Chem&BioOffice - Biblioteca UAM Xochimilco
634
ChemBioOffice.Com ® Chem & Bio Office Chem & Bio 3D, Finder and BioViz ®
-
Upload
khangminh22 -
Category
Documents
-
view
2 -
download
0
Transcript of Chem&BioOffice - Biblioteca UAM Xochimilco
ChemBioO
ffice.Com®
Chem & Bio OfficeChem & Bio 3D, Finder and BioViz
®

CS Product Registration
Name
Title
Firm
Street
City State Zip
Country
Tel Fax
Serial No. Purchase Date
USER INFORMATION
For faster response and accuracy, use the Web:www.cambridgesoft.com/register/
1. Product you are registering (check one): o Chem & Bio OfÞce o Chem & BIo Draw o Chem & Bio 3D o Inventory
o BioOffice o BioDraw o BioAssay o E-Notebook
o Chem & Bio Office Enterprise o Chem & Bio Office Workgroup
o Other
2. System running CS software (check one): o Microsoft Windows o Apple Macintosh o Other
3. Please check one that best describes you: o Commercial o Academic o Student o Gov’t/Non Profit o Other
4. Your discipline: o Analytical Chem. o Inorganic Chem. o Biochemistry o Chemical Engineering o Physical Chem. o Organic Chem. o Pharmacology o Biology o Proteomics o Genomics o Information o Other
QUESTIONNAIRE (OPTIONAl)
Register today and receive free:
· Warranty technical support
· ChemBioNews.Com publication for Scientists with Computers
· Information on new releases
Thank You! Enjoy your software!
Please remove this portion before mailing.
Please copy serial number from CS Installation Instructions.
Register your CambridgeSoft Product.
Please complete the registration card at right.
Registering your prod-uct makes you eligible to receive update and upgrade information,
technical support, and a free subscription to ChemBioNews.Com, a
publication for Scientists with Computers.
www.cambridgesoft.comVisit our homepage for
more information about CS products and services.
Technical SupportWarranty technical
support available. For details please see:
www.cambridgesoft.com/ services/contact/
US 1 617 588-9300 FAX 1 617 588–9390 Web www.cambridgesoft.comEU 00 800 875 20000 FAX +44 1223 464990 EMAIL [email protected] 03-3502-7800 FAX 03-3502-7890MAIL 100 CambridgePark Drive Cambridge, MA 02140 USA
!
!

NO
PO
STA
GE
NEC
ESSA
RY
IF M
AIlE
D
IN T
HE
UN
ITED
STA
TES
BU
SIN
ESS
REP
LY M
AIL
FIRS
T-C
lASS
PER
MIT
NO
. 506
7 C
AM
BRID
GE,
MA
POST
AG
E W
Ill B
E PA
ID B
Y A
DD
RESS
EE
Prod
uct
Reg
istr
atio
nC
ambr
idge
Soft
Cor
pora
tion
100
Cam
brid
gePa
rk D
rive
Cam
brid
ge, M
A 0
2140
–980
2 U
SA
PERF.

Chem & Bio Office Chem & Bio 3D, Finder and BioViz
®
Chem & Bio Office Desktop 2010 for Windows
Chem & Bio Office is an integrated suite that includes: • Chem & Bio Draw for drawing chemical and biological structures• Chem & Bio 3D for molecular modeling and analysis • Chem & Bio Finder for searching and information integration• BioAssay & BioViz for retrieving and visualizing biological data• Inventory for managing and searching reagents• E-Notebook for managing laboratory information• ChemInfo for chemical and scientific databases
User’s Guide

License InformationAll resources and application files in ChemBioOffice, ChemOffice, BioOffice, ChemBioDraw, ChemDraw, BioDraw, ChemBio3D, Chem3D, ChemFinder, BioViz, Inventory, E-Notebook, BioAs-say, ChemINDEX, ChemFinder, and ChemInfo programs, all resources in the ChemOffice, ChemDraw, Chem3D, ChemFinder, and ChemInfo application files, and this manual are Copyright © 1986-2009 by CambridgeSoft Corporation (“CS”) with all rights reserved worldwide. MOPAC 2002 is Copyright © 1993-2006 by Fujitsu Limited with all rights reserved.Information in this document is subject to change without notice and does not represent a commit-ment on the part of CS. Both these materials and the right to use them are owned exclusively by CS. Use of these materials is licensed by CS under the terms of a software license agreement; they may be used only as provided for in said agreement.ChemBioOffice, ChemOffice BioOffice, ChemBioDraw, ChemDraw, BioDraw, ChemBio3D, Chem3D, CS MOPAC, ChemFinder, BioViz, Inventory, E-Notebook, and BioAssay, and ChemInfo are not supplied with copy protection. Do not duplicate any of the copyrighted materials except for your personal backups without written permission from CS. To do so would be in violation of federal and international law, and may result in criminal as well as civil penalties. You may use ChemBioOf-fice, ChemOffice BioOffice, ChemBioDraw, ChemDraw, BioDraw, ChemBio3D, Chem3D, CS MOPAC, ChemFinder, BioViz, Inventory, E-Notebook, and BioAssay ChemOffice, ChemDraw, Chem3D, CS MOPAC, ChemFinder, Inventory, E-Notebook, BioAssay, and ChemInfo on any com-puter owned by you; however, extra copies may not be made for that purpose. Consult the CS License Agreement for Software and Database Products for further details.
Trademark Notices ChemBioOffice, ChemOffice, BioOffice, ChemBioDraw. ChemDraw, BioDraw,ChemBio3D, Chem3D, ChemINDEX, ChemFinder, ChemInfo and ChemACX are registered trademarks of CambridgeSoft Corporation (Cambridge Scientific Computing, Inc.).The Merck Index is a registered trademark of Merck & Co., Inc. ©2006 All rights reserved.MOPAC 2002 is a trademark of Fujitsu Limited.Microsoft Windows, Windows 2000, Windows XP, and Microsoft Word, Microsoft Excel, Microsoft PowerPoint, Microsoft Access, and SQL Server 2005 are registered trademarks of Microsoft Corpo-ration.Apple Events, Macintosh, Laserwriter, Imagewriter, QuickDraw and AppleScript are registered trademarks of Apple Computer, Inc. Geneva, Monaco, and TrueType are trademarks of Apple Com-puter, Inc.InChI™ is a trademark of the International Union of Pure and Applied Chemistry.Jaguar is a trademark of Schrödinger, LLC.THE MERCK INDEX® is a trademark of Merck & Company Incorporated, Whitehouse Station, New Jersey, USA and is registered in the United States Patent and Trademark Office.

Oracle® is a registered trademark of Oracle Corporation and/or its affiliates. Other names may be trademarks of their respective owners.All other trademarks are the property of their respective holders. Any use of the marks in connection with the sale, offering for sale, distribution or advertising of any goods and services, including any other Web site, or in connection with labels, signs, prints, packages, wrappers, receptacles or adver-tisements used for the sale, offering for sale, distribution or advertising of any goods and services, including any other Web site, which is likely to cause confusion, to cause mistake or to deceive, is strictly prohibited.
Copyright NoticeThe materials contained in CambridgeSoft Database Products, including but not limited to, Che-mACX, ChemIndex, and The Merck Index, are protected by copyright laws and international copy-right treaties, as well as other intellectual property laws and treaties. Copyright in the materials contained on the CD and internet subscription products, including, but not limited to, the textual material, chemical structures representations, artwork, photographs, computer software, audio and visual elements, is owned or controlled separately by CS.CS is a distributor (and not a publisher) of information supplied by third parties. Accordingly, CS has no editorial control over such information. Database Suppliers (“Supplier”) individually own all right, title, and interest, including copyright, in their database—and retain all such rights in providing information to Customers.The materials contained in The Merck Index are protected by copyright laws and international copy-right treaties, as well as other intellectual property laws and treaties. Copyright in the materials con-tained on the CD and internet subscription products, including, but not limited to, the textual material, chemical structures representations, artwork, photographs, computer software, audio and visual elements, is owned or controlled separately by Merck & Co., Inc., (“Merck”) and CambridgeSoft Corporation (“CS”).The ChemReact68, ChemSynth, ChemReact500, and ChemSelect Reaction Database is copyrighted © by InfoChem GmbH 1997.AspTear is copyrighted © by Softwing.InChI™ is a trademark of the International Union of Pure and Applied Chemistry. InChI™ Material in ChemDraw is © IUPAC 2005.schrödinger® JaguarGAMESS is copyrighted © by Ames LaboratoryCopyright © 1986-2009 CambridgeSoft Corporation (Cambridge Scientific Computing, Inc.) All Rights Reserved.Printed in the United States of America.All other trademarks are the property of their respective holders.CambridgeSoft End-User License Agreement for Software Products

Important: This CambridgeSoft Software License Agreement (“Agreement”) is a legal agreement between you, the end user (either an individual or an entity), and CambridgeSoft Corporation (“CS”) regarding the use of CS Software and Database Products, which may include computer software, the associated media, any printed materials, and any “online” or electronic documentation. By installing, copying, or otherwise using any CS Software Product, you signify that you have read the CS End User License Agreement and agree to be bound by its terms. If you do not agree to the Agreement’s terms, promptly return the package within 30 days of purchase and all its contents to the place of pur-chase for a full refund.
CambridgeSoft Software and Database License1. Grant of License. CambridgeSoft (CS) Software Products are licensed, not sold. CS grants and you hereby accept a nonexclusive license to use one copy of the enclosed Software Product (“Soft-ware”) in accordance with the terms of this Agreement. This licensed copy of the Software may only be used on a single computer, except as provided below.You may physically transfer the Software from one computer to another for your own use, provided the Software is in use (or installed) on only one computer at a time. If the Software is permanently installed on your computer (other than a network server), you may also use the Software on a porta-ble or home computer, provided that you use the software on only one computer at a time. You may not (a) electronically transfer the Software from one computer to another, (b) distribute copies of the Software to others, or (c) modify or translate the Software without the prior written consent of CS, (d) place the software on a server so that it is accessible via a public network such as the Internet, (e) sublicense, rent, lease or lend any portion of the Software or Documentation, (f) modify or adapt the Software or merge it into another program, (g) modify or circumvent the software activation, or (h) reverse engineer the software activation so as to circumvent it. The Software may be placed on a file or disk server connected to a network, provided that a license has been purchased for every computer with access to that server. You may make only those copies of the Software which are necessary to install and use it as permitted by this agreement, or are for purposes of backup and archival records; all copies shall bear CS’s copyright and proprietary notices. You may not make copies of any accom-panying written materials.With a fixed license, the software cannot be installed on more than the number of computers equiva-lent to the number of fixed licenses purchased. For example, a 10-user fixed license means the soft-ware can be installed on no more than 10 different computers. A fixed license cannot be installed on a server. With a concurrent license, the software can be installed on any number of computers at the organization, but the number of computers using the software at any one time cannot exceed the number of concurrent licenses purchased. For example, a 10-user concurrent license can be installed on 20 computers, but no more than 10 users can be using it at any one time. If the number of users of the software could potentially exceed the number of licensed copies, then Licensee must have a rea-sonable mechanism or process in place to assure that the number of persons using the software does not exceed the number of copies. CambridgeSoft reserves the right to conduct periodic audits no
more than once per year to review the implementation of this agreement at the Licensee’s site. At CambridgeSoft’s request, Licensee will provide a knowledgeable employee to assist in said audit2. Ownership. The Software is and at all times shall remain the sole property of CS. This ownership is protected by the copyright laws of the United States and by international treaty provisions. Upon expiration or termination of this agreement, you shall promptly return all copies of the Software and accompanying written materials to CS. You may not modify, decompile, reverse engineer, or disas-semble the Software.3. Assignment Restrictions. You may not rent, lease, or otherwise sublet the Software or any part thereof. You may transfer on a permanent basis the rights granted under this license provided you transfer this Agreement and all copies of the Software, including prior versions, and all accompany-ing materials. The recipient must agree to the terms of this Agreement in full and register this transfer in writing with CS.4. Use of Included Data. All title and copyrights in and to the Software product, including but not limited to any images, photographs, animations, video, audio, music, text, applets, Java applets, and data files and databases (the “Included Data”), are owned by CS or its suppliers.
• You may not copy, distribute or otherwise make the Included Data publicly available.• Licensed users of ChemOffice Enterprise and Workgroup and the accompanying Plug-in software
products may access, search, and view the Included Data and may transmit the results of any search of the Included Data to other users of the licensed ChemOffice Enterprise and Workgroup software products within your organization only, provided that such transmission is via an internal corporate (or university) network and is not accessible by the public.
• You may not install the Included Data on non-licensed computers nor distribute or otherwise make the Included Data publicly available.
• You may use the Software to organize personal data, and you may transmit such personal data over the Internet provided that the transmission does not contain any Included Data.
• All rights not specifically granted under this Agreement are reserved by CS.
5. Limitations on Use. (a) Desktop versions of E-Notebook, Inventory, and BioAssay are licensed for use with SQL Server Express, and are not licensed for use with SQL Server. Licenses for use with SQL Server are available separately. (b) Workgroup versions of E-Notebook, Inventory, and BioAs-say are licensed for use with SQL Server and SQL Server Express. (c) Except as expressly provided by copyright law, copying, redistribution, or publication, whether for commercial or non-commercial purposes, must be with the express permission of CS, Merck, or other CS partner. In any copying, redistribution, or publication of copyrighted material, any changes to or deletion of author attribution or copyright notice, or any other proprietary notice of CS, Merck, or other Database producer are prohibited.6. Separation of Components. The Software is licensed as a single product. Its component parts may not be separated for use on more than one computer, except in the case of ChemBioOffice Enterprise. ChemBioOffice Enterprise includes licenses for ChemBioDraw ActiveX and licenses for

ChemBio3D ActiveX. The ActiveX software products may be installed on computers other than that one on which ChemBioOffice Enterprise is installed. However, each copy of the ActiveX is individ-ually subject to the provisions of Paragraphs 1 through 4 of this Agreement.7. Educational Use Only of Student Licenses. If you are a student enrolled at an educational institu-tion, the CS License Agreement grants to you personally a license to use one copy of the enclosed Software in accordance with the terms of this Agreement. In this case the CS License Agreement does not permit commercial use of the Software nor does it permit you to allow any other person to use the Software.8. Modification of Databases, Web sites, or Subscription Services. CS reserves the right to change, modify, suspend or discontinue any or all parts of any Paid Subscription Services and databases at any time.9. Termination. You may terminate the license at any time by destroying all copies of the Software and documentation in your possession. Without prejudice to any other rights, CS may terminate this Agreement if you fail to comply with its terms and conditions. In such event, you must destroy all copies of the Software Product and all of its component parts.10. Revocation of Subscription Access. Any use which is commercial and/or non-personal is strictly prohibited, and may subject the Subscriber making such uses to revocation of access to this Paid Sub-scription Service, as well as any other applicable civil or criminal penalties. Similarly, sharing a Sub-scriber password with a non-Subscriber or otherwise making this Paid Subscription Service available to third parties other than the Authorized User as defined above is strictly prohibited, and may sub-ject the Subscriber participating in such activities to revocation of access to the Paid Subscription Services; and, the Subscriber and any third party, to any other applicable civil or criminal penalties under copyright or other laws. In the case of an authorized site license, a Subscriber shall cause any employee, agent or other third party which the Subscriber allows to use the Paid Subscription Service materials to abide by all of the terms and conditions of this Agreement. In all other cases, only the Subscriber is permitted to access the Paid Subscription Service materials. Should CambridgeSoft become aware of any use that might cause revocation of the license, they shall notify the Subscriber. The Subscriber shall have 90 days from date of notice to correct such violation before any action will be taken.11. Confidentiality. The Software contains trade secrets and proprietary know-how that belong to CS and are being made available to you in strict confidence. ANY USE OR DISCLOSURE OF THE SOFT-WARE, OR USE OF ITS ALGORITHMS, PROTOCOLS OR INTERFACES, OTHER THAN IN STRICT ACCORDANCE WITH THIS LICENSE AGREEMENT, MAY BE ACTIONABLE AS A VIOLATION OF OUR TRADE SECRET RIGHTS.
CS Limited WarrantySoftware Limited Warranty. CS’s sole warranty with respect to the Software is that it shall be free of errors in program logic or documentation, attributable to CS, which prevent the performance of
the principal computing functions of the Software. CS warrants this for a period of thirty (30) days from the date of receipt.CS’s Liability. In no event shall CS be liable for any indirect, special, or consequential damages, such as, but not limited to, loss of anticipated profits or other economic loss in connection with or arising out of the use of the software by you or the services provided for in this agreement, even if CS has been advised of the possibility of such damages.CS’s entire liability and your exclusive remedy shall be, at CS’s discretion, either (A) return of any license fee, or (B) correction or replacement of software that does not meet the terms of this limited warranty and that is returned to CS with a copy of your purchase receipt.Database Representations and Limited Warranty. The User shall indemnify, defend and hold CS, Merck, and/or other Supplier harmless from any damages, expenses and costs (including reasonable attorneys’ fees) arising out of any breach or alleged breach of these Terms and Conditions, represen-tations and/or warranties herein, by the User or any third party to whom User shares her/his password or otherwise makes available this Subscription Service. The User shall cooperate in the defense of any claim brought against CambridgeSoft, Merck, and/or other Database Suppliers. In no event shall CS, Merck, and/or other Supplier be liable for any indirect, special, or consequential damages, such as, but not limited to, loss of anticipated profits or other economic loss in connection with or arising out of the use of the software by you or the services provided for in this agreement, even if CS, Merck, and/or other Supplier has been advised of the possibility of such damages. CS and/or Merck’s entire liability and your exclusive remedy shall be, at CS’s discretion a return of any pro-rata portion of the subscription fee. The failure of either party to assert a right hereunder or to insist upon compli-ance with any term or condition of this Agreement shall not constitute a waiver of that right or excuse a similar subsequent failure to perform any such term or condition by the other party.NO OTHER WARRANTIES. CS DISCLAIMS OTHER IMPLIED WARRANTIES, INCLUDING, BUT NOT LIM-ITED TO, IMPLIED WARRANTIES OF MERCHANTABILITY OR FITNESS FOR A PARTICULAR PURPOSE, AND IMPLIED WARRANTIES ARISING BY USAGE OF TRADE, COURSE OF DEALING, OR COURSE OF PERFORMANCE. NOTWITHSTANDING THE ABOVE, WHERE APPLICABLE, IF YOU QUALIFY AS A “CONSUMER” UNDER THE MAGNUSONMOSS WARRANTY ACT, THEN YOU MAY BE ENTITLED TO ANY IMPLIED WARRANTIES ALLOWED BY LAW FOR THE PERIOD OF THE EXPRESS WARRANTY AS SET FORTH ABOVE. SOME STATES DO NOT ALLOW LIMITATIONS ON IMPLIED WARRANTIES, SO THE ABOVE LIMITATION MIGHT NOT APPLY TO YOU. THIS WARRANTY GIVES YOU SPECIFIC LEGAL RIGHTS, AND YOU MAY ALSO HAVE OTHER RIGHTS WHICH VARY FROM STATE TO STATE.
No Waiver. The failure of either party to assert a right hereunder or to insist upon compliance with any term or condition of this Agreement shall not constitute a waiver of that right or excuse a similar subsequent failure to perform any such term or condition by the other party.Governing Law. This Agreement shall be construed according to the laws of the Commonwealth of Massachusetts.Export. You agree that the Software will not be shipped, transferred, or exported into any country or used in any manner prohibited by the United States Export Administration Act or any other export laws, restrictions, or regulations.

End-User License Agreement for CambridgeSoft Database ProductsImportant: This CambridgeSoft End-User License Agreement is a legal agreement between you (either an individual or a single entity) and CambridgeSoft Corporation for the CambridgeSoft sup-plied database product(s) and may include associated media, printed materials, and “online” or elec-tronic documentation. By using the database product(s) you agree that you have read, understood and will be bound by this license agreement.
Database Product License1. Copyright Notice. The materials contained in CambridgeSoft Database Products, including but not limited to, ChemACX, ChemIndex, and The Merck Index, are protected by copyright laws and international copyright treaties, as well as other intellectual property laws and treaties. Copyright in the materials contained on the CD and internet subscription products, including, but not limited to, the textual material, chemical structures representations, artwork, photographs, computer software, audio and visual elements, is owned or controlled separately by CambridgeSoft Corporation (“CS”).CS is a distributor (and not a publisher) of information supplied by third parties. Accordingly, CS has no editorial control over such information. Database Suppliers (“Supplier”) individually own all right, title, and interest, including copyright, in their database—and retain all such rights in providing information to Customers.The materials contained in The Merck Index are protected by copyright laws and international copy-right treaties, as well as other intellectual property laws and treaties. Copyright in the materials con-tained on the CD and internet subscription products, including, but not limited to, the textual material, chemical structures representations, artwork, photographs, computer software, audio and visual elements, is owned or controlled separately by the Merck & Co., Inc., (“Merck”) and CambridgeSoft Corporation (“CS”).2. Limitations on Use. Except as expressly provided by copyright law, copying, redistribution, or publication, whether for commercial or non-commercial purposes, must be with the express permis-sion of CS and/or Merck. In any copying, redistribution, or publication of copyrighted material, any changes to or deletion of author attribution or copyright notice, or any other proprietary notice of CS, Merck, or other Database producer are prohibited.3. Grant of License, CD/DVD Databases. CambridgeSoft Software Products are licensed, not sold. CambridgeSoft grants and you hereby accept a nonexclusive license to use one copy of the enclosed Software Product (“Software”) in accordance with the terms of this Agreement. This licensed copy of the Software may only be used on a single computer, except as provided below. You may physi-cally transfer the Software from one computer to another for your own use, provided the Software is in use (or installed) on only one computer at a time. If the Software is permanently installed on your computer (other than a network server), you may also use the Software on a portable or home com-puter, provided that you use the software on only one computer at a time. You may not (a) electroni-cally transfer the Software from one computer to another, (b) distribute copies of the Software to

others, or (c) modify or translate the Software without the prior written consent of CambridgeSoft, (d) place the software on a server so that it is accessible via a public network such as the Internet, (e) sublicense, rent, lease or lend any portion of the Software or Documentation, or (f) modify or adapt the Software or merge it into another program. The Software may be placed on a file or disk server connected to a network, provided that a license has been purchased for every computer with access to that server. You may make only those copies of the Software which are necessary to install and use it as permitted by this agreement, or are for purposes of backup and archival records; all copies shall bear CambridgeSoft’s copyright and proprietary notices. You may not make copies of any accompa-nying written materials.4. Assignment Restrictions for CD/DVD databases. You may not rent, lease, or otherwise sublet the Software or any part thereof. You may transfer on a permanent basis the rights granted under this license provided you transfer this Agreement and all copies of the Software, including prior versions, and all accompanying materials. The recipient must agree to the terms of this Agreement in full and register this transfer in writing with CambridgeSoft.5. Revocation of Subscription Access. Any use which is commercial and/or non-personal is strictly prohibited, and may subject the Subscriber making such uses to revocation of access to this Paid Sub-scription Service, as well as any other applicable civil or criminal penalties. Similarly, sharing a Sub-scriber password with a non-Subscriber or otherwise making this Paid Subscription Service available to third parties other than the Authorized User as defined above is strictly prohibited, and may sub-ject the Subscriber participating in such activities to revocation of access to the Paid Subscription Services; and, the Subscriber and any third party, to any other applicable civil or criminal penalties under copyright or other laws. In the case of an authorized site license, a Subscriber shall cause any employee, agent or other third party which the Subscriber allows to use the Paid Subscription Service materials to abide by all of the terms and conditions of this Agreement. In all other cases, only the Subscriber is permitted to access the Paid Subscription Service materials. Should CambridgeSoft become aware of any use that might cause revocation of the license, they shall notify the Subscriber. The Subscriber shall have 90 days from date of notice to correct such violation before any action will be taken.6. Trademark Notice. THE MERCK INDEX ® is a trademark of Merck & Company Incorporated, Whitehouse Station, New Jersey, USA and is registered in the United States Patent and Trademark Office. CambridgeSoft ® and ChemACX are trademarks of CambridgeSoft Corporation, Cambridge, Massachusetts, USA and are registered in the United States Patent and Trademark Office, the Euro-pean Union (CTM), Japan, and other markets.Any use of the marks in connection with the sale, offering for sale, distribution or advertising of any goods and services, including any other Web site, or in connection with labels, signs, prints, pack-ages, wrappers, receptacles or advertisements used for the sale, offering for sale, distribution or advertising of any goods and services, including any other Web site, which is likely to cause confu-sion, to cause mistake or to deceive, is strictly prohibited.

7. Modification of Databases, Web sites, or Subscription Services. CS reserves the right to change, modify, suspend or discontinue any or all parts of any Paid Subscription Services and databases at any time.8. Representations and Warranties. The User shall indemnify, defend and hold CS, Merck, and/or other Supplier harmless from any damages, expenses and costs (including reasonable attorneys’ fees) arising out of any breach or alleged breach of these Terms and Conditions, representations and/or warranties herein, by the User or any third party to whom User shares her/his password or otherwise makes available this Subscription Service. The User shall cooperate in the defense of any claim brought against CambridgeSoft, Merck, and/or other Database Suppliers.In no event shall CS, Merck, and/or other Supplier be liable for any indirect, special, or consequential damages, such as, but not limited to, loss of anticipated profits or other economic loss in connection with or arising out of the use of the software by you or the services provided for in this agreement, even if CS, Merck, and/or other Supplier has been advised of the possibility of such damages. CS and/or Merck’s entire liability and your exclusive remedy shall be, at CS’s discretion a return of any pro-rata portion of the subscription fee.The failure of either party to assert a right hereunder or to insist upon compliance with any term or condition of thisAgreement shall not constitute a waiver of that right or excuse a similar subsequent failure to per-form any such term or condition by the other party.This Agreement shall be construed according to the laws of the Commonwealth of Massachusetts, United States of America.


Q: IS IT OK TO COPY MY COLLEAGUE’SSOFTWARE?NO, it’s not okay to copy your colleague’s
software. Software is protected by federal copyright law,which says that you can't make such additional copieswithout the permission of the copyright holder. Byprotecting the investment of computer softwarecompanies in software development, the copyright lawserves the cause of promoting broad public availability ofnew, creative, and innovative products. These companiesdevote large portions of their earnings to the creation ofnew software products and they deserve a fair return ontheir investment. The creative teams who develop thesoftware–programmers, writers, graphic artists andothers–also deserve fair compensation for their efforts.Without the protection given by our copyright laws, theywould be unable to produce the valuable programs thathave become so important to our daily lives: educationalsoftware that teaches us much needed skills; businesssoftware that allows us to save time, effort and money;and entertainment and personal productivity softwarethat enhances leisure time.
Q: That makes sense, but what do I get out ofpurchasing my own software?
A: When you purchase authorized copies of softwareprograms, you receive user guides and tutorials, quickreference cards, the opportunity to purchaseupgrades, and technical support from the softwarepublishers. For most software programs, you can readabout user benefits in the registration brochure orupgrade flyer in the product box.
Q: What exactly does the law say about copyingsoftware?
A: The law says that anyone who purchases a copy ofsoftware has the right to load that copy onto a singlecomputer and to make another copy “for archivalpurposes only” or, in limited circumstances, for“purposes only of maintenance or repair.” It is illegalto use that software on more than one computer or tomake or distribute copies of that software for anyother purpose unless specific permission has beenobtained from the copyright owner. If you piratesoftware, you may face not only a civil suit fordamages and other relief, but criminal liability as well,including fines and jail terms of up to one year
Q: So I'm never allowed to copy software for any otherreason?
A: That’s correct. Other than copying the software youpurchase onto a single computer and making anothercopy “for archival purposes only” or “purposes only ofmaintenance or repair,” the copyright law prohibitsyou from making additional copies of the software forany other reason unless you obtain the permission ofthe software company.
Q: At my company, we pass disks around all the time.We all assume that this must be okay since it wasthe company that purchased the software in thefirst place.
A: Many employees don’t realize that corporations arebound by the copyright laws, just like everyone else.Such conduct exposes the company (and possibly thepersons involved) to liability for copyrightinfringement. Consequently, more and morecorporations concerned about their liability havewritten policies against such “softlifting”. Employeesmay face disciplinary action if they make extra copiesof the company’s software for use at home or onadditional computers within the office. A good rule toremember is that there must be one authorized copyof a software product for every computer upon whichit is run
Q: Can I take a piece of software owned by mycompany and install it on my personal computer athome if instructed by my supervisor?
A: A good rule of thumb to follow is one softwarepackage per computer, unless the terms of the licenseagreement allow for multiple use of the program. Butsome software publishers’ licenses allow for “remote”or “home” use of their software. If you travel ortelecommute, you may be permitted to copy yoursoftware onto a second machine for use when you arenot at your office computer. Check the license care-fully to see if you are allowed to do this.
Q: What should I do if become aware of a companythat is not compliant with the copyright law or itssoftware licenses?
A: Cases of retail, corporate and Internet piracy or non-compliance with software licenses can be reported onthe Internet at http://www.siia.net/piracy/report.aspor by calling the Anti-Piracy Hotline:(800) 388-7478.

Q: Do the same rules apply to bulletin boards and usergroups? I always thought that the reason they gottogether was to share software.
A: Yes. Bulletin boards and user groups are bound by thecopyright law just as individuals and corporations.However, to the extent they offer shareware or publicdomain software, this is a perfectly acceptablepractice. Similarly, some software companies offerbulletin boards and user groups special demonstrationversions of their products, which in some instancesmay be copied. In any event, it is the responsibility ofthe bulletin board operator or user group to respectcopyright law and to ensure that it is not used as avehicle for unauthorized copying or distribution.
Q: I'll bet most of the people who copy software don'teven know that they're breaking the law.
A: Because the software industry is relatively new, andbecause copying software is so easy, many people areeither unaware of the laws governing software use orchoose to ignore them. It is the responsibility of eachand every software user to understand and adhere tocopyright law. Ignorance of the law is no excuse. Ifyou are part of an organization, see what you an do toinitiate a policy statement that everyone respects.Also, suggest that your management considerconducting a software audit. Finally, as an individual,help spread the word that users should be “softwarelegal.”
Q: What are the penalties for copyright infringement?
A: The Copyright Act allows a copyright owner torecover monetary damages measured either by: (1) itsactual damages plus any additional profits of theinfringer attributable to the infringement, or (2)statutory damages, of up to $150,000 for each copy-righted work infringed. The copyright owner also hasthe right to permanently enjoin an infringer fromengaging in further infringing activities and may beawarded costs and attorneys’ fees. The law alsopermits destruction or other reasonable disposition ofall infringing copies and devices by which infringingcopies have been made or used in violation of thecopyright owner’s exclusive rights. In cases of willfulinfringement, criminal penalties may also be assessedagainst the infringer.
SIIA also offers a number of other materials designed tohelp you comply with the Federal Copyright Law. Thesematerials include:
"It's Just Not Worth the Risk" video.This 12–minute video, available $10, has helped over20,000 organizations dramatize to their employees theimplications and consequences of software piracy.
“Don’t Copy that Floppy” videoThis 9 minute rap video, available for $10, is designedto educate students on the ethical use of software.
Other education materials including, “Software Useand the Law”, a brochure detailing the copyright lawand how software should be used by educationalinstitutions, corporations and individuals; and severalposters to help emphasize the message that unauthorizedcopying of software is illegal.
To order any of these materials, please send your request to:
“SIIA Anti-Piracy Materials”Software & Information Industry Association1090 Vermont Ave, Sixth Floor,Washington, D.C. 20005(202) 289-7442
We urge you to make as many copies as you would likein order to help us spread the word that unauthorizedcopying of software is illegal.

Chem & Bio Draw Chem & Bio OfficeManuals:
Includes:
Dat
abas
esD
eskt
op A
pplic
atio
nsSo
ftwar
eW
orkg
roup
Sol
utio
ns
A Guide to CambridgeSoft ManualsWorkgroup Solutions
Chem & Bio Office
ChemBio 3D and DatabasesFinder & BioViz
Chem & BioDrawing Standard
Chem & Bio Draw ■
Chem & Bio 3D ■
Chem & Bio Finder ■
BioAssay Desktop ■
BioViz Desktop ■
Inventory Desktop ■
E-Notebook Desktop ■
ChemDraw/Excel ■
Struct = Name ■
ChemNMR ■
CombiChem/Excel ■
ChemFinder/Office ■
MOPAC, GAMESS, MM2 ■
CS Gaussian, Jaguar Interface ■
CombiChem/E-Notebook ■
BioAssay Workgroup ■
BioSAR Enterprise ■
Inventory Workgroup ■
Formulations & Mixtures ■
Compliant SDMS ■
The Merck Index ■
R&D Insight/Chemists ■
ChemINDEX Database, NCI, AIDS & Cancer ■
Traditional Chinese Medicines ■
Drugs: Synonyms & Properties ■
Nanogens Index; Medicinal Chemistry ■
ChemACX, ChemMSDS Database ■
Sigma-Aldrich MSDS ■
ChemReact500, ChemReact68 & ChemSynth ■
Including E-Notebook
Desktop Software
Chem & Bio Office 2010 User Guide i
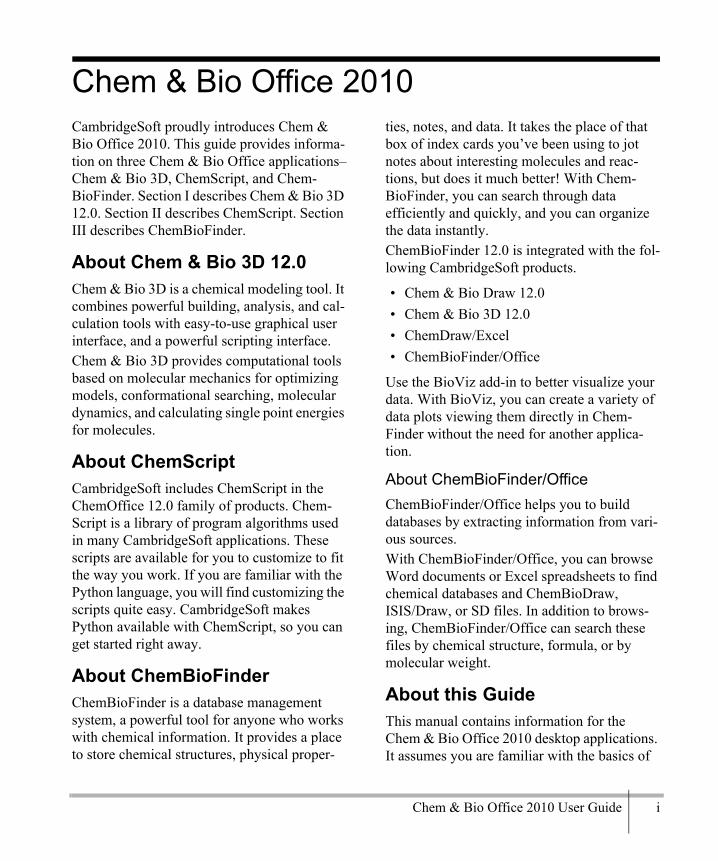
Chem & Bio Office 2010CambridgeSoft proudly introduces Chem & Bio Office 2010. This guide provides informa-tion on three Chem & Bio Office applications–Chem & Bio 3D, ChemScript, and Chem-BioFinder. Section I describes Chem & Bio 3D 12.0. Section II describes ChemScript. Section III describes ChemBioFinder.
About Chem & Bio 3D 12.0Chem & Bio 3D is a chemical modeling tool. It combines powerful building, analysis, and cal-culation tools with easy-to-use graphical user interface, and a powerful scripting interface.Chem & Bio 3D provides computational tools based on molecular mechanics for optimizing models, conformational searching, molecular dynamics, and calculating single point energies for molecules.
About ChemScriptCambridgeSoft includes ChemScript in the ChemOffice 12.0 family of products. Chem-Script is a library of program algorithms used in many CambridgeSoft applications. These scripts are available for you to customize to fit the way you work. If you are familiar with the Python language, you will find customizing the scripts quite easy. CambridgeSoft makes Python available with ChemScript, so you can get started right away.
About ChemBioFinderChemBioFinder is a database management system, a powerful tool for anyone who works with chemical information. It provides a place to store chemical structures, physical proper-
ties, notes, and data. It takes the place of that box of index cards you’ve been using to jot notes about interesting molecules and reac-tions, but does it much better! With Chem-BioFinder, you can search through data efficiently and quickly, and you can organize the data instantly.ChemBioFinder 12.0 is integrated with the fol-lowing CambridgeSoft products.
• Chem & Bio Draw 12.0• Chem & Bio 3D 12.0• ChemDraw/Excel• ChemBioFinder/Office
Use the BioViz add-in to better visualize your data. With BioViz, you can create a variety of data plots viewing them directly in Chem-Finder without the need for another applica-tion.
About ChemBioFinder/OfficeChemBioFinder/Office helps you to build databases by extracting information from vari-ous sources.With ChemBioFinder/Office, you can browse Word documents or Excel spreadsheets to find chemical databases and ChemBioDraw, ISIS/Draw, or SD files. In addition to brows-ing, ChemBioFinder/Office can search these files by chemical structure, formula, or by molecular weight.
About this GuideThis manual contains information for the Chem & Bio Office 2010 desktop applications. It assumes you are familiar with the basics of

Adm
inistrator
ii
you operating system. If you are not, refer to your system manual.Some of the material describes tasks that must be performed in conjunction with Microsoft Excel or Word. If needed, refer to the users’s manual for these applications.The chapters in this guide are organized by task. They are intended to help you become familiar with the Chem & Bio Office applica-tions so that you can begin using them as quickly as possible.
ConventionsThese notations are used throughout this guide:
instructionsMuch of this document is dedicated to explain-ing how to perform specific tasks. There are two basic conventions used to help you follow each step.
NavigationTypically, a task will ask you to navigate through various menu items. For example, to reflect a Chem & Bio 3D model through X-Y plane, one of the steps will be:
1. Go to Structure>Reflect Model>Through X-Y Plane.
This means that you start at the Structure menu, select Reflect Model, and then select Through X-Y Plane.
Action itemsInstructions will often ask you to select or find items that are in either a menu or dialog box. Each action item appears in a font that is dif-ferent from the regular text. Structure, Reflect Model and Through X-Y Plane, are the action items in the example above.
Additional InformationRefer to the following resources for more information on Chem & Bio Office products and how to use them:
• The Chem & Bio Office Quick reference cards
• The Help system for each ChemOffice application
• The CambridgeSoft Web site: www.cambridgesoft.com/support.
Quick Reference CardsThe Quick Reference Cars are located in the back of the Chem & Bio Office 2010 manual. The cards provide summaries of desktop appli-cation commands and features. Because many of the instructions require knowledge of the interface elements, us the Quick Reference cards as you perform the tutorials.
Online HelpChem & Bio Office 2010 applications provide some or all of the following types of Help:Help. Available in the Help menu for each Chem & Bio Office 2010 application.Tool Tips. A brief description of an object that appears when you point to the object.Status Bar. The lower left corner of the appli-cation window that displays useful information as you work.
CambridgeSoft Web siteSee the Web sites below for more information on CambridgeSoft products:TECHNICAL SUPPORThttp://www.cambridgesoft.com/services

Chem & Bio Office 2010 User Guide iii
CHEMDRAW PLUGINhttp://www.cambridgesoft.com/services/docu-mentation/chemdrawplugin/CHEM3D ACTIVEX CONTROLhttp://www.cambridgesoft.com/services/Desk-topSupport/Documentation/Chem3DControl/SOFTWARE DEVELOPER’S KIThttp://sdk.cambridgesoft.com/PURCHASING PRODUCTS AND CHEMICALShttp://scistore.cambridgesoft.com/
Microsoft® Office ProductsChemOffice products are compatible with the following versions of Microsoft Office:
System RequirementsBefore installing Chem & BioDraw, see the “ReadMeFirst” and any other ReadMe docu-ments on the installation CD-ROM.
Windows® Requirements
Operating System. Windows 2000, XP Pro (32-bit only), Windows Vista (32-bit only).Browsers. Microsoft Internet Explorer 7.x, Microsoft Internet Explorer 6.x, Firefox 1.x, Netscape 7.x, Mozilla 1.x
Microsoft Office. Microsoft Office 2000, Microsoft Office XP, Microsoft Office 2003, Microsoft Office 2007.
NOTE: ChemDraw for Excel and Combi for Excel add-ins, E-Notebook in Chem & Bio Office 2010 release do not support Microsoft Office 2000.
Screen Resolution. Chem & Bio 3D supports a PC screen resolution of 800 x 600 or higher.
NOTE: Windows XP Service Pack 2 includes security fea-tures that automatically block active content. This means that by default, Internet Explorer blocks Chem & Bio Draw 12.0 and Chem & Bio 3D 12.0 ActiveX controls. To activate them, you must choose the option to “allow blocked content” from the bar appearing under the address bar notifying you that the security settings have blocked some of the content of the page. Internet Explorer does not remem-ber this information, so you must repeat the activation each time you access the page.If you visit a site frequently, you can add it to the list of trusted sites in Internet Explorer security settings.
Macintosh® Requirements
Operating System. Mac OS X 10.3.x, Mac OS X 10.4 PowerPC, Mac OS X 10.4 Intel, Mac OS X 10.5 PowerPC/Intel.Browsers. Safari 1.4 and higher, Firefox 1.x, Mozilla 1.7.5 and higher, Netscape 7.0.xScreen Resolution. Chem & Bio 3D supports a Macintosh screen resolution of 800 x 600 or higher.

Adm
inistrator
iv

Chem & Bio Office 2010 User Guide v
ContentsChem & Bio Office 2010 ........................ i
About Chem & Bio 3D 12.0 ....................... iAbout ChemScript ...................................... iAbout ChemBioFinder ............................... iAbout this Guide ........................................ iConventions ............................................... iiAdditional Information .............................. iiQuick Reference Cards .............................. iiMicrosoft® Office Products ..................... iiiSystem Requirements ............................... iii
Section IChem & Bio 3DWhat’s New ............................................3
Chapter 1About Chem & Bio 3D 12.0 ...................5
Chapter 2Chem & Bio 3D 12.0 Basics ...................7
Getting Around ...........................................7Model Building Basics .............................20
Chapter 3Displaying Models ................................25
Structure Displays ....................................25Molecular Surfaces ...................................33Other Sources ...........................................40
Chapter 4Tutorials ............................................... 41
Tutorial 1: The ChemDraw Panel ............ 41Tutorial 2: Using Bond Tools .................. 42Tutorial 3: The Build from Text Tool ..... 46Tutorial 4: Examining Conformations .... 49Tutorial 5: The Dihedral Driver ............. 52Tutorial 6: Overlaying Models ................ 54Tutorial 7: Docking Models .................... 56Tutorial 8: Viewing Orbitals ................... 58Tutorial 9: Mapping Surfaces .................. 58Tutorial 10: Partial Charges ..................... 60
Chapter 5Building Models................................... 63
Setting the Model Building Controls ....... 63Building with the ChemDraw Panel ........ 64Building With the Bond Tools ................ 65Build from Text Tool .............................. 67Building From Tables .............................. 71Changing Elements .................................. 72Changing Bond Order .............................. 73Adding Fragments .................................. 74Setting Measurements ............................. 75Setting Charges ........................................ 77Serial Numbers ........................................ 77Changing Stereochemistry ....................... 78Refining a Model ..................................... 80Printing and Saving ................................. 80Copying and Embedding ......................... 81
Chapter 6Modifying Models ................................ 83
Selecting .................................................. 83Showing and Hiding Atoms .................... 86Moving Atoms or Models ....................... 88
Adm
inistrator
vi Contents
Rotating Models .......................................89Resizing Models .......................................93The Z-matrix ............................................94
Chapter 7Viewing Models ....................................99
Popup Information ....................................99The Measurement Table .........................100Deviation from Plane .............................102Comparing Models by Overlay ..............104Model Explorer ......................................105Structure Browser ...................................108
Chapter 8Force Field Calculations ...................111
About Atom Types .................................111Force Fields ............................................111Molecular Dynamics ..............................120Compute Properties ................................125Showing Used Parameters ......................127Defining Atom Types .............................127
Chapter 9Exporting Models ..............................129
Using the Clipboard ..............................129
Chapter 10CS GAMESS Computations .............133
CS GAMESS Overview .........................133Minimizing Energy ................................133Saving Customized Job Descriptions .....135Running a CS GAMESS Job ..................136
Chapter 11Gaussian .............................................137
The Gaussian Interface ...........................137Optimize to Transition State ..................140
Computing Properties ............................ 140Job Description File Formats ................ 140
Chapter 12Jaguar .................................................143
Overview ............................................... 143Minimizing Energy ................................ 143Optimize to Transition State .................. 144Predicting Spectra .................................. 144Computing Properties ............................ 145Advanced Mode .................................... 145
Chapter 13CS MOPAC ........................................147
Minimizing Energy ................................ 147Computing Properties ............................ 151Predict IR Spectrum .............................. 152CS MOPAC Files .................................. 164
Appendix ASubstructures .....................................167
Defining Substructures .......................... 168
Appendix BKeyboard Modifiers ...........................171
Rotation ................................................. 171Selection ................................................ 172
Appendix CBuilding Types ....................................175
Assigning building Types ...................... 175Defining building types ......................... 176
Appendix D2D to 3D Conversion ..........................177
Chem & Bio Office 2010 User Guide vii
Appendix EFile Formats ........................................179
Editing File Format Atom Types ...........179File Format Examples ............................179Export File Formats ................................207
Appendix FParameter Tables ...............................217
Using Parameter Tables .........................217Estimating Parameters ............................218Creating Parameters ...............................219The Elements ..........................................219Building Types .......................................220Substructures ..........................................222References ..............................................222Bond Stretching Parameters ...................222Angle Bending Parameters .....................223Pi Bonds .................................................225Electronegativity Adjustments ...............226MM2 Constants ......................................226MM2 Atom Type Parameters .................228Torsional Parameters ..............................229Out-of-Plane Bending ............................232van der Waals Interactions ....................232
Appendix GComputation Concepts ......................235
Computational Chemistry Overview ......235Computational Methods Overview ........235Uses of Computational Methods ............236Choosing the Best Method .....................236Molecular Mechanics Theory in Brief ...242The Force-Field ......................................242Molecular Dynamics Simulation ............249Approximate Hamiltonians in MOPAC .250Choosing a Hamiltonian .........................250
Appendix HMM2 ................................................... 255
The MM2 Force Field ........................... 256Allinger’s Force Field ............................ 256
Appendix IMOPAC .............................................. 259
Potential Energy Functions ................... 259Adding Parameters to MOPAC ............. 260Using Keywords .................................... 260Specifying the Electronic Configuration 261
Appendix JTechnical Support ............................. 267
Serial Numbers ...................................... 267Troubleshooting ..................................... 268
Section IIChemScript
Chapter 14ChemScript ........................................ 271
Getting Started ....................................... 272Editing Scripts ....................................... 273Tutorials ................................................. 275Useful References .................................. 277
Adm
inistrator
viii Contents
Section IIIChemBioFinderWhat’s New ........................................281
Chapter 15ChemBioFinder & BioViz .................283
About ChemBioFinder 12.0® ................283About BioViz .........................................283About this guide .....................................283Additional information ...........................284
Chapter 16The User Interface .............................285
The ChemBioFinder User Interface .......285More UI features ....................................290Opening ChemBioFinder 12.0 ...............290Using ChemBioFinder 12.0 with databases 291
Chapter 17Tutorials .............................................293
Tutorial 1: Creating forms ......................293Tutorial 2: Opening a database ...............295Tutorial 3: Creating a database ...............296Tutorial 4: Searching a database ............298Tutorial 5: Reaction queries ...................301Tutorial 6:Creating a BioViz chart .........304Tutorial 7: Working with subforms ........309
Chapter 18Forms ..................................................311
Creating forms automatically .................311
Saving a form ........................................ 313Creating forms manually ....................... 313Setting box properties ............................ 318Editing forms ......................................... 324
Chapter 19Databases ............................................333
Selecting a database ............................... 333Opening databases ................................. 336Browsing databases ............................... 338Creating a database ................................ 341Creating a portal database ..................... 346
Chapter 20Working with Data ............................347
Entering data .......................................... 347Editing data ............................................ 349Sorting data ............................................ 353Resetting the database ........................... 354Changing the database scheme .............. 354
Chapter 21Queries ................................................357
Text searches ......................................... 357Numeric searches .................................. 358Molecular formula searches .................. 358Date searches ......................................... 359Find list .................................................. 360Structure searches .................................. 360Reaction searches .................................. 366Combined searches ................................ 368SQL searches ......................................... 369Query procedures .................................. 369Refining a search ................................... 374Special structure searches ...................... 376Managing queries .................................. 380Search examples .................................... 384

Chem & Bio Office 2010 User Guide ix
Chapter 22Importing and Exporting Data .........389
Importing data ........................................389Exporting data .......................................394
Chapter 23Relational Data and Subforms .........399
Access relational data ............................399Creating a subform .................................399Working with subforms ..........................401Searching a subform ...............................402
Chapter 24Compound Profiles ............................405
Creating a compound profile ..................406Editing a compound profile ....................408Customizing ...........................................411
Chapter 25 ChemBioFinder/Oracle ....................413
Setup .......................................................413Opening an Oracle database ...................414Searching ................................................415Sorting ....................................................416Handling lists .........................................416Setting Oracle preferences .....................417Updating and adding data .......................417Loading ...................................................418Indexing ..................................................419CAL ........................................................420
Chapter 26 BioViz .................................................423
Changes in version 11 ............................423Changes in version 10 ............................424Creating a plot ........................................425Statistical analysis ..................................428Plotting queries .......................................432
Changing the display ............................. 433
Chapter 27BioSAR ............................................... 435
Subforms and autolinks ......................... 436Multiple sort .......................................... 437Query hitlists ......................................... 438Domains ................................................. 441Creating an mdb database ...................... 441
Chapter 28Customizing ChemBioFinder 12.0 ... 445
Setting preferences ................................ 445Favorites tree ......................................... 449Toolbars ................................................. 450Periodic table ......................................... 451Embedding ActiveX controls ................ 452Scripting ................................................ 453Methods of communication ................... 460
Chapter 29ChemFinder/Office ............................ 465
Overview ............................................... 465The user interface (UI) .......................... 465Selecting files to search ......................... 465Searching by chemical structure ........... 467Searching by multiple properties ........... 468Browsing search results ......................... 469Saving files or data sources ................... 469Searching DSD files .............................. 470Sending a file to another application ..... 471Refining your search ............................. 472Changing ChemFinder/Office settings .. 474
Appendix AStructural Query Features ............... 477
General properties ................................. 477Changing the scope of a search ............. 483

Adm
inistrator
x Contents
Atom properties ......................................483Bond properties ......................................487
Appendix BFormula Input Rules .........................489
Rules .......................................................489Examples ................................................489
Appendix CCombiChem ......................................491
CombiChem overview ............................491Working with reaction templates ...........491Entering a template .................................491
Appendix DSimilarity Rules .................................495
Complete structure similarity .................495Substructure similarity ...........................496
Appendix ECAL Commands ................................497
CAL help ............................................... 497Menu commands ................................... 497Box creation commands ........................ 500Box manipulation commands ................ 505Program execution commands .............. 508General commands ................................ 511File commands ...................................... 525Variable commands ............................... 527Environment variables ........................... 533Script-only commands ........................... 534
Appendix F CS Oracle Cartridge .........................539
Pre-setup procedures ............................. 539Fast-move caching scheme .................... 540Configuring via CF_SETTINGS table .. 540Searching ............................................... 541
Index .................................. 543

Chem & Bio Office 2010 User Guide 1Chem & Bio 3D
Chem & Bio 3D

2

Chem & Bio Office 2010 User Guide 3Chem & Bio 3D
What’s NewChem & Bio 3D 12.0 introduces a variety of improvements and new features not found in earlier versions. The new features are briefly described below. You can find more informa-tion on these and other features throughout the manual and online Help.Support for multiple processors. For demand-ing calculations, Chem & Bio 3D 12.0 includes a new option that lets you take advantage of multiple processors for MMFF94 calculations. This means you can use all your available computer resources.For more information, See “Multiple proces-sors” on page 112.Advanced Electrostatic calculations. Electro-static calculation is a non-bonded energy cal-culation and it takes it account the charge on the non-bonded atoms and their interatomic distance. Since approximation of electrostatic interactions is done, the need for any cut off technique is eliminated. Chem & Bio 3D 12.0 offers three ways to perform MMFF94 electro-static calculations—exact, fast multiple method, and adaptive tree code algorithm. See “Electrostatic calculations” on page 113.Van der Waals calculations. It is a non-bonded energy calculation and takes into account the attractive and repulsive forces between the non bonded atoms. It implements various cut off techniques for better and less time consuming approximation and calculation. In addition to performing exact calculations, Chem & Bio 3D 12.0 provides three ways for you to approxi-mate results for Van der Waals calculations. See “van der Waals calculations” on page 114.
Updated ChemDraw panel. The ChemDraw panel in Chem & Bio 3D 12.0 has two modes, LiveLink and Insertion. This new design makes version 12.0 more streamlined than earlier ver-sions and simpler to use. For more informa-tion, See “The ChemDraw Panel” on page 17.Structure Browser preview. The ChemDraw preview is a convenient feature that has been added to the structure browser window. When-ever you select a fragment in the structure browser, you can see its 2-dimensional struc-ture in the ChemDraw preview window. See “Structure Browser” on page 108.MMFF94 for molecular dynamics calculations. In earlier versions of Chem & Bio 3D, MMFF94 was a powerful tool for calculat-ing minimization energies. In version 12.0, you can also use MMFF94 to perform molecular dynamics calculations.The method of molecular dynamics simulation is one of the principal tools in the theoretical study of biological molecules. In Chem & Bio 3D 12.0, molecular dynamics was carried out using MM2 force field, which is designed to model small organic molecules. In ChemBio3D Ultra 12.0, MMFF94 force field, which is a combined organic/ protein force field is used for molecular dynamics calcula-tions. For more information of molecular dynamics, See “Molecular dynamics simula-tion using MMFF94” on page 121.Confirmation sampling. Most organic mole-cules of non trivial size can assume a multitude of 3D conformations. Different algorithms/methods are used to search for conformational minima. Chem & Bio 3D 12.0 supports Sto-
4 What’s New
chastic method of Conformation sampling to generate stable conformations. For more infor-mation, See “Conformation Sampling” on page 115.CS MOPAC 2009. Chem & Bio 3D 12.0 sup-ports the latest version of CS MOPAC- CS MOPAC 2009. CS MOPAC 2009 uses a linear scaling algorithm called MOZYME. It is based on SCF technique and is suitable for geometry optimizations of giant molecules like proteins. CS MOPAC 2009 enables geometry optimiza-
tions on closed shell systems of up to 15,000 atoms. CS MOPAC 2009 provides a new and more accurate semi-empirical computation method, PM6. See “PM6 Applicability and Limitations” on page 253Support for Office 2007. Chem & Bio 3D 12.0 supports Microsoft Office 2007. This means you can use the latest software to add a model to your Word document, Excel spreadsheet, PowerPoint presentation, or FrontPage Web site.

Chem & Bio Office 2010 User Guide 5Chem & Bio 3D
About Chem & Bio 3D 12.0Chem & Bio 3D 12.0 enables you to create color models of chemical and biochemical compounds. The Chem & Bio 3D 12.0 family of products includes Chem3D Pro 12.0, Bio3D Ultra 12.0, and ChemBio3D Ultra 12.0. Each of these powerful and versatile applications is uniquely designed to meet the demanding requirements of chemical and biochemical modeling. Whether you are studying the ter-tiary structure of a protein or the thermal prop-erties of a new polymer, one of these products will likely meet your needs.
Chem3D Pro 12.0This latest version of Chem & Bio 3D 12.0 has numerous new features that were never avail-able in earlier versions. Chem3D Pro 12.0 is specifically designed for studying small mole-cules and their properties such as quantum mechanics, reactivity, and thermal characteris-tics, just to name a few.
Bio3D Ultra 12.0With Chem & Bio Office 2010, CambridgeSoft proudly introduces Bio3D Ultra 12.0. Here you will find a host of new features that cater to users who specialize in the biology and biochemistry sciences. For instance, use Bio3D to identify protein binding sites, analyze RNA fragments, or view virtu-ally any complex biology model.
ChemBio3D Ultra 12.0ChemBio3D Ultra 12.0 includes all the fea-tures found in Bio3D Ultra 12.0 and Chem3D Pro 12.0. CambridgeSoft also makes available Jaguar and Gaussian for performing advanced quantum mechanics calculations.
NOTE: Gaussian is compatible only with ChemBio3D Ultra and may be purchased sepa-rately. See www.CambridgeSoft.com for infor-mation.
Once you have a model, you can calculate a variety of molecular properties—electrostatic potentials, bond energies, and spectrum predic-tion, and more. It combines powerful building, analysis, and computational tools with intuitive menus and a powerful scripting interface.
About GaussianGaussian is a cluster of programs that are available for you to perform semi-empirical and ab initio molecular orbital (MO) calcula-tions.
NOTE: Gaussian is compatible only with ChemBio3D Ultra and may be purchased sepa-rately. See www.CambridgeSoft.com for more information.
1

6 About Chem & Bio 3D 12.0Chapter 1
When Gaussian is installed (if it is not, the Gaussian menu option is gray), Chem & Bio 3D 12.0 communicates with it and serves as a graphical front end for Gaussian’s text-based input and output. Chem & Bio 3D 12.0 is com-patible with Gaussian 03 for Windows and requires the 32-bit version.
About JaguarSCHRÖDINGER® Jaguar is a high-perfor-mance ab initio package for both gas and solu-
tion phase simulations, with particular strength in treating metal containing systems. It is a practical quantum mechanical tool for solving real-world problems. The new Chem & Bio 3D interface is the only Windows platform GUI for Jaguar.
NOTE: Jaguar is compatible only with ChemBio3D Ultra.

Chem & Bio Office 2010 User Guide 7Chem & Bio 3D
Chem & Bio 3D 12.0 BasicsGetting AroundThe main screen consists of a model window, menus, toolbars and dialog boxes. It can also include up to three optional panels that display
the Output and Comments boxes, the Model Explorer, tables, and the ChemDraw Panel. The Status bar displays information about the active frame of your model and hidden atoms.
2
Figure 2.1 The Chem & Bio 3D showing, the ChemDraw panel and the Model Explorer window set to Auto-Hide: A) Title Bar; B) Building toolbar; C) Model display toolbar; D) Demo toolbar; E) Calculation toolbar; F) ChemDraw Panel tab; G) Menu bar; H) Standard toolbar; I) Active window tab; J) Model Explorer tab; K) Model Area; L) Status bar.

8 Chem & Bio 3D 12.0 BasicsChapter 2
The Model WindowThe Model window is the work space where you build your model. Any text information about the model, such as calculation results, appears in the Output window or the Status bar.The table below describes the objects in the Model window.
Rotation BarsUse the rotation bars rotate a model as you view it. The bars are hidden by default and appear only when you use them.To rotate a model:
1. Select the Trackball tool.
2. Click and drag from any of the rotation bars to anywhere in the model window.
Figure 2.2 The rotation axis: A) Z-Axis; B) X-Axis; C) Y-Axis; D) Bond Axis
The Bond axis bar is active only when you select a bond or dihedral. To freely rotate the image, drag in the main window. The cursor changes to a hand when you are in freehand rotation mode.To hide the bars (without disabling them):
1. Go to File>Preferences.2. Click GUI tab.3. Select Show Mouse Rotation Zones.
Saving ModelsSave your model by right-clicking its name at the top of the window. You can then print, save, or close the model as required.
PreferencesGUI customization includes style options, win-dow settings, and Model Explorer display options. The VS 2005 (Whidbey) style option includes smart docking for toolbars. You can change the settings by selecting appropriate option under the GUI tab of the Preferences dia-log box.
Object Description
Model area The workspace where a molecular model is viewed, built, modified, or ana-lyzed. The origin of the Car-tesian axes (0,0,0) is always located at the center of this window, regardless of how the model is moved or scaled. The Cartesian axes do not move relative to the window.
Active Win-dow tab
Chem & Bio 3D 12.0 can open multiple models simul-taneously. The tab selects the active window.
Chem & Bio Office 2010 User Guide 9Chem & Bio 3D
Menus and ToolbarsThe toolbars contain icons that offer shortcuts to many commonly used functions. Go to View>Toolbars to activate the toolbars you want.
Detaching toolbarsTo move any toolbar, you can detach it from the top of the screen and drag it to any part of the GUI.To detach a toolbar:
1. Click and drag its left-most border onto the Model window.
2. Click and drag its title bar to move it any-where on the screen you want.
TIP: Most toolbar commands are duplicated from the menus, and are available for your as a convenience. If you only use a command infre-quently, you can save clutter by using the menu commands.
The File MenuIn addition to providing other commands, the File menu includes the Chem & Bio 3D Tem-plates, Preferences, and Model Settings. Import File. Import MOL2 and SD files into Chem & Bio 3D documents.Model Settings. Set defaults for display modes and colors, model building, atom and ligand display, atom labels and fonts, movie and ste-reo pair settings, and atom/bond popup label information.Preferences. Set defaults for image export, cal-culation output path, OpenGL settings and including hydrogens in CDX format files.Sample Files. Open example models. To intro-duce yourself to Chem & Bio 3D, you may
consider taking a look at the sample files. These include a variety of simple and complex models representing compounds found in research and academia.
The Edit MenuThe Edit menu offers a list of fundamental commands that you can apply to your models:Copy as. Puts the model on the Clipboard in ChemDraw format, as a SMILES1 string, or in bitmap format. Copy As ChemDraw Structure. Puts the model on the Clipboard in CDX format. You may only paste the structure into an application that can accept this format, for example Chem & Bio Draw, ChemFinder & BioViz, or Chem & Bio 3D.Copy As SMILES. Puts the model on the Clip-board as a SMILES string. You can paste the structure only into applications that can accept this format.Copy As Picture. Puts the model on the Clip-board as a bitmap. You can paste the structure only into applications that can accept bitmaps.
NOTE: The application you paste into must recognize the format. For example, you cannot paste a ChemDraw structure into a Microsoft Word document.
Paste Special. Preserves coordinates when pasting a Chem & Bio 3D model from one document to another.Clear. Clears the Model window of all struc-tures.
1. A text string that represents the structure of a molecule.
10 Chem & Bio 3D 12.0 BasicsChapter 2
Select All. Selects the entire model.Select Fragment. If you have selected an atom, selects the fragment to which that atom belongs.
The View MenuUse the View menu to select the view position and focus, as well as the toolbars, tables, and panels that are visible. The Model Display sub-menu of the View menu duplicates all of the commands in the Model Display toolbar.Model Display. It provides a variety of options for you to change the way your model looks. None of the Model Display options change the model; they only change how it is displayed.
• Show Hydrogen Atoms—A toggle switch to display or hide hydrogen atoms.
• Show Hydrogen Bonds—A toggle switch to display or hide hydrogen bonds between molecules.
• Show Lone Pairs—A toggle switch to dis-play or hide lone pairs of electrons.
• Show Atom Symbols—A toggle switch to display what each atom is carbon, oxygen, hydrogen, etc.
• Show Serial Numbers—A toggle switch to display or hide the serial number. Each atom has a unique number used to identify it.
• Show Residue Labels—Displays or hides the names of amino acid residues in the 3D view.
NOTE: Residue labels appear only when a protein structure is displayed in the Model win-dow.
• Show Atom Dots—Displays or hides atom dot surfaces for the model. The dot surface is based on van der Waals radius or partial charges, as set in the Atom Display table of the Settings dialog box.
• Red &Blue—A toggle switch to set the dis-play for optimal viewing with red-blue 3D glasses to create a stereo effect.
• Stereo Pairs—A toggle switch to enhance the 3D effect by displaying a model with two slightly different orientations. It can also create orthogonal (simultaneous front and side) views. The degree of separation is set on the Stereo View tab of the Settings dialog box.
• Perspective—A toggle switch to create a perspective rendering of the model by con-sistent scaling of bond lengths and atom sizes by depth. The degree of scaling is controlled by the Perspective “Field of View” slider on the Model Display tab of the Settings dialog box.
• Depth Fading—A toggle switch to create a realistic depth effect, where more distant parts of the model fade into the back-ground. The degree of fading is controlled by the Depth Fading “Field of View” slider on the Model Display tab of the Settings dialog box.
• Model Axes—Displays or hides the model axes.
• View Axes—Displays or hides the view axes.
NOTE: When both axes overlap and the Model axes are displayed, the View axes are not visi-ble.
Chem & Bio Office 2010 User Guide 11Chem & Bio 3D
• Background Color—Displays the Back-ground color select toolbar. Dark back-grounds are best for viewing protein ribbon or cartoon displays. Selecting red-blue will automatically override the background color to display the optimal black back-ground. Background colors are not used when printing, except for Ribbon displays. When saving a model as a GIF file, the background will be transparent, if you have selected that option for Image Export in the Preferences dialog box.
• Background Effects—Displays how the shade gradient appears.
• Color By—Selects the model coloring scheme. See “Coloring Displays” on page 28 for more information.
View Position. The View Position submenu provides options for centering the view, fitting the window, and aligning the view with an axis.View Focus. Use the View Focus submenus to set the focus. See “View Focus” on page 74.Toolbars. Click the name of a toolbar to dis-play and hide it. You can attach a toolbar to any side of the GUI by dragging it to the desired position. If you are using a floating toolbar, you can change its shape by dragging any of its edges.
• Standard toolbar—Contains standard file, edit, and print tools. The commands are also available on the File and Edit menus.
• Building toolbar—Contains the Select, Translate, Rotate, and Zoom tools in addi-tion to the model building tools—bonds, text building tool, and eraser. These tools are not duplicated on any menu. This tool-bar is divided into “safe” and “unsafe” tools. The four “safe” tools on the left con-
trol only the view – they do not affect the model in any way. This includes the new “safe” select tool and the translate tool. Use the Move tool to move atoms and frag-ments.
• Model Display toolbar—Contains tools to control the display of the model. These tools are duplicated on the View menu.
• Surfaces toolbar—Contains tools to calcu-late and display a molecular surface. Molecular Surface displays provide infor-mation about entire molecules, as opposed to the atom and bond information provided by Structure displays.
• Calculation toolbar—Performs MM2 mini-mization from a desktop icon. The spin-ning- arrow icon shows when any calculation is running; use the Stop icon to stop a calculation before its preset termina-tion.
• Status bar—Displays the Status bar, which displays information about the active frame of your model.
• Customize—Displays the Customize dia-log box. Customizing toolbars is a standard Microsoft Windows operation, and is out-side the scope of this documentation.
Model Explorer. Displays a hierarchical tree representation of the model. Most useful when working with complex molecules such as pro-teins, the Model Explorer gives you highly granular control over the model display.ChemDraw Panel. Displays the ChemDraw Panel. Use the ChemDraw Panel to build mole-cules quickly and easily with familiar Chem & Bio Draw tools. You can import, export, mod-ify, or create small molecules quickly and eas-ily using the Chem & Bio Draw ActiveX tools palette.
12 Chem & Bio 3D 12.0 BasicsChapter 2
Cartesian Table. Displays the Cartesian Coor-dinates table. Cartesian Coordinates describe atomic position in terms of X-, Y-, and Z-coor-dinates relative to an arbitrary origin. Internal coordinates Table. Displays the inter-nal coordinates, or Z-Matrix, table. Internal coordinates are the most commonly used coor-dinates for preparing a model for further com-putation.Measurement Table. Displays the Measure-ment table. The Measurement table displays bond lengths, bond angles, dihedral angles, and ring closures. Atom Property Table. The Atom Property Table displays calculated properties for each atom in the model. See “Atom Properties” on page 102 for more information.Parameters Tables. Displays a list of external tables that Chem & Bio 3D uses to construct models, perform computations, and display results. Output Box. Displays the Output box, which provides information about the model, itera-tions, etc. The content in the output box is not saved with the model.Comments Box. Displays the Comments box, a place for you to add comments. These com-ments are stored with the file when you save it.Dihedral Chart. Opens the window displaying results of Dihedral Driver1 MM2 computa-tions. See “Tutorial 5: The Dihedral Driver” on page 52 for more information.
Demo. Provides options to spin the model on the Y-axis. This lets you view your model from different perspectives as it rotates.Full Screen. View the model in full screen dis-play with the entire Chem & Bio 3D GUI hid-den. Press Esc to close the view.Status Bar. Displays or hides the Status Bar.
The Structure MenuThe Structure menu commands populate the Measurement table and control movement of the model.Measurements. The options below allow you to measure distances and bond angles in your model.
• Generate All Bond Lengths—Displays bond lengths in the Measurement Table. The Actual values come from the model and the Optimal values come from the Bond Stretching Parameters external table.
• Generate All Bond Angles—Displays bond angles in the Measurement Table. The Actual values come from the model and the Optimal values come from Angle Bending Parameters and other external tables.
• Generate All Dihedral Angles—Displays dihedral angles in the Measurement Table. The Actual values come from the model and the Optimal values come from Angle Bend-ing Parameters and other external tables.
• Clear—Clears the entire Measurement table. If you only want to clear part of the table, select the portion you want to clear, and choose Delete from the context menu.
Model Position. The options in this submenu let you move and align your model relative to the window axes.
• Center Model on Origin—Resizes and cen-ters the model in the model window.
1. The dihedral driver feature is avail-able only in ChemBio3D Ultra 12.0 and Chem3D Pro 12.0

Chem & Bio Office 2010 User Guide 13Chem & Bio 3D
• Center Selection on Origin—Resizes and centers the selected portion of the model in the Model window.
• Align Model With {X-, Y-, or Z-} Axis—When two atoms are selected, moves them to the X-, Y-, or Z-axis, depending on which of the three menu items you choose.
• Align Model With {X-Y, X-Z, or Y-Z} Plane—When three atoms are selected, moves them to the X-Y, X-Z, or Y-Z plane, depending on which of the three menu items you choose.
Reflect Model. The options on the Reflect Model submenu reflect the model through a 2-coordinate plane that you select, negating the third coordinate. If the model contains any chiral centers this will change the model into its enantiomer. Pro-R positioned atoms will become Pro-S and Pro-S positioned atoms will become Pro-R. All dihedral angles used to position atoms will also be negated.
• Through XY Plane—Reflects the model through the XY plane by negating Z coordi-nates.
• Through XZ Plane—Reflects the model through the XZ plane by negating Y coordi-nates.
• Through YZ Plane—Reflects the model through the YZ plane by negating X coordi-nates.
• Invert Through Origin—Reflects the model through the origin, negating all Cartesian coordinates.
THE SET Z-MATRIX SUBMENUSet Origin Atom—Sets the selected atom(s) as the origin of the internal coordinates. Up to three atoms may be selected as either the origin atom or an atom positioned relative to the ori-
gin atom. See “The Z-matrix” on page 94 for more information.Position by Dihedral—Positions an atom rela-tive to three previously positioned atoms using a bond distance, a bond angle, and a dihedral angle. For more information on changing the internal coordinates see “Setting Dihedral Angles” on page 75.Position by Bond Angles—Positions an atom relative to three previously positioned atoms using a bond distance and two bond angles. For more information on changing the internal coordinates see “Setting Bond Angles” on page 75. Detect Stereochemistry. Scans the model and lists the stereocenters in the Output box.Invert. Inverts the isomeric form. For example, to invert a model from the cis- form to the trans- form, select one of the stereo centers and use the Invert command.Deviation from Plane. When you select four or more atoms, this option outputs the RMS devi-ation from the plane to the Output window.Add Centroid. Adds a centroid to a selected model or fragment. At least two atoms must be selected. The centroid and “bonds” to the selected atoms are displayed, and “bond” lengths can be viewed in the tool tips. To delete a centroid, select it and press the Delete or Backspace key.
NOTE: You cannot add a centroid to a model or fragment when more than 12 atoms are selected.
Rectify. Fills the open valences for an atom, usually with hydrogen atoms. This command is only useful if the default automatic rectifica-

14 Chem & Bio 3D 12.0 BasicsChapter 2
tion is turned off in the Model Settings dialog box.Clean Up. Corrects unrealistic bond lengths and bond angles that may occur when building models, especially when you build strained ring systems.Bond Proximate. If two atoms are close enough together to be bonded, this option will provide a covalent bond between the two. Go to File>Model Settings>Model Building tab and use the Bond Proximate Addition slider to spec-ify the maximum distance between atoms for which this feature can be used.Lone Pair. Adds and removes lone electron pairs. You can also hide or show them after you add them.Overlay. The Overlay submenu provides all of the commands to enable you to compare frag-ments by superimposing one fragment in a model window over a second fragment. Two types of overlay are possible: quick and mini-mization. See “Fast Overlay” on page 110, and “Comparing Models by Overlay” on page 104 for information on each overlay type.Dock. Use the Dock command to position a fragment into a desired orientation and prox-imity relative to a second fragment. Each frag-ment remains rigid during the docking computation.
The Standard ToolbarThe Standard toolbar contains tools for stan-dard Windows functions, including up to 20 steps of Undo and Redo. :
Figure 2.3 The Standard Toolbar
The Building ToolbarThe Building toolbar contains tools to let you create and manipulate models:
Figure 2.4 The Building Toolbar.
New FileOpen File Save File CopyCutPasteUndoRedoPrint
“Safe” Select tool (view only)Translate toolRotate toolRotation Dial activatorZoom toolMove Objects toolSingle Bond toolDouble Bond toolTriple Bond toolDummy Bond toolBuild From Text toolEraser tool
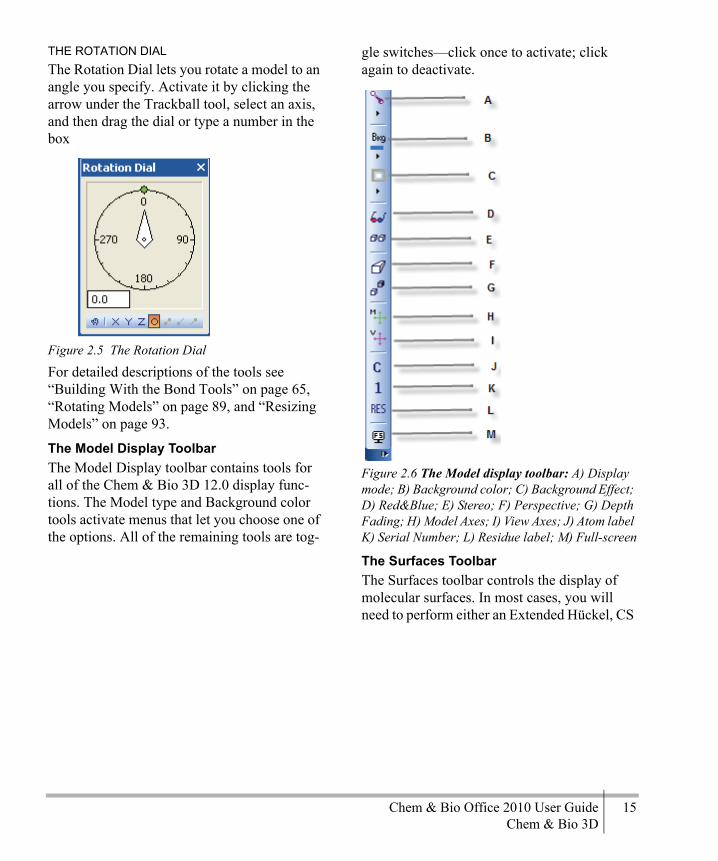
Chem & Bio Office 2010 User Guide 15Chem & Bio 3D
THE ROTATION DIALThe Rotation Dial lets you rotate a model to an angle you specify. Activate it by clicking the arrow under the Trackball tool, select an axis, and then drag the dial or type a number in the box
Figure 2.5 The Rotation Dial
For detailed descriptions of the tools see “Building With the Bond Tools” on page 65, “Rotating Models” on page 89, and “Resizing Models” on page 93.
The Model Display ToolbarThe Model Display toolbar contains tools for all of the Chem & Bio 3D 12.0 display func-tions. The Model type and Background color tools activate menus that let you choose one of the options. All of the remaining tools are tog-
gle switches—click once to activate; click again to deactivate.
Figure 2.6 The Model display toolbar: A) Display mode; B) Background color; C) Background Effect; D) Red&Blue; E) Stereo; F) Perspective; G) Depth Fading; H) Model Axes; I) View Axes; J) Atom label K) Serial Number; L) Residue label; M) Full-screen
The Surfaces ToolbarThe Surfaces toolbar controls the display of molecular surfaces. In most cases, you will need to perform either an Extended Hückel, CS
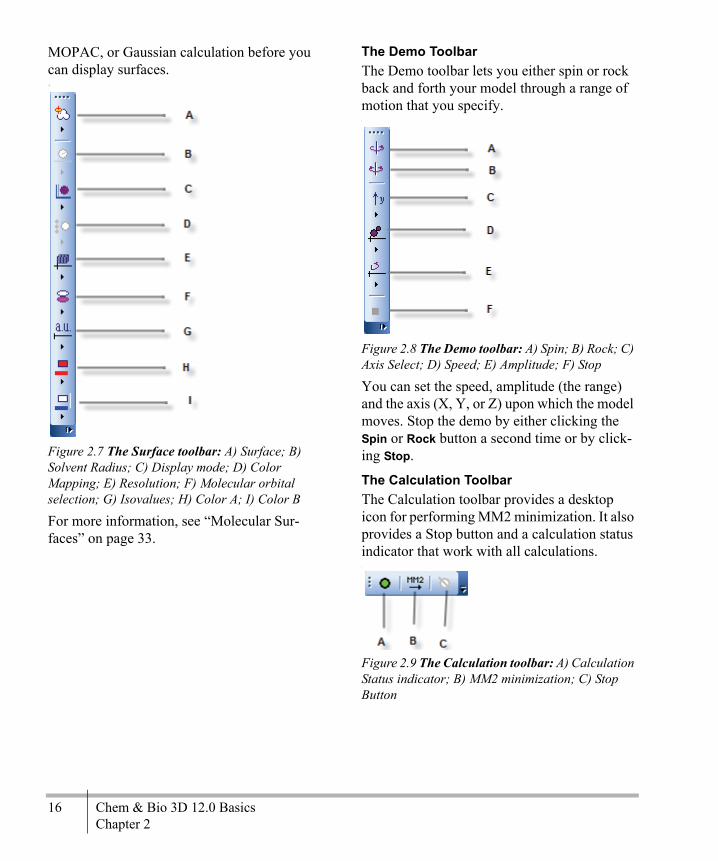
16 Chem & Bio 3D 12.0 BasicsChapter 2
MOPAC, or Gaussian calculation before you can display surfaces. : r
Figure 2.7 The Surface toolbar: A) Surface; B) Solvent Radius; C) Display mode; D) Color Mapping; E) Resolution; F) Molecular orbital selection; G) Isovalues; H) Color A; I) Color B
For more information, see “Molecular Sur-faces” on page 33.
The Demo ToolbarThe Demo toolbar lets you either spin or rock back and forth your model through a range of motion that you specify. :
Figure 2.8 The Demo toolbar: A) Spin; B) Rock; C) Axis Select; D) Speed; E) Amplitude; F) Stop
You can set the speed, amplitude (the range) and the axis (X, Y, or Z) upon which the model moves. Stop the demo by either clicking the Spin or Rock button a second time or by click-ing Stop.
The Calculation ToolbarThe Calculation toolbar provides a desktop icon for performing MM2 minimization. It also provides a Stop button and a calculation status indicator that work with all calculations.:
Figure 2.9 The Calculation toolbar: A) Calculation Status indicator; B) MM2 minimization; C) Stop Button
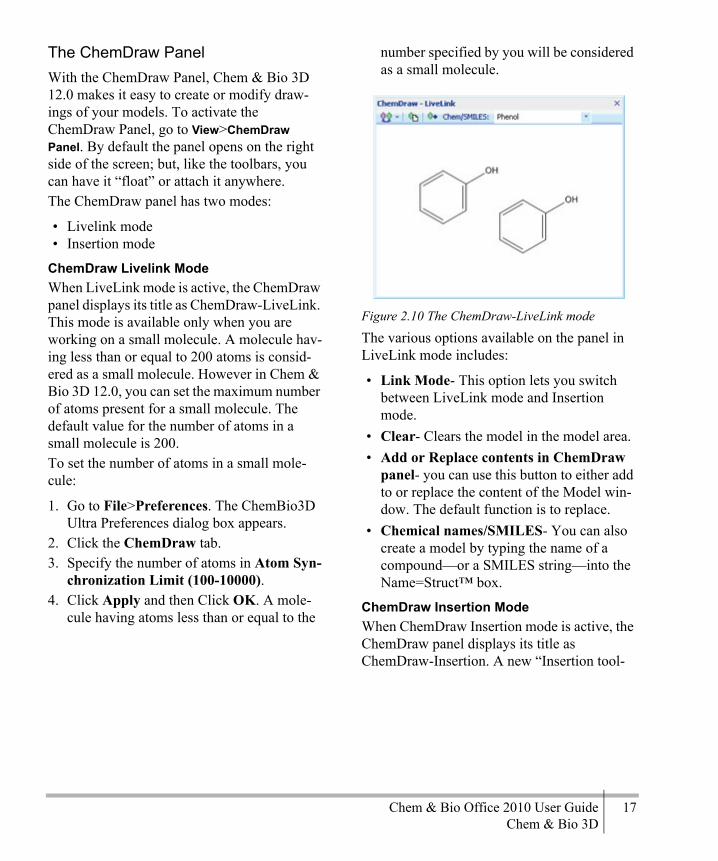
Chem & Bio Office 2010 User Guide 17Chem & Bio 3D
The ChemDraw PanelWith the ChemDraw Panel, Chem & Bio 3D 12.0 makes it easy to create or modify draw-ings of your models. To activate the ChemDraw Panel, go to View>ChemDraw Panel. By default the panel opens on the right side of the screen; but, like the toolbars, you can have it “float” or attach it anywhere.The ChemDraw panel has two modes:
• Livelink mode • Insertion mode
ChemDraw Livelink ModeWhen LiveLink mode is active, the ChemDraw panel displays its title as ChemDraw-LiveLink. This mode is available only when you are working on a small molecule. A molecule hav-ing less than or equal to 200 atoms is consid-ered as a small molecule. However in Chem & Bio 3D 12.0, you can set the maximum number of atoms present for a small molecule. The default value for the number of atoms in a small molecule is 200. To set the number of atoms in a small mole-cule:
1. Go to File>Preferences. The ChemBio3D Ultra Preferences dialog box appears.
2. Click the ChemDraw tab.3. Specify the number of atoms in Atom Syn-
chronization Limit (100-10000).4. Click Apply and then Click OK. A mole-
cule having atoms less than or equal to the
number specified by you will be considered as a small molecule.
Figure 2.10 The ChemDraw-LiveLink mode
The various options available on the panel in LiveLink mode includes:
• Link Mode- This option lets you switch between LiveLink mode and Insertion mode.
• Clear- Clears the model in the model area.• Add or Replace contents in ChemDraw
panel- you can use this button to either add to or replace the content of the Model win-dow. The default function is to replace.
• Chemical names/SMILES- You can also create a model by typing the name of a compound—or a SMILES string—into the Name=Struct™ box.
ChemDraw Insertion ModeWhen ChemDraw Insertion mode is active, the ChemDraw panel displays its title as ChemDraw-Insertion. A new “Insertion tool-
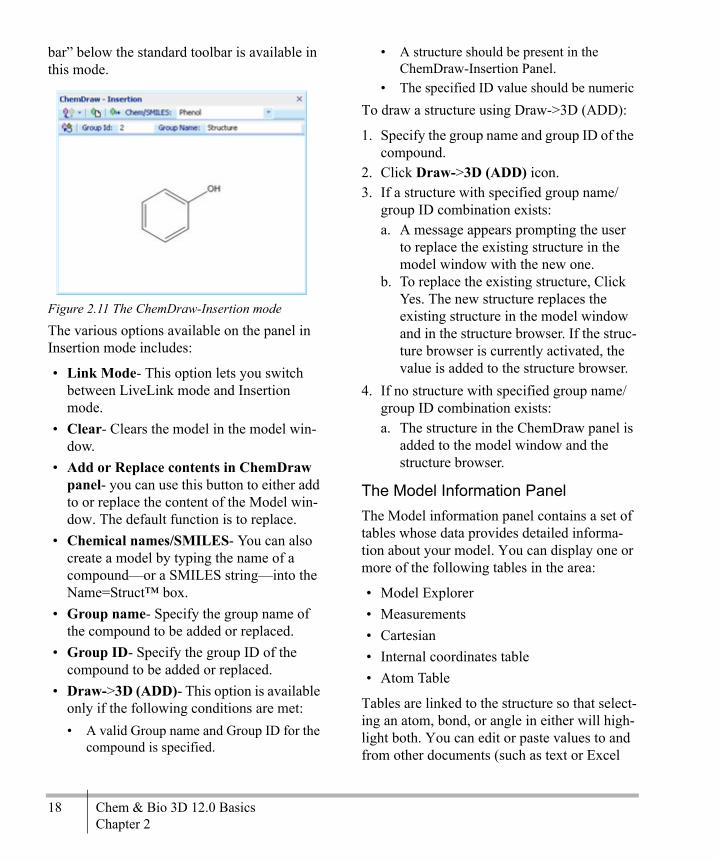
18 Chem & Bio 3D 12.0 BasicsChapter 2
bar” below the standard toolbar is available in this mode.
Figure 2.11 The ChemDraw-Insertion mode
The various options available on the panel in Insertion mode includes:
• Link Mode- This option lets you switch between LiveLink mode and Insertion mode.
• Clear- Clears the model in the model win-dow.
• Add or Replace contents in ChemDraw panel- you can use this button to either add to or replace the content of the Model win-dow. The default function is to replace.
• Chemical names/SMILES- You can also create a model by typing the name of a compound—or a SMILES string—into the Name=Struct™ box.
• Group name- Specify the group name of the compound to be added or replaced.
• Group ID- Specify the group ID of the compound to be added or replaced.
• Draw->3D (ADD)- This option is available only if the following conditions are met:• A valid Group name and Group ID for the
compound is specified.
• A structure should be present in the ChemDraw-Insertion Panel.
• The specified ID value should be numericTo draw a structure using Draw->3D (ADD):
1. Specify the group name and group ID of the compound.
2. Click Draw->3D (ADD) icon.3. If a structure with specified group name/
group ID combination exists:a. A message appears prompting the user
to replace the existing structure in the model window with the new one.
b. To replace the existing structure, Click Yes. The new structure replaces the existing structure in the model window and in the structure browser. If the struc-ture browser is currently activated, the value is added to the structure browser.
4. If no structure with specified group name/ group ID combination exists:a. The structure in the ChemDraw panel is
added to the model window and the structure browser.
The Model Information PanelThe Model information panel contains a set of tables whose data provides detailed informa-tion about your model. You can display one or more of the following tables in the area:
• Model Explorer• Measurements• Cartesian• Internal coordinates table• Atom Table
Tables are linked to the structure so that select-ing an atom, bond, or angle in either will high-light both. You can edit or paste values to and from other documents (such as text or Excel
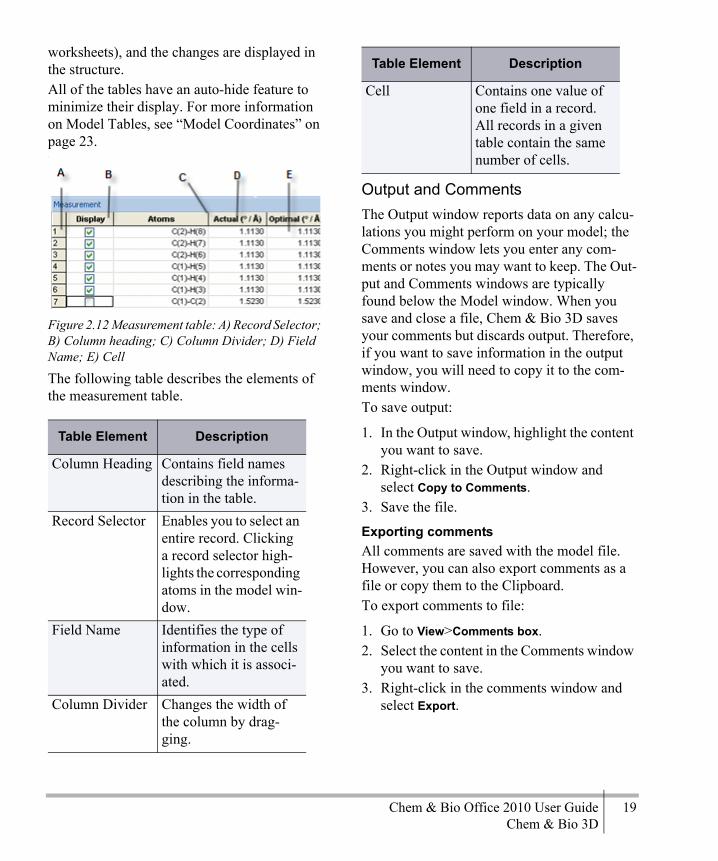
Chem & Bio Office 2010 User Guide 19Chem & Bio 3D
worksheets), and the changes are displayed in the structure.All of the tables have an auto-hide feature to minimize their display. For more information on Model Tables, see “Model Coordinates” on page 23.:
Figure 2.12 Measurement table: A) Record Selector; B) Column heading; C) Column Divider; D) Field Name; E) Cell
The following table describes the elements of the measurement table.
Output and CommentsThe Output window reports data on any calcu-lations you might perform on your model; the Comments window lets you enter any com-ments or notes you may want to keep. The Out-put and Comments windows are typically found below the Model window. When you save and close a file, Chem & Bio 3D saves your comments but discards output. Therefore, if you want to save information in the output window, you will need to copy it to the com-ments window.To save output:
1. In the Output window, highlight the content you want to save.
2. Right-click in the Output window and select Copy to Comments.
3. Save the file.
Exporting commentsAll comments are saved with the model file. However, you can also export comments as a file or copy them to the Clipboard. To export comments to file:
1. Go to View>Comments box.2. Select the content in the Comments window
you want to save.3. Right-click in the comments window and
select Export.
Table Element Description
Column Heading Contains field names describing the informa-tion in the table.
Record Selector Enables you to select an entire record. Clicking a record selector high-lights the corresponding atoms in the model win-dow.
Field Name Identifies the type of information in the cells with which it is associ-ated.
Column Divider Changes the width of the column by drag-ging.
Cell Contains one value of one field in a record. All records in a given table contain the same number of cells.
Table Element Description

20 Chem & Bio 3D 12.0 BasicsChapter 2
4. In the Save As window, enter a name for the file and save it in either text or HTML format.
To copy output to the Clipboard:
1. Select the text you want to save.2. Right-click in the window and choose Copy.
Alternately, you can choose Select All from the context menu.3. Paste into the document of your choice.
You must use Copy – Paste to restore informa-tion from a saved file.You can remove information from the Output window without affecting the model.To remove messages:
1. Select the text you want to delete.2. Do one of the following:
• Right-click and choose Clear.• Press Delete or Backspace.
NOTE: Remember that information in the Out-put window is not saved when you save the Model. However, information in the Comment window is saved.
Model Building BasicsAs you create models, Chem & Bio 3D 12.0 applies standard parameters from external tables along with user-selected settings to pro-duce the model display. There are several options for selecting your desired display set-tings: you can change defaults in the Model Settings dialog box, use menu or toolbar com-mands, or use context-sensitive menus (right-click menus) in the Model Explorer. You can also view and change model coordinates.
Internal and External TablesChem & Bio 3D 12.0 uses two types of param-eter tables:Internal tables. Contain information about a specific model. These include:
• Measurement table• Cartesian Coordinates• Internal coordinates table
To view an internal table, choose the table from the View menu.External tables. Contain information used by all models.Examples of external tables are:
• Elements, Atom Types, and Substructures tables that you use to build models.
• Torsional Parameters tables that are used by Chem & Bio 3D when you perform an MM2 computation.
• Tables that store data gathered during dihe-dral driver conformational searches.
To view an external table, go to View>Parame-ter Tables. Then choose the table to view.For more information on Parameter Tables, See “Parameter Tables” on page 217.
Viewing OptionsYou can superimpose multiple tables if you attach them to an edge of the GUI. One table will be visible and the others will display as selection tabs. Attached tables have the auto-hide feature. To auto-hide a table, push the pin in the upper right corner of the table. The table minimizes to a tab when you are not using it.
Standard MeasurementsStandard measurements are the optimal (or equilibrium) bond lengths and angles between
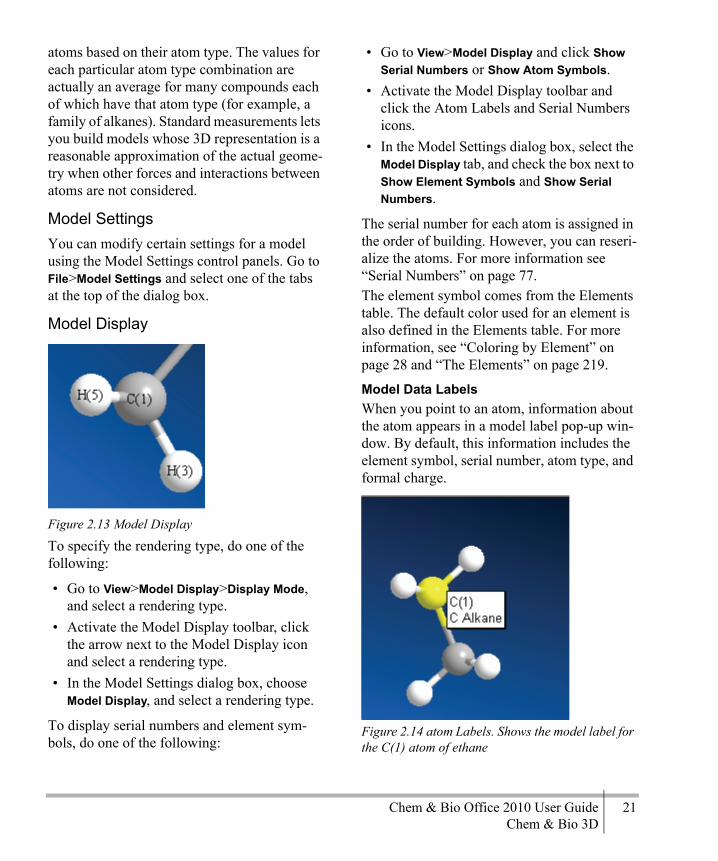
Chem & Bio Office 2010 User Guide 21Chem & Bio 3D
atoms based on their atom type. The values for each particular atom type combination are actually an average for many compounds each of which have that atom type (for example, a family of alkanes). Standard measurements lets you build models whose 3D representation is a reasonable approximation of the actual geome-try when other forces and interactions between atoms are not considered.
Model SettingsYou can modify certain settings for a model using the Model Settings control panels. Go to File>Model Settings and select one of the tabs at the top of the dialog box.
Model Display:
Figure 2.13 Model Display
To specify the rendering type, do one of the following:
• Go to View>Model Display>Display Mode, and select a rendering type.
• Activate the Model Display toolbar, click the arrow next to the Model Display icon and select a rendering type.
• In the Model Settings dialog box, choose Model Display, and select a rendering type.
To display serial numbers and element sym-bols, do one of the following:
• Go to View>Model Display and click Show Serial Numbers or Show Atom Symbols.
• Activate the Model Display toolbar and click the Atom Labels and Serial Numbers icons.
• In the Model Settings dialog box, select the Model Display tab, and check the box next to Show Element Symbols and Show Serial Numbers.
The serial number for each atom is assigned in the order of building. However, you can reseri-alize the atoms. For more information see “Serial Numbers” on page 77.The element symbol comes from the Elements table. The default color used for an element is also defined in the Elements table. For more information, see “Coloring by Element” on page 28 and “The Elements” on page 219.
Model Data LabelsWhen you point to an atom, information about the atom appears in a model label pop-up win-dow. By default, this information includes the element symbol, serial number, atom type, and formal charge.
Figure 2.14 atom Labels. Shows the model label for the C(1) atom of ethane

22 Chem & Bio 3D 12.0 BasicsChapter 2
When you point to a bond, the label displays the bond length and order.The model data changes to reflect the atoms that are selected in the model. For example, when three contiguous atoms H(3)-C(1)-C(2) are selected, the model label includes the atom you point to and its atom type, the other atoms in the selection, and the angle.If you select four adjoining atoms, the dihedral angle appears in the model label. If you select two bonded or non-bonded atoms, the distance between those atoms appears.To specify what information appears in atom, bond, and angle labels:
1. Go to File>Preferences.2. Select the Pop-up Info tab.3. Select the information you want to display.4. Click OK.
Atom Types Building types contain much of the Chem & Bio 3D 12.0 intelligence for building models with 3D geometries. If a building type is assigned to an atom, you can see it in the model data when you point to it. In the previ-ous section, the selected atom has a building type of “C Alkane”.An atom that has a building type assigned has a defined geometry, bond orders, type of atom used to fill open valences (rectification), and standard bond length and bond angle measure-ments (depending on the other atoms making up the bond).The easiest way to build models uses a dynamic assignment of building types that occurs as you build. For example, when you change a single bond in a model of ethane to a double bond, the building type automatically changes from C Alkane to C Alkene. In the process, the geometry of the carbon and the
number of hydrogens filling open valences changes. You can also build models without assigning atom types.To assign building types as you build:
1. In the Model Settings dialog box, select the Model Building tab.
2. Check Correct Building Types.
To assign atom types after you build:
1. Select the atom(s).2. Go to Structure>Rectify.
Building type information is stored in the Building Types table. To view the Building Types table, go to View>Parameter Tables>Chem 3D Building Atom Types.
RectificationRectification is the process of filling open valences of the atoms in your model, typically by adding hydrogen atoms.To rectify automatically as you build, do the following:
1. In the Model Settings dialog box, select the Model Building tab.
2. Select Rectify.
Bond Lengths and Bond AnglesYou can apply standard measurements (bond lengths and bond angles) automatically as you build or apply them later. Standard measure-ments are determined using the atom types for pairs of bonded atoms or sets of three adjacent atoms, and are found in the external tables Bond Stretching Parameters.xml and Angle Bending Parameters.xml.
The Model ExplorerThe Model Explorer lets you explore the struc-tural features of a model, such as chains and functional groups. The Model Explorer is also

Chem & Bio Office 2010 User Guide 23Chem & Bio 3D
useful for when you want to alter a model’s properties. The Model Explorer is designed as a hierarchi-cal tree control that you can expand and col-lapse as necessary and view any part of the model you want. Changes are applied in a bot-tom-up manner, so that changes to atoms and bonds override changes at the chain or frag-ment level. Display modes and color settings are easy to control at a fine-grained level. Properties of atoms and bonds are also easy to access and change. You can show/hide/high-light features at any level. Hidden or changed features are marked in the tree with colored icons, so you can easily keep track of your modifications. See “Model Explorer” on page 105 for more information.
Model CoordinatesEach atom in a model occupies a position in space. Typically, there are two ways to repre-sent the position of an atom: internal coordi-nates and Cartesian coordinates. Chem & Bio 3D establishes the coordinates as you build a model.
Internal coordinates Internal coordinates for a model are often referred to as a Z-matrix and are the most com-monly used coordinates for preparing a model
for further computation. Changing a Z-matrix lets you enter relations between atoms by spec-ifying angles and lengths. To display the Internal Coordinates table, go to View>Internal Coordinates table. You can edit the values within the table, or move atoms within the model and go to Structure>Set Inter-nal Coordinates. You can copy and paste tables to text files or Excel spreadsheets using the commands in the context (right-click) menu. :
Figure 2.15 Internal Coordinates table for ethane
Cartesian CoordinatesCartesian coordinates describe atomic position in terms of X-, Y-, and Z-coordinates relative to an arbitrary origin. Often, the origin corre-sponds to the first atom drawn. However, you can set the origin using commands in the Model Position submenu of the Structure menu.Instead of editing the coordinates directly in this table, you can save the model using the Cartesian coordinates file format (.cc1 or .cc2), then edit that file with a text editor. You can also copy and paste the table into a text file or

24 Chem & Bio 3D 12.0 BasicsChapter 2
Excel worksheet using the commands in the context (right-click) menu.
NOTE: If you edit coordinates in the table, remember to turn off Rectify and Apply Standard Measurements in the Model Building tab of the Model Settings dialog while you edit so that other atoms are not affected.
Figure 2.16 Cartesian table for ethane
The Measurement TableThe Measurement table displays bond lengths, bond angles, dihedral angles, and ring closures. When you first open a Measurement Table, it will be blank.To display data in a Measurement Table:
1. Go to Structure>Measurements.2. Select the information you wish to display.
ACTUAL VS OPTIMAL VALUESOptimal values are the ideal measurements for your model. These values are based on model building parameters that come with Chem & Bio 3D 12.0. The Actual values are the mea-surements from your model. When you per-form a structure clean up, Chem & Bio 3D 12.0 tries to match the Actual values as closely as it can to the Optimal values.If you edit the Actual field, you change the value in the model, and the atoms in the model move to represent the new values. If you edit the Optimal value, you apply a con-straint. These values are used only in Clean Up (on the Structure menu) and MM2 computa-tions. DELETING MEASUREMENT TABLE DATAYou can isolate the information you enter in the Measurement table by deleting the records that you do not want to view. For example, you could display bond lengths, then delete every-thing except the carbon-carbon bonds. This would make them easier to compare.To delete a record, right-click the record and click Delete on the context menu.
NOTE: Deleting records in a Measurement table does not delete the corresponding atoms.
To clear the entire table, go to Structure>Measurement and select Clear.

Chem & Bio Office 2010 User Guide 25Chem & Bio 3D
Displaying ModelsYou can display molecular models in several ways, depending on what information you want to learn from them. The atoms and bonds of a model can take on different appearances. In Chem & Bio 3D 12.0, an appearance is called a model display (also called a rendering type). Depending on the type of molecule, cer-tain model displays may offer advantages by highlighting structural features of interest. For example, the Ribbons model display might be the option of choice to show the conforma-tional folding of a protein without the distract-ing structural detail of individual atoms.Model display options are divided into two general types, structure displays and molecular surface displays.
Structure DisplaysStructures are graphical representations based on the traditional, physical three-dimensional molecular model types. The following struc-ture display types are available from Model Display view of the Chem & Bio 3D 12.0 Set-ting dialog box:
• Wire Frame• Sticks• Ball and Stick• Cylindrical Bonds• Space Filling • Ribbons
• Cartoons
To change the default structural display type of a model:
1. Go to File>Model Settings. The Model Set-tings dialog box appears.
2. Select the Model Display tab.3. Set the new options.
To change the structural display type of a model temporarily, click the arrow on the Model Display tool and select the display type.
Structure Display ModesThe following table describes the Chem & Bio 3D 12.0 modes for structure displays:
3
Display Mode Description
Wire Frame Wire frame models are the most simple dis-play mode. Bonds are displayed as pixel-wide lines. Atoms are not displayed explic-itly, but each half of a bond is colored to rep-resent the element color for the atom. Wire frame models are well suited for extremely large mod-els such as proteins.
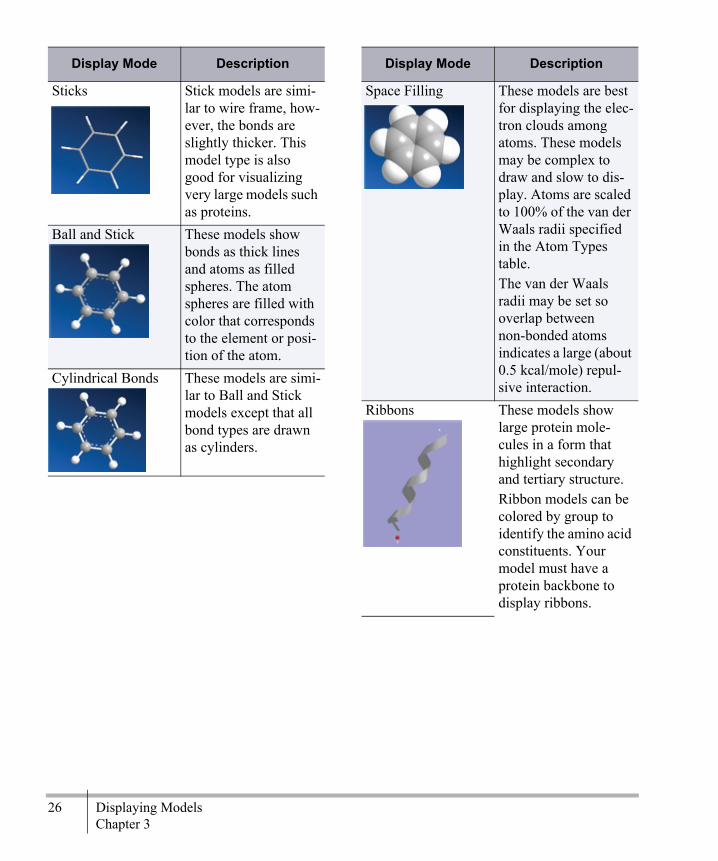
26 Displaying ModelsChapter 3
Sticks Stick models are simi-lar to wire frame, how-ever, the bonds are slightly thicker. This model type is also good for visualizing very large models such as proteins.
Ball and Stick These models show bonds as thick lines and atoms as filled spheres. The atom spheres are filled with color that corresponds to the element or posi-tion of the atom.
Cylindrical Bonds These models are simi-lar to Ball and Stick models except that all bond types are drawn as cylinders.
Display Mode Description
Space Filling These models are best for displaying the elec-tron clouds among atoms. These models may be complex to draw and slow to dis-play. Atoms are scaled to 100% of the van der Waals radii specified in the Atom Types table.The van der Waals radii may be set so overlap between non-bonded atoms indicates a large (about 0.5 kcal/mole) repul-sive interaction.
Ribbons These models show large protein mole-cules in a form that highlight secondary and tertiary structure. Ribbon models can be colored by group to identify the amino acid constituents. Your model must have a protein backbone to display ribbons.
Display Mode Description

Chem & Bio Office 2010 User Guide 27Chem & Bio 3D
Displaying Solid SpheresIn ball and stick, cylindrical bonds, and space filling models, you can display the solid spheres representing atoms and control their size in individual atoms or all atoms. To display solid spheres by default on all atoms:
1. Go to File>Model Settings.2. Select the Atom & Bond tab.3. In the Atom Dot Surfaces section, click the
Show By Default check box.4. Click OK.5. Go to View>Model Display and select or
deselect Show Atom Dots.
Setting Solid Sphere SizeThe maximum radius of the sphere that repre-sents an atom can be based on the van der Waals radius or partial charge. To specify which property to use, select the radio button below the slider.The van der Waals radius is specified using the atom type of the atom.The partial charge is the result of a calculation: Extended Hückel, CS MOPAC, or Gaussian. If
you have not performed a calculation, the par-tial charge for each atom is shown as 0, and the model will display as a stick model. When sizing by partial charge, the absolute value of the charge is used. An atom with a partial charge of 0.500 will have the same radius as an atom with a partial charge of -0.500.ATOM SPHERES SIZE%The value of the Atom Sphere Size% slider on the Atom & Bond tab represents a percentage of the Covalent radius specified for each atom in the Elements Table. This percentage ranges from 0 (small) to 100 (large). Thus, when the Atom Size is 100, the atoms are scaled to their maximum radii. The value of this setting affects Ball and Stick and Cylindrical Bond models.
Displaying Dot SurfacesYou can add dot surfaces to any of the model display types like the stick model shown below.
Figure 3.1 Viewing dot surfaces
The dot surface is based on the van der Waals radius or partial charges as set in the Atom Dis-play table of the Model Settings dialog box.To display dot surfaces by default on all atoms:
Cartoons Cartoon models, like ribbon models, show large protein mole-cules in a form that highlights secondary and tertiary structure.Ribbon and Cartoon model display modes do not provide pop-up information and are not intended for print-ing as bitmaps.
Display Mode Description
28 Displaying ModelsChapter 3
1. Go to File>Model Settings and select the Atom & Bond tab.
2. In the Atom Dot Surfaces section, click the Show By Default check box.
3. Use the Density slider to adjust the density of the dot surface and click apply.
4. Click OK.
All atoms currently in the model window dis-play the selected option.To toggle the display of dot surfaces in a model, go to View>Model Display>Show Atom Dots.
Coloring DisplaysYou can change the default for the way colors are used to display your model in the Model Display tab of the Model Settings control panel. To make a temporary change, Go to View>Model Display>Color By and select a menu option. The options are:
• Monochrome• Partial Charge• Chain• Element• Group• Depth
NOTE: Monochrome and Chain are available only for proteins displayed in the Ribbon or Cartoon display mode.
Coloring by ElementColor by element is the default mode for small molecules. The default colors are stored in the Elements Table.To change the color of elements specified in the Elements table:
1. Go to View>Parameter Tables>Elements. The Elements Table opens.
2. Double-click the Color field for an element. The Color dialog box appears.
3. Select the color to use and click OK.4. Close and save the table.
NOTE: You must save the changes before they take effect.
Coloring by GroupYou can assign different colors to groups (sub-structures) in the model. To change a color associated with a group in the active model:
1. In the Model Explorer, right-click on the group name and choose Select Color. The Color dialog box appears.
2. Select the color to use and click OK.
Coloring by Partial ChargeWhen coloring by partial charge, atoms with a highly negative partial charge are deep blue. Atoms with a highly positive partial charge are deep red. As the partial charge gets closer to 0, the atom is paler. Atoms with a 0 partial charge are white.The partial charge is the result of a calcula-tion—Extended Hückel, CS MOPAC, or
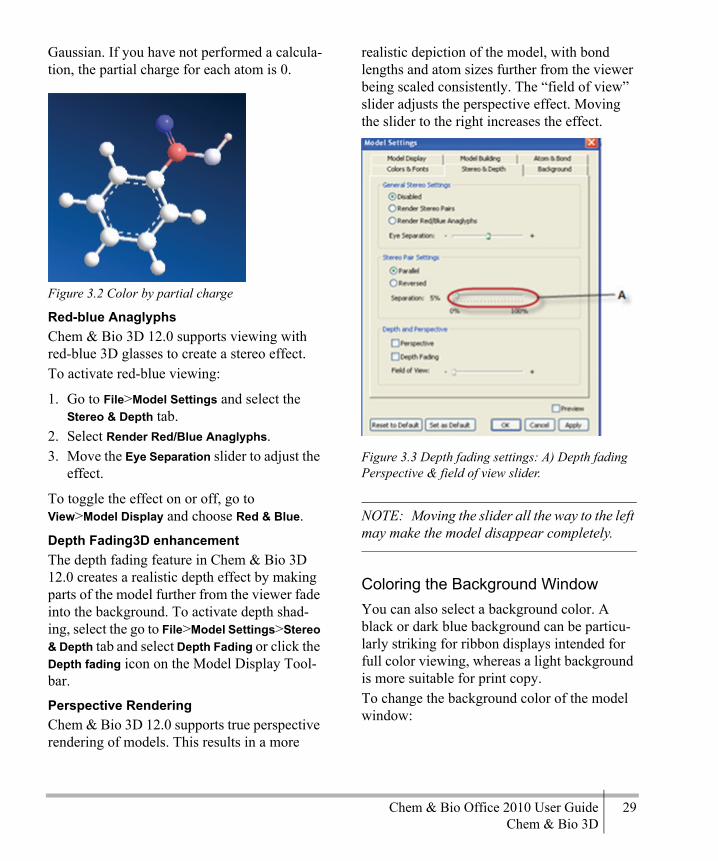
Chem & Bio Office 2010 User Guide 29Chem & Bio 3D
Gaussian. If you have not performed a calcula-tion, the partial charge for each atom is 0.
Figure 3.2 Color by partial charge
Red-blue AnaglyphsChem & Bio 3D 12.0 supports viewing with red-blue 3D glasses to create a stereo effect.To activate red-blue viewing:
1. Go to File>Model Settings and select the Stereo & Depth tab.
2. Select Render Red/Blue Anaglyphs.3. Move the Eye Separation slider to adjust the
effect.
To toggle the effect on or off, go to View>Model Display and choose Red & Blue.
Depth Fading3D enhancementThe depth fading feature in Chem & Bio 3D 12.0 creates a realistic depth effect by making parts of the model further from the viewer fade into the background. To activate depth shad-ing, select the go to File>Model Settings>Stereo & Depth tab and select Depth Fading or click the Depth fading icon on the Model Display Tool-bar.
Perspective RenderingChem & Bio 3D 12.0 supports true perspective rendering of models. This results in a more
realistic depiction of the model, with bond lengths and atom sizes further from the viewer being scaled consistently. The “field of view” slider adjusts the perspective effect. Moving the slider to the right increases the effect.
Figure 3.3 Depth fading settings: A) Depth fading Perspective & field of view slider.
NOTE: Moving the slider all the way to the left may make the model disappear completely.
Coloring the Background WindowYou can also select a background color. A black or dark blue background can be particu-larly striking for ribbon displays intended for full color viewing, whereas a light background is more suitable for print copy.To change the background color of the model window:
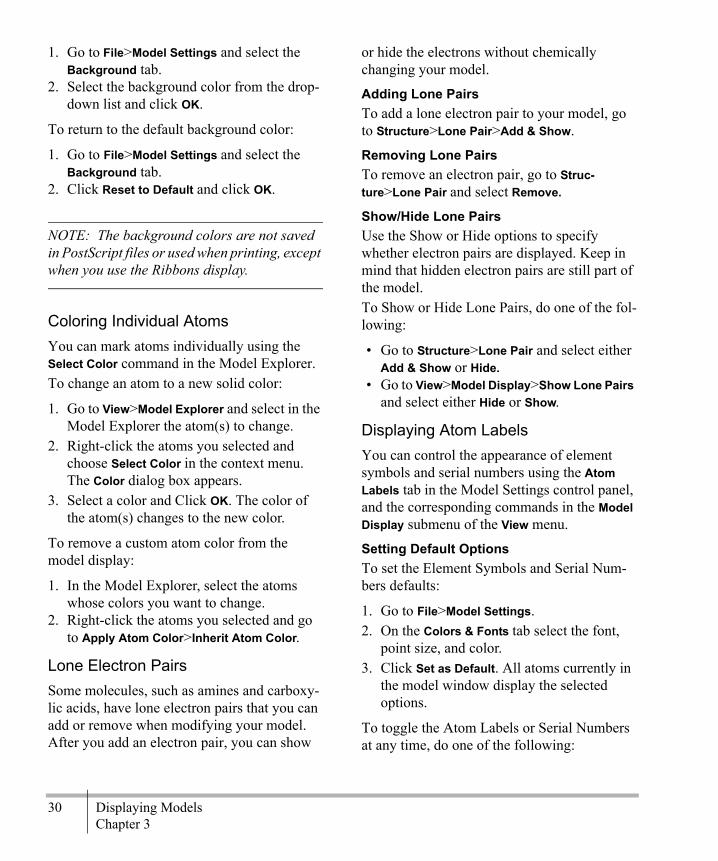
30 Displaying ModelsChapter 3
1. Go to File>Model Settings and select the Background tab.
2. Select the background color from the drop-down list and click OK.
To return to the default background color:
1. Go to File>Model Settings and select the Background tab.
2. Click Reset to Default and click OK.
NOTE: The background colors are not saved in PostScript files or used when printing, except when you use the Ribbons display.
Coloring Individual AtomsYou can mark atoms individually using the Select Color command in the Model Explorer. To change an atom to a new solid color:
1. Go to View>Model Explorer and select in the Model Explorer the atom(s) to change.
2. Right-click the atoms you selected and choose Select Color in the context menu. The Color dialog box appears.
3. Select a color and Click OK. The color of the atom(s) changes to the new color.
To remove a custom atom color from the model display:
1. In the Model Explorer, select the atoms whose colors you want to change.
2. Right-click the atoms you selected and go to Apply Atom Color>Inherit Atom Color.
Lone Electron PairsSome molecules, such as amines and carboxy-lic acids, have lone electron pairs that you can add or remove when modifying your model. After you add an electron pair, you can show
or hide the electrons without chemically changing your model.
Adding Lone PairsTo add a lone electron pair to your model, go to Structure>Lone Pair>Add & Show.
Removing Lone PairsTo remove an electron pair, go to Struc-ture>Lone Pair and select Remove.
Show/Hide Lone PairsUse the Show or Hide options to specify whether electron pairs are displayed. Keep in mind that hidden electron pairs are still part of the model.To Show or Hide Lone Pairs, do one of the fol-lowing:
• Go to Structure>Lone Pair and select either Add & Show or Hide.
• Go to View>Model Display>Show Lone Pairs and select either Hide or Show.
Displaying Atom LabelsYou can control the appearance of element symbols and serial numbers using the Atom Labels tab in the Model Settings control panel, and the corresponding commands in the Model Display submenu of the View menu.
Setting Default OptionsTo set the Element Symbols and Serial Num-bers defaults:
1. Go to File>Model Settings.2. On the Colors & Fonts tab select the font,
point size, and color.3. Click Set as Default. All atoms currently in
the model window display the selected options.
To toggle the Atom Labels or Serial Numbers at any time, do one of the following:
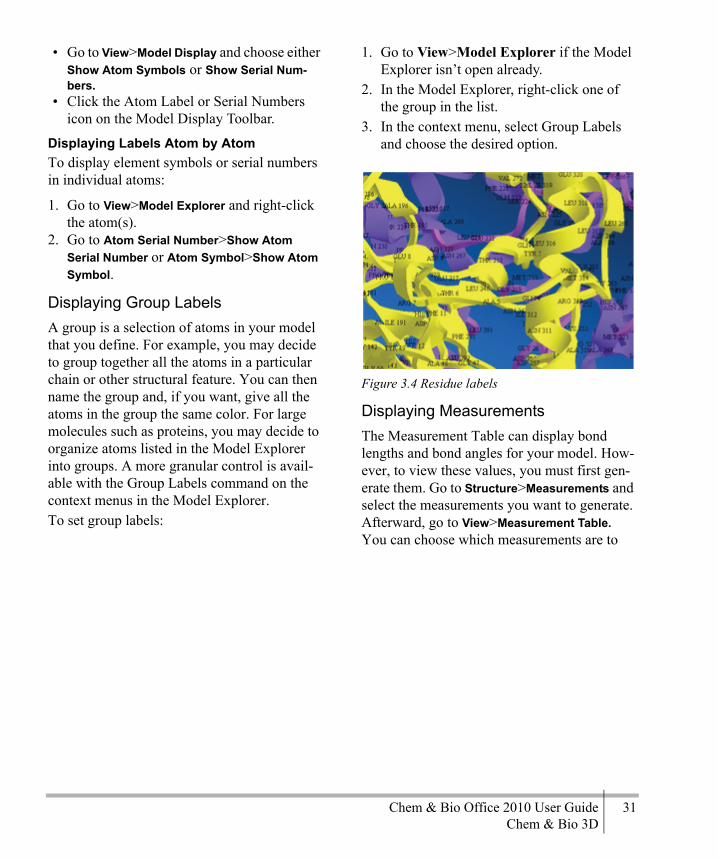
Chem & Bio Office 2010 User Guide 31Chem & Bio 3D
• Go to View>Model Display and choose either Show Atom Symbols or Show Serial Num-bers.
• Click the Atom Label or Serial Numbers icon on the Model Display Toolbar.
Displaying Labels Atom by Atom To display element symbols or serial numbers in individual atoms:
1. Go to View>Model Explorer and right-click the atom(s).
2. Go to Atom Serial Number>Show Atom Serial Number or Atom Symbol>Show Atom Symbol.
Displaying Group LabelsA group is a selection of atoms in your model that you define. For example, you may decide to group together all the atoms in a particular chain or other structural feature. You can then name the group and, if you want, give all the atoms in the group the same color. For large molecules such as proteins, you may decide to organize atoms listed in the Model Explorer into groups. A more granular control is avail-able with the Group Labels command on the context menus in the Model Explorer. To set group labels:
1. Go to View>Model Explorer if the Model Explorer isn’t open already.
2. In the Model Explorer, right-click one of the group in the list.
3. In the context menu, select Group Labels and choose the desired option.
Figure 3.4 Residue labels
Displaying MeasurementsThe Measurement Table can display bond lengths and bond angles for your model. How-ever, to view these values, you must first gen-erate them. Go to Structure>Measurements and select the measurements you want to generate. Afterward, go to View>Measurement Table. You can choose which measurements are to

32 Displaying ModelsChapter 3
displayed by checking the required Display check boxes.
Figure 3.5 Measurement display
Using Stereo PairsStereo Pairs is a display enhancement tech-nique based on the optical principles of the ste-reoscope (a device for viewing photographs in three dimensions). By displaying two images with a slight displacement, a 3D effect is cre-ated.Stereo views can be either parallel or reverse (direct or cross-eyed). Some people find it eas-ier to look directly, others can cross their eyes and focus on two images, creating an enhanced three dimensional effect. In either case, the effect may be easier to achieve on a printed stereo view of your model than on the screen.
Keep the images relatively small, and adjust the distance from your eyes.To set the Stereo Pairs parameters:
1. Go to File>Model Settings and click the Ste-reo & Depth tab. The stereo views control panel appears.
2. Select Render Stereo Pairs to display two views of the model next to each other. The right view is the same as the left view, rotated about the Y-axis.
3. Specify the Eye Separation (Stereo Offset) with the slider. This controls the amount of Y-axis rotation.
4. Specify the degree of separation using the Separation slider. About 5% of the width is a typical separation for stereo viewing.
To select whether the views are cross-eyed or direct, do one of the following:
• Select Reversed to rotate the right frame to the left. If your left eye focuses on the right-hand model and your right eye focuses on the left-hand model, the two ste-reo views can overlap.
• Select Parallel to rotate the right view fur-ther to the right.
Stereo EnhancementChem & Bio 3D 12.0 provides stereo graphics rendering for hardware that has stereo OpenGL capabilities. There are a variety of stereo graphics cards, stereo glasses, and 3D monitors available.
1. Go to File>Preferences and select the OpenGL tab.
2. Select Use Hardware Stereo when Available.3. Click OK.
Chem & Bio Office 2010 User Guide 33Chem & Bio 3D
Once the hardware is enabled, stereo enhance-ment is available in any 3D window.
NOTE: You must enable “stereo in OpenGL” in the display adapter properties control, as well as in Chem3D preferences, and select the correct mode for the glasses/monitor you are using.
You can use depth fading and perspective with hardware enhancement, but should not activate other stereo modes.
Controlling SeparationYou can adjust the stereo effect by adjusting the eye separation.
1. Go to File>Model Explorer and select the Stereo & Depth tab.
2. Under General Stereo Settings, adjust the Eye Separation slider.
3. Click OK.
Molecular SurfacesMolecular surface displays provide informa-tion about entire molecules, as opposed to the atom and bond information provided by struc-ture displays. Surfaces show information about a molecule’s physical and chemical properties. They display aspects of the external surface interface or electron distribution of a molecule.Before any molecular surface can be displayed, the data necessary to describe the surface must be calculated using Extended Hückel or one of the methods available in Gaussian.There is one exception to the requirement that you must perform a calculation before a molecular surface can be displayed. Solvent accessible surfaces are automatically calcu-lated from parameters stored in the parameters
tables. Therefore, no additional calculations are needed, and the Solvent Accessible com-mand on the Choose Surface submenu is always active.
Extended Hückel Extended Hückel is a semi-empirical method you can use to generate molecular surfaces rapidly for most molecular models. For this reason, we provide a brief discussion on how to perform an Extended Hückel calculationTo compute molecular surfaces using the Extended Hückel method, go to Calcula-tions>Extended Hückel>Calculate Surfaces.
NOTE: Before performing an Extended Hückel calculation, Chem & Bio 3D 12.0 deletes all lone pairs and dummy atoms.
At this point, a calculation has been performed and the results of the calculation are stored with the model.To compute partial charges using the Extended Hückel method, go to Calculations>Extended Hückel>Calculate Charges.For each atom in the model, a message is cre-ated listing the atom and its partial charge. If you have selected Partial Charge in the Pop-up Information tab of the Model Settings dialog box, then the partial charges will appear as part of the pop-up information when you point to an atom.
Displaying Molecular SurfacesTo display a surface:
1. Decide what surface type to display.2. Perform a suitable calculation using
Extended Hückel or Gaussian 03. Include
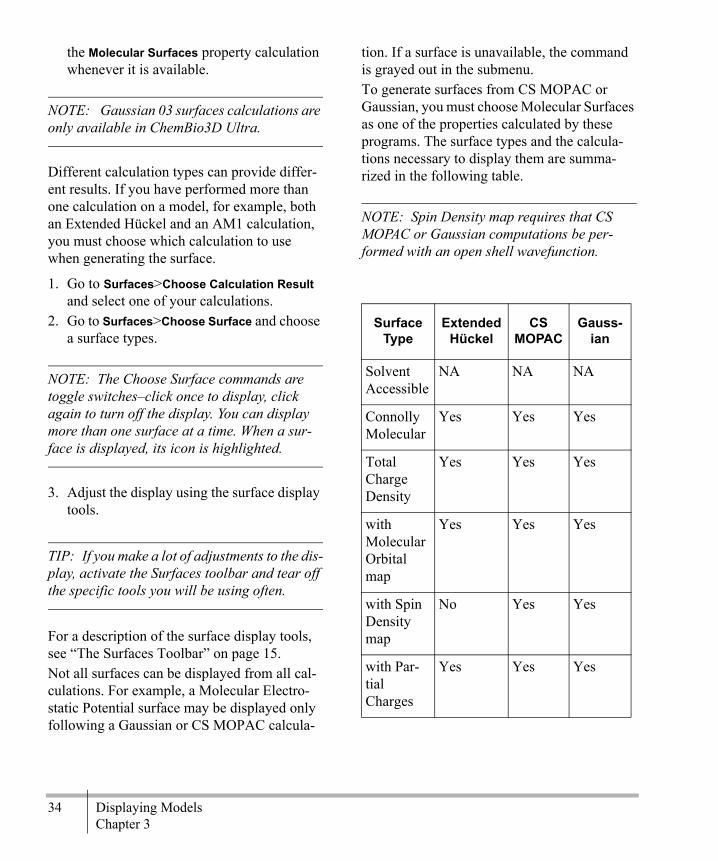
34 Displaying ModelsChapter 3
the Molecular Surfaces property calculation whenever it is available.
NOTE: Gaussian 03 surfaces calculations are only available in ChemBio3D Ultra.
Different calculation types can provide differ-ent results. If you have performed more than one calculation on a model, for example, both an Extended Hückel and an AM1 calculation, you must choose which calculation to use when generating the surface.
1. Go to Surfaces>Choose Calculation Result and select one of your calculations.
2. Go to Surfaces>Choose Surface and choose a surface types.
NOTE: The Choose Surface commands are toggle switches–click once to display, click again to turn off the display. You can display more than one surface at a time. When a sur-face is displayed, its icon is highlighted.
3. Adjust the display using the surface display tools.
TIP: If you make a lot of adjustments to the dis-play, activate the Surfaces toolbar and tear off the specific tools you will be using often.
For a description of the surface display tools, see “The Surfaces Toolbar” on page 15.Not all surfaces can be displayed from all cal-culations. For example, a Molecular Electro-static Potential surface may be displayed only following a Gaussian or CS MOPAC calcula-
tion. If a surface is unavailable, the command is grayed out in the submenu.To generate surfaces from CS MOPAC or Gaussian, you must choose Molecular Surfaces as one of the properties calculated by these programs. The surface types and the calcula-tions necessary to display them are summa-rized in the following table.
NOTE: Spin Density map requires that CS MOPAC or Gaussian computations be per-formed with an open shell wavefunction.
Surface Type
Extended Hückel
CS MOPAC
Gauss-ian
Solvent Accessible
NA NA NA
Connolly Molecular
Yes Yes Yes
Total Charge Density
Yes Yes Yes
with Molecular Orbital map
Yes Yes Yes
with Spin Density map
No Yes Yes
with Par-tial Charges
Yes Yes Yes

Chem & Bio Office 2010 User Guide 35Chem & Bio 3D
Setting Molecular Surface TypesChem & Bio 3D offers four different types of surface displays, each with its own properties. These types are shown in the following table:
Setting Molecular Surface IsovaluesIsovalues are constant values used to generate a surface. For each surface property, values can be calculated throughout space. For exam-ple, the electrostatic potential is very high near each atom of a molecule, and vanishes as you move away from it. Chem & Bio 3D generates a surface by connecting all the points in space
with Molecular Electro-static Potential map
No Yes Yes
Total Spin Density
No Yes Yes
Molecular Electro-static Potential
No Yes Yes
Molecular Orbitals
Yes Yes Yes
Surface Type Description
Solid The surface is dis-played as an opaque form. Solid is a good choice when you are interested in the details of the surface itself, and not partic-ularly interested in the underlying atoms and bonds.
Surface Type
Extended Hückel
CS MOPAC
Gauss-ian Wire Mesh The surface is dis-
played as a con-nected net of lines. Wire Mesh is a good choice when you want to focus on sur-face features, but still want some idea of the atoms and bonds in the structure.
Dots The surface is dis-played as a series of unconnected dots. Dots are a good choice if you are pri-marily interested in the underlying struc-ture and just want to get an idea of the sur-face shape.
Translucent The surface is dis-played in solid form, but is partially trans-parent so you can also see the atoms and bonds within it. Translucent is a good compromise between surface display styles.
Surface Type Description

36 Displaying ModelsChapter 3
that have the same value, the isovalue. Weather maps offer other common examples of isovalues in two dimensions, connecting locations of equal temperature (isotherms) or equal pressure (isobars). There are two isoval-ues to select from, depending on the surface you choose. For the total charge density sur-face, set the isocharge value; for the molecular orbital surface, se the isocontour value.To set an isovalue:
1. Go to Surfaces>Choose Surface and select a surface type.
2. On the Surfaces menu, select either Isocon-tour or Isocharge.
3. Adjust the slider to the new isovalue.
The new isovalue is the middle value listed at the bottom of the Isocontour tool.
Setting the Surface ResolutionThe Surface Resolution is a measure of how smooth the surface appears. The higher the res-olution, the more points are used to calculate the surface, and the smoother the surface appears. However, high resolution values can also take a long time to calculate. The default setting of 30 is a good compromise between speed and smoothness. To set the resolution:
1. Go to Surfaces>Resolution. The Resolution slider appears.
2. Adjust the slider to the desired resolution.The new resolution is the middle value listed at the bottom of the Resolution tool.
Setting Molecular Surface ColorsHow you set the color depends on what type of surface you use. For Solvent Accessible, Connolly Molecular, or Total Charge Density surfaces, do the fol-lowing:
1. Go to Surfaces>Color Mapping>Surface Color. The Surface Color dialog box appears.
2. Select the new color.
For Total Spin Density, Molecular Electro-static Potential, and Molecular Orbital surface types, you must specify two colors. On the Sur-faces menu, choose Color A or Color B.
Setting Solvent RadiusYou can set the solvent radius using the slider. The default solvent radius is 1.4 Å, the value for water. Radii for some common solvents are shown below:
To set the solvent radius:
1. Go to Surfaces>Solvent Radius. The Radius slider appears.
2. Adjust the slider to the desired resolution.
The new radius is the middle value listed at the bottom of the Radius tool.
Setting Surface MappingThe Mapping Property provides color-coded representations of atom colors, groups of atoms, hydrophobicity, partial charges, and
Solvent Radius (Å)
Water 1.4Methanol 1.9Ethanol 2.2Acetonitrile 2.3Acetone 2.4Ether 2.4Pyridine 2.4DMSO 2.5Benzene 2.6Chloroform 2.7
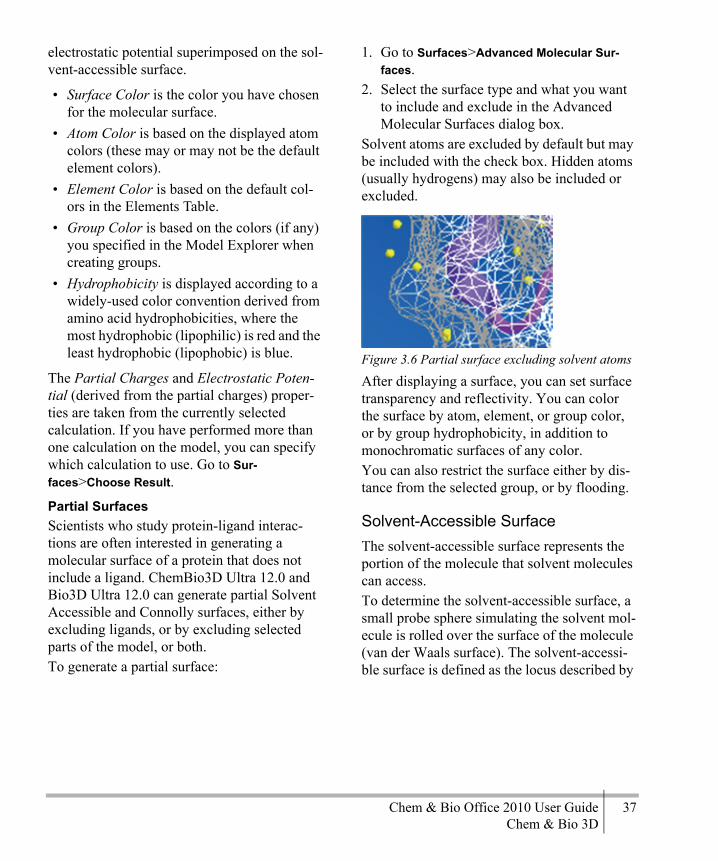
Chem & Bio Office 2010 User Guide 37Chem & Bio 3D
electrostatic potential superimposed on the sol-vent-accessible surface.
• Surface Color is the color you have chosen for the molecular surface.
• Atom Color is based on the displayed atom colors (these may or may not be the default element colors).
• Element Color is based on the default col-ors in the Elements Table.
• Group Color is based on the colors (if any) you specified in the Model Explorer when creating groups.
• Hydrophobicity is displayed according to a widely-used color convention derived from amino acid hydrophobicities, where the most hydrophobic (lipophilic) is red and the least hydrophobic (lipophobic) is blue.
The Partial Charges and Electrostatic Poten-tial (derived from the partial charges) proper-ties are taken from the currently selected calculation. If you have performed more than one calculation on the model, you can specify which calculation to use. Go to Sur-faces>Choose Result.
Partial SurfacesScientists who study protein-ligand interac-tions are often interested in generating a molecular surface of a protein that does not include a ligand. ChemBio3D Ultra 12.0 and Bio3D Ultra 12.0 can generate partial Solvent Accessible and Connolly surfaces, either by excluding ligands, or by excluding selected parts of the model, or both.To generate a partial surface:
1. Go to Surfaces>Advanced Molecular Sur-faces.
2. Select the surface type and what you want to include and exclude in the Advanced Molecular Surfaces dialog box.
Solvent atoms are excluded by default but may be included with the check box. Hidden atoms (usually hydrogens) may also be included or excluded.
Figure 3.6 Partial surface excluding solvent atoms
After displaying a surface, you can set surface transparency and reflectivity. You can color the surface by atom, element, or group color, or by group hydrophobicity, in addition to monochromatic surfaces of any color.You can also restrict the surface either by dis-tance from the selected group, or by flooding.
Solvent-Accessible SurfaceThe solvent-accessible surface represents the portion of the molecule that solvent molecules can access.To determine the solvent-accessible surface, a small probe sphere simulating the solvent mol-ecule is rolled over the surface of the molecule (van der Waals surface). The solvent-accessi-ble surface is defined as the locus described by

38 Displaying ModelsChapter 3
the center of the probe sphere, as shown in the diagram below.
Figure 3.7 van der Waals surfaces: A)van Der Waals surface; B) Solvent Accessible surface; C) Solvent Probe
Connolly Molecular SurfaceThe Connolly surface, also called the molecu-lar surface, is similar to the solvent-accessible surface. Using a small spherical probe to simu-late a solvent, it is defined as the surface made by the center of the solvent sphere as it con-tacts the van der Waals surface. The volume enclosed by the Connolly surface is called the solvent-excluded volume.
These surfaces are shown below.
Figure 3.8 Connolly or solvent-excluded surface: A) van Der Waals; B) Connolly; C) Solvent Accessible
The Connolly Surface of icrn is shown in .
Figure 3.9 Connolly surface of icrn
Total Charge DensityThe total charge density1 is the electron den-sity in the space surrounding the nuclei of a molecule, or the probability function for find-ing electrons in the space around a molecule.
1. The Total charge density surface mapping is available only in ChemBio3D Ultra 12.0.
Chem & Bio Office 2010 User Guide 39Chem & Bio 3D
The default isocharge value of 0.002 atomic units (a.u.). This value approximates the mole-cule’s van der Waals radius and represents about 95% of the entire three-dimensional space occupied by the molecule.The total charge density surface is the best vis-ible representation of a molecule’s shape, as determined by its electronic distribution. The total charge density surface is calculated from scratch for each molecule and is generally more accurate than the space filling display.For total charge density surfaces, the properties available for mapping are molecular orbital, spin density, electrostatic potential, and partial charges. The color scale uses red for the high-est magnitude and blue for the lowest magni-tude of the property. Neutral is white.You can choose the orbital to map onto the sur-face with the Molecular Orbital tool on the Sur-faces menu. The orbital number appears in parentheses in the HOMO/LUMO submenu.
Total Spin DensityThe total spin density surface1 describes the difference in densities between spin-up and spin-down electrons in any given region of a molecule’s space. The larger the difference in a given region, the more that region approxi-mates an unpaired electron. The relative pre-dominance of spin-up or spin-down electrons in regions of the total spin density surface can be visualized by color when total spin density is mapped onto another surface (total charge density). Entirely spin-up (positive value) elec-trons are red, entirely spin-down (negative) blue, and paired electrons (neutral) are white.
You can use the total spin density surface to examine the unpaired electrons of a molecule. The surface exists only where unpaired elec-trons are present. Viewing the total spin den-sity surface requires that both spin density and molecular surfaces are calculated by CS MOPAC or Gaussian using an open shell wavefunction.
MEPThe molecular electrostatic potential (MEP)2 represents the attraction or repulsion between a molecule and a proton. Attraction is repre-sented by negative values and repulsion is indi-cated by positive values. Experimental MEP values can be obtained by X-ray diffraction or electron diffraction techniques, and provide insight into which regions of a molecule are more susceptible to electrophilic or nucleo-philic attack. You can visualize the relative MEP values by color when MEP is mapped onto another surface (total charge density). The most positive MEP value is red, the most nega-tive blue, and neutral is white.
Molecular OrbitalsMolecular orbital (MO) surfaces visually rep-resent the various stable electron distributions of a molecule. According to frontier orbital theory, the shapes and symmetries of the high-est-occupied and lowest-unoccupied molecular orbitals (HOMO and LUMO) are crucial in predicting the reactivity of a species and the stereochemical and regiochemical outcome of a chemical reaction.
1. The Total spin density surface map-ping is available only in ChemBio3D Ultra 12.0
2. The molecular electrostatic poten-tial mapping is available only in ChemBio3D Ultra.
40 Displaying ModelsChapter 3
Go to Surfaces>Select Molecular Orbital to see the list of HOMO/LUMO orbitals in the model. Select the orbital you want to view.You can specify the isocontour value for any computed MO surface using the Isocontour tool on the Surfaces menu. The default isocon-tour value for a newly computed surface is the value you last specified for a previously com-puted surface. If you have not specified an iso-contour value, the default value is 0.01.
Other SourcesYou can use files from sources other than Chem & Bio 3D 12.0 to visualize surfaces. From Windows sources, you can open a Gaus-sian Formatted Checkpoint (.fchk) or Cube (.cub) file.From sources other than Windows, create a Gaussian Cube file and open it in Chem & Bio 3D 12.0.
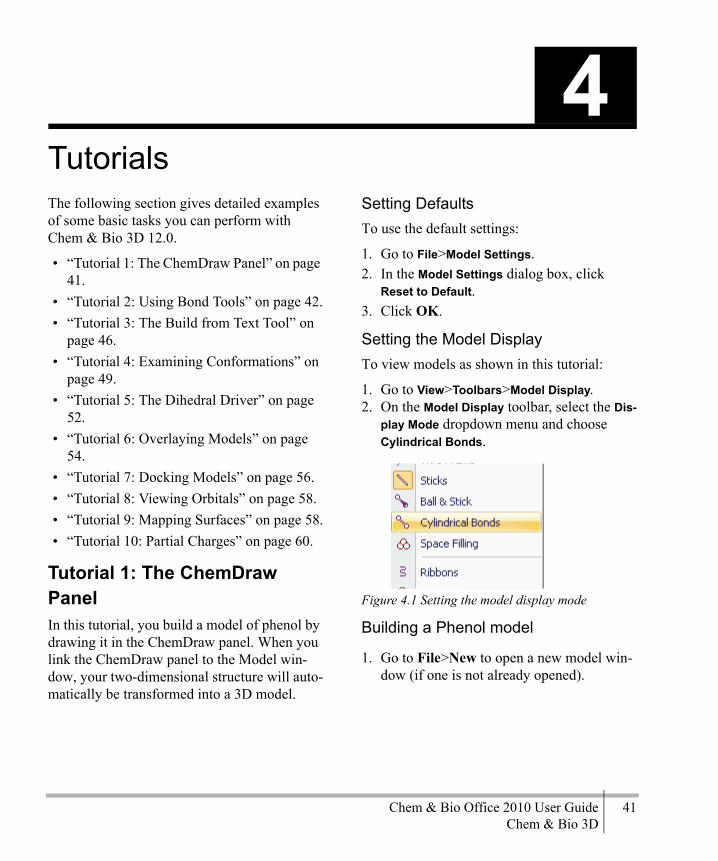
Chem & Bio Office 2010 User Guide 41Chem & Bio 3D
TutorialsThe following section gives detailed examples of some basic tasks you can perform with Chem & Bio 3D 12.0.
• “Tutorial 1: The ChemDraw Panel” on page 41.
• “Tutorial 2: Using Bond Tools” on page 42.• “Tutorial 3: The Build from Text Tool” on
page 46.• “Tutorial 4: Examining Conformations” on
page 49.• “Tutorial 5: The Dihedral Driver” on page
52.• “Tutorial 6: Overlaying Models” on page
54.• “Tutorial 7: Docking Models” on page 56.• “Tutorial 8: Viewing Orbitals” on page 58.• “Tutorial 9: Mapping Surfaces” on page 58.• “Tutorial 10: Partial Charges” on page 60.
Tutorial 1: The ChemDraw PanelIn this tutorial, you build a model of phenol by drawing it in the ChemDraw panel. When you link the ChemDraw panel to the Model win-dow, your two-dimensional structure will auto-matically be transformed into a 3D model.
Setting DefaultsTo use the default settings:
1. Go to File>Model Settings.2. In the Model Settings dialog box, click
Reset to Default.3. Click OK.
Setting the Model DisplayTo view models as shown in this tutorial:
1. Go to View>Toolbars>Model Display.2. On the Model Display toolbar, select the Dis-
play Mode dropdown menu and choose Cylindrical Bonds.
:
Figure 4.1 Setting the model display mode
Building a Phenol model
1. Go to File>New to open a new model win-dow (if one is not already opened).
4

42 TutorialsChapter 4
2. Go to View>ChemDraw Panel to open the ChemDraw panel.
TIP: The ChemDraw panel is automatically hidden by default. If you want the panel to stay open, push the pin on the upper right.
3. Click in the ChemDraw panel. The ChemDraw tools palette appears.
4. On the ChemDraw tools palette, select the Benzene tool.
5. Click in the ChemDraw panel to place a benzene ring. The ChemDraw structure is converted to a 3D representation.
Figure 4.2 A 3D model of benzene
To change the benzene ring to phenol:
1. Double-click any hydrogen in the 3D model. A text box appears.
2. Type OH in the text box, then press Enter.
The phenol molecule is displayed in the Model window and in the ChemDraw panel.
Tutorial 2: Using Bond ToolsIn this tutorial, we use a model of ethane to demonstrate some of the fundamental features of Chem & Bio 3D 12.0. We show how to rotate models, view bond properties, and add atom serial numbers.
1. Click Single Bond tool.2. Click in the Model window, drag to the
right and release the mouse button. A model of ethane appears.
NOTE: If you are using default settings, hydro-gens are displayed automatically.
Rotating modelsTo see the three-dimension features of your model, you can rotate it using the Trackball tool. You have a choice of rotating by free-hand; around the X, Y, or Z axis; or, around a bond that you select.To perform free-hand rotation:
1. Click Trackball tool.2. Point near the center of the model window
and hold down the mouse button.3. Drag the cursor in any direction to rotate
the model.
NOTE: The Trackball tool rotates the view only; it does not change atoms’ Cartesian coor-dinates.
ROTATING AROUND AN AXISTo rotate around an axis:
1. Move the cursor to the edge of the model window. As you mouse over the edge of the window, the rotation bars appears.

Chem & Bio Office 2010 User Guide 43Chem & Bio 3D
2. Drag one of the bars to rotate the model around that axis.
NOTE: Rotation bars are available only when you use the Trackball tool.
ROTATING AROUND A BONDTo rotate around a bond:
1. Click Select tool.2. Select the bond you want to rotate the
model around.3. Select the Trackball tool.4. Click and drag the Rotate About Bond rota-
tion bar on the left side of the Model win-dow.
Examining ModelsHere we view some bond properties of the ethane model:
1. Click Select tool.2. Move the pointer over the left carbon. An
information box appears next to the carbon.The first line contains the atom label, either C(1) or C(2). The second line contains the name of the atom type, C Alkane.:
Figure 4.3 Viewing the atom label
3. Move the pointer over the C-C bond to dis-play its bond length and bond order.
:
Figure 4.4 Viewing bond length
To display information about angles, select several atoms.
1. Click C(1), then Shift+click C(2) and H(7).2. Point to any of the selected atoms or bonds.
The angle for the selection appears.
Figure 4.5 Viewing bond angles
To display information about adjacent atoms:
1. Hold the Shift key and select four adjacent atoms.

44 TutorialsChapter 4
2. Point to any portion of the selection. The dihedral angle formed by the four selected atoms is displayed.
Figure 4.6 Viewing a dihedral angle
If you want, you can also change the bond order. In this case, we can change the ethane model to ethylene:
1. Click Double Bond tool.2. Drag the mouse from C(1) to C(2).3. Point to the C(1)-C(2) bond. The bond
length decreases and the bond order increases.
: .
Figure 4.7 Model of ethylene
Building Cyclic CompoundsYou can continue building on the ethylene model to create cyclohexane.First, change ethylene back to ethane:
1. Click Select tool.2. Right-click the double bond.
3. In the context menu, go to Set Bond Order>Single.
Hiding HydrogensSometimes, you may want to hide the hydro-gen atoms in your model to make building eas-ier. The hydrogens are still there and chemically active, just not in view.To hide the hydrogens, go to View>Model Dis-play>Show Hydrogen atoms>Hide.
Adding atomsHere we add more atoms to the model to create a cyclohexane ring:
1. Click Single Bond tool.2. Drag upward from the left carbon. Another
C-C bond appears.

Chem & Bio Office 2010 User Guide 45Chem & Bio 3D
3. Continue adding bonds until you have six carbons as shown below.
Create a ring
1. Drag from one terminal carbon across to the other.
2. Release the mouse button to close the ring.
Figure 4.8 Building cyclohexane with the bond tool
Serial Numbers and LabelsWhenever you build or examine a model, atoms of the same type all look the same (as they should). However, it is sometimes conve-nient to be able to distinguish one from another as you work. This is where atom serial num-bers and labels become useful.
1. Go to View>Model Display>Show Serial Numbers or click Serial Number icon on the Model Display toolbar.
2. Go to View>Model Display>Show Atom Symbols, or click Atom Symbol icon on the Model Display toolbar.
NOTE: The serial numbers that appear do not reflect a normal ordering because you started with a smaller model and built up from it.
If you want, you can change the numbering order by choosing which atom is numbered first.To renumber the atoms:
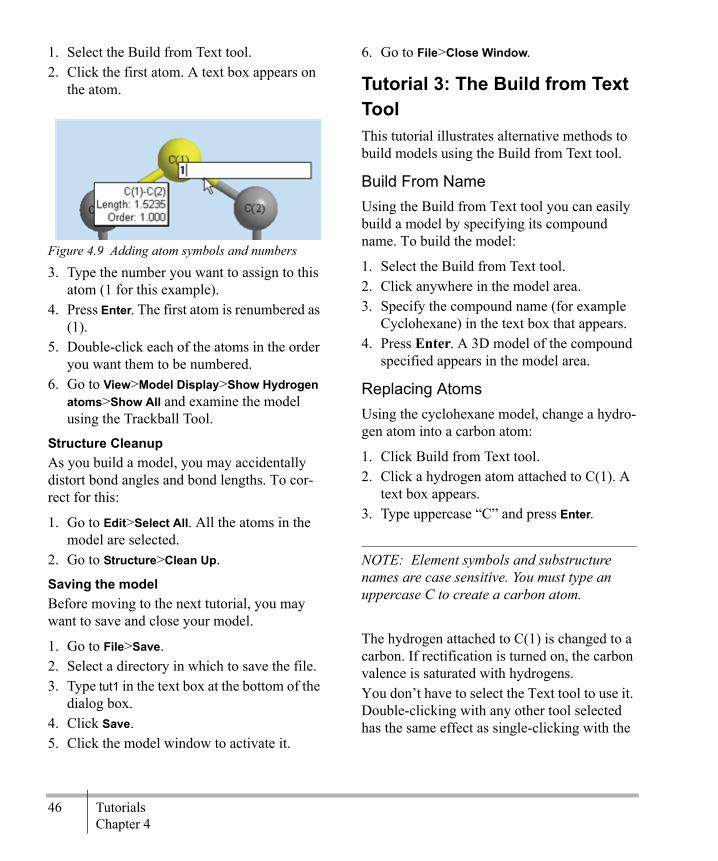
46 TutorialsChapter 4
1. Select the Build from Text tool.2. Click the first atom. A text box appears on
the atom.
Figure 4.9 Adding atom symbols and numbers
3. Type the number you want to assign to this atom (1 for this example).
4. Press Enter. The first atom is renumbered as (1).
5. Double-click each of the atoms in the order you want them to be numbered.
6. Go to View>Model Display>Show Hydrogen atoms>Show All and examine the model using the Trackball Tool.
Structure CleanupAs you build a model, you may accidentally distort bond angles and bond lengths. To cor-rect for this:
1. Go to Edit>Select All. All the atoms in the model are selected.
2. Go to Structure>Clean Up.
Saving the modelBefore moving to the next tutorial, you may want to save and close your model.
1. Go to File>Save.2. Select a directory in which to save the file.3. Type tut1 in the text box at the bottom of the
dialog box.4. Click Save.5. Click the model window to activate it.
6. Go to File>Close Window.
Tutorial 3: The Build from Text ToolThis tutorial illustrates alternative methods to build models using the Build from Text tool.
Build From NameUsing the Build from Text tool you can easily build a model by specifying its compound name. To build the model:
1. Select the Build from Text tool.2. Click anywhere in the model area.3. Specify the compound name (for example
Cyclohexane) in the text box that appears.4. Press Enter. A 3D model of the compound
specified appears in the model area.
Replacing AtomsUsing the cyclohexane model, change a hydro-gen atom into a carbon atom:
1. Click Build from Text tool.2. Click a hydrogen atom attached to C(1). A
text box appears.3. Type uppercase “C” and press Enter.
NOTE: Element symbols and substructure names are case sensitive. You must type an uppercase C to create a carbon atom.
The hydrogen attached to C(1) is changed to a carbon. If rectification is turned on, the carbon valence is saturated with hydrogens. You don’t have to select the Text tool to use it. Double-clicking with any other tool selected has the same effect as single-clicking with the

Chem & Bio Office 2010 User Guide 47Chem & Bio 3D
Text tool. To demonstrate this, replace two more hydrogens using an alternative method:
1. Select Trackball tool so that you can rotate your model to get a better view of what you are building.
2. Double-click two more hydrogens to change them to methyl groups.
TIP: Notice that the “C” you entered previ-ously in the Text tool remains as the default until you change it. You only have to double-click, and press Enter.
Now, refine the structure to an energy mini-mum to take into account the additional inter-actions imposed by the methyl groups. Click the MM2 Minimize tool on the Calculation toolbar.
Saving the FileWhen the minimization is complete:
1. Go to File>Save As.2. Type tut2a.3. Select a directory in which to save the file
and click Save.Save a copy of the model using the name tut2b.These two copies of your model will be used in later tutorials.
Using Labels to Create ModelsYou can also create models by typing atom labels (element symbols and numbers) in a text box.
For example, to build 4-methyl-2-pentanol shown below:
Figure 4.10 Creating a model with the text box
1. Go to File>New or click New tool on the Standard toolbar.
2. Click Build from Text tool.3. Click in the empty space in the model win-
dow. A text box appears.4. In the text box, type:
CH3CH(CH3)CH2CH(OH)CH3.You type labels as if you were naming the structure: pick the longest chain of carbons as the backbone, and specify other groups as sub-stituents. Enclose substituents in parentheses after the atom to which they are attached.5. Press Enter.
TIP: The Text building tool also accepts struc-tures in SMILES notation, either typed in or cut and pasted from other documents.
Name=StructAnother, simpler way of building this model is to type Pentane in the ChemDraw panel Name=Struct text box, then modify the appro-priate hydrogens.To create the model using Name=Struct:
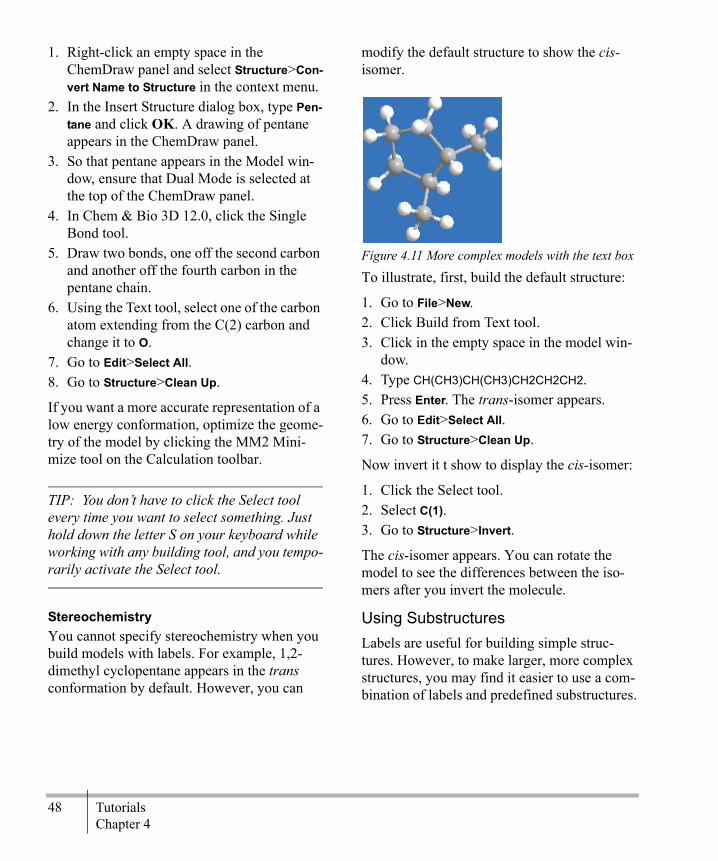
48 TutorialsChapter 4
1. Right-click an empty space in the ChemDraw panel and select Structure>Con-vert Name to Structure in the context menu.
2. In the Insert Structure dialog box, type Pen-tane and click OK. A drawing of pentane appears in the ChemDraw panel.
3. So that pentane appears in the Model win-dow, ensure that Dual Mode is selected at the top of the ChemDraw panel.
4. In Chem & Bio 3D 12.0, click the Single Bond tool.
5. Draw two bonds, one off the second carbon and another off the fourth carbon in the pentane chain.
6. Using the Text tool, select one of the carbon atom extending from the C(2) carbon and change it to O.
7. Go to Edit>Select All.8. Go to Structure>Clean Up.
If you want a more accurate representation of a low energy conformation, optimize the geome-try of the model by clicking the MM2 Mini-mize tool on the Calculation toolbar.
TIP: You don’t have to click the Select tool every time you want to select something. Just hold down the letter S on your keyboard while working with any building tool, and you tempo-rarily activate the Select tool.
StereochemistryYou cannot specify stereochemistry when you build models with labels. For example, 1,2-dimethyl cyclopentane appears in the trans conformation by default. However, you can
modify the default structure to show the cis-isomer.
Figure 4.11 More complex models with the text box
To illustrate, first, build the default structure:
1. Go to File>New.2. Click Build from Text tool.3. Click in the empty space in the model win-
dow.4. Type CH(CH3)CH(CH3)CH2CH2CH2.5. Press Enter. The trans-isomer appears.6. Go to Edit>Select All.7. Go to Structure>Clean Up.
Now invert it t show to display the cis-isomer:
1. Click the Select tool. 2. Select C(1).3. Go to Structure>Invert.
The cis-isomer appears. You can rotate the model to see the differences between the iso-mers after you invert the molecule.
Using SubstructuresLabels are useful for building simple struc-tures. However, to make larger, more complex structures, you may find it easier to use a com-bination of labels and predefined substructures.

Chem & Bio Office 2010 User Guide 49Chem & Bio 3D
Over 200 substructures are predefined in Chem & Bio 3D 12.0. These include the most com-monly used organic structures.
TIP: Predefined substructures are listed in the substructures.xml file. To view the list, go to View>Parameter Tables>Substructures. Text you type in the text box is case sensitive (you must type it exactly as it appears in the Sub-structures table).
To build a model of nitrobenzene using sub-structures:
1. Go to File>New.2. Click Build from Text tool.3. Click the empty space in the Model win-
dow.4. Type Ph(NO2) in the text box.5. Press Enter. A model of nitrobenzene
appears.
The substructure in this example is the phenyl group, as indicated by “Ph”. Substructures are defined with specific attachment points for other substituents. For phenyl, the attachment point is C(1).Build a peptide model:
1. Go to File>New.2. Click Build from Text tool.3. Click an empty space in the Model window.
A text box appears.4. Type H(Ala)12OH and press Enter.5. Rotate this structure to see the alpha helix
that forms.
Viewing the modelChange the model display type:
1. Click the arrow on the right side of the Model Display Mode tool on the Model Display toolbar.
2. Select Wire Frame as the Model Type.
TIP: You can also click the Display Mode icon. Successive clicks cycle through the Display Mode options.
3. Select Trackball tool, and rotate the model so you are viewing it down the center of the helix.
4. Use the Model Display Mode tool to choose Ribbons as the model type to see an alterna-tive display commonly used for proteins.
Tutorial 4: Examining ConformationsThis tutorial uses steric energy values to com-pare the two conformations of ethane—eclipsed and staggered.To draw ethane:
1. Open the ChemDraw panel if it isn’t already open.
2. Draw a line in the ChemDraw panel. A model of ethane appears.
VIEWING BOND PROPERTIESTo view the bond properties:
1. Click in the Model Window2. Go to Structure>Measurements>Generate
All Bond Lengths. The Measurement table appears.
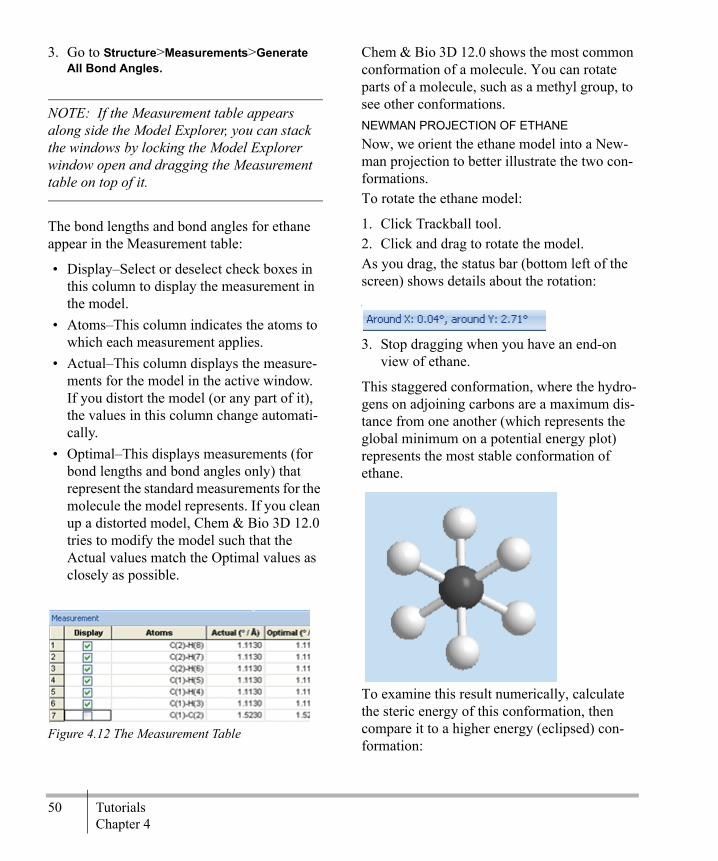
50 TutorialsChapter 4
3. Go to Structure>Measurements>Generate All Bond Angles.
NOTE: If the Measurement table appears along side the Model Explorer, you can stack the windows by locking the Model Explorer window open and dragging the Measurement table on top of it.
The bond lengths and bond angles for ethane appear in the Measurement table:
• Display–Select or deselect check boxes in this column to display the measurement in the model.
• Atoms–This column indicates the atoms to which each measurement applies.
• Actual–This column displays the measure-ments for the model in the active window. If you distort the model (or any part of it), the values in this column change automati-cally.
• Optimal–This displays measurements (for bond lengths and bond angles only) that represent the standard measurements for the molecule the model represents. If you clean up a distorted model, Chem & Bio 3D 12.0 tries to modify the model such that the Actual values match the Optimal values as closely as possible.
.
Figure 4.12 The Measurement Table
Chem & Bio 3D 12.0 shows the most common conformation of a molecule. You can rotate parts of a molecule, such as a methyl group, to see other conformations.NEWMAN PROJECTION OF ETHANENow, we orient the ethane model into a New-man projection to better illustrate the two con-formations. To rotate the ethane model:
1. Click Trackball tool.2. Click and drag to rotate the model.As you drag, the status bar (bottom left of the screen) shows details about the rotation:[
3. Stop dragging when you have an end-on view of ethane.
This staggered conformation, where the hydro-gens on adjoining carbons are a maximum dis-tance from one another (which represents the global minimum on a potential energy plot) represents the most stable conformation of ethane.
To examine this result numerically, calculate the steric energy of this conformation, then compare it to a higher energy (eclipsed) con-formation:
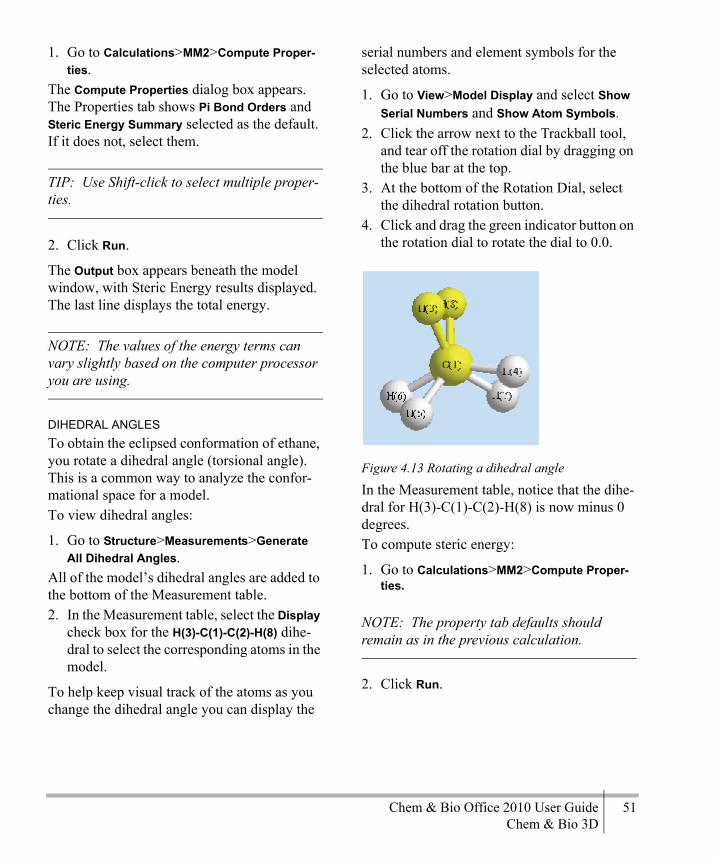
Chem & Bio Office 2010 User Guide 51Chem & Bio 3D
1. Go to Calculations>MM2>Compute Proper-ties.
The Compute Properties dialog box appears. The Properties tab shows Pi Bond Orders and Steric Energy Summary selected as the default. If it does not, select them.
TIP: Use Shift-click to select multiple proper-ties.
2. Click Run.
The Output box appears beneath the model window, with Steric Energy results displayed. The last line displays the total energy.
NOTE: The values of the energy terms can vary slightly based on the computer processor you are using.
DIHEDRAL ANGLESTo obtain the eclipsed conformation of ethane, you rotate a dihedral angle (torsional angle). This is a common way to analyze the confor-mational space for a model.To view dihedral angles:
1. Go to Structure>Measurements>Generate All Dihedral Angles.
All of the model’s dihedral angles are added to the bottom of the Measurement table. 2. In the Measurement table, select the Display
check box for the H(3)-C(1)-C(2)-H(8) dihe-dral to select the corresponding atoms in the model.
To help keep visual track of the atoms as you change the dihedral angle you can display the
serial numbers and element symbols for the selected atoms.
1. Go to View>Model Display and select Show Serial Numbers and Show Atom Symbols.
2. Click the arrow next to the Trackball tool, and tear off the rotation dial by dragging on the blue bar at the top.
3. At the bottom of the Rotation Dial, select the dihedral rotation button.
4. Click and drag the green indicator button on the rotation dial to rotate the dial to 0.0.
Figure 4.13 Rotating a dihedral angle
In the Measurement table, notice that the dihe-dral for H(3)-C(1)-C(2)-H(8) is now minus 0 degrees.To compute steric energy:
1. Go to Calculations>MM2>Compute Proper-ties.
NOTE: The property tab defaults should remain as in the previous calculation.
2. Click Run.
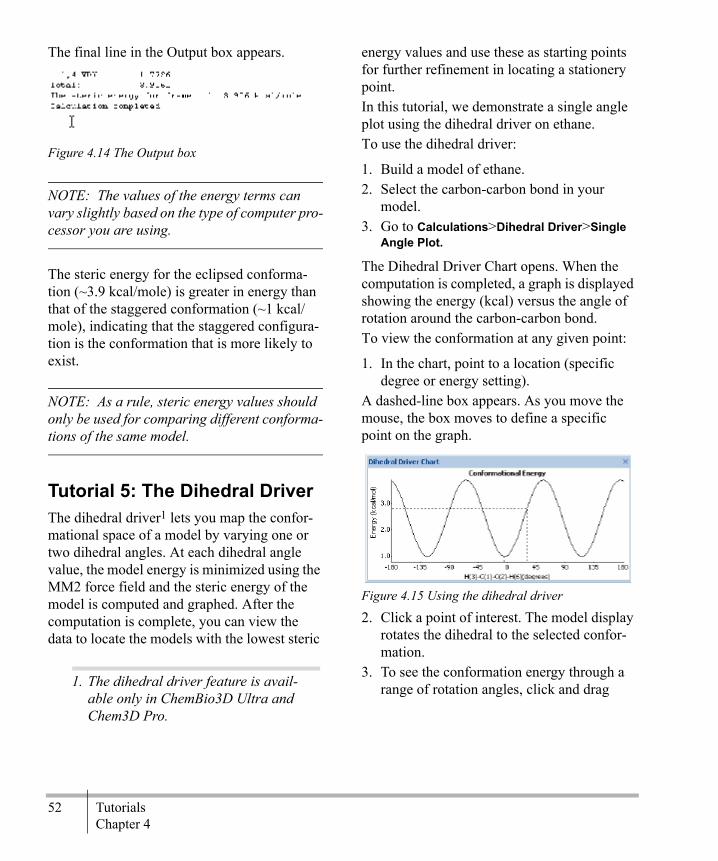
52 TutorialsChapter 4
The final line in the Output box appears.
Figure 4.14 The Output box
NOTE: The values of the energy terms can vary slightly based on the type of computer pro-cessor you are using.
The steric energy for the eclipsed conforma-tion (~3.9 kcal/mole) is greater in energy than that of the staggered conformation (~1 kcal/mole), indicating that the staggered configura-tion is the conformation that is more likely to exist.
NOTE: As a rule, steric energy values should only be used for comparing different conforma-tions of the same model.
Tutorial 5: The Dihedral Driver The dihedral driver1 lets you map the confor-mational space of a model by varying one or two dihedral angles. At each dihedral angle value, the model energy is minimized using the MM2 force field and the steric energy of the model is computed and graphed. After the computation is complete, you can view the data to locate the models with the lowest steric
energy values and use these as starting points for further refinement in locating a stationery point.In this tutorial, we demonstrate a single angle plot using the dihedral driver on ethane.To use the dihedral driver:
1. Build a model of ethane.2. Select the carbon-carbon bond in your
model.3. Go to Calculations>Dihedral Driver>Single
Angle Plot.
The Dihedral Driver Chart opens. When the computation is completed, a graph is displayed showing the energy (kcal) versus the angle of rotation around the carbon-carbon bond. To view the conformation at any given point:
1. In the chart, point to a location (specific degree or energy setting).
A dashed-line box appears. As you move the mouse, the box moves to define a specific point on the graph.
Figure 4.15 Using the dihedral driver
2. Click a point of interest. The model display rotates the dihedral to the selected confor-mation.
3. To see the conformation energy through a range of rotation angles, click and drag 1. The dihedral driver feature is avail-
able only in ChemBio3D Ultra and Chem3D Pro.

Chem & Bio Office 2010 User Guide 53Chem & Bio 3D
across the Chart while viewing the model itself.
NOTE: The dihedral is rotated in 5-degree increments through 360 degrees for a total of 72 conformations to produce the graph. You can view the minimized energy values for each point in the Output window.
To rotate the other dihedral angle (other end of the bond), right-click in the Dihedral Driver window and choose Rotate other End.
Rotating two dihedralsTo rotate two dihedrals:
1. Use Shift+click to select two adjacent bonds.
In this case, the middle atom’s position remains fixed2. Go to Calculations>Dihedral Driver>Double
Angle Plot.
The Output window opens. When the compu-tation is completed, a graph is displayed show-ing theta 1 vs. theta 2.
Figure 4.16 The dihedral driver Chart; A: Legend bar.
NOTE: The chart is the result of rotating one angle through 360° in 10° increments while holding the other constant. The second angle is then advanced 10° and the operation is repeated.
To view the conformation/energy at any given point, click any point in the chart. The model display rotates both dihedrals to the selected conformation/energy.When the atoms are too close to each other, some combination of dihedral angles may result in a bad conformation and the energy values may scale to a very high value. Two ways to deal with the bad conformations include:
1. Set Legend Function- you can apply a leg-end function to the energy values. For example instead of using linear scale you
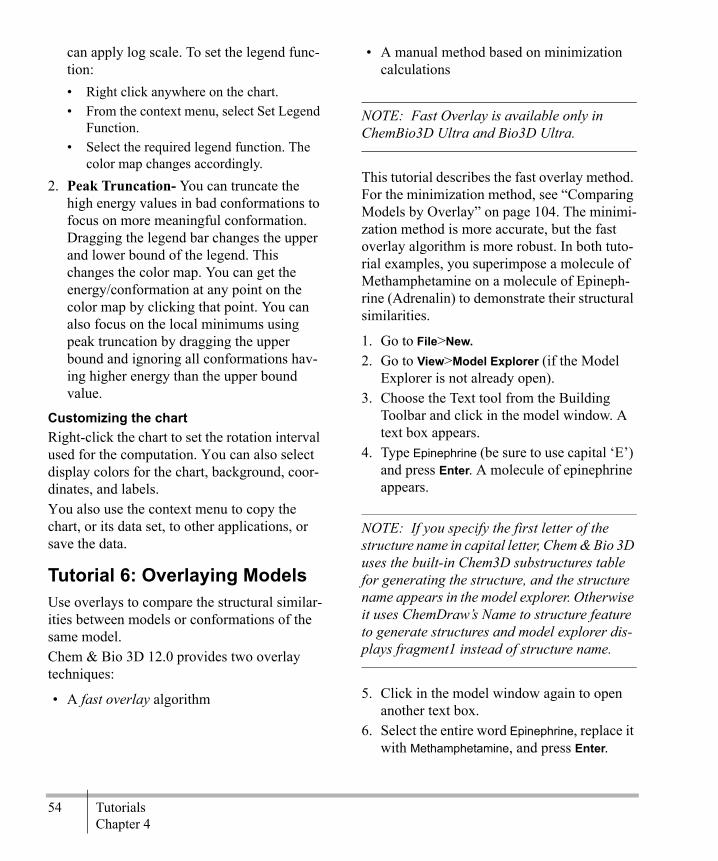
54 TutorialsChapter 4
can apply log scale. To set the legend func-tion:• Right click anywhere on the chart.• From the context menu, select Set Legend
Function.• Select the required legend function. The
color map changes accordingly.2. Peak Truncation- You can truncate the
high energy values in bad conformations to focus on more meaningful conformation. Dragging the legend bar changes the upper and lower bound of the legend. This changes the color map. You can get the energy/conformation at any point on the color map by clicking that point. You can also focus on the local minimums using peak truncation by dragging the upper bound and ignoring all conformations hav-ing higher energy than the upper bound value.
Customizing the chartRight-click the chart to set the rotation interval used for the computation. You can also select display colors for the chart, background, coor-dinates, and labels.You also use the context menu to copy the chart, or its data set, to other applications, or save the data.
Tutorial 6: Overlaying ModelsUse overlays to compare the structural similar-ities between models or conformations of the same model.Chem & Bio 3D 12.0 provides two overlay techniques:
• A fast overlay algorithm
• A manual method based on minimization calculations
NOTE: Fast Overlay is available only in ChemBio3D Ultra and Bio3D Ultra.
This tutorial describes the fast overlay method. For the minimization method, see “Comparing Models by Overlay” on page 104. The minimi-zation method is more accurate, but the fast overlay algorithm is more robust. In both tuto-rial examples, you superimpose a molecule of Methamphetamine on a molecule of Epineph-rine (Adrenalin) to demonstrate their structural similarities.
1. Go to File>New. 2. Go to View>Model Explorer (if the Model
Explorer is not already open).3. Choose the Text tool from the Building
Toolbar and click in the model window. A text box appears.
4. Type Epinephrine (be sure to use capital ‘E’) and press Enter. A molecule of epinephrine appears.
NOTE: If you specify the first letter of the structure name in capital letter, Chem & Bio 3D uses the built-in Chem3D substructures table for generating the structure, and the structure name appears in the model explorer. Otherwise it uses ChemDraw’s Name to structure feature to generate structures and model explorer dis-plays fragment1 instead of structure name.
5. Click in the model window again to open another text box.
6. Select the entire word Epinephrine, replace it with Methamphetamine, and press Enter.

Chem & Bio Office 2010 User Guide 55Chem & Bio 3D
Methamphetamine appears in the Model Explorer.
Figure 4.17 Two fragments
The two fragments may be jumbled together. You might want to separate them before you proceed. To move a fragment:
1. To select a fragment, click the name of the fragment in the Model Explorer.
2. Using the Move Objects tool, Shift-click-drag the model in the model window to move it. A box or oval indicates the posi-tion of the fragment while you are moving it.
TIP: You can rotate a fragment separately from the whole model by selecting at least one atom in it and using the Shift key with the track-ball tool.
At this point, you have to decide which of the fragments you want to move and which will be the target. In this simple example, with only two compounds, it doesn’t really matter. You might, however, have cases where you want to overlay a number of compounds on a specific target.
1. Using the Move Objects tool, click any empty region of the model window to ensure all fragments are deselected.
2. In the Model Explorer window, click the Epinephrine fragment to select it.
3. Right-click the fragment and go to Over-lay>Set Target Fragment.
The icon on the fragment changes to a target.
Figure 4.18 Model Explorer with target selected
4. In the Model Explorer window, right-click the Methamphetamine fragment.
5. Go to Overlay>fast overlay on the context menu.
The fragments are overlaid. The numbers show the serial numbers of the target atoms to which the matching overlay atoms correspond.
TIP: You can also designate a fragment as a target rather than a group. However, either a fragment or group may be overlayed.
Figure 4.19 Overlaid fragments
To turn off the fast overlay mode, go to Over-lay>Clear Target Fragment.

56 TutorialsChapter 4
Tutorial 7: Docking ModelsThe Dock command lets you position a frag-ment in a desired orientation and proximity rel-ative to a second fragment. Each fragment remains rigid during the docking computation. The Dock command is available when two or more distances between atoms in one fragment and atoms in a second fragment are specified. These distances are entered into the Optimal field in the Measurement table. You can use docking to simulate the associa-tion of regions of similar lipophilicity and hydrophilicity on two proximate polymer chains.In this tutorial, we demonstrate the Dock com-mand using two polymer chains.
Build the first polymer chain
1. Open a new Model window and select the Text Building tool.
2. Click in the model window. A text box appears.
3. Type (AA-mon)3(C2F4)4(AA-mon)3H in the text box.
4. Press Enter.
A polyacrylic acid/polytetrafluoroethylene block copolymer appears in the model win-dow. The text, (AA-mon)3, is converted to a polymer segment with three repeat units of acrylic acid. The text, (C2F4)4, is converted to a polymer segment with four repeat units of tet-rafluoroethylene.
Build a copy of the chainClick in the model window well above and to the right of the first model. When the filled text box appears, press Enter. A second polymer molecule appears.
Orient the chains
1. Click in the empty space in the model win-dow to deselect any atoms in the model window.
2. Click the down arrow on the Trackball tool to open the rotation dial tool.
3. Select the Y axis, and drag the dial to show 55°.
TIP: To get exactly 55° you may need to edit the value in the number box. After editing, press Enter. The value displayed in the right corner of the dial should be the same as in the number box.
The resulting model appears as shown below (the second model may appear in a different position on your computer):
Figure 4.20 Docking models
Set optimal distancesThe Optimal distance determines how closely the molecules dock. In this tutorial, you will set the distance to 5Å.
1. In the Model Explorer, select C(6) in Fragment1 in the AA-mon 2 group.
2. Locate the C(98) atom in Fragment 2 (AA-mon 12 group) and CTRL-click to select it.

Chem & Bio Office 2010 User Guide 57Chem & Bio 3D
3. Go to Structure>Measurements>Display Distance Measurement.
The Measurement table opens (or becomes active), displaying the C(98)-C(6) pair.4. Click the Optimal cell.5. Type 5 and press Enter.
The optimal distance between C(6) and C(98) is specified as 5.000Å. To have a reasonable dock, you must specify at least four atom pairs. Repeat steps 1 through 6 for matching atom pairs throughout the frag-ments. For example, if you choose one pair from each group your list might look like the following:
Ignore the distances in the Actual cell because they depend on how the second polymer was positioned relative to the first polymer when the second polymer was created.To begin the docking computation:
1. Go to Structure>Dock. The Dock dialog box appears.
2. Type 0.100 for the Minimum RMS Error value and 0.010 for the Minimum RMS Gradi-ent.
The docking computation stops when the RMS Error or the RMS Gradient becomes less than the Minimum RMS Error and Minimum RMS Gradient value. 3. Click Display Each Iteration. This lets you see how much the fragments have moved after each iteration of the docking com-putation. 4. Click Start.
Note that while the docking computation pro-ceeds, one molecule remains stationary and the second molecule moves. To stop the docking computation before it reaches its preset RMS values, click Stop Cal-culation on the Calculation toolbar. Both dock-ing and recording are stopped. The Status bar displays the values describing each iteration.
Figure 4.21 Docked polymers
The following illustration shows the distances between atom pairs at the completion of the docking computation. The distances in the
Atoms Actual Optimal
C(1)-C(93) 21.2034 5.0000
C(98)-C(6) 21.1840 5.0000
C(104)-C(12) 21.2863 5.0000
C(108)-C(16) 21.1957 5.0000
C(22)-C(114) 20.6472 5.0000
C(28)-C(120) 20.7001 5.0000
C(34)-C(126) 20.1410 5.0000
C(133)-C(41) 20.3559 5.0000
C(45)-C(137) 20.3218 5.0000
C(50)-C(142) 20.4350 5.0000

58 TutorialsChapter 4
Actual cell are close to the distances in the Optimal cell.
Figure 4.22 Measurements for docked polymers
Your results may not exactly match those described here. The relative position of the two fragments or molecules at the start of the dock-ing computation can affect your results. For more accurate results, lower the minimum RMS gradient.
Tutorial 8: Viewing OrbitalsThe highest occupied molecular orbitals (HOMO) and lowest unoccupied molecular orbitals (LUMO) are commonly the most important orbitals affecting a molecular reac-tivity. This tutorial examines the orbitals of double bonds by looking at ethene, the sim-plest molecule containing a double bond.Create an ethene model:
1. Go to File>New.2. Draw a double bond in the ChemDraw
panel. A molecule of ethene appears. Before you can view the molecular orbital sur-face, you must first calculate it.3. Go to Calculations>Extended Hückel>Calcu-
late Surfaces.
To view the Highest Occupied Molecular Orbital (HOMO):
1. Go to Surfaces>Choose Surface>Molecular Orbital.
2. Go to Surfaces>Select Molecular Orbital to see the HOMO/LUMO options. Select
HOMO (N=6). The pi bonding orbital surface appears.
Figure 4.23 Pi bonding orbital surface
NOTE: You may need to rotate the molecule to view the orbitals.
3. To view the LUMO, go to Surfaces>Select Molecular Orbital and Select LUMO (N=7). The pi antibonding orbital surface appears.
Figure 4.24 Pi antibonding orbital surface
These are only two of many different orbitals available. The others represent various interac-tions of sigma orbitals.
Tutorial 9: Mapping Surfaces This tutorial demonstrates Gaussian minimiza-tion1 and how to map calculated values to molecular surfaces for viewing. You can per-
1. Gaussian is compatible only with ChemBio3D Ultra.

Chem & Bio Office 2010 User Guide 59Chem & Bio 3D
form the same minimization using extended Hückel calculations.The allyl radical is a textbook example of reso-nance-enhanced stabilization.
Figure 4.25 The allyl radical
To examine radicals with spin density surfaces, first create the allyl radical:
1. Go to File>New.2. Right-click in an empty area of the
ChemDraw panel and go to Structure>Con-vert Name to Structure.
3. In the Insert Structure text box, type 1-pro-pene and click OK. A molecule of 1-pro-pene appears.
4. In the Model window, select the H9 hydro-gen using the Select tool.
5. Press Delete.A dialog box appears asking if you want to turn off rectification. Chem & Bio 3D 12.0 knows that, in most cases, carbon atoms have four substituents.6. Click Turn Off Automatic Rectification. The
propene radical appears.
Figure 4.26 Propene radical model
Next, calculate the minimization:
1. Go to Calculations>Gaussian Interface>Min-imize (Energy/Geometry).
2. In the Routine tab, set the method to PM3, and the wave function to U-Unrestricted Open-Shell.
3. Also in the Routine tab, set the Spin Multi-plicity to 2.
Setting the Spin Multiplicity ensures that the molecule is a radical.One of the best ways to view spin density is by mapping it onto the Total Charge Density sur-face. This lets you see what portions of the total charge are contributed by unpaired elec-trons, or radicals. To view spin density mapped onto the total charge density surface:
1. In the Properties tab, select Molecular Sur-faces and Spin Density.
2. Click Run.
When the calculation is finished, select the Trackball tool and rotate the model back and forth. It should be completely planar.
Figure 4.27 Viewing the minimized model
To complete this tutorial, you will need to adjust a number of surface settings. For conve-nience, activate the Surfaces toolbar. Go to View>Toolbars>Surfaces.
1. On the Surfaces toolbar, point to Surface and select Total Charge Density. The icon changes to denote the surface selected.
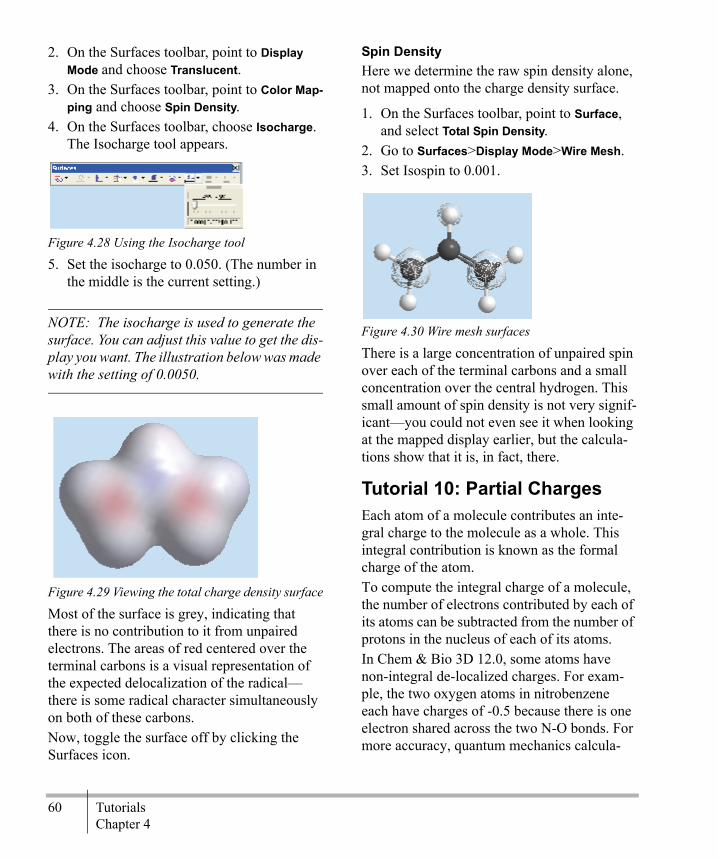
60 TutorialsChapter 4
2. On the Surfaces toolbar, point to Display Mode and choose Translucent.
3. On the Surfaces toolbar, point to Color Map-ping and choose Spin Density.
4. On the Surfaces toolbar, choose Isocharge. The Isocharge tool appears.
Figure 4.28 Using the Isocharge tool
5. Set the isocharge to 0.050. (The number in the middle is the current setting.)
NOTE: The isocharge is used to generate the surface. You can adjust this value to get the dis-play you want. The illustration below was made with the setting of 0.0050.
Figure 4.29 Viewing the total charge density surface
Most of the surface is grey, indicating that there is no contribution to it from unpaired electrons. The areas of red centered over the terminal carbons is a visual representation of the expected delocalization of the radical—there is some radical character simultaneously on both of these carbons.Now, toggle the surface off by clicking the Surfaces icon.
Spin DensityHere we determine the raw spin density alone, not mapped onto the charge density surface.
1. On the Surfaces toolbar, point to Surface, and select Total Spin Density.
2. Go to Surfaces>Display Mode>Wire Mesh. 3. Set Isospin to 0.001.
Figure 4.30 Wire mesh surfaces
There is a large concentration of unpaired spin over each of the terminal carbons and a small concentration over the central hydrogen. This small amount of spin density is not very signif-icant—you could not even see it when looking at the mapped display earlier, but the calcula-tions show that it is, in fact, there.
Tutorial 10: Partial ChargesEach atom of a molecule contributes an inte-gral charge to the molecule as a whole. This integral contribution is known as the formal charge of the atom.To compute the integral charge of a molecule, the number of electrons contributed by each of its atoms can be subtracted from the number of protons in the nucleus of each of its atoms. In Chem & Bio 3D 12.0, some atoms have non-integral de-localized charges. For exam-ple, the two oxygen atoms in nitrobenzene each have charges of -0.5 because there is one electron shared across the two N-O bonds. For more accuracy, quantum mechanics calcula-

Chem & Bio Office 2010 User Guide 61Chem & Bio 3D
tions can produce partial charges (which are also non-integral).However, as shown in Tutorial 9, electrons in molecules actually occupy areas of the mole-cule that are not associated with individual atoms and can also be attracted to different atomic nucleii as they move across different atomic orbitals. In fact, bonds are a representa-tion of the movement of these electrons between different atomic nucleii.Because electrons do not occupy the orbitals of a single atom in a molecule, the actual charge of each atom is not integral, but is based on the average number of electrons in the model that are occupying the valence shells of that atom at any given instant. By subtracting this average from the number of protons in the molecule, the partial charge of each atom is determined. Visualizing the partial charge of the atoms in a molecule is another way to understand the model's reactivity. Typically the greater the partial charge on an atom, the more likely it is to form bonds with other atoms whose partial charge is the opposite sign.
NOTE: Chem & Bio 3D 12.0 recognizes for-mal charges you assign to atoms in the model window and ChemDraw panel. It then calcu-lates de-localized charges for all atoms in the model where delocalization occurs. To display formal and de-localized charges, hover the mouse over a charged atom.
Using the theories in Extended Hückel, CS MOPAC, or Gaussian, you can compute the partial charges for each atom. In the following example, the partial charges for phenol are computed by Extended Hückel.
1. Go to the File>New.
2. Using the Text Building tool, click in the model window.
3. Type PhOH in the text box, and press Enter. A molecule of phenol is created.
4. To compute Extended Hückel charges, go to Calculations>Extended Hückel>Calculate Charges.
The Atom Property table opens, displaying the results. To view the table at any time, go to View>Atom Property Table.
Displaying Partial ChargesYou can use varying gradients of color to illus-trate partial charges for atoms in your model. For example, strongly positive charged atoms may appear bright red while strongly negative atoms appear blue. Lesser positively and nega-tively charged atoms also appear somewhere within the color range, depending on the value. To display partial charges, you first need to run the charge calculation.To display partial charges:
1. Go to File>Model Settings and select the Colors & Fonts tab.
2. Under Color by, select Atom Properties.3. In the Atom Properties drop-down list,
select Charge(Hückel).4. Select one of the two color bands. The first
band ranges from blue to red. The second band has a more refined range of color.
5. In the min/max text boxes, select the range of calculations you want to colorize. To select the entire range of values calculated for the model, click Scan Value Range.
6. To view the model with your options, select the Preview check box at the bottom of the dialog box and click Apply.
7. Click OK.

62 TutorialsChapter 4
All the atoms are colored according to the color scale you chose. Atoms with a large neg-ative partial charge are deep blue. Atoms with a large positive partial charge are deep red. As the magnitude of the charges approaches 0, the color of the atom becomes paler.
Figure 4.31 Partial charges for phenol
For phenol, the greatest negative charge is on the oxygen atom. The greatest positive charge is on the adjacent carbon atom (with the adja-cent hydrogen atom a close second). The rest of the molecule has relatively pale atoms; their partial charges are much closer to zero.

Chem & Bio Office 2010 User Guide 63Chem & Bio 3D
Building ModelsChem & Bio 3D 12.0 enables you to build or change a model by three principal methods:
• Using the ChemDraw panel, which uses ChemDraw to build and insert or copy and modify models.
• Using Bond tools, in which build a hydro-carbon structure and modify bonds and atoms as needed.
• Using the Build from Text tool, which lets you build or modify models using atom labels and substructures.
Usually, a combination of these methods yields the best results. For example, you might build a carbon skeleton of a model with ChemDraw or the bond tools, then change some of the car-bons into other elements with the Build from Text tool. Or you can build a model exclu-sively using the Build from Text tool.In addition, you can use Structure tools to change bond lengths and angles, or change ste-reochemistry.
Setting the Model Building ControlsYou control how you build by changing options in the Model Building tab in the Model Settings dialog box. The default mode is all options selected. You can choose to build in a faster mode, with less built-in “chemical intel-
ligence”, by turning off one or more of the options. Intelligent mode yields a reasonable 3D model as you build. Alternatively, fast mode provides a quick way to generate a backbone structure. You can then turn it into a chemically reason-able 3D model using the Structure menu Rec-tify and Clean Up tools.To change the building mode:
1. Go to File>Model Settings. The Model Set-tings dialog box appears.
2. Select the Model Building tab.3. Select or deselect the appropriate radio but-
tons, described below.
Correct Atom Types. Determines whether atom types are assigned to each atom as you build. Atom types, such as “C Alkane” specify the valence, bond lengths, bond angles, and geometry for the atom. Rectify. Determines whether the open valences for an atom are filled, usually with hydrogen atoms.Apply Standard Measurements. Determines whether the standard measurements associated with an atom type are applied as you build.Fit Model to Window. Determines whether the entire model is resized and centered in the model window after a change to the model is made.
5

64 Building ModelsChapter 5
Detect Conjugated System. When selected, all bonds in a conjugated system are set at a bond order of 1.5. When unselected, bonds are dis-played as drawn. Does not affect previously drawn structures.Bond Proximate Addition (%). Determines whether a bond is created between a selection of atoms. For more information see “Bonding by Proximity” on page 74.
NOTE: For more information about atom types, standard measurements, and rectifica-tion, see “Model Building Basics” on page 20.
Building with the ChemDraw PanelChem & Bio 3D 12.0 makes it easy to create or modify models in ChemDraw. To open the ChemDraw panel:
1. Go to View>ChemDraw Panel. By default, the ChemDraw panel appears to the right of the model window.
2. Click in the panel to activate it. The Tools palette appears.
TIP: If you don’t see the Tools palette, right-click in the ChemDraw panel, and select View>Show Main Toolbar.
Drawing small moleculesOnce the ChemDraw panel is active, you can begin drawing structures. Once you have a structure, you can display it to the Model win-dow.
• To replace the model with the ChemDraw structure or add the structure, click the icon.
Name=StructThe ChemDraw Name=Struct window lets you build models by entering a chemical name or a SMILES string. You can also copy names or SMILES strings from other documents and paste them, either into the Name=Struct win-dow, or directly into the Model window.
TIP: You can also paste chemical formulas into the Chem & Bio 3D Model window. Be aware, however, that a formula may represent an isomer.
Building with Other 2D ProgramsYou can use other 2D drawing packages such as ISIS/Draw to create chemical structures, then copy them into Chem & Bio 3D for auto-matic conversion to a 3D model. To build a model with 2D drawings:
1. In the source program, copy the structure to the clipboard.
2. In Chem & Bio 3D, go to Edit>Paste.
The 2D structure is converted to a 3D model in Chem & Bio 3D 12.0. The standard measurements are applied to the structure. For more information See “2D to 3D Conversion” on page 177
NOTE: You cannot paste from ISIS/Draw into the ChemDraw panel, only into the Model win-dow. You can, however use the synchronize con-trol to add the model to the ChemDraw panel.
Chem & Bio Office 2010 User Guide 65Chem & Bio 3D
You can also cut-and-paste, or drag-and-drop, models to and from ChemDraw to Chem & Bio 3D or the ChemDraw panel. See “Copying to other applications” on page 129 for more information.Chem & Bio 3D ignores on-bond or atom objects copied to the clipboard (arrows, orbit-als, curves). Superatoms in ISIS/Draw are expanded if Chem3D finds a corresponding substructure. If a corresponding structure is not found, you must define a substructure. For more information, see “Defining Substruc-tures” on page 168.
Building With the Bond ToolsUse the bond tools to create the basic structure of your models. After you draw a bond, you can modify it to look the way you want. For example, you can change the carbons or hydro-gens to other elements or hide the hydrogens to reduce clutter on the screen.To create a model using a bond tool:
1. Choose a bond tool. The Single Bond tool is used in this example.
2. In the Model window, click and drag in the direction you want the bond to be oriented.
3. Release the mouse button to complete the bond.
4. To add bonds to the model, click and drag from an atom you just drew.
After you have the basic structure, you can change the carbons to different heteroatoms.
RectificationWhen Correct Atom Types and Rectify settings are selected in the Model Building tab panel (File>Model Settings>Model Building tab), the atom type is set according to the bond tool used (C Alkane in this example) and the appro-priate number of hydrogens are added.
When the Rectify option is set in the Model Building tab, the hydrogen is replaced by a car-bon.
Adjusting Bond WidthTypically, all the bonds in your model will look the same and be a specified width. How-ever, if you want, you can emphasize part of the structure or even just one bond by adjusting bond widths as desired.
1. Right-click the bond whose width you want to modify.
2. Choose Select Bond Size from the context window.
3. In the Bond Size Selection dialog box, use the slider to modify the width.
Adjusting all bondsTo adjust the width for all bonds in your model:
1. Go to File>Model Settings and select the Atom & Bond tab.
2. Move the Bond Size slider to the desired width.
3. Click OK.
Undefined Bonds and AtomsUse the Uncoordinated Bond tool to create an uncoordinated bond with a dummy atom (labeled Du). Uncoordinated Bonds and dummy atoms are ignored in all computations. An uncoordinated bond lets you specify a con-nection between two atoms without a strict definition of the type of bond. This bond is often used in coordination complexes for inor-ganic compounds, where another element might be substituted. Dummy atoms are also useful for positioning atoms in a Z-matrix, perhaps for export to another application for further analysis. This is

66 Building ModelsChapter 5
helpful when models become large and con-nectivities are difficult to specify. To add an uncoordinated bond and dummy atom:
1. Select the Uncoordinated Bond tool.2. Point to an atom and drag from the atom.
An uncoordinated bond and a dummy atom are added to the model. The atom created is labeled “Du”, the Chem & Bio 3D 12.0 ele-ment symbol for Dummy atoms.
Figure 5.1 A) Dummy atoms
Displaying Delocalized BondsAlternating double and single bonds in aromat-ics and other compounds can be displayed in either their Kekule or de-localized form. Two
typical examples are CO2- and benzene, shown below.
Figure 5.2 Kekule and delocalized bond for benzoic acid
After you build your model, you can toggle between Kekule and de-localized bonds any of the following three ways:
• Type CTRL-k.• Go to View>Model Display>Delocalized
Bonds and select an option.• Go to File>Model Settings>Model Display
tab and select (or deselect) the Show De-localized Bonds as Dashed Lines.
Removing Bonds and AtomsWhen you remove bonds and atoms:
• Click a bond to remove only that bond. • Click an atom to remove the atom and all
attached bonds.
To remove an atom or bond, do one of the fol-lowing:
• Click the Eraser tool and click the atom or bond.
• Select the atom or bond, and from the Edit menu, choose Clear.

Chem & Bio Office 2010 User Guide 67Chem & Bio 3D
• Select the atom or bond and press Delete.
NOTE: If automatic rectification is on, you will not be able to delete hydrogen atoms. Turn rec-tification off when modifying a model. (Go to File>Model Settings>Model Building tab.)
Build from Text ToolThe Build from Text tool lets you enter text that represents elements, atom types (elements with specific hybridization), substructures, for-mal charges, and serial numbers. The text you enter must be found in either the Elements, Atom Types, or Substructures tables. The match must be exact, including correct capital-ization. These tables can be found in the Parameter Tables list on the View menu.
NOTE: For all discussions below, all the Model Building tab options in the Chem 3D Set-ting dialog box are assumed to be turned on.
Here are some general rules for using the Build from Text Tool:
• Text is case sensitive. For example, the cor-rect way to specify a chlorine atom is Cl. The correct way to specify the phenyl group substructure is to type Ph. PH or ph will not be recognized.
• Pressing Enter applies the text to the model.• Typing a formal charge directly after an ele-
ment symbol will set the formal charge for that atom. For example PhO- will create a model of a phenoxide ion instead of phenol.
• If you double click an atom, the contents of the previous text box are applied to that atom. If the atom is one of several selected
atoms, then the contents of the previous text box are applied to all of the selected atoms.
• If a tool other than the Build from Text tool is selected, double-clicking in the model window is equivalent to clicking with the Build from Text tool selected. Triple-click-ing in the model window is equivalent to double-clicking with the Build from Text tool selected.
The interpretation of the text in a text box depends on whether atoms are selected as fol-lows:
• If the model window is empty, a model is built using the text.
• If you have one or more atoms selected, the text is added to the model at that selection if possible. If the specifications for a selected atom are violated, the connection cannot be made.
• If you have a model in the window, but do not have anything selected, a second frag-ment is added, but is not connected to the model.
• When a text box is visible, you can modify the selection by Shift+clicking or Shift-dragging across atoms.
Symbols and FormulaeWith the Build from Text tool, you can create structures by entering chemical symbols and formulae, as described by the examples below:To use an element symbol in a text box:
1. Select the Build from Text tool.2. Click in the model window. A text box
appears. 3. Type C.4. Press Enter. A model of methane appears.

68 Building ModelsChapter 5
The atom type is automatically assigned as a C Alkane, and the appropriate number of hydro-gens are automatically added. To use the same text to add another methyl group:
1. Point to the atom you want to replace, in this example a hydrogen, and click. The text box appears with the previous label.
2. Press Enter.To add a different element:
1. Click a hydrogen atom. A text box appears over the atom.
2. Type N.3. Press Enter.A nitrogen is added to form ethylamine.To build ethylamine in one step:
1. Click in the model window. A text box appears.
2. Type CH3CH2NH2.3. Press Enter. A model of ethylamine
appears.
Changing building typesYou can use a text box to change the building type and bonding characteristics. For example, to change an alkane to an alkene:To change the building type of some atoms:
1. Click a carbon atom. A text box appears.2. Shift-click the other carbon atom. Both
atoms are selected.3. Type C Alkene. 4. Press Enter.The building type and the bond order are changed to reflect the new model of ethylene-amine. You can point at the atoms and bonds to display this new information.
The Table EditorTo use the Table Editor to enter text in a text box:
1. Go to View>Parameter Tables>Chem 3D Building Atom Types.
2. Select the element or building type in the table.
3. Go to Edit>Copy.4. Double-click in the Chem & Bio 3D Model
Window.5. In Chem & Bio 3D, go to Edit>Paste.
Specifying Order of AttachmentIn both the simple and complex forms for using the Build from Text tool, you can specify the order of attachment and repeating units by numbers and parentheses. For example, type (CH3)3CNH2 into a text box with no atoms selected and press Enter. A model of tert-butylamine appears.
Using SubstructuresYou can use pre-defined functional groups called substructures to build models. To view the available substructures, go to View>Param-eter Tables>Substructures.Here are some advantages for using substruc-tures:
• Substructures are energy minimized.• Substructures have more than one attach-
ment atom (bonding atom) pre-configured. For example, the substructure Ph for the phe-nyl group has a single attachment point. The substructure COO for the carboxyl group has attachment points at both the carboxyl carbon and the anionic oxygen. These provide for insertion of this group within a model. Similar multi-bonding sites are defined for all amino acid and other polymer units.

Chem & Bio Office 2010 User Guide 69Chem & Bio 3D
• Amino Acid substructures come in both alpha (indicated by the amino acid name alone) and beta (indicated by a ß- preceding the name of the amino acid) forms. The dihedral angles have been preset for build-ing alpha helix and beta sheet forms.
• You can use substructures alone or in com-bination with single elements or atom types.
• Using a substructure automatically creates a record in the Groups table that you can use for easy selection of groups, or coloring by group.
• Substructures are particularly useful for building polymers.
• You can define your own substructures and add them to the substructures table, or cre-ate additional tables. For more information, see “Defining Substructures” on page 168.
Building with SubstructuresYou must know where the attachment points are for each substructure to get meaningful structures using this method. Pre-defined sub-structures have attachment points as defined by standard chemistry conventions. For more information see “Attachment point rules” on page 167.To use a substructure as an independent frag-ment, make sure there are no atoms selected. To insert a substructure into a model, select the atoms that are bonded to the attachment points of the substructure.To build a model using a substructure:
1. Type the name of the substructure into a text box (or copy and paste it from the Sub-structures table).
2. Press Enter. The substructure appears in the model window.
When you replace an atom or atoms with a substructure, the atoms that were bonded to the replaced atoms are bonded to the attachment points of the substructure. The attachment points left by the replaced atoms are also ordered by serial number.
Example 1. Building EthaneTo build a model of ethane using a substruc-ture:
1. Type Et or EtH into a text box with no atoms selected.
2. Press Enter. A model of ethane appears.
NOTE: When automatic rectification is on, the free valence in the ethyl group is filled with a hydrogen. If automatic rectification is off, you need to type EtH to get the same result. For sub-structures with more than one atom with an open valence, explicitly specify terminal atoms for each open valence.
Example 2. Building with a Substructure and Other ElementsTo build a model with substructures and other elements:
1. Type PrNH2 into a text box with no atoms selected.
2. Press Enter. A model of propylamine appears.
The appropriate bonding site for the Pr sub-structure is used for bonding to the additional elements NH2.
Example 3. PolypeptidesUse substructures for building polymers, such as proteins:
1. Type HAlaGlyPheOH into a text box with no atoms selected.
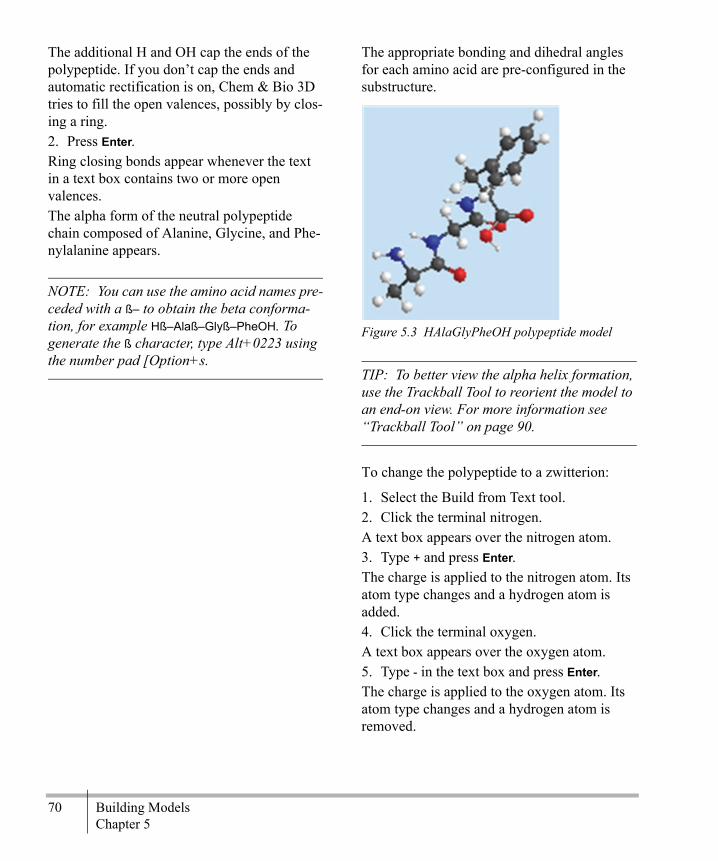
70 Building ModelsChapter 5
The additional H and OH cap the ends of the polypeptide. If you don’t cap the ends and automatic rectification is on, Chem & Bio 3D tries to fill the open valences, possibly by clos-ing a ring. 2. Press Enter.Ring closing bonds appear whenever the text in a text box contains two or more open valences.The alpha form of the neutral polypeptide chain composed of Alanine, Glycine, and Phe-nylalanine appears.
NOTE: You can use the amino acid names pre-ceded with a ß– to obtain the beta conforma-tion, for example Hß–Alaß–Glyß–PheOH. To generate the ß character, type Alt+0223 using the number pad [Option+s.
The appropriate bonding and dihedral angles for each amino acid are pre-configured in the substructure.
Figure 5.3 HAlaGlyPheOH polypeptide model
TIP: To better view the alpha helix formation, use the Trackball Tool to reorient the model to an end-on view. For more information see “Trackball Tool” on page 90.
To change the polypeptide to a zwitterion:
1. Select the Build from Text tool.2. Click the terminal nitrogen.A text box appears over the nitrogen atom.3. Type + and press Enter.The charge is applied to the nitrogen atom. Its atom type changes and a hydrogen atom is added.4. Click the terminal oxygen.A text box appears over the oxygen atom.5. Type - in the text box and press Enter.The charge is applied to the oxygen atom. Its atom type changes and a hydrogen atom is removed.

Chem & Bio Office 2010 User Guide 71Chem & Bio 3D
For amino acids that repeat, put parentheses around the repeating unit plus a number rather than type the amino acid repeatedly. For exam-ple, type HAla(Pro)10GlyOH.
Example 4. Other Polymers
Figure 5.4 The formation of a PET (polyethylene terephthalate) polymer with 4 units (a.k.a.: Dacron, Terylene, Mylar) ia shown above: PET model
To build this model, type OH(PET)4H into a text box with no atoms selected and press Enter. The H and OH are added to cap the ends of the polymer.
Replacing an AtomThe substructure you use must have the same number of attachment points as the atom you are replacing. For example, if you try to replace a carbon in the middle of a chain with an Ethyl substructure, an error occurs because the ethyl group has only one open valence and the selected carbon has two.To replace an individual atom with a substruc-ture:
1. Click the Build from Text tool.2. Click the atom to replace. A text box
appears.3. Type the name of the substructure to add
(case-sensitive).4. Press Enter. The substructure replaces the
selected atom. For example, to change benzene to biphenyl:
1. Click the atom to replace. A text box appears.
Figure 5.5 Changing a model with the text box
2. Type Ph.3. Press Enter.
Figure 5.6 Biphenyl model
Building From TablesCartesian Coordinate tables and Internal coor-dinates tables can be saved as text files or in Excel worksheets. (See “Internal coordinates Table” on page 12 and “Cartesian Coordi-nates” on page 23 for more information.) Like-wise, tables from text files or worksheets can be copied into blank tables in Chem & Bio 3D to create models. Text tables can use spaces or tabs between columns. For a Cartesian table, there must be four col-umns (not including the Serial Number col-umn) or five columns (if the Serial Number
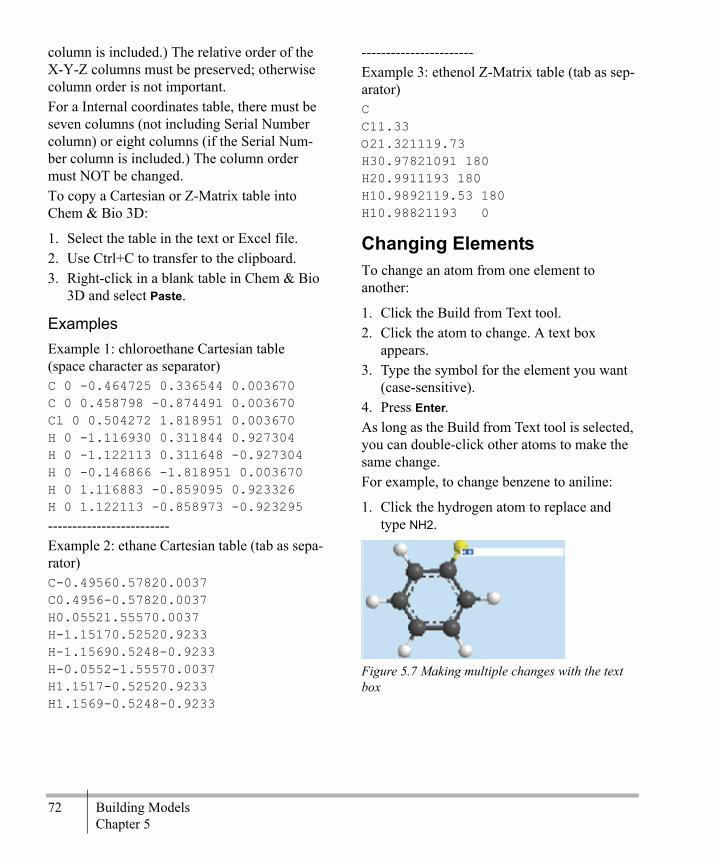
72 Building ModelsChapter 5
column is included.) The relative order of the X-Y-Z columns must be preserved; otherwise column order is not important. For a Internal coordinates table, there must be seven columns (not including Serial Number column) or eight columns (if the Serial Num-ber column is included.) The column order must NOT be changed.To copy a Cartesian or Z-Matrix table into Chem & Bio 3D:
1. Select the table in the text or Excel file.2. Use Ctrl+C to transfer to the clipboard.3. Right-click in a blank table in Chem & Bio
3D and select Paste.
ExamplesExample 1: chloroethane Cartesian table(space character as separator)C 0 -0.464725 0.336544 0.003670C 0 0.458798 -0.874491 0.003670Cl 0 0.504272 1.818951 0.003670H 0 -1.116930 0.311844 0.927304H 0 -1.122113 0.311648 -0.927304H 0 -0.146866 -1.818951 0.003670H 0 1.116883 -0.859095 0.923326H 0 1.122113 -0.858973 -0.923295
-------------------------Example 2: ethane Cartesian table (tab as sepa-rator)C-0.49560.57820.0037C0.4956-0.57820.0037H0.05521.55570.0037H-1.15170.52520.9233H-1.15690.5248-0.9233H-0.0552-1.55570.0037H1.1517-0.52520.9233H1.1569-0.5248-0.9233
-----------------------Example 3: ethenol Z-Matrix table (tab as sep-arator)CC11.33O21.321119.73H30.97821091 180H20.9911193 180H10.9892119.53 180H10.98821193 0
Changing ElementsTo change an atom from one element to another:
1. Click the Build from Text tool.2. Click the atom to change. A text box
appears.3. Type the symbol for the element you want
(case-sensitive).4. Press Enter.As long as the Build from Text tool is selected, you can double-click other atoms to make the same change.For example, to change benzene to aniline:
1. Click the hydrogen atom to replace and type NH2.
Figure 5.7 Making multiple changes with the text box

Chem & Bio Office 2010 User Guide 73Chem & Bio 3D
2. Press Enter.
Figure 5.8 aniline model
Changing Bond OrderTo change the bond order, you can use the bond tools, commands, or the Build from Text tool.You can change the bond order in the follow-ing ways:
• One bond at a time.• Several bonds at once.• By changing the atoms types on the bond.
To change the bond order with the bond tool:
1. Select a bond tool (of a different order).2. Drag from one atom to another to change.To change the bond order using a command:
1. Right-click a bond.2. Point to Set Bond Order, and choose a bond
order.To change the bond order by changing the atom type of the atoms on either end of the bond:
1. Click the Build from Text tool.
2. Shift+click all the atoms that are attached to bonds whose order you want to change.
3. Type the atom type to which you want to change the selected atoms.
4. Press Enter.The bond orders of the bonds change to reflect the new atom types.To change several bonds at once:
1. Open the ChemDraw panel and click in it to activate the ChemDraw control.
2. Choose either selection tool, Lasso or Mar-quee.
3. Click the first bond to be changed, then use Shift+Click to select the others.
4. Right-click in the selected area, and choose the bond type.
Figure 5.9 Using a context menu to change bonds
5. Click in the Chem & Bio 3D window to complete the action.
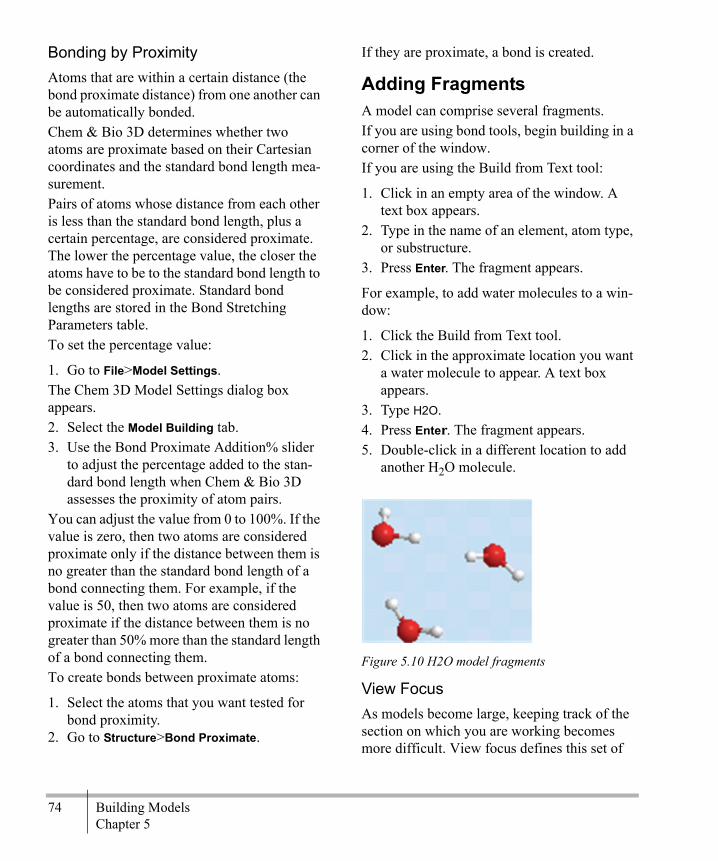
74 Building ModelsChapter 5
Bonding by ProximityAtoms that are within a certain distance (the bond proximate distance) from one another can be automatically bonded.Chem & Bio 3D determines whether two atoms are proximate based on their Cartesian coordinates and the standard bond length mea-surement.Pairs of atoms whose distance from each other is less than the standard bond length, plus a certain percentage, are considered proximate. The lower the percentage value, the closer the atoms have to be to the standard bond length to be considered proximate. Standard bond lengths are stored in the Bond Stretching Parameters table.To set the percentage value:
1. Go to File>Model Settings.The Chem 3D Model Settings dialog box appears.2. Select the Model Building tab.3. Use the Bond Proximate Addition% slider
to adjust the percentage added to the stan-dard bond length when Chem & Bio 3D assesses the proximity of atom pairs.
You can adjust the value from 0 to 100%. If the value is zero, then two atoms are considered proximate only if the distance between them is no greater than the standard bond length of a bond connecting them. For example, if the value is 50, then two atoms are considered proximate if the distance between them is no greater than 50% more than the standard length of a bond connecting them.To create bonds between proximate atoms:
1. Select the atoms that you want tested for bond proximity.
2. Go to Structure>Bond Proximate.
If they are proximate, a bond is created.
Adding Fragments A model can comprise several fragments.If you are using bond tools, begin building in a corner of the window. If you are using the Build from Text tool:
1. Click in an empty area of the window. A text box appears.
2. Type in the name of an element, atom type, or substructure.
3. Press Enter. The fragment appears.
For example, to add water molecules to a win-dow:
1. Click the Build from Text tool.2. Click in the approximate location you want
a water molecule to appear. A text box appears.
3. Type H2O.4. Press Enter. The fragment appears.5. Double-click in a different location to add
another H2O molecule.
Figure 5.10 H2O model fragments
View FocusAs models become large, keeping track of the section on which you are working becomes more difficult. View focus defines this set of

Chem & Bio Office 2010 User Guide 75Chem & Bio 3D
atoms for you and keeps them in view. By default, the entire model is in focus.To set the view focus to include specific atoms and bonds you are working on:
1. Select the fragment or set of atoms or bonds.
2. Go to View>View Focus>Set Focus to Selec-tion.
Once you have set the view focus, the follow-ing happen:
• When building with the bond tools, Chem & Bio 3D will resize and reposition the view so that all of the atoms in the view focus are visible.
• As new atoms are added, they become part of the view focus.
• When rotating, or resizing the view manu-ally, the rotation or resize will be centered around the view focus.
Setting MeasurementsTo set any of the following measurements go to Structure>Measurements:
• Bond lengths• Bond angles• Dihedral angles• Close contacts
NOTE: When you choose Structure>Measure-ments, the display of the Set Measurement option will vary, depending on what you have selected.
When you use the Clean Up command (go to Structure>Clean Up), the bond length and bond angle values are overridden.Chem & BioDraw
tries to adjust the structure so that its measure-ments match those in the Optimal column of the Measurement table as closely as possible. These optimal values are the standard mea-surements in the Bond Stretching and Angle Bending parameter tables. For all other mea-surements, performing a Clean Up or MM2 computation alters these values. To use values you set in these computations, you must apply a constraint.
Setting Bond LengthsTo set the length of a bond between two bonded atoms:
1. Select two adjacent atoms.2. Go to Structure>Measurements>Display
Bond Length Measurement. The Measurement table appears, displaying distance between the two atoms. Click the dis-tance value in the Actual column and edit it.3. Click the distance value in the Actual col-
umn and edit it.4. Press Enter.
Setting Bond AnglesTo set a bond angle:
1. Select three contiguous atoms for a bond angle.
2. Go to Structure>Measurements>Display Bond Angle Measurement.
The Measurement table appears, displaying the angle value. Click the angle value in the Actual column and edit it.3. Edit the highlighted text.4. Press Enter.
Setting Dihedral AnglesTo set a dihedral angle:

76 Building ModelsChapter 5
1. Select four contiguous atoms.2. Go to Structure>Measurements>Display
Dihedral Measurement The Measurement table appears, displaying the angle value. Click the angle value in the Actual column and edit it. 3. Press Enter.
NOTE: Angles in the Measurement table may be negative but equivalent values.
Setting close contact Distances To set the distance between two non-bonded atoms (an atom pair):
1. Select two unbonded atoms.2. Go to Structure>Measurements>Display
Distance Measurement.The Measurement table appears, displaying the distance. The Actual value is highlighted.3. Edit the highlighted text. 4. Press Enter.
NOTE: You can also move an atom with the Move Objects tool. The Measurement table will automatically update.
Atom MovementWhen you change the value of a measurement, the last atom selected moves. Chem & Bio 3D determines which other atoms in the same fragment also move by repositioning the atoms that are attached to the moving atom and excluding the atoms that are attached to the other selected atoms.
If all of the atoms in a measurement are within a ring, the set of moving atoms is generated as follows:
• Only one selected end atom that describes the measurement moves while other atoms describing the measurement remain in the same position.
• If you are setting a bond length or the dis-tance between two atoms, all atoms bonded to the non-moving selected atom do not move. From among the remaining atoms, any atoms which are bonded to the moving atom move.
• If the Rectify check box in the Model Building tab (go to File>Model Set-tings>Model Building tab) is selected, recti-fication atoms that are positioned relative to an atom that moves may also be reposi-tioned.
For example, consider the structure below:
Figure 5.11 Cyclopentylmethanol model
If you set the bond angle C(1)-C(2)-C(3) to 108 degrees, C(3) becomes the end moving atom. C(1) and C(2) remain stationary. H(11) and H(12) move because they are not part of the ring but are bonded to the moving atom. If the Automatically Rectify check box is selected, Model Building tabH(10) may move because it is a rectification atom and is posi-tioned relative to C(3).
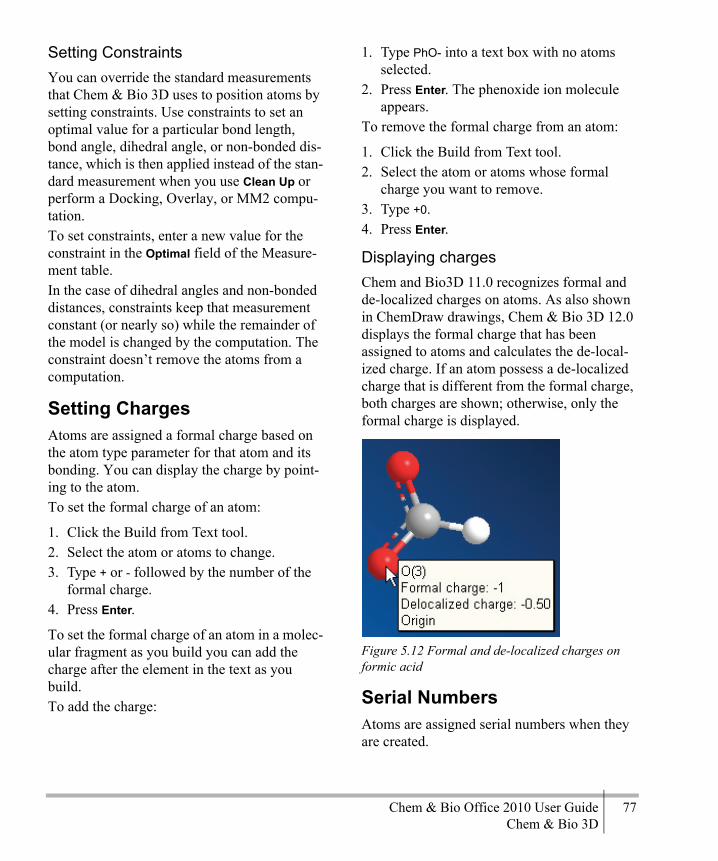
Chem & Bio Office 2010 User Guide 77Chem & Bio 3D
Setting ConstraintsYou can override the standard measurements that Chem & Bio 3D uses to position atoms by setting constraints. Use constraints to set an optimal value for a particular bond length, bond angle, dihedral angle, or non-bonded dis-tance, which is then applied instead of the stan-dard measurement when you use Clean Up or perform a Docking, Overlay, or MM2 compu-tation.To set constraints, enter a new value for the constraint in the Optimal field of the Measure-ment table.In the case of dihedral angles and non-bonded distances, constraints keep that measurement constant (or nearly so) while the remainder of the model is changed by the computation. The constraint doesn’t remove the atoms from a computation.
Setting ChargesAtoms are assigned a formal charge based on the atom type parameter for that atom and its bonding. You can display the charge by point-ing to the atom. To set the formal charge of an atom:
1. Click the Build from Text tool.2. Select the atom or atoms to change.3. Type + or - followed by the number of the
formal charge. 4. Press Enter.
To set the formal charge of an atom in a molec-ular fragment as you build you can add the charge after the element in the text as you build. To add the charge:
1. Type PhO- into a text box with no atoms selected.
2. Press Enter. The phenoxide ion molecule appears.
To remove the formal charge from an atom:
1. Click the Build from Text tool.2. Select the atom or atoms whose formal
charge you want to remove.3. Type +0.4. Press Enter.
Displaying chargesChem and Bio3D 11.0 recognizes formal and de-localized charges on atoms. As also shown in ChemDraw drawings, Chem & Bio 3D 12.0 displays the formal charge that has been assigned to atoms and calculates the de-local-ized charge. If an atom possess a de-localized charge that is different from the formal charge, both charges are shown; otherwise, only the formal charge is displayed.
Figure 5.12 Formal and de-localized charges on formic acid
Serial NumbersAtoms are assigned serial numbers when they are created.

78 Building ModelsChapter 5
Viewing serial numbersYou can view the serial numbers in the follow-ing ways:
• For individual atoms, use the Select tool to point to the atom. The serial number appears in the pop-up information.
• Go to View>Model Display>Show Serial Numbers.
• Go to File>Model Settings>Model Display tab and check the Show Serial Numbers check box. Click Apply.
• Click the Serial Number toggle on the Model Display Toolbar.
Reassigning serial numbersSerial numbers are initially assigned based on the order in which you add atoms to your model.To reassign the serial number of an atom:
1. In the Model Explorer, select the atoms you want to re-number.
2. Right-click the selected atoms and go to Atom Serial Numbers>Hide Atom Serial Numbers.
NOTE: The Model Explorer cannot update its numbering to match the changes you are mak-ing on the model when Serial Numbers are dis-played. If you forget this step, you will see different numbers on the tree control and the model. If this happens, simply hide the serial numbers momentarily and redisplay them.
3. Click the Build from Text tool.
4. Click the atom you want to reserialize. A text box appears.
5. Type the serial number. 6. Press Enter.
If the serial numbers of any unselected atoms conflict with the new serial numbers, then those unselected atoms are renumbered also.To reserialize another atom with the next sequential number, double-click the next atom you want to reserialize.To reserialize several atoms at once:
1. Click the Build from Text tool.2. Hold down Shift and select several atoms. 3. Type the starting serial number.4. Press Enter.
Normally, the selected atoms are reserialized in the order of their current serial numbers. However, the first four atoms selected are rese-rialized in the order you selected them.
Changing StereochemistryYou can alter the stereochemistry of your model by inversion or reflection.
Inversion The Invert command performs an inversion symmetry operation about a selected chiral atom.To perform an inversion:
1. Select the atom.2. Go to Structure>Invert.
The Invert command only repositions side chains extending from an atom.

Chem & Bio Office 2010 User Guide 79Chem & Bio 3D
For example, if you choose Invert for cyclohex-ylmethylamine around the C(1) carbon:
Figure 5.13 Cyclohexylmethylamine model
The inverted structure is shown below
Figure 5.14 Inverted cyclohexylmethylamine model
To invert several dihedral angles (such as all of the dihedral angles in a ring) simultaneously:
1. Select the dihedral angles to invert. 2. From the Structure>Invert.
All of the dihedral angles that make up the ring are negated. Atoms positioned axial to the ring are repositioned equatorial. Atoms positioned equatorial to the ring are repositioned axial.
ReflectionUse the Reflect command to perform reflec-tions on your model through any of the speci-fied planes–X, Y, or Z. When you choose the Reflect commands cer-tain Cartesian coordinates of each of the atoms are negated. When you choose Reflect Through Y-Z Plane, all of the X coordinates are negated.
You can choose Reflect Through X-Z Plane to negate all of the Y coordinates. Likewise, you can choose Reflect Through X-Y Plane to negate all of the Z coordinates. You can choose Invert through Origin to negate all of the Cartesian coordinates of the model.If the model contains any chiral centers, each of these commands change the model into its enantiomer. If this is done, all of the Pro-R positioned atoms become Pro-S and all of the Pro-S positioned atoms become Pro-R. All dihedral angles used to position atoms are negated.
NOTE: Pro-R and Pro-S within Chem3D are not equivalent to the specifications R and S used in standard chemistry terminology.
For example, for the structure shown below, when any atom is selected, go to Struc-ture>Reflect ModelThrough X-Z Plane.
Figure 5.15 Reflecting through a plane
Chem & Bio 3D produces the following enan-tiomer.:
Figure 5.16 Enantiomer produced by reflection

80 Building ModelsChapter 5
Refining a ModelAfter building a 3D structure, you may need to clean it up. For example, if you built the model without automatic rectification, atom type assignment, or standard measurements, you can apply these as a refinement.
Rectifying AtomsTo rectify the selected atoms in your model, go to Structure>Rectify. Hydrogen atoms are added and deleted so that each selected atom is bonded to the correct number of atoms as specified by the geometry for its atom type. This command also assigns atom types before rectification.The atom types of the selected atoms are changed so that they are consistent with the bound-to orders and bound-to types of adjacent atoms.
Cleaning Up a ModelNormally, Chem & Bio 3D 12.0 creates approximately correct structures. However, it is possible to create unrealistic structures, especially when you build strained ring sys-tems. To correct unrealistic bond lengths and bond angles use the Clean Up command.To clean up the selected atoms in a model, go to Structure>Clean Up.The selected atoms are repositioned to reduce errors in bond lengths and bond angles. Planar atoms are flattened and dihedral angles around double bonds are rotated to 0 or 180 degrees.
Printing and SavingWhen you are ready, you can print your mod-els to either an Adobe® PostScript® or non-
PostScript® printer or save it in any of a variety of file formats.
PrintingWhen you print your model, you can specify a variety of options such as the scale and resolu-tion of the image.
Setting Print OptionsTo open the Print Setup dialog box, go to File>Print Setup.To set up print options:
1. In the Printer dropdown list, select the name of the printer.
2. In the Form dropdown list, select the size o f the paper you want to use.
3. Select an orientation.4. For printing more than one model at a time,
select whether you want to use 2-Sided Printing.
5. Select from the following options:
• Scale to Full Page- The model will be resized to the size of the page
• Scale to____ mm/Angstrom• Always print with White Background-
White will replace the background color that appears on screen.
• High resolution Printing- select for higher quality. Deselect for faster printing.
• Include a Footer- footer appears at the bot-tom of the printed page.
6. Click OK.
To Print
1. Go to File>Print.2. In the print dialog box, select the page you
want to print and the number of copies. Click OK.

Chem & Bio Office 2010 User Guide 81Chem & Bio 3D
Saving ModelsTypically, you will want to save a model as a file so that you can come back to it later or import it into another application such as Microsoft Word. Chem 3D lets you save in a variety of formats. Each format has its own specific use, advantages and disadvantages. For information on file formats, see Appendix E.
Setting DefaultsChem 3D uses a default file type and location whenever you save a file. However, you can override them such that Chem 3D uses defaults of your own choosing each time it saves a file.To Set your own defaults:
1. Go to File>Preferences. The Preferences dialog box opens.
2. In the File tab, specify in the dropdown list the file type you want to use as a default.
3. Specify a default file location where you want files to be saved.
Keep in mind that the options you choose are only your defaults. You can still select a differ-ent format or location whenever you save a file.
Saving your file
1. Go to File>Save As.
2. Enter a name for the file and select a file type.
3. Click Save.
Copying and EmbeddingWhen you copy a model into another applica-tion, such as Microsoft Word or ChemDraw, the original model is unaffected. You can mod-ify the copy as much as you want and the orig-inal Chem 3D file is unchanged. However, when you embed the file, you place the origi-nal file within the application. This means that you can open it from within ChemDraw (or Word, etc). If you modify the file in Chem 3D, it is also modified in the ChemDraw document that contains it.
Copying ModelsTo copy a model as a 3D structure:
1. In Chem 3D, select the model.2. go to Edit>Copy As and choose either Bit-
map or Enhanced Meta File.
NOTE: Note: Bitmap will retain the back-ground, EMF format will make the background transparent.
3. In ChemDraw (or Word, etc.), select Edit>Paste.

82 Building ModelsChapter 5
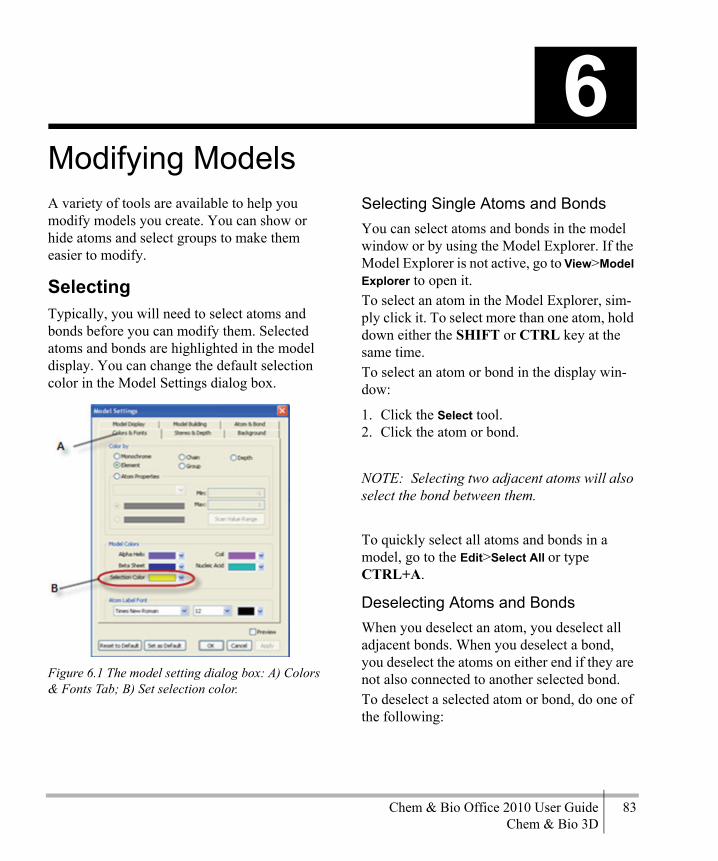
Chem & Bio Office 2010 User Guide 83Chem & Bio 3D
Modifying ModelsA variety of tools are available to help you modify models you create. You can show or hide atoms and select groups to make them easier to modify.
SelectingTypically, you will need to select atoms and bonds before you can modify them. Selected atoms and bonds are highlighted in the model display. You can change the default selection color in the Model Settings dialog box.
Figure 6.1 The model setting dialog box: A) Colors & Fonts Tab; B) Set selection color.
Selecting Single Atoms and BondsYou can select atoms and bonds in the model window or by using the Model Explorer. If the Model Explorer is not active, go to View>Model Explorer to open it.To select an atom in the Model Explorer, sim-ply click it. To select more than one atom, hold down either the SHIFT or CTRL key at the same time.To select an atom or bond in the display win-dow:
1. Click the Select tool.2. Click the atom or bond.
NOTE: Selecting two adjacent atoms will also select the bond between them.
To quickly select all atoms and bonds in a model, go to the Edit>Select All or type CTRL+A.
Deselecting Atoms and BondsWhen you deselect an atom, you deselect all adjacent bonds. When you deselect a bond, you deselect the atoms on either end if they are not also connected to another selected bond.To deselect a selected atom or bond, do one of the following:
6
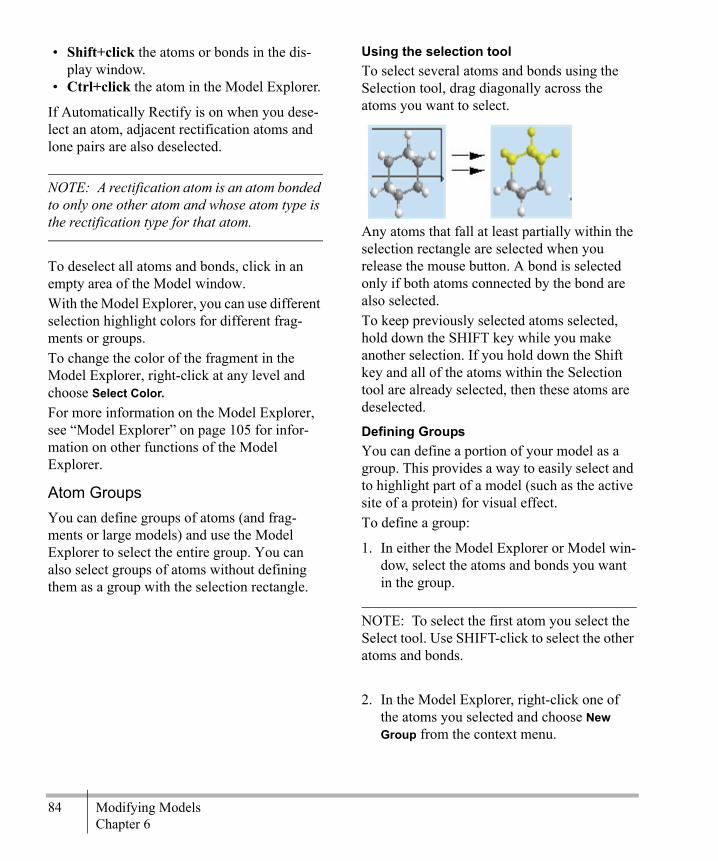
84 Modifying ModelsChapter 6
• Shift+click the atoms or bonds in the dis-play window.
• Ctrl+click the atom in the Model Explorer.
If Automatically Rectify is on when you dese-lect an atom, adjacent rectification atoms and lone pairs are also deselected.
NOTE: A rectification atom is an atom bonded to only one other atom and whose atom type is the rectification type for that atom.
To deselect all atoms and bonds, click in an empty area of the Model window. With the Model Explorer, you can use different selection highlight colors for different frag-ments or groups.To change the color of the fragment in the Model Explorer, right-click at any level and choose Select Color.For more information on the Model Explorer, see “Model Explorer” on page 105 for infor-mation on other functions of the Model Explorer.
Atom GroupsYou can define groups of atoms (and frag-ments or large models) and use the Model Explorer to select the entire group. You can also select groups of atoms without defining them as a group with the selection rectangle.
Using the selection toolTo select several atoms and bonds using the Selection tool, drag diagonally across the atoms you want to select.
Any atoms that fall at least partially within the selection rectangle are selected when you release the mouse button. A bond is selected only if both atoms connected by the bond are also selected. To keep previously selected atoms selected, hold down the SHIFT key while you make another selection. If you hold down the Shift key and all of the atoms within the Selection tool are already selected, then these atoms are deselected.
Defining GroupsYou can define a portion of your model as a group. This provides a way to easily select and to highlight part of a model (such as the active site of a protein) for visual effect. To define a group:
1. In either the Model Explorer or Model win-dow, select the atoms and bonds you want in the group.
NOTE: To select the first atom you select the Select tool. Use SHIFT-click to select the other atoms and bonds.
2. In the Model Explorer, right-click one of the atoms you selected and choose New Group from the context menu.

Chem & Bio Office 2010 User Guide 85Chem & Bio 3D
If the groups in your model are substructures defined in the Substructures table (substruc-tures.xml), you can assign standard colors to them.To assign (or change) a color:
1. Go to View>Parameter Tables>Substruc-tures.
2. For the substructure whose color you want to change, double-click its corresponding cell in the Color column.The Color dialog box appears.
3. Select a color and click OK.4. Close and Save the Substructures table.
Once colors are assigned in the Substructures table, you can use them to apply color by group:
1. Go to File>Model Settings.2. Select the Colors & Fonts tab.3. Select the Group radio button in the Color
by section. Each atom in your model appears in the color specified for its group.
NOTE: Color by Group is displayed only when Ribbon or Cartoon display mode is selected.
Selecting a Group or FragmentThere are several ways to select a group or fragment. The simplest is to use the Model Explorer, and select the fragment.You may also select a single atom or bond. Go to Edit>Select Fragment.
NOTE: If you want to select more than one fragment, you must use the Model Explorer.
After you have selected a single atom or bond, each successive double-click will select the next higher level of hierarchy.
Selecting by DistanceYou can select atoms or groups based on the distance or radius from a selected atom or group of objects. This feature is useful, among other things, for highlighting the binding site of a protein. To select atoms or groups by distance:
1. Use the Model Explorer to select an atom or fragment.

86 Modifying ModelsChapter 6
2. Right-click the selected object. From the context menu point to Select and click the appropriate option:
NOTE: Atoms or groups already selected are not included.Also, the current selection will be deselected unless multiple selection is used. Hold the shift key down to specify multiple selection.
Showing and Hiding AtomsSometimes, you may want to view your mod-els with some atoms temporarily hidden. Use the Model Explorer to hide atoms or groups.
Hiding atoms and groupsTo hide atoms or groups, right-click at any level, point to Visibility and click Hide... (Atom Group, etc.). Hidden atoms or groups are dis-played in parentheses in the tree control.By default, all levels in the hierarchy are set to inherit the settings of the level above, but you can reset the default to hide a group but show individual atoms in it.
Showing atomsTo show an atom belonging to a hidden group, right-click on the atom in the tree control, point to Visibility and choose Show.
Hydrogens and Lone PairsTo show all hydrogen atoms and lone pairs in the model, go to View>Model Display and select either:• Show hydrogen atoms>Show All
• Show Lone Pairs>Show AllA check mark appears beside the command, indicating that it has been selected. When these options are not selected, hydrogen atoms and lone pairs are automatically hidden.
Showing All AtomsIf you are working with a large model, it may be difficult to keep track of everything you have hidden. To show all atoms or groups that are hidden:
1. Select a level in the tree control above the hidden atoms or groups, or Shift+click to select the entire model.
2. From the context menu point to Select and click Select All Children.
3. Right-click again, point to Show... and choose Inherit Setting.
Option Result
Select Atoms within Distance of Selection
Selects all atoms lying within the specified dis-tance from any part of the current selection.
Select Groups within Distance of Selection
Selects all groups that con-tain one or more atoms lying within the specified distance from any part of the current selection.
Select Atoms within Radius of Selection Cen-troid
Selects all atoms lying within the specified dis-tance of the centroid of the current selection.
Select Groups within Radius of Selection Cen-troid
Selects all groups that con-tain one or more atoms lying within the specified distance of the centroid of the current selection.

Chem & Bio Office 2010 User Guide 87Chem & Bio 3D
Hydrogen BondsChem & Bio 3D 12.0 can detect and display hydrogen bonds in a model. You can also selectively display only the polar hydrogen atoms in a model. Chem & Bio 3D 12.0 recog-nizes the following hydrogen bond donor and acceptor groups:Hydrogen Bond Donors:
• *-N-H• *-O-H
Hydrogen Bond Acceptors:
• All Oxygen atoms• Nitrogen atoms in delocalized systems
To display hydrogen bond, do one of the fol-lowing:
• Go to View>Model Display>Hydrogen Bonds and choose either Show Intermolecular or Show All.
• Go to File>Model Settings and select the model Display tab. Select Show intermolecu-lar or Show All in the Hydrogen Bonds drop-down list.
Hydrogen bonds are represented as dashed lines between the donor hydrogen and the acceptor atom. Bonds with less than ideal geometry are displayed with a blue tint. The
intensity of the color increases as the bond becomes less ideal. :
Figure 6.2 Hydrogen bonds in MM2 optimized water
There are separate controls for hydrogen atoms and lone pairs, and you can choose to display only polar hydrogens (those bonded to oxygen or nitrogen). As with displaying hydrogen bonds, you control the setting either from the View menu or the Model Settings dialog box.
Figure 6.3 Setting hydrogen and lone-pair display: A) Show/Hide hydrogen atoms; B) Show/Hide lone pairs
By default, Show Polar is selected when a mac-romolecular PDB or mmCIF file is loaded.These display modes are global options, but their effect can be overridden by explicitly

88 Modifying ModelsChapter 6
changing the display mode of a particular atom or group in the Model Explorer.
Moving Atoms or ModelsUse the Move Objects tool to move atoms and other objects to different locations. If the atom, group of atoms, bond, or group of bonds that you want to move are already selected, then all of the selected atoms move. Using the Move Objects tool changes the view relative to the model coordinates.The following examples use the visualization axes to demonstrate the difference between different types of moving. To move an atom to a different location on the X-Y plane:
1. Click both the Model Axis and View Axis tools to visualize the axes.
NOTE: The axes will only appear if there is a model in the window.
2. Drag with the single bond tool to create a model of ethane.
3. Point to an atom using the Move Objects Tool.
4. Drag the atom to a new location. Dragging moves atoms parallel to the X-Y plane, changing only their X- and Y-coordi-nates. If Automatically Rectify is on, then the unse-lected rectification atoms that are adjacent to selected atoms move with the selected atoms.
To move a model:
1. With the Move Objects tool, click and drag across the model to select it.
2. Drag the model to the new location.
Figure 6.4 Moving a model
Note that the View axis also moves relative to the model coordinates.
The Translate ToolUse the Translate tool to move a model in the view window. When you use the Translate tool, you move the focus view and the model coordinates along with the model. Thus, the
1
2
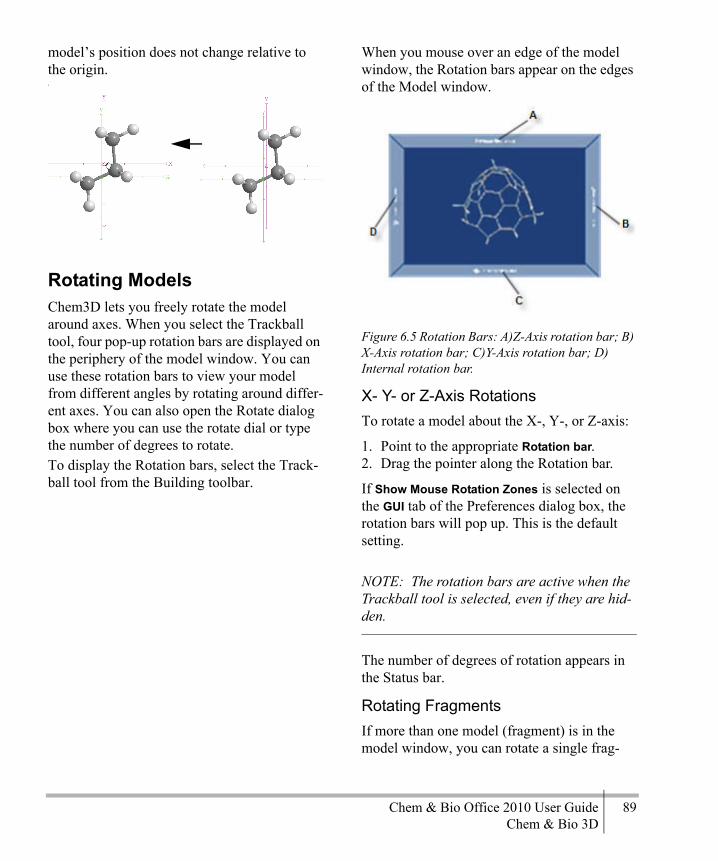
Chem & Bio Office 2010 User Guide 89Chem & Bio 3D
model’s position does not change relative to the origin.z
Rotating ModelsChem3D lets you freely rotate the model around axes. When you select the Trackball tool, four pop-up rotation bars are displayed on the periphery of the model window. You can use these rotation bars to view your model from different angles by rotating around differ-ent axes. You can also open the Rotate dialog box where you can use the rotate dial or type the number of degrees to rotate.To display the Rotation bars, select the Track-ball tool from the Building toolbar.
When you mouse over an edge of the model window, the Rotation bars appear on the edges of the Model window.
Figure 6.5 Rotation Bars: A)Z-Axis rotation bar; B) X-Axis rotation bar; C)Y-Axis rotation bar; D) Internal rotation bar.
X- Y- or Z-Axis RotationsTo rotate a model about the X-, Y-, or Z-axis:
1. Point to the appropriate Rotation bar. 2. Drag the pointer along the Rotation bar.
If Show Mouse Rotation Zones is selected on the GUI tab of the Preferences dialog box, the rotation bars will pop up. This is the default setting.
NOTE: The rotation bars are active when the Trackball tool is selected, even if they are hid-den.
The number of degrees of rotation appears in the Status bar.
Rotating FragmentsIf more than one model (fragment) is in the model window, you can rotate a single frag-

90 Modifying ModelsChapter 6
ment or rotate all fragments in the model win-dow.To rotate only one fragment:
1. Select an atom in the fragment you want to rotate.
2. Hold the Shift key while dragging a rotation bar.
To rotate all fragments, drag a rotation bar.
Trackball ToolUse the Trackball tool to freely rotate a model. Starting anywhere in the model window, drag the pointer in any direction The Status bar dis-plays the X and Y axis rotation.
Internal RotationsInternal rotations alter a dihedral angle and create another conformation of your model. You can rotate an internal angle using the dihe-dral rotators on the Rotation Dial.
Using the Rotation DialThe Rotation Dial offers a quick method for rotating a model or dihedral a chosen number of degrees with reasonable accuracy. To open the rotation dial.
1. Click the arrow next to the Trackball tool. 2. Enter exact numbers into the degree text
box. The Internal Rotation icons are avail-able only when atoms or bonds have been selected in the model.
To perform internal rotations in a model, you must select at least two atoms or one bond.
You may then either rotate the model around the bond axis, or rotate either end.
Figure 6.6 The Rotation dial: A) degree display box; B) Axis rotation; C) rotate around bond axis; D) dihedral rotation
NOTE: Using the Internal Rotation Bar (the one to the left of the workspace) rotates the model around the selected bond axis. Note that this is a change from earlier versions of Chem3D, where the Internal Rotation Bar rotated the dihedral.
Internal rotation is typically specified by a bond. The fragment at one end of the bond is stationary while the fragment attached to the other end rotates. The order in which you select the atoms determines which fragment rotates.

Chem & Bio Office 2010 User Guide 91Chem & Bio 3D
For example, consider ethoxybenzene (phene-tole).:
Figure 6.7 Rotating around a bond
To rotate about the C-O bond where the phenyl group moves:
1. Click the arrow next to the Trackball tool, and drag the Rotation Dial onto the work-space.
2. Hold down the S key, and select the O atom.3. Hold down the Shift and S keys, and select
the C1 atom.4. Click the left-hand dihedral rotator.5. Drag the dial to rotate the phenyl group.
Figure 6.8 Selecting atoms for rotation around a bond: A) First Selection( Anchor); B) Second selec-tion; C) Faded fragment is rotating
To perform a rotation about the C-O bond where the ethyl group moves, do one of the fol-lowing:
• Click the right-hand dihedral rotator.
• Reverse the order of selection: first select C1, then O.
TIP: To deselect the atoms, hold down the S key and click anywhere in the model window.
Rotating Around a BondTo rotate the model around a specific bond:
1. Select a bond.2. Drag the pointer along the Rotate About
Bond Rotation bar on the left side of the Model window.
Rotating Around a Specific AxisYou can rotate your model around an axis you specify by selecting any two atoms in your model. You can add dummy atoms (see “Undefined Bonds and Atoms” on page 65) as fragments to specify an axis around which to rotate. To rotate the model around an axis:
1. Select any two atoms.2. Drag the pointer along the Rotate About
Bond Rotation bar on the left side of the Model window.
Rotating a Dihedral AngleYou can select a specific dihedral angle to rotate. To rotate a dihedral:
1. Select four atoms that define the dihedral.2. Select one of the dihedral rotators on the
Rotation Dial.3. Drag the dial or enter a number in the text
box.
TIP: The keyboard shortcuts for dihedral rota-tion are Shift+B and Shift+N.

92 Modifying ModelsChapter 6
You can change the orientation of your model along a specific axis. Although your model moves, the origin of the model (0, 0, 0) does not change, and is always located in the center of the model window. To change the origin, see “Centering a Selection” on page 93.
Aligning to an AxisTo position your model parallel to either the X-, Y-, or Z-axis:
1. Select two atoms only.2. Go to View>View Position>Align View (X, Y,
or Z) Axis With Selection.The model rotates so that the two atoms you select are parallel to the appropriate axis.
NOTE: This changes the view, not the coordi-nates of the molecule. To change the model coordinates, Go to Structure>Model Position.
For example, to see an end-on view of ethanol:
1. Click the Select tool.2. Shift+click C(1) and C(2).
Figure 6.9 Selecting atom for alignment
3. Go to View>View Position>Align View Z Axis With Selection.
Aligning to a PlaneYou can align a model to a plane when you select three or more atoms. When you select three atoms, those atoms define a unique plane. If you select more than three atoms, a plane is computed that minimizes the average distance between the selected atoms and the plane. To position a plane in your model parallel to a plane of the Cartesian Coordinate system:
1. Select three or more atoms.2. Go to View>View Position>Align View
(choose a plane) With Selection. The entire model rotates so that the computed plane is parallel to the X-Y, Y-Z, or X-Z plane. The center of the model remains in the center of the window.To move three atoms to a plane and two of the atoms onto an axis:
1. Select the two atoms.2. Go to View>View Position>Align View
(choose an axis) With Selection.3. Shift+click the third atom.4. Go to View>View Position>Align View
(choose an axis) With Selection.For example, to move a cyclohexane chair so that three alternating atoms are on the X-Y Plane:

Chem & Bio Office 2010 User Guide 93Chem & Bio 3D
1. Select two non-adjacent carbon atoms in the ring.
2. Go to View>View Position>Align View X-Axis With Selection.
The model moves to the position shown in Fig-ure B.
Figure 6.10 Aligning to the XY plane
3. Select the third carbon atom such that no two selected atoms in the ring are adjacent.
4. Go to View>View Position>Align View X-Y Plane With Selection.
The model moves to the position shown in Fig-ure 6.10 C.
Resizing ModelsChem & Bio 3D provides the following ways to resize your model:
• Resizing Windows• Scaling a Model
Centering a SelectionWhen resizing a model, or before doing com-putations, it is often useful to center the model. Chem3D lets you select an atom (or atoms) to determine the center, or perform the calcula-tion on the entire model.To center your model based on a particular selection:
1. Select one or more atoms. (optional)2. Go to Structure>Model Postion>Center
Model (or Selection) on Origin.
This command places the centroid of the selected atoms at the coordinate origin. Chem & Bio 3D 12.0 calculates the centroid of the selected atoms by averaging their X, Y, and Z coordinates. If you do not select any atoms, the command operates on the entire model.
The Zoom ToolYou can reduce or enlarge a model using the Zoom tool.This tool is useful whenever you want to view different parts of large molecules. The coordi-nates of the model do not change.
Scaling a ModelYou can scale a model to fit a window. If you have created a movie of the model, you have a choice of scaling individual frames or the whole movie.To scale a model to the window size, do one of the following:
• Go to View>View Position>Fit to Window.• Go to View>View Position>Fit All Frames to
Window to scale an entire movie.
A
B
C
B

94 Modifying ModelsChapter 6
The Model To Window command operates only on the active frame of a movie. To scale more than one frame, you must repeat the command for each frame you want to scale.
NOTE: The Fit command only affect the scale of the model. Atomic radii and interatomic dis-tances do not change.
The Z-matrixThe relative position of each atom in your model is determined by a set of internal coordi-nates known as a Z-matrix. The internal coor-dinates for any particular atom consist of measurements (bond lengths, bond angles, and dihedral angles) between it and other atoms. All but three of the atoms in your structure (the first three atoms in the Z-matrix which describes your model) are positioned in terms of three previously positioned atoms.To view the current Z-matrix of a model, go to View>Z-Matrix Table.The first three atoms in a Z-matrix are defined as follows:Origin atom. The first atom in a Z-matrix. All other atoms in the model are positioned (either directly or indirectly) in terms of this atom.First Positioned atom. Positioned only in terms of the Origin atom. Its position is speci-fied by a distance from the Origin atom. Usu-ally, the First Positioned atom is bonded to the Origin atom. Second Positioned atom. Positioned in terms of the Origin atom and the First Positioned atom. There are two possible ways to position
the Second Positioned atom, as described in Figure 6.11.
Figure 6.11 Atoms in a Z-matrix:A) Original atom; B) Angle; C) 2nd positioned atom; D) 1st positioned atom; E) Distance
In the left example, the Second Positioned atom is a specified distance from the First Positioned atom. In addition, the placement of the Second Positioned atom is specified by the angle between the Origin atom, the First Posi-tioned atom, and the Second Positioned atom. In the right example, the Second Positioned atom is a specified distance from the Origin atom. In addition, the placement of the Second Positioned atom is specified by the angle between the First Positioned atom, the Origin atom, and the Second Positioned atom.
Positioning by Three Other AtomsIn the following set of illustrations, each atom D is positioned relative to three previously positioned atoms C, B, and A. Three measure-ments are needed to position D: a distance, and two angles.Atom C is the Distance-Defining atom; D is placed a specified distance from C. Atom B is the First Angle-Defining atom; D, C, and B describe an angle. Atom A is the Second Angle-Defining atom. It is used to position D in one of two ways:
• By a dihedral angle A-B-C-D• By a second angle A-C-D.
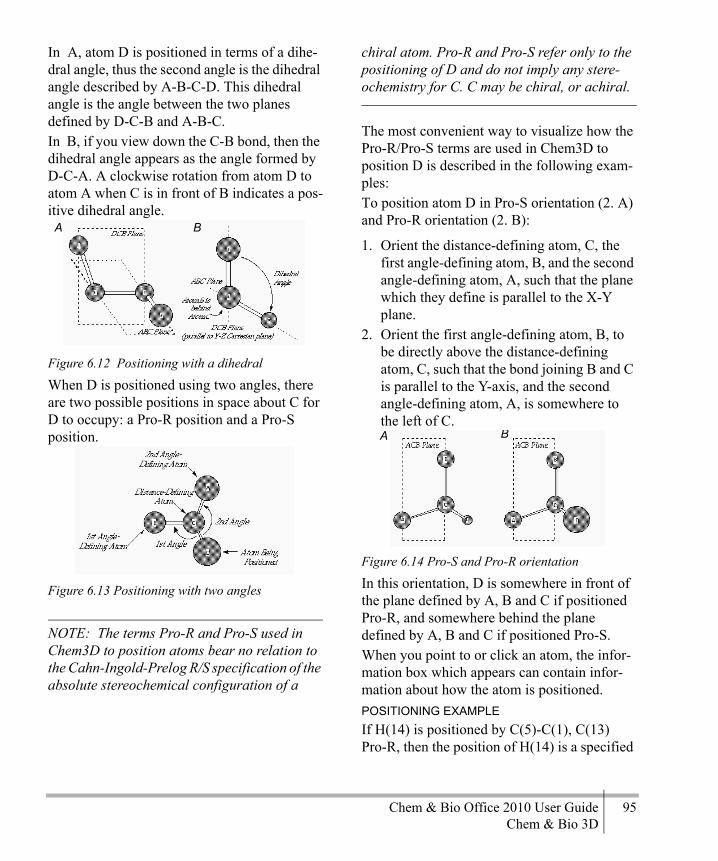
Chem & Bio Office 2010 User Guide 95Chem & Bio 3D
In A, atom D is positioned in terms of a dihe-dral angle, thus the second angle is the dihedral angle described by A-B-C-D. This dihedral angle is the angle between the two planes defined by D-C-B and A-B-C. In B, if you view down the C-B bond, then the dihedral angle appears as the angle formed by D-C-A. A clockwise rotation from atom D to atom A when C is in front of B indicates a pos-itive dihedral angle.
Figure 6.12 Positioning with a dihedral
When D is positioned using two angles, there are two possible positions in space about C for D to occupy: a Pro-R position and a Pro-S position.
Figure 6.13 Positioning with two angles
NOTE: The terms Pro-R and Pro-S used in Chem3D to position atoms bear no relation to the Cahn-Ingold-Prelog R/S specification of the absolute stereochemical configuration of a
chiral atom. Pro-R and Pro-S refer only to the positioning of D and do not imply any stere-ochemistry for C. C may be chiral, or achiral.
The most convenient way to visualize how the Pro-R/Pro-S terms are used in Chem3D to position D is described in the following exam-ples:To position atom D in Pro-S orientation (2. A) and Pro-R orientation (2. B):
1. Orient the distance-defining atom, C, the first angle-defining atom, B, and the second angle-defining atom, A, such that the plane which they define is parallel to the X-Y plane.
2. Orient the first angle-defining atom, B, to be directly above the distance-defining atom, C, such that the bond joining B and C is parallel to the Y-axis, and the second angle-defining atom, A, is somewhere to the left of C.
Figure 6.14 Pro-S and Pro-R orientation
In this orientation, D is somewhere in front of the plane defined by A, B and C if positioned Pro-R, and somewhere behind the plane defined by A, B and C if positioned Pro-S. When you point to or click an atom, the infor-mation box which appears can contain infor-mation about how the atom is positioned.POSITIONING EXAMPLEIf H(14) is positioned by C(5)-C(1), C(13) Pro-R, then the position of H(14) is a specified
A B
A B

96 Modifying ModelsChapter 6
distance from C(5) as described by the H(14)-C(5) bond length. Two bond angles, H(14)-C(5)-C(1), and H(14)-C(5)-C(13), are also used to position the atom. Because H(14) is positioned by two bond angles, there are two possible positions in space about C(5) for H(14) to occupy; the Pro-R designation determines which of the two positions is used.
Figure 6.15 Positioning example
If an atom is positioned by a dihedral angle, the three atoms listed in the information about an atom would all be connected by dashes, such as C(6)-C(3)-C(1), and there would be no Pro-R or Pro-S designation.The commands in the Set Z-Matrix submenu allow you to change the Z-matrix for your model using the concepts described previously.Because current measurements are retained when you choose any of the commands in the Set Z-Matrix submenu, no visible changes in the model window occur.POSITIONING BY BOND ANGLESTo position an atom relative to three previ-ously positioned atoms using a bond distance and two bond angles:
1. With the Select tool, click the second angle-defining atom.
2. Shift-click the first angle-defining atom.3. Shift-click the distance-defining atom.4. Shift-click the atom to position.
You should now have four atoms selected, with the atom to be positioned selected last.5. Go to Structure>Set Z-Matrix>Position by
Bond Angles.For example, consider the structure in .
Figure 6.16 Decahydronaphthalene model
To position atom C(7) by two bond angles, select atoms in the following order: C(5), C(1), C(6), C(7), then choose Position by Bond Angles.POSITIONING BY DIHEDRAL ANGLETo position an atom relative to three previ-ously positioned atoms using a bond distance, a bond angle, and a dihedral angle:
1. With the Select tool, click the dihe-dral-angle defining atom.
2. Shift-click the first angle-defining atom.3. Shift-click the distance-defining atom.4. Shift-click the atom to position. You should now have four atoms selected, with the atom to be positioned selected last.5. Go to Structure>Set Z-Matrix>Position by
Dihedral.For example, using the previous illustration, choose atoms in the following order: C(7), C(6), C(1), C(10) to position C(10) by a dihe-dral angle in a ring. Then choose Position by Dihedral.SETTING ORIGIN ATOMSTo specify the origin atoms of the Z-matrix:

Chem & Bio Office 2010 User Guide 97Chem & Bio 3D
1. With the Select tool, click the first one, two, or three atoms to start the Z-matrix.
2. Go to Structure>Set Z-Matrix, and choose Set Origin Atom.
The selected atoms become the origin atoms for the Z-matrix and all other atoms are posi-tioned relative to the new origin atoms. Because current measurements are retained, no visible changes to the model occur.

98 Modifying ModelsChapter 6

Chem & Bio Office 2010 User Guide 99Chem & Bio 3D
Viewing ModelsYou can view information about an active model in a pop-up or in measurement table.
Popup InformationYou can display information about atoms and bonds by pointing to them so that pop-up infor-mation appears.You can display the following information about an atom:
• Cartesian coordinates• Atom type• Internal coordinates (Z-matrix)• Measurements • Bond Length• Bond Order
• Partial Charge
NOTE: Precise bond orders for delocalized pi systems are displayed if the MM2 Force Field has been computed.
The information about an atom or bond always begins with the name of that object, such as C(12) for an atom or O(5)-P(3) for a bond. Other information that appears depends on the preferences you choose.
7

100 Viewing ModelsChapter 7
To set what pop-up information appears, go to File>Preferences and select the Popup Info. tab. The options are described below:Cartesian Coordinates. Displays the three numerical values indicating the atom’s posi-tion along the X, Y, and Z axes.Atom Type. Displays the atom type corre-sponding to the first column of a record in the Atom Types table.Internal coordinates. Lists the relative posi-tions and angles of atoms in this model relative to the origin atom.
NOTE: The internal coordinates definition includes whether the second angle used to posi-tion the selected atom is a dihedral angle or a second bond angle. If atoms other than the one at which you are pointing are selected, the mea-surement formed by all the selected atoms appears.
Measurements. Provides information relative to other selected atoms, such as the distance between two atoms, the angle formed by three atoms, or the dihedral angle formed by four atoms.Bond Length. Reports the distance between the atoms attached by a bond in angstroms.Bond Order. Reports the bond orders calcu-lated by Minimize Energy, Steric Energy, or Molecular Dynamics. Bond orders are usually 1.000, 1.500, 2.000, or 3.000 depending on whether the bond is a sin-
gle, delocalized, double, or triple bond. Com-puted bond orders can be fractional.Partial Charge. Displays the partial charge according to the currently selected calculation.See “Displaying Molecular Surfaces” on page 33 for information on how to select a calcula-tion.
Non-Bonded DistancesTo display the popup, simply place your cursor over an atom or bondTo display the distance between two non-adja-cent atoms or the angle between two bonds, select the atoms or bonds (SHIFT-click) and place your cursor over one of the selected bonds or atoms.:
Figure 7.1 The distance between adjacent hydrogen atoms
The Measurement TableAnother way to view information about your model is to activate the Measurement Table. This table can display internal measurements between atoms in your model in various ways.

Chem & Bio Office 2010 User Guide 101Chem & Bio 3D
You can display several measurements sequen-tially in the table.
Figure 7.2 The Measurement table: A) Bond lengths; B) Bond angles
To display internal measurements:
1. Go to View>Measurement Table. A blank table appears in the Tables window.
2. Go to Structure>Measurements and select a measurement to generate.
When you select a measurement in the Mea-surement table, the corresponding atoms are selected in the model window. If you select atoms in your model, any corresponding mea-surements are selected.
Editing MeasurementsThe measurements in the table are not avail-able just for you to view, you can also change them. When you change a value in the table, the model itself is automatically updated.To change the value of a measurement:
1. In the Actual column, select the value you want to change.
2. Type a new value in the selected cell and press Enter. The model reflects the new measurement.
When atoms are deleted, any measurements that refer to them are removed from the Mea-surement table.
Non-Bonded DistancesTo display non-bonded atom measurements:
1. Select the atoms.2. Go to Structure>Measurements>Display
Distance Measurement.
The measurement between the selected atoms is added to the table.
Figure 7.3 Adding measurements to a table: A) non-bonded distance
Optimal MeasurementsOptimal values are used instead of the corre-sponding standard measurements when a mea-surement is required in an operation such as Clean Up Structure. Optimal measurements are only used when the Measurement table is visi-ble. When the Measurement table is not visi-ble, the standard measurements are taken from the parameter tables.To specify optimal values for particular measurements, edit the value in the Optimal column. Chem3D also uses the optimal values with the Dock command. When you choose Dock from the Structure menu, Chem3D reconciles the actual distance between atoms in two frag-ments to their optimal distances by rigidly moving one fragment relative to the other.

102 Viewing ModelsChapter 7
Removing MeasurementsYou can remove information from the Mea-surement table without affecting the model. Go to Structure>Measurements>Clear.
Deviation from PlaneThe Deviation from Plane command lets you compute the RMS Deviation from the least squares plane fitted to the selected atoms in the model. EXAMPLE:PENICILLINTo examine the deviation from plane for five atoms in a penicillin molecule:
1. Build a penicillin model.2. Using the Select tool, click on S (4) atom.3. SHIFT+Click the other atoms in the
five-membered penicillin ring.
Figure 7.4 Viewing Deviation from a Plane
4. Go to Structure>Deviation from Plane.
When the deviation from plane calculation is complete, the value appears in the Output win-dow. The result indicates that the atoms in the five-membered ring of penicillin are not totally coplanar; there is a slight pucker to the ring.
Atom PropertiesThe Atom Property Table displays results for calculations you perform. These can be calcu-lated on a model from a Maestro file, another Chem 3D file, or on the current model. For example, if you perform an Huckel calculation, the Atom Property Table will list the relative charge for each atom. To view the table, go to View>Atom Property Table.
Atom Property Table FeaturesYou can use the Atom Property table for more than just displaying calculation results. You can rename the columns and also use it to iden-tify calculated atom properties. RENAMING COLUMNSWhen you perform a calculation on your model, a new column is added to the table, dis-playing the results. The column title consists of the type of result (“Charge”, in the table shown above) and the method used to calculate the results (“Hückel”). You can rename the col-umn to anything you want.

Chem & Bio Office 2010 User Guide 103Chem & Bio 3D
To rename a column in the Atom Property Table:
1. Double-click the column title.2. Type a new name in the title box.3. Click anywhere outside the table.
NOTE: Only the type of result can be renamed. You cannot change or delete the method (shown in parentheses) used to perform the calculation.
SELECTING ATOMSWhen you view the Atom Property Table, it may not be obvious which atoms in the table correspond to those in your model. To see which atom is which, select an atom in your model. The atom will be highlighted in the table. Alternatively, click the row number in the table to highlight the atom in your model. For Windows, use CTRL-click or SHIFT-click (OPTION-click for Macintosh) to select multi-ple atoms.COLOR-CODING RESULTSAfter you perform a calculation, you may find it useful to graphically identify in your model the results of a calculation. If the table displays a range of results among the listed atoms, you can color-code each atom based on where it falls within the range.To color-code atoms:
1. Go to File>Model Settings and select the Colors & Fonts tab.
2. Under Color by, select Atom Properties.3. In the Atom Properties drop-down list,
select the calculation you want to color-code.
4. Select one of the two color bands. The first band ranges from blue to red. The second band has a more refined range of color.
5. In the min/max text boxes, select the range of calculations you want to colorize. To select the entire range represented in the Atom Properties, click Scan Value Range.
6. To view the model with your options, select the Preview check box at the bottom of the dialog box and click Apply.
7. Click OK.SAVING RESULTSWhen you save you model, calculation results in the Atom Properties table are also saved.
NOTE: The results in the Atom Property table are identical to those listed in the Output win-dow. However, only those results listed in the Atom Property table are saved with the Model.
Displaying the Coordinates TablesThe coordinate tables display the position of each atom in your model. The Internal coordi-nate table shows the position of each atom rel-ative to the position of another atom. The Cartesian table displays the X-, Y-, and Z-coordinates of each atom relative to a fixed position in space.
Internal Coordinates (Z -Matrix coordinates)The first atom in the Internal coordinates table is defined as the origin atom. All other atoms in the table are listed with their corresponding positions relative to the origin atom.To display the Internal coordinates table, go to View>Internal coordinates Table.When you select a record in the table, the cor-responding atom is selected in the model. Con-versely, when you select atoms in the model, the corresponding records are selected in the table.
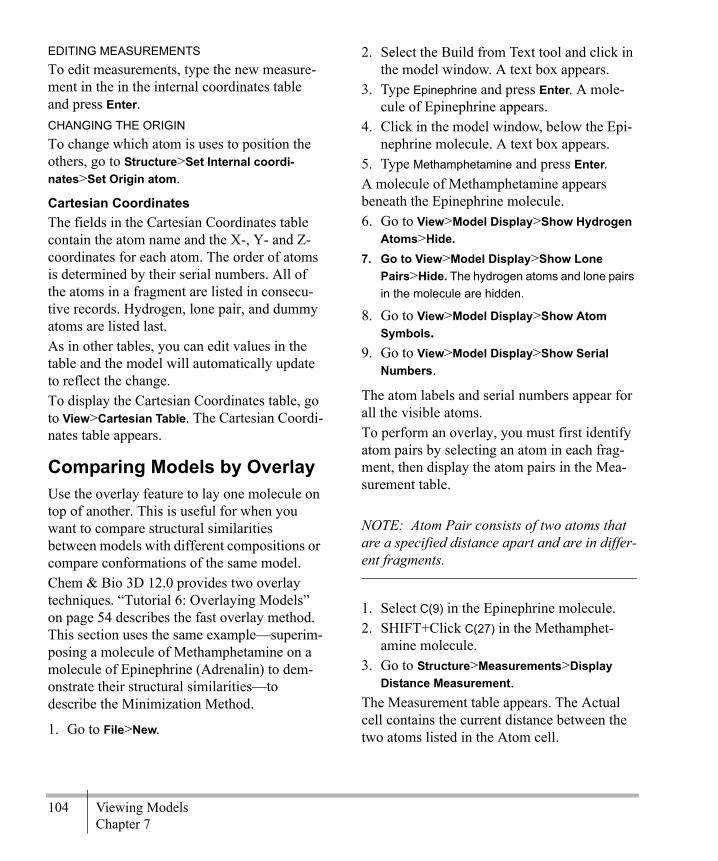
104 Viewing ModelsChapter 7
EDITING MEASUREMENTSTo edit measurements, type the new measure-ment in the in the internal coordinates table and press Enter.CHANGING THE ORIGINTo change which atom is uses to position the others, go to Structure>Set Internal coordi-nates>Set Origin atom.
Cartesian CoordinatesThe fields in the Cartesian Coordinates table contain the atom name and the X-, Y- and Z- coordinates for each atom. The order of atoms is determined by their serial numbers. All of the atoms in a fragment are listed in consecu-tive records. Hydrogen, lone pair, and dummy atoms are listed last.As in other tables, you can edit values in the table and the model will automatically update to reflect the change.To display the Cartesian Coordinates table, go to View>Cartesian Table. The Cartesian Coordi-nates table appears.
Comparing Models by OverlayUse the overlay feature to lay one molecule on top of another. This is useful for when you want to compare structural similarities between models with different compositions or compare conformations of the same model.Chem & Bio 3D 12.0 provides two overlay techniques. “Tutorial 6: Overlaying Models” on page 54 describes the fast overlay method. This section uses the same example—superim-posing a molecule of Methamphetamine on a molecule of Epinephrine (Adrenalin) to dem-onstrate their structural similarities—to describe the Minimization Method.
1. Go to File>New.
2. Select the Build from Text tool and click in the model window. A text box appears.
3. Type Epinephrine and press Enter. A mole-cule of Epinephrine appears.
4. Click in the model window, below the Epi-nephrine molecule. A text box appears.
5. Type Methamphetamine and press Enter.A molecule of Methamphetamine appears beneath the Epinephrine molecule.6. Go to View>Model Display>Show Hydrogen
Atoms>Hide.7. Go to View>Model Display>Show Lone
Pairs>Hide. The hydrogen atoms and lone pairs in the molecule are hidden.
8. Go to View>Model Display>Show Atom Symbols.
9. Go to View>Model Display>Show Serial Numbers.
The atom labels and serial numbers appear for all the visible atoms.To perform an overlay, you must first identify atom pairs by selecting an atom in each frag-ment, then display the atom pairs in the Mea-surement table.
NOTE: Atom Pair consists of two atoms that are a specified distance apart and are in differ-ent fragments.
1. Select C(9) in the Epinephrine molecule.2. SHIFT+Click C(27) in the Methamphet-
amine molecule. 3. Go to Structure>Measurements>Display
Distance Measurement.The Measurement table appears. The Actual cell contains the current distance between the two atoms listed in the Atom cell.

Chem & Bio Office 2010 User Guide 105Chem & Bio 3D
4. For an acceptable overlay, you must specify at least three atom pairs, although it can be done with only two pairs. Repeat steps 1 to 3 to create at least three atom pairs.
5. The optimal distances for overlaying two fragments are assumed to be zero for any atom pair that appears in the Measurement table. For each atom pair, type 0 into the Optimal column and press Enter.
:
Figure 7.5 Adding optimal values for overlay to the Measurement table
Now perform the overlay computation:
NOTE: To help see the two overlaid fragments, you can color a fragment. For more informa-tion see “Model Explorer” on page 105
1. Go to View>Model Display and deselect Show Atom Symbols and Show Serial Num-bers.
2. Go to Structure>Overlay>Minimize.The Overlay dialog box appears. 3. Type 0.100 for the Minimum RMS Error and
0.010 for the Minimum RMS Gradient.The overlay computation will stop when either the RMS Error becomes less than the Mini-mum RMS Error or the RMS Gradient becomes less than the Minimum RMS Gradi-ent value.4. Click Display Every Iteration. 5. Click Start.How the fragments are moved at each iteration of the overlay computation is displayed.
To save the iterations as a movie, click the Record Each Iteration check box. To stop the overlay computation before it reaches the preset minimum, click Stop Calcu-lation on the toolbar.The overlay and recording operation stops.The following illustration shows the distances between atom pairs at the completion of the overlay computation. The distances in the Actual cells are quite close to zero. The relative position of the two fragments or molecules at the start of the computation can affect the final results.
Model ExplorerThe Model Explorer displays a hierarchical tree representation of the model. It provides an easy way for you to explore the structure of any model, even complex macromolecules, and alter display properties at any level. Use the Model Explorer to:
• Define objects. • Add objects to groups.• Rename objects.• Delete objects, with or without their con-
tents.
The display properties of objects you can alter include:
• Changing the display mode.• Showing or hiding. • Changing the color.
At the atom level, you can display or hide:
• Atom spheres• Atom dots• Element symbols• Serial numbers

106 Viewing ModelsChapter 7
To display the Model Explorer, Go to View>Model Explorer.
Model Explorer ObjectsThe Model Explorer defines the model in terms of “objects”. Every object has a set of properties, including a property that defines whether or not it belongs to another object (is a “child” of a higher level “parent” object.) The default setting for all properties is Inherit Setting. This means that “parents” determine the properties of “children”, until you choose to change a property. By changing some prop-erty of a lower level object, you can better visualize the part of the model you want to study. The Model Explorer objects are:
• Fragments• Solvents• Chains• Backbone• Groups• Atoms• Bonds
FragmentsThe Fragment object represents the highest level segment (“parent”) of a model. Frag-ments represent separate parts of the model, that is, if you start at an atom in one fragment, you cannot trace through a series of bonds that connect to an atom in another fragment. If you create a bond between two such atoms, Chem3D will collapse the hierarchical struc-ture to create one fragment. Fragment objects typically consist of chains and groups, but may also contain individual atoms and bonds.
Chains and groupsIn Chem3D, chains and groups are functionally identical. Chains are special groups found in PDB files. If you rename a group as a chain, or vice versa, the icon will change. This is also the reason that only the word “Group” is used in the menus. All Group commands also apply to chains. Group objects can consist of other groups, atoms and bonds. Chem3D does not limit a group to contiguous atoms and bonds, though this is the logical definition.
BondsBond objects do not appear by default in the Model Explorer. To display bonds, go to File>Preferences. In the GUI tab, select Show Bonds.
SolventsThe Solvent object is a special group contain-ing all of the solvent molecules in the model. The individual molecules appear as “child” groups within the Solvent object. A Solvent object should not be child of any other object.
NOTE: When importing PDB models, solvents will sometimes show up in chains. Chem3D preserves this structure to save the PDB file again.
BackboneThe Backbone object is a display feature that lets you show the carbon-nitrogen backbone structure of a protein. It appears in the Model Explorer as a separate object with no children. The atoms and bonds that make up the back-bone belong to other chains and groups, but are also virtual children of the Backbone object. This lets you select display properties for the backbone that override the display properties

Chem & Bio Office 2010 User Guide 107Chem & Bio 3D
of the chains and groups above them in the hierarchy.
AtomsEach atom object in the Model Explorer repre-sents one atom in your model. Atoms cannot be moved outside the fragment. If you deleted an atom from a fragment (or a group within a fragment) the model itself is changed.
Managing Objects
Object PropertiesTo view or change an object property:
1. Select the object (fragment, group, or atom) you wish to change.
2. Right-click the object and select the appro-priate submenu, and choose a command.
When you change an object property, the object icon changes to green. When you hide an object, the icon changes to red. Objects with default properties have a blue icon.
Figure 7.6 Icons in the Model Explorer: A) Hidden; B) Changed
Groups
Creating GroupsSome models, PDB proteins for example, have group information incorporated in the file. For
other models you will need to define the groups:
1. Do one of the following:
• In the Model Explorer, hold down the CTRL key and select atoms you want on the group.
• In the Model window, hold the SHIFT key and select the atoms you want in the group.
2. In the Model Explorer, right click your selection and choose New Group from the context menu.
3. If you want, rename the group by typing a new name.
Adding to GroupsYou can add lower level objects to an existing group, or combine groups to form new groups.To add to a group:
1. In the Model Explorer, select the objects you want to add, using either SHIFT+click (contiguous) or CTRL+click (non-contigu-ous).
2. Right-click your selection and choose New Group from the context menu.
3. Rename the group, if desired.
NOTE: The order of selection is important. The group or chain to which you are adding should be the last object selected.
Deleting GroupsYou can delete the group without affecting its objects or the model. You can also delete the group and all the objects within it.
• Select Delete Group to remove the grouping while leaving its contents intact.

108 Viewing ModelsChapter 7
• Select Delete Group and Contents to delete the group from the model.
Figure 7.7 Changing display types in the Model Explorer
Coloring GroupsAnother way to view models is by assigning different colors to groups. Changing a group color in the Model Explorer overrides the stan-dard color settings in the Elements table and the Substructures table. To change a group color:
1. Select a group or groups.2. Choose Select Color on the context menu.
The Color Dialog box appears.3. Choose a color and click OK.
To revert to the default color:
1. Select the group or groups.2. Right-click your selection.3. On the context menu, go to Apply Group
Color and select Inherit Group Color.
Resetting DefaultsTo remove changes, use the Reset Children to Default command on the context menu.
Moving ObjectsNot only can you group objects together but you can also move them in and out of groups.
This becomes useful when you want to high-light different parts of your model or assign attributes. To move an object, simply click-drag it from one group or another. To move several objects, first select them using either CTRL+Click or SHIFT+Click.
Nesting ObjectsYou can also put objects in other objects. For example, you can have a DNA fragment that contains two helix groups that, in turn, con-tains nucleic acid groups.There are a few things to keep in mind when you move objects:
• You cannot click-drag objects from one fragment to another. (For example, you can-not move atoms from one molecule to another.)
• You cannot rearrange atoms within a group.
Display ModesOne means of bringing out a particular part of a model is by changing the display mode. The usual limitations apply (see “Displaying Mod-els” on page 25). The submenu will display only available modes.
Structure BrowserYou can import files, such as SD files, that contain multiple structures—two, three, or even dozens. Using the Structure Browser, you can browse through the list of structures and view each one in the Model window. A new ChemDraw -Preview panel is available at the bottom of the Structure browser panel. The Structure browser panel and the ChemDraw-
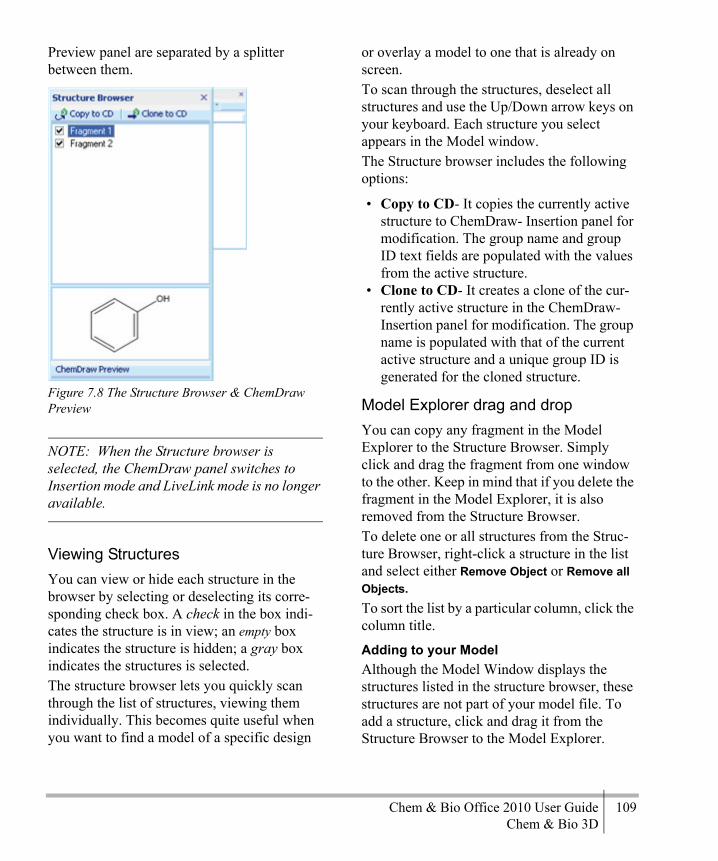
Chem & Bio Office 2010 User Guide 109Chem & Bio 3D
Preview panel are separated by a splitter between them.
Figure 7.8 The Structure Browser & ChemDraw Preview
NOTE: When the Structure browser is selected, the ChemDraw panel switches to Insertion mode and LiveLink mode is no longer available.
Viewing StructuresYou can view or hide each structure in the browser by selecting or deselecting its corre-sponding check box. A check in the box indi-cates the structure is in view; an empty box indicates the structure is hidden; a gray box indicates the structures is selected. The structure browser lets you quickly scan through the list of structures, viewing them individually. This becomes quite useful when you want to find a model of a specific design
or overlay a model to one that is already on screen.To scan through the structures, deselect all structures and use the Up/Down arrow keys on your keyboard. Each structure you select appears in the Model window.The Structure browser includes the following options:
• Copy to CD- It copies the currently active structure to ChemDraw- Insertion panel for modification. The group name and group ID text fields are populated with the values from the active structure.
• Clone to CD- It creates a clone of the cur-rently active structure in the ChemDraw-Insertion panel for modification. The group name is populated with that of the current active structure and a unique group ID is generated for the cloned structure.
Model Explorer drag and dropYou can copy any fragment in the Model Explorer to the Structure Browser. Simply click and drag the fragment from one window to the other. Keep in mind that if you delete the fragment in the Model Explorer, it is also removed from the Structure Browser.To delete one or all structures from the Struc-ture Browser, right-click a structure in the list and select either Remove Object or Remove all Objects.To sort the list by a particular column, click the column title.
Adding to your ModelAlthough the Model Window displays the structures listed in the structure browser, these structures are not part of your model file. To add a structure, click and drag it from the Structure Browser to the Model Explorer.

110 Viewing ModelsChapter 7
After the structure is in the Model Explorer, you can treat it the same as any other fragment.
Fast OverlayUse this feature to overlay all the objects in the Structure Browser onto the structure that is selected in the Model window.
1. In either the Model window or Model Explorer, select the target structure
2. Right-click anywhere in the Structure Browser and select fast overlay in the con-text window.

Chem & Bio Office 2010 User Guide 111Chem & Bio 3D
Force Field CalculationsA force field is an industry accepted term for any calculation method used to predict molec-ular properties. For example, you may want to use a force field calculation to predict the tor-sional constraint for a particular bond or per-haps the repulsion forces between molecules. Force fields are commonly used for a wide variety of calculations and are often verified with experimental values.
About Atom TypesBefore Chem & Bio 3D performs force field calculation, it takes into account the type of each atom in your model. An atom’s type is more than just the element it represents. It also takes into account the functional group to which it belongs and its location in your model. For example, a carboxyl carbon has a different atom type than an alkyl carbon.You may be tempted to think of atom types as building types. However, there are distinct dif-ferences. Building types describe only an atom’s contribution to the structure of a model-- its bond angles and bond lengths. The atom type describes the atom’s contribution to bond energies, thermal properties and other charac-teristics. The force fields use this data to calcu-late properties of your model and predict the behavior of the molecule it represents.
Force FieldsChem & Bio 3D offers two commonly accepted force field calculation methods, MM2 and MMFF94. These methods are designed so that you can calculate molecular properties of your models. Each of these methods enable you to calculate a variety of steric energy, ther-mal energy, and other values. Results are saved as part of the atom properties.MM2 and MMFF94 may be viewed as differ-ent calculation techniques you use to arrive at a specified result. Which technique you use depends on your type of model and the prop-erty you want to calculate. For example, for a given model, you may find that one method provides a better potential energy prediction than the other. Meanwhile, the other method may produce charge values that are closer to experimental values. Here we describe each of these methods and the calculations you can perform using them.
MM2The MM2 force field method is available in all versions of Chem & Bio 3D. MM2 is most commonly used for calculating properties of organic molecular models. The MM2 proce-dures described assume that you understand how the potential energy surface relates to con-formations of your model. If you are not famil-
8
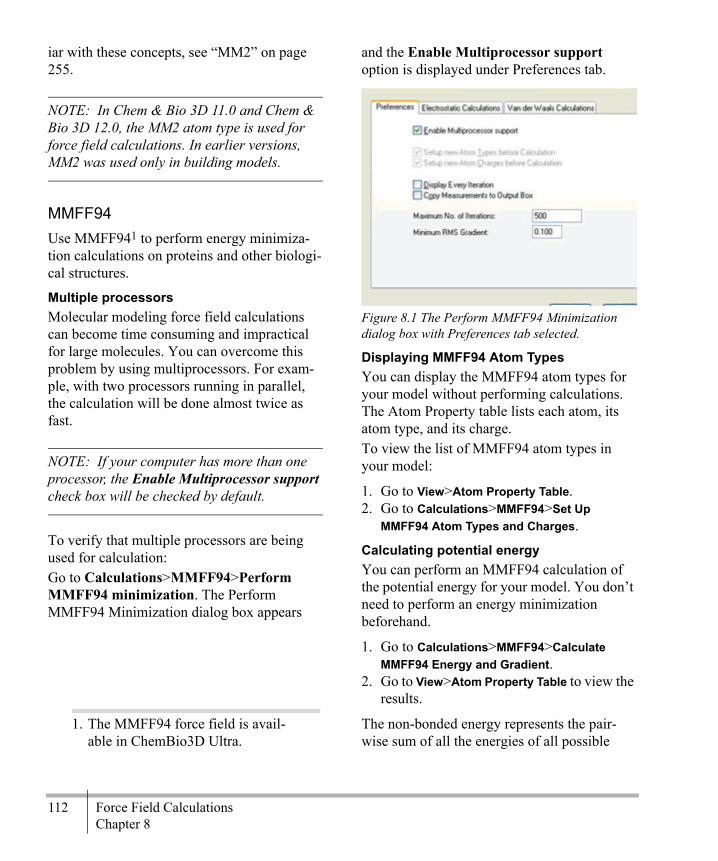
112 Force Field CalculationsChapter 8
iar with these concepts, see “MM2” on page 255.
NOTE: In Chem & Bio 3D 11.0 and Chem & Bio 3D 12.0, the MM2 atom type is used for force field calculations. In earlier versions, MM2 was used only in building models.
MMFF94Use MMFF941 to perform energy minimiza-tion calculations on proteins and other biologi-cal structures.
Multiple processorsMolecular modeling force field calculations can become time consuming and impractical for large molecules. You can overcome this problem by using multiprocessors. For exam-ple, with two processors running in parallel, the calculation will be done almost twice as fast.
NOTE: If your computer has more than one processor, the Enable Multiprocessor support check box will be checked by default.
To verify that multiple processors are being used for calculation:Go to Calculations>MMFF94>Perform MMFF94 minimization. The Perform MMFF94 Minimization dialog box appears
and the Enable Multiprocessor support option is displayed under Preferences tab.
Figure 8.1 The Perform MMFF94 Minimization dialog box with Preferences tab selected.
Displaying MMFF94 Atom TypesYou can display the MMFF94 atom types for your model without performing calculations. The Atom Property table lists each atom, its atom type, and its charge.To view the list of MMFF94 atom types in your model:
1. Go to View>Atom Property Table.2. Go to Calculations>MMFF94>Set Up
MMFF94 Atom Types and Charges.
Calculating potential energyYou can perform an MMFF94 calculation of the potential energy for your model. You don’t need to perform an energy minimization beforehand.
1. Go to Calculations>MMFF94>Calculate MMFF94 Energy and Gradient.
2. Go to View>Atom Property Table to view the results.
The non-bonded energy represents the pair-wise sum of all the energies of all possible
1. The MMFF94 force field is avail-able in ChemBio3D Ultra.
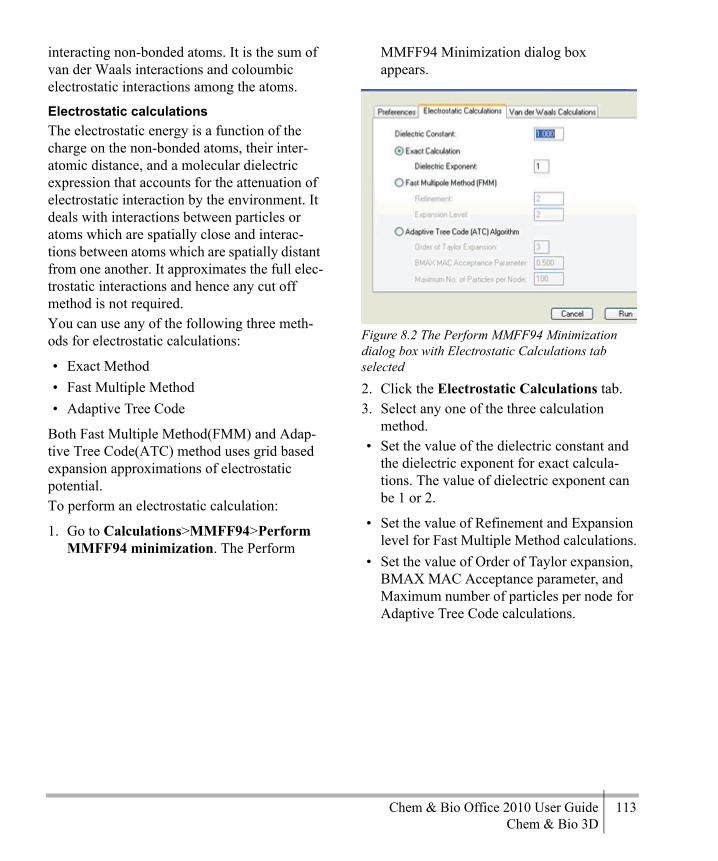
Chem & Bio Office 2010 User Guide 113Chem & Bio 3D
interacting non-bonded atoms. It is the sum of van der Waals interactions and coloumbic electrostatic interactions among the atoms.
Electrostatic calculationsThe electrostatic energy is a function of the charge on the non-bonded atoms, their inter-atomic distance, and a molecular dielectric expression that accounts for the attenuation of electrostatic interaction by the environment. It deals with interactions between particles or atoms which are spatially close and interac-tions between atoms which are spatially distant from one another. It approximates the full elec-trostatic interactions and hence any cut off method is not required. You can use any of the following three meth-ods for electrostatic calculations:
• Exact Method• Fast Multiple Method• Adaptive Tree Code
Both Fast Multiple Method(FMM) and Adap-tive Tree Code(ATC) method uses grid based expansion approximations of electrostatic potential.To perform an electrostatic calculation:
1. Go to Calculations>MMFF94>Perform MMFF94 minimization. The Perform
MMFF94 Minimization dialog box appears.
Figure 8.2 The Perform MMFF94 Minimization dialog box with Electrostatic Calculations tab selected
2. Click the Electrostatic Calculations tab.3. Select any one of the three calculation
method.• Set the value of the dielectric constant and
the dielectric exponent for exact calcula-tions. The value of dielectric exponent can be 1 or 2.
• Set the value of Refinement and Expansion level for Fast Multiple Method calculations.
• Set the value of Order of Taylor expansion, BMAX MAC Acceptance parameter, and Maximum number of particles per node for Adaptive Tree Code calculations.

114 Force Field CalculationsChapter 8
4. Click Run. The output window displays the calculation result.
NOTE: When using either the FMM or ATC, it is strongly recommended that you use one of the Van der Waals cutoff techniques as well, or the Van der Waals terms will still scale as N2 time where N is the number of atoms.
van der Waals calculationsvan der Waals attraction occurs at short range, and rapidly dies off as the interacting atoms move apart by a few angstroms. Repulsion occur when the distance between interaction atoms becomes even slightly less than the sum of their contact radii. van der Waal calculation is a non-bonded energy calculation. As the number of atoms increases, van der waals cal-culations may become time consuming. Chem & Bio 3D 12.0 introduces three cut off tech-niques that prevent van der Waals calculations from scaling in time as the number of atoms increases:
• Shift function• Switching function• Truncation function
NOTE: The new cut off techniques is available only when Exact Calculation is unchecked.
To perform van der waals calculation:
1. Go to Calculations>MMFF94>Perform MMFF94 minimization. The Perform
MMFF94 Minimization dialog box appears.
2. Click Van der Waals Calculations tab.3. To run the calculation using a cut off tech-
nique, un-check Exact calculation check box.
4. Select any one of the three cut off tech-niques and set the value of its correspond-ing parameter.
5. Click Run. The output window displays the calculation result.
A warning is displayed if any error occurs and the focus is shifted to the tab/field that caused the error.
Energy MinimizationOne of the most common applications for either method is performing energy minimiza-tion calculations. When you build you model, the location for each atom may not accurately represent the atom’s location in the actual mol-ecule. Your model may depict high-energy strain at various bonds or conformational strain between atoms. As a result, your model may not accurately represent the molecule.
Chem & Bio Office 2010 User Guide 115Chem & Bio 3D
To correct your model, you may consider per-forming an MM2 or MMFF94 energy minimi-zation calculation. When you do, Chem & Bio 3D examines your model and identifies its var-ious atom types. It then calculates a new posi-tion of each atom so that the cumulative potential energy for your model is minimized. Having calculated each new position, Chem & Bio 3D moves each atom in your model so that the total energy is at a minimum.You cannot minimize energy in models con-taining phosphate groups drawn with double bonds. For information on how to create a model with phosphate groups you can mini-mize, see the Chem3D Drawing FAQ at:http://www.cambridgesoft.com/services/Desk-topSupport/KnowledgeBase/FAQ/details/Default.aspx?TechNote=91 At the Web site, select Chem3D from the Prod-uct dropdown list.
Conformation SamplingStochastic conformation sampling is a method for determining the likely conformations of a molecule by starting with an initial structure, atomic coordinates and defined bonds.Each of the atom's initial X, Y and Z coordi-nates are modified by the combination there with of random numbers to create a new ran-dom coordinate position. The distorted conformation is then minimized using MMFF94 calculations and stored. Then a new set of random numbers, combined with the atomic coordinates and the steric energy of the new structure, is calculated.To perform conformation sampling:
1. Go to Calcula-tions>MMFF94>MMFF94Stochastic Conformation Sampling. A dialog box appears.
2. Specify the maximum random offset value.3. Specify the number of minimal conforma-
tions to be displayed.4. Specify the maximum number of steps of
minimization.5. Click Run. The result appears in the output
window.
NOTE: The stochastic method of conformation sampling is not applicable to macromolecules.
Minimizing model energyYou can perform a minimization using either of the force fields–MMFF94 or MM2.MMFF94To perform an MMFF94 minimization:
1. Go to Calculations>MMFF94>Do MMFF94 Minimization. The Do MMF94 Minimization dialog box appears.
2. Under Preferences tab in the Do MMFF94 Minimization dialog box, select any of the following options:
• Display Every Iteration-Select this option to view the model during the calculation. Remember that displaying or recording each iteration may increase the time required to minimize the structure.
• Copy Measurements to Output Box -View each measurement in the Output win-dow.
• Setup new Atom Types before Calcula-tion - When this option is selected, Chem & Bio 3D will delete any custom MMFF94 atom types you have defined for your model. Deselect this option if you want to keep them.

116 Force Field CalculationsChapter 8
• Setup new Atom Charges before Calcu-lation - When this option is selected, Chem & Bio 3D 12.0 will replace any custom charges you have entered in the Atom Prop-erty table. To retain the charges you have entered, deselect this option.
3. Click Run. The result appears in the output window.
ENERGY MINIMIZATION USING MM2To minimize the energy of the molecule based on MM2 force field:
1. Build the model whose energy is to be min-imized.
2. To constrain measurements, set Optimal col-umn measurements in the Measurement table (go to View>Measurement table).
3. Go to Calculations>MM2>Minimize Energy.4. In the Minimization Energy dialog box,
select any of the following options and click Run:
• Minimum RMS Gradient-Specify the convergence criteria for the gradient of the potential energy surface. Use a large val-ues for shorter calculation time but less accurate results. Use a smaller value for more accurate results but longer calcula-tion time. (The default value of 0.100 is a reasonable compromise).
• Display Every Iteration-Select this option to view the model during the calcu-lation. Remember that displaying each iteration may significantly slow down the calculation.
• Copy Measurements to Output Box-view the value of each measurement in the Output window.
• Select Move Only Selected Atoms-restrict movement of a selected part of a
model during the minimization. Calcula-tion results are not affected.
NOTE: To interrupt a minimization that is in progress, click Stop in the Computing dialog box.
NOTE: If you plan to make changes to any of the MM2 constants first make a backup copy of the parameter tables. This will ensure that you can get back the values that are shipped with Chem3D, in case you need them.
NOTE: Chem & Bio 3D 12.0 guesses parame-ters if you try to minimize a structure contain-ing atom types not supported by MM2. To view all parameters used in the analysis, See “Show-ing Used Parameters” on page 127.
Data for each iteration appears in the Output window when the calculations begin. (How-ever, if you have not selected the Copy Mea-surements to Output option, only the last iteration is displayed).After the RMS gradient is reduced to less than the requested value, the minimization ends, and the final steric energy components and total appear in the Output window.Intermediate status messages may appear in the Output window. A message appears if the minimization terminates abnormally (usually caused by a poor starting conformation).
Multiple CalculationsIf you want, you can minimize several models simultaneously. If a computation is in progress when you begin minimizing a second model,

Chem & Bio Office 2010 User Guide 117Chem & Bio 3D
the minimization of the second model is delayed until the first one stops. You can perform any action in Chem3D that does not move, add, or delete any part of the model. For example, you can move windows around during minimization, change settings, or scale your model.
Example: Minimizing EthaneEthane is a simple example of minimization, because it has only one minimum-energy (staggered) and one maximum-energy (eclipsed) conformation.To minimize energy in ethane:
1. Go to View>Model Display>Display Mode>Ball & Stick.
2. Draw a model of ethane in an empty win-dow.
3. Go to View>Model Display>Show Serial Numbers.
4. Go to Calculations>MM2>Minimize Energy.5. Click Run.The results of the calculation appear in the Output box. If necessary, use the scroll bar to view all the results.The total steric energy for the conformation is 0.8180 kcal/mol. The 1,4 van der Waals term of 0.6756 dominates the steric energy. This term is due to the H-H repulsion contribution.
NOTE: The values of the energy terms shown are approximate and can vary slightly based on the type of processor used to calculate them.
Dihedral anglesTo view the value of one of the dihedral angles that contributes to the 1,4 van der Waals con-tribution:
1. Select the atoms making up the dihedral angle as shown in the figure below by Shift+clicking H(7), C(2), C(1), and H(4) in that order.
2. Go to Structure>Measurements>Display Dihedral Measurement.
Figure 8.3 Dihedral measurement for ethane
The displayed angle represents the lowest energy conformation for the ethane model.
Using constraint valuesEntering a value in the Optimal column imposes a constraint on the minimization rou-tine. You are increasing the force constant for the torsional term in the steric energy calcula-tion so that you can optimize to the transition state.
1. Select the Trackball tool.

118 Force Field CalculationsChapter 8
2. Reorient the model by dragging the X- and Y-axis rotation bars until you have an end-on view.
Figure 8.4 Ethane model, end-on view
To force a minimization to converge on the transition conformation, set the barrier to rota-tion:
1. In the Measurement table, type 0 in the Opti-mal column for the selected dihedral angle and press Enter.
2. Go to Calculations>MM2>Minimize Energy. The Minimize Energy dialog box appears.
3. Click Run.
Figure 8.5 Minimized ethane, end-on view
When the minimization is complete, the model conforms to the eclipsed structure and the reported energy values appear in the Output window. The energy for this eclipsed confor-mation is higher relative to the staggered form. The majority of the energy contribution is from
the torsional energy and the 1,4 van der Waals interactions.
NOTE: The values of the energy terms shown here are approximate and can vary slightly based on the type of processor used to calculate them.
Figure 8.6 Output for eclipsed ethane model
The dihedral angle in the Actual column becomes 0, corresponding to the imposed con-straint.The difference in energy between the global minimum (Total, previous calculation) and the transition state (Total, this calculation) is 2.50 kcal/mole, which is in agreement with litera-ture values.To further illustrate points about minimization, delete the value from the Optimal column for the dihedral angle. Then, click the MM2 icon on the Calculation toolbar.After the minimization is complete, you are still at 0 degrees. This is an important consider-ation for working with the MM2 minimizer. It uses first derivatives of energy to determine the next logical move to lower the energy. However, for saddle points (transition states), the region is fairly flat and the minimizer is satisfied that a minimum is reached. If you sus-pect your starting point is not a minimum, try
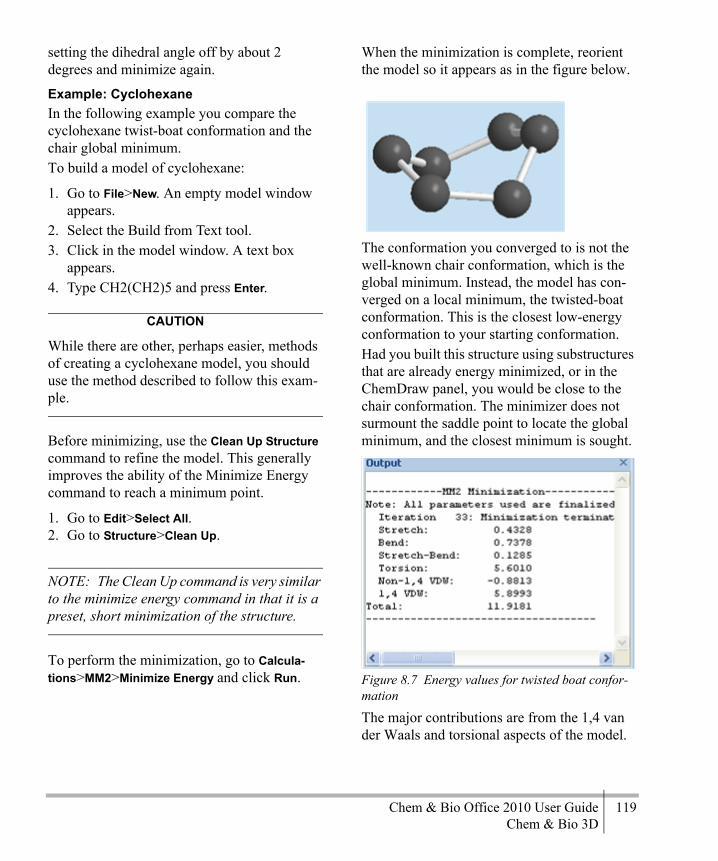
Chem & Bio Office 2010 User Guide 119Chem & Bio 3D
setting the dihedral angle off by about 2 degrees and minimize again.
Example: CyclohexaneIn the following example you compare the cyclohexane twist-boat conformation and the chair global minimum.To build a model of cyclohexane:
1. Go to File>New. An empty model window appears.
2. Select the Build from Text tool.3. Click in the model window. A text box
appears.4. Type CH2(CH2)5 and press Enter.
CAUTION
While there are other, perhaps easier, methods of creating a cyclohexane model, you should use the method described to follow this exam-ple.
Before minimizing, use the Clean Up Structure command to refine the model. This generally improves the ability of the Minimize Energy command to reach a minimum point.
1. Go to Edit>Select All.2. Go to Structure>Clean Up.
NOTE: The Clean Up command is very similar to the minimize energy command in that it is a preset, short minimization of the structure.
To perform the minimization, go to Calcula-tions>MM2>Minimize Energy and click Run.
When the minimization is complete, reorient the model so it appears as in the figure below.
The conformation you converged to is not the well-known chair conformation, which is the global minimum. Instead, the model has con-verged on a local minimum, the twisted-boat conformation. This is the closest low-energy conformation to your starting conformation. Had you built this structure using substructures that are already energy minimized, or in the ChemDraw panel, you would be close to the chair conformation. The minimizer does not surmount the saddle point to locate the global minimum, and the closest minimum is sought.:
Figure 8.7 Energy values for twisted boat confor-mation
The major contributions are from the 1,4 van der Waals and torsional aspects of the model.
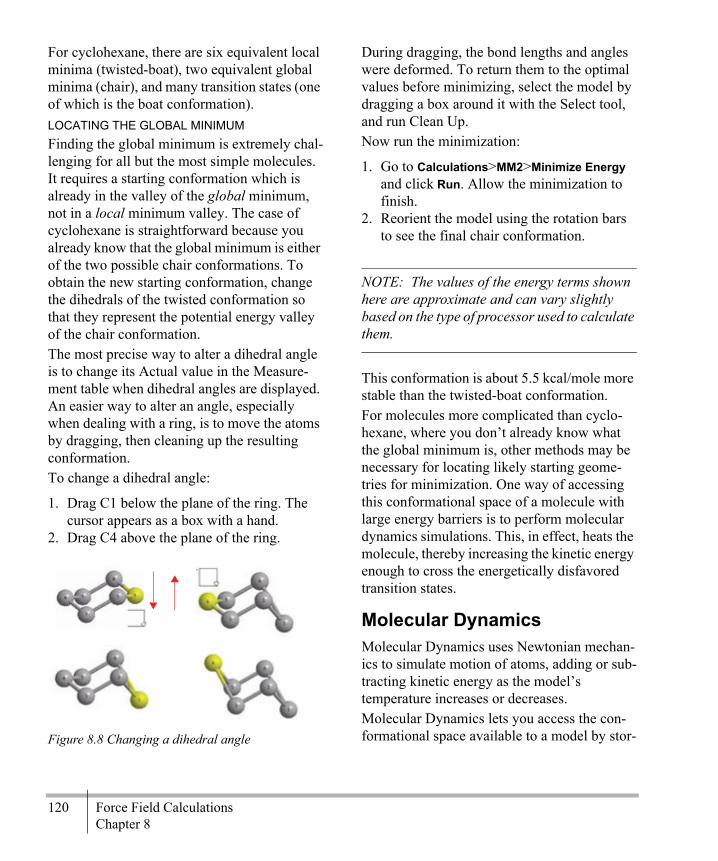
120 Force Field CalculationsChapter 8
For cyclohexane, there are six equivalent local minima (twisted-boat), two equivalent global minima (chair), and many transition states (one of which is the boat conformation).LOCATING THE GLOBAL MINIMUMFinding the global minimum is extremely chal-lenging for all but the most simple molecules. It requires a starting conformation which is already in the valley of the global minimum, not in a local minimum valley. The case of cyclohexane is straightforward because you already know that the global minimum is either of the two possible chair conformations. To obtain the new starting conformation, change the dihedrals of the twisted conformation so that they represent the potential energy valley of the chair conformation.The most precise way to alter a dihedral angle is to change its Actual value in the Measure-ment table when dihedral angles are displayed. An easier way to alter an angle, especially when dealing with a ring, is to move the atoms by dragging, then cleaning up the resulting conformation. To change a dihedral angle:
1. Drag C1 below the plane of the ring. The cursor appears as a box with a hand.
2. Drag C4 above the plane of the ring.
Figure 8.8 Changing a dihedral angle
During dragging, the bond lengths and angles were deformed. To return them to the optimal values before minimizing, select the model by dragging a box around it with the Select tool, and run Clean Up.Now run the minimization:
1. Go to Calculations>MM2>Minimize Energy and click Run. Allow the minimization to finish.
2. Reorient the model using the rotation bars to see the final chair conformation.
NOTE: The values of the energy terms shown here are approximate and can vary slightly based on the type of processor used to calculate them.
This conformation is about 5.5 kcal/mole more stable than the twisted-boat conformation.For molecules more complicated than cyclo-hexane, where you don’t already know what the global minimum is, other methods may be necessary for locating likely starting geome-tries for minimization. One way of accessing this conformational space of a molecule with large energy barriers is to perform molecular dynamics simulations. This, in effect, heats the molecule, thereby increasing the kinetic energy enough to cross the energetically disfavored transition states.
Molecular DynamicsMolecular Dynamics uses Newtonian mechan-ics to simulate motion of atoms, adding or sub-tracting kinetic energy as the model’s temperature increases or decreases.Molecular Dynamics lets you access the con-formational space available to a model by stor-
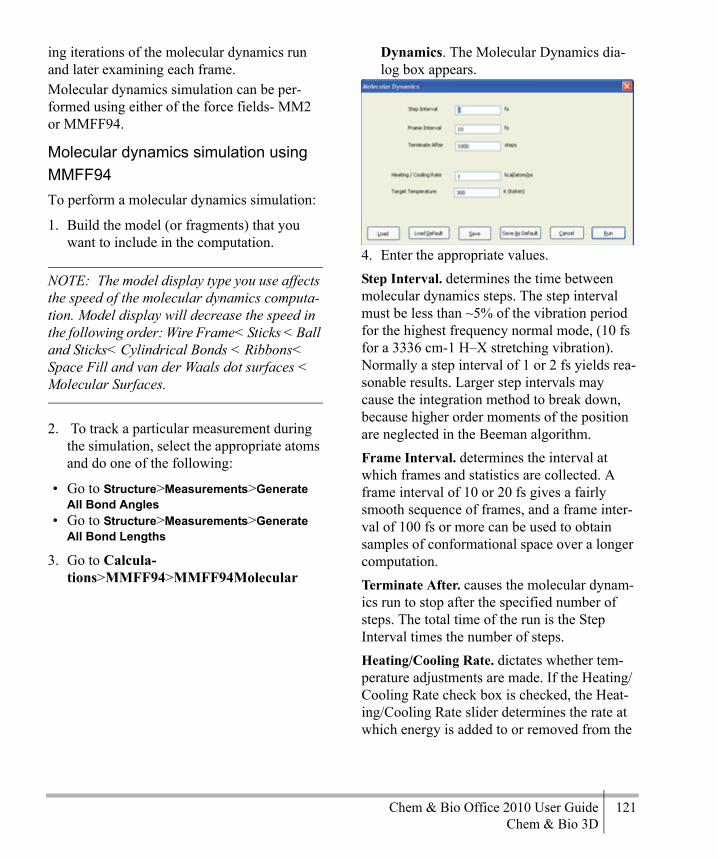
Chem & Bio Office 2010 User Guide 121Chem & Bio 3D
ing iterations of the molecular dynamics run and later examining each frame.Molecular dynamics simulation can be per-formed using either of the force fields- MM2 or MMFF94.
Molecular dynamics simulation using MMFF94To perform a molecular dynamics simulation:
1. Build the model (or fragments) that you want to include in the computation.
NOTE: The model display type you use affects the speed of the molecular dynamics computa-tion. Model display will decrease the speed in the following order: Wire Frame< Sticks < Ball and Sticks< Cylindrical Bonds < Ribbons< Space Fill and van der Waals dot surfaces < Molecular Surfaces.
2. To track a particular measurement during the simulation, select the appropriate atoms and do one of the following:
• Go to Structure>Measurements>Generate All Bond Angles
• Go to Structure>Measurements>Generate All Bond Lengths
3. Go to Calcula-tions>MMFF94>MMFF94Molecular
Dynamics. The Molecular Dynamics dia-log box appears.
4. Enter the appropriate values. Step Interval. determines the time between molecular dynamics steps. The step interval must be less than ~5% of the vibration period for the highest frequency normal mode, (10 fs for a 3336 cm-1 H–X stretching vibration). Normally a step interval of 1 or 2 fs yields rea-sonable results. Larger step intervals may cause the integration method to break down, because higher order moments of the position are neglected in the Beeman algorithm.Frame Interval. determines the interval at which frames and statistics are collected. A frame interval of 10 or 20 fs gives a fairly smooth sequence of frames, and a frame inter-val of 100 fs or more can be used to obtain samples of conformational space over a longer computation.Terminate After. causes the molecular dynam-ics run to stop after the specified number of steps. The total time of the run is the Step Interval times the number of steps.Heating/Cooling Rate. dictates whether tem-perature adjustments are made. If the Heating/Cooling Rate check box is checked, the Heat-ing/Cooling Rate slider determines the rate at which energy is added to or removed from the
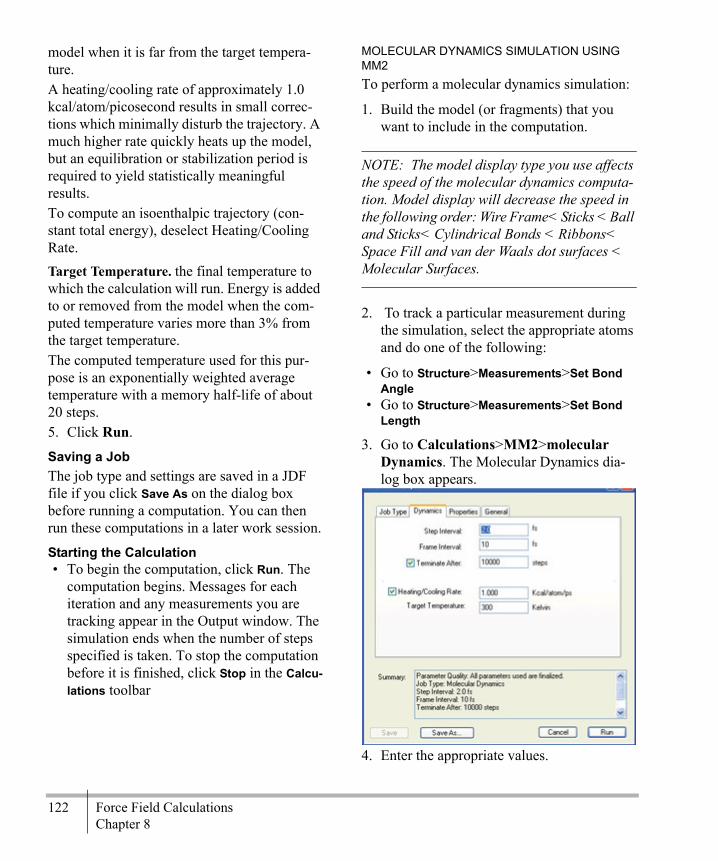
122 Force Field CalculationsChapter 8
model when it is far from the target tempera-ture. A heating/cooling rate of approximately 1.0 kcal/atom/picosecond results in small correc-tions which minimally disturb the trajectory. A much higher rate quickly heats up the model, but an equilibration or stabilization period is required to yield statistically meaningful results.To compute an isoenthalpic trajectory (con-stant total energy), deselect Heating/Cooling Rate.Target Temperature. the final temperature to which the calculation will run. Energy is added to or removed from the model when the com-puted temperature varies more than 3% from the target temperature. The computed temperature used for this pur-pose is an exponentially weighted average temperature with a memory half-life of about 20 steps.5. Click Run.
Saving a JobThe job type and settings are saved in a JDF file if you click Save As on the dialog box before running a computation. You can then run these computations in a later work session.
Starting the Calculation• To begin the computation, click Run. The
computation begins. Messages for each iteration and any measurements you are tracking appear in the Output window. The simulation ends when the number of steps specified is taken. To stop the computation before it is finished, click Stop in the Calcu-lations toolbar
MOLECULAR DYNAMICS SIMULATION USING MM2To perform a molecular dynamics simulation:
1. Build the model (or fragments) that you want to include in the computation.
NOTE: The model display type you use affects the speed of the molecular dynamics computa-tion. Model display will decrease the speed in the following order: Wire Frame< Sticks < Ball and Sticks< Cylindrical Bonds < Ribbons< Space Fill and van der Waals dot surfaces < Molecular Surfaces.
2. To track a particular measurement during the simulation, select the appropriate atoms and do one of the following:
• Go to Structure>Measurements>Set Bond Angle
• Go to Structure>Measurements>Set Bond Length
3. Go to Calculations>MM2>molecular Dynamics. The Molecular Dynamics dia-log box appears.
4. Enter the appropriate values.
Chem & Bio Office 2010 User Guide 123Chem & Bio 3D
Step Interval. determines the time between molecular dynamics steps. The step interval must be less than ~5% of the vibration period for the highest frequency normal mode, (10 fs for a 3336 cm-1 H–X stretching vibration). Normally a step interval of 1 or 2 fs yields rea-sonable results. Larger step intervals may cause the integration method to break down, because higher order moments of the position are neglected in the Beeman algorithm.Frame Interval. determines the interval at which frames and statistics are collected. A frame interval of 10 or 20 fs gives a fairly smooth sequence of frames, and a frame inter-val of 100 fs or more can be used to obtain samples of conformational space over a longer computation.Terminate After. causes the molecular dynam-ics run to stop after the specified number of steps. The total time of the run is the Step Interval times the number of steps.Heating/Cooling Rate. dictates whether tem-perature adjustments are made. If the Heating/Cooling Rate check box is checked, the Heat-ing/Cooling Rate slider determines the rate at which energy is added to or removed from the model when it is far from the target tempera-ture. A heating/cooling rate of approximately 1.0 kcal/atom/picosecond results in small correc-tions which minimally disturb the trajectory. A
much higher rate quickly heats up the model, but an equilibration or stabilization period is required to yield statistically meaningful results.To compute an isoenthalpic trajectory (con-stant total energy), deselect Heating/Cooling Rate.Target Temperature. the final temperature to which the calculation will run. Energy is added to or removed from the model when the com-puted temperature varies more than 3% from the target temperature. The computed temperature used for this pur-pose is an exponentially weighted average temperature with a memory half-life of about 20 steps.5. Click Run.
Saving a JobThe job type and settings are saved in a JDF file if you click Save As on the dialog box before running a computation. You can then run these computations in a later work session.
Starting the CalculationTo begin the computation, click Run. The com-putation begins. Messages for each iteration and any measurements you are tracking appear in the Output window. The simulation ends when the number of steps specified is taken. To stop the computation before it is finished, click Stop in the Calculations toolbar.

124 Force Field CalculationsChapter 8
Job Type SettingsUse the Job Type tab to set options for the computation.
Figure 8.9 The Job Type tab
Select the appropriate options:
To begin the computation:• Click Run.
The computation begins. Messages for each iteration and any measurements you are track-ing appear in the Output window. If you have chosen to Record each iteration, the Movie menu commands (and Movie tool-bar icons) will be active at the end of the com-putation.The simulation ends when the number of steps specified is taken.To stop the computation prematurely:• Click Stop in the Computation dialog box.
EXAMPLE: COMPUTING THE MOLECULAR DYNAMICS TRAJECTORY FOR A SHORT SEGMENT OF POLYTETRAFLUOROETHYLENE (PTFE)To build the model:
1. Go to File>New.
If you want to … Then Click …
record each iteration as a frame in a movie for later replay
Show Step Infor-mation.
track a particular measure-ment
Copy Measure-ments to Output.
restrict movement of a selected part of a model during the minimization
Move Only Selected Atoms.
save a file containing the Time (in picoseconds), Total Energy, Potential Energy, and Temperature data for each step.
Click Save Step Data In and browse to choose a location for storing this file.
The word “heating” or “cooling” appears for each step in which heating or cooling was performed. A summary of this data appears in the Message window each time a new frame is created.

Chem & Bio Office 2010 User Guide 125Chem & Bio 3D
2. Select the Build from Text tool.3. Click in the model window. A text box
appears.4. Type F(C2F4)6F and press Enter.A polymer segment consisting of six repeat units of tetrafluoroethylene appears in the model window. To perform the computation:
1. Select C(2), the leftmost terminal carbon, then Shift+click C(33), the rightmost termi-nal carbon.
2. Go to Structure>Measurements>Display Distance Measurement.
A measurement for the overall length of the molecule appears in the Measurement table. 3. Go to Calculations>MM2>Molecular Dynam-
ics.4. Click Run.When the calculation begins, the Output Win-dow appears.
Figure 8.10 C(2) - C(33) distance before calculation
The C(2)-C(33) distance for the molecule before the molecular dynamics calculation began is approximately 9.4Å. 5. Scroll down to the bottom of the Output
window and examine the C(2)-C(33) dis-
tance for the molecule at 0.190 picosec-onds.
Figure 8.11 C(2) - C(33) distance after calculation
The C(2)-C(33) distance is approximately 13.7Å, 42% greater than the initial C(2)-C(33) distance.
Compute PropertiesCompute Properties represents a single point energy computation that reports the total steric energy for the current conformation of a model (the active frame, if more than one exists).
NOTE: The Steric Energy is computed at the end of an MM2 Energy minimization.
A comparison of the steric energy of various conformations of a molecule gives you infor-mation on the relative stability of those confor-mations.
NOTE: In cases where parameters are not available because the atom types in your model are not among the MM2 atom types supported, Chem3D will attempt an educated guess. You can view the guessed parameters by using the Show Used Parameters command after the analysis is completed.
Compare the steric energies of cis- and trans-2-butene.
Selected

126 Force Field CalculationsChapter 8
To build trans-2-butene and compute proper-ties:
1. Go to File>New.2. Select the Build from Text tool.3. Click in the model window. A text box
appears.4. Type trans-2-butene and press Enter.A molecule of trans-2-butene appears in the model window. 5. Go to Calculations>MM2>Compute Proper-
ties. The Compute Properties dialog box appears.
6. Click Run.The Output window appears. When the steric energy calculation is complete, the individual steric energy terms and the total steric energy appear.Use the Output window scroll bar to view all of the output. The units are kcal/mole for all terms. At the beginning of the computation the first message indicates that the parameters are of Quality=4 meaning that they are experimen-tally determined/verified parameters.
NOTE: The values of the energy terms shown here are approximate and can vary slightly based on the type of processor used to calculate them.
The following values are displayed:
• Stretch represents the energy associated with distorting bonds from their optimal length.
• Bend represents the energy associated with deforming bond angles from their optimal values.
• Stretch-Bend term represents the energy required to stretch the two bonds involved
in a bond angle when that bond angle is severely compressed.
• Torsion term represents the energy associ-ated with deforming torsional angles in the molecule from their ideal values.
• Non-1,4 van der Waals term represents the energy for the through-space interaction between pairs of atoms that are separated by more than three atoms.
For example, in trans-2-butene, the Non-1,4 van der Waals energy term includes the energy for the interaction of a hydrogen atom bonded to C(1) with a hydrogen atom bonded to C(4).
• 1,4 van der Waals represents the energy for the through-space interaction of atoms sep-arated by two atoms. For example, in trans-2-butene, the 1,4 van der Waals energy term includes the energy for the interaction of a hydrogen atom bonded to C(1) with a hydrogen atom bonded to C(2).
• The Dipole/Dipole steric energy represents the energy associated with the interaction of bond dipoles. For example, in trans-2-butene, the Dipole/Dipole term includes the energy for the interaction of the two C Alkane/C Alkene bond dipoles.
To build a cis-2-butene and compute proper-ties:
1. Go to Edit>Clear to delete the model.2. Double-click in the model window. A text
box appears.3. Type cis-2-butene and press Enter.A molecule of cis-2-butene appears in the model window. 4. Go to Calculations>MM2>Compute Proper-
ties. The steric energy terms for cis-2-butene appears in the Output window.
5. Click Run.
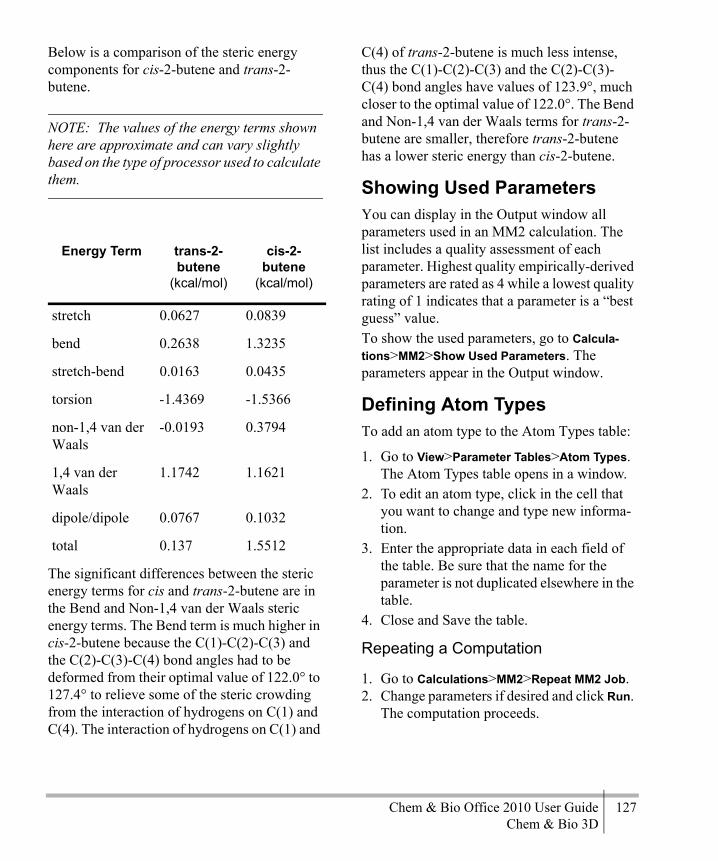
Chem & Bio Office 2010 User Guide 127Chem & Bio 3D
Below is a comparison of the steric energy components for cis-2-butene and trans-2-butene.
NOTE: The values of the energy terms shown here are approximate and can vary slightly based on the type of processor used to calculate them.
The significant differences between the steric energy terms for cis and trans-2-butene are in the Bend and Non-1,4 van der Waals steric energy terms. The Bend term is much higher in cis-2-butene because the C(1)-C(2)-C(3) and the C(2)-C(3)-C(4) bond angles had to be deformed from their optimal value of 122.0° to 127.4° to relieve some of the steric crowding from the interaction of hydrogens on C(1) and C(4). The interaction of hydrogens on C(1) and
C(4) of trans-2-butene is much less intense, thus the C(1)-C(2)-C(3) and the C(2)-C(3)-C(4) bond angles have values of 123.9°, much closer to the optimal value of 122.0°. The Bend and Non-1,4 van der Waals terms for trans-2-butene are smaller, therefore trans-2-butene has a lower steric energy than cis-2-butene.
Showing Used ParametersYou can display in the Output window all parameters used in an MM2 calculation. The list includes a quality assessment of each parameter. Highest quality empirically-derived parameters are rated as 4 while a lowest quality rating of 1 indicates that a parameter is a “best guess” value.To show the used parameters, go to Calcula-tions>MM2>Show Used Parameters. The parameters appear in the Output window.
Defining Atom TypesTo add an atom type to the Atom Types table:
1. Go to View>Parameter Tables>Atom Types. The Atom Types table opens in a window.
2. To edit an atom type, click in the cell that you want to change and type new informa-tion.
3. Enter the appropriate data in each field of the table. Be sure that the name for the parameter is not duplicated elsewhere in the table.
4. Close and Save the table.
Repeating a Computation
1. Go to Calculations>MM2>Repeat MM2 Job.2. Change parameters if desired and click Run.
The computation proceeds.
Energy Term trans-2-butene
(kcal/mol)
cis-2-butene
(kcal/mol)
stretch 0.0627 0.0839
bend 0.2638 1.3235
stretch-bend 0.0163 0.0435
torsion -1.4369 -1.5366
non-1,4 van der Waals
-0.0193 0.3794
1,4 van der Waals
1.1742 1.1621
dipole/dipole 0.0767 0.1032
total 0.137 1.5512

128 Force Field CalculationsChapter 8

Chem & Bio Office 2010 User Guide 129Chem & Bio 3D
Exporting ModelsYou can export a model to other applications as a picture or in chemical notation. Two graphic formats are available: bitmap and EMF; and, three notation formats: ChemDraw structure, SMILES, and InChI™1.
NOTE: Chemical notation formats are mostly suitable for exporting smaller models. You should be aware of the limitations of the format before using it.
You can also export an embedded object that uses the Chem & Bio 3D ActiveX Control to manipulate the object.
Using the Clipboard When exporting in a graphic format, the size of the file that you copy to the clipboard from Chem & Bio 3D is determined by the size of the Chem & Bio 3D model window. If you want the size of a copied molecule to be smaller or larger, resize the model window accordingly before you copy it. If the model windows for several models are the same size, and Fit Model to Window is on, then the mod-els should copy as the same size.
Copying to other applicationsYou can transfer information to Chem & Bio-Draw, MicroSoft Word, PowerPoint, and other desktop applications as a 3D picture or as a 2D drawing.To copy and paste a model as a 3D picture:
1. Select the model.2. Go to Edit>Copy As and choose either Bit-
map or Enhanced Metafile.3. In the other software application, paste the
model into an open file. For example, in ChemDraw, go to Edit>Paste.
NOTE: The model is imported as a bitmap or EMF graphic and contains no structural infor-mation.
To transfer a model as a 2D drawing:
1. Select the model.2. Go to Edit>Copy As>ChemDraw Structure.3. In the other software application, paste the
model into an open file. For example, in ChemDraw, go to Edit>Paste. The model is pasted into ChemDraw.
SMILES and InChI™
To copy the model as a SMILES or InChI string, select the model and go to Edit>Copy As and choose either SMILES or InChI.
9
1. InChI™ is a registered trademark of the International Union of Pure and Applied Chemistry. InChI™ Material in Chem & Bio 3D is © IUPAC 2005.
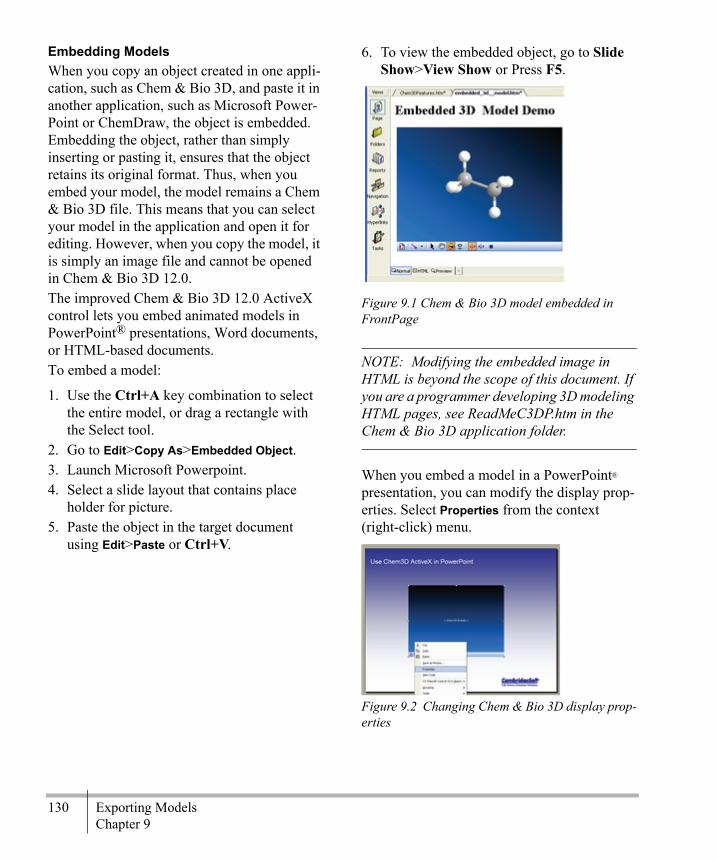
130 Exporting ModelsChapter 9
Embedding ModelsWhen you copy an object created in one appli-cation, such as Chem & Bio 3D, and paste it in another application, such as Microsoft Power-Point or ChemDraw, the object is embedded. Embedding the object, rather than simply inserting or pasting it, ensures that the object retains its original format. Thus, when you embed your model, the model remains a Chem & Bio 3D file. This means that you can select your model in the application and open it for editing. However, when you copy the model, it is simply an image file and cannot be opened in Chem & Bio 3D 12.0.The improved Chem & Bio 3D 12.0 ActiveX control lets you embed animated models in PowerPoint® presentations, Word documents, or HTML-based documents. To embed a model:
1. Use the Ctrl+A key combination to select the entire model, or drag a rectangle with the Select tool.
2. Go to Edit>Copy As>Embedded Object.3. Launch Microsoft Powerpoint.4. Select a slide layout that contains place
holder for picture.5. Paste the object in the target document
using Edit>Paste or Ctrl+V.
6. To view the embedded object, go to Slide Show>View Show or Press F5.
Figure 9.1 Chem & Bio 3D model embedded in FrontPage
NOTE: Modifying the embedded image in HTML is beyond the scope of this document. If you are a programmer developing 3D modeling HTML pages, see ReadMeC3DP.htm in the Chem & Bio 3D application folder.
When you embed a model in a PowerPoint® presentation, you can modify the display prop-erties. Select Properties from the context (right-click) menu.
Figure 9.2 Changing Chem & Bio 3D display prop-erties

Chem & Bio Office 2010 User Guide 131Chem & Bio 3D
Listed below are the properties you can change in an embedded object.DataURL. Normally left blank. You can refer-ence a file rather than using cut-paste, but the slide presentation may not have access to that file later.EncodeData. Cannot be changed.Fullscreen. Cannot be changed.Height. Defines the height of the object win-dow.Left. Defines the placement of the left edge of the object window.Modified. Cannot be changed.Rotation. Specifies the model rotation. Enter data in the following format: axis speed (angle)Angle can be X, Y, or Z or a combination, for example: XY. Speed may be 0-5, but the default setting of 1 generally gives best results. Specifying an angle means that the model will rock rather than spin. For example, x 1 45 will rock the model on the X axis at speed 1 through an angle of 45°. ShowContextMenu. Shows/hides right-click menus in the object window.
ShowRotationBar. Shows/hides the Rotation toolbar.ShowToolbar. Determines placement of the Toolbar (left, right, top, bottom) or hides the toolbar.Top. Defines the top of the object window., measured from the top of the slide.Visible. Shows/hides the object window.Width. Defines the width of the object win-dow.
Background Effects and ImagesChem & Bio 3D 12.0 has nearly two dozen background effects for presenting images. You can also insert an image into the background, to display your company’s logo or for visual effect.

132 Exporting ModelsChapter 9

Chem & Bio Office 2010 User Guide 133Chem & Bio 3D
CS GAMESS Computations CS GAMESS OverviewThe CambridgeSoft General Atomic and Molecular Electronic Structure System (CS GAMESS) is a general ab initio quantum chemistry package. It computes wavefunctions using RHF, ROHF, UHF, GVB, and MCSCF. CI and MP2 energy corrections are available for some of these. CS GAMESS is a command-line application, which requires a user to type text-based com-mands and data. Chem & Bio 3D 12.0 serves as a front-end graphical user interface (GUI), allowing you create and run CS GAMESS jobs from within the application. The CS GAMESS application is installed auto-matically with Chem & Bio 3D 12.0. You must, however, accept a license agreement and register the software before you can use it. Chem & Bio 3D 12.0 does this automatically the first time you use the CS GAMESS compu-tation option. The computation options on the CS GAMESS interface menu are:
• Minimize Energy• Optimize to Transition State• Compute Properties• Run Frequency• Predict IR/Raman Spectra• Predict NMR Spectra
When you choose one of these options, The CS GAMESS interface dialog box appears, with the recommended default parameters for that computation chosen. You may change parame-ters on any of the tabbed pages of the dialog box before running the computation. Thus, the options are a convenience in that they insert defaults. If you know what parameter settings you want to use, you can run any computation using any of the options as a starting point. If you are familiar with the CS GAMESS key-words, you can choose Use Advanced Mode and get a GUI version of the command line interface.
Minimizing EnergyTo perform a CS GAMESS Minimize Energy1 computation on a model:
1. Go to Calculations>GAMESS>Minimize Energy. The Minimize Energy dialog box appears with the Job & Theory tab dis-played.
2. Use the tabs to customize your computa-tion. See the following sections for details.
3. Click Run.
10
1. Minimizing Energy using CS GAMESS is available only with Chem & Bio 3D Ultra.

134 CS GAMESS ComputationsChapter 10
The Job & Theory TabUse the Job & Theory tab to specify the combi-nation of basis set and particular electronic structure theory. By default, this tab is opti-mized for setting up ab initio computations. For more detailed information, see the $BASIS section of the CS GAMESS documentation.To specify the calculation settings:
1. From the Method list, choose a method.2. From the Wave Function list, choose a func-
tion. 3. From the Basis Set list, choose the basis set.
NOTE: To use a Method or Basis Set that is not on the list, type it in the Additional Keywords section on the General tab. For more informa-tion, see “Specifying the General Settings” on page 135.
4. From the Diffuse list, select the diffuse function to add to the basis set.
5. Set the Polarization functions. If you select a function for Heavy Atom, also select an H option.
6. Select a Spin Multiplicity value between 1 and 10.
The General TabUse the General tab to set options for display and recording results of calculations.To set the job type options:
1. In the Minimize Energy dialog box, click the Job Type tab.
2. Select the appropriate options:
Specifying Properties to ComputeUse the Properties tab to specify which proper-ties are computed. The default Population Anal-ysis type is Mulliken. To specify properties:
If you want to … Then click …
watch the minimi-zation process live at each iteration in the calculation
Display Every Iteration(Displaying or record-ing each iteration adds significantly to the time required to mini-mize the structure.)
store the output in a notepad at the specified location
Send output to note-pad
generate only the output file in CS GAMESS interface folder and avoid generating the input file
Kill temporary files
dump the whole output into the comments box
Send Back Output
aggregate identical protons
Average Equivalent Hydrogens
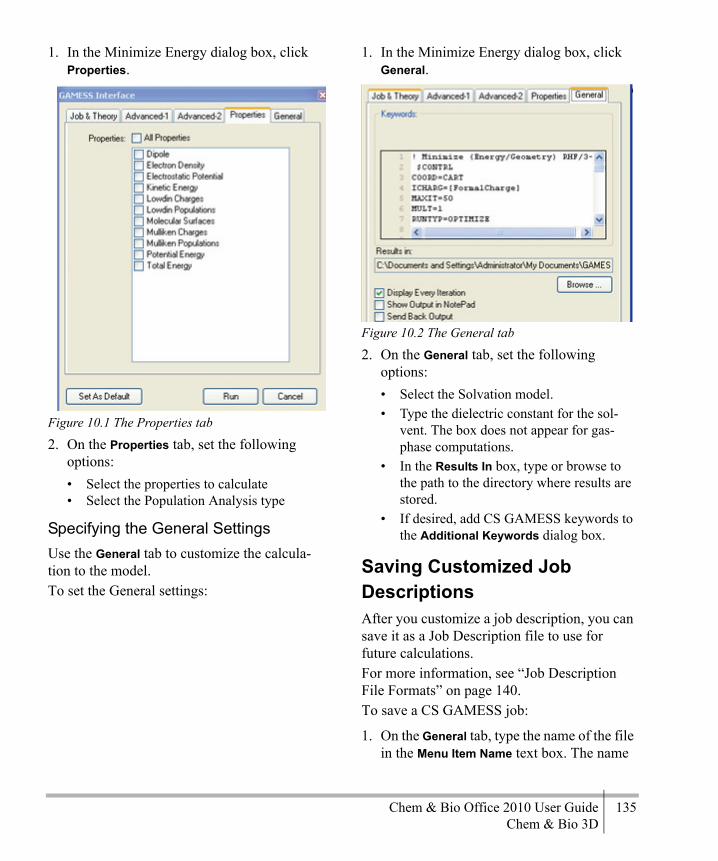
Chem & Bio Office 2010 User Guide 135Chem & Bio 3D
1. In the Minimize Energy dialog box, click Properties.
Figure 10.1 The Properties tab
2. On the Properties tab, set the following options:• Select the properties to calculate• Select the Population Analysis type
Specifying the General SettingsUse the General tab to customize the calcula-tion to the model.To set the General settings:
1. In the Minimize Energy dialog box, click General.
Figure 10.2 The General tab
2. On the General tab, set the following options:• Select the Solvation model.• Type the dielectric constant for the sol-
vent. The box does not appear for gas-phase computations.
• In the Results In box, type or browse to the path to the directory where results are stored.
• If desired, add CS GAMESS keywords to the Additional Keywords dialog box.
Saving Customized Job DescriptionsAfter you customize a job description, you can save it as a Job Description file to use for future calculations.For more information, see “Job Description File Formats” on page 140.To save a CS GAMESS job:
1. On the General tab, type the name of the file in the Menu Item Name text box. The name

136 CS GAMESS ComputationsChapter 10
you choose will appear in the GAMESS menu.
2. Click Save As. The Save dialog box appears.
3. Open the folder: \Chem3D\C3D Extensions\GAMESS Job.
NOTE: You must save the file in the GAMESS Job folder for it to appear in the menu.
4. Select the .jdf or .jdt file type.5. Click Save.Your custom job description appears in the GAMESS menu.
Running a CS GAMESS JobIf you have a previously created an INP GAMESS job file, you can run1 the file in Chem3D.To run the job file:
1. Go to Calculations>GAMESS>Run a Job. The Open dialog box appears.
2. Type the full path of the CS GAMESS file or Browse to location.
3. Click Open. The appropriate dialog box appears.
4. Change settings on the tabs if desired.5. Click Run.
Repeating a CS GAMESS JobAfter a CS GAMESS computation has been performed, you can repeat it using the GAMESS menu.To repeat a CS GAMESS job:
1. Go to the Calculations>GAMESS>Repeat [name of computation]. The appropriate dialog box appears.
2. Change parameters if desired and click Run.
1. Previously created and saved CS GAMESS job file can be run only in Chem & Bio 3D Ultra.

Chem & Bio Office 2010 User Guide 137Chem & Bio 3D
GaussianGaussian is a powerful, command-line driven, computational chemistry application including both ab initio and semi-empirical methods. It is not included in Chem & Bio 3D 12.0 (the Gaussian menu option appears gray) and needs to be installed locally. It can be purchased directly from CambridgeSoft. The latest ver-sion of Gaussian supported by Chem & Bio 3D 12.0 is Gaussian 03 Revision-D.01.Chem & Bio 3D 12.0 provides an interface for Gaussian calculations. The model in the Chem & Bio 3D window transparently provides the data for creating Gaussian jobs or running Gaussian calculations. Version 12.0 supports all Gaussian calculations, offering the follow-ing features:
• 13C and 1H NMR spectra predictions• IR and Raman spectra predictions• Multi-step Jobs• Partial Optimizations• Support for DFT Methods• Advanced Mode
For information on how to use Gaussian, see the documentation supplied with the Gaussian application.
The Gaussian InterfaceThe Gaussian interface offers several Gaussian features, including prediction of NMR, UV, IR, and Raman spectra.
Predicting SpectraUsing Gaussian, Chem & Bio 3D can predict NMR, IR/Raman, and UV/VIS spectra1. To calculate a spectrum, go to Calculations>Gaus-sian Interface and select the spectrum you want.
NOTE: Depending on your computer’s speed and memory, and the size of the model, Gauss-ian calculations may take several minutes.
TIP: Run a minimization before predicting spectra. MM2 is faster than Gaussian minimi-zation, and is usually adequate. Gaussian may fail to produce a spectrum if the model is not at a minimum energy state.
Viewing SpectraTo view the predicted spectra, Go to View>Spectrum Viewer2. For each prediction
11
1. Predicting Spectra using Gaussian is avail-able only for ChemBio 3D Ultra.
2. Viewing Spectra using Gaussian is available only for ChemBio 3D Ultra
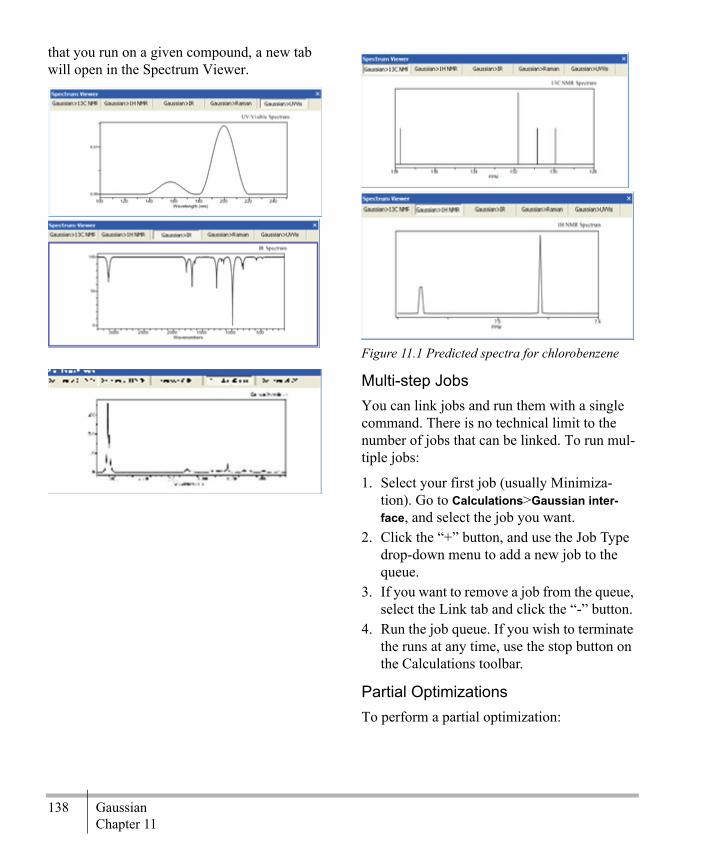
138 GaussianChapter 11
that you run on a given compound, a new tab will open in the Spectrum Viewer.
Figure 11.1 Predicted spectra for chlorobenzene
Multi-step JobsYou can link jobs and run them with a single command. There is no technical limit to the number of jobs that can be linked. To run mul-tiple jobs:
1. Select your first job (usually Minimiza-tion). Go to Calculations>Gaussian inter-face, and select the job you want.
2. Click the “+” button, and use the Job Type drop-down menu to add a new job to the queue.
3. If you want to remove a job from the queue, select the Link tab and click the “-” button.
4. Run the job queue. If you wish to terminate the runs at any time, use the stop button on the Calculations toolbar.
Partial OptimizationsTo perform a partial optimization:

Chem & Bio Office 2010 User Guide 139Chem & Bio 3D
1. Select a portion of the model. You may optimize either the selected or un-selected portion, whichever is more convenient.
2. Select optimization from the Gaussian Inter-face submenu. In the Gaussian Interface dialog box, click the Internal Coordinates radio button.
3. In the Move Which text window, indicate whether the selected or un-selected atoms are to be optimized.
Figure 11.2 Setting up a partial optimization: A) Internal Coordinates
Input TemplateThe General tab of the Gaussian Interface dia-log box contains the input template. You can set output parameters with the check boxes and edit keywords in the run file.
Advanced ModeIf you are an expert user, you can go directly to a text entry window similar to the input tem-plate. Just click Use Advanced Mode on the Gaussian Interface submenu.
Figure 11.3 Advanced Mode
Note the Gaussian 2003 Keywords link under the text window. If you need help, clicking the link opens your web browser to the keywords page of the Gaussian Web site.

140 GaussianChapter 11
Support for DFT MethodsSelecting DFT for Method opens a dialog box where you can choose which DFT method you wish to use.
Figure 11.4 DFT methods
When you have chosen a method, the complete DFT method information is displayed, and a button appears next to the Method text box to allow you to edit your input.
Figure 11.5 DFT display
Optimize to Transition StateTo optimize your model to a transition state, use a conformation that is as close to the transi-tion state as possible. Do not use a local or glo-bal minimum, because the algorithm cannot
effectively move the geometry from that start-ing point.To optimize a transition state:
1. Go to Calculations>Gaussian Inter-face>Optimize to Transition State. The Gaussian Interface dialog box appears, with Optimize to transition state as the default Job Type.
2. You may use the defaults, or set your own parameters.
NOTE: Unless you are an experienced Gauss-ian user, use the Transition State defaults.
3. On the Properties tab, select the properties you wish to calculate from the final opti-mized conformation.
4. On the General tab, type any additional key-words that you want to use to modify the optimization.
5. Click Run.
Computing PropertiesTo specify the parameters for calculations to predict properties of a model:
1. Go to Calculations>Gaussian>Compute Properties. The Gaussian Interface dialog box appears, with the Properties tab selected.
2. Select the properties to estimate.3. Click Run.
Job Description File FormatsJob description files are like Preferences files; they store the settings of the dialog box. There are two types as described below.
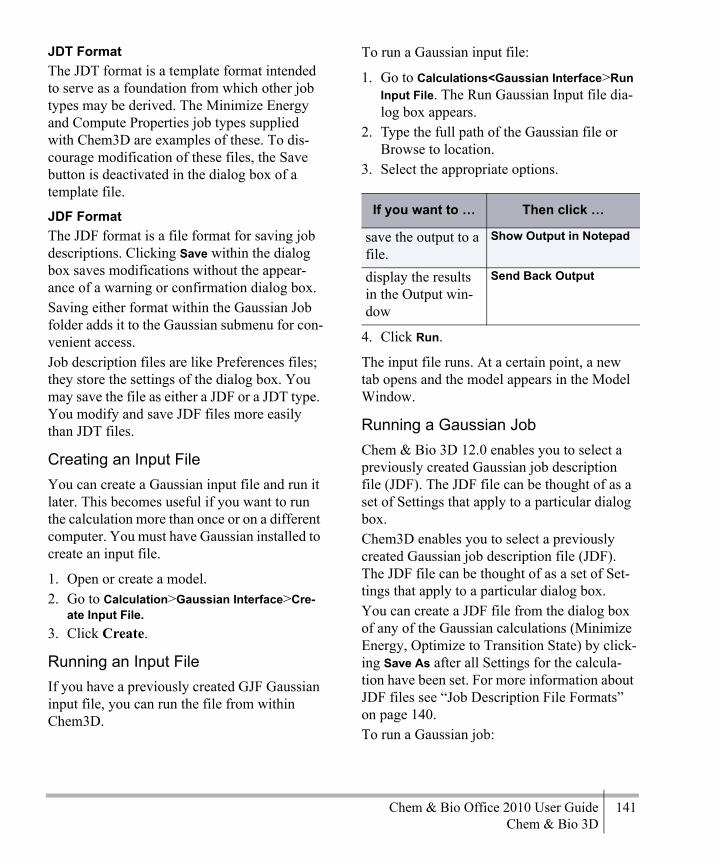
Chem & Bio Office 2010 User Guide 141Chem & Bio 3D
JDT FormatThe JDT format is a template format intended to serve as a foundation from which other job types may be derived. The Minimize Energy and Compute Properties job types supplied with Chem3D are examples of these. To dis-courage modification of these files, the Save button is deactivated in the dialog box of a template file.
JDF FormatThe JDF format is a file format for saving job descriptions. Clicking Save within the dialog box saves modifications without the appear-ance of a warning or confirmation dialog box.Saving either format within the Gaussian Job folder adds it to the Gaussian submenu for con-venient access.Job description files are like Preferences files; they store the settings of the dialog box. You may save the file as either a JDF or a JDT type. You modify and save JDF files more easily than JDT files.
Creating an Input FileYou can create a Gaussian input file and run it later. This becomes useful if you want to run the calculation more than once or on a different computer. You must have Gaussian installed to create an input file.
1. Open or create a model.2. Go to Calculation>Gaussian Interface>Cre-
ate Input File.3. Click Create.
Running an Input FileIf you have a previously created GJF Gaussian input file, you can run the file from within Chem3D.
To run a Gaussian input file:
1. Go to Calculations<Gaussian Interface>Run Input File. The Run Gaussian Input file dia-log box appears.
2. Type the full path of the Gaussian file or Browse to location.
3. Select the appropriate options.
4. Click Run.
The input file runs. At a certain point, a new tab opens and the model appears in the Model Window.
Running a Gaussian JobChem & Bio 3D 12.0 enables you to select a previously created Gaussian job description file (JDF). The JDF file can be thought of as a set of Settings that apply to a particular dialog box. Chem3D enables you to select a previously created Gaussian job description file (JDF). The JDF file can be thought of as a set of Set-tings that apply to a particular dialog box. You can create a JDF file from the dialog box of any of the Gaussian calculations (Minimize Energy, Optimize to Transition State) by click-ing Save As after all Settings for the calcula-tion have been set. For more information about JDF files see “Job Description File Formats” on page 140.To run a Gaussian job:
If you want to … Then click …
save the output to a file.
Show Output in Notepad
display the results in the Output win-dow
Send Back Output

142 GaussianChapter 11
1. From the Gaussian submenu, choose Run Gaussian Job. The Open dialog box appears.
2. Select the file to run. The dialog box corre-sponding to the type of job (Minimize Energy, Compute Properties, and so on.) saved within the file appears.
3. Click Run.
Repeating a Gaussian JobAfter you perform a Gaussian calculation, you can repeat the job as follows:
1. From the Gaussian submenu, choose Repeat [name of computation]. The appro-priate dialog box appears.
2. Change parameters if desired and click Run. The computation proceeds.
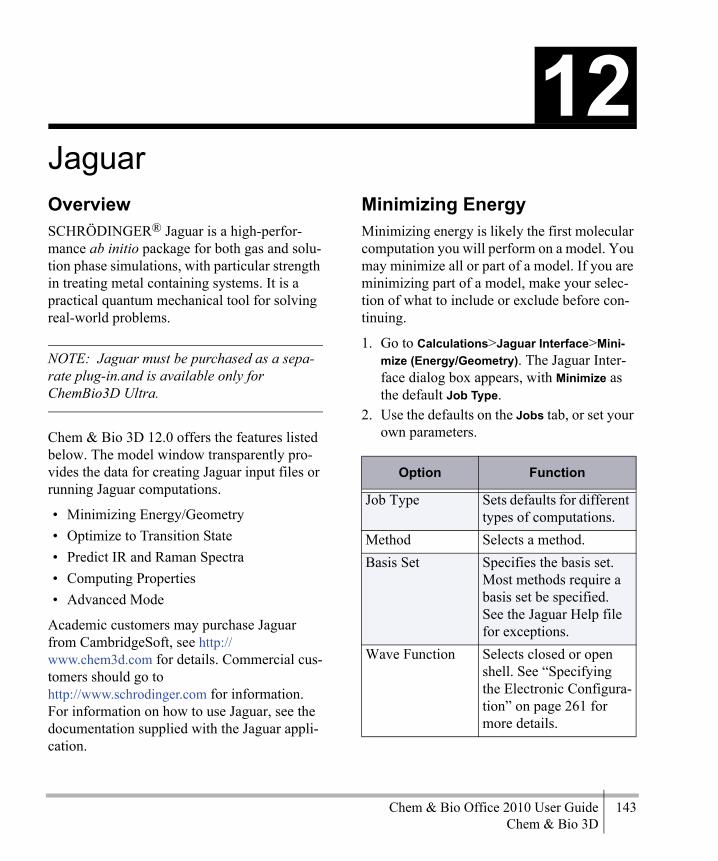
Chem & Bio Office 2010 User Guide 143Chem & Bio 3D
JaguarOverviewSCHRÖDINGER® Jaguar is a high-perfor-mance ab initio package for both gas and solu-tion phase simulations, with particular strength in treating metal containing systems. It is a practical quantum mechanical tool for solving real-world problems.
NOTE: Jaguar must be purchased as a sepa-rate plug-in.and is available only for ChemBio3D Ultra.
Chem & Bio 3D 12.0 offers the features listed below. The model window transparently pro-vides the data for creating Jaguar input files or running Jaguar computations.
• Minimizing Energy/Geometry• Optimize to Transition State• Predict IR and Raman Spectra• Computing Properties• Advanced Mode
Academic customers may purchase Jaguar from CambridgeSoft, see http://www.chem3d.com for details. Commercial cus-tomers should go to http://www.schrodinger.com for information. For information on how to use Jaguar, see the documentation supplied with the Jaguar appli-cation.
Minimizing EnergyMinimizing energy is likely the first molecular computation you will perform on a model. You may minimize all or part of a model. If you are minimizing part of a model, make your selec-tion of what to include or exclude before con-tinuing.
1. Go to Calculations>Jaguar Interface>Mini-mize (Energy/Geometry). The Jaguar Inter-face dialog box appears, with Minimize as the default Job Type.
2. Use the defaults on the Jobs tab, or set your own parameters.
12
Option Function
Job Type Sets defaults for different types of computations.
Method Selects a method.Basis Set Specifies the basis set.
Most methods require a basis set be specified. See the Jaguar Help file for exceptions.
Wave Function Selects closed or open shell. See “Specifying the Electronic Configura-tion” on page 261 for more details.
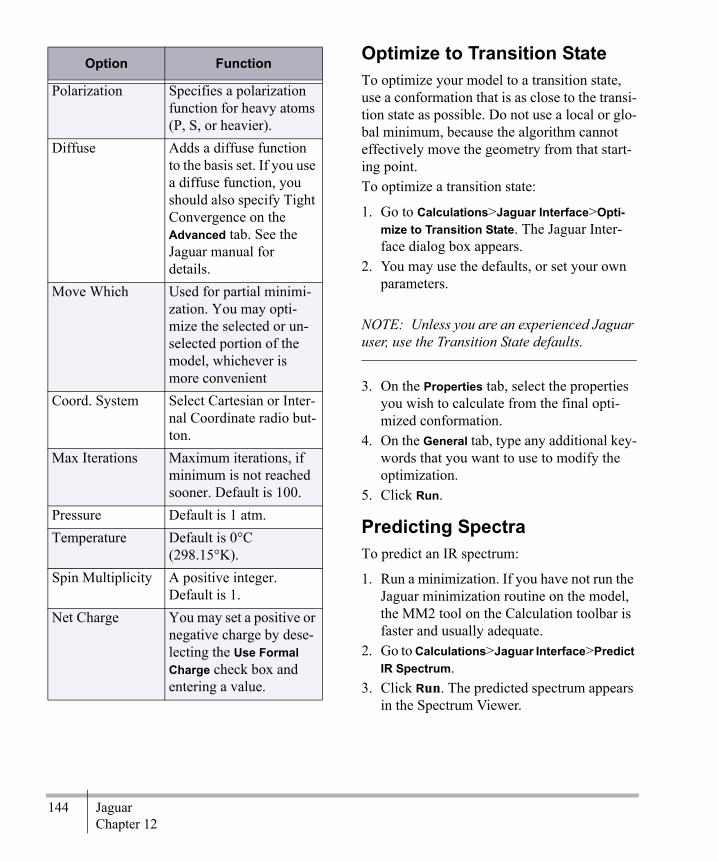
144 JaguarChapter 12
Optimize to Transition StateTo optimize your model to a transition state, use a conformation that is as close to the transi-tion state as possible. Do not use a local or glo-bal minimum, because the algorithm cannot effectively move the geometry from that start-ing point.To optimize a transition state:
1. Go to Calculations>Jaguar Interface>Opti-mize to Transition State. The Jaguar Inter-face dialog box appears.
2. You may use the defaults, or set your own parameters.
NOTE: Unless you are an experienced Jaguar user, use the Transition State defaults.
3. On the Properties tab, select the properties you wish to calculate from the final opti-mized conformation.
4. On the General tab, type any additional key-words that you want to use to modify the optimization.
5. Click Run.
Predicting SpectraTo predict an IR spectrum:
1. Run a minimization. If you have not run the Jaguar minimization routine on the model, the MM2 tool on the Calculation toolbar is faster and usually adequate.
2. Go to Calculations>Jaguar Interface>Predict IR Spectrum.
3. Click Run. The predicted spectrum appears in the Spectrum Viewer.
Polarization Specifies a polarization function for heavy atoms (P, S, or heavier).
Diffuse Adds a diffuse function to the basis set. If you use a diffuse function, you should also specify Tight Convergence on the Advanced tab. See the Jaguar manual for details.
Move Which Used for partial minimi-zation. You may opti-mize the selected or un-selected portion of the model, whichever is more convenient
Coord. System Select Cartesian or Inter-nal Coordinate radio but-ton.
Max Iterations Maximum iterations, if minimum is not reached sooner. Default is 100.
Pressure Default is 1 atm. Temperature Default is 0°C
(298.15°K).Spin Multiplicity A positive integer.
Default is 1.Net Charge You may set a positive or
negative charge by dese-lecting the Use Formal Charge check box and entering a value.
Option Function

Chem & Bio Office 2010 User Guide 145Chem & Bio 3D
Computing PropertiesTo specify the parameters for computations to predict properties of a model:
1. Go to Calculations>Jaguar>Compute Prop-erties. The Jaguar Interface dialog box appears, with the Properties tab selected.
2. Select the properties to estimate.3. Click Run.
Advanced ModeIf you are an expert user, you can go directly to a text entry window similar to the input tem-plate. Just click Use Advanced Mode on the Jaguar Interface submenu. Note the Online Jaguar Keywords link under the text window. If you need help, clicking the link opens your web browser to the keywords page of the Schrödinger Web site.

146 JaguarChapter 12

Chem & Bio Office 2010 User Guide 147Chem & Bio 3D
CS MOPAC CS MOPAC is a molecular computation appli-cation that features several widely-used, semi-empirical methods. CambridgeSoft provides it in two versions, Professional and Ultra.CS MOPAC Pro lets you compute properties and perform energy minimizations, optimize to transition states, and compute properties.CS MOPAC Ultra is available as an optional plug-in.To install either version of CS MOPAC, you must first install Chem & Bio 3D 11.0. Either version of CS MOPAC will work with either version of Chem & Bio 3D.With CS MOPAC you can do the following:
• Minimizing Energy• Optimizing Geometry• Optimizing to a Transition State
• Computing Properties like:
• Locating the Eclipsed Transition State of Ethane
• Example 1: Dipole Moment• Example 2: Cation Stability• Example 3: Charge Distribution• Example 4: The Dipole Moment of m-
Nitrotoluene• Example 5: Phase Stability• Example 6: Hyperfine Coupling Constants• Example 8: RHF Spin Density
• Use CS MOPAC Properties
• Use CS MOPAC files
The procedures assume you have a basic understanding of the computational concepts and terminology of semi-empirical methods, and the concepts involved in geometry optimi-zation (minimization) and single-point compu-tations.
Minimizing EnergyMinimizing energy is generally the first molec-ular computation performed on a model. Go to Calculations>MOPAC Interface>Minimize Energy. The CS MOPAC Interface dialog box appears, with Minimize as a default Job Type.
13
Option Function
Job Type Sets defaults for different types of computations.
Method Selects a method.Wave Function Selects close or open
shell. See “Specifying the Electronic Configura-tion” on page 261 for more details.
Optimizer Selects a geometry mini-mizer. See “Optimizing Geometry” on page 148 for more information.
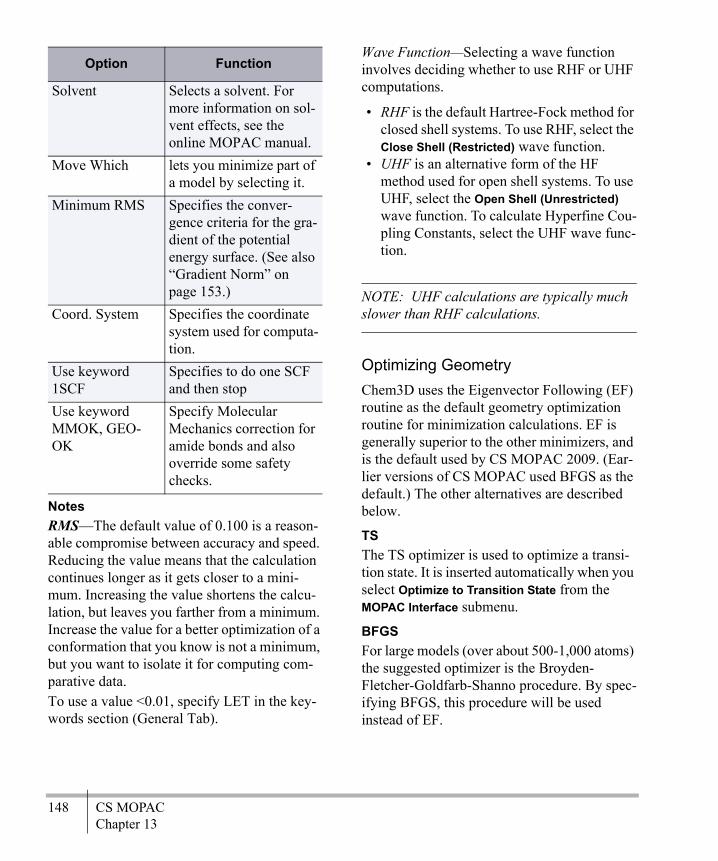
148 CS MOPACChapter 13
NotesRMS—The default value of 0.100 is a reason-able compromise between accuracy and speed. Reducing the value means that the calculation continues longer as it gets closer to a mini-mum. Increasing the value shortens the calcu-lation, but leaves you farther from a minimum. Increase the value for a better optimization of a conformation that you know is not a minimum, but you want to isolate it for computing com-parative data.To use a value <0.01, specify LET in the key-words section (General Tab).
Wave Function—Selecting a wave function involves deciding whether to use RHF or UHF computations.
• RHF is the default Hartree-Fock method for closed shell systems. To use RHF, select the Close Shell (Restricted) wave function.
• UHF is an alternative form of the HF method used for open shell systems. To use UHF, select the Open Shell (Unrestricted) wave function. To calculate Hyperfine Cou-pling Constants, select the UHF wave func-tion.
NOTE: UHF calculations are typically much slower than RHF calculations.
Optimizing GeometryChem3D uses the Eigenvector Following (EF) routine as the default geometry optimization routine for minimization calculations. EF is generally superior to the other minimizers, and is the default used by CS MOPAC 2009. (Ear-lier versions of CS MOPAC used BFGS as the default.) The other alternatives are described below.
TSThe TS optimizer is used to optimize a transi-tion state. It is inserted automatically when you select Optimize to Transition State from the MOPAC Interface submenu.
BFGSFor large models (over about 500-1,000 atoms) the suggested optimizer is the Broyden-Fletcher-Goldfarb-Shanno procedure. By spec-ifying BFGS, this procedure will be used instead of EF.
Solvent Selects a solvent. For more information on sol-vent effects, see the online MOPAC manual.
Move Which lets you minimize part of a model by selecting it.
Minimum RMS Specifies the conver-gence criteria for the gra-dient of the potential energy surface. (See also “Gradient Norm” on page 153.)
Coord. System Specifies the coordinate system used for computa-tion.
Use keyword 1SCF
Specifies to do one SCF and then stop
Use keyword MMOK, GEO-OK
Specify Molecular Mechanics correction for amide bonds and also override some safety checks.
Option Function
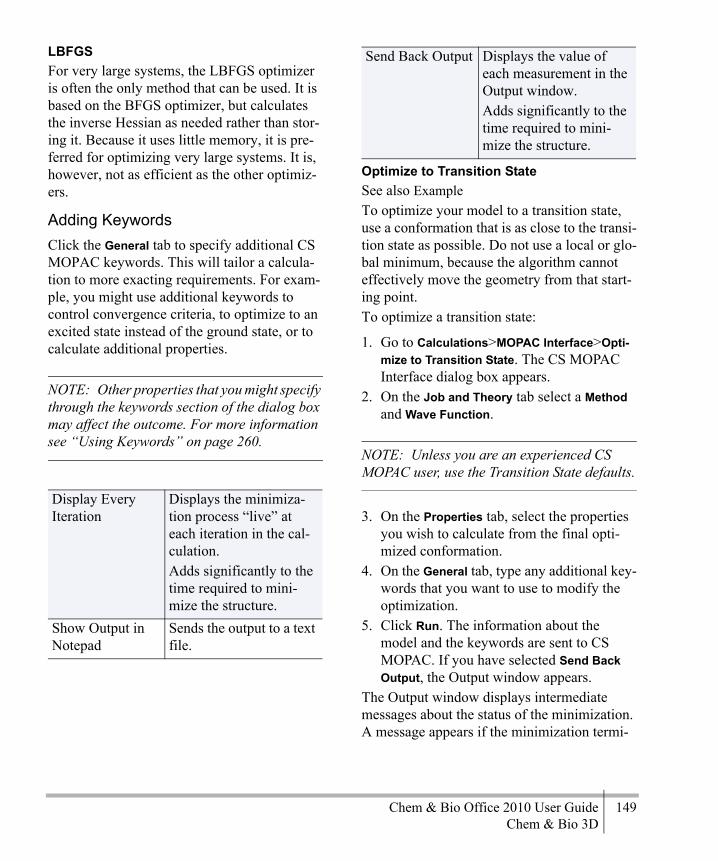
Chem & Bio Office 2010 User Guide 149Chem & Bio 3D
LBFGSFor very large systems, the LBFGS optimizer is often the only method that can be used. It is based on the BFGS optimizer, but calculates the inverse Hessian as needed rather than stor-ing it. Because it uses little memory, it is pre-ferred for optimizing very large systems. It is, however, not as efficient as the other optimiz-ers.
Adding KeywordsClick the General tab to specify additional CS MOPAC keywords. This will tailor a calcula-tion to more exacting requirements. For exam-ple, you might use additional keywords to control convergence criteria, to optimize to an excited state instead of the ground state, or to calculate additional properties.
NOTE: Other properties that you might specify through the keywords section of the dialog box may affect the outcome. For more information see “Using Keywords” on page 260.
Optimize to Transition StateSee also ExampleTo optimize your model to a transition state, use a conformation that is as close to the transi-tion state as possible. Do not use a local or glo-bal minimum, because the algorithm cannot effectively move the geometry from that start-ing point. To optimize a transition state:
1. Go to Calculations>MOPAC Interface>Opti-mize to Transition State. The CS MOPAC Interface dialog box appears.
2. On the Job and Theory tab select a Method and Wave Function.
NOTE: Unless you are an experienced CS MOPAC user, use the Transition State defaults.
3. On the Properties tab, select the properties you wish to calculate from the final opti-mized conformation.
4. On the General tab, type any additional key-words that you want to use to modify the optimization.
5. Click Run. The information about the model and the keywords are sent to CS MOPAC. If you have selected Send Back Output, the Output window appears.
The Output window displays intermediate messages about the status of the minimization. A message appears if the minimization termi-
Display Every Iteration
Displays the minimiza-tion process “live” at each iteration in the cal-culation.Adds significantly to the time required to mini-mize the structure.
Show Output in Notepad
Sends the output to a text file.
Send Back Output Displays the value of each measurement in the Output window.Adds significantly to the time required to mini-mize the structure.
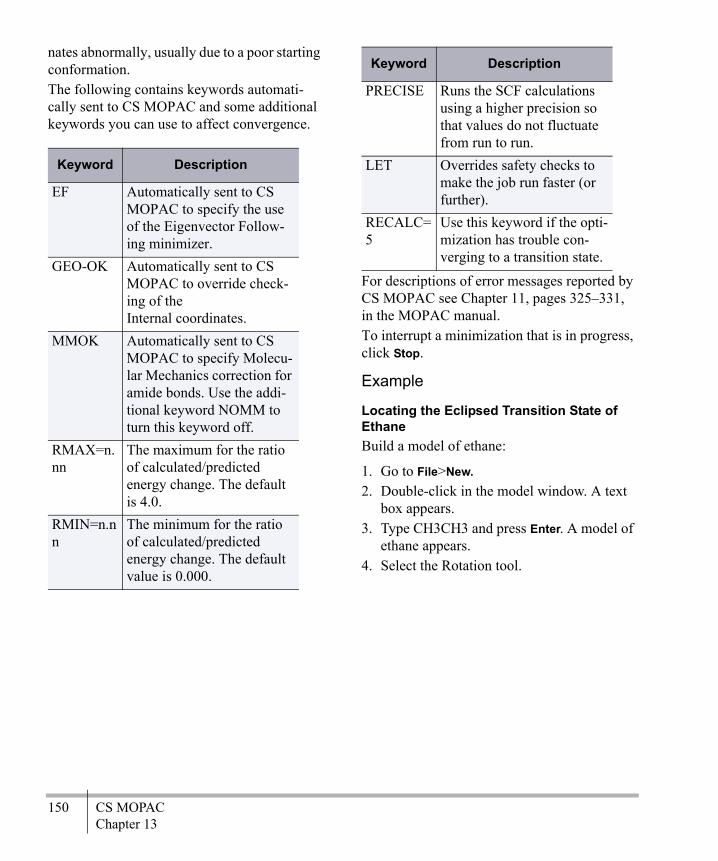
150 CS MOPACChapter 13
nates abnormally, usually due to a poor starting conformation.The following contains keywords automati-cally sent to CS MOPAC and some additional keywords you can use to affect convergence.
For descriptions of error messages reported by CS MOPAC see Chapter 11, pages 325–331, in the MOPAC manual.To interrupt a minimization that is in progress, click Stop.
Example
Locating the Eclipsed Transition State of EthaneBuild a model of ethane:
1. Go to File>New.2. Double-click in the model window. A text
box appears.3. Type CH3CH3 and press Enter. A model of
ethane appears.4. Select the Rotation tool.
Keyword Description
EF Automatically sent to CS MOPAC to specify the use of the Eigenvector Follow-ing minimizer.
GEO-OK Automatically sent to CS MOPAC to override check-ing of the Internal coordinates.
MMOK Automatically sent to CS MOPAC to specify Molecu-lar Mechanics correction for amide bonds. Use the addi-tional keyword NOMM to turn this keyword off.
RMAX=n.nn
The maximum for the ratio of calculated/predicted energy change. The default is 4.0.
RMIN=n.nn
The minimum for the ratio of calculated/predicted energy change. The default value is 0.000.
PRECISE Runs the SCF calculations using a higher precision so that values do not fluctuate from run to run.
LET Overrides safety checks to make the job run faster (or further).
RECALC=5
Use this keyword if the opti-mization has trouble con-verging to a transition state.
Keyword Description
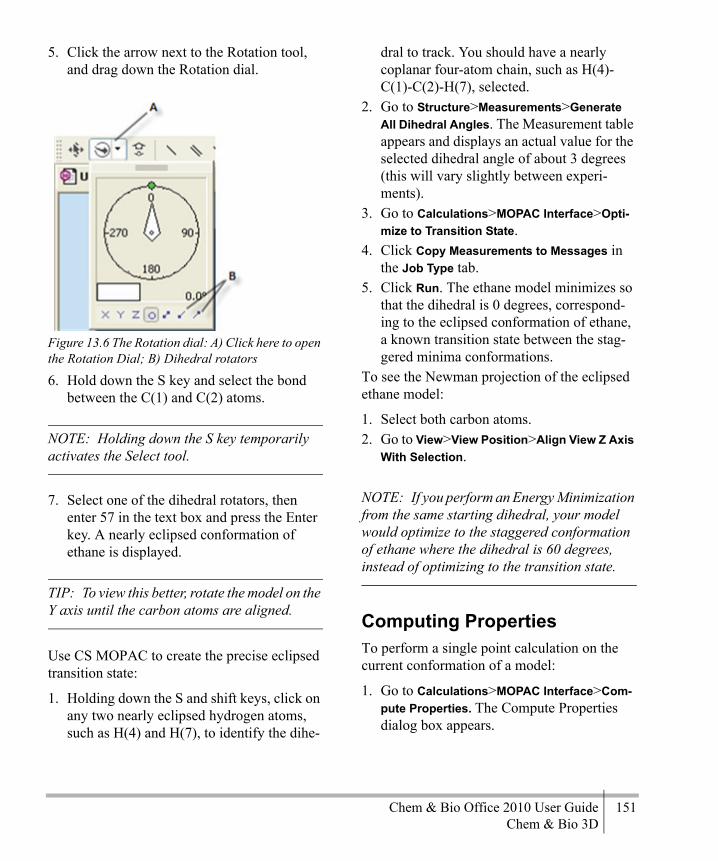
Chem & Bio Office 2010 User Guide 151Chem & Bio 3D
5. Click the arrow next to the Rotation tool, and drag down the Rotation dial.
Figure 13.6 The Rotation dial: A) Click here to open the Rotation Dial; B) Dihedral rotators
6. Hold down the S key and select the bond between the C(1) and C(2) atoms.
NOTE: Holding down the S key temporarily activates the Select tool.
7. Select one of the dihedral rotators, then enter 57 in the text box and press the Enter key. A nearly eclipsed conformation of ethane is displayed.
TIP: To view this better, rotate the model on the Y axis until the carbon atoms are aligned.
Use CS MOPAC to create the precise eclipsed transition state:
1. Holding down the S and shift keys, click on any two nearly eclipsed hydrogen atoms, such as H(4) and H(7), to identify the dihe-
dral to track. You should have a nearly coplanar four-atom chain, such as H(4)-C(1)-C(2)-H(7), selected.
2. Go to Structure>Measurements>Generate All Dihedral Angles. The Measurement table appears and displays an actual value for the selected dihedral angle of about 3 degrees (this will vary slightly between experi-ments).
3. Go to Calculations>MOPAC Interface>Opti-mize to Transition State.
4. Click Copy Measurements to Messages in the Job Type tab.
5. Click Run. The ethane model minimizes so that the dihedral is 0 degrees, correspond-ing to the eclipsed conformation of ethane, a known transition state between the stag-gered minima conformations.
To see the Newman projection of the eclipsed ethane model:
1. Select both carbon atoms.2. Go to View>View Position>Align View Z Axis
With Selection.
NOTE: If you perform an Energy Minimization from the same starting dihedral, your model would optimize to the staggered conformation of ethane where the dihedral is 60 degrees, instead of optimizing to the transition state.
Computing PropertiesTo perform a single point calculation on the current conformation of a model:
1. Go to Calculations>MOPAC Interface>Com-pute Properties. The Compute Properties dialog box appears.

152 CS MOPACChapter 13
2. On the Theory tab, choose a potential energy function to use for performing the calculation.
3. On the Properties tab, select the properties to calculate.
:
Figure 13.7 The Properties tab
4. On the Properties tab:• Select the properties• Select the charges.• Set the value of Dielectric constant.
5. On the General tab, type any additional key-words, if necessary.
6. Click Run.
Predict IR SpectrumA chart displaying the IR spectrum of the mol-ecule selected can be generated.To generate the IR spectrum:
1. Go to Calculations>Mopac inter-face>Predict IR Spectrum. The CS MOPAC Interface dialog box appears.
2. Click Job & Theory tab and do the follow-ing:• Select Predict IR Spectrum from Job type
list.• Set the values of method, wave function,
solvent and coordinate system.3. Click Run. The Spectrum viewer display-
ing the chart appears.
CS MOPAC PropertiesThe following section describes the properties that you can calculate for a given conformation of your model, either as a single point energy computation using the Compute Properties command, or after a minimization using either the Minimize Energy or Optimize to Transition State commands.
Heat of Formation, ΔHfThis energy value represents the heat of forma-tion for a model’s current conformation. It is
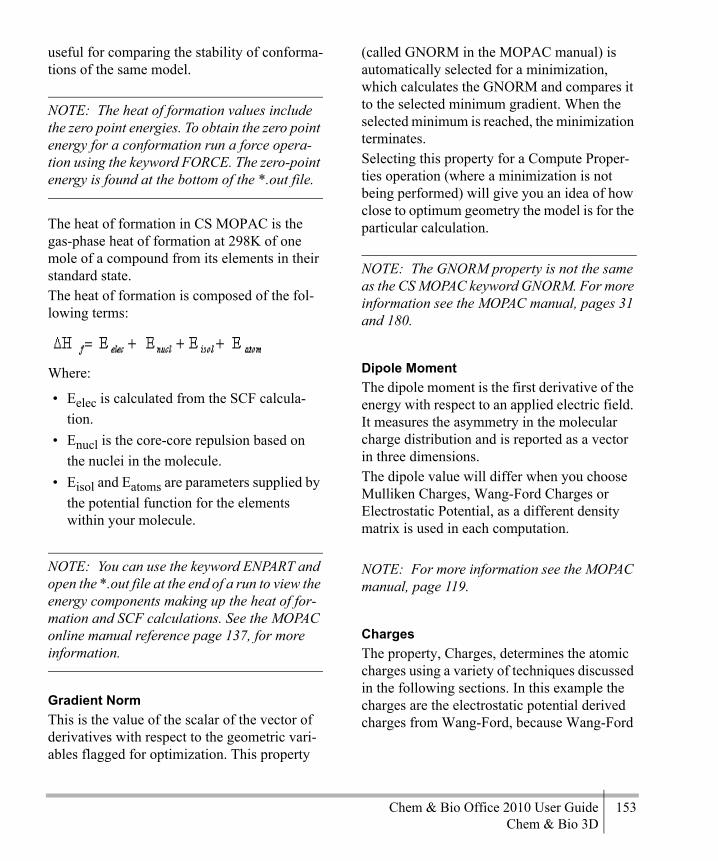
Chem & Bio Office 2010 User Guide 153Chem & Bio 3D
useful for comparing the stability of conforma-tions of the same model.
NOTE: The heat of formation values include the zero point energies. To obtain the zero point energy for a conformation run a force opera-tion using the keyword FORCE. The zero-point energy is found at the bottom of the *.out file.
The heat of formation in CS MOPAC is the gas-phase heat of formation at 298K of one mole of a compound from its elements in their standard state. The heat of formation is composed of the fol-lowing terms:
Where:
• Eelec is calculated from the SCF calcula-tion.
• Enucl is the core-core repulsion based on the nuclei in the molecule.
• Eisol and Eatoms are parameters supplied by the potential function for the elements within your molecule.
NOTE: You can use the keyword ENPART and open the *.out file at the end of a run to view the energy components making up the heat of for-mation and SCF calculations. See the MOPAC online manual reference page 137, for more information.
Gradient NormThis is the value of the scalar of the vector of derivatives with respect to the geometric vari-ables flagged for optimization. This property
(called GNORM in the MOPAC manual) is automatically selected for a minimization, which calculates the GNORM and compares it to the selected minimum gradient. When the selected minimum is reached, the minimization terminates. Selecting this property for a Compute Proper-ties operation (where a minimization is not being performed) will give you an idea of how close to optimum geometry the model is for the particular calculation.
NOTE: The GNORM property is not the same as the CS MOPAC keyword GNORM. For more information see the MOPAC manual, pages 31 and 180.
Dipole MomentThe dipole moment is the first derivative of the energy with respect to an applied electric field. It measures the asymmetry in the molecular charge distribution and is reported as a vector in three dimensions.The dipole value will differ when you choose Mulliken Charges, Wang-Ford Charges or Electrostatic Potential, as a different density matrix is used in each computation.
NOTE: For more information see the MOPAC manual, page 119.
ChargesThe property, Charges, determines the atomic charges using a variety of techniques discussed in the following sections. In this example the charges are the electrostatic potential derived charges from Wang-Ford, because Wang-Ford

154 CS MOPACChapter 13
charges give useful information about chemi-cal stability (reactivity).
Mulliken ChargesThis property provides a set of charges on an atom basis derived by reworking the density matrix from the SCF calculation. Unlike the Wang-Ford charges used in the previous exam-ple, Mulliken charges give a quick survey of charge distribution in a molecule.
NOTE: For more information, see the MOPAC online manual, page 41 and 121.
The following table contains the keywords automatically sent to CS MOPAC.
Electrostatic PotentialThe charges derived from an electrostatic potential computation give useful information about chemical reactivity.The electrostatic potential is computed by cre-ating an electrostatic potential grid. Chem3D reports the point charges derived from such a grid.
In general, these atomic point charges give a better indication of likely sites of attack when compared to atomic charges derived from the Coulson density matrix (Charges) or Mulliken population analysis (Mulliken Charges). The uses for electrostatic potential derived charges are generally the same as for atomic charges. For examples, see “Charges” on page 153.There are two properties available for calculat-ing atomic point charges: Wang-Ford Charges and Electrostatic Potential.
Wang-Ford ChargesThis computation of point charges can be used with the AM1 potential function only.
NOTE: For elements not covered by the AM1 potential function, use the Electrostatic Poten-tial property to get similar information on ele-ments outside this properties range.
Below are the keywords automatically sent to CS MOPAC.
Keyword Description
MULLIK Automatically sent to CS MOPAC to generate the Mul-liken Population Analysis.
GEO-OK Automatically sent to CS MOPAC to override checking of the Z-matrix.
MMOK Automatically sent to CS MOPAC to specify Molecular Mechanics correction for amide bonds. Use the additional key-word NOMM to turn this key-word off.
Keyword Description
PMEP Automatically sent to CS MOPAC to specify the genera-tion of Point Charges from PMEP.
QPMEP Automatically sent to CS MOPAC to specify the Wang/Ford electrostatic Potential rou-tine.
GEO-OK Automatically sent to CS MOPAC to override checking of the Z-matrix.
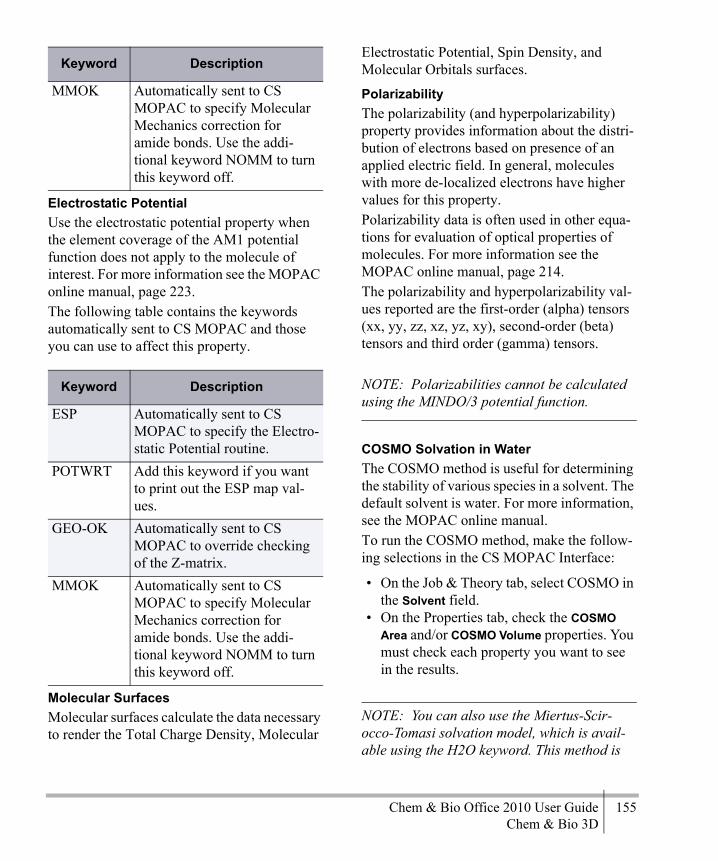
Chem & Bio Office 2010 User Guide 155Chem & Bio 3D
Electrostatic PotentialUse the electrostatic potential property when the element coverage of the AM1 potential function does not apply to the molecule of interest. For more information see the MOPAC online manual, page 223.The following table contains the keywords automatically sent to CS MOPAC and those you can use to affect this property.
Molecular SurfacesMolecular surfaces calculate the data necessary to render the Total Charge Density, Molecular
Electrostatic Potential, Spin Density, and Molecular Orbitals surfaces.
PolarizabilityThe polarizability (and hyperpolarizability) property provides information about the distri-bution of electrons based on presence of an applied electric field. In general, molecules with more de-localized electrons have higher values for this property.Polarizability data is often used in other equa-tions for evaluation of optical properties of molecules. For more information see the MOPAC online manual, page 214.The polarizability and hyperpolarizability val-ues reported are the first-order (alpha) tensors (xx, yy, zz, xz, yz, xy), second-order (beta) tensors and third order (gamma) tensors.
NOTE: Polarizabilities cannot be calculated using the MINDO/3 potential function.
COSMO Solvation in WaterThe COSMO method is useful for determining the stability of various species in a solvent. The default solvent is water. For more information, see the MOPAC online manual.To run the COSMO method, make the follow-ing selections in the CS MOPAC Interface:
• On the Job & Theory tab, select COSMO in the Solvent field.
• On the Properties tab, check the COSMO Area and/or COSMO Volume properties. You must check each property you want to see in the results.
NOTE: You can also use the Miertus-Scir-occo-Tomasi solvation model, which is avail-able using the H2O keyword. This method is
MMOK Automatically sent to CS MOPAC to specify Molecular Mechanics correction for amide bonds. Use the addi-tional keyword NOMM to turn this keyword off.
Keyword Description
ESP Automatically sent to CS MOPAC to specify the Electro-static Potential routine.
POTWRT Add this keyword if you want to print out the ESP map val-ues.
GEO-OK Automatically sent to CS MOPAC to override checking of the Z-matrix.
MMOK Automatically sent to CS MOPAC to specify Molecular Mechanics correction for amide bonds. Use the addi-tional keyword NOMM to turn this keyword off.
Keyword Description

156 CS MOPACChapter 13
recommended only for water as the solvent. A discussion of this method can be found in the CS MOPAC online documentation.
Hyperfine Coupling ConstantsHyperfine Coupling Constants are useful for simulating Electron Spin Resonance (ESR) spectra. Hyperfine interaction of the unpaired electron with the central proton and other equivalent protons cause complex splitting patterns in ESR spectra. ESR spectroscopy measures the absorption of microwave radiation by an unpaired electron when it is placed under a strong magnetic field.Hyperfine Coupling Constants (HFCs) are related to the line spacing within the hyperfine pattern of an ESR spectra and the distance between peaks.Species that contain unpaired electrons are as follows:
• Free radicals• Odd electron molecules• Transition metal complexes• Rare-earth ions• Triplet-state molecules
For more information see the MOPAC online manual, page 34.
The following table contains the keywords automatically sent to CS MOPAC and those you can use to affect this property.
Spin DensitySpin density arises in molecules where there is an unpaired electron. Spin density data pro-vides relative amounts of alpha spin electrons for a particular state. Spin density is a useful property for accessing sites of reactivity and for simulating ESR spec-tra.Two methods of calculating spin density of molecules with unpaired electrons are avail-able: RHF Spin Density and UHF Spin Den-sity.UHF SPIN DENSITYThe UHF Spin Density removes the closed shell restriction. In doing so, separate wave
Keyword Description
UHF Automatically sent to CS MOPAC if you choose “Open Shell (Unrestricted)” wave functions to specify the use of the Unrestricted Hartree-Fock methods.
Hyperfine Automatically sent to CS MOPAC to specify the hyper-fine computation.
GEO-OK Automatically sent to CS MOPAC to override checking of the Z-matrix.
MMOK Automatically sent to CS MOPAC to specify Molecular Mechanics correction for amide bonds. Use the additional key-word NOMM to turn this key-word off.

Chem & Bio Office 2010 User Guide 157Chem & Bio 3D
functions for alpha and beta spin electrons are computed. For more information see the MOPAC online manual, page 152.The following table contains the keywords automatically sent to CS MOPAC and those you can use to affect this property.
RHF SPIN DENSITYRHF Spin Density uses the 1/2 electron correc-tion and a single configuration interaction cal-culation to isolate the alpha spin density in a molecule. This method is particularly useful when the UHF Spin Density computation becomes too resource intensive for large mole-cules. For more information see the MOPAC online manual, page 28.
The following table contains the keywords automatically sent to CS MOPAC and those you can use to affect this property.
Example 1: Dipole MomentThis example describes how to calculate the dipole moment for formaldehyde:
1. Go to File>New Model.2. Click the Build from Text tool.3. Click in the model window. A text box
appears.4. Type H2CO and press Enter. A model of
formaldehyde appears.
Figure 13.8 Formaldehyde model
Keyword Description
UHF Automatically sent to CS MOPAC if you choose “Open Shell (Unrestricted)” wave functions to specify the use of the Unrestricted Hartree-Fock methods.
GEO-OK Automatically sent to CS MOPAC to override checking of the Z-matrix.
MMOK Automatically sent to CS MOPAC to specify Molecular Mechanics correction for amide bonds. Use the additional key-word NOMM to turn this key-word off.
SPIN You can add this keyword to print the spin density matrix in the *.out file.
Keyword Description
ESR Automatically sent to CS MOPAC to specify RHF spin density calculation.
GEO-OK Automatically sent to CS MOPAC to override checking of the Z-matrix.
MMOK Automatically sent to CS MOPAC to specify Molecular Mechanics correction for amide bonds. Use the additional key-word NOMM to turn this key-word off.

158 CS MOPACChapter 13
5. Go to Calculations>MOPAC Interface>Mini-mize Energy.
6. On the Theory tab, choose AM1.7. On the Properties tab, select Dipole. 8. Click Run.The results shown in the Messages window indicate the electron distribution is skewed in the direction of the oxygen atom.
If you rotate your model, the X,Y, and Z com-ponents of the dipole differ. However, the total dipole does not. In this example, the model is oriented so that the significant component of the dipole lies along the X-axis.
Example 2: Cation StabilityThis example compares cation stabilities in a homologous series of molecules.To build the model:
1. Go to File>New.2. Click the Build from Text tool.3. Click in the model window. A text box
appears.4. For tri-chloro, type CCl3 and press Enter.5. Repeat step 1 through step 4 for the other
cations: type CHCl2 for di-chloro; type
CH2Cl for mono-chloro and CH3 for methyl cation.
NOTE: The cations in this example are even electron closed shell systems and are assumed to have Singlet ground state. No modifications through additional keywords are necessary. The default RHF computation is used.
6. For each model, click the central carbon, type “+” and press Enter. The model changes to a cation and insures that the charge is sent to CS MOPAC.
To perform the computation:
1. Go to Calculations>MOPAC Interface>Mini-mize Energy.
2. On the Theory tab, choose AM1.3. On the Properties tab, select Charges in the
Properties list.4. Select Wang-Ford from the Charges list.5. Click Run. The results for the model appear
in the Message window when the computa-tion is complete.
The molecules are now planar, reflecting sp2 hybridization of the central carbon.From these simple computations, you can rea-son that the charge of the cation is not local-ized to the central carbon, but is rather distributed to different extents by the other atoms attached to the charged carbon. The gen-eral trend for this group of cations is that the more chlorine atoms attached to the charged carbon, the more stable the cation (the decreas-ing order of stability is tri-chloro >di-chloro > mono-chloro > methyl).
X Y Z Total
Dipole (vector Debye)
-2.317
0.000
0.000
2.317

Chem & Bio Office 2010 User Guide 159Chem & Bio 3D
Example 3: Charge DistributionIn this example, we analyze the charge distri-bution in a series of mono-substituted phenoxy ions.
1. Go to File>New Model.2. Click the Build from Text tool.3. Click in the model window.4. Type PhO- and press Enter. A phenoxide
ion model appears.
NOTE: All the monosubstituted phenols under examination are even electron closed shell sys-tems and are assumed to have Singlet ground state. No modifications by additional keywords are necessary. The default RHF computation is used.
5. Go to Calculations>MOPAC Interface>Mini-mize Energy.
6. On the Theory tab, choose PM3. This auto-matically selects Mulliken from the Charges list.
7. On the Property tab, select Charges.8. Click Run.To build the para-nitrophenoxide ion:
1. Click the Build from Text tool.2. Click H10, type NO2, then press Enter. The
para-nitrophenoxide ion displays. Perform minimization as in the last step.For the last two monosubstituted nitro phenols, first, select the nitro group using the Select Tool and press the Delete key. Add the nitro group at the meta (H9) or ortho (H8) position and repeat the analysis.The data from this series of analyses are shown below. The substitution of a nitro group at para, meta and ortho positions shows a decrease in negative charge at the phenoxy
oxygen in the order meta>para>ortho, where ortho substitution shows the greatest reduction of negative charge on the phenoxy oxygen. You can reason from this data that the phenoxy ion is stabilized by nitro substitution at the ortho position.
Phenoxide p-Nitro m- Nitro o-Nitro
C1 0.39572 C1 0.41546
C1 0.38077
C1 0.45789
C2 -0.46113 C2 -0.44929
C2 -0.36594
C2 -0.75764
C3 -0.09388 C3 -0.00519
C3 -0.33658
C3 0.00316
C4 -0.44560 C4 -0.71261
C4 -0.35950
C4 -0.41505
C5 -0.09385 C5 -0.00521
C5 -0.10939
C5 -0.09544
C6 -0.46109 C6 -0.44926
C6 -0.41451
C6 -0.38967
O7 -0.57746
O7 -0.49291
O7 -0.54186
O7 -0.48265
H8 0.16946 H8 0.18718
H8 0.21051
N8 1.38805
H9 0.12069 H9 0.17553
N9 1.31296
H9 0.16911
H10 0.15700
N10 1.38043
H10 0.19979
H10 0.17281
H11 0.12067
H11 0.17561
H11 0.14096
H11 0.13932
H12 0.16946
H12 0.18715
H12 0.17948
H12 0.18090
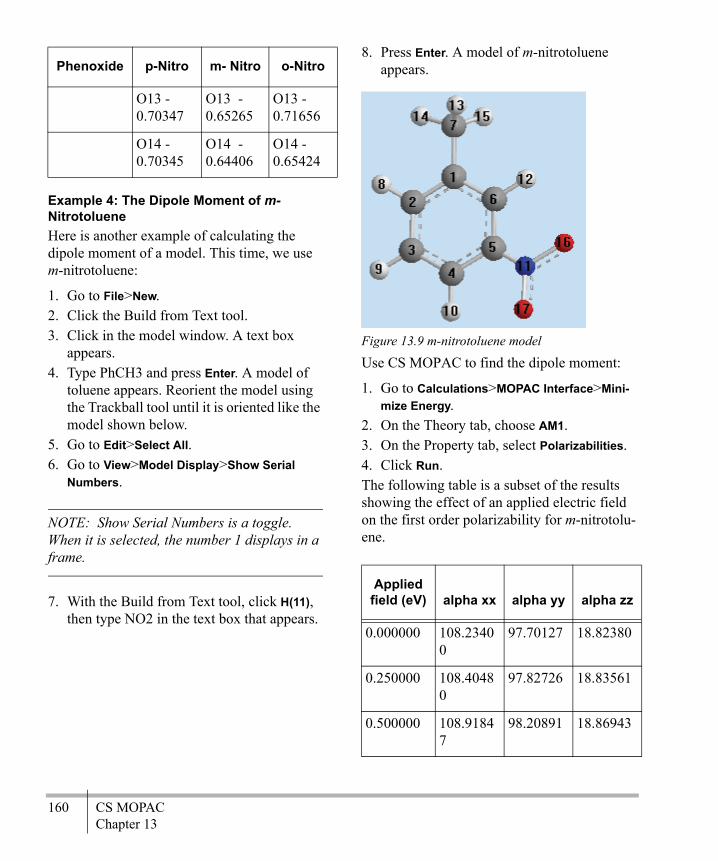
160 CS MOPACChapter 13
Example 4: The Dipole Moment of m-NitrotolueneHere is another example of calculating the dipole moment of a model. This time, we use m-nitrotoluene:
1. Go to File>New.2. Click the Build from Text tool.3. Click in the model window. A text box
appears.4. Type PhCH3 and press Enter. A model of
toluene appears. Reorient the model using the Trackball tool until it is oriented like the model shown below.
5. Go to Edit>Select All.6. Go to View>Model Display>Show Serial
Numbers.
NOTE: Show Serial Numbers is a toggle. When it is selected, the number 1 displays in a frame.
7. With the Build from Text tool, click H(11), then type NO2 in the text box that appears.
8. Press Enter. A model of m-nitrotoluene appears.
Figure 13.9 m-nitrotoluene model
Use CS MOPAC to find the dipole moment:
1. Go to Calculations>MOPAC Interface>Mini-mize Energy.
2. On the Theory tab, choose AM1.3. On the Property tab, select Polarizabilities. 4. Click Run.The following table is a subset of the results showing the effect of an applied electric field on the first order polarizability for m-nitrotolu-ene.
O13 -0.70347
O13 -0.65265
O13 -0.71656
O14 -0.70345
O14 -0.64406
O14 -0.65424
Phenoxide p-Nitro m- Nitro o-Nitro
Applied field (eV) alpha xx alpha yy alpha zz
0.000000 108.23400
97.70127 18.82380
0.250000 108.40480
97.82726 18.83561
0.500000 108.91847
98.20891 18.86943

Chem & Bio Office 2010 User Guide 161Chem & Bio 3D
The following table contains the keywords automatically sent to CS MOPAC and those you can use to affect this property.
Example 5: Phase StabilityIn this example, we compare the stability of the glycine Zwitterion in water and gas phases.To compare stabilities:
1. Go to File>New.2. Click the Build from Text tool.3. Click in the model window. A text box
appears.
4. Type HGlyOH and press Enter. A model of glycine appears.
Figure 13.10 Glycine model
5. Go to Calculations>MOPAC Interface>Mini-mize Energy.
6. On the Theory tab, choose PM3.7. On the Property tab, Ctrl+click Heat of For-
mation and COSMO Solvation.8. Click Run. The results appear in the Mes-
sages window.9. Go to Calculations>MOPAC Interface>Mini-
mize Energy.10.On the Property tab, deselect COSMO Solva-
tion.11.Click Run. The results appear in the Mes-
sages window.To create the zwitterion form:
1. Click the Build from Text tool.2. Click the nitrogen, type “+”, then press
Enter.
Keyword Description
POLAR (E=(n1, n2, n3))
Automatically sent to CS MOPAC to specify the polar-izablity routine. n is the start-ing voltage in eV. The default value is E = 1.0.You can reenter the keyword and another value for n to change the starting voltage.
GEO-OK Automatically sent to CS MOPAC to override check-ing of the Z-matrix.
MMOK Automatically sent to CS MOPAC to specify Molecu-lar Mechanics correction for amide bonds. Use the addi-tional keyword NOMM to turn this keyword off.

162 CS MOPACChapter 13
3. Click the oxygen atom, type “-”, then press Enter. The glycine zwitterion is formed.
Figure 13.11 Glycine zwitterion
4. Perform a minimization with and without the COSMO solvation property selected as performed for the glycine model.
The following table summarizes the results of the four analyses.
From this data you can reason that the glycine zwitterion is the more favored conformation in water and the neutral form is more favored in gas phase.
Example 6: Hyperfine Coupling ConstantsThis example uses the ethyl radical.To build the model:
1. Go to File>New Model.2. Click the Build from Text tool.3. Click in the model window. A text box
appears.4. Type EtH and press Enter.5. Click the Select tool.6. Select H(8).7. Press Backspace.If you have automatic rectification on, a mes-sage appears asking to turn it off to perform this operation. 8. Click Turn Off Automatic Rectification. The
Ethyl Radical is displayed.
Figure 13.12 Ethyl radical model
To perform the HFC computation:
1. Go to Calculations>MOPAC Interface>Mini-mize Energy.
2. On the Theory tab, choose the PM3 poten-tial function and the Open Shell (Unre-stricted) wave function.
3. On the Properties tab, choose Hyperfine Coupling Constants.
4. Click Run.
Form of glycine ΔH (kcal/mole)
Solvent Accessible Surface Å2
neutral (H2O) -108.32861 52.36067zwitterion (H2O)
-126.93974 52.37133
neutral (gas) -92.75386zwitterion (gas) -57.83940

Chem & Bio Office 2010 User Guide 163Chem & Bio 3D
The unpaired electron in the ethyl radical is delocalized. Otherwise, there would be no cou-pling constants.
Example 7: UHF Spin DensityAgain, using the ethyl radical, calculate the UHF spin density:
1. Create the ethyl radical as described in “Spin Density” on page 156.
2. Go to Calculations>MOPAC Interface>Mini-mize Energy.
3. On the Theory tab, select PM3.4. On the Properties tab, select Open Shell
(Unrestricted) and Spin Density. The Message window displays a list of atomic orbital spin densities. The atomic orbitals are not labeled for each value, however, the general rule is shown in the table below (CS MOPAC only uses s, px, py and pz orbitals).
You can reason from the result shown that the unpaired electron in the ethyl radical is more localized at pz orbital on C1. Generally, this is a good indication of the reactive site
Example 8: RHF Spin DensityThis example also uses the ethyl radical, this time to calculate the RHF spin density:
1. Create the ethyl radical as described in “Spin Density” on page 156.
2. Go to Calculations>MOPAC Interface>Mini-mize Energy.
3. On the Theory tab, choose PM3 and Closed Shell (Restricted).
4. On the Properties tab, choose Spin Density.
Hyperfine Coupling Constants
C1 0.02376C2 -0.00504H3 -0.02632H4 -0.02605H5 0.00350H6 0.05672H7 0.05479
Atomic Orbital Spin Density A.O.
0.07127 C1 s
0.06739 C1 px0.08375 C1 py0.94768 C1 pz-0.01511 C2 S-0.06345 C2 px-0.01844 C2 py-0.03463 C2 pz-0.07896 H3 s0.07815 H4 s0.01046 H5 s0.05488 H6 s0.05329 H7 s
Atomic Orbital Spin Density A.O.

164 CS MOPACChapter 13
The Message window displays the total spin densities for each atom (spin densities for all orbitals are totaled for each atom).
NOTE: You can look in the *.out file for a breakdown of the spin densities for each atomic orbital.
You can reason from this result that the unpaired electron in the ethyl radical is more localized on C1. Generally, this is a good indi-cation of the reactive site.
CS MOPAC Files
Using the *.out fileIn addition to the Messages window, CS MOPAC creates two text files that contain information about the computations. Each computation performed using CS MOPAC creates a *.out file containing all information concerning the computation. A summary *.arax file is also created, (where x increments from a to z after each run). The *.out file is overwritten for each run, but a new summary *.arax, file is created after each com-putation (*.araa, *.arab, and so on.)
The OUT and AAX files are saved by default to the \MOPAC Interface subfolder in your My Documents folder. You may specify a different location from the General tab of the CS MOPAC Interface dialog box.The following information is found in the summary file for each run:
• Electronic Energy (Eelectronic)
• Core-Core Repulsion Energy (Enuclear)
• Symmetry• Ionization Potential• HOMO/LUMO energies
The *.out file contains the following informa-tion by default.
• Starting atomic coordinates• Starting internal coordinates• Molecular orbital energies (eigenvalues)• Ending atomic coordinates
The workings of many of the calculations can also be printed in the *.out file by specifying the appropriate keywords before running the calculation. For example, specifying MECI as an additional keyword will show the derivation of microstates used in an RHF 1/2 electron approximation calculation. For more informa-tion see “Using Keywords” on page 260.
NOTE: Close the *.out file while performing CS MOPAC computations or the CS MOPAC application stops functioning.
Creating an Input FileA CS MOPAC input file (.MOP) is associated with a model and its dialog box settings.To create a CS MOPAC input file:
Total Spin Density
0.90744 C1 0.00644 C20.00000 H3 0.00000 H4 0.00001 H5 0.04395 H6 0.04216 H7
Chem & Bio Office 2010 User Guide 165Chem & Bio 3D
1. Go to Calculations>MOPAC Interface>Cre-ate Input File.
2. Select the appropriate settings and click Create.
Running Input FilesChem & Bio 3D lets you run previously cre-ated CS MOPAC input files. To run an input file:
1. Go to Calculations>MOPAC Interface and click Run Input File. The Run MOPAC Input File dialog box appears.
2. Specify the full path of the CS MOPAC file or Browse to the file location.
3. Select the appropriate options. For more information about the options see “Specify-ing the Electronic Configuration” on page 261.
4. Click Run.A new model window appears displaying the initial model. The CS MOPAC job runs and the results appear. All properties requested for the job appear in the *.out file. Only iteration messages appear for these jobs.
NOTE: If you are opening a CS MOPAC file where a model has an open valence, such as a radical, you can avoid having the coordinates readjusted by Chem3D by turning off Automat-ically Rectify in the Building control panel.
NOTE: CS MOPAC input files that containing multiple instances of the Z-matrix under exam-ination will not be correctly displayed in Chem3D. This type of CS MOPAC input files
includes calculations that use the SADDLE keyword, or model reaction coordinate geome-tries.
Running CS MOPAC JobsChem3D enables you to select a previously created CS MOPAC job description file (JDF). The JDF file can be thought of as a set of Set-tings that apply to a particular dialog box. To create a JDF file:
1. Go to Calculations>MOPAC Interface and choose a calculation.
2. After all settings for the calculation are specified, click Save As.
To run a CS MOPAC job from a JDF file:
1. Go to Calculations>MOPAC Interface and click Run MOPAC Job. The Open dialog box appears.
2. Select the JDF file to run. The dialog box corresponding to the type of job saved within the file appears.
3. Click Run.
Repeating CS MOPAC JobsAfter you perform a CS MOPAC calculation, you can repeat the job as follows:
1. Go to Calculations>MOPAC Interface and choose Repeat [name of computation]. The appropriate dialog box appears.
2. Change parameters if desired and click Run. The calculation proceeds.
Creating Structures From ARC FilesWhen you perform a CS MOPAC calculation, the results are stored in an ARC file in the \MOPAC Interface subfolder in your My Docu-ments folder.
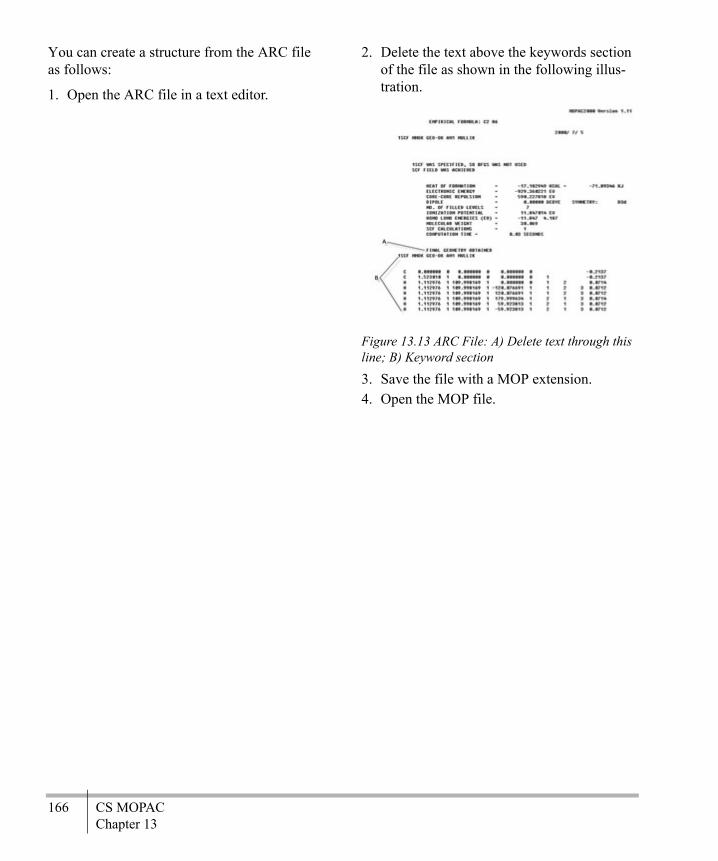
166 CS MOPACChapter 13
You can create a structure from the ARC file as follows:
1. Open the ARC file in a text editor.
2. Delete the text above the keywords section of the file as shown in the following illus-tration.
Figure 13.13 ARC File: A) Delete text through this line; B) Keyword section
3. Save the file with a MOP extension.4. Open the MOP file.

Chem & Bio Office 2010 User Guide 167Chem & Bio 3D
SubstructuresA substructure is defined as part of a molecular structure that has attachment points to which other atoms or substructures connect.You can define substructures and add them to a substructures table. When you define a sub-structure, the attachment points (where the substructure attaches to the rest of the struc-ture) are stored with the substructure. If a substructure (such as Ala) contains more than one attachment point, the atom with the lowest serial number normally becomes the first attachment point. The atom with the sec-ond lowest serial number becomes the second attachment point, and so on.
Attachment point rulesThe following rules cover all possible situa-tions for multiple attachment points in sub-structures; Rule 3 is the normal situation described above:• If two atoms are the same according to the
above criteria, the atom with the lowest serial number goes first.
• If an atom has an open valence and is attached to a selected atom, it is numbered
after any atom that is attached to an unse-lected atom.
• If an atom is attached only to rectified atoms, it goes after any atom that is attached to non-rectification atoms.
• If two atoms are the same according to the above criteria, then the one attached to the atom with the lowest serial number goes first.
Angles and measurementsIn addition to the attachment points, the mea-surements between the selected atoms and nearby unselected atoms are saved with the substructure to position the substructure rela-tive to other atoms when the substructure is used to convert labels into atoms and bonds.For example, Chem & Bio 3D 12.0 stores with the substructure a dihedral angle formed by two atoms in the substructure and two unse-lected atoms. If more than one dihedral angle can be composed from selected (substructure) and unselected (non-substructure) atoms, the dihedral angle that is saved with the substruc-ture consists of the atoms with the lowest serial numbers.
A
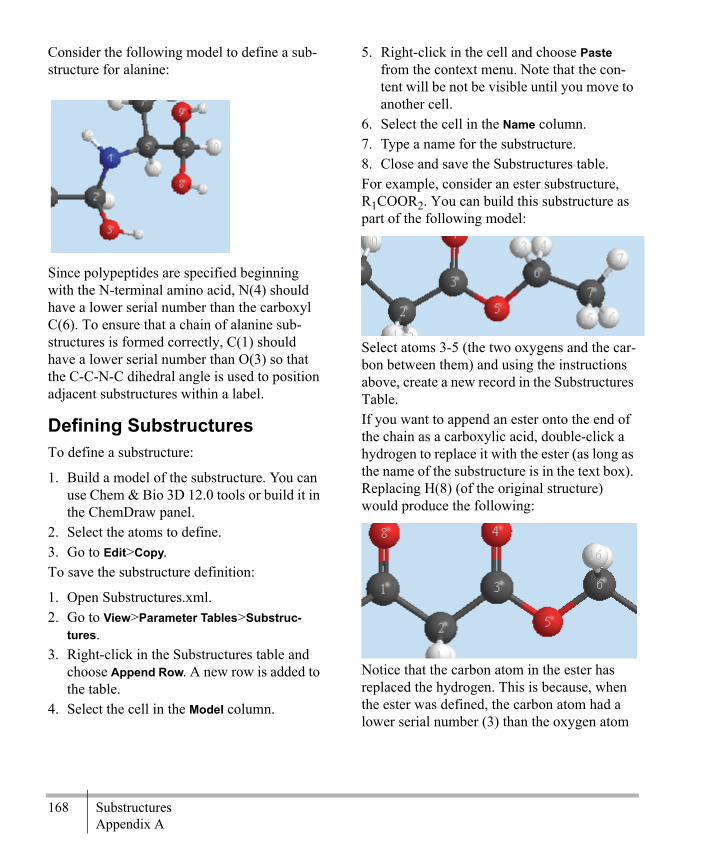
168 SubstructuresAppendix A
Consider the following model to define a sub-structure for alanine:
Since polypeptides are specified beginning with the N-terminal amino acid, N(4) should have a lower serial number than the carboxyl C(6). To ensure that a chain of alanine sub-structures is formed correctly, C(1) should have a lower serial number than O(3) so that the C-C-N-C dihedral angle is used to position adjacent substructures within a label.
Defining SubstructuresTo define a substructure:
1. Build a model of the substructure. You can use Chem & Bio 3D 12.0 tools or build it in the ChemDraw panel.
2. Select the atoms to define.3. Go to Edit>Copy.To save the substructure definition:
1. Open Substructures.xml.2. Go to View>Parameter Tables>Substruc-
tures.3. Right-click in the Substructures table and
choose Append Row. A new row is added to the table.
4. Select the cell in the Model column.
5. Right-click in the cell and choose Paste from the context menu. Note that the con-tent will be not be visible until you move to another cell.
6. Select the cell in the Name column. 7. Type a name for the substructure. 8. Close and save the Substructures table.For example, consider an ester substructure, R1COOR2. You can build this substructure as part of the following model::
Select atoms 3-5 (the two oxygens and the car-bon between them) and using the instructions above, create a new record in the Substructures Table.If you want to append an ester onto the end of the chain as a carboxylic acid, double-click a hydrogen to replace it with the ester (as long as the name of the substructure is in the text box). Replacing H(8) (of the original structure) would produce the following::
Notice that the carbon atom in the ester has replaced the hydrogen. This is because, when the ester was defined, the carbon atom had a lower serial number (3) than the oxygen atom

Chem & Bio Office 2010 User Guide 169Chem & Bio 3D
that formed the other attachment point in the substructure (5).
NOTE: When defining substructures with mul-tiple attachment points, it is critical to note the serial numbers of the atoms in the substructure
so that you can correctly orient the substructure when it is inserted in the model. See the rules for multiple attachment points discussed at the beginning of this section.

170 SubstructuresAppendix A

Chem & Bio Office 2010 User Guide 171Chem & Bio 3D
Keyboard ModifiersThe following tables list the keyboard modifi-ers that allow you to manipulate your view of the model without changing tools.
Rotation
In addition to the keyboard shortcuts, you can rotate a model by dragging with the mouse
B
Key Drag Shift+Drag
ALT Trackball rotate view
Trackball rotate model selection
V Rotate view about selected bond
Rotate model selec-tion about axis
X Rotate view about view X axis
Rotate model about view X axis
Y Rotate view about view Y axis
Rotate model about view Y axis
Z Rotate view about view Z axis
Rotate model about view Z axis
Shift+B Shift+N
Rotate 1/2 of frag-ment around bondwhich fragment rotates depends on the order in which the atoms were selected.
Key Drag Shift+Drag
ALT Trackball rotate all objects
Trackball rotate the selected object(s). At least one object must be selected.
Shift+B Shift+N
Rotate 1/2 of frag-ment around bondwhich fragment rotates depends on the order in which the atoms were selected.
V Rotate all objects (one bond must be selected)
Rotate model about the axis. The model that includes the selected bond rotates around the bond.
X Rotate all objects about X axis
Rotate model about the X axis
Y Rotate all objects about Y axis
Rotate model about the Y axis
Z Rotate all objects about Z axis
Rotate model about the Z axis

172 Keyboard ModifiersAppendix B
while holding down both the middle mouse button or scroll wheel and the left mouse but-ton.
TIP: The order is important; press the middle button first.
Zoom and Translate
If you have a wheel mouse, you may also use the scroll wheel to zoom. Dragging with the middle button or scroll wheel translates the view.
SelectionStandard Selection
NOTE: Clicking a bond selects the bond and the two atoms connected to it. Double-clicking an atom or bond selects the fragment that atom or bond belongs to. Double-clicking a selected fragment selects the next higher fragment; that is, each double-click moves you up one in the hierarchy until you have selected the entire model.
Radial SelectionRadial selection is selection of an object or group of objects based on the distance or radius from a selected object or group of objects. This feature is particularly useful for highlighting the binding site of a protein. Radial selection is accessed through the Select submenu of the context menu in the Model Explorer or 3D display. In all cases, specify multiple selections by holding the shift key down while making the selections
Key Drag Shift+Drag
CTRL Move all objects
Move the selected model
A Zoom to center
Q Zoom to rotation center
W Zoom to selection center
Key Click Shift+Click
Drag Shift+Drag
S Select atom/bond
Multiple select atom/bond
Box select atoms /bonds
Multiple box select atoms /bonds
Submenu option Effect
Select Atoms within Distance of Selec-tion
Selects all atoms (except for those already selected) lying within the specified distance from any part of the current selection. The current selection will be un-selected unless multiple selection is used.

Chem & Bio Office 2010 User Guide 173Chem & Bio 3D
Select Groups within Distance of Selection
Selects all groups (except for those already selected) that contain one or more atoms lying within the specified dis-tance from any part of the current selection. The current selection will be un-selected unless multiple selection is used.
Select Atoms within Radius of Selec-tion Centroid
Selects all atoms (except for those already selected) lying within the specified distance of the centroid of the current selection. The current selection will be un-selected unless multiple selection is used.
Select Groups within Radius of Selec-tion Centroid
Selects all groups (except for those already selected) that contain one or more atoms lying within the specified dis-tance of the centroid of the current selection. The current selection will be un-selected unless multiple selection is used.
Submenu option Effect

174 Keyboard ModifiersAppendix B

Chem & Bio Office 2010 User Guide 175Chem & Bio 3D
Building TypesBuilding types define the structure of your model–the bond lengths, bond angles, and rela-tive sizes of the atoms themselves. By default, Chem & Bio 3D assigns building types as you build your model. Chem & Bio 3D includes a predefined set of building types. However, you can also create your own.
Assigning building TypesWhen you replace atoms, Chem & Bio 3D attempts to assign the best type to each atom by comparing the information about the atom (such as its symbol and the number of bonds) to each record in the Atom Type table.When you have selected the Correct Building Type check box in the Model Building tab (File>Model Settings>Model Building tab), building types are corrected when you delete or add atoms or bonds. In addition, the build-ing types of pre-existing atoms may change when you replace other atoms with other atoms of a different type.
Building Type CharacteristicsThe characteristics of an atom must match the following type characteristics for Chem & Bio 3D to assign the type to the atom.
• The symbol.• The bound-to type (if specified for the
building type).• The bound-to order (if the bound-to type is
specified).• The number of double, triple and de-local-
ized bonds.
NOTE: For comparing bond orders, a building type that contains one double bond may be assigned to an atom that contains two de-local-ized bonds, such as in benzene.
If the maximum ring size field of a building type is specified, then the atom must be in a ring of that size or smaller to be assigned the corresponding building type. If an atom is bound to fewer ligands than are specified by a building type geometry but the rectification type is specified, then the atom can be assigned to that building type. Open valences are filled with rectification atoms.
C
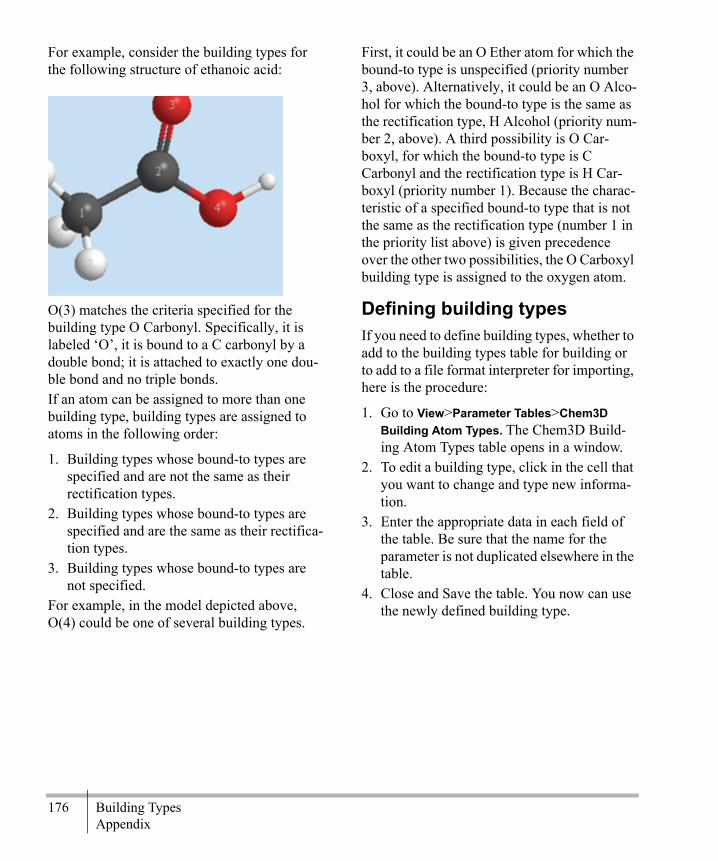
176 Building TypesAppendix
For example, consider the building types for the following structure of ethanoic acid:
O(3) matches the criteria specified for the building type O Carbonyl. Specifically, it is labeled ‘O’, it is bound to a C carbonyl by a double bond; it is attached to exactly one dou-ble bond and no triple bonds.If an atom can be assigned to more than one building type, building types are assigned to atoms in the following order:
1. Building types whose bound-to types are specified and are not the same as their rectification types.
2. Building types whose bound-to types are specified and are the same as their rectifica-tion types.
3. Building types whose bound-to types are not specified.
For example, in the model depicted above, O(4) could be one of several building types.
First, it could be an O Ether atom for which the bound-to type is unspecified (priority number 3, above). Alternatively, it could be an O Alco-hol for which the bound-to type is the same as the rectification type, H Alcohol (priority num-ber 2, above). A third possibility is O Car-boxyl, for which the bound-to type is C Carbonyl and the rectification type is H Car-boxyl (priority number 1). Because the charac-teristic of a specified bound-to type that is not the same as the rectification type (number 1 in the priority list above) is given precedence over the other two possibilities, the O Carboxyl building type is assigned to the oxygen atom.
Defining building typesIf you need to define building types, whether to add to the building types table for building or to add to a file format interpreter for importing, here is the procedure:
1. Go to View>Parameter Tables>Chem3D Building Atom Types. The Chem3D Build-ing Atom Types table opens in a window.
2. To edit a building type, click in the cell that you want to change and type new informa-tion.
3. Enter the appropriate data in each field of the table. Be sure that the name for the parameter is not duplicated elsewhere in the table.
4. Close and Save the table. You now can use the newly defined building type.

Chem & Bio Office 2010 User Guide 177Chem & Bio 3D
2D to 3D ConversionThis section describes how Chem & Bio 3D 12.0 performs the conversion from two to three dimensions. You can open a 2D drawing using several methods.
• Opening a Chem & Bio Draw or ISIS/Draw document.
• Pasting a Chem & Bio Draw or ISIS/Draw structure from the Clipboard.
• Opening a Chem & Bio Draw connection table file.
While Chem & Bio 3D can read and assimilate any Chem & Bio Draw structure, you can assist Chem & Bio 3D in the two- to three-dimensional conversion of your models by following the suggestions in this Appendix.Chem & Bio 3D uses the atom labels and bonds drawn in ChemDraw to form the struc-ture of your model. For every bond drawn in ChemDraw, a corresponding bond is created in Chem & Bio 3D. Every atom label is converted into at least one atom.Dative bonds are converted to single bonds with a positive formal charge added to one atom (the atom at the tail of the dative bond) and a negative formal charge added to the other (the head of the dative bond).
Stereochemical RelationshipsChem & Bio 3D 12.0 uses the stereo bonds H-Dot, and H-Dash atom labels in a Chem & Bio Draw structure to define the stereochemi-
cal relationships in the corresponding model. Wedged bonds in Chem & Bio Draw 12.0 indi-cate a bond where the atom at the wide end of the bond is in front of the atom at the narrow end of the bond. Wedged hashed bonds indi-cate the opposite: the atom at the wide end of a wedged hashed bond is behind the atom at the other end of the bond.
As shown above, the two phenyl rings are a trans formation about the cyclopentane ring. The phenyl ring on the left is attached by a wedged hashed bond; the phenyl ring on the right is attached by a wedged bond. You can also use dashed, hashed, and bold bonds. However, you should be aware of potential ambiguity where these non-direc-tional bonds are used. A dashed, hashed, or bold bond must be between one atom that has at least three attachments and one atom that
D

178 2D to 3D ConversionAppendix D
has no more than two attachments, including the dashed, hashed, or bold bond.Shown below, the nitrogen atom is placed behind the ring system and the two methyl groups are placed in front of the ring system. Each of these three atoms is bonded to only one other atom, so they are presumed to be at the wide ends of the stereo bonds.
However, in the next figure (below), the hashed bond is ambiguous because both atoms on the hashed bond are attached to more than two bonds. In this case the hashed bond is treated like a solid bond. Wavy bonds are always treated like solid bonds.
H-Dots and H-Dashes are also used to indicate stereochemistry. H-Dots become hydrogen atoms attached to carbon atoms by a wedged bond. H-Dashes become hydrogen atoms attached by a wedged hashed bond.
The following figure shows cis-decalin on the left and trans-decalin on the right as they would be drawn in Chem & Bio Draw to be read in by Chem & Bio 3D. Of course, you can specify a cis fusion with two H-Dots instead of two H-Dashes.
As a general rule, the more stereo bonds you include in your model, the greater is the proba-bility that Chem & Bio 3D 12.0 will make cor-rect choices for chirality and dihedral angles. When converting two-dimensional structures, Chem & Bio 3D 12.0 uses standard bond lengths and angles as specified in the current set of parameters. If Chem & Bio 3D 12.0 tries to translate strained ring systems, the ring clo-sures will not be of the correct length or angle.
LabelsChem & Bio 3D 12.0 uses the atom labels in a two-dimensional structure to determine the atom types of the atoms. Unlabeled atoms are assumed to be carbon. Labels are converted into atoms and bonds using the same method as that used to convert the text in a text box into atoms and bonds. Therefore, labels can contain several atoms or even substructures.

Chem & Bio Office 2010 User Guide 179Chem & Bio 3D
File FormatsEditing File Format Atom TypesSome file formats contain information that describes the atom types. Typically, these atom types are ordered by some set of numbers, sim-ilar to the atom type numbers used in the Atom Types table. If the file format needs to support additional types of atoms, you can supply those types by editing the file format atom types.Chem & Bio 3D 12.0 uses XML tables to store file formats. You can edit these tables in any text editor or in Chem & Bio 3D. Go to View>Parameter Tables) and select the table you want to edit.
TIP: The XML files are in the path ...\Chem3D\C3D Items\
NameEach atom type is described by a name. This name is a number found in files of the format described by the file format. All names must be
unique. The records in the table window are sorted by name.
NOTE: While names are similar to atom type numbers, they do not have to correspond to the atom type numbers of atom types. In some cases, however, they do correspond.
DescriptionThe second field contains a description of the atom type, such as C Alkane. This description is included for your reference only.The remaining fields contain information cor-responding to the information in an Atom Types table.
File Format ExamplesThe following sections provide examples of the files created when you save Chem3D files using the provided file formats.
Alchemy FileThe following is a sample Alchemy file (Alchemy) created using Chem3D for a model of cyclohexanol. The numbers in the first col-
E
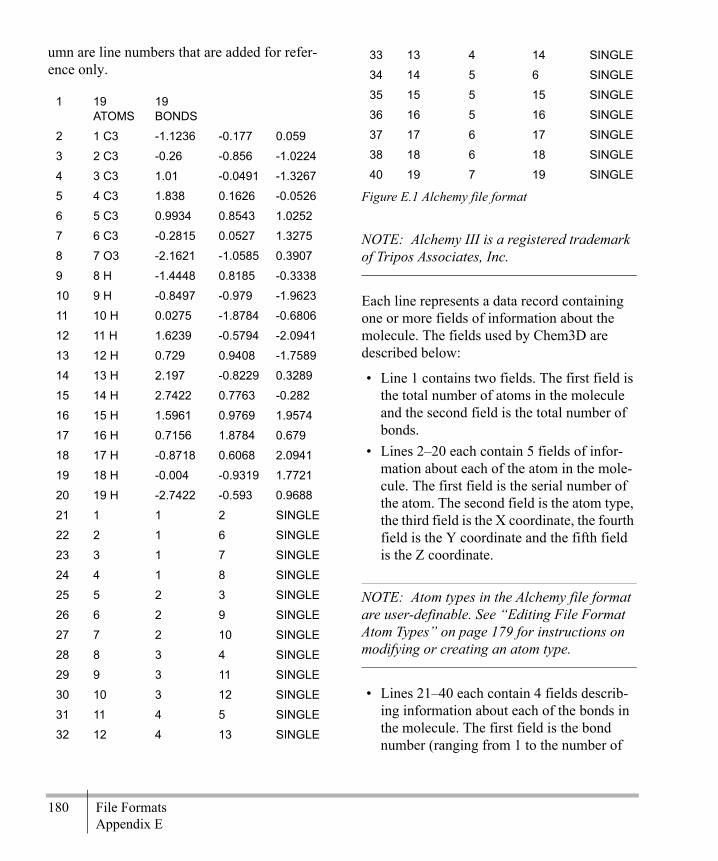
180 File FormatsAppendix E
umn are line numbers that are added for refer-ence only.
Figure E.1 Alchemy file format
NOTE: Alchemy III is a registered trademark of Tripos Associates, Inc.
Each line represents a data record containing one or more fields of information about the molecule. The fields used by Chem3D are described below:
• Line 1 contains two fields. The first field is the total number of atoms in the molecule and the second field is the total number of bonds.
• Lines 2–20 each contain 5 fields of infor-mation about each of the atom in the mole-cule. The first field is the serial number of the atom. The second field is the atom type, the third field is the X coordinate, the fourth field is the Y coordinate and the fifth field is the Z coordinate.
NOTE: Atom types in the Alchemy file format are user-definable. See “Editing File Format Atom Types” on page 179 for instructions on modifying or creating an atom type.
• Lines 21–40 each contain 4 fields describ-ing information about each of the bonds in the molecule. The first field is the bond number (ranging from 1 to the number of
1 19 ATOMS
19 BONDS
2 1 C3 -1.1236 -0.177 0.059
3 2 C3 -0.26 -0.856 -1.0224
4 3 C3 1.01 -0.0491 -1.3267
5 4 C3 1.838 0.1626 -0.0526
6 5 C3 0.9934 0.8543 1.0252
7 6 C3 -0.2815 0.0527 1.3275
8 7 O3 -2.1621 -1.0585 0.3907
9 8 H -1.4448 0.8185 -0.3338
10 9 H -0.8497 -0.979 -1.9623
11 10 H 0.0275 -1.8784 -0.6806
12 11 H 1.6239 -0.5794 -2.0941
13 12 H 0.729 0.9408 -1.7589
14 13 H 2.197 -0.8229 0.3289
15 14 H 2.7422 0.7763 -0.282
16 15 H 1.5961 0.9769 1.9574
17 16 H 0.7156 1.8784 0.679
18 17 H -0.8718 0.6068 2.0941
19 18 H -0.004 -0.9319 1.7721
20 19 H -2.7422 -0.593 0.9688
21 1 1 2 SINGLE
22 2 1 6 SINGLE
23 3 1 7 SINGLE
24 4 1 8 SINGLE
25 5 2 3 SINGLE
26 6 2 9 SINGLE
27 7 2 10 SINGLE
28 8 3 4 SINGLE
29 9 3 11 SINGLE
30 10 3 12 SINGLE
31 11 4 5 SINGLE
32 12 4 13 SINGLE
33 13 4 14 SINGLE
34 14 5 6 SINGLE
35 15 5 15 SINGLE
36 16 5 16 SINGLE
37 17 6 17 SINGLE
38 18 6 18 SINGLE
40 19 7 19 SINGLE

Chem & Bio Office 2010 User Guide 181Chem & Bio 3D
bonds), the second field is the serial number of the atom where the bond begins, the third field is the serial number of the atom where the bond ends, and the fourth field is the bond type. The possible bond types are: SINGLE, DOUBLE, TRIPLE, AMIDE, or AROMATIC. Note that all the bond order names are padded on the right with spaces to eight characters.
FORTRANThe FORTRAN format for each record of the Alchemy file is as follows:
Cartesian Coordinate FilesTwo file formats are supplied with Chem & Bio 3D that interpret Cartesian coordinate files. These formats, Cart Coords, Cart Coords 2, interpret text files that specify models in terms of the X, Y, and Z coordinates of the atoms. These file formats can also interpret fractional cell coordinates in orthogonal or non-orthogonal coordinate systems.BUILDING TYPESTwo file formats are supplied with Chem3D that interpret Cartesian coordinate files. The
difference between the two file formats are the codes used to convert atom type numbers in the file into atom types used by Chem3D.In Cart Coords 1, atom types are numbered according to the numbering used by N.L. Allinger in MM2. These numbers are also gen-erally followed by the program PC Model.In Cart Coords 2, the atom type number for all atom types is computed by multiplying the atomic number of the element by 10 and add-ing the number of valences as specified by the geometry of the atom type. These numbers are also generally followed by the program Macro-Model. For example, the atom type number for C Alkane (a tetrahedral carbon atom) is 64 using Cart Coords 2.To examine the atom types described by a file format, see “Editing File Format Atom Types” on page 179.THE CARTESIAN COORDINATE FILE FORMATThe format for Cartesian coordinate files may be described as follows:
1. The first line of data contains the number of atoms in the model.
Optionally, you can follow the number of atoms in the file with crystal cell parameters for the crystal structure: a, b, c, α, β, and γ. Following the cell parameters, you can also include an exponent. If you include an expo-nent, then all of the fractional cell coordinates will be divided by 10 raised to the power of the exponent.2. The first line of a Cartesian coordinate file
is followed by one line of data for each atom in the model. Each line describing an atom begins with the symbol for the atom. This symbol corresponds to a symbol in the Elements table. The symbol can include a
Line Number
Description FORTRAN Format
1 number of atoms, number of bonds
I5, 1X, ATOMS,1X,I5,1X, BONDS
2–20 atom serial num-ber, type, and coordinates
I6,A4,3(F9.4)
21–40 bond id, from atom, to atom, bond type
I6,I5,I6,2X,A8

182 File FormatsAppendix E
charge, such as N+. The symbol is followed by the serial number.
3. The serial number is followed by the three coordinates of the atom. If you have speci-fied crystal cell parameters in the first line of the file, then these numbers are the frac-tional cell coordinates. Otherwise, the three numbers are X, Y, and Z Cartesian coordi-nates.
4. Following the coordinates is the atom type number of the atom type for this atom. This number corresponds to the code of an atom type record specified in the file format atom type table. For more information, see “Edit-ing File Format Atom Types” on page 179.
5. Following the atom type number is the con-nection table for the atom. You can specify up to ten other atoms. The connection table for a Cartesian coordinate file can be listed in one of two ways: by serial number or by position.
Connection tables by serial number use the serial number of each atom to determine the number that appears in the connection table of other atoms. All serial numbers must, there-fore, be unique. Connection tables by position use the relative positions of the atoms in the file to determine the number for each atom that will appear in the connection table of other atoms. The first atom is number 1, the second is 2, etc. 6. To create multiple views of the same set of
atoms, you can flow the descriptions of the atoms with an equal number of lines corre-sponding to the same atoms with different coordinates. Chem3D generates indepen-
dent views using the additional sets of coor-dinates.
:
19
C 1 0.70669
1.066193
0.50882 1 2 4 9 10
C 2 -0.83473
1.075577
0.508789
1 1 3 10 11
C 3 -1.40901
0.275513
-0.66891
1 2 6 12 13
C 4 1.217285
-0.38632
0.508865
1 1 5 14 15
C 5 0.639328
-1.19154
-0.66444
1 4 6 16 17
C 6 -0.89444
-1.1698 -0.64665
1 3 5 18 19
O 101 1.192993
1.809631
1.59346 6 1 102
H 9 1.052597
1.559525
-0.43226
5 1
H 10 -1.211624
2.125046
0.457016
5 3
H 11 -1.208969
0.640518
1.465607
5 3

Chem & Bio Office 2010 User Guide 183Chem & Bio 3D
Components of a Cartesian coordinate file with Connection Table by Serial Number for C(1) of Cyclohexanol is shown below.
Figure E.2 Connection table by serial number
Components of a Cartesian coordinate file with Crystal coordinate Parameters for C(1) are shown below.
Figure E.3 Connection table by crystal co-ordinate parameters
Components of a Cartesian Coordinate file with Connection table by Position for Cyclo-hexanol is shown in .
Figure E.4 Connection table by position
FORTRAN FormatsThe FORTRAN format for a Cartesian coordi-nate file with a connection table is described in the following tables:
H 12 -2.524918
0.2816 -0.62580
5 4
H 13 -1.11557
0.762314
-1.629425
5 4
H 14 0.937027
-0.8781 1.470062
5 5
H 15 2.329758
-0.41023
0.437714
5 5
H 16 1.003448
-2.24631
-0.61828
5 6
H 17 1.005798
-0.76137
-1.627 5 6
H 18 -1.295059
-1.73161
-1.52456
5 7
H 19 -1.26513
-1.68524
0.271255
5 7
H 102 2.127594
1.865631
1.48999 21 101
X, Y and Z Coordinates
Serial Numbers of Other Atoms to which C(1) is Bonded
Atom Type Text Number
Element Symbol
4 9 101C 1 0.706696 1.066193 0.508820 1 2
Serial Number
43 10.23 12.56 8.12 90.0 120.0 90.0 4
C 1 1578 -2341 5643 1 20 21 22
Fractional Cell Coordinates
Number of Atoms a b c α β γ Exponent
X, Y and Z Coordinates
Positions of Other Atoms to which C(1) is Bonded
Atom Type Text Number
Element Symbol
4 7 8C 1 0.706696 1.066193 0.508820 1 2
Serial Number

184 File FormatsAppendix E
Cartesian coordinate File (Connection Table by Serial Number or Position):
Cartesian coordinate File (Fractional Crystal Cell Parameters):
Cambridge Crystal Data Bank FilesYou can import Cambridge Crystal Data Bank (CCDB) files but not save files in the CCDB format. Chem & Bio 3D uses the FDAT format of CCDB, described on pages 26–42 of the data file specifications of the Cambridge Struc-tural Database, Version 1 File Specifications from the Cambridge Crystallographic Data Centre. For further details about the FDAT for-mat, refer to the above publication or contact the Cambridge Crystallographic Data Centre. As described in the specifications of the Cam-bridge Crystal Data Bank format, bonds are
automatically added between pairs of atoms whose distance is less than that of the sum of the covalent radii of the two atoms. The bond orders are guessed based on the ratio of the actual distance to the sum of the covalent radii. The bond orders, bond angles, and the atom symbols are used to determine the atom types of the atoms in the model.
Internal Coordinates FileInternal coordinates files (INT Coords) are text files that describe a single molecule by the internal coordinates used to position each atom. The serial numbers are determined by the order of the atoms in the file. The first atom has a serial number of 1, the second is number 2, etc. The format for Internal coordinates files is as follows:
1. Line 1 is a comment line ignored by Chem3D. Each subsequent line begins with the building type number.
2. Line 2 contains the building type number of the Origin atom.
3. Beginning with line 3, the building type number is followed by the serial number of the atom to which the new atom is bonded and the distance to that atom. The origin atom is always the first distance-defining atom in the file. All distances are measured in Angstroms.
Line Number
Description FORTRAN For-mat
1 Number of Atoms
I3
2 to end Atom coordi-nates
A3, 1X, I4, 3(1X, F11.6), 1X, I4, 10(1X, I4)
Line Number
Description FORTRAN For-mat
1 Number of Atoms, Crystal Cell Parameters
I3, 6(1X, F), I
2 to End Atom coordi-nates
A3, 1X, I4, 3(1X, F11.6), 1X, I4, 10(1X,I4)
Bond Type Actual Distance / Sum of Covalent Radii
Triple 0.81Double 0.87Delocalized 0.93Single 1.00
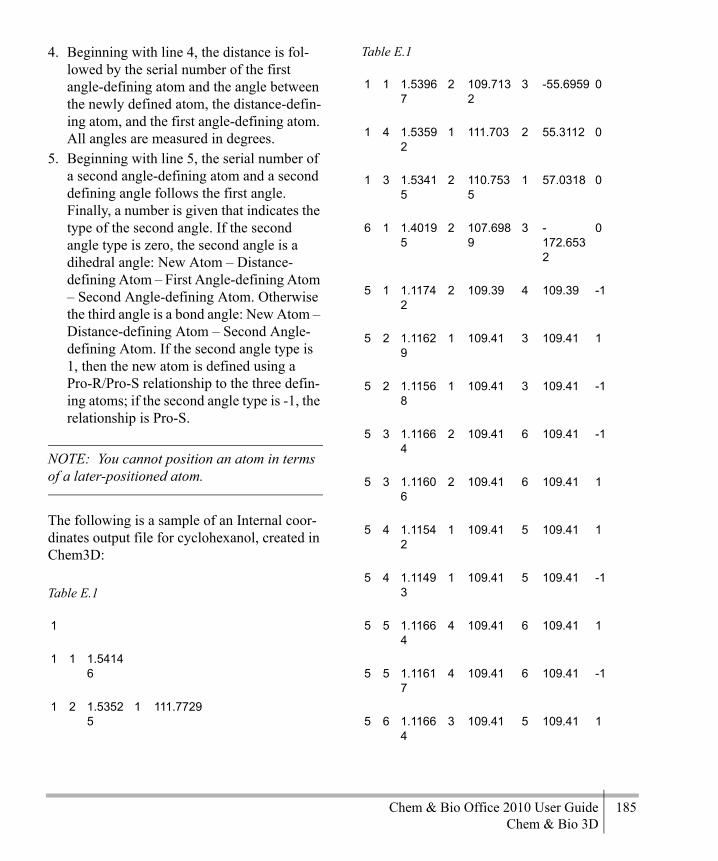
Chem & Bio Office 2010 User Guide 185Chem & Bio 3D
4. Beginning with line 4, the distance is fol-lowed by the serial number of the first angle-defining atom and the angle between the newly defined atom, the distance-defin-ing atom, and the first angle-defining atom. All angles are measured in degrees.
5. Beginning with line 5, the serial number of a second angle-defining atom and a second defining angle follows the first angle. Finally, a number is given that indicates the type of the second angle. If the second angle type is zero, the second angle is a dihedral angle: New Atom – Distance-defining Atom – First Angle-defining Atom – Second Angle-defining Atom. Otherwise the third angle is a bond angle: New Atom – Distance-defining Atom – Second Angle-defining Atom. If the second angle type is 1, then the new atom is defined using a Pro-R/Pro-S relationship to the three defin-ing atoms; if the second angle type is -1, the relationship is Pro-S.
NOTE: You cannot position an atom in terms of a later-positioned atom.
The following is a sample of an Internal coor-dinates output file for cyclohexanol, created in Chem3D:
Table E.1
1
1 1 1.54146
1 2 1.53525
1 111.7729
1 1 1.53967
2 109.7132
3 -55.6959 0
1 4 1.53592
1 111.703 2 55.3112 0
1 3 1.53415
2 110.7535
1 57.0318 0
6 1 1.40195
2 107.6989
3 -172.6532
0
5 1 1.11742
2 109.39 4 109.39 -1
5 2 1.11629
1 109.41 3 109.41 1
5 2 1.11568
1 109.41 3 109.41 -1
5 3 1.11664
2 109.41 6 109.41 -1
5 3 1.11606
2 109.41 6 109.41 1
5 4 1.11542
1 109.41 5 109.41 1
5 4 1.11493
1 109.41 5 109.41 -1
5 5 1.11664
4 109.41 6 109.41 1
5 5 1.11617
4 109.41 6 109.41 -1
5 6 1.11664
3 109.41 5 109.41 1
Table E.1
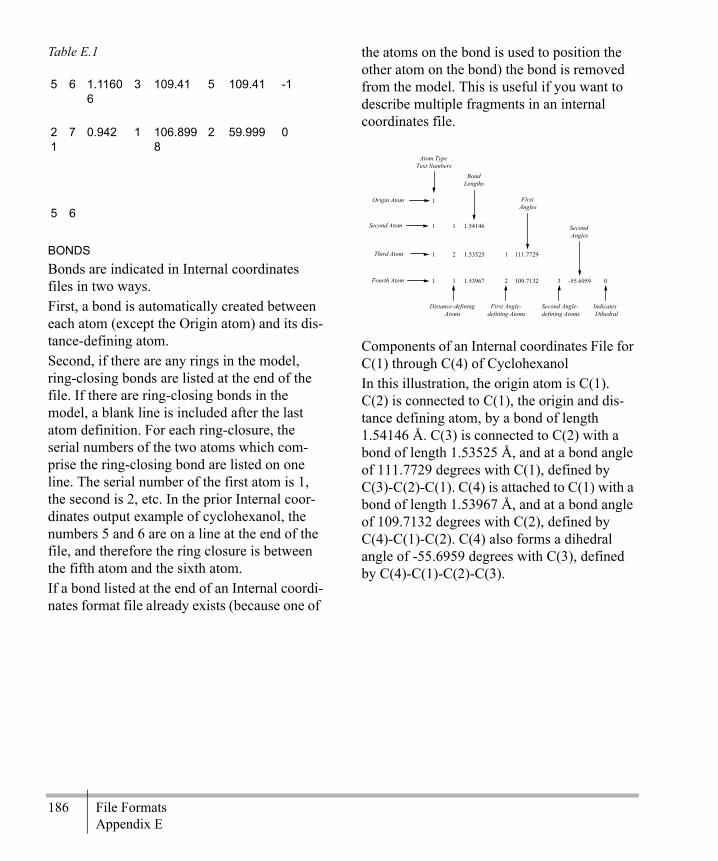
186 File FormatsAppendix E
BONDSBonds are indicated in Internal coordinates files in two ways. First, a bond is automatically created between each atom (except the Origin atom) and its dis-tance-defining atom. Second, if there are any rings in the model, ring-closing bonds are listed at the end of the file. If there are ring-closing bonds in the model, a blank line is included after the last atom definition. For each ring-closure, the serial numbers of the two atoms which com-prise the ring-closing bond are listed on one line. The serial number of the first atom is 1, the second is 2, etc. In the prior Internal coor-dinates output example of cyclohexanol, the numbers 5 and 6 are on a line at the end of the file, and therefore the ring closure is between the fifth atom and the sixth atom. If a bond listed at the end of an Internal coordi-nates format file already exists (because one of
the atoms on the bond is used to position the other atom on the bond) the bond is removed from the model. This is useful if you want to describe multiple fragments in an internal coordinates file.
Components of an Internal coordinates File for C(1) through C(4) of CyclohexanolIn this illustration, the origin atom is C(1). C(2) is connected to C(1), the origin and dis-tance defining atom, by a bond of length 1.54146 Å. C(3) is connected to C(2) with a bond of length 1.53525 Å, and at a bond angle of 111.7729 degrees with C(1), defined by C(3)-C(2)-C(1). C(4) is attached to C(1) with a bond of length 1.53967 Å, and at a bond angle of 109.7132 degrees with C(2), defined by C(4)-C(1)-C(2). C(4) also forms a dihedral angle of -55.6959 degrees with C(3), defined by C(4)-C(1)-C(2)-C(3).
5 6 1.11606
3 109.41 5 109.41 -1
21
7 0.942 1 106.8998
2 59.999 0
5 6
Table E.1
1
1 1 1.54146
1 2 1.53525 1 111.7729
1 1 1.53967 2 109.7132 3 -55.6959 0
Origin Atom
Second Atom
Third Atom
Fourth Atom
Atom Type Text Numbers
Bond Lengths
First Angles
Second Angles
Distance-defining Atoms
First Angle- defining Atoms
Second Angle- defining Atoms
Indicates Dihedral

Chem & Bio Office 2010 User Guide 187Chem & Bio 3D
This portion of the Internal coordinates file for C(1) through C(4) of Cyclohexanol can be rep-resented by the following structural diagram:
FORTRAN FORMATSThe FORTRAN formats for the records in an Internal coordinates file are as follows:
MacroModelMacroModel is produced within the Depart-ment of Chemistry at Columbia University, New York, N.Y. The MacroModel file format is defined in the “MacroModel Structure Files” version 2.0 documentation. The following is a sample file that describes a model of cyclohex-anol.
Line Number Description FORTRAN Format
Comment Ignored by Chem3D
Origin Atom I4
Second Atom I4, 1X, I3, 1X, F9.5
Third Atom I4, 2(1X, I3, 1X, F9.5)
Fourth Atom to Last Atom
I4, 3(1X, I3, 1X, F9.5), I4
Blank Line
Ring Closure Atoms
2(1X, I4)
3
1
4
2
1.541 Å
109.713°
111.771°
1.535 Å
1.540 Å
-55.698° Dihedral Angle
19 cyclohexanol
3 2 1 6 1 7 1 18
1 0 0 0 0 -1.396
0.3501
1.055
0
3 1 1 3 1 8 1 9 1 0 0 0 0 -0.455
-0.740
1.587
0
3 2 1 4 1 10 1 11
1 0 0 0 0 0.511
-1.222
0.497
0
3 3 1 5 1 12 1 13
1 0 0 0 0 1.302
-0.048
-0.10
0
3 4 1 6 1 14 1 15
1 0 0 0 0 0.372
1.0566
-0.62
0
3 1 1 5 1 16 1 17
1 0 0 0 0 -0.606
1.5251
0.459
0
41
1 1 0 0 0 0 0 0 0 0 0 0 -2.068
-0.083
0.277
0
41
2 1 0 0 0 0 0 0 0 0 0 0 -1.053
-1.603
1.968
0
41
2 1 0 0 0 0 0 0 0 0 0 0 0.127
-0.340
2.451
0

188 File FormatsAppendix E
Each line represents a data record containing one or more fields of information about the model. Each field is delimited by space(s) or a tab.The fields in the MacroModel format file used by Chem & Bio 3D are:
1. Line 1 contains 2 fields: the first field is the number of atoms and the second field is the name of the molecule. The molecule name is the file name when the file is created using Chem3D.
2. Lines 2-19 each contain 17 fields describ-ing information about one atom and its attached bond. The first field contains the atom type. The second through thirteenth fields represent 6 pairs of numbers describ-ing the bonds that this atom makes to other atoms. The first number of each pair is the serial number of the other atom, and the second number is the bond type. The four-teenth field is the X coordinate, the fif-teenth field is the Y coordinate, the sixteenth field is the Z coordinate and finally, and the seventeenth field is the color of the atom.
Atom colors are ignored by Chem3D. This field will contain a zero if the file was created using Chem3D.
NOTE: Atom types are user-definable. See “Editing File Format Atom Types” on page 179 for instructions on modifying or creating an atom type.
For example, the following illustrates the atom and bond components for C6 and bond 3 of cyclohexanol:
FORTRAN FORMATSThe FORTRAN format for each record of the MacroModel format is as follows:
41
3 1 0 0 0 0 0 0 0 0 0 0 1.222
-1.972
0.925
0
41
3 1 0 0 0 0 0 0 0 0 0 0 -0.058
-1.742
-0.30
0
41
4 1 0 0 0 0 0 0 0 0 0 0 1.972
0.3806
0.679
0
41
4 1 0 0 0 0 0 0 0 0 0 0 1.960
-0.413
-0.92
0
41
5 1 0 0 0 0 0 0 0 0 0 0 0.981
1.9214
-0.99
0
41
6 1 0 0 0 0 0 0 0 0 0 0 -1.309
2.2832
0.037
0
41
6 1 0 0 0 0 0 0 0 0 0 0 -0.033
2.0317
1.272
0
41
1 1 0 0 0 0 0 0 0 0 0 0 -2.052
0.7172
1.881
0
42
15
1 0 0 0 0 0 0 0 0 0 0 0.275
0.3749
-2.41
0
Line Number
Description FORTRAN Format
3 1 5 1 16 1 17 1 0 0 0 0 -0.606857 1.525177 0.459900 01
Each pair of numbers represents an atom to which this atom is bonded
Z
Atom Color
Serial Number Bond TypeAtom Type X YCoordinates

Chem & Bio Office 2010 User Guide 189Chem & Bio 3D
MDL MolFileThe MDL MolFile format is defined in the arti-cle “Description of Several Chemical Structure File Formats Used by Computer Programs Developed at Molecular Design Limited found in the Journal of Chemical Information and Computer Science, Volume 32, Number 3, 1992, pages 244–255.
NOTE: MDL MACCS-II is a product of MDL Information Systems, Inc. (previously called Molecular Design, Limited).
The following is a sample MDL MolFile file created using Chem3D Pro. This file describes a model of cyclohexanol (the line numbers are added for reference only):
1 number of atoms and molecule name (file name
1X,I5,2X,A
1 cyclohexanol
2
3
4 19 19 0 0 0
5 -1.3488 0.1946 1.0316 C 0 0 0 0 0
6 -0.4072 -0.8965 1.5632 C 0 0 0 0 0
7 0.5621 -1.3777 0.4733 C 0 0 0 0 0
8 1.3507 -0.2045 -0.1277 C 0 0 0 0 0
9 0.4203 0.9011 -0.6518 C 0 0 0 0 0
10 -0.559 1.3696 0.4359 C 0 0 0 0 0
11 -0.3007 0.4266 -1.7567 O 0 0 0 0 0
12 -2.0207 -0.239 0.253 H 0 0 0 0 0
13 -2.0051 0.5617 1.8571 H 0 0 0 0 0
14 -1.0054 -1.7589 1.9444 H 0 0 0 0 0
15 0.1749 -0.4961 2.4273 H 0 0 0 0 0
16 1.27 -2.1277 0.9014 H 0 0 0 0 0
17 -0.0103 -1.8981 -0.3309 H 0 0 0 0 0
18 2.0207 0.225 0.6551 H 0 0 0 0 0
19 2.0084 -0.5688 -0.9529 H 0 0 0 0 0
20 1.0296 7659 -1.0161 H 0 0 0 0 0
21 -1.2615 2.1277 0.0139 H 0 0 0 0 0
22 0.0143 1.8761 1.2488 H 0 0 0 0 0
23 0.3286 0.2227 -2.4273 H 0 0 0 0 0
24 1 2 1 0 0 0
25 1 6 1 0 0 0
26 1 8 1 6 0 0
27 1 9 1 1 0 0
28 2 3 1 6 0 0
29 2 10 1 0 0 0
30 2 11 1 1 0 0

190 File FormatsAppendix E
Each line represents either a blank line, or a data record containing one or more fields of information about the structure. Each field is delimited by a space(s) or a tab. The fields in the MDL MolFile format used by Chem3D Pro are discussed below:
1. Line 1 starts the header block, which con-tains the name of the molecule. The mole-cule name is the file name when the file was created using Chem3D Pro.
2. Line 2 continues the Header block, and is a blank line.
3. Line 3 continues the Header block, and is another blank line.
4. Line 4 (the Counts line) contains 5 fields which describes the molecule: The first field is the number of atoms, the second field is the number of bonds, the third field is the number of atom lists, the fourth field is an unused field and the fifth field is the stereochemistry.
NOTE: Chem3D Pro ignores the following fields: number of atom lists, the unused field and stereochemistry. These fields will always contain a zero if the file was created using Chem3D Pro.
5. Lines 5–23 (the Atom block) each contain 9 fields which describes an atom in the mole-cule: The first field is the X coordinate, the second field is the Y coordinate, the third field is the Z coordinate, the fourth field is the atomic symbol, the fifth field is the mass difference, the sixth field is the charge, the seventh field is the stereo parity designator, the eighth field is the number of hydrogens and the ninth field is the center.
NOTE: Chem3D Pro ignores the following fields: mass difference, charge, stereo parity designator, number of hydrogens, and center. These fields contain zeros if the file was created using Chem3D Pro.
6. Lines 24–42 (the Bond block) each contain 6 fields which describe a bond in the mole-cule: the first field is the from-atom id, the second field is the to-atom id, the third field is the bond type, the fourth field is the bond stereo designator, the fifth field is an
31 3 4 1 0 0 0
32 3 12 1 0 0 0
33 3 13 1 6 0 0
34 4 5 1 0 0 0
35 4 14 1 1 0 0
36 4 15 1 6 0 0
37 5 6 1 1 0 0
38 5 7 1 6 0 0
39 5 16 1 0 0 0
40 6 17 1 0 0 0
41 6 18 1 1 0 0
42 7 19 1 6 0 0

Chem & Bio Office 2010 User Guide 191Chem & Bio 3D
unused field and the sixth field is the topol-ogy code.
NOTE: Chem3D Pro ignores the unused field and topology code. These fields will contain zeros if the file was created using Chem3D Pro.
LIMITATIONSThe MDL MolFile format does not support non-integral charges in the same way as Chem3D Pro. For example, in a typical MDL MolFile format file, the two oxygens in a nitro functional group (NO2) contain different charges: -1 and 0. In Chem3D models, the oxy-gen atoms each contain a charge of -0.500.FORTRAN FORMATSThe FORTRAN format for each record of the MDL MolFile format is as follows:
MSI MolFileThe MSI MolFile is defined in Chapter 4, “Chem-Note File Format” in the Centrum: Chem-Note™ Application documentation, pages 4-1 to 4-5. The following is a sample MSI MolFile file created using Chem3D Pro for cyclohexanol (the line numbers are added for purposes of discussion only):
Line Num-ber
Description FORTRAN For-mat
1 Molecule name (file name)
A
2 Blank line
3 Blank line
4 Number of atoms Number of bonds
5I3
5–23 Atom coordi-nates, atomic symbol
3F10.4,1X,A2,5I3
24–42 Bond id, from atom, to atom, and bond type
6(1X,I2)
Figure E.5 : MSI Molfile format
1 ! Polygen 133
2 Polygen Corporation: ChemNote molecule file (2D)
3 * File format version number
4 90.0928
5 * File update version number
6 92.0114
7 * molecule name
8 cyclohexanol-MSI
9 empirical formula
10 Undefined Empirical Formula

192 File FormatsAppendix E
11 * need 3D conversion?
12 0
13 * 3D displacement vector
14 0.000 0.000 0.000
15 * 3D rotation matrix
16 1.000 0.000 0.000 0.000 1.000 0.000 0.000 0.000 1.000
17 * 3D scale factor
18 0
19 * 2D scale factor
20 1
21 * 2D attributes
22 1 0 0 0 0 0 0 0 0 0 0 0 0 0 0
23 * 3D attributes
24 0 0 0 0 0 0 0 0 0 0 0
25 * Global display attributes
26 1 0 1 12 256
27 * Atom List
28 * Atom# Lbl Type x y x y z bits chrg ichrg frag istp lp chrl ring frad name seg grp FLAGS
29 1 C 10 0 0 -1 0.46 0.2 0 0 0 0 0 0 0 0 0 C 1 0 -1 0 0 0 0 0 0 [C]
30 2 C 10 0 0 1.2 -1.1 0.2 0 0 0 0 0 0 0 0 0 C 2 0 -1 0 0 0 0 0 0 [C]
30 2 C 10 0 0 1.2 -1.1 0.2 0 0 0 0 0 0 0 0 0 C 2 0 -1 0 0 0 0 0 0 [C]
31 3 C 10 0 0 0.1 -1.6 0.7 0 0 0 0 0 0 0 0 0 C 3 0 -1 0 0 0 0 0 0 [C]
32 4 C 10 0 0 1.3 -1.1 0 0 0 0000000C40-1000000[C]
33 5 C 10 0 0 1.2 0.48 0 0 0 0 0 0 0 0 0 0 C 5 0 -1 0 0 0 0 0 0 [C]
34 6 C 10 0 0 0 1.01 -1 0 0 0 0 0 0 0 0 0 C 6 0 -1 0 0 0 0 0 0 [C]
35 7 O 45 0 0 0 2.42 -1 0 0 0 0 0 0 0 0 0 O 7 0 -1 0 0 0 0 0 0 [O]
36 8 H 8 0 0 0.6 2.72 -1 0 0 0 0 0 0 0 0 0 H 7 0 -1 0 0 0 0 0 0 [H]
37 9 H 1 0 0 2.1 0.86 -1 0 0 0 0 0 0 0 0 0 H 8 0 -1 0 0 0 0 0 0 [H]
38 10 H 1 0 0 1.4 0.86 0.8 0 0 0 0 0 0 0 0 0 H 9 0 -1 0 0 0 0 0 0 [H]
39 11 H 1 0 0 1.1 -1.4 -1 0 0 0 0 0 0 0 0 0 H 10 0 -1 0 0 00 00[H]
40 12 H 1 0 0 2.2 -1.4 0.2 0 0 0 0 0 0 0 0 0 H 11 0 -1 0 0 0000 [H]
41 13 H 1 0 0 0 0.72 -2 0 0 0 0 0 0 0 0 0 H 12 0 -1 0 0000 0 [H]
42 14 H 1 0 0 0.1 -2.7 0.7 0 0 0 0 0 0 0 0 0 H 13 0 -1 0 0 0000 [H]
43 15 H 1 0 0 0.3 -1.3 1.7 0 0 0 0 0 0 0 0 0 H 14 0 -1 0 0 0 00 [H]
Figure E.5 : MSI Molfile format
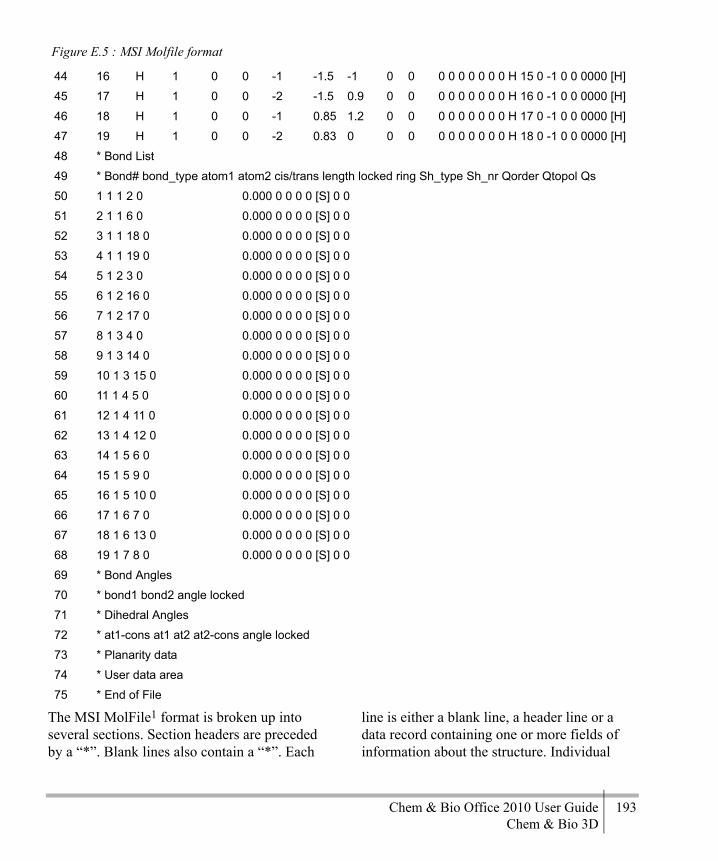
Chem & Bio Office 2010 User Guide 193Chem & Bio 3D
The MSI MolFile1 format is broken up into several sections. Section headers are preceded by a “*”. Blank lines also contain a “*”. Each
line is either a blank line, a header line or a data record containing one or more fields of information about the structure. Individual
44 16 H 1 0 0 -1 -1.5 -1 0 0 0 0 0 0 0 0 0 H 15 0 -1 0 0 0000 [H]
45 17 H 1 0 0 -2 -1.5 0.9 0 0 0 0 0 0 0 0 0 H 16 0 -1 0 0 0000 [H]
46 18 H 1 0 0 -1 0.85 1.2 0 0 0 0 0 0 0 0 0 H 17 0 -1 0 0 0000 [H]
47 19 H 1 0 0 -2 0.83 0 0 0 0 0 0 0 0 0 0 H 18 0 -1 0 0 0000 [H]
48 * Bond List
49 * Bond# bond_type atom1 atom2 cis/trans length locked ring Sh_type Sh_nr Qorder Qtopol Qs
50 1 1 1 2 0 0.000 0 0 0 0 [S] 0 0
51 2 1 1 6 0 0.000 0 0 0 0 [S] 0 0
52 3 1 1 18 0 0.000 0 0 0 0 [S] 0 0
53 4 1 1 19 0 0.000 0 0 0 0 [S] 0 0
54 5 1 2 3 0 0.000 0 0 0 0 [S] 0 0
55 6 1 2 16 0 0.000 0 0 0 0 [S] 0 0
56 7 1 2 17 0 0.000 0 0 0 0 [S] 0 0
57 8 1 3 4 0 0.000 0 0 0 0 [S] 0 0
58 9 1 3 14 0 0.000 0 0 0 0 [S] 0 0
59 10 1 3 15 0 0.000 0 0 0 0 [S] 0 0
60 11 1 4 5 0 0.000 0 0 0 0 [S] 0 0
61 12 1 4 11 0 0.000 0 0 0 0 [S] 0 0
62 13 1 4 12 0 0.000 0 0 0 0 [S] 0 0
63 14 1 5 6 0 0.000 0 0 0 0 [S] 0 0
64 15 1 5 9 0 0.000 0 0 0 0 [S] 0 0
65 16 1 5 10 0 0.000 0 0 0 0 [S] 0 0
66 17 1 6 7 0 0.000 0 0 0 0 [S] 0 0
67 18 1 6 13 0 0.000 0 0 0 0 [S] 0 0
68 19 1 7 8 0 0.000 0 0 0 0 [S] 0 0
69 * Bond Angles
70 * bond1 bond2 angle locked
71 * Dihedral Angles
72 * at1-cons at1 at2 at2-cons angle locked
73 * Planarity data
74 * User data area
75 * End of File
Figure E.5 : MSI Molfile format
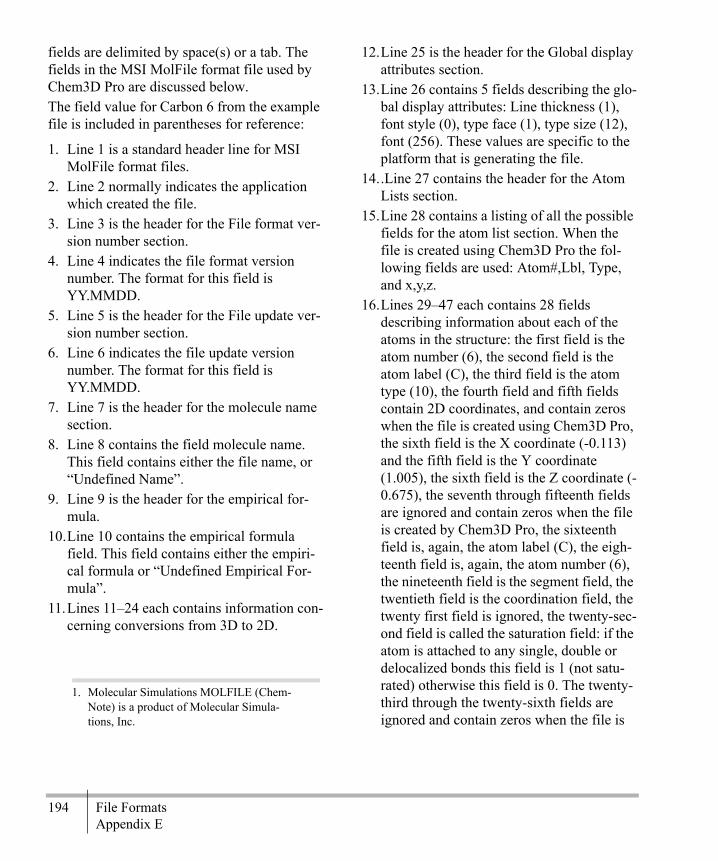
194 File FormatsAppendix E
fields are delimited by space(s) or a tab. The fields in the MSI MolFile format file used by Chem3D Pro are discussed below. The field value for Carbon 6 from the example file is included in parentheses for reference:
1. Line 1 is a standard header line for MSI MolFile format files.
2. Line 2 normally indicates the application which created the file.
3. Line 3 is the header for the File format ver-sion number section.
4. Line 4 indicates the file format version number. The format for this field is YY.MMDD.
5. Line 5 is the header for the File update ver-sion number section.
6. Line 6 indicates the file update version number. The format for this field is YY.MMDD.
7. Line 7 is the header for the molecule name section.
8. Line 8 contains the field molecule name. This field contains either the file name, or “Undefined Name”.
9. Line 9 is the header for the empirical for-mula.
10.Line 10 contains the empirical formula field. This field contains either the empiri-cal formula or “Undefined Empirical For-mula”.
11.Lines 11–24 each contains information con-cerning conversions from 3D to 2D.
12.Line 25 is the header for the Global display attributes section.
13.Line 26 contains 5 fields describing the glo-bal display attributes: Line thickness (1), font style (0), type face (1), type size (12), font (256). These values are specific to the platform that is generating the file.
14..Line 27 contains the header for the Atom Lists section.
15.Line 28 contains a listing of all the possible fields for the atom list section. When the file is created using Chem3D Pro the fol-lowing fields are used: Atom#,Lbl, Type, and x,y,z.
16.Lines 29–47 each contains 28 fields describing information about each of the atoms in the structure: the first field is the atom number (6), the second field is the atom label (C), the third field is the atom type (10), the fourth field and fifth fields contain 2D coordinates, and contain zeros when the file is created using Chem3D Pro, the sixth field is the X coordinate (-0.113) and the fifth field is the Y coordinate (1.005), the sixth field is the Z coordinate (-0.675), the seventh through fifteenth fields are ignored and contain zeros when the file is created by Chem3D Pro, the sixteenth field is, again, the atom label (C), the eigh-teenth field is, again, the atom number (6), the nineteenth field is the segment field, the twentieth field is the coordination field, the twenty first field is ignored, the twenty-sec-ond field is called the saturation field: if the atom is attached to any single, double or delocalized bonds this field is 1 (not satu-rated) otherwise this field is 0. The twenty-third through the twenty-sixth fields are ignored and contain zeros when the file is
1. Molecular Simulations MOLFILE (Chem-Note) is a product of Molecular Simula-tions, Inc.

Chem & Bio Office 2010 User Guide 195Chem & Bio 3D
created using Chem3D Pro, the twenty-sev-enth field is, again, the atom label (C).
NOTE: Atom types in the Molecular Simula-tions MolFile format are user-definable. For more information, see “Editing File Format Atom Types” on page 179.
17.Line 48 contains the header for the Bond List section.
18.Line 49 contains a listing of all the possible fields for the bond list section. When the file is created by Chem3D Pro the follow-ing fields are used: Bond#, Bond_type, atom 1, atom 2 and cis/trans and Qorder.
19.Lines 50–68 each contain 4 fields describ-ing information about each of the bonds in the structure: the first field is the internal bond number (6), the second field is the bond type (1), the third and fourth fields are the atom serial numbers for the atoms involved in the bond [atom 1 (2), atom 2 (16)], the fifth field is the cis/trans designa-tor (this is 0 if it does not apply), the sixth through tenth fields are ignored, and con-tain zeros if the file is created using Chem3D Pro, the eleventh field contains the bond order ([S] meaning single), the twelfth and thirteenth fields are ignored and contain zeros if the file is created using Chem3D Pro.
20.Lines 69–73 are each a section header for 3D conversion use. This section only con-tains the header name only (as shown) when the file is created using Chem3D Pro.
21.Line 74 is a header for the section User data area. This section contains the header name only (as shown) when the file is created using Chem3D Pro.
22.Line 75 is a header that indicates the End of File.
FORTRAN FORMATSThe FORTRAN format for each record of the Molecular Simulations MolFile format is as follows:
MOPAC The specific format of the MOPAC files used by Chem3D is the MOPAC Data-File format. This format is described on pages 1-5 through 1-7 in the “Description of MOPAC” section and page 3-5 in the “Geometry Specification” section in the MOPAC Manual (fifth edition). For further details about the MOPAC Data-File format, please refer to the above publica-tion. The following is a sample MOPAC output file from Chem3D for cyclohexanol:
Line Number
Description FORTRAN For-mat
29-47 atom list, field value
I,1X,A,3(1X,I),3F9.3,1X,I,F4.1,7(1X,I),1X,A,I,8(1X,I), “[“,A, “] “
50-68 bond list, field values
I,4(1X,I),F9.3,4(2X,I),1X, “[“,A1, “] “,2(1X,I)
Table E.2
Line 1:
Line 2:
Cyclohexanol

196 File FormatsAppendix E
The following illustrates the components of the MOPAC Output File from Chem3D for C(1) Through C(4) of Cyclohexanol
The internal coordinates section of the MOPAC Data-File format contains one line of text for each atom in the model. Each line con-tains bond lengths, bond angles, dihedral angles, action integers, and connectivity atoms.As shown in the illustration above, C(1) is the origin atom. C(2) is connected to C(1) with a bond of length 1.541519 Å. C(3) is connected to C(2) with a bond of length 1.535233 Å, and
Line 3:
Line 4a:
C 0 0 0 0 0 0 0 0 0
Line 4b:
C 1.54152 1 0 0 0 0 1 0 0
Line 4c:
C 1.53523 1 111.7747
1 0 0 2 1 0
Line 4d:
C 1.53973 1 109.7114
1 -55.6959 1 1 2 3
Line 4e:
C 1.53597 1 111.7012
1 55.3112 1 4 1 2
Line 4f:
C 1.53424 1 110.7535
1 57.03175 1 3 2 1
Line 4g:
O 1.40196 1 107.6989
1 -172.662 1 1 2 3
Line 4h:
H 1.11739 1 107.8685
1 62.06751 1 1 2 3
Line 4I:
H 1.11633 1 110.0751
1 -177.17 1 2 1 4
Line 4j:
H 1.11566 1 109.4526
1 65.43868 1 2 1 4
Line 4k:
H 1.11665 1 109.9597
1 178.6209 1 3 2 1
Line 4l:
H 1.1161 1 109.5453
1 -63.9507 1 3 2 1
Line 4m:
H 1.11542 1 109.4316
1 -66.0209 1 4 1 2
Table E.2
Line 4n:
H 1.11499 1 110.549
1 176.0838 1 4 1 2
Line 4o:
H 1.11671 1 109.93 1 -178.296 1 5 4 1
Line 4p:
H 1.11615 1 109.4596
1 64.43501 1 5 4 1
Line 4q:
H 1.11664 1 110.0104
1 -178.325 1 6 3 2
Line 4r:
H 1.11604 1 109.6082
1 64.09581 1 6 3 2
Line 4s:
H 0.94199 1 106.898
1 -173.033 1 7 1 2
Table E.2
Bond Lengths
Action Integers
Bond Angles
Dihedral Angles
Action Integers
Action Integers
Element Symbol
1st Atom
2nd Atom
3rd Atom
4th Atom
C
C
C
C
0.000000
1.541519
1.535233
1.539734
0.000000
0.000000
111.774673
109.711411
0.000000
0.000000
0.000000
-55.695877
0
1
1
1
0
0
0
0
01
1 1
0 0 0
1 0 0
2 1 0
1 2 3
Connectivity Atoms
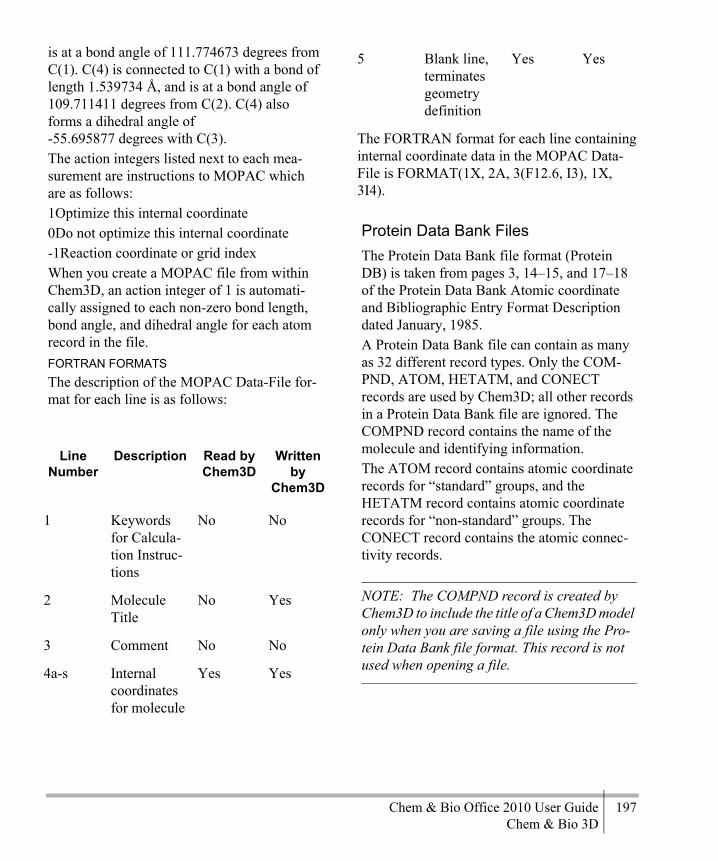
Chem & Bio Office 2010 User Guide 197Chem & Bio 3D
is at a bond angle of 111.774673 degrees from C(1). C(4) is connected to C(1) with a bond of length 1.539734 Å, and is at a bond angle of 109.711411 degrees from C(2). C(4) also forms a dihedral angle of -55.695877 degrees with C(3). The action integers listed next to each mea-surement are instructions to MOPAC which are as follows:1Optimize this internal coordinate0Do not optimize this internal coordinate-1Reaction coordinate or grid indexWhen you create a MOPAC file from within Chem3D, an action integer of 1 is automati-cally assigned to each non-zero bond length, bond angle, and dihedral angle for each atom record in the file. FORTRAN FORMATSThe description of the MOPAC Data-File for-mat for each line is as follows:
Protein Data Bank FilesThe Protein Data Bank file format (Protein DB) is taken from pages 3, 14–15, and 17–18 of the Protein Data Bank Atomic coordinate and Bibliographic Entry Format Description dated January, 1985.A Protein Data Bank file can contain as many as 32 different record types. Only the COM-PND, ATOM, HETATM, and CONECT records are used by Chem3D; all other records in a Protein Data Bank file are ignored. The COMPND record contains the name of the molecule and identifying information. The ATOM record contains atomic coordinate records for “standard” groups, and the HETATM record contains atomic coordinate records for “non-standard” groups. The CONECT record contains the atomic connec-tivity records.
NOTE: The COMPND record is created by Chem3D to include the title of a Chem3D model only when you are saving a file using the Pro-tein Data Bank file format. This record is not used when opening a file.
Line Number
Description Read by Chem3D
Written by
Chem3D
1 Keywords for Calcula-tion Instruc-tions
No No
2 Molecule Title
No Yes
3 Comment No No
4a-s Internal coordinates for molecule
Yes Yes
5 Blank line, terminates geometry definition
Yes Yes
The FORTRAN format for each line containing internal coordinate data in the MOPAC Data-File is FORMAT(1X, 2A, 3(F12.6, I3), 1X, 3I4).
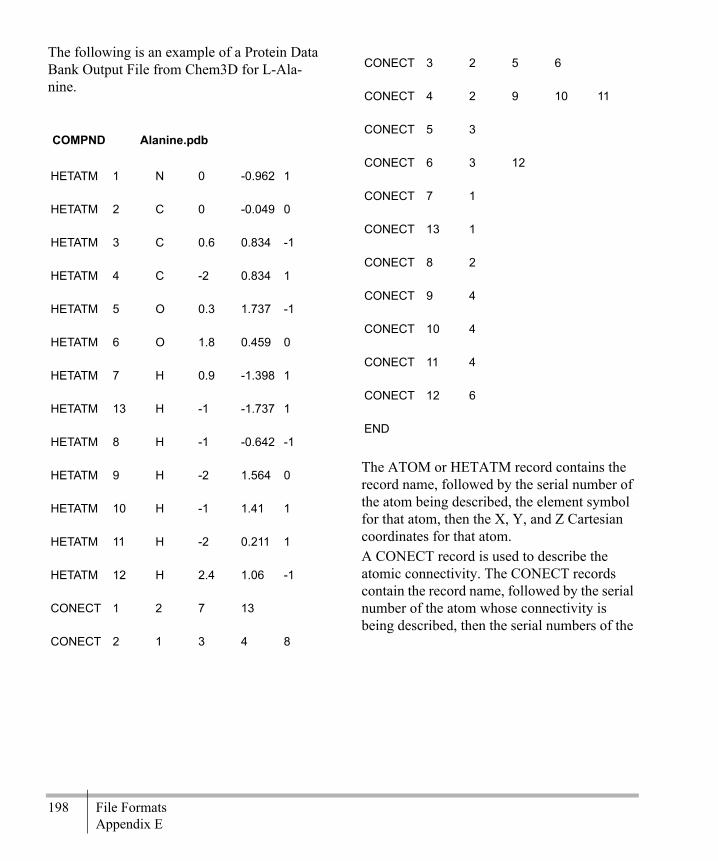
198 File FormatsAppendix E
The following is an example of a Protein Data Bank Output File from Chem3D for L-Ala-nine.
The ATOM or HETATM record contains the record name, followed by the serial number of the atom being described, the element symbol for that atom, then the X, Y, and Z Cartesian coordinates for that atom. A CONECT record is used to describe the atomic connectivity. The CONECT records contain the record name, followed by the serial number of the atom whose connectivity is being described, then the serial numbers of the
COMPND Alanine.pdb
HETATM 1 N 0 -0.962 1
HETATM 2 C 0 -0.049 0
HETATM 3 C 0.6 0.834 -1
HETATM 4 C -2 0.834 1
HETATM 5 O 0.3 1.737 -1
HETATM 6 O 1.8 0.459 0
HETATM 7 H 0.9 -1.398 1
HETATM 13 H -1 -1.737 1
HETATM 8 H -1 -0.642 -1
HETATM 9 H -2 1.564 0
HETATM 10 H -1 1.41 1
HETATM 11 H -2 0.211 1
HETATM 12 H 2.4 1.06 -1
CONECT 1 2 7 13
CONECT 2 1 3 4 8
CONECT 3 2 5 6
CONECT 4 2 9 10 11
CONECT 5 3
CONECT 6 3 12
CONECT 7 1
CONECT 13 1
CONECT 8 2
CONECT 9 4
CONECT 10 4
CONECT 11 4
CONECT 12 6
END

Chem & Bio Office 2010 User Guide 199Chem & Bio 3D
first atom, second atom, third atom and fourth atom to which the described atom is connected.
FORTRAN FORMATSThe full description of the COMPND record format in Protein Data Bank files is as follows:
The full description of the ATOM and HETATM record formats in Protein Data Bank files is as follows:
The full description of the CONECT record format in Protein Data Bank files is as follows:
Column Number
Column Descrip-tion
Used by Chem3D
1-6 Record Name (COMPND)
Yes
7-10 UNUSED No
11-70 Name of Molecule Yes
Column Number
Column Descrip-tion
Used by Chem3D
1-6 Record Name (HETATM or ATOM)
Yes
7-11 Atom Serial Num-ber
Yes
Record Name
Serial Number
Element Symbol
X Coord.
Y Coord.
Z Coord.
Record Name
1st Atom Serial
Number
2nd Atom Serial
Number
3rd Atom Serial
Number
4th Atom Serial
Number
Serial Number
Chem3D File Title
Record Name
HETATM 1 N
2 1 3 4 8
0.038 -0.962 0.943
CONECT
Alanine.pdbCOMPND
12 UNUSED No
13–16 Atom Name (Ele-ment Symbol)
Yes
17 Alternate Location Indicator
No
18–20 Residue Name Optional
21 UNUSED No
22 Chain Identifier No
23–26 Residue Sequence Number
No
27 Code for insertions of residues
No
28–30 UNUSED No
31–38 X Orthogonal Å coordinates
Yes
39–46 Y Orthogonal Å coordinates
Yes
47–54 Z Orthogonal Å coordinates
Yes
55–60 Occupancy No
61–66 Temperature Factor No
67 UNUSED No
68–70 Footnote Number No
Column Number
Column Description Used by Chem3D
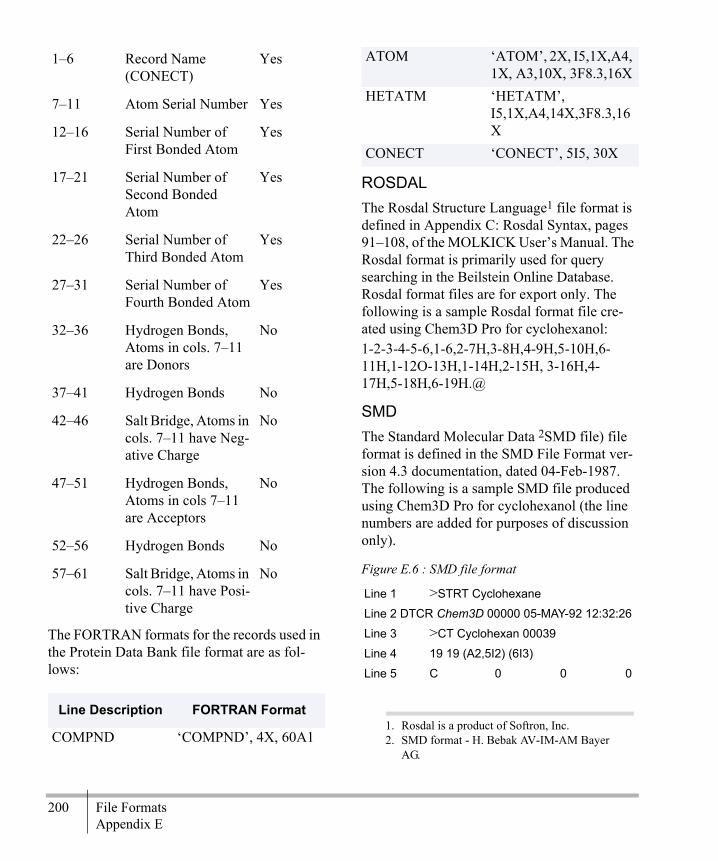
200 File FormatsAppendix E
The FORTRAN formats for the records used in the Protein Data Bank file format are as fol-lows:
ROSDAL The Rosdal Structure Language1 file format is defined in Appendix C: Rosdal Syntax, pages 91–108, of the MOLKICK User’s Manual. The Rosdal format is primarily used for query searching in the Beilstein Online Database. Rosdal format files are for export only. The following is a sample Rosdal format file cre-ated using Chem3D Pro for cyclohexanol:1-2-3-4-5-6,1-6,2-7H,3-8H,4-9H,5-10H,6-11H,1-12O-13H,1-14H,2-15H, 3-16H,4-17H,5-18H,6-19H.@
SMDThe Standard Molecular Data 2SMD file) file format is defined in the SMD File Format ver-sion 4.3 documentation, dated 04-Feb-1987. The following is a sample SMD file produced using Chem3D Pro for cyclohexanol (the line numbers are added for purposes of discussion only).
1–6 Record Name (CONECT)
Yes
7–11 Atom Serial Number Yes
12–16 Serial Number of First Bonded Atom
Yes
17–21 Serial Number of Second Bonded Atom
Yes
22–26 Serial Number of Third Bonded Atom
Yes
27–31 Serial Number of Fourth Bonded Atom
Yes
32–36 Hydrogen Bonds, Atoms in cols. 7–11 are Donors
No
37–41 Hydrogen Bonds No
42–46 Salt Bridge, Atoms in cols. 7–11 have Neg-ative Charge
No
47–51 Hydrogen Bonds, Atoms in cols 7–11 are Acceptors
No
52–56 Hydrogen Bonds No
57–61 Salt Bridge, Atoms in cols. 7–11 have Posi-tive Charge
No
Line Description FORTRAN Format
COMPND ‘COMPND’, 4X, 60A1
ATOM ‘ATOM’, 2X, I5,1X,A4, 1X, A3,10X, 3F8.3,16X
HETATM ‘HETATM’, I5,1X,A4,14X,3F8.3,16X
CONECT ‘CONECT’, 5I5, 30X
1. Rosdal is a product of Softron, Inc.2. SMD format - H. Bebak AV-IM-AM Bayer
AG.
Figure E.6 : SMD file format
Line 1 >STRT Cyclohexane
Line 2 DTCR Chem3D 00000 05-MAY-92 12:32:26
Line 3 >CT Cyclohexan 00039
Line 4 19 19 (A2,5I2) (6I3)
Line 5 C 0 0 0

Chem & Bio Office 2010 User Guide 201Chem & Bio 3D
Each line is either a blank line, a block header line or a data record containing multiple fields of information about the structure. The SMD file is broken down into several blocks of information. The header for each block starts with a > sign. Individual fields are delimited by space(s) or a tab. The fields in the SMD format file used by Chem3D Pro are discussed below:
1. Line 1 starts the block named STRT. This block contains the molecule name. The
Line 6 C 0 0 0
Line 7 C 0 0 0
Line 8 C 0 0 0
Line 9 C 0 0 0
Line 10 C 0 0 0
Line 11 H 0 0 0
Line 12 H 0 0 0
Line 13 H 0 0 0
Line 14 H 0 0 0
Line 15 H 0 0 0
Line 16 O 0 0 0
Line 17 H 0 0 0
Line 18 H 0 0 0
Line 19 H 0 0 0
Line 20 H 0 0 0
Line 21 H 0 0 0
Line 22 H 0 0 0
Line 23 H 0 0 0
Line 24 1 2 1
Line 25 1 6 1
Line 26 1 12 1
Line 27 1 14 1
Line 28 2 3 1
Line 29 2 7 1
Line 30 2 15 1
Line 31 3 4 1
Line 32 3 8 1
Line 33 3 16 1
Line 34 4 5 1
Line 35 4 9 1
Line 36 4 17 1
Line 37 5 6 1
Line 38 5 10 1
Line 39 5 18 1
Figure E.6 : SMD file format
Line 40 6 11 1
Line 41 6 19 1
Line 42 12 13 1
Line 43 >CO ANGSTROEM 0020
Line 44 4 (3I10)
Line 45 -6903 13566 -4583
Line 46 -14061 808 125
Line 47 -4424 -8880 7132
Line 48 7577 -12182 -1855
Line 49 14874 594 -6240
Line 50 5270 10234 -13349
Line 51 -18551 -4300 -8725
Line 52 -9815 -18274 9852
Line 53 4047 -17718 -10879
Line 54 19321 5600 2685
Line 55 10636 19608 -16168
Line 56 -2794 21139 6600
Line 57 2876 15736 11820
Line 58 -14029 20018 -10310
Line 59 -22477 3450 6965
Line 60 -806 -4365 16672
Line 61 14642 -18918 3566
Line 62 23341 -2014 -13035
Line 63 1740 5536 -22837
Figure E.6 : SMD file format

202 File FormatsAppendix E
molecule name is the file name when the file was created using Chem3D Pro.
2. Line 2 starts the block named DTCR. The information in this line includes the name of the application that created the file and the date and time when the file was gener-ated.
3. Line 3 starts the block named CT which contains the connection table of the com-pound(s). Also on this line is a 10 character description of the connection table. This will be the same as the file name when the file is generated using Chem3D Pro. Finally, the number of records contained within the CT block is indicated, 39 in the above example.
4. Line 4 of the CT Block contains four fields. The first field is the number of atoms, the second field is the number of bonds, the third field is the FORTRAN format for the number of atoms, and the fourth field is the FORTRAN format for the number of bonds.
5. Lines 5–23 of the CT Block each contain 4 fields describing an atom. The first field is the element symbol (first letter uppercase, second lowercase). The second field is the total number of hydrogens attached to the atom, the third field is the stereo informa-tion about the atom and the fourth field is the formal charge of the atom.
NOTE: If the file is created using Chem3D Pro, the number of hydrogens, the stereo infor-mation and the formal charge fields are not used, and will always contain zeros.
6. Lines 24–42 of the CT Block each contains 3 fields describing a bond between the two atoms. The first field is the serial number of
the atom from which the bond starts, the second field is the serial number of atom where the bond ends, and the third field is the bond order.
7. Line 43 starts the block named CO, The information in this block includes the Car-tesian coordinates of all the atoms from the CT block and indicates the type of coordi-nates used, Angstroms in this example. Also in this line is the number of lines in the block, 20 in this example.
8. Line 44 contains two fields. The first field contains the exponent used to convert the coordinates in the lines following to the coordinate type specified in line 43. The second field is the FORTRAN format of the atom coordinates.
9. Lines 45–65 each contains three fields describing the Cartesian coordinates of an atom indicated in the CT block. The first field is the X coordinate, the second field is the Y coordinate and the third field is the Z coordinate.
SYBYL MOL FileThe SYBYL MOL File format (SYBYL) is defined in Chapter 9, “SYBYL File Formats”, pages 9–1 through 9–5, of the 1989 SYBYL Programming Manual.The following is an example of a file in SYBYL format produced from within Chem3D. This file describes a model of cyclo-hexanol.
Table E.3
19 MOL Cyclohexanol0
1 1 1.068 0.3581 -0.7007C
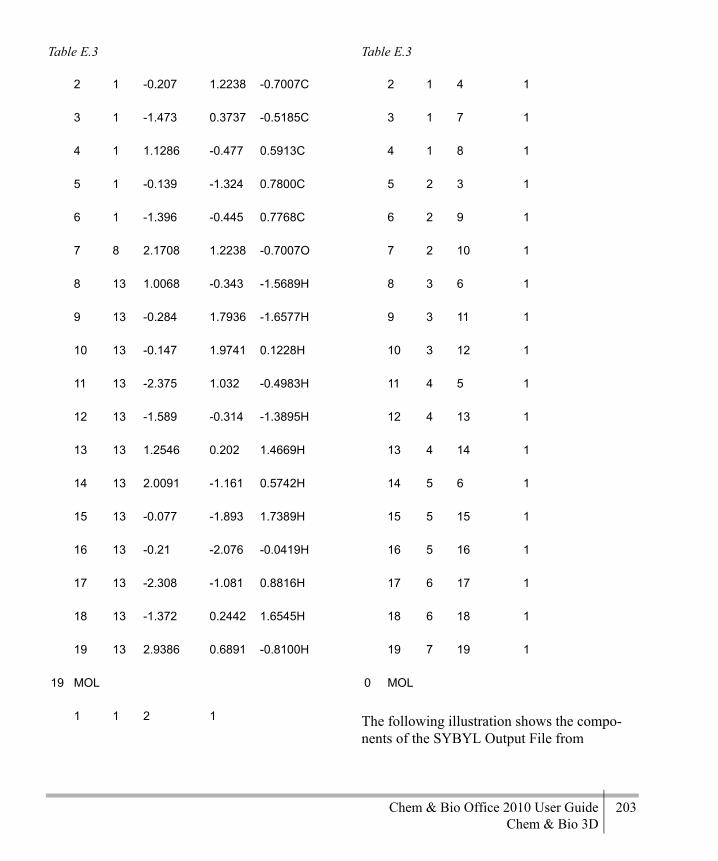
Chem & Bio Office 2010 User Guide 203Chem & Bio 3D
The following illustration shows the compo-nents of the SYBYL Output File from
2 1 -0.207 1.2238 -0.7007C
3 1 -1.473 0.3737 -0.5185C
4 1 1.1286 -0.477 0.5913C
5 1 -0.139 -1.324 0.7800C
6 1 -1.396 -0.445 0.7768C
7 8 2.1708 1.2238 -0.7007O
8 13 1.0068 -0.343 -1.5689H
9 13 -0.284 1.7936 -1.6577H
10 13 -0.147 1.9741 0.1228H
11 13 -2.375 1.032 -0.4983H
12 13 -1.589 -0.314 -1.3895H
13 13 1.2546 0.202 1.4669H
14 13 2.0091 -1.161 0.5742H
15 13 -0.077 -1.893 1.7389H
16 13 -0.21 -2.076 -0.0419H
17 13 -2.308 -1.081 0.8816H
18 13 -1.372 0.2442 1.6545H
19 13 2.9386 0.6891 -0.8100H
19 MOL
1 1 2 1
Table E.3
2 1 4 1
3 1 7 1
4 1 8 1
5 2 3 1
6 2 9 1
7 2 10 1
8 3 6 1
9 3 11 1
10 3 12 1
11 4 5 1
12 4 13 1
13 4 14 1
14 5 6 1
15 5 15 1
16 5 16 1
17 6 17 1
18 6 18 1
19 7 19 1
0 MOL
Table E.3
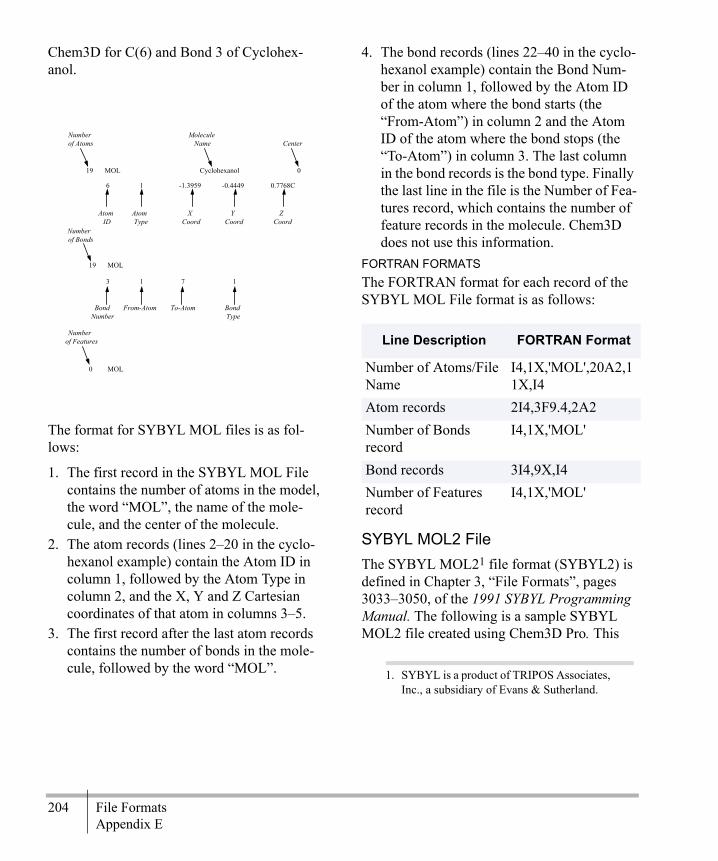
204 File FormatsAppendix E
Chem3D for C(6) and Bond 3 of Cyclohex-anol.
The format for SYBYL MOL files is as fol-lows:
1. The first record in the SYBYL MOL File contains the number of atoms in the model, the word “MOL”, the name of the mole-cule, and the center of the molecule.
2. The atom records (lines 2–20 in the cyclo-hexanol example) contain the Atom ID in column 1, followed by the Atom Type in column 2, and the X, Y and Z Cartesian coordinates of that atom in columns 3–5.
3. The first record after the last atom records contains the number of bonds in the mole-cule, followed by the word “MOL”.
4. The bond records (lines 22–40 in the cyclo-hexanol example) contain the Bond Num-ber in column 1, followed by the Atom ID of the atom where the bond starts (the “From-Atom”) in column 2 and the Atom ID of the atom where the bond stops (the “To-Atom”) in column 3. The last column in the bond records is the bond type. Finally the last line in the file is the Number of Fea-tures record, which contains the number of feature records in the molecule. Chem3D does not use this information.
FORTRAN FORMATSThe FORTRAN format for each record of the SYBYL MOL File format is as follows:
SYBYL MOL2 FileThe SYBYL MOL21 file format (SYBYL2) is defined in Chapter 3, “File Formats”, pages 3033–3050, of the 1991 SYBYL Programming Manual. The following is a sample SYBYL MOL2 file created using Chem3D Pro. This
19 MOL
19 MOL
Cyclohexanol 0
6 1 -1.3959 -0.4449 0.7768C
3 1 7 1
0 MOL
Number of Atoms
Molecule Name Center
Atom ID
Atom Type
X Coord
Y Coord
Z Coord
Number of Bonds
Number of Features
Bond Number
From-Atom To-Atom Bond Type
Line Description FORTRAN Format
Number of Atoms/File Name
I4,1X,'MOL',20A2,11X,I4
Atom records 2I4,3F9.4,2A2Number of Bonds record
I4,1X,'MOL'
Bond records 3I4,9X,I4Number of Features record
I4,1X,'MOL'
1. SYBYL is a product of TRIPOS Associates, Inc., a subsidiary of Evans & Sutherland.
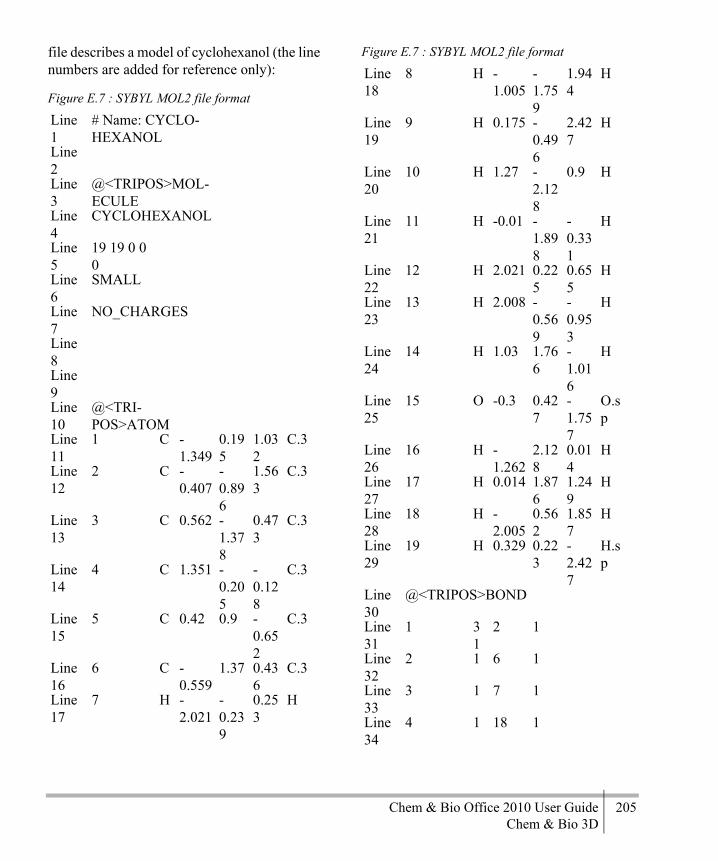
Chem & Bio Office 2010 User Guide 205Chem & Bio 3D
file describes a model of cyclohexanol (the line numbers are added for reference only):
Figure E.7 : SYBYL MOL2 file format
Line 1
# Name: CYCLO-HEXANOL
Line 2Line 3
@<TRIPOS>MOL-ECULE
Line 4
CYCLOHEXANOL
Line 5
19 19 0 0 0
Line 6
SMALL
Line 7
NO_CHARGES
Line 8Line 9Line 10
@<TRI-POS>ATOM
Line 11
1 C -1.349
0.195
1.032
C.3
Line 12
2 C -0.407
-0.896
1.563
C.3
Line 13
3 C 0.562 -1.378
0.473
C.3
Line 14
4 C 1.351 -0.205
-0.128
C.3
Line 15
5 C 0.42 0.9 -0.652
C.3
Line 16
6 C -0.559
1.37 0.436
C.3
Line 17
7 H -2.021
-0.239
0.253
H
Line 18
8 H -1.005
-1.759
1.944
H
Line 19
9 H 0.175 -0.496
2.427
H
Line 20
10 H 1.27 -2.128
0.9 H
Line 21
11 H -0.01 -1.898
-0.331
H
Line 22
12 H 2.021 0.225
0.655
H
Line 23
13 H 2.008 -0.569
-0.953
H
Line 24
14 H 1.03 1.766
-1.016
H
Line 25
15 O -0.3 0.427
-1.757
O.sp
Line 26
16 H -1.262
2.128
0.014
H
Line 27
17 H 0.014 1.876
1.249
H
Line 28
18 H -2.005
0.562
1.857
H
Line 29
19 H 0.329 0.223
-2.427
H.sp
Line 30
@<TRIPOS>BOND
Line 31
1 31
2 1
Line 32
2 1 6 1
Line 33
3 1 7 1
Line 34
4 1 18 1
Figure E.7 : SYBYL MOL2 file format

206 File FormatsAppendix E
Each line is either a blank line, a section header or a data record containing multiple fields of information about the compound. The SYBYL MOL2 file is broken down into several sec-tions of information. Record type indicators (RTI) break the information about the mole-cule into sections. RTI’s are always preceded by an “@” sign. Individual fields are delimited by space(s) or a tab. The fields in the SYBYL MOL2 format file used by Chem3D Pro are as follows:
1. Line 1 is a comment field. The pound sign preceding the text indicates a comment line. Name: is a field designating the name of molecule. The molecule name is the file name when the file is created using Chem3D Pro.
2. Line 2 is a blank line.3. Line 3, “@<TRIPOS>MOLECULE”, is a
Record Type Indicator (RTI) which begins a section containing information about the molecule(s) contained in the file.
NOTE: There are many additional RTIs in the SYBYL MOL2 format. Chem3D Pro uses only @<TRIPOS>MOLECULE, @<TRI-POS>ATOM and @<TRIPOS>BOND.
4. Line 4 contains the name of the molecule. The name on line 4 is the same as the name on line 1.
5. Line 5 contains 5 fields describing informa-tion about the molecule: The first field is the number of atoms, the second field is the number of bonds, the third field is the num-ber of substructures, the fourth field is the number of features and the fifth field is the number of sets.
NOTE: Chem3D Pro ignores the following fields: number of substructures, number of fea-tures and number of sets. These fields will con-tain zeros if the file was created using Chem3D Pro.
6. Line 6 describes the molecule type. This field contains SMALL if the file is created using Chem3D Pro.
7. Line 7 describes the charge type associated with the molecule. This field contains
Line 35
5 2 3 1
Line 36
6 2 8 1
Line 37
7 2 9 1
Line 38
8 3 4 1
Line 39
9 3 10 1
Line 40
10 3 11 1
Line 41
11 4 5 1
Line 42
12 4 12 1
Line 43
13 4 13 1
Line 44
14 5 6 1
Line 45
15 5 14 1
Line 46
16 5 15 1
Line 47
17 6 16 1
Line 48
18 6 17 1
Line 49
19 15
19 1
Figure E.7 : SYBYL MOL2 file format
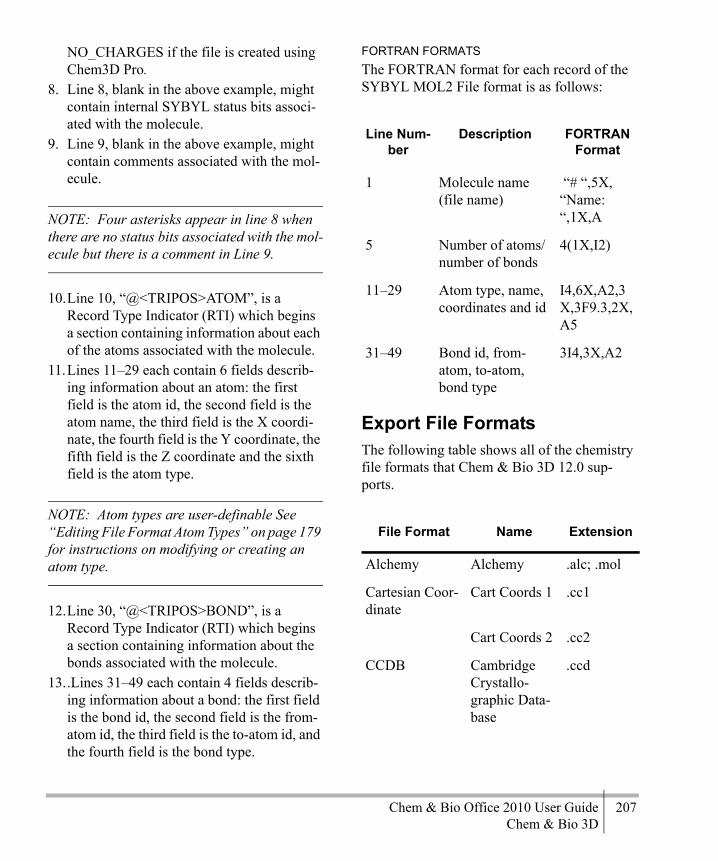
Chem & Bio Office 2010 User Guide 207Chem & Bio 3D
NO_CHARGES if the file is created using Chem3D Pro.
8. Line 8, blank in the above example, might contain internal SYBYL status bits associ-ated with the molecule.
9. Line 9, blank in the above example, might contain comments associated with the mol-ecule.
NOTE: Four asterisks appear in line 8 when there are no status bits associated with the mol-ecule but there is a comment in Line 9.
10.Line 10, “@<TRIPOS>ATOM”, is a Record Type Indicator (RTI) which begins a section containing information about each of the atoms associated with the molecule.
11.Lines 11–29 each contain 6 fields describ-ing information about an atom: the first field is the atom id, the second field is the atom name, the third field is the X coordi-nate, the fourth field is the Y coordinate, the fifth field is the Z coordinate and the sixth field is the atom type.
NOTE: Atom types are user-definable See “Editing File Format Atom Types” on page 179 for instructions on modifying or creating an atom type.
12.Line 30, “@<TRIPOS>BOND”, is a Record Type Indicator (RTI) which begins a section containing information about the bonds associated with the molecule.
13..Lines 31–49 each contain 4 fields describ-ing information about a bond: the first field is the bond id, the second field is the from-atom id, the third field is the to-atom id, and the fourth field is the bond type.
FORTRAN FORMATSThe FORTRAN format for each record of the SYBYL MOL2 File format is as follows:
Export File FormatsThe following table shows all of the chemistry file formats that Chem & Bio 3D 12.0 sup-ports.
Line Num-ber
Description FORTRAN Format
1 Molecule name (file name)
“# “,5X, “Name: “,1X,A
5 Number of atoms/number of bonds
4(1X,I2)
11–29 Atom type, name, coordinates and id
I4,6X,A2,3X,3F9.3,2X,A5
31–49 Bond id, from-atom, to-atom, bond type
3I4,3X,A2
File Format Name Extension
Alchemy Alchemy .alc; .mol
Cartesian Coor-dinate
Cart Coords 1 .cc1
Cart Coords 2 .cc2
CCDB Cambridge Crystallo-graphic Data-base
.ccd

208 File FormatsAppendix E
To save a model with a different format, name or location:
1. Go to File>Save As. The Save File dialog box appears.
2. Specify the name of the file, the folder, and disk where you want to save the file.
3. Select the file format in which you want to save the model.
4. Click Save.When you save a file in another file format, only information relevant to the file format is saved. For example, you will lose dot surfaces, color, and atom labels when saving a file as an MDL MolFile.
Publishing FormatsThe file formats described in this section are available for importing and exporting models as pictures. The pictures can then be used in desktop publishing and word processing soft-ware.IMAGE FORMAT FEATURESChem3D 11 gives you more options when sav-ing graphic formats, and the options are easier to set than ever.
• Transparent OLE copy/paste
Chem3D .c3xml; .c3d
Chem3D tem-plate
.c3t
ChemDraw ChemDraw .cdx; .cdxml
Connection Table
Conn Table .ct; .con
CS GAMESS Input
CS GAMESS Input
.inp
Gaussian Checkpoint
.fchk; .fch
Gaussian Cube .cub
Gaussian Input Gaussian Input .gjc; .gjf
Internal Coordi-nates
Int Coords .int
MacroModel MacroModel .mcm; .dat; .out
Maestro Maestro *.mae
Molecular Design Limited MolFile
MDL MolFile .mol
MSI ChemNote MSI Chem-Note
.msm
MOPAC input file
MOPAC .mop; .dat; .mpc; 2mt
MOPAC graph file
.gpt
File Format Name Extension
Protein Data Bank
Protein DB .pdb; .ent
ROSDAL Rosdal .rdl
Standard Molecular Data
SMD File .smd
SYBYL MOL SYBYL .sml
SYBYL MOL2 SYBYL2 .sm2; .ml2
File Format Name Extension
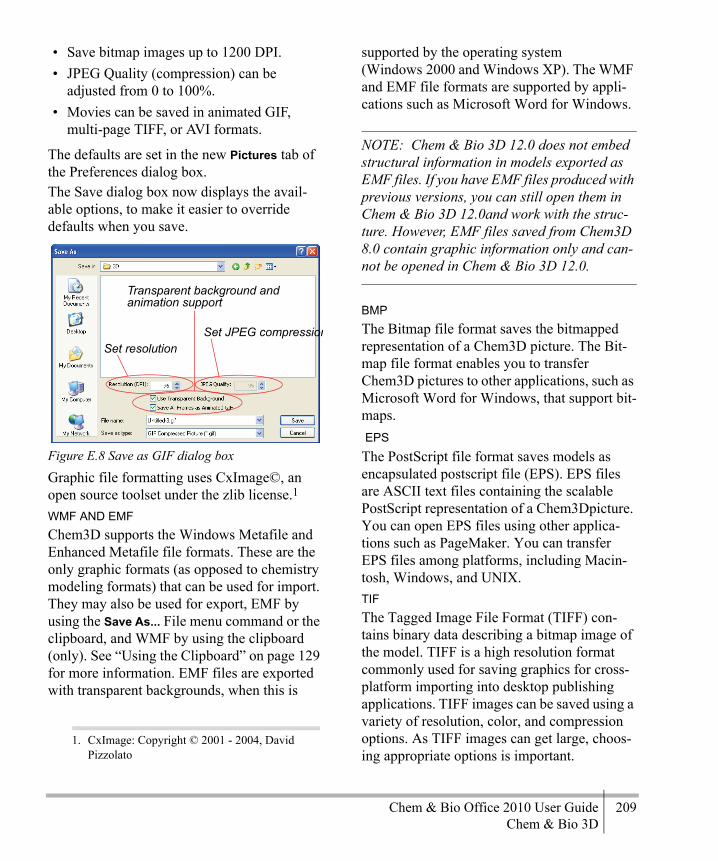
Chem & Bio Office 2010 User Guide 209Chem & Bio 3D
• Save bitmap images up to 1200 DPI.• JPEG Quality (compression) can be
adjusted from 0 to 100%.• Movies can be saved in animated GIF,
multi-page TIFF, or AVI formats.
The defaults are set in the new Pictures tab of the Preferences dialog box.The Save dialog box now displays the avail-able options, to make it easier to override defaults when you save.
Figure E.8 Save as GIF dialog box
Graphic file formatting uses CxImage©, an open source toolset under the zlib license.1
WMF AND EMF Chem3D supports the Windows Metafile and Enhanced Metafile file formats. These are the only graphic formats (as opposed to chemistry modeling formats) that can be used for import. They may also be used for export, EMF by using the Save As... File menu command or the clipboard, and WMF by using the clipboard (only). See “Using the Clipboard” on page 129 for more information. EMF files are exported with transparent backgrounds, when this is
supported by the operating system (Windows 2000 and Windows XP). The WMF and EMF file formats are supported by appli-cations such as Microsoft Word for Windows.
NOTE: Chem & Bio 3D 12.0 does not embed structural information in models exported as EMF files. If you have EMF files produced with previous versions, you can still open them in Chem & Bio 3D 12.0and work with the struc-ture. However, EMF files saved from Chem3D 8.0 contain graphic information only and can-not be opened in Chem & Bio 3D 12.0.
BMP The Bitmap file format saves the bitmapped representation of a Chem3D picture. The Bit-map file format enables you to transfer Chem3D pictures to other applications, such as Microsoft Word for Windows, that support bit-maps. EPSThe PostScript file format saves models as encapsulated postscript file (EPS). EPS files are ASCII text files containing the scalable PostScript representation of a Chem3Dpicture. You can open EPS files using other applica-tions such as PageMaker. You can transfer EPS files among platforms, including Macin-tosh, Windows, and UNIX.TIFThe Tagged Image File Format (TIFF) con-tains binary data describing a bitmap image of the model. TIFF is a high resolution format commonly used for saving graphics for cross-platform importing into desktop publishing applications. TIFF images can be saved using a variety of resolution, color, and compression options. As TIFF images can get large, choos-ing appropriate options is important.
1. CxImage: Copyright © 2001 - 2004, David Pizzolato
Set resolutionSet JPEG compression
Transparent background and animation support

210 File FormatsAppendix E
When you save a file as TIF, an option button appears in the Save As dialog box.To specify the save options:
1. Click Options.
Figure E.9 The TIFF Options dialog box
2. Choose a resolution. The size of the file increases as the square of the resolution.
3. Choose a color option.
NOTE: If objects in your document are black and white they are saved as black and white regardless of which Color options you set. If you import drawings from other applications and want them to print Black and White you must set the Color option to Monochrome.
4. Choose a compression option:
GIF, PNG AND JPGUse the Graphics Interchange Format (GIF), Portable Network Graphics (PNG) file format, or the JPEG format to publish a Chem3D model on the world wide web. Each of these formats uses a compression algorithm to reduce the size of the file. Applications that can import GIF, PNG, and JPG files include Netscape Communicator and Microsoft Inter-net Explorer.The model window background color is used as the transparent color in the GIF format graphic.
NOTE: The size of the image in Chem3D when you save the file will be the size of the image as it appears in your web page. If you turn on the “Fit Model to Window” building preference in Chem3D, you can resize the Chem3D window (in Chem3D) to resize the model to the desired size then save.
If you want to … Then choose …
force objects to black and white.
Monochrome.
store colors using computer monitor style of color encoding.
RGB Indexed.
use printing press style of color encoding.
CMYK Contiguous.Stores colors non-sequentially. For exam-ple: CMYKCMYK. The PackBits compression type provides no com-pression for this type of file.
If you want to … Then choose …
reduce file size by encoding repeating bytes of information as output. For example, for a line of color information such as: CCCCC-MMMMMYYYYYKKKKK, the compression yields a smaller file by representing the infor-mation as C5M5Y5K5.
PackBits.
fax transmissions of images
CCITT Group 3 or CCITT Group 4.

Chem & Bio Office 2010 User Guide 211Chem & Bio 3D
3DMThe QuickDraw 3D MetaFile (3DM) file for-mat contains 3-dimensional object data describing the model. You can import 3DM files into many 3D modeling applications. You can transfer 3DM files between Macintosh and Windows platforms. AVIUse this file format to save a movie you have created for the active model. You can import the resulting movie file into any application that supports the AVI file format.
Export FormatsThe following file formats are used to export models to chemistry modeling application other than Chem & Bio 3D 12.0. Most of the formats also support import.
AlchemyUse the ALC file format to interface with TRI-POS© applications such as Alchemy©. This is supported only for input.
Cartesian CoordinatesUse Cartesian Coordinates 1 (.CC1) or 2 (.CC2) to import or export the X, Y, and Z Car-tesian coordinates for your model.When you save a file as Cartesian Coordinates, an option button appears in the Save As dialog box.To specify the save options:
1. Click Options. The Cartesian Coordinates Options dialog box appears.
Figure E.10 The Cartesian Coordinates Options dialog box
2. Select the appropriate options:
If you want the file to … Then click …
contain a connection table for each atom with serial numbers
By Serial Number.
contain a connection table for each atom that describes adjacent atoms by their positions in the file
By Position.
not contain a connection table
Missing.
contain serial numbers Include Serial Numbers.
contain atom type numbers Include Atom Type Text Numbers.
contain internal coordinates for each view of the model
Save All Frames.
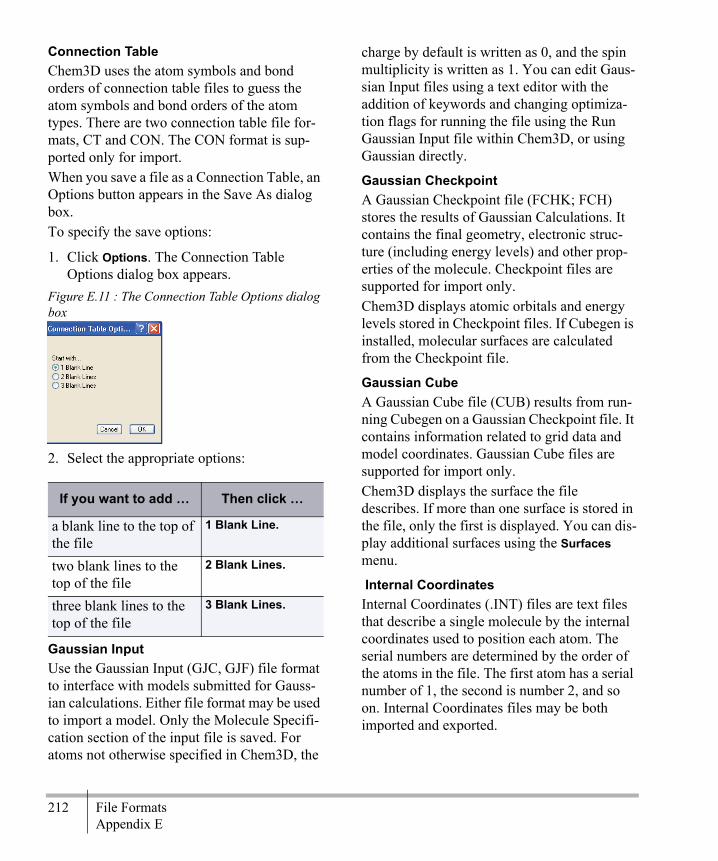
212 File FormatsAppendix E
Connection TableChem3D uses the atom symbols and bond orders of connection table files to guess the atom symbols and bond orders of the atom types. There are two connection table file for-mats, CT and CON. The CON format is sup-ported only for import.When you save a file as a Connection Table, an Options button appears in the Save As dialog box. To specify the save options:
1. Click Options. The Connection Table Options dialog box appears.
Figure E.11 : The Connection Table Options dialog box
2. Select the appropriate options:
Gaussian InputUse the Gaussian Input (GJC, GJF) file format to interface with models submitted for Gauss-ian calculations. Either file format may be used to import a model. Only the Molecule Specifi-cation section of the input file is saved. For atoms not otherwise specified in Chem3D, the
charge by default is written as 0, and the spin multiplicity is written as 1. You can edit Gaus-sian Input files using a text editor with the addition of keywords and changing optimiza-tion flags for running the file using the Run Gaussian Input file within Chem3D, or using Gaussian directly.
Gaussian CheckpointA Gaussian Checkpoint file (FCHK; FCH) stores the results of Gaussian Calculations. It contains the final geometry, electronic struc-ture (including energy levels) and other prop-erties of the molecule. Checkpoint files are supported for import only.Chem3D displays atomic orbitals and energy levels stored in Checkpoint files. If Cubegen is installed, molecular surfaces are calculated from the Checkpoint file.
Gaussian CubeA Gaussian Cube file (CUB) results from run-ning Cubegen on a Gaussian Checkpoint file. It contains information related to grid data and model coordinates. Gaussian Cube files are supported for import only.Chem3D displays the surface the file describes. If more than one surface is stored in the file, only the first is displayed. You can dis-play additional surfaces using the Surfaces menu.
Internal CoordinatesInternal Coordinates (.INT) files are text files that describe a single molecule by the internal coordinates used to position each atom. The serial numbers are determined by the order of the atoms in the file. The first atom has a serial number of 1, the second is number 2, and so on. Internal Coordinates files may be both imported and exported.
If you want to add … Then click …
a blank line to the top of the file
1 Blank Line.
two blank lines to the top of the file
2 Blank Lines.
three blank lines to the top of the file
3 Blank Lines.
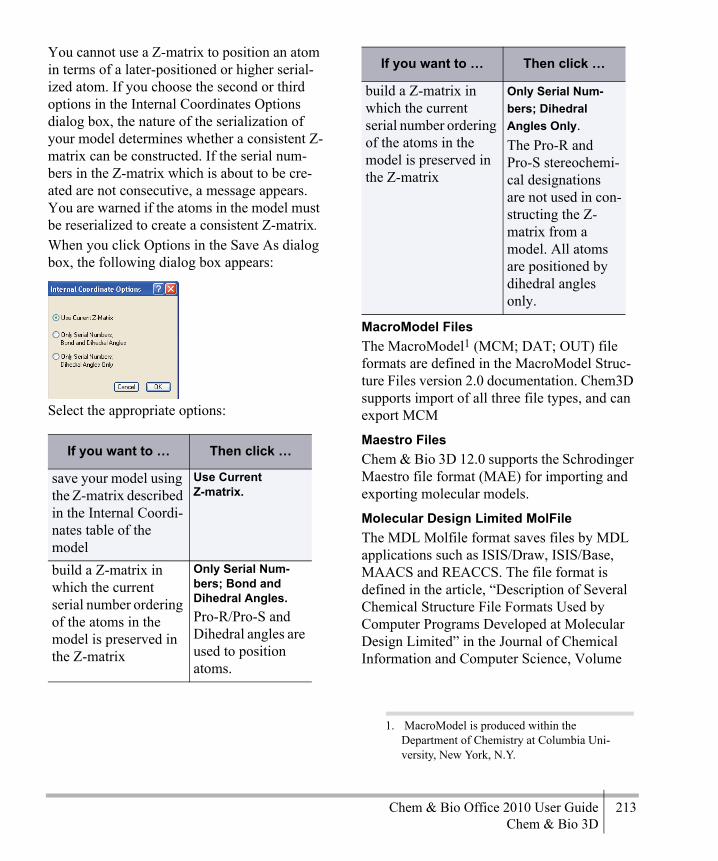
Chem & Bio Office 2010 User Guide 213Chem & Bio 3D
You cannot use a Z-matrix to position an atom in terms of a later-positioned or higher serial-ized atom. If you choose the second or third options in the Internal Coordinates Options dialog box, the nature of the serialization of your model determines whether a consistent Z-matrix can be constructed. If the serial num-bers in the Z-matrix which is about to be cre-ated are not consecutive, a message appears. You are warned if the atoms in the model must be reserialized to create a consistent Z-matrix.When you click Options in the Save As dialog box, the following dialog box appears:
Select the appropriate options:
MacroModel FilesThe MacroModel1 (MCM; DAT; OUT) file formats are defined in the MacroModel Struc-ture Files version 2.0 documentation. Chem3D supports import of all three file types, and can export MCM
Maestro FilesChem & Bio 3D 12.0 supports the Schrodinger Maestro file format (MAE) for importing and exporting molecular models.
Molecular Design Limited MolFileThe MDL Molfile format saves files by MDL applications such as ISIS/Draw, ISIS/Base, MAACS and REACCS. The file format is defined in the article, “Description of Several Chemical Structure File Formats Used by Computer Programs Developed at Molecular Design Limited” in the Journal of Chemical Information and Computer Science, Volume
If you want to … Then click …
save your model using the Z-matrix described in the Internal Coordi-nates table of the model
Use Current Z-matrix.
build a Z-matrix in which the current serial number ordering of the atoms in the model is preserved in the Z-matrix
Only Serial Num-bers; Bond and Dihedral Angles.Pro-R/Pro-S and Dihedral angles are used to position atoms.
build a Z-matrix in which the current serial number ordering of the atoms in the model is preserved in the Z-matrix
Only Serial Num-bers; Dihedral Angles Only.The Pro-R and Pro-S stereochemi-cal designations are not used in con-structing the Z-matrix from a model. All atoms are positioned by dihedral angles only.
1. MacroModel is produced within the Department of Chemistry at Columbia Uni-versity, New York, N.Y.
If you want to … Then click …

214 File FormatsAppendix E
32, Number 3, 1992, pages 244–255.Use this format to interface with MDL’s ISIS applications and other chemistry-related appli-cations. Both import and export are supported.
MSI ChemNoteUse the MSI ChemNote (.MSM) file format to interface with Molecular Simulations applica-tions such as ChemNote. The file format is defined in the ChemNote documentation. Both import and export are supported.
MOPAC FilesMOPAC data may be stored in MOP, DAT, MPC, or 2MT file formats. Chem3D can import any of these file formats, and can export MOP files. You can edit MOPAC files using a text editor, adding keywords and changing optimization flags, and run the file using the Run MOPAC Input file command within Chem3D.When you click Options in the Save As dialog box, the MOPAC Options dialog box appears.
Click the Save All Frames check box to create a MOPAC Data file in which the internal coor-dinates for each view of the model are included. The initial frame of the model con-tains the first 3 lines of the usual MOPAC out-put file (see the example file below). Each
subsequent frame contains only lines describ-ing the Z-matrix for the atoms in that frame.
NOTE: For data file specifications, see page 13 of the online MOPAC manual.
To edit a file to run using the Run MOPAC Input File command:
1. Open the MOPAC output file in a text edi-tor.
The output file below shows only the first four atom record lines. The first line and column of the example output file shown below are for purposes of description only and are not part of the output file.
Col.1
Col. 2
C3
Col. 4
C5
Col. 6
Col. 7
Col. 8
Line 1
Line 2
Cyclohexanol
Line 3
Line 4
C 0 0 0 0 0 0 0 0 0
Line 5
C 1.54152
1 0 0 0 0 1 0 0
Line 6
C 1.53523
1 111.77
1 0 0 2 1 0
L7.Ln
C 1.53973
1 109.7
1 -55.69
1 1 2 3

Chem & Bio Office 2010 User Guide 215Chem & Bio 3D
2. In Line 1, type the keywords for the compu-tations you want MOPAC to perform (blank in the example above). Line 2 is where enter the name that you want to assign to the window for the resulting model. How-ever, Chem3D ignores this line.
3. Leave Line 3 blank.4. Line 4 through Ln (were n is the last atom
record) include the internal coordinates, optimization flags, and connectivity infor-mation for the model.• Column 1 is the atom specification.• Column 2 is the bond distance (for the
connectivity specified in Column 8).• Column 3 is the optimization flag for the
bond distance specified in Column 2.• Column 4 is the bond angle (for the con-
nectivity specified in Column 8).• Column 5 is the optimization flag for the
bond angle specified in Column 4.• Column 6 is the dihedral angle (for the
connectivity specified in Column 8).• Column 7 is the optimization flag for the
dihedral angle specified in Column 6.5. To specify particular coordinates to opti-
mize, change the optimization flags in Col-umn 3, Column 5 and Column 7 for the respective internal coordinate. The avail-able flags in MOPAC are:
6. Add additional information in line Ln+1. For example, symmetry information used in a SADDLE computation.
7. Leave the last line in the data file blank to indicate file termination.
8. Save the file in a text only format.
MOPAC Graph FilesA MOPAC Graph (GPT) file stores the results of MOPAC calculations that include the GRAPH keyword. It contains the final geome-try, electronic structure, and other properties of the molecule. Chem3D supports the MOPAC Graph file format for import only.
Protein Data Bank FilesBrookhaven Protein Data Bank files (PDB; ENT) are used to store protein data and are typically large in size. Chem3D can import both file types, and exports PDB. The PDB file format is taken from the Protein Data Bank Atomic Coordinate and Bibliographic Entry Format Description.
ROSDAL Files (RDL)The ROSDAL Structure Language1 (RDL) file format is defined in Appendix C: ROSDAL Syntax of the MOLKICK User’s Manual, and in this manual in E, “File Formats.”. The ROS-DAL format is primarily used for query searching in the Beilstein Online Database. Chem3D supports the ROSDAL file format for export only.
Standard Molecular Data (SMD) Use the Standard Molecular Data (.SMD) file format for interfacing with the STN Express application for online chemical database searching. Both import and export are sup-ported.
Ln+1
1 Optimize this internal coordi-nate
0 Do not optimize this internal-1 Reaction coordinate or grid
indexT Monitor turning points in DRC 1. ROSDAL is a product of Softron, Inc.

216 File FormatsAppendix E
SYBYL FilesUse the SYBYL© (SML, SM2, ML2) file for-mats to interface with Tripos’s SYBYL appli-cations. The SML and SM2 formats can be used for both import and export; the ML2 for-mat is supported for import only.
Job Description File FormatsYou can use Job description files to save cus-tomized default settings for calculations. You can save customized calculations as a Job Description file (.JDF) or Job Description Sta-tionery (.JDT). Saving either format in a
Chem3D job folder adds it to the appropriate Chem3D menu.
JDF FilesThe JDF file format is a file format for saving job descriptions. When you open a JDF file, you can edit and save the settings.
JDT FilesThe JDT file format is a template format for saving settings that can be applied to future calculations. You can edit the settings of a tem-plate file, however you cannot save your changes.

Chem & Bio Office 2010 User Guide 217Chem & Bio 3D
Parameter TablesChem3D uses the parameter tables, containing information about elements, bond types, atom types, and other parameters, for building and for analyzing your model. The parameter tables must be located in the C3D Items directory in the same directory as the Chem3D application.
Using Parameter TablesChem3D uses several parameter tables to cal-culate bond lengths and bond angles in your model. To apply this information, go to File>Model Settings>Model Building tab and select the Apply Standard Measurements check box.Calculating the MM2 force field of a model requires special parameters for the atoms and bonds in your model. The MM2 force field is calculated during Energy Minimization, Molecular Dynamics, and Steric Energy com-putations. The use of the parameter tables are described below:3-Membered Ring Angles. Bond angles for bonds in 3-membered rings. In force field anal-ysis, angle bending portion of the force field for bonds in 3-membered rings.4-Membered Ring Angles. Bond angles for bonds in 4-membered rings. In force field anal-ysis, angle bending portion of the force field for bonds in 4-membered rings.
4-Membered Ring Torsionals. The portion of the force field for the torsional angles in your model for atoms in 4-membered rings.Angle Bending Parameters. Standard bond angles. In force field analysis, the angle bend-ing portion of the force field for bonds.Bond Stretching Parameters. Standard bond lengths. In force field analysis, bond stretching and electrostatic portions of force field for bonds.Chem3d Building Atom Types. Building types available for building models.Conjugated Pisystem Atoms. Bond lengths for bonds involved in pi systems. Pi system por-tion of the force field for pi atoms.Conjugated Pisystem Bonds. Pi system por-tion of the force field for pi bonds.Electronegativity Adjustments. Adjusts opti-mal bond length between two atoms when one atom is attached to an atom that is electronega-tive.Elements. Contains elements available for building models.MM2 Atom Type Parameters. van der Waals parameters for computing force field for each atom.MM2 Atom Types. Atom types in the model that may be used for MM2 calculations.
F
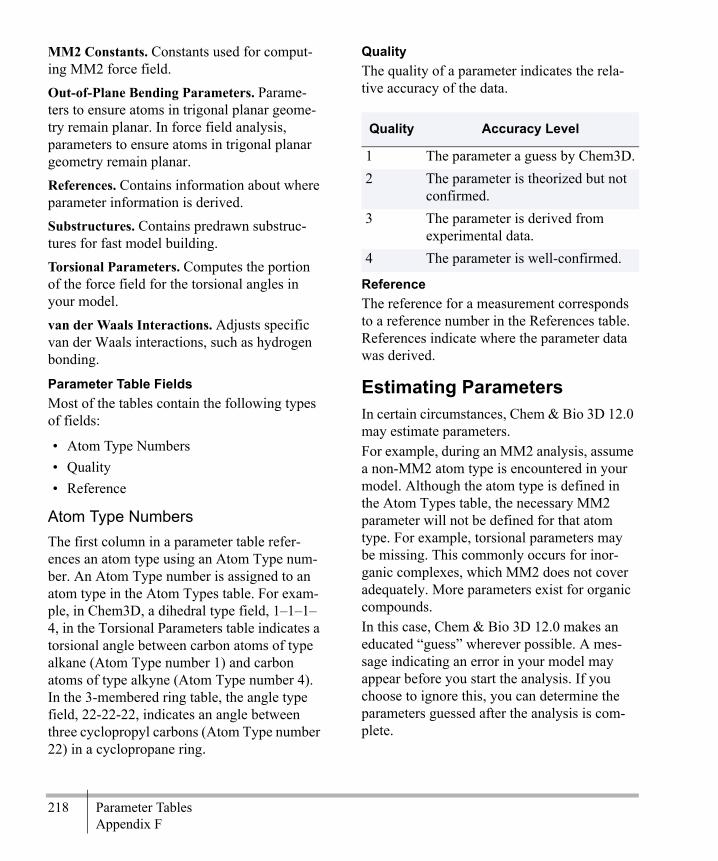
218 Parameter TablesAppendix F
MM2 Constants. Constants used for comput-ing MM2 force field.Out-of-Plane Bending Parameters. Parame-ters to ensure atoms in trigonal planar geome-try remain planar. In force field analysis, parameters to ensure atoms in trigonal planar geometry remain planar.References. Contains information about where parameter information is derived.Substructures. Contains predrawn substruc-tures for fast model building. Torsional Parameters. Computes the portion of the force field for the torsional angles in your model.van der Waals Interactions. Adjusts specific van der Waals interactions, such as hydrogen bonding.
Parameter Table FieldsMost of the tables contain the following types of fields:
• Atom Type Numbers• Quality• Reference
Atom Type NumbersThe first column in a parameter table refer-ences an atom type using an Atom Type num-ber. An Atom Type number is assigned to an atom type in the Atom Types table. For exam-ple, in Chem3D, a dihedral type field, 1–1–1–4, in the Torsional Parameters table indicates a torsional angle between carbon atoms of type alkane (Atom Type number 1) and carbon atoms of type alkyne (Atom Type number 4). In the 3-membered ring table, the angle type field, 22-22-22, indicates an angle between three cyclopropyl carbons (Atom Type number 22) in a cyclopropane ring.
QualityThe quality of a parameter indicates the rela-tive accuracy of the data.
ReferenceThe reference for a measurement corresponds to a reference number in the References table. References indicate where the parameter data was derived.
Estimating ParametersIn certain circumstances, Chem & Bio 3D 12.0 may estimate parameters.For example, during an MM2 analysis, assume a non-MM2 atom type is encountered in your model. Although the atom type is defined in the Atom Types table, the necessary MM2 parameter will not be defined for that atom type. For example, torsional parameters may be missing. This commonly occurs for inor-ganic complexes, which MM2 does not cover adequately. More parameters exist for organic compounds. In this case, Chem & Bio 3D 12.0 makes an educated “guess” wherever possible. A mes-sage indicating an error in your model may appear before you start the analysis. If you choose to ignore this, you can determine the parameters guessed after the analysis is com-plete.
Quality Accuracy Level
1 The parameter a guess by Chem3D.2 The parameter is theorized but not
confirmed.3 The parameter is derived from
experimental data.4 The parameter is well-confirmed.

Chem & Bio Office 2010 User Guide 219Chem & Bio 3D
To view the parameters used in an MM2 analy-sis, go to Calculations>MM2>Show Used Parameters. Estimated parameters have a Qual-ity value of 1.
Creating ParametersThe MM2 force field parameters are based on a limited number of MM2 atom types. These atom types cover the common atom types found in organic compounds. As discussed in the previous section, parameters may be miss-ing from structures containing other than an MM2 atom type.
NOTE: Adding or changing parameter tables is not recommended unless you are sure of the information your are adding. For example, new parameter information that is documented in journals.
To add a new parameter to a parameter table:
1. Go to View>Parameter Tables and choose the parameter table to open.
2. Right-click a row header and choose Append Row from the context menu. A blank row is inserted.
3. Type the information for the new parameter.
4. Close and save the file.
NOTE: Do not include duplicate parameters. If duplicate parameters exist in a parameter table it is indeterminate which parameter will be used when called for in a calculation.
NOTE: If you do want to make changes to any of the parameters used in Chem3D, it is strongly recommended that you make a back up copy of the original parameter table and remove it from the C3DTABLE directory.
The ElementsThe Elements table (Elements.xml) contains the elements for building your models.To use an element in a model, type its symbol in the Replacement text box (or paste it, after copying the cell in the “Symbol” field to the Clipboard) and press the Enter key when an atom is selected, or double-click an atom. If no atom is selected, a fragment is added. Four fields comprise a record in the Elements table: the symbol, the covalent radius, the color, and the atomic number.Symbol. Normally you use only the first col-umn of the Elements table while building mod-els. If you are not currently editing a text cell, you can quickly move from one element to another by typing the first letter or letters of the element symbol.Cov Rad. The covalent radius is used to approximate bond lengths between atoms.Color. The colors of elements are used when the Color by Element check box is selected in the control panel. To change the color of an
220 Parameter TablesAppendix F
element, double-click the current color. The Color Picker dialog box appears in which you can specify a new color for the element.
Building Types The Chem3D Building Atom Types table XML file (Chem3D Building Atom Types.xml) contains the atom types used in building models.Normally you use only the first column of the Chem3D Building Atom Types table while build-ing models. To use a building type in a model, type its name in the Replacement text box (or paste it, after copying the name cell to the Clip-board) and press Enter when an atom is selected, or when you double-click an atom. If no atom is selected, a fragment is added.Twelve fields comprise a building type record: name, symbol, van der Waals radius, text num-ber, charge, the maximum ring size, rectifica-tion type, geometry, number of double bonds, number of triple bonds, number of delocalized bonds, bound-to order and bound-to type.Name. The records are ordered alphabetically by atom type name. Building type names must be unique.Symbol. This field contains the element sym-bol associated with the building type. The sym-bol links the Chem3D Building Atom Types table and the Elements table. The element sym-bol is used in atom labels and when you save files in file formats that do not support building types, such as MDL MolFile.van der Waals Radius. The van der Waals (van der Waals) radius is used to specify the size of atom balls and dot surfaces when dis-playing the Ball & Stick, Cylindrical Bonds or Space Filling models.
The Generate All Close Contacts command (go to Structure>Measurements>Generate All Close Contacts) determines close contacts by com-paring the distance between pairs of non-bonded atoms to the sum of their van der Waals radii.
NOTE: The van der Waals radii specified in the Chem3D BuildingAtom Types table do not affect the results of an MM2 computation. The radii used in MM2 computations are specified in the MM2 Atom Types table.
Text. Text numbers are used to determine which measurements apply to a given group of atoms in other parameter tables.For example, C Alkane has a building type number of 1 and O Alcohol has a building type number of 6. To determine the standard bond length of a bond between a C Alkane atom and an O Alcohol atom, look at the 1-6 record in the Bond Stretching table.Charge. The charge of a building type is used when assigning building types to atoms in a model. When the information about an atom is dis-played, the atom symbol is always followed by the charge. Charges can be fractional. For example, the charge of a carbon atom in a cyclopentadienyl ring is 0.200.Chem & Bio 3D displays the formal charge that has been assigned to atoms and calculates the delocalized charge. Both charges are dis-played (when applicable) in the popup window when you hover over an atom.Max Ring. The maximum ring size field indi-cates whether the corresponding building type should be restricted to atoms found in rings of a certain size. If this cell is zero or empty, then

Chem & Bio Office 2010 User Guide 221Chem & Bio 3D
this building type is not restricted. For exam-ple, the maximum ring size of C Cyclopropane is 3.Rectification Type. The rectification type spec-ifies the type of atom used to fill open valences. Rectification atoms are added or deleted as you build your model. To activate rectification, go to File>Model Settings. On the Model Building tab, select the Rectify check box. Possible rectification types are:
When you specify a rectification type, the bound-to type of the rectification type should not conflict with the building type. If there is no rectification type for an atom, it is never rectified. For example, if the rectification type of O Car-boxyl is H Carboxyl, the bound-to type of H Carboxyl should be either O Carboxyl or empty. Otherwise, when assigning building types, hydrogen atoms bound to O Carboxyl atoms are not assigned H Carboxyl.Geometry. The geometry for a building type describes both the number of bonds that extend from this type of atom and the angles formed by those bonds.
Possible geometries are:
NOTE: Standard bond angle parameters are used only when the central atom has a tetrahe-dral, trigonal or bent geometry.
Double, Triple, and Delocalized Bonds. The number of double bonds, number of triple bonds, and number of delocalized bonds are integers ranging from zero to the number of ligands as specified by the geometry. Chem3D uses this information both to assign building types based on the bond orders and to assign bond orders based on building types.Bound-to Order. Specifies the order of the bond acceptable between a building type and the atom type specified in the bound-to type. For example, for C Carbonyl, only double bonds can be formed to bound-to type O Carboxylate. If there is no bound-to type specified, this field is not used. The possible bound-to bond orders are single, double, triple, and delocalized.
NOTE: The bound-to order should be consis-tent with the number of double, triple, and delo-calized bonds for this atom type. If the bound-to type of an atom type is not specified, its bound-to order is ignored.
• D • H• H Alcohol • H Amide• H Amine • H Ammonium• H Carboxyl • H Enol• H Guani-
dine• H Thiol
• 0 Ligand • 1 Ligand• 5 Ligands • Bent• Linear • Octahedral• Square planar • Tetrahedral• Trigonal bipyramidal • Trigonal planar• Trigonal pyramidal
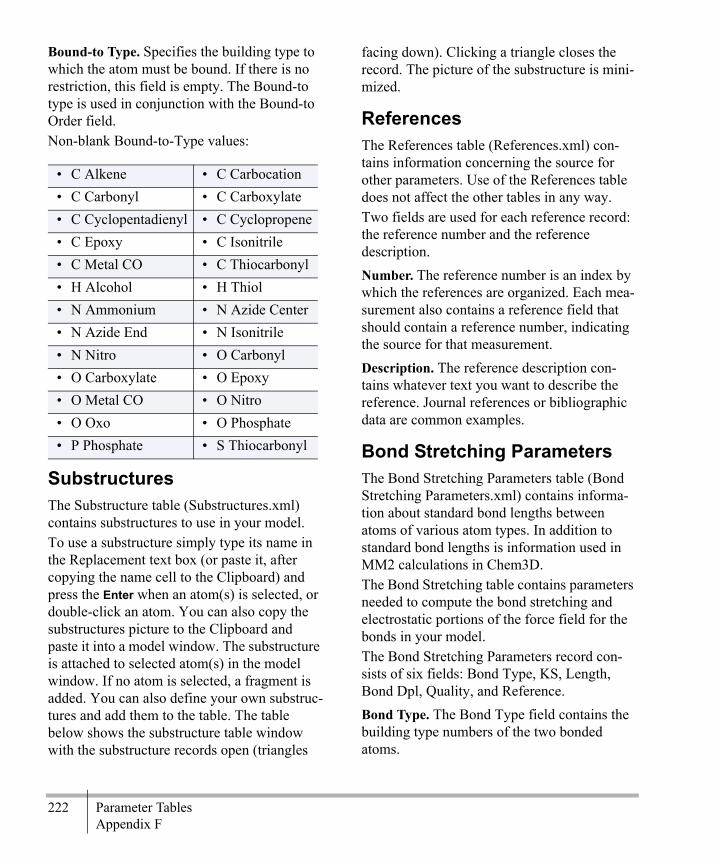
222 Parameter TablesAppendix F
Bound-to Type. Specifies the building type to which the atom must be bound. If there is no restriction, this field is empty. The Bound-to type is used in conjunction with the Bound-to Order field.Non-blank Bound-to-Type values:
SubstructuresThe Substructure table (Substructures.xml) contains substructures to use in your model.To use a substructure simply type its name in the Replacement text box (or paste it, after copying the name cell to the Clipboard) and press the Enter when an atom(s) is selected, or double-click an atom. You can also copy the substructures picture to the Clipboard and paste it into a model window. The substructure is attached to selected atom(s) in the model window. If no atom is selected, a fragment is added. You can also define your own substruc-tures and add them to the table. The table below shows the substructure table window with the substructure records open (triangles
facing down). Clicking a triangle closes the record. The picture of the substructure is mini-mized.
ReferencesThe References table (References.xml) con-tains information concerning the source for other parameters. Use of the References table does not affect the other tables in any way. Two fields are used for each reference record: the reference number and the reference description. Number. The reference number is an index by which the references are organized. Each mea-surement also contains a reference field that should contain a reference number, indicating the source for that measurement.Description. The reference description con-tains whatever text you want to describe the reference. Journal references or bibliographic data are common examples.
Bond Stretching ParametersThe Bond Stretching Parameters table (Bond Stretching Parameters.xml) contains informa-tion about standard bond lengths between atoms of various atom types. In addition to standard bond lengths is information used in MM2 calculations in Chem3D. The Bond Stretching table contains parameters needed to compute the bond stretching and electrostatic portions of the force field for the bonds in your model. The Bond Stretching Parameters record con-sists of six fields: Bond Type, KS, Length, Bond Dpl, Quality, and Reference. Bond Type. The Bond Type field contains the building type numbers of the two bonded atoms.
• C Alkene • C Carbocation• C Carbonyl • C Carboxylate• C Cyclopentadienyl • C Cyclopropene• C Epoxy • C Isonitrile• C Metal CO • C Thiocarbonyl• H Alcohol • H Thiol• N Ammonium • N Azide Center• N Azide End • N Isonitrile• N Nitro • O Carbonyl• O Carboxylate • O Epoxy• O Metal CO • O Nitro• O Oxo • O Phosphate• P Phosphate • S Thiocarbonyl
Chem & Bio Office 2010 User Guide 223Chem & Bio 3D
For example, Bond Type 1-2 is a bond between an alkane carbon and an alkene carbon. KS. The KS, or bond stretching force constant field, contains a proportionality constant which directly impacts the strength of a bond between two atoms. The larger the value of KS for a particular bond between two atoms, the more difficult it is to compress or to stretch that bond. Length. The third field, Length, contains the bond length for a particular bond type. The larger the number in the Length field, the longer is that type of bond. Bond Dpl. The Bond Dpl field contains the bond dipole for a particular bond type. The numbers in this cell give an indication of the polarity of the particular bond. A value of zero indicates that there is no difference in the elec-tronegativity of the atoms in a particular bond. A positive bond dipole indicates that the build-ing type represented by the first atom type number in the Bond Type field is less elec-tronegative than the building type represented by the second atom type number. Finally, a negative bond dipole means that the building type represented by the first building type number in the Bond Type field is more elec-tronegative than the building type represented by the second atom type number. For example, the 1-1 bond type has a bond dipole of zero since both alkane carbons in the bond are of the same electronegativity. The 1-6 bond type has a bond dipole of 0.440 since an ether or alcohol oxygen is more electronega-tive than an alkane carbon.
Finally, the 1-19 bond type has a bond dipole of - 0.600 since a silane silicon is less elec-tronegative than an alkane carbon.
NOTE: The 1-5 bond type has a dipole of zero, despite the fact that the carbon and hydrogen atoms on this bond have unequal electronega-tivity. This approximation drastically reduces the number of dipoles to be computed and has been found to produce acceptable results.
Record OrderThe order of the records in the Bond Stretching table window is as follows:
1. Records are sorted by the first atom type number in the Bond Type field. For exam-ple, the record for bond type 1-3 is before the record for bond type 2-3.
2. For records where the first atom type num-ber is the same, the records are sorted by the second atom type number in the Bond Type field. For example, bond type 1-1 is before the record for bond type 1-2.
Angle Bending Parameters• 4-Membered Ring Angle Bending• 3-Membered Ring Angle Bending
The Angle Bending table (Angle Bending Parameters.xml) describes bond angles between atoms of various atom type. In addi-tion to standard bond angles is information used in MM2 Calculations in Chem3D. Angle bending parameters are used when the central atom has four or fewer attachments and the bond angle is not in a three or four membered ring. (In three and four membered rings, the parameters in the 3-Membered Ring
224 Parameter TablesAppendix F
Angles.xml and 4-Membered Ring Angles.xml are used.)The Angle Bending table contains the parame-ters used to determine the bond angles in your model. In Chem3D Pro, additional information is used to compute the angle bending portions of the MM2 force field for the bond angles in your model. The 3- and 4-membered Ring Angles table contains the parameters that are needed to determine the bond angles in your model that are part of either 3- or 4-membered rings. In Chem3D, additional information is used to compute the angle bending portions of the MM2 force field for any bond angles in your model that occur in these rings. Each of the records in the Angle Bending table, the 4-Membered Ring Angles table and the 3-Membered Ring Angles table consists of seven fields, described below: Angle Type. The Angle Type field contains the atom type numbers of the three atoms that cre-ate the bond angle.For example, angle type 1-2-1 is a bond angle formed by an alkane carbon bonded to an alk-ene carbon, which is bonded to another alkane carbon. Notice that the alkene carbon is the central atom of the bond angle. KB. The KB, or the angle bending constant, contains a measure of the amount of energy required to deform a particular bond angle. The larger the value of KB for a particular bond angle described by three atoms, the more diffi-cult it is to compress or stretch that bond angle. –XR2–. –XR2–, the third field, contains the optimal value of a bond angle where the cen-tral atom of that bond angle is not bonded to any hydrogen atoms. In the –XR2– notation, X represents the central atom of a bond angle and
R represents any non-hydrogen atom bonded to X. For example, the optimal value of the 1-1-3 angle type for 2,2-dichloropropionic acid is the –XR2– bond angle of 107.8°, since the central carbon (C-2) has no attached hydrogen atoms. The optimal value of the 1-8-1 angle type for N,N,N-triethylamine is the –XR2– bond angle of 107.7°, because the central nitrogen has no attached hydrogen atoms. Notice that the cen-tral nitrogen has a trigonal pyramidal geome-try, thus one of the attached non-hydrogen atoms is a lone pair, the other non-hydrogen atom is a carbon. –XRH–. The –XRH– field contains the optimal value of a bond angle where the central atom of that bond angle is also bonded to one hydro-gen atom and one non-hydrogen atom. In the –XRH– notation, X and R are the same as –XR2–, and H represents a hydrogen atom bonded to X. For example, the optimal value of the 1-1-3 angle type for 2-chloropropionic acid is the –XRH– bond angle of 109.9°, since the central carbon (C-2) has one attached hydrogen atom. The optimal value of the 1-8-1 angle type for N,N-diethylamine is the –XRH– value of 107.7°, because the central N has one attached hydrogen atom. In this case the –XR2– and –XRH– values for the 1-8-1 angle type are iden-tical. As in the N,N,N-triethylamine example above, the only attached non-hydrogen atom is a lone pair. –XH2–. –XH2– is the optimal value of a bond angle where the central atom of that bond angle is also bonded to two hydrogen atoms. For example, the optimal value of the 1-1-3 angle type for propionic acid is the –XH2– bond angle of 110.0°, since the central carbon (C-2) has two attached hydrogen atoms.

Chem & Bio Office 2010 User Guide 225Chem & Bio 3D
Record OrderWhen sorted by angle type, the order of the records in the Angle Bending table, the 4-Membered Ring Angles table and the 3-Mem-bered Ring Angles table is as follows:
1. Records are sorted by the second atom type number in the Angle Type field. For exam-ple, the record for bond angle type 1-2-1 is before the record for bond angle type 1-3-1.
2. For multiple records where the second atom type number is the same, the records are sorted by the first atom type number in the Angle Type field. For example, the record for bond angle type 1-3-2 is listed before the record for bond angle type 2-3-2.
3. For multiple records where the first two atom type numbers are the same, the records are sorted by the third atom type number in the Angle Type field. For exam-ple, the record for bond angle type 1-1-1 is listed before the record for bond angle type 1-1-2.
Pi Atoms. The Pi Atoms table (Conjugated Pisystem Atoms.xml) contains the parameters used to correct bond lengths and angles for pi atoms in your model. In Chem3D, additional information is used to compute the pi system portions of the MM2 force field for the pi atoms in your model. The records in the Pi Atoms table comprise six fields: Atom Type, Electron, Ionization, Repulsion, Quality, and Reference.Atom Type. The Atom type number field con-tains the atom type number to which the rest of the Conjugated Pisystem Atoms record applies. Electron. The Electron field contains the num-ber of electrons that a particular pi atom con-tributes to the pi system.
For example, an alkene carbon, atom type number 2, contributes 1 electron to the pi sys-tem whereas a pyrrole nitrogen, atom type number 40, contributes 2 electrons to the pi system. Ionization. The Ionization field contains the amount of energy required to remove a pi elec-tron from an isolated pi atom. The unit of the ionization energy is electron volt (eV). The magnitude of the ionization energy is larger the more electronegative the atom. For example, an alkene carbon has an ioniza-tion energy of -11.160 eV, and the more elec-tronegative pyrrole nitrogen has an ionization energy of -13.145 eV. Repulsion. The Repulsion field contains a measure of:
• The energy required to keep two electrons, each on separate pi atoms, from moving apart.
• The energy required to keep two electrons, occupying the same orbital on the same pi atom, from moving apart. The units of the repulsion energy are electron volts (eV). The repulsion energy is more positive the more electronegative the atom.
For example, an alkene carbon has an repul-sion energy of 11.134 eV, and the more elec-tronegative pyrrole nitrogen has an repulsion energy of 17.210 eV.
Pi BondsThe Pi Bonds table (Conjugated PI System Bonds.xml) contains parameters used to cor-rect bond lengths and bond angles for bonds that are part of a pi system. In Chem3D, addi-tional information is used to compute the pi system portions of the MM2 force field for the pi bonds in a model.

226 Parameter TablesAppendix F
There are five fields in records in the Pi Bonds table: Bond Type, dForce, dLength, Quality, and Reference.Bond Type. The Bond Type field is described by the atom type numbers of the two bonded atoms. For example, bond type 2-2 is a bond between two alkene carbons. dForce. The dForce field contains a constant used to decrease the bond stretching force con-stant of a particular conjugated double bond. The force constant Kx for a bond with a calcu-lated pi bond order x is: Kx = K2 - (1 - x) * dForcewhere K2 is the force constant for a non-conju-gated double bond, taken from the Bond Stretching table. The higher the value of Kx for the bond between two pi atoms, the more difficult it is to compress or stretch that bond.dLength. The dLength field contains a con-stant used to increase the bond length of any conjugated double bond. The bond length lx for a bond with a calculated pi bond order x is:lx = l2 + (1 - x) * dLengthwhere l2 is the bond length of a non-conjugated double bond, taken from the Bond Stretching table. The higher the value of lx for the bond between two pi atoms, the longer that bond is.Record Order. When sorted for Bond Type, the order of the records in the Conjugated Pisystem Bonds table is as follows:
1. Records are sorted by the first atom type number in the Bond Type field. For exam-ple, the record for bond type 2-2 is listed before the record for bond type 3-4.
2. For records where the first atom type num-ber is the same, the records are sorted by
the second atom type number in the Bond Type field. For example, the record for bond type 2-2 is listed before the record for bond type 2-3.
Electronegativity AdjustmentsThe parameters contained in the Electronega-tivity Adjustments table (Electronegativity Adjustments.xml) are used to adjust the opti-mal bond length between two atoms when one of the atoms is attached to a third atom, on that is electronegative.For example, the carbon-carbon single bond length in ethane is different from that in etha-nol. The MM2 parameter set has only a single parameter for carbon-carbon single bond lengths (1.523Å). The use of electronegativity correction parameters allows the C-C bond in ethanol to be corrected. The electronegativity parameter used in the Electronegativity Cor-rections table is the 1-1-6 angle type, where atom type 1 is a C Alkane and atom type 6 is an O Alcohol. The value of this parameter is -0.009Å. Thus the C-C bond length in ethanol is 0.009Å shorter than the standard C-C bond length.
MM2 ConstantsThe MM2 Constants table (MM2 Con-stants.xml) contains parameters that Chem3D uses to compute the MM2 force field. CUBIC AND QUARTIC STRETCH CONSTANTSIntegrating the Hooke's Law equation provides the Hooke's Law potential function, which describes the potential energy of the ball and spring model. The shape of this potential func-tion is the classical potential well.
dVdx------- F dx–==–
Chem & Bio Office 2010 User Guide 227Chem & Bio 3D
The Hooke's Law potential function is qua-dratic, thus the potential well created is sym-metrical. The real shape of the potential well is asymmetric and is defined by the Morse Func-tion, but the Hooke's Law potential function works well for most molecules.
Certain molecules contain long bonds which are not described well by Hooke's Law. For this reason the MM2 force field contains a cubic stretch term. The cubic stretch term allows for an asymmetric shape of the potential well, thereby allowing these long bonds to be handled. However, the cubic stretch term is not sufficient to handle abnormally long bonds. Thus the MM2 force field contains a quartic stretch term to correct for problems caused by these abnormally long bonds.TYPE 2 (-CHR-) BENDING FORCE PARAMETERS FOR C-C-C ANGLES
• -CHR- Bending K for 1-1-1 angles• -CHR- Bending K for 1-1-1 angles in 4-
membered rings • -CHR- Bending K for 22-22-22 angles in 3-
membered rings
These constants are distinct from the force constants specified in the Angle Bending table. The bending force constant (K) for the 1-1-1 angle (1 is the atom type number for the C Alkane atom type) listed in the MM2 Angle Bending parameters table is for an alkane car-bon with two non-hydrogen groups attached. Angle bending parameters for carbons with one or two attached hydrogens differ from those for carbons with no attached hydrogens. Because carbons with one or two attached
hydrogens frequently occur, separate force constants are used for these bond angles. The -CHR- Bending K for 1-1-1 angles allows more accurate force constants to be specified for the Type 1 (-CH2-) and Type 2 (-CHR-) interactions. In addition, the -CHR- Bending K for 1-1-1 angles in 4-membered rings and the -CHR- Bending K for 22-22-22 angles (22 is the atom type number for the C Cyclopropane atom type) in 3-membered rings differ from the aforementioned -CHR- Bending K for 1-1-1 angles and thus require separate constants to be accurately specified. STRETCH-BEND PARAMETERS
• X-B,C,N,O-Y Stretch-Bend interaction force constant
• X-B,C,N,O-H Stretch-Bend interaction force constant
• X-Al,S-Y Stretch-Bend force constant• X-Al,S-H Stretch-Bend force constant• X-Si,P-Y Stretch-Bend force constant• X-Si,P-H Stretch-Bend force constant• X-Ga,Ge,As,Se-Y Stretch-Bend force con-
stant
The stretch-bend parameters are force con-stants for the stretch-bend interaction terms in the prior list of elements. X and Y represent any non-hydrogen atom. When an angle is compressed, the MM2 force field uses the stretch-bend force constants to lengthen the bonds from the central atom in the angle to the other two atoms in the angle. For example, the normal C-C-C bond angle in cyclobutane is 88.0°, as compared to a C-C-C bond angle of 110.8° in cyclohexane. The stretch-bend force constants are used to lengthen the C-C bonds in cyclobutane to
V x( ) dV k xdx 12---kx2=
0
x
∫°=0
x
∫°=
228 Parameter TablesAppendix F
1.550Å, from a C-C bond length of 1.536Å in cyclohexane. SEXTIC BENDING CONSTANTSextic bending constant (* 10**8)Chem3D uses the sextic bending constant to increase the energy of angles with large defor-mations from their ideal value. DIELECTRIC CONSTANTS
• Dielectric constant for charges• Dielectric constant for dipoles
The dielectric constants perform as inverse proportionality constants in the electrostatic energy terms. The constants for the charge and dipole terms are supplied separately so that either can be partially or completely sup-pressed. The charge-dipole interaction uses the geomet-ric mean of the charge and dipole dielectric constants. For example, when you increase the Dielectric constant for dipoles, a decrease in the Dipole/Dipole energy occurs. This has the effect of reducing the contribution of dipole-dipole interactions to the total steric energy of a mole-cule. ELECTROSTATIC AND VAN DER WAALS CUTOFF PARAMETERS
• Cutoff distance for charge/charge interac-tions Cutoff distance for charge/dipole interactions
• Cutoff distance for dipole/dipole interac-tions
• Cutoff distance for van der Waals interac-tions
These parameters define the minimum distance at which the fifth-order polynomial switching function is used for the computation of the listed interactions.
MM2 Atom Type ParametersThe MM2 Atom Types table (MM2 Atom Types.xml) contains the van der Waals param-eters used to compute the force field for each atom in your model.Each MM2 Atom Type record contains eight fields: Atom type number, R*, Eps, Reduct, Atomic Weight, Lone Pairs, Quality, and Ref-erence.
Text type numberThe Text number field is the atom type to which the rest of the MM2 Atom Type Param-eter record applies. The records in the MM2 Atom Type table window are sorted in ascend-ing order of Atom Type Atom type number.RThe R field is the van der Waals radius of the particular atom. The larger the van der Waals radius of an atom is, the larger that atom.
NOTE: Chem3D uses the van der Waals radius, R, in the MM2 Atom Types table for computation. It is not the same as the van der Waals radius in the Atom Types table, which is used for displaying the model.
EPSThe Eps or Epsilon field is a constant that is proportional to the depth of the potential well. As the value of epsilon increases, the depth of the potential well increases, as does the

Chem & Bio Office 2010 User Guide 229Chem & Bio 3D
strength of the repulsive and attractive interac-tions between an atom and other atoms.
NOTE: For specific van der Waals interac-tions, the R and Eps values from the van der Waals Interactions table are used instead of values in the MM2 Atom Types table. See “van der Waals Interactions” for more information.
REDUCTReduct is a constant used to position the center of the electron cloud on a hydrogen atom toward the nucleus of the carbon atom to which it is bonded by approximately 10% of the distance between the two atoms. Any atom in a van der Waals potential function must possess a spherical electron cloud cen-tered about its nucleus. For most larger atoms this is a reasonable assumption, but for smaller atoms such as hydrogen it is not. Molecular mechanics calculations based on spherical electron clouds centered about hydrogen nuclei do not give accurate results. However, it is a reasonable compromise to assume that the electron cloud about hydrogen is still spherical, but that it is no longer cen-tered on the hydrogen nucleus. The Reduct constant is multiplied by the normal bond length to give a new bond length which repre-sents the center of the repositioned electron cloud. The value of the Reduct field for all non-hydrogen atoms is zero.
ATOMIC WEIGHTThe fifth field, Atomic Weight, is the atomic weight of atoms represented by this atom type number.
NOTE: The atomic weight is for the isotopi-cally pure element. For example, the atomic weight for atom type number 1 is 12.000, the atomic weight of 12C.
LONE PAIRSThe Lone Pairs field contains the number of lone pairs around a particular atom type. Notice that an amine nitrogen, atom type num-ber 8, has one lone pair and an ether oxygen, atom type number 6, has two lone pairs. Lone pairs are treated explicitly for atoms such as these, which have distinctly non-spherical electron distributions. For atom types such as O Carbonyl, which have more nearly spherical electron distributions, no explicit lone pairs are necessary.
NOTE: Lone pairs are not automatically dis-played in atoms that require them.
Torsional ParametersThe Torsional Parameters table (Torsional Parameters.xml) contains parameters used to compute the portions of the MM2 force field for the torsional angles in your model. The 4-Membered Ring Torsional Parameters (4-membered Ring Torsionals.xml) contains torsional parameters for atoms in 4-membered rings.Each of the records in the Torsional Parame-ters table and the 4-Membered Ring Torsional Parameters table consists of six fields: Dihe-

230 Parameter TablesAppendix F
dral Type, V1, V2, V3, Quality, and Refer-ence. DIHEDRAL TYPEThe Dihedral Type field contains the atom type numbers of the four atom types that describe the dihedral angle.For example, angle type 1-2-2-1 is a dihedral angle formed by an alkane carbon bonded to an alkene carbon that is bonded to a second alk-ene carbon which, in turn, is bonded to another alkane carbon. In other words, angle type 1-2-2-1 is the dihedral angle between the two methyl groups of 2-butene.The two alkene carbons are the central atoms of the dihedral angle.V1The V1, or 360° Periodicity Torsional con-stant, field contains the first of three principal torsional constants used to compute the total torsional energy in a molecule. V1 derives its name from the fact that a torsional constant of 360° periodicity can have only one torsional energy minimum and one torsional energy maximum within a 360° period. The period starts at -180° and ends at 180°.A positive value of V1 means that a maximum occurs at 0° and a minimum occurs at ±180° in a 360° period. A negative value of V1 means that a minimum occurs at 0° and a maximum occurs at ±180° in a 360° period. The signifi-cance of V1 is explained in the example fol-lowing the V2 discussion.V2The V2, or 180° Periodicity Torsional con-stant, field contains the second of three princi-pal torsional constants used to compute the total torsional energy in a molecule. V2 derives its name from the fact that a torsional constant of 180° periodicity can have only two torsional
energy minima and two torsional energy max-ima within a 360° period. A positive value of V2 indicates there are min-ima at 0° and +180°, and there are maxima at -90° and +90° in a 360° period. A negative value of V2 causes the position of the maxima and minima to be switched, as in the case of V1 above. The significance of V2 is explained in the following example.A good example of the significance of the V1 and V2 torsional constants exists in the 1-2-2-1 torsional parameter of 2-butene. The values of V1 and V2 in the Torsional Parameters table are -0.100 and 10.000 respectively. Because a positive value of V2 indicates that there are minima at 0° and +180°, these min-ima signify cis-2-butene and trans-2-butene respectively. Notice that V2 for torsional parameters involving torsions about carbon-carbon double bonds all have values ranging from approximately V2=8.000 to V2=16.250. In addition, V2 torsional parameters involving torsions about carbon-carbon single bonds all have values ranging from approximately V2=-2.000 to V2=0.950. The values of V2 for torsions about carbon-carbon double bonds are higher than those val-ues for torsions about carbon-carbon single bonds. A consequence of this difference in V2 values is that the energy barrier for rotations about double bonds is much higher than the barrier for rotations about single bonds. The V1 torsional constant creates a torsional energy difference between the conformations represented by the two torsional energy min-ima of the V2 constant. As discussed previ-ously, a negative value of V1 means that a torsional energy minimum occurs at 0° and a torsional energy maximum occurs at 180°. The value of V1=-0.100 means that cis-2-butene is

Chem & Bio Office 2010 User Guide 231Chem & Bio 3D
a torsional energy minimum that is 0.100 kcal/mole lower in energy than the torsional energy maximum represented by trans-2-butene. The counterintuitive fact that the V1 field is negative can be understood by remembering that only the total energy can be compared to experimental results. In fact, the total energy of trans-2-butene is computed to be 1.423 kcal/mole lower than the total energy of cis-2-butene. This corresponds closely with experi-mental results. The negative V1 term has been introduced to compensate for an overestima-tion of the energy difference based solely on van der Waals repulsion between the methyl groups and hydrogens on opposite ends of the double bond. This example illustrates an important lesson: There is not necessarily any correspondence between the value of a particular parameter used in MM2 calculations and value of a par-ticular physical property of a molecule. V3The V3, or 120° Periodicity Torsional con-stant, field contains the third of three principal torsional constants used to compute the total torsional energy in a molecule. V3 derives its name from the fact that a torsional constant of 120° periodicity can have three torsional energy minima and three torsional energy maxima within a 360° period. A positive value of V3 indicates there are minima at -60°, +60° and +180° and there are maxima at -120°, 0°, and +120° in a 360° period. A negative value of V3 causes the position of the maxima and minima to be reversed, as in the case of V1 and V2 above. The significance of V3 is explained in the following example.The 1-1-1-1 torsional parameter of n-butane is an example of the V3 torsional constant. The values of V1, V2 and V3 in the Torsional
Parameters table are 0.200, 0.270 and 0.093 respectively. Because a positive value of V3 indicates that there are minima at -60°, +60° and +180° and there are maxima at -120°, 0°, and +120°, the minima at ±60° signify the two conformations of n-butane in which the methyl groups are gauche to one another. The +180° minimum represents the conformation in which the methyl groups are anti to one another. The maximum at 0° represents the conformation in which the methyl groups are eclipsed. The maxima at ±120° conform n-butane in which a methyl group and a hydro-gen are eclipsed. The V1 and V2 torsional constants in this example affect the torsional energy in a similar way to the V1 torsional constant for torsions about a carbon-carbon double bond (see previ-ous example).
NOTE: The results of MM2 calculations on hydrocarbons do not correspond well with the experimental data on hydrocarbons when only the V3 torsional constant is used (when V1 and V2 are set to zero). However, including small values for the V1 and V2 torsional constants in the MM2 calculations for hydrocarbons dra-matically improve the correspondence of the MM2 results with experimental results. This use of V1 and V2 provides little correspondence to any particular physical property of hydrocar-bons.
Record OrderWhen sorted by Dihedral Angle, the order of the records in the Torsional Parameters table and the 4-Membered Ring Torsional Parame-ters table is as follows:
232 Parameter TablesAppendix F
1. Records are sorted by the second atom type number in the Dihedral Type field. For example, the record for dihedral type 1-1-1-1 is listed before the record for dihedral type 1-2-1-1.
2. For records where the second atom type number is the same, the records are sorted by the third atom type number in the Dihe-dral Type field. For example, the record for dihedral type 1-1-1-1 is listed before the record for dihedral type 1-1-2-1.
3. For multiple records where the second and third atom type numbers are the same, the records are sorted by the first atom type number in the Dihedral Type field. For example, the record for dihedral type 5-1-3-1 is listed before the record for dihedral type 6-1-3-1.
4. For multiple records where the first, second and third atom type numbers are the same, the records are sorted by the fourth atom type number in the Dihedral Type field. For example, the record for dihedral type 5-1-3-1 is listed before the record for dihedral type 5-1-3-2.
Out-of-Plane BendingThe Out-of-Plane Bending table (Out-of-Plane Bending Parameters.xml) contains parameters that ensure that atoms with trigonal planar geometry remain planar in MM2 calculations.There are four fields in records in the Out-of-Plane Bending Parameters table: Bond Type, Force Constant, Quality and Reference.BOND TYPEThe first field is the Bond Type, which is described by the atom type numbers of the two bonded atoms. For example, Bond Type 2-3 is a bond between an alkene carbon and a carbonyl carbon.
FORCE CONSTANTThe Force Constant field, or the out-of-plane bending constant, field contains a measure of the amount of energy required to cause a trigo-nal planar atom to become non-planar. The larger the value of Force Constant for a partic-ular atom, the more difficult it is to coerce that atom to be non-planar. RECORD ORDERWhen sorted by Bond Type, the order of the records in the Out-of-Plane Bending Parame-ters table is as follows:
1. Records are sorted by the first atom type number in the Bond Type field. For exam-ple, the record for bond type 2-1 is before the record for bond type 3-1.
2. For records where the first atom type num-ber is the same, the records are sorted by the second atom type number in the Bond Type field. For example, the record for bond type 2-1 is before the record for bond type 2-2.
NOTE: Out-of-plane bending parameters are not symmetrical. For example, the force con-stant for a 2-3 bond refers to the plane about the type 2 atom. The force constant for a 3-2 bond refers to the plane about the type 3 atom.
van der Waals Interactions The parameters contained in the van der Waals parameters table (van der Waals Interac-tion.xml) are used to adjust specific van der Waals interactions in a molecule, such as hydrogen bonding, to provide better correspon-dence with experimental data in calculating the MM2 force field.

Chem & Bio Office 2010 User Guide 233Chem & Bio 3D
For example, consider the van der Waals inter-action between an alkane carbon (Atom Type 1) and a hydrogen (Atom Type 5). Normally, the van der Waals energy is based on the sum of the van der Waals radii for these atoms, found for each atom in the Atom Types table (1.900Å for Atom type number 1 + 1.400Å for Atom type number 2 = 3.400Å). However, bet-ter correspondence between the computed van der Waals energy and experimental data is found by substituting this sum with the value found in the van der Waals Interactions table for this specific atom type pair (Atom Types 1-5 = 3.340Å). Similarly, an Eps parameter is substituted for the geometric mean of the Eps parameters for a pair of atoms if their atom
types appear in the van der Waals Interactions table.RECORD ORDERWhen sorted by Atom Type, the order of the records in van der Waals Interactions table window is as follows:Records are sorted by the first atom type num-ber in the Atom Type field. For example, the record for Atom Type 1-36 is before the record for atom type 2-21.For records where the first atom type number is the same, the records are sorted by the sec-ond atom type number in the Atom Type field. For example, the record for atom type 2-21 is before the record for atom type 2-23.

234 Parameter TablesAppendix F
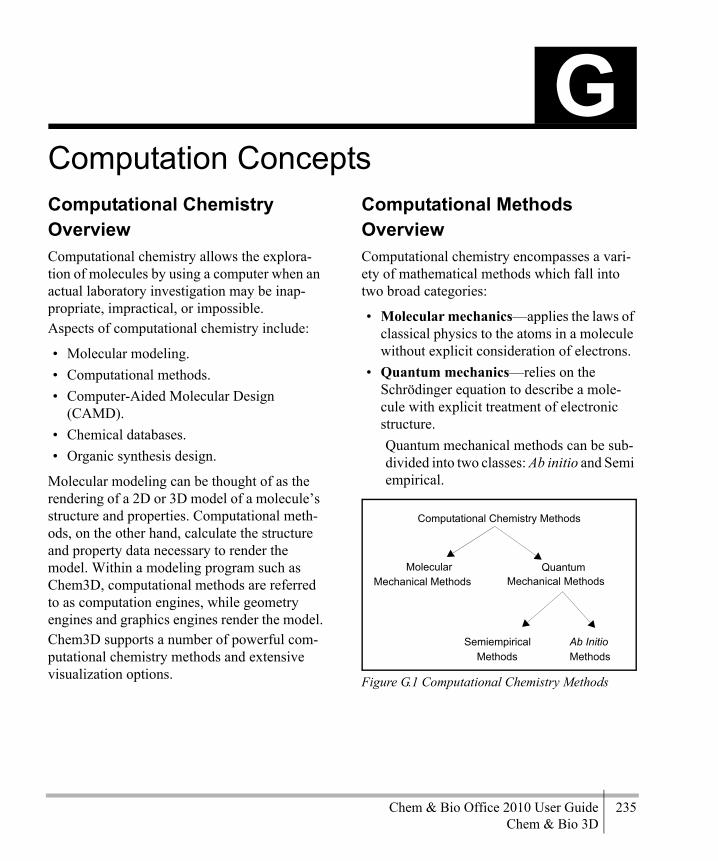
Chem & Bio Office 2010 User Guide 235Chem & Bio 3D
Computation ConceptsComputational Chemistry OverviewComputational chemistry allows the explora-tion of molecules by using a computer when an actual laboratory investigation may be inap-propriate, impractical, or impossible.Aspects of computational chemistry include:
• Molecular modeling.• Computational methods.• Computer-Aided Molecular Design
(CAMD).• Chemical databases.• Organic synthesis design.
Molecular modeling can be thought of as the rendering of a 2D or 3D model of a molecule’s structure and properties. Computational meth-ods, on the other hand, calculate the structure and property data necessary to render the model. Within a modeling program such as Chem3D, computational methods are referred to as computation engines, while geometry engines and graphics engines render the model.Chem3D supports a number of powerful com-putational chemistry methods and extensive visualization options.
Computational Methods OverviewComputational chemistry encompasses a vari-ety of mathematical methods which fall into two broad categories:
• Molecular mechanics—applies the laws of classical physics to the atoms in a molecule without explicit consideration of electrons.
• Quantum mechanics—relies on the Schrödinger equation to describe a mole-cule with explicit treatment of electronic structure. Quantum mechanical methods can be sub-divided into two classes: Ab initio and Semi empirical.
Figure G.1 Computational Chemistry Methods
G
Computational Chemistry Methods
Molecular Mechanical Methods Mechanical Methods
Quantum
Semiempirical Methods
Ab InitioMethods
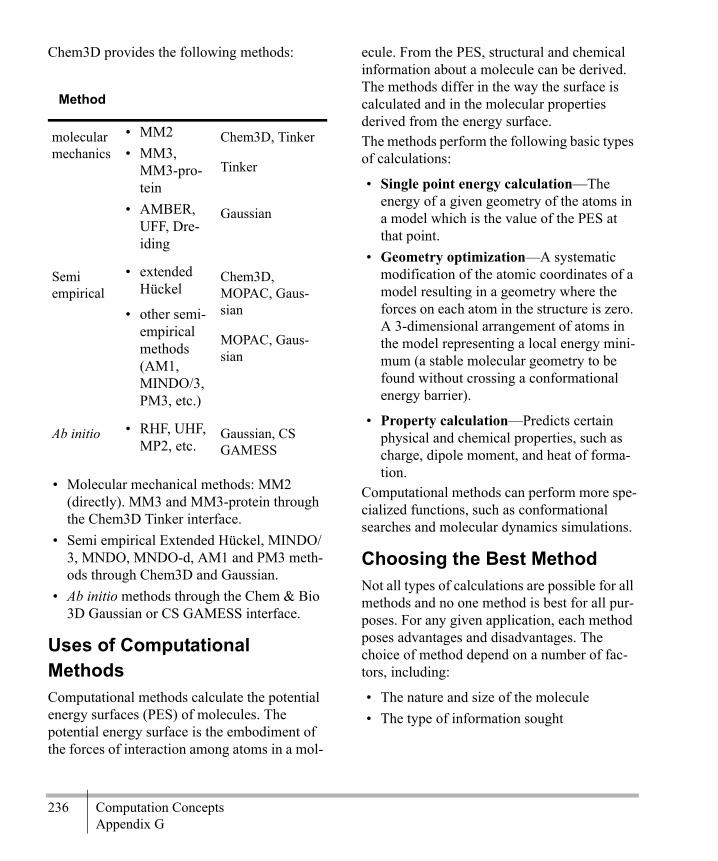
236 Computation ConceptsAppendix G
Chem3D provides the following methods:
• Molecular mechanical methods: MM2 (directly). MM3 and MM3-protein through the Chem3D Tinker interface.
• Semi empirical Extended Hückel, MINDO/3, MNDO, MNDO-d, AM1 and PM3 meth-ods through Chem3D and Gaussian.
• Ab initio methods through the Chem & Bio 3D Gaussian or CS GAMESS interface.
Uses of Computational MethodsComputational methods calculate the potential energy surfaces (PES) of molecules. The potential energy surface is the embodiment of the forces of interaction among atoms in a mol-
ecule. From the PES, structural and chemical information about a molecule can be derived. The methods differ in the way the surface is calculated and in the molecular properties derived from the energy surface. The methods perform the following basic types of calculations:
• Single point energy calculation—The energy of a given geometry of the atoms in a model which is the value of the PES at that point.
• Geometry optimization—A systematic modification of the atomic coordinates of a model resulting in a geometry where the forces on each atom in the structure is zero. A 3-dimensional arrangement of atoms in the model representing a local energy mini-mum (a stable molecular geometry to be found without crossing a conformational energy barrier).
• Property calculation—Predicts certain physical and chemical properties, such as charge, dipole moment, and heat of forma-tion.
Computational methods can perform more spe-cialized functions, such as conformational searches and molecular dynamics simulations.
Choosing the Best MethodNot all types of calculations are possible for all methods and no one method is best for all pur-poses. For any given application, each method poses advantages and disadvantages. The choice of method depend on a number of fac-tors, including:
• The nature and size of the molecule• The type of information sought
Method
molecular mechanics
• MM2• MM3,
MM3-pro-tein
• AMBER, UFF, Dre-iding
Chem3D, Tinker
Tinker
Gaussian
Semi empirical
• extended Hückel
• other semi-empirical methods (AM1, MINDO/3, PM3, etc.)
Chem3D, MOPAC, Gaus-sian
MOPAC, Gaus-sian
Ab initio • RHF, UHF, MP2, etc.
Gaussian, CS GAMESS

Chem & Bio Office 2010 User Guide 237Chem & Bio 3D
• The availability of applicable experimen-tally determined parameters (as required by some methods)
• Computer resources
The three most important of the these criteria are:
• Model size—The size of a model can be a limiting factor for a particular method. The limiting number of atoms in a molecule increases by approximately one order of magnitude between method classes from ab initio to molecular mechanics. Ab initio is limited to tens of atoms, semiempirical to hundreds, and molecular mechanics to thousands.
• Parameter Availability—Some methods depend on experimentally determined parameters to perform computations. If the model contains atoms for which the param-eters of a particular method have not been derived, that method may produce invalid predictions. Molecular mechanics, for example, relies on parameters to define a force-field. A force-field is only applicable to the limited class of molecules for which it is parametrized.
• Computer resources—Requirements increase relative to the size of the model for each of the methods.
Ab initio: The time required for performing computations increases on the order of N4, where N is the number of atoms in the model.Semiempirical: The time required for com-putation increases as N3 or N2, where N is the number of atoms in the model.
MM2: The time required for performing computations increases as N2, where N is the number of atoms.
In general, molecular mechanical methods are computationally less expensive than quantum mechanical methods. The suitability of each general method for particular applications can be summarized as follows.
Molecular Mechanics Methods Applications SummaryMolecular mechanics in Chem3D apply to:
• Systems containing thousands of atoms. • Organic, oligonucleotides, peptides, and
saccharides.• Gas phase only (for MM2).
Useful techniques available using MM2 meth-ods include:
• Energy Minimization for locating stable conformations.
• Single point energy calculations for com-paring conformations of the same molecule.
• Searching conformational space by varying one or two dihedral angles.
• Studying molecular motion using Molecu-lar Dynamics.
Quantum Mechanical Methods Applications SummaryUseful information determined by quantum mechanical methods includes:
• Molecular orbital energies and coefficients.• Heat of Formation for evaluating conforma-
tional energies.• Partial atomic charges calculated from the
molecular orbital coefficients.• Electrostatic potential.

238 Computation ConceptsAppendix G
• Dipole moment.• Transition-state geometries and energies.• Bond dissociation energies.
Semiempirical methods available in Chem3D with Gaussian apply to: • Systems containing up to 120 heavy atoms
and 300 total atoms.• Organic, organometallics, and small oligo-
mers (peptide, nucleotide, saccharide).Gas phase or implicit solvent environment.
• Ground, transition, and excited states.
Ab initio methods available in Chem3D with Gaussian or Jaguar apply to:
• Systems containing up to 150 atoms.• Organic, organometallics, and molecular
fragments (catalytic components of an enzyme).
• Gas or implicit solvent environment. • Study ground, transition, and excited states
(certain methods).
Table G.1 Comparison of Methods
Method Type Advantages Disadvantages Best For
Molecular Mechanics (Gaussian)
Uses classical physics
Relies on force-field with embedded empir-ical parameters
Least intensive computationally—fast and useful with limited computer resources
Can be used for mole-cules as large as enzymes
Particular force field applicable only for a limited class of molecules
Does not calculate elec-tronic properties
Requires experimental data (or data from ab initio) for parameters
Large systems (thousands of atoms)
Systems or processes with no breaking or forming of bonds
Semiempirical (MOPAC, Gaussian)
Uses quantum physics
Uses experimentally derived empirical parameters
Uses approximation extensively
Less demanding computationally than ab initio methods
Capable of calculating transition states and excited states
Requires experimental data (or data from ab initio) for parameters
Less rigorous than ab initio methods
Medium-sized systems (hundreds of atoms)
Systems involving elec-tronic transitions

Chem & Bio Office 2010 User Guide 239Chem & Bio 3D
Potential Energy SurfacesA potential energy surface (PES) can describe:
• A molecule or ensemble of molecules hav-ing constant atom composition (ethane, for example) or a system where a chemical reaction occurs.
• Relative energies for conformations (eclipsed and staggered forms of ethane).
Potential energy surfaces can differentiate between:
• Molecules having slightly different atomic composition (ethane and chloroethane).
• Molecules with identical atomic composi-tion but different bonding patterns, such as propylene and cyclopropane
• Excited states and ground states of the same molecule.
Potential Energy Surfaces (PES)The true representation of a model’s potential energy surface is a multi-dimensional surface
whose dimensionality increases with the num-ber of atom coordinates. Since each atom has three independent variables (x, y, z coordi-nates), visualizing a surface for a many-atom model is impossible. However, you can gener-alize this problem by examining any 2 inde-pendent variables, such as the x and y coordinates of an atom, as shown below.
Figure G.2 Potential energy surfaces
ab initio (Gaussian, CS GAMESS)
Uses quantum physics
Mathematically rigorous—no empirical parameters
Useful for a broad range of systems
Does not depend on experimental data
Capable of calculating transition states and excited states
Computationally inten-sive
Small systems(tens of atoms)
Systems involving elec-tronic transitions
Molecules or systems without available experi-mental data (“new” chemistry)
Systems requiring rigorous accuracy
Table G.1 Comparison of Methods
Method Type Advantages Disadvantages Best For
Local MinimumGlobal Minimum
Saddle PointPotential Energy

240 Computation ConceptsAppendix G
The main areas of interest on a potential energy surface are the extrema as indicated by the arrows, are as follows:
• Global minimum—The most stable con-formation appears at the extremum where the energy is lowest. A molecule has only one global minimum.
• Local minima—Additional low energy extrema. Minima are regions of the PES where a change in geometry in any direc-tion yields a higher energy geometry.
• Saddle point—A stationary point between two low energy extrema. A saddle point is defined as a point on the potential energy surface at which there is an increase in energy in all directions except one, and for which the slope (first derivative) of the surface is zero.
NOTE: At the energy minimum, the energy is not zero; the first derivative (gradient) of the energy with respect to geometry is zero.
All the minima on a potential energy surface of a molecule represent stable stationery points where the forces on each atom sums to zero. The global minimum represents the most sta-ble conformation; the local minima, less stable conformations; and the saddle points represent transition conformations between minima.
Single Point Energy CalculationsSingle point energy calculations can be used to calculate properties of specific geometry of a model. The values of these properties depend on where the model lies on the potential sur-face as follows:
• A single point energy calculation at a global minimum provides information about the model in its most stable conformation.
• A single point calculation at a local mini-mum provides information about the model in one of many stable conformations.
• A single point calculation at a saddle point provides information about the transition state of the model.
• A single point energy calculation at any other point on the potential energy surface provides information about that particular geometry, not a stable conformation or tran-sition state.
Single point energy calculations can be per-formed before or after optimizing geometry.
NOTE: Do not compare values from different methods. Different methods rely on different assumptions about a given molecule, and the energies differ by an arbitrary offset.
Geometry OptimizationGeometry optimization is used to locate a sta-ble conformation of a model, and should be done before performing additional computa-tions or analyses of a model.Locating global and local energy minima is typically done by energy minimization. Locat-ing a saddle point is optimizing to a transition state.The ability of a geometry optimization to con-verge to a minimum depends on the starting geometry, the potential energy function used, and the settings for a minimum acceptable gra-dient between steps (convergence criteria).Geometry optimizations are iterative and begin at some starting geometry as follows:

Chem & Bio Office 2010 User Guide 241Chem & Bio 3D
1. The single point energy calculation is per-formed on the starting geometry.
2. The coordinates for some subset of atoms are changed and another single point energy calculation is performed to determine the energy of that new conformation.
3. The first or second derivative of the energy (depending on the method) with respect to the atomic coordinates determines how large and in what direction the next incre-ment of geometry change should be.
4. The change is made.5. Following the incremental change, the
energy and energy derivatives are again determined and the process continues until convergence is achieved, at which point the minimization process terminates.
The following illustration shows some con-cepts of minimization. For simplicity, this plot shows a single independent variable plotted in two dimensions.
The starting geometry of the model determines which minimum is reached. For example, start-ing at (b), minimization results in geometry (a), which is the global minimum. Starting at (d) leads to geometry (f), which is a local mini-
mum.The proximity to a minimum, but not a particular minimum, can be controlled by spec-ifying a minimum gradient that should be reached. Geometry (f), rather than geometry (e), can be reached by decreasing the value of the gradient where the calculation ends.In theory, if a convergence criterion (energy gradient) is too lax, a first-derivative minimi-zation can result in a geometry that is near a saddle point. This occurs because the value of the energy gradient near a saddle point, as near a minimum, is very small. For example, at point (c), the derivative of the energy is 0, and as far as the minimizer is concerned, point (c) is a minimum. First derivative minimizers can-not, as a rule, cross saddle points to reach another minimum.
NOTE: If the saddle point is the extremum of interest, it is best to use a procedure that specif-ically locates a transition state, such as the CS MOPAC Pro Optimize To Transition State command.
You can take the following steps to ensure that a minimization has not resulted in a saddle point.
• The geometry can be altered slightly and another minimization performed. The new starting geometry might result in either (a), or (f) in a case where the original one led to (c).
• The Dihedral Driver can be employed to search the conformational space of the model. For more information, see “Tutorial 5: The Dihedral Driver” on page 52.
• A molecular dynamics simulation can be run, which will allow small potential energy barriers to be crossed. After completing the

242 Computation ConceptsAppendix G
molecular dynamics simulation, individual geometries can then be minimized and ana-lyzed. For more information see “MM2” on page 255
You can calculate the following properties with the computational methods available through Chem3D using the PES: • Steric energy• Heat of formation• Dipole moment• Charge density• COSMO solvation in water• Electrostatic potential• Electron spin density• Hyperfine coupling constants• Atomic charges• Polarizability• Others, such as IR vibrational frequencies
Molecular Mechanics Theory in BriefMolecular mechanics computes the energy of a molecule in terms of a set of classical potential energy functions. The potential energy func-tions and the parameters used for their evalua-tion are known as a “force-field”. Molecular mechanical methods are based on the following principles:
• Nuclei and electrons are lumped together and treated as unified particles (atoms).
• Atoms are typically treated as spheres.• Bonds are typically treated as springs.• Non-bonded interactions between atoms are
described using potential functions derived from classical mechanics.
• Individual potential functions are used to describe the different interactions: bond stretching, angle bending, torsion (bond twisting), and through-space (non-bonded) interactions.
• Potential energy functions rely on empiri-cally derived parameters (force constants, equilibrium values) that describe the inter-actions between sets of atoms.
• The sum of the interactions determines the conformation of the molecule.
• Molecular mechanical energies have no meaning as absolute quantities. They can only be used to compare relative steric energy (strain) between two or more con-formations of the same molecule.
The Force-FieldSince molecular mechanics treats bonds as springs, the mathematics of spring deformation (Hooke’s Law) is used to describe the ability of bonds to stretch, bend, and twist. Non-bonded atoms (greater than two bonds apart) interact through van der Waals attraction, steric repulsion, and electrostatic attraction and repulsion. These properties are easiest to describe mathematically when atoms are con-sidered as spheres of characteristic radii.The total potential energy, E, of a molecule can be described by the following summation of interactions: E= Stretching Energy + Bending Energy + Torsion Energy + Non-bonded Interaction EnergyThe first three terms are the so-called bonded interactions. In general, these bonded interac-tions can be viewed as a strain energy imposed by a model moving from some ideal zero strain conformation. The last term, which represents

Chem & Bio Office 2010 User Guide 243Chem & Bio 3D
the non-bonded interactions, includes the two interactions shown below. The total potential energy can be described by the following relationships between atoms. The numbers refer to the atom positions in the figure shown below.
1. Bond Stretching: (1-2) bond stretching between directly bonded atoms
2. Angle Bending: (1-3) angle bending between two atoms that are adjacent to a third atom.
3. Torsion Energy: (1-4) torsional angle rota-tion between atoms that form a dihedral angle.
4. Repulsion for atoms that are too close and attraction at long range from dispersion forces (van der Waals interaction).
5. Interactions from charges, dipoles, quadru-poles (electrostatic interactions).
The following illustration shows the major interactions.
Figure G.3 Potential Energy Interactions
Different kinds of force-fields have been developed. Some include additional energy terms that describe other kinds of deforma-
tions, such as the coupling between bending and stretching in adjacent bonds, in order to improve the accuracy of the mechanical model.The reliability of a molecular mechanical force-field depends on the parameters and the potential energy functions used to describe the total energy of a model. Parameters must be optimized for a particular set of potential energy functions, and thus are not transferable to other force fields.
MM2 Chem3D uses a modified version of Allinger’s MM2 force field. For additional MM2 refer-ences see “MM2” on page 255.The principal additions to Allinger’s MM2 force field are:
• A charge-dipole interaction term• A quartic stretching term• Cutoffs for electrostatic and van der Waals
terms with 5th order polynomial switching function
• Automatic pi system calculations when necessary
• Torsional and non-bonded constraints.
Chem3D stores the parameters for the potential energy function in tables. These tables may be viewed and edited from the Parameter Tables option of the View menu. Each parameter is classified by a Quality num-ber. This number indicates the reliability of the data. The quality ranges from 4, where the data is derived completely from experimental data (or ab initio data), to 1, where the data is guessed by Chem3D.

244 Computation ConceptsAppendix G
The parameter table, MM2 Constants, contains adjustable parameters that correct for failings of the potential functions in outlying situations.
NOTE: Editing of MM2 parameters should only be done with the greatest of caution by expert users. Within a force-field equation, parameters operate interdependently; chang-ing one normally requires that others be changed to compensate for its effects.
Bond Stretching Energy
The bond stretching energy equation is based on Hooke's law. The Ks parameter controls the stiffness of the spring’s stretching (bond stretching force constant), while ro defines its equilibrium length (the standard measurement used in building models). Unique Ks and ro parameters are assigned to each pair of bonded atoms based on their atom types (C-C, C-H, O-C). The parameters are stored in the Bond Stretching parameter table. The constant, 71.94, is a conversion factor to obtain the final units as kcal/mole.The result of this equation is the energy contri-bution associated with the deformation of the bond from its equilibrium bond length. This simple parabolic model fails when bonds are stretched toward the point of dissociation. The Morse function would be the best correc-tion for this problem. However, the Morse Function leads to a large increase in computa-tion time. As an alternative, cubic stretch and quartic stretch constants are added to provide a result approaching a Morse-function correc-tion.
The cubic stretch term allows for an asymmet-ric shape of the potential well, allowing these long bonds to be handled. However, the cubic stretch term is not sufficient to handle abnor-mally long bonds. A quartic stretch term is used to correct problems caused by these very long bonds. With the addition of the cubic and quartic stretch term,the equation for bond stretching becomes:
Both the cubic and quartic stretch constants are defined in the MM2 Constants table.To precisely reproduce the energies obtained with Allinger’s force field: set the cubic and quartic stretching constant to “0” in the MM2 Constants tables.
Angle Bending Energy
The bending energy equation is also based on Hooke’s law. The Kb parameter controls the stiffness of the spring’s bending (angular force constant), while θ0 defines the equilibrium angle. This equation estimates the energy asso-ciated with deformation about the equilibrium bond angle. The constant, 0.02191418, is a conversion factor to obtain the final units as kcal/mole.Unique parameters for angle bending are assigned to each bonded triplet of atoms based on their atom types (C-C-C, C-O-C, C-C-H). For each triplet of atoms, the equilibrium angle differs depending on what other atoms the cen-tral atom is bonded to. For each angle there are three possibilities: XR2, XRH or XH2. For example, the XH2 parameter would be used for a C-C-C angle in propane, because the other atoms the central atom is bonded to are both

Chem & Bio Office 2010 User Guide 245Chem & Bio 3D
hydrogens. For isobutane, the XRH parameter would be used, and for 2,2-dimethylpropane, the XR2 parameter would be used.The effect of the Kb and θ0 parameters is to broaden or steepen the slope of the parabola. The larger the value of Kb, the more energy is required to deform an angle from its equilib-rium value. Shallow potentials are achieved with Kb values less than 1.0.A sextic term is added to increase the energy of angles with large deformations from their ideal value. The sextic bending constant, SF, is defined in the MM2 Constants table. With the addition of the sextic term, the equation for angle bending becomes:
NOTE: The default value of the sextic force constant is 0.00000007. To precisely reproduce the energies obtained with Allinger’s force field, set the sextic bending constant to “0” in the MM2 Constants tables.
There are three parameter tables for the angle bending parameters:
• Angle Bending parameters• 3-Membered Ring Angle Bending parame-
ters • 4-Membered Ring Angle Bending parame-
ters
There are three additional angle bending force constants available in the MM2 Constants table. These are the “-CHR-Bending” con-stants, specifically for carbons with one or two attached hydrogens.The -CHR- Bending Kb for 1-1-1 angles1 allows more accurate force constants to be specified for Type 1 (-CHR-) and Type 2 (-CHR-) interactions.
The -CHR-Bending Kb for 1-1-1 angles in 4-membered rings and the -CHR- Bending Kb for 22-22-22 angles in 3-membered rings require separate constants for accurate specifi-cation.
Torsion Energy
This term accounts for the tendency for dihe-dral angles (torsionals) to have an energy mini-mum occurring at specific intervals of 360/n. In Chem3D, n can equal 1, 2, or 3.
The Vn/2 parameter is the torsional force con-stant. It determines the amplitude of the curve. The n signifies its periodicity. nφ shifts the entire curve about the rotation angle axis. The parameters are determined through curve-fit-ting techniques. Unique parameters for tor-sional rotation are assigned to each bonded quartet of atoms based on their atom types (C-C-C-C, C-O-C-N, H-C-C-H).Chem3D provides three torsional parameters tables:
• Torsional parameters • 4-Membered ring torsions• 3-Membered ring torsions.
Non-Bonded EnergyThe non-bonded energy represents the pair-wise sum of the energies of all possible inter-
1. The numbers in the angle definitions refer to the Text column in the Atom Types Table. 1 refers to C-alkane, and 22 refers to C-cyclo-propane.

246 Computation ConceptsAppendix G
acting non-bonded atoms within a predetermined “cut-off” distance. The non-bonded energy accounts for repulsive forces experienced between atoms at close dis-tances, and for the attractive forces felt at longer distances. It also accounts for their rapid falloff as the interacting atoms move farther apart by a few Angstroms.
van der Waals EnergyRepulsive forces dominate when the distance between interacting atoms becomes less than the sum of their contact radii. In Chem3D repulsion is modeled by an equation which combines an exponential repulsion with an attractive dispersion interaction (1/R6):
The parameters include:
• Ri* and Rj*—the van der Waals radii for the atoms
• Epsilon (ε)—determines the depth of the attractive potential energy well and how easy it is to push atoms together
• rij—which is the actual distance between the atoms
At short distances the above equation favors repulsive over dispersive interactions. To com-pensate for this at short distances (R=3.311) this term is replaced with:
The R* and Epsilon parameters are stored in the MM2 Atom Types table.
For certain interactions, values in the VDW interactions parameter table are used instead of those in the MM2 atom types table. These situ-ations include interactions where one of the atoms is very electronegative relative to the other, such as in the case of a water molecule.
Cutoff Parameters for van der Waals InteractionsThe use of cutoff distances for van der Waals terms greatly improves the computational speed for large molecules by eliminating long range, relatively insignificant, interactions from the computation.Chem3D uses a fifth-order polynomial switch-ing function so that the resulting force field maintains second-order continuity. The cutoff is implemented gradually, beginning at 90% of the specified cutoff distance. This distance is set in the MM2 Constants table.The van der Waals interactions fall off as 1/r6, and can be cut off at much shorter distances, for example 10Å. This cut off speeds the com-putations significantly, even for relatively small molecules.
NOTE: To precisely reproduce the energies obtained with Allinger’s force field: set the van der Waals cutoff constants to large values in the MM2 Constants table.
Electrostatic Energy
The electrostatic energy is a function of the charge on the non-bonded atoms, q, their inter-atomic distance, rij, and a molecular dielectric expression, D, that accounts for the attenuation

Chem & Bio Office 2010 User Guide 247Chem & Bio 3D
of electrostatic interaction by the environment (solvent or the molecule itself).In Chem3D, the electrostatic energy is mod-eled using atomic charges for charged mole-cules and bond dipoles for neutral molecules. There are three possible interactions accounted for by Chem3D:
• charge/charge • dipole/dipole• dipole/charge.
Each type of interaction uses a different form of the electrostatic equation as shown below:
charge/charge contribution
where the value 332.05382 converts the result to units of kcal/mole.
dipole/dipole contribution
where the value 14.388 converts the result from ergs/mole to kcal/mole, χ is the angle between the two dipoles μi and μj, αi and αj are the angles the dipoles form with the vector, rij, connecting the two at their midpoints, and Dm is the (effective) dielectric constant.
dipole/charge contribution
where the value 69.120 converts the result to units of kcal/mole.Bond dipole parameters, μ, for each atom pair are stored in the bond stretching parameter
table. The charge, q, is stored in the atom types table. The molecular dielectric expression is set to a constant value between 1.0 and 5.0 in the MM2 Atom types table.
NOTE: Chem3D does not use a distance-dependent dielectric.
Cutoff Parameters for Electrostatic InteractionsThe use of cutoff distances for electrostatic terms, as for van der Waals terms, greatly improves the computational speed for large molecules by eliminating long-range interac-tions from the computation.As in the van der Waals calculations, Chem3D uses a fifth-order polynomial switching func-tion to maintain second-order continuity in the force-field. The switching function is invoked as minimum values for charge/charge, charge/dipole, or dipole/dipole interactions are reached. These cutoff values are located in the MM2 Constants parameter table.Since the charge-charge interaction energy between two point charges separated by a dis-tance r is proportional to 1/r, the charge-charge cutoff must be rather large, typically 30 to 40Å, depending on the size of the molecule. The charge-dipole, dipole-dipole interactions fall off as 1/r2, 1/r3 and can be cutoff at much shorter distances, for example 25 and 18Å respectively. To precisely reproduce the ener-gies obtained with Allinger’s force field: set the cutoff constants to large values (99, for example) in the MM2 Constants table.
OOP BendingAtoms that are arranged in a trigonal planar fashion, as in sp2 hybridization, require an

248 Computation ConceptsAppendix G
additional term to account for out-of-plane (OOP) bending. MM2 uses the following equa-tion to describe OOP bending:
The form of the equation is the same as for angle bending, however, the θ value used is angle of deviation from coplanarity for an atom pair and θ o is set to zero. The illustration below shows the θ determined for atom pairs DB.
Figure G.4 : Determination of θ
The special force constants for each atom pair are located in the Out of Plane bending param-eters table. The sextic correction is used as pre-viously described for Angle Bending. The sextic constant, SF, is located in the MM2 Constants table.
Pi Bonds and Atoms with Pi BondsFor models containing pi systems, MM2 per-forms a Pariser-Parr-Pople pi orbital SCF com-putation for each system. A pi system is defined as a sequence of three or more atoms of types which appear in the Conjugate Pi sys-tem Atoms table. Because of this computation, MM2 may calculate bond orders other than 1, 1.5, 2, and so on.
NOTE: The method used is that of D.H. Lo and M.A. Whitehead, Can. J. Chem., 46, 2027(1968), with heterocycle parameter according to G.D. Zeiss and M.A. Whitehead, J.
Chem. Soc. (A), 1727 (1971). The SCF compu-tation yields bond orders which are used to scale the bond stretching force constants, stan-dard bond lengths and twofold torsional barri-ers.
The basic process is:
1. A Fock matrix is generated based on the favorability of electron sharing between pairs of atoms in a pi system.
2. The pi molecular orbitals are computed from the Fock matrix.
3. The pi molecular orbitals are used to com-pute a new Fock matrix, then this new Fock matrix is used to compute better pi molecu-lar orbitals.
4. Step 2 and 3 are repeated until the computa-tion of the Fock matrix and the pi molecular orbitals converge. This method is called the self-consistent field technique or a pi-SCF calculation.
5. A pi bond order is computed from the pi molecular orbitals.
6. The pi bond order is used to modify the bond length(BLres) and force constant (Ksres) for each bond in the pi system.
7. The modified values of Ksres and BLres are used in the molecular mechanics portion of the MM2 computation to further refine the molecule.
Stretch-Bend Cross TermsStretch-bend cross terms are used when a cou-pling occurs between bond stretching and angle bending. For example, when an angle is compressed, the MM2 force field uses the stretch-bend force constants to lengthen the
D
A
B
Cθ y
x
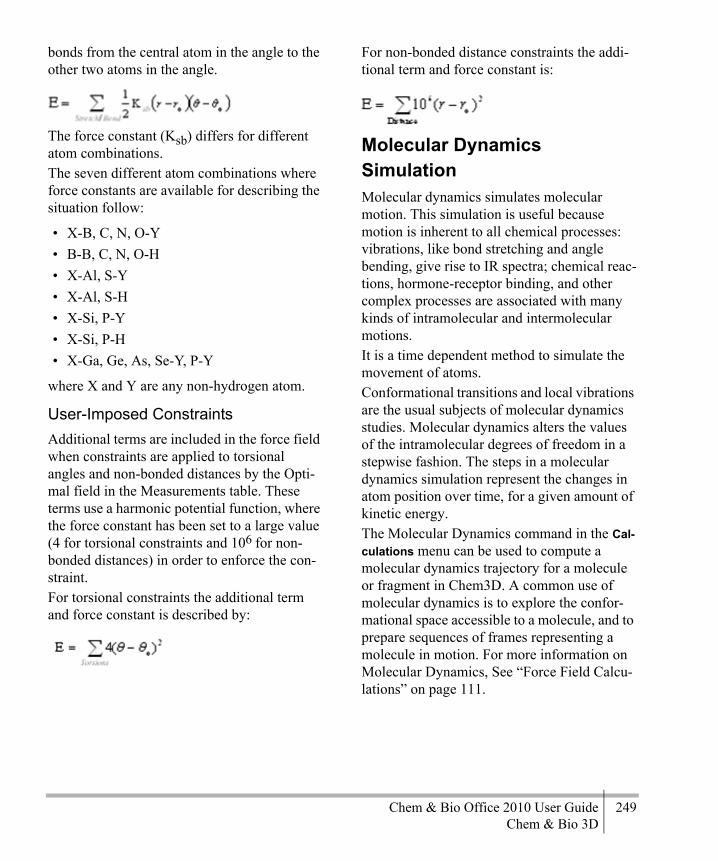
Chem & Bio Office 2010 User Guide 249Chem & Bio 3D
bonds from the central atom in the angle to the other two atoms in the angle.
The force constant (Ksb) differs for different atom combinations. The seven different atom combinations where force constants are available for describing the situation follow:
• X-B, C, N, O-Y• B-B, C, N, O-H• X-Al, S-Y• X-Al, S-H• X-Si, P-Y• X-Si, P-H• X-Ga, Ge, As, Se-Y, P-Y
where X and Y are any non-hydrogen atom.
User-Imposed ConstraintsAdditional terms are included in the force field when constraints are applied to torsional angles and non-bonded distances by the Opti-mal field in the Measurements table. These terms use a harmonic potential function, where the force constant has been set to a large value (4 for torsional constraints and 106 for non-bonded distances) in order to enforce the con-straint.For torsional constraints the additional term and force constant is described by:
For non-bonded distance constraints the addi-tional term and force constant is:
Molecular Dynamics SimulationMolecular dynamics simulates molecular motion. This simulation is useful because motion is inherent to all chemical processes: vibrations, like bond stretching and angle bending, give rise to IR spectra; chemical reac-tions, hormone-receptor binding, and other complex processes are associated with many kinds of intramolecular and intermolecular motions. It is a time dependent method to simulate the movement of atoms.Conformational transitions and local vibrations are the usual subjects of molecular dynamics studies. Molecular dynamics alters the values of the intramolecular degrees of freedom in a stepwise fashion. The steps in a molecular dynamics simulation represent the changes in atom position over time, for a given amount of kinetic energy.The Molecular Dynamics command in the Cal-culations menu can be used to compute a molecular dynamics trajectory for a molecule or fragment in Chem3D. A common use of molecular dynamics is to explore the confor-mational space accessible to a molecule, and to prepare sequences of frames representing a molecule in motion. For more information on Molecular Dynamics, See “Force Field Calcu-lations” on page 111.

250 Computation ConceptsAppendix G
Molecular Dynamics FormulasThe molecular dynamics computation consists of a series of steps that occur at a fixed inter-val, typically about 2.0 fs (femtoseconds, 1.0 x 10⁻¹⁵ seconds). The Beeman algorithm for inte-grating the equations of motion, with improved coefficients (B. R. Brooks) is used to compute new positions and velocities of each atom at each step. Each atom (i) is moved according to the fol-lowing formula:
Similarly, each atom is moved for y and z, where xi, yi, and zi are the Cartesian coordi-nates of the atom, vi is the velocity, ai is the acceleration, aio
ld is the acceleration in the pre-vious step, and Δt is the time between the cur-rent step and the previous step. The potential energy and derivatives of potential energy (gi) are then computed with respect to the new Car-tesian coordinates. New accelerations and velocities are computed at each step according to the following formu-las (mi is the mass of the atom):
Approximate Hamiltonians in MOPACThere are five approximation methods avail-able in MOPAC: • MNDO• AM1
• PM3• PM6• MNDO-d1
The potential energy functions modify the HF equations by approximating and parameteriz-ing aspects of the Fock matrix. The approximations in semiempirical MOPAC methods play a role in the following areas of the Fock operator:
• The basis set used in constructing the 1-electron atom orbitals is a minimum basis set of only the s and p Slater Type Orbitals (STOs) for valence electrons.
• The core electrons are not explicitly treated. Instead they are added to the nucleus. The nuclear charge is termed Neffective. For example, Carbon as a nuclear charge of +6-2 core electrons for a effective nuclear charge of +4.
• Many of the 2-electron Coulomb and Exchange integrals are parameterized based on element.
Choosing a HamiltonianOverall, these potential energy functions may be viewed as a chronological progression of improvements from the oldest method, MINDO/3 to the newest method, PM3. How-ever, although the improvements in each method were designed to make global improvements, they have been found to be lim-ited in certain situations. The two major questions to consider when choosing a potential function are:
1. MNDO-d method is available only for ChemBio 3D Ultra.

Chem & Bio Office 2010 User Guide 251Chem & Bio 3D
• Is the method parameterized for the ele-ments in the model?
• Does the approximation have limitations which render it inappropriate for the model being studied?
For more detailed information see the MOPAC online manual.
MNDO Applicability and LimitationsMNDO may be applied to the shaded elements in the table below:
The following limitations apply to MNDO:
• Sterically crowded molecules are too unsta-ble, for example, neopentane.
• Four-membered rings are too stable, for example, cubane.
• Hydrogen bonds are virtually non-existent, for example, water dimer. Overly repulsive nonbonding interactions between hydro-gens and other atoms are predicted. In par-ticular, simple H-bonds are generally not predicted to exist using MNDO.
• Hypervalent compounds are too unstable, for example, sulfuric acid.
• Activation barriers are generally too high. • Non-classical structures are predicted to be
unstable relative to the classical structure, for example, ethyl radical.
• Oxygenated substituents on aromatic rings are out-of-plane, for example, nitroben-zene.
• •The peroxide bond is systematically too short by about 0.17 Å.
• •The C-O-C angle in ethers is too large.
AM1 Applicability and LimitationsAM1 may be applied to the shaded elements in the table below:
Important factors relevant to AM1 are:
• AM1 is similar to MNDO; however, there are changes in the core-core repulsion terms and reparameterization.
• AM1 is a distinct improvement over MNDO, in that the overall accuracy is con-siderably improved. Specific improvements are:• The strength of the hydrogen bond in the
water dimer is 5.5 kcal/mol, in accordance with experiment.
• Activation barriers for reaction are mark-edly better than those of MNDO.
• Hypervalent phosphorus compounds are considerably improved relative to MNDO.
• In general, errors in ΔHf obtained using AM1 are about 40% less than those given by MNDO.
• AM1 phosphorus has a spurious and very sharp potential barrier at 3.0Å. The effect of this is to distort otherwise symmetric geometries and to introduce spurious acti-vation barriers. A good example is given by P4O6, in which the nominally equiva-lent P-P bonds are predicted by AM1 to
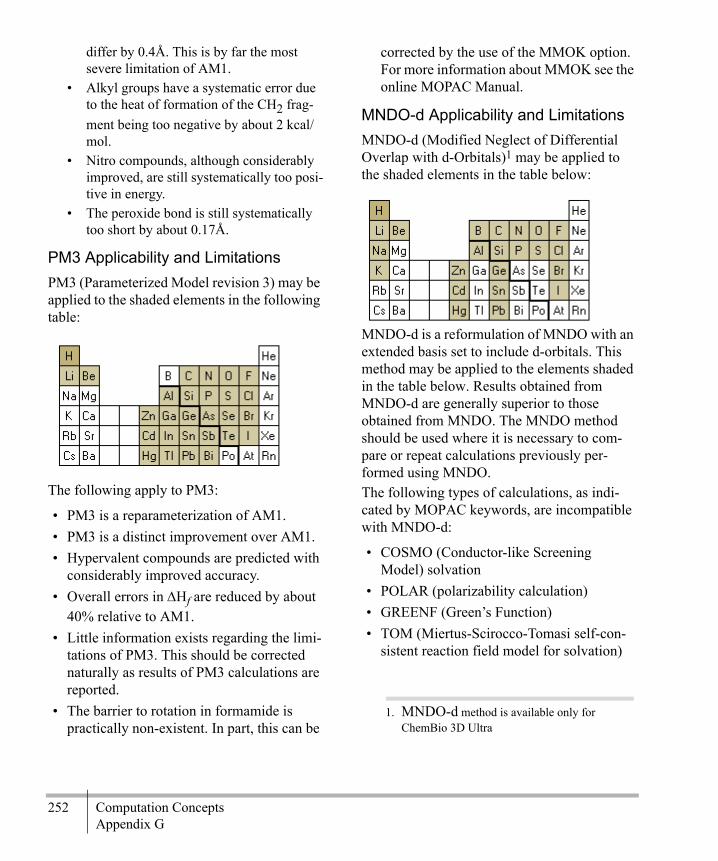
252 Computation ConceptsAppendix G
differ by 0.4Å. This is by far the most severe limitation of AM1.
• Alkyl groups have a systematic error due to the heat of formation of the CH2 frag-ment being too negative by about 2 kcal/mol.
• Nitro compounds, although considerably improved, are still systematically too posi-tive in energy.
• The peroxide bond is still systematically too short by about 0.17Å.
PM3 Applicability and LimitationsPM3 (Parameterized Model revision 3) may be applied to the shaded elements in the following table:
The following apply to PM3:
• PM3 is a reparameterization of AM1.• PM3 is a distinct improvement over AM1.• Hypervalent compounds are predicted with
considerably improved accuracy.• Overall errors in ΔHf are reduced by about
40% relative to AM1.• Little information exists regarding the limi-
tations of PM3. This should be corrected naturally as results of PM3 calculations are reported.
• The barrier to rotation in formamide is practically non-existent. In part, this can be
corrected by the use of the MMOK option. For more information about MMOK see the online MOPAC Manual.
MNDO-d Applicability and LimitationsMNDO-d (Modified Neglect of Differential Overlap with d-Orbitals)1 may be applied to the shaded elements in the table below:
MNDO-d is a reformulation of MNDO with an extended basis set to include d-orbitals. This method may be applied to the elements shaded in the table below. Results obtained from MNDO-d are generally superior to those obtained from MNDO. The MNDO method should be used where it is necessary to com-pare or repeat calculations previously per-formed using MNDO.The following types of calculations, as indi-cated by MOPAC keywords, are incompatible with MNDO-d:
• COSMO (Conductor-like Screening Model) solvation
• POLAR (polarizability calculation)• GREENF (Green’s Function)• TOM (Miertus-Scirocco-Tomasi self-con-
sistent reaction field model for solvation)
1. MNDO-d method is available only for ChemBio 3D Ultra

Chem & Bio Office 2010 User Guide 253Chem & Bio 3D
PM6 Applicability and Limitations PM6(Parameterized Model revision 6) may be applied to all main group elements and transi-tion metals.The following apply to:
• PM6 is a reparameterization of PM5. It has been developed using experimental and ab initio data from over 9000 compounds.
• PM6 is a distinct improvement over PM3 and AM1.
• Corrects major errors in AM1 and PM3.
• More accurate prediction of heat of forma-tion.
• Generates more accurate geometries- For example, it optimizes anthraquinones to correct planar fused ring structure.
• More accurate positioning of bridging hydrogen bonds- for example, the bridging hydrogen bond between the two oxygen atoms is positioned equidistant in dicarbox-ylic acid anions.

254 Computation ConceptsAppendix G

Chem & Bio Office 2010 User Guide 255Chem & Bio 3D
MM2This section provides additional information about the MM2 parameters and force field that has not be covered in other areas of the Chem & Bio 3D 12.0 documentation.
MM2 ParametersThe original MM2 parameters include the ele-ments commonly used in organic compounds: carbon, hydrogen, nitrogen, oxygen, sulfur, and halogens. The atom type numbers for these atom types range from 1 to 50. The MM2 parameters were derived from three sources:
• Most of the parameters were provided by Dr. N. L. Allinger.
• Several additional parameters were pro-vided by Dr. Jay Ponder, author of the TINKER program.
• Some commonly used parameters that were not provided by Dr. Allinger or Dr. Ponder are provided by CambridgeSoft Corpora-tion. However, most of these parameters are estimates which are extrapolated from other parameters.
The best source of information on the MM2 parameter set is Molecular Mechanics, Burk-ert, Ulrich and Allinger, Norman L., ACS Monograph 177, American Chemical Society, Washington, DC, 1982.
A method for developing reasonable guesses for parameters for non-MM2 atom types can be found in “Development of an Internal Searching Algorithm for Parameterization of the MM2/MM3 Force Fields”, Journal of Computational Chemistry, Vol 12, No. 7, 844-849 (1991).
Other ParametersThe rest of the parameters consist of atom types and elements in the periodic table which were not included in the original MM2 force field, such as metals. The rectification type of all the non-MM2 atom types in the Chem3D Parameter tables is Hydrogen (H). The atom type numbers for these atom types range from 111 to 851. The atom type number for each of the non-MM2 atom types in the MM2 Atom Type Parameters table is based on the atomic number of the element and the num-ber of ligands in the geometry for that atom type. To determine an atom type number, the atomic number is multiplied by ten, and the number of ligands is added. For example, Co Octahedral has an atomic num-ber of 27 and six ligands. Therefore the atom type number is 276. In a case where different atom types of the same element have the same number of ligands (Iridium Tetrahedral, Atom Type # 774 and Iri-dium Square Planar, Atom Type # 779), the number nine is used for the second geometry.
H

256 MM2Appendix H
Viewing ParametersTo view the parameters used by Chem & Bio 3D 12.0 to perform MM2 computations, go to View>Parameter Tables>MM2 Atom Type Parameters.
Editing ParametersYou can edit the parameters that come with Chem3D. Parameters that you add or change can be guesses or approximations that you make, or values obtained from current litera-ture.In addition, there are several adjustable param-eters available in the MM2 Constants table.
NOTE: Before performing any editing we strongly recommend that you create back-up copies of all the parameter files located in the C3DTable directory.
To add a new parameter to the Torsional parameters table
1. Go to View>Parameter Tables>Torsional Parameters.
2. Enter the appropriate data in each field of the parameter table. Be sure that the name for the parameter is not duplicated else-where in the table.
3. Close and Save the table.
The MM2 Force FieldChem & Bio 3D 12.0 includes a new imple-mentation of Norman L. Allinger’s MM2 force field based in large measure on work done by Jay W. Ponder of Washington University. This appendix does not attempt to completely describe the MM2 force field, but discusses the way in which the MM2 force field is imple-
mented and used in Chem3D and the differ-ences between this implementation, Allinger’s MM2 program (QCPE 395), and Ponder’s TINKER system (M.J. Dudek and J.W. Pon-der, J. Comput. Chem., 16, 791-816 (1995)).For a review of MM2 and applications of molecular mechanics methods in general, see Molecular Mechanics, by U. Burkert and N. L. Allinger, ACS, Washington, D.C., USA, 1982. Computational Chemistry, by T. Clark, Wiley, N.Y., USA, 1985, also contains an excellent description of molecular mechanics. For a description of the TINKER system and the detailed rationale for Ponder’s additions to the MM2 force field, visit the TINKER home page. For a description and review of molecular dynamics, see Dynamics of Proteins and Nucleic Acids, J. Andrew McCammon and Stephen Harvey, Cambridge University Press, Cambridge, UK, 1987. Despite its focus on biopolymers, this book contains a cogent description of molecular dynamics and related methods, as well as information applicable to other molecules.
Allinger’s Force FieldThe Chem3D implementation of the Allinger Force Field differs in these areas:
• A charge-dipole interaction term• A quartic stretching term• Cutoffs for electrostatic and van der Waals
terms with a fifth-order polynomial switch-ing function
• Automatic pi system calculation when nec-essary
CHARGE-DIPOLE INTERACTION TERMAllinger’s potential function includes one of two possible electrostatic terms: one based on
Chem & Bio Office 2010 User Guide 257Chem & Bio 3D
bond dipoles, or one based on partial atomic charges. The addition of a charge-dipole inter-action term allows for a combined approach, where partial charges are represented as bond dipoles, and charged groups, such as ammo-nium or phosphate, are treated as point charges.QUARTIC STRETCHING TERMWith the addition of a quartic bond stretching term, troublesome negative bond stretching energies which appear when long bonds are treated by Allinger’s force field are eliminated.The quartic bond stretching term is required primarily for molecular dynamics; it has little or no effect on low energy conformations. To precisely reproduce energies obtained with Allinger’s force field, set the quartic stretching constant in the MM2 Constants table window to zero.ELECTROSTATIC AND VAN DER WAALS CUTOFF TERMSThe cutoffs for electrostatic and van der Waals terms greatly improve the computation speed for large molecules by eliminating long range interactions from the computation. To precisely reproduce energies obtained with Allinger’s force field, set the cutoff distances to large values (greater than the diameter of the model).The cutoff is implemented gradually, begin-ning at 50% of the specified cutoff distance for charge and charge-dipole interactions, 75% for dipole-dipole interactions, and 90% for van der Waals interactions. Chem & Bio 3D uses a fifth-order polynomial switching function so that the resulting force field is second-order continuous. Because the charge-charge interaction energy between two point charges separated by a dis-tance r is proportional to 1/r, the charge-charge
cutoff must be rather large, typically 30 or 40Å. The charge-dipole, dipole-dipole, and van der Waals energies, which fall off as 1/r2, 1/r3, and 1/r6, respectively, can be cut off at much shorter distances, for example, 25Å, 18Å, and 10Å, respectively. Fortunately, since the van der Waals interactions are by far the most numerous, this cutoff speeds the compu-tation significantly, even for relatively small molecules.PI ORBITAL SCF COMPUTATIONChem & Bio 3D determines whether the model contains any pi systems, and performs a Pariser-Parr-Pople pi orbital SCF computation for each system. A pi system is defined as a sequence of three or more atoms of types which appear in the Pi Atoms table window (PIATOMS.xml).The method used is that of D.H. Lo and M.A. Whitehead, Can. J. Chem., 46, 2027 (1968), with heterocycle parameters according to G.D. Zeiss and M.A. Whitehead, J. Chem. Soc. (A), 1727 (1971). The SCF computation yields bond orders which are used to scale the bond stretching force constants, standard bond lengths, and twofold torsional barriers.A step-wise overview of the process used to perform pi system calculations is as follows:
1. A matrix called the Fock matrix is initial-ized to represent the favorability of sharing electrons between pairs of atoms in a pi sys-tem.
2. The pi molecular orbitals are computed from the Fock matrix.
3. The pi molecular orbitals are used to com-pute a new Fock matrix, then this new Fock matrix is used to compute better pi molecu-lar orbitals.
4. Step 2 and step 3 are repeated until the computation of Fock matrix and the pi
258 MM2Appendix H
molecular orbitals converge. This method is called the self-consistent field technique or a pi-SCF calculation.
5. A pi bond order is computed from the pi molecular orbitals.
6. The pi bond order is used to modify the bond length (BLres) and force constant (KSres) for each sigma bond in the pi system.
7. The values of KSres and BLres are used in the molecular mechanics portion of the MM2 computation to further refine the molecule.
To examine the computed bond orders after an MM2 computation:
1. In the Pop-up Information control panel, select Bond Order.
2. Position the pointer over a bond.The information box contains the newly com-puted bond orders for any bonds that are in a pi system.
Chem & Bio Office 2010 User Guide 259Chem & Bio 3D
MOPACThis section provides additional information about the MOPAC that has not be covered in other areas of the Chem & Bio 3D 12.0 docu-mentation:.
• MOPAC background• Potential energy functions • Adding parameters to MOPAC• Electronic configuration (includes using
MOPAC sparkles
MOPAC Background MOPAC was created by Dr. James Stewart at the University of Texas in the 1980s. It imple-ments semi-empirical methodologies for ana-lyzing molecular models. (MOPAC stands for Molecular Orbital PACkage.) Due to its com-plexity and command line user interface, its use was limited until the mid 1990s.Since version 3.5 (1996), Chem & Bio 3D has provided an easy-to-use GUI interface for MOPAC that makes it accessible to the novice molecular modeller, as well as providing greater usability for the veteran modeller. MOPAC 2002 is copyrighted by Fujitsu, Ltd.MOPAC 2007 was released in 2007.MOPAC 2009 is the latest version. MOPAC 2007 can be upgraded to MOPAC 2009. We are currently supporting MOPAC 2009.
Potential Energy FunctionsMOPAC provides five potential energy func-tions: MNDO, PM3, PM6, AM1, and MNDO-d. All are SCF (Self Consistent Field) methods. Each function represents an approximation in the mathematics for solving the Electronic Schrödinger equation for a molecule.Historically, these approximations were made to allow ab initio calculations to be within the reach of available computer technology. Cur-rently, ab initio methods for small molecules are within the reach of desktop computers. Larger molecules, however, are still more effi-ciently modeled on the desktop using semi-empirical or molecular mechanics methodolo-gies.To understand the place that the potential energy functions in MOPAC take in the semi-empirical arena, here is a brief chronology of the approximations that comprise the semi-empirical methods. The first approximation was termed CNDO for Complete Neglect of Differential Overlap. The next approximation was termed INDO for Intermediate Neglect of Differential Overlap, Next followed MINDO/3, which stands for “Modified Intermediate Neglect of Differential Overlap”. Next was MNDO, which is short for “Modified Neglect of Differential Overlap” which corrected MINDO/3 for various organic molecules made up from elements in rows 1 and 2 of the peri-odic table. AM1 improved upon MNDO mark-
I
260 MOPACAppendix I
edly. Finally the most recent, PM3 is a reparameterization of AM1. The approxima-tions in PM3 are the same as AM1.This sequence of potential energy functions represents a series of improvements to support the initial assumption that complete neglect of diatomic orbitals would yield useful data when molecules proved too resource intensive for ab initio methods.
Adding Parameters to MOPACParameters are in constant development for use with PM3 and AM1 potential functions. If you find that the standard set of parameters that comes with CS MOPAC does not cover an ele-ment that you need, for example Cu, you can search the literature for the necessary parame-ter and add it at run time when performing a MOPAC job. This flexibility greatly enhances the usefulness of MOPAC.You can add parameters at run time using the keyword EXTERNAL=name, where name is the name of the file (and its full path) contain-ing the additional parameters.
Using KeywordsSelecting parameters for a MOPAC approxi-mation automatically inserts keywords in a window on the General tab of the MOPAC Interface. You can edit these keywords or use additional keywords to perform other calcula-tions or save information to the *.out file.
CAUTION
Use the automatic keywords unless you are an advanced MOPAC user. Changing the key-words may give unreliable results.
For a complete list of keywords see the MOPAC online manual.
Automatic KeywordsThe following contains keywords automati-cally sent to MOPAC and some additional key-words you can use to affect convergence.
Keyword Description
EF Automatically sent to MOPAC to specify the use of the Eigen-vector Following (EF) mini-mizer.
BFGS Prevents the automatic inser-tion of EF and restores the BFGS minimizer.
GEO-OK Automatically sent to MOPAC to override checking of the Z-matrix.
MMOK Automatically sent to MOPAC to specify Molecular Mechan-ics correction for amide bonds. Use the additional keyword NOMM to turn this keyword off.
RMAX=n.nn
The calculated/predicted energy change must be less than n.nn. The default is 4.0.
RMIN=n.nn The calculated/predicted energy change must be more than n.n. The default value is 0.000.
PRECISE Runs the SCF calculations using a higher precision so that values do not fluctuate from run to run.
LET Overrides safety checks to make the job run faster.
RECALC=5 Use this keyword if the optimi-zation has trouble converging to a transition state.

Chem & Bio Office 2010 User Guide 261Chem & Bio 3D
For descriptions of error messages reported by MOPAC see Chapter 11, pages 325–331, in the MOPAC manual.
Additional KeywordsKeywords that output the details of a particular computation are shown in the following table. Terms marked with an asterisk (*) appear in the *.out file.
The following table contains the keywords that invoke additional computations. Terms marked with an asterisk (*) appear in the *.out file.
Specifying the Electronic ConfigurationMOPAC must have the net charge of the mole-cule in order to determine whether the mole-cule is open or closed shell. If a molecule has a net charge, be sure you have either specified a charged atom type or added the charge.You can assign a charge using the Build from Text tool or by specifying it in MOPAC:To add the charge to the model:
1. Click the Build from Text tool. 2. Click an atom in your model.3. Type a charge symbol.For example, click a carbon and type “+” in a text box to make it a carbocation.The charge is
Keyword Data
ENPART All Energy Components*FORCE Zero Point EnergyFORCE Vibrational Frequencies*
MECI Microstates used in MECI cal-culation*
none HOMO/LUMO Energies*
none Ionization Potential*
none Symmetry*
LOCALIZE Print localized orbitalsVECTORS Print final eigenvectors
(molecular orbital coefficients)BONDS Bond Order Matrix*
Keyword Description
CIS UV absorption energies*Performs C.I. using only the first excited Singlet states and does not include the ground state. Use MECI to print out energy information in the *.out file.
FORCE Vibrational Analysis*Useful for determining zero point energies and normal vibrational modes. Use DFORCE to print out vibration information in *.out file.
NOMM No MM correction By default, MOPAC performs a molecular mechanics (MM) correction for CONH bonds.
PI Resolve density matrix into sigma and pi bonds.
PRECISE Increase SCF criteriaIncreases criteria by 100 times. This is useful for increasing the precision of energies reported.
T = n [M,H,D] Increase the total CPU time allowed for the job. The default is 1h (1 hour) or 3600 seconds.
Keyword Description
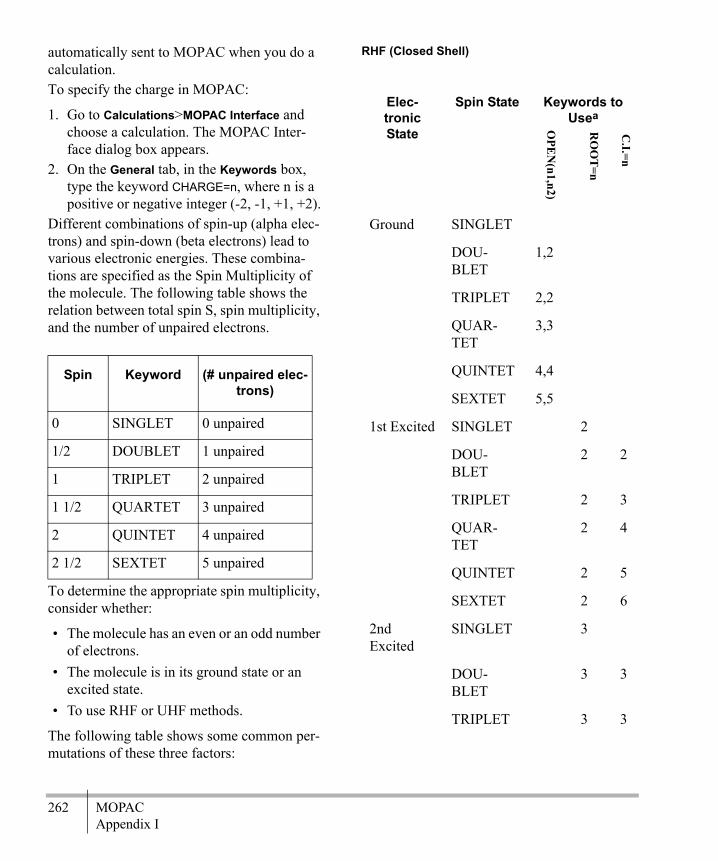
262 MOPACAppendix I
automatically sent to MOPAC when you do a calculation. To specify the charge in MOPAC:
1. Go to Calculations>MOPAC Interface and choose a calculation. The MOPAC Inter-face dialog box appears.
2. On the General tab, in the Keywords box, type the keyword CHARGE=n, where n is a positive or negative integer (-2, -1, +1, +2).
Different combinations of spin-up (alpha elec-trons) and spin-down (beta electrons) lead to various electronic energies. These combina-tions are specified as the Spin Multiplicity of the molecule. The following table shows the relation between total spin S, spin multiplicity, and the number of unpaired electrons.
To determine the appropriate spin multiplicity, consider whether:
• The molecule has an even or an odd number of electrons.
• The molecule is in its ground state or an excited state.
• To use RHF or UHF methods.
The following table shows some common per-mutations of these three factors:
RHF (Closed Shell)
Spin Keyword (# unpaired elec-trons)
0 SINGLET 0 unpaired
1/2 DOUBLET 1 unpaired
1 TRIPLET 2 unpaired
1 1/2 QUARTET 3 unpaired
2 QUINTET 4 unpaired
2 1/2 SEXTET 5 unpaired
Elec-tronic State
Spin State Keywords to Usea
Ground SINGLET
DOU-BLET
1,2
TRIPLET 2,2
QUAR-TET
3,3
QUINTET 4,4
SEXTET 5,5
1st Excited SINGLET 2
DOU-BLET
2 2
TRIPLET 2 3
QUAR-TET
2 4
QUINTET 2 5
SEXTET 2 6
2nd Excited
SINGLET 3
DOU-BLET
3 3
TRIPLET 3 3
OPE
N(n1,n2)
RO
OT
=n
C.I.=n

Chem & Bio Office 2010 User Guide 263Chem & Bio 3D
Even-Electron SystemsIf a molecule has an even number of electrons, the ground state and excited state configura-tions can be Singlet, Triplet, or Quintet (not likely). Normally the ground state is Singlet, but for some molecules, symmetry consider-ations indicate a Triplet is the most stable ground state.
GROUND STATE, RHF The Ground State, RHF configuration is as fol-lows:Singlet ground state. the most common con-figuration for a neutral, even electron stable organic compound. No additional keywords are necessary.Triplet ground state. Use the following key-word combination: TRIPLET OPEN(2,2)
Quintet ground state. Use the following key-word combination: QUINTET OPEN(4,4)
NOTE: The OPEN keyword is normally neces-sary only when the molecule has a high degree of symmetry, such as molecular oxygen. The OPEN keyword increases the active space available to the SCF calculation by including virtual orbitals. This is necessary for attaining the higher multiplicity configurations for even shell system. The OPEN keyword also invokes the RHF computation using the 1/2 electron approximation method and a C.I. calculation to correct the final RHF energies. To see the states used in a C.I. calculation, type MECI as an additional keyword. The information is printed at the bottom of the *.out file.
GROUND STATE, UHFFor UHF computations, all unpaired electrons are forced to be spin up (alpha).• Singlet ground state—the most common
configuration for a neutral, even electron, stable organic compound. No additional keywords are necessary.
• UHF will likely converge to the RHF solu-tion for Singlet ground states.
QUAR-TET
3 4
QUINTET 3 5
SEXTET 3 6a. Do not use OPEN(n1,n2) for ground-
state systems except for high symmetry systems with open shells
UHF (Open Shell)
Electronic State Spin State
Ground SINGLETDOUBLETTRIPLETQUARTETQUINTETSEXTET
Elec-tronic State
Spin State Keywords to Usea
OPE
N(n1,n2)
RO
OT
=n
C.I.=n

264 MOPACAppendix I
• Triplet or Quintet ground state: Use the keyword TRIPLET or QUINTET.
NOTE: When a higher multiplicity is used, the UHF solution yields different energies due to separate treatment of alpha electrons.
EXCITED STATE, RHFFirst Excited State: The first excited state is actually the second lowest state (the root=2) for a given spin system (Singlet, Triplet, Quin-tet). To request the first excited state, use the fol-lowing sets of keywords:First excited Singlet: ROOT=2 OPEN(2,2) SIN-GLET (or specify the single keyword EXCITED)First excited triplet: ROOT=2 OPEN (2,2)TRIPLET C.I.=n, where n=3 is the simplest case.First excited quintet: ROOT=2 OPEN (4,4) QUIN-TET C.I.=n, where n=5 is the simplest case. Second Excited State: The second excited state is actually the third lowest state (the root=3) for a given system (Singlet, Triplet, Quintet). To request the second excited state use the fol-lowing set of keywords:Second excited Singlet: OPEN(2,2) ROOT=3 SINGLET
Second excited triplet: OPEN(2,2) ROOT=3 TRIPLET C.I.=n, where n=3 is the simplest case.Second excited quintet: OPEN(4,4) ROOT=3 QUINTET C.I.=n, where n=5 is the simplest case.EXCITED STATE, UHFOnly the ground state of a given multiplicity can be calculated using UHF.
Odd-Electron SystemsOften, anions, cations, or radicals are odd-elec-tron systems. Normally, the ground states and
excited state configuration can be doublet, quartet or sextet.GROUND STATE, RHFDoublet ground state: This is the most com-mon configuration. No additional keywords are necessary.Quartet: Use the following keyword combina-tion: QUARTET OPEN(3,3)
Sextet ground state: Use the following key-word combination: SEXTET OPEN(5,5)
GROUND STATE, UHFFor UHF computations all unpaired electrons are forced to be spin up (alpha).Doublet ground state: This is the most com-mon configuration for a odd electron molecule. No additional keywords are necessary. UHF will yield energies different from those obtained by the RHF method.Quartet and Sextet ground state: Use the key-word QUARTET or SEXTET. EXCITED STATE, RHFFirst Excited State: The first excited state is actually the second lowest state (the root=2) for a given spin system (Doublet, Quartet, Sex-tet). To request the first excited state use the following sets of keywords.First excited doublet: ROOT=2 DOUBLET C.I.=n, where n=2 is the simplest case.First excited quartet: ROOT=2 QUARTET C.I.=n, where n=4 is the simplest case.First excited sextet: ROOT=2 SEXTET C.I.=n, where n=5 is the simplest case. Second Excited State: The second excited state is actually the third lowest state (the root=3) for a given system (Singlet, Triplet, Quintet). To request the second excited state use the fol-lowing set of keywords:Second excited doublet: ROOT=3 DOUBLET C.I.=n, where n=3 is the simplest case.
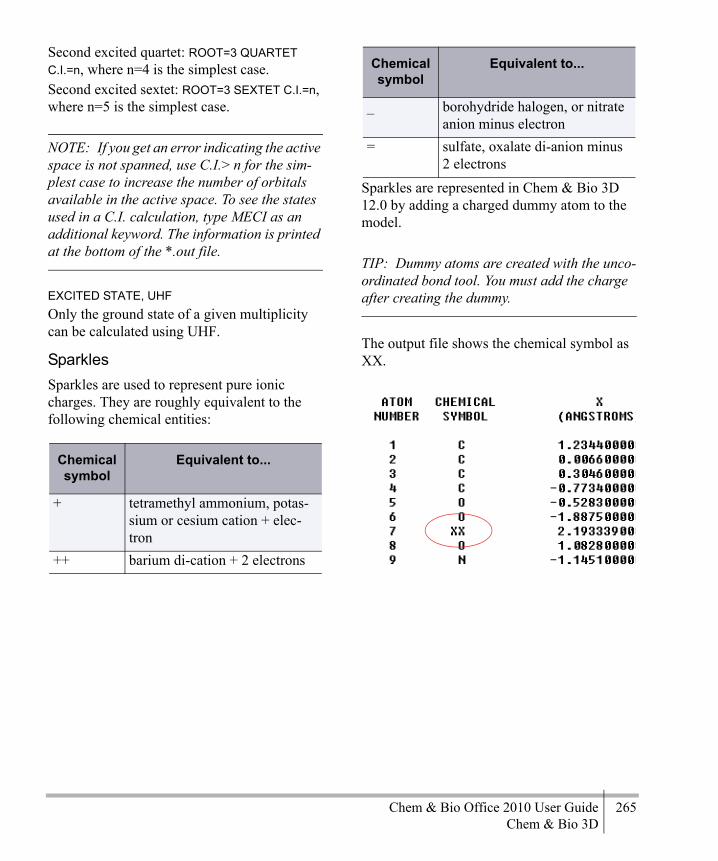
Chem & Bio Office 2010 User Guide 265Chem & Bio 3D
Second excited quartet: ROOT=3 QUARTET C.I.=n, where n=4 is the simplest case.Second excited sextet: ROOT=3 SEXTET C.I.=n, where n=5 is the simplest case.
NOTE: If you get an error indicating the active space is not spanned, use C.I.> n for the sim-plest case to increase the number of orbitals available in the active space. To see the states used in a C.I. calculation, type MECI as an additional keyword. The information is printed at the bottom of the *.out file.
EXCITED STATE, UHFOnly the ground state of a given multiplicity can be calculated using UHF.
SparklesSparkles are used to represent pure ionic charges. They are roughly equivalent to the following chemical entities:
Sparkles are represented in Chem & Bio 3D 12.0 by adding a charged dummy atom to the model.
TIP: Dummy atoms are created with the unco-ordinated bond tool. You must add the charge after creating the dummy.
The output file shows the chemical symbol as XX.
Chemical symbol
Equivalent to...
+ tetramethyl ammonium, potas-sium or cesium cation + elec-tron
++ barium di-cation + 2 electrons
_ borohydride halogen, or nitrate anion minus electron
= sulfate, oxalate di-anion minus 2 electrons
Chemical symbol
Equivalent to...

266 MOPACAppendix I

Chem & Bio Office 2010 User Guide 267Chem & Bio 3D
Technical SupportCambridgeSoft Corporation (CS) provides technical support to all registered users of this software through the internet, and through our Technical Support department.Our Technical Support webpages contain answers to frequently asked questions (FAQs) and general information about our software. You can access our Technical Support page using the following address: http://www.cambridgesoft.com/services/If you don’t find the answers you need on our Web site, please do the following before con-tacting Technical Support.
1. Check the system requirements for the soft-ware at the beginning of this User’s Guide.
2. Read the Troubleshooting section of this appendix and follow the possible resolution tactics outlined there.
3. If all your attempts to resolve a problem fail, fill out a copy of the CS Software Problem Report Form at the back of this User’s Guide. This form is also available on-line at:http://www.cambridgesoft.com/services/mail
• Try to reproduce the problem before con-tacting us. If you can reproduce the prob-lem, please record the exact steps that you took to do so.
• Record the exact wording of any error mes-sages that appear.
• Record anything that you have tried to cor-rect the problem.
You can deliver your CS Software Problem Report Form to Technical Support by the fol-lowing methods:Internet: http://www.cambridgesoft.com/ser-vices/mailEmail: [email protected] Fax: 617 588-9360Mail: CambridgeSoft CorporationATTN: Technical Support100 CambridgePark Drive Cambridge, MA 02140 USA
Serial NumbersWhen contacting Technical Support, always provide your serial number. This serial number is on the outside of the original application box. This is the same number you entered when you launched your CambridgeSoft appli-cation for the first time. If you have thrown away your box and lost your installation instructions, you can still find the serial num-ber. Go to Help>About CS {application name}.The serial number appears at the bot-tom left of the About box.
J
268 Technical SupportAppendix J
For more information on obtaining serial num-bers and registration codes see: http://www.cambridgesoft.com/services/coderequest/
TroubleshootingThis section describes steps you can take that affect the overall performance of CS Desktop Applications, as well as steps to follow if your computer crashes when using a CS software product.
PerformanceBelow are some ways you can optimize the performance of CambridgeSoft Desktop Appli-cations:
• In the Performance tab in the System con-trol panel, allocate more processor time to the application.
• Install more physical RAM. The more you have, the less ChemOffice Desktop Appli-cations will have to access your hard disk to use Virtual Memory.
• Increase the Virtual Memory (VM). Virtual memory extends RAM by allowing space on your hard disk to be used as RAM. How-ever, the time for swapping between the application and the hard disk is slower than swapping with physical RAM.
Applications and DriversAs with most complex software applications, there may be unusual circumstances in which Chem & Bio 3D 12.0 may become unrespon-sive. Below are some recommended steps for you to follow to try to resolve software and driver issues.
1. Restart Windows and try to reproduce the problem. If the problem recurs, continue with the following steps.
2. The most common conflicts concern video drivers, printer drivers, screen savers, and virus protection. If you do need to contact us, be sure to determine what type and ver-sion of drivers you are using.
• Video Driver related problems: If you are having problems with the display of any CambridgeSoft Desktop Application, try switching to the VGA video driver in the display Control Panel (or System Setup, and then retest the problems. If using a dif-ferent driver helps, your original driver may need to be updated–contact the maker of the driver and obtain the most up-to-date driver. If you still have trouble contact us with the relevant details about the original driver and the resulting problem.
• Printer Driver related problems: Try using a different printer driver. If using a different driver helps, your original driver may need to be updated–contact the maker of the driver and obtain the most up-to-date driver. If you still have trouble contact us with the relevant details about the original driver and the resulting problem.
3. Try reinstalling the software. Before you reinstall, uninstall the software and disable all background applications, including screen savers and virus protection. See the complete uninstall instructions on the CambridgeSoft Technical Support web page.
4. If the problem still occurs, use our contact form at: http://www.cambridgesoft.com/ser-vices/mail and provide the details of the problem to Technical Support.

Chem & Bio Office 2010 User Guide 269ChemScript
ChemScript

270

Chem & Bio Office 2010 User Guide 271ChemScript
ChemScriptChemScript is the cheminformatics Software Development Kit (SDK), a library of the “chemical intelligence” programming algo-rithms that are prevalent throughout CambridgeSoft products. As a software devel-oper, you can create your own scripts for your particular business needs.All example script files in the ChemScript library are available in Python and .NET. If you are familiar with either of these languages, you will find these scripts easy to understand. However, if you are new to either Python or .NET, we suggest that you look at some of the Web sites and books listed at the end of this chapter.
Why use ChemScript?ChemScript adds considerable versatility to how you manage your chemical data. Using ChemScript, you can modify, view, and trans-fer your data from one place to another using your own custom rules.1
For example, you can:• Process chemical data in novel ways.• Integrate cheminformatics applications.
• Develop new cheminformatics applications or Web services.
Here are just a few common uses for Chem-Script:Salt splitting and stripping. You can identify and remove salt fragments from a structure drawing and register the pure compound.Canonical codes. Generate canonical codes for a set of structures and use the codes to find duplicates in your data.File format conversion. Convert structure or reaction files from one format to another.Generate properties. Execute Struct=Name or generate physical property features found in Chem & Bio Draw.Common scaffold orientation. Enforce stan-dard orientations of structures based on the established orientation of a common substruc-ture.2D Structure Diagram Generation (SDG) and Cleanup. Generate new 2D structures from connection tables without coordinates and clean up existing 2D structure using the Chem & Bio Draw algorithms.
About PythonAlthough ChemScript is available in Python and .NET, we will use Python throughout this guide to explain ChemScript. Python is a non-proprietary and widely used programming lan-
14
1. ChemScript lets you convert up to 10,000 data records per day. For greater capacity, you will need ChemScript Ultra. For infor-mation, contact CambridgeSoft.
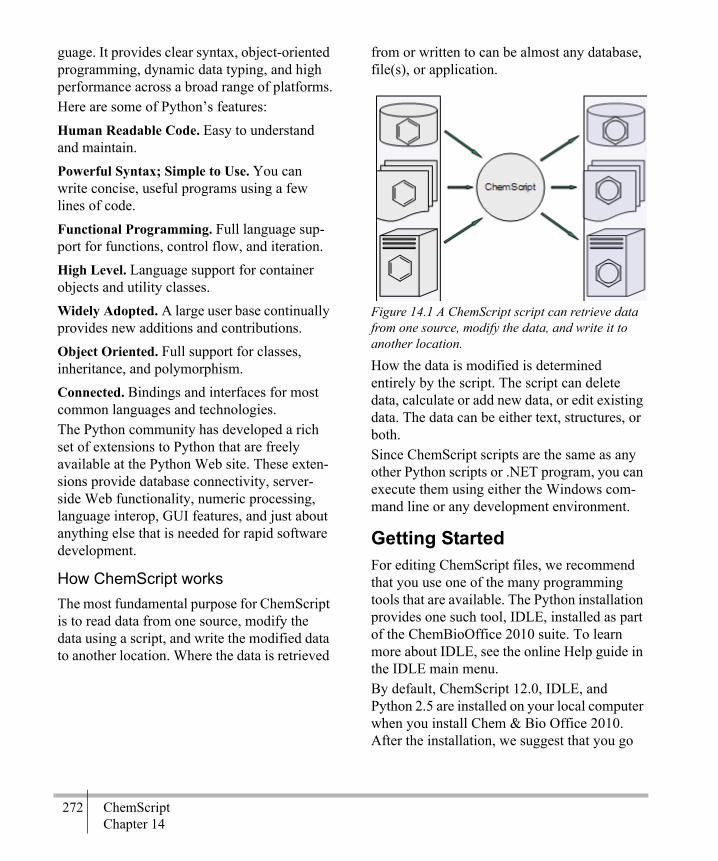
272 ChemScriptChapter 14
guage. It provides clear syntax, object-oriented programming, dynamic data typing, and high performance across a broad range of platforms.Here are some of Python’s features:Human Readable Code. Easy to understand and maintain.Powerful Syntax; Simple to Use. You can write concise, useful programs using a few lines of code.Functional Programming. Full language sup-port for functions, control flow, and iteration.High Level. Language support for container objects and utility classes.Widely Adopted. A large user base continually provides new additions and contributions.Object Oriented. Full support for classes, inheritance, and polymorphism.Connected. Bindings and interfaces for most common languages and technologies.The Python community has developed a rich set of extensions to Python that are freely available at the Python Web site. These exten-sions provide database connectivity, server-side Web functionality, numeric processing, language interop, GUI features, and just about anything else that is needed for rapid software development.
How ChemScript worksThe most fundamental purpose for ChemScript is to read data from one source, modify the data using a script, and write the modified data to another location. Where the data is retrieved
from or written to can be almost any database, file(s), or application.
Figure 14.1 A ChemScript script can retrieve data from one source, modify the data, and write it to another location.
How the data is modified is determined entirely by the script. The script can delete data, calculate or add new data, or edit existing data. The data can be either text, structures, or both.Since ChemScript scripts are the same as any other Python scripts or .NET program, you can execute them using either the Windows com-mand line or any development environment.
Getting StartedFor editing ChemScript files, we recommend that you use one of the many programming tools that are available. The Python installation provides one such tool, IDLE, installed as part of the ChemBioOffice 2010 suite. To learn more about IDLE, see the online Help guide in the IDLE main menu.By default, ChemScript 12.0, IDLE, and Python 2.5 are installed on your local computer when you install Chem & Bio Office 2010. After the installation, we suggest that you go
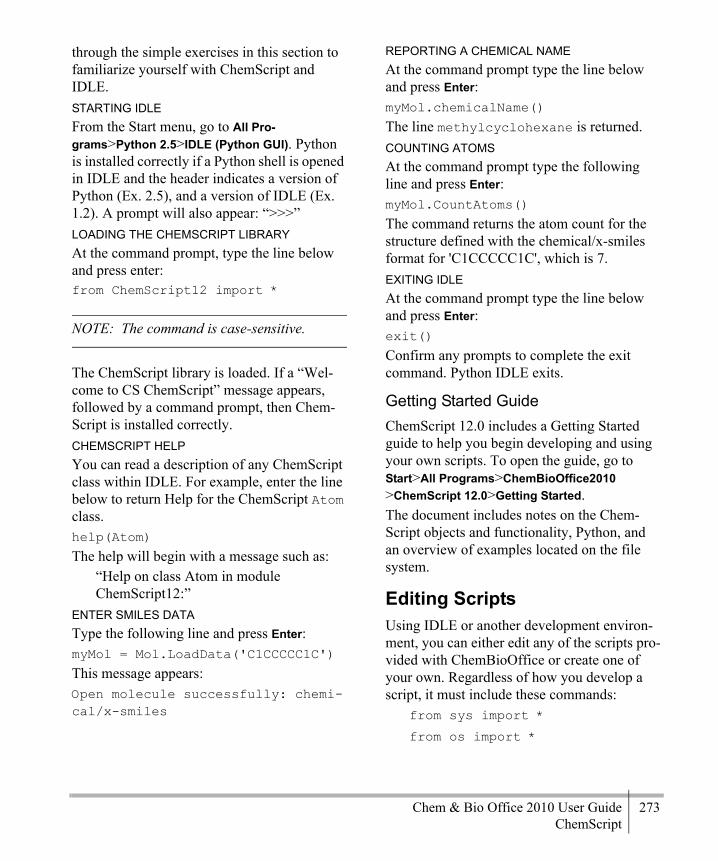
Chem & Bio Office 2010 User Guide 273ChemScript
through the simple exercises in this section to familiarize yourself with ChemScript and IDLE.STARTING IDLEFrom the Start menu, go to All Pro-grams>Python 2.5>IDLE (Python GUI). Python is installed correctly if a Python shell is opened in IDLE and the header indicates a version of Python (Ex. 2.5), and a version of IDLE (Ex. 1.2). A prompt will also appear: “>>>”LOADING THE CHEMSCRIPT LIBRARYAt the command prompt, type the line below and press enter:from ChemScript12 import *
NOTE: The command is case-sensitive.
The ChemScript library is loaded. If a “Wel-come to CS ChemScript” message appears, followed by a command prompt, then Chem-Script is installed correctly.CHEMSCRIPT HELPYou can read a description of any ChemScript class within IDLE. For example, enter the line below to return Help for the ChemScript Atom class. help(Atom)
The help will begin with a message such as:“Help on class Atom in module ChemScript12:”
ENTER SMILES DATAType the following line and press Enter:myMol = Mol.LoadData('C1CCCCC1C')
This message appears: Open molecule successfully: chemi-cal/x-smiles
REPORTING A CHEMICAL NAMEAt the command prompt type the line below and press Enter:myMol.chemicalName()
The line methylcyclohexane is returned.COUNTING ATOMSAt the command prompt type the following line and press Enter:myMol.CountAtoms()
The command returns the atom count for the structure defined with the chemical/x-smiles format for 'C1CCCCC1C', which is 7.EXITING IDLEAt the command prompt type the line below and press Enter:exit()
Confirm any prompts to complete the exit command. Python IDLE exits.
Getting Started GuideChemScript 12.0 includes a Getting Started guide to help you begin developing and using your own scripts. To open the guide, go to Start>All Programs>ChemBioOffice2010 >ChemScript 12.0>Getting Started.The document includes notes on the Chem-Script objects and functionality, Python, and an overview of examples located on the file system.
Editing ScriptsUsing IDLE or another development environ-ment, you can either edit any of the scripts pro-vided with ChemBioOffice or create one of your own. Regardless of how you develop a script, it must include these commands:
from sys import *
from os import *
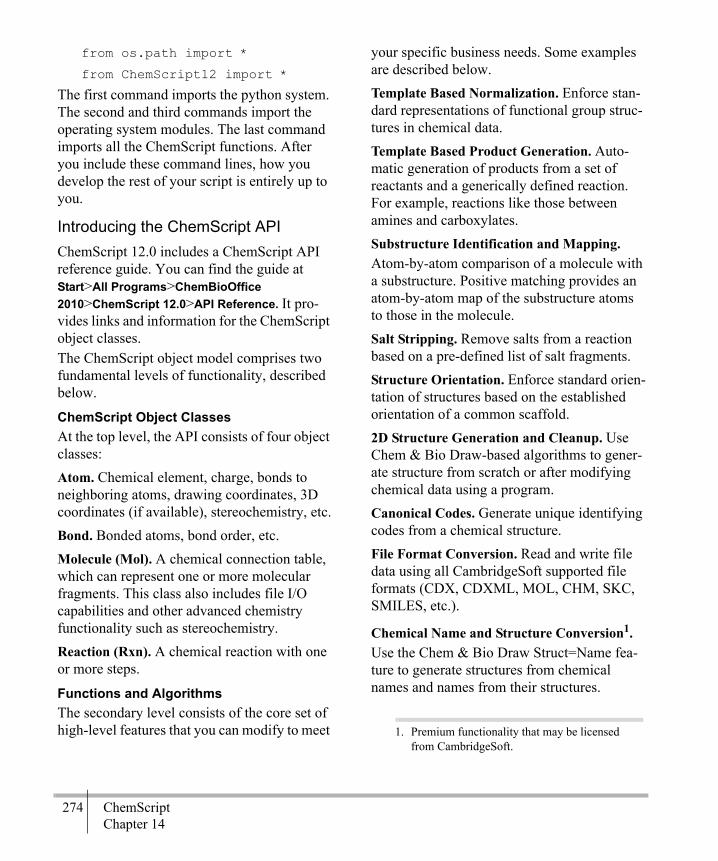
274 ChemScriptChapter 14
from os.path import *
from ChemScript12 import *
The first command imports the python system. The second and third commands import the operating system modules. The last command imports all the ChemScript functions. After you include these command lines, how you develop the rest of your script is entirely up to you.
Introducing the ChemScript APIChemScript 12.0 includes a ChemScript API reference guide. You can find the guide at Start>All Programs>ChemBioOffice 2010>ChemScript 12.0>API Reference. It pro-vides links and information for the ChemScript object classes.The ChemScript object model comprises two fundamental levels of functionality, described below.
ChemScript Object ClassesAt the top level, the API consists of four object classes:Atom. Chemical element, charge, bonds to neighboring atoms, drawing coordinates, 3D coordinates (if available), stereochemistry, etc.Bond. Bonded atoms, bond order, etc.Molecule (Mol). A chemical connection table, which can represent one or more molecular fragments. This class also includes file I/O capabilities and other advanced chemistry functionality such as stereochemistry.Reaction (Rxn). A chemical reaction with one or more steps.
Functions and AlgorithmsThe secondary level consists of the core set of high-level features that you can modify to meet
your specific business needs. Some examples are described below.Template Based Normalization. Enforce stan-dard representations of functional group struc-tures in chemical data. Template Based Product Generation. Auto-matic generation of products from a set of reactants and a generically defined reaction. For example, reactions like those between amines and carboxylates. Substructure Identification and Mapping. Atom-by-atom comparison of a molecule with a substructure. Positive matching provides an atom-by-atom map of the substructure atoms to those in the molecule. Salt Stripping. Remove salts from a reaction based on a pre-defined list of salt fragments.Structure Orientation. Enforce standard orien-tation of structures based on the established orientation of a common scaffold. 2D Structure Generation and Cleanup. Use Chem & Bio Draw-based algorithms to gener-ate structure from scratch or after modifying chemical data using a program.Canonical Codes. Generate unique identifying codes from a chemical structure. File Format Conversion. Read and write file data using all CambridgeSoft supported file formats (CDX, CDXML, MOL, CHM, SKC, SMILES, etc.).
Chemical Name and Structure Conversion1. Use the Chem & Bio Draw Struct=Name fea-ture to generate structures from chemical names and names from their structures.
1. Premium functionality that may be licensed from CambridgeSoft.

Chem & Bio Office 2010 User Guide 275ChemScript
Molecular Mechanics. Optimize molecular structures using the MM2 force-field.
The ChemScript API onlineCambridgeSoft provides the API online. You can find the API at sdk.cambridgesoft.com.
TutorialsWe provide several sample scripts to illustrate how you can develop your own custom code to meet your business needs. Many of the scripts we use are in the ChemScript samples direc-tory. By default, this directory is where Chem & Bio Office 2010 is installed:C:\Program Files\CambridgeSoft\ChemOffice2010\ChemScript 12\Samples
For the sake of brevity, we won’t repeat the scripts in this manual or try to teach the Python language. However, we briefly describe what you can do with the code examples so that you can modify and expand upon them for your own use. As you read the tutorials, you are encouraged to view the code in IDLE and edit it as desired to see how each example works. For more on IDLE, see “Using ChemScript” on page 5.
Example 1: Automated Structure Clean upThis sample script cleans up the structures in multiple Chem & Bio Draw files all at the same time. It uses the same cleanup function used in Chem & Bio Draw. You can find the script at Example.001/script.py. The script reads the CDX structure files from a source directory, applies the cleanup feature to each structure, and write the modified files to
an output directory. The original files remain unchanged.
Figure 14.2 The structure cleanup script reads a structure file (left) and creates a new, cleaned up structure file (right).
Although this example uses the CDXML for-mat, other formats such as MDL MOL may also be applied. You can also force Chem-Script to use specific file formats for reading and writing data.
Example 2: Create an SD fileThe ChemScript examples include a script that illustrates how you can create an SD file from existing CDXML files. You can find the script at Example.002/script.py. We begin with a list of CDXML files that each contain a chemical structure. The list of files is hard-coded into the ChemScript script. When exe-cuted, the script uses the SDFileWriter method to create an SD file that includes all the structures.
Example 3: Create a list of CDXML filesThis example illustrates how to read an SD file and write a list of CDXML files. The source files is at Example.003/script.py.
Example 4: Filter an SD fileThis example uses the atomByAtomSearch method to demonstrate a simple application of the "atom-by-atom" substructure search in ChemScript. The program reads an SD file and filters structures into one of two output SD files, structures that contain a phenyl group and

276 ChemScriptChapter 14
structures that don’t. It also illustrates how you can read chemical data formatted as a SMILES string. See Example.004/script.py.
Example 5: Computing Canonical CodesThis example script checks whether any struc-tures appear in both of two SD files based on the structures’ canonical codes. The output is a new SD file with the duplicate structures excluded. See Example.005/script.py.This example first computes the canonical code for each structure. Since the canonical code does not vary with different representa-tions of the same chemical structure, it can be used to determine whether two structures are chemically equivalent.This example also introduces the Python Dic-tionary, which is an associative array. The dic-tionary maps a key to a value. The dictionary is used to determine whether a canonical code has been previously encountered.This example uses an alternate looping con-struct to read an SD file.
CAUTION
Canonical codes should never be permanently stored because their representation can change among different versions of ChemScript.
Example 6: Simple salt strippingThe program reads an SD File, identifies and removes salt components (if any are present), and outputs two SD files. The output structure file contains the original structures without the salt component, and the output salt file con-
tains the salt components that were stripped, along with a reference to the original structure.
NOTE: This example uses a default set of salts that CambridgeSoft provides. However, you can also define a customized salt table that enables you to designate which chemicals are considered salts.
Example 7: Structure OverlayThis script introduces the ChemScript structure overlay feature. It uses a scaffold structure file to superimpose two chemically similar struc-tures. The script first examines the structures in an SD file that contain a common scaffold sub-structure. It then aligns these structures so that they have the same orientation with respect to the scaffold. See Example.006/script.py.
NOTE: The overlay functionality can also be used to align three dimensional structures.
Example 8: Reaction TransformationThis example demonstrates reaction transfor-mation. This means that you can draw a reac-tion that defines a transformation of a molecule and then apply that transformation to a set of structure files.All the files necessary for this tutorial are in the Example.007 directory. The transform1.cdxml file provides the reac-tion that defines the transformationFigure 14.3.

Chem & Bio Office 2010 User Guide 277ChemScript
The files in the Input directory contain all the structures that will be transformed.
Figure 14.3 The transform file defines how the transformation is applied to the source files.
The script searches the input files for structures that contain a nitro group, shown as a reactant in the transformation file. If a structure is found, the script transforms the nitro group to the form shown in the product and copies the entire structure to a new file. One example is shown in the figure below.
Figure 14.4 A) before the transformation is applied; B) after transformation.
Files that don’t meet the search criteria are ignored.
Useful ReferencesThere are numerous resources available for learning Python and .NET. Just a few of the many books and Web sites are listed below.
Books
PythonIn addition, there are many books about the Python language that are available.
• Beginning Python: From Novice to Profes-sional by Magnus Lie Hetland.
• Dive into Python by Mark Pilgrim.• Learning Python by Mark Lutz & David
Ascher. This is a beginner/intermediate learning manual and reference.
• Python in a Nutshell by Alex Martelli. This book is a brief introduction and good refer-ence to Python.
.NETWe recommend these books to learn more about .NET:
• C# in a Nutshell by Peter Drayton, Ben Albahari, and Ted Neward.
• Pro C# with .NET 3.0 by Andrew Troelsen.
• C# Essentials by Ben Albahari, Peter Dray-ton, and Brad Merrill.
• C# 3.0 Cookbook by Jay Hilyard and Stephen Teilhet.
Web Sites
PythonYou can find more information on Python at: http://www.python.org. This is the official python programming language site.
.NETFor information on .NET, see http://msdn.microsoft.com

278 ChemScriptChapter 14

Chem & Bio Office 2010 User Guide 279ChemBioFinder
ChemBioFinder

280
Chem & Bio Office 2010 User Guide 281ChemBioFinder
What’s NewChemBioFinder has long been the preferred tool for storing chemical structures, physical properties, notes, tables of data, and charts based on that data. ChemBioFinder introduces a variety of improvements and new features not found in earlier versions.
New Features
ClassesThis is new menu item within the Find Struc-ture submenu under the Search menu. The Classes menu provides a submenu with various items for performing searches. For more infor-
mation, see “Special structure searches” on page 376.
By date modifiedThis is a new menu item that appears within the Find Structure submenu under the Search menu. For more information, see “Special structure searches” on page 376.
ClusteringThis is a new tool for ChemBioFinder bio-visual chemist. See “Clustering in BioViz” on page 135 for more information.

282 What’s New

ChemBioFinder & BioViz 283User Guide
ChemBioFinder & BioVizAbout ChemBioFinder 12.0®
ChemBioFinder 12.0 is a database manage-ment system for anyone who works with chemical information. It provides a place to store chemical structures, physical properties, notes, tables of data, and charts. With Chem-BioFinder 12.0, you can quickly find and orga-nize your data.
About BioVizBioViz is a visualization add-in for Chem-BioFinder 12.0 that allows you to plot numeric data in ChemBioFinder 12.0 databases. You can identify trends and correlations in your data, and within subsets of your data, without exporting to another application. You can have as many plot windows as you like, each show-ing a different visualization of data from the current form.ChemBioFinder 12.0 & BioViz collaborates with the following CambridgeSoft products to help you perform specific tasks:
Chem & Bio Draw®. Lets you draw two-dimensional structures and reactions.
Chem & Bio 3D®. Lets you draw three-dimen-sional structures.
Chem & Bio Draw/Excel®. Allows you to export data to Excel.
About this guideThis guide contains information for the Chem-BioFinder & BioViz. It assumes that you are familiar with the basics of your Windows oper-ating system. If you are not refer to your sys-tem manual. Some of the material describes tasks that must be performed in conjunction with other integrated CambridgeSoft products. The material on the addins describes tasks that must be performed in conjunction with Microsoft Excel or Word. If you are not famil-iar with these products, please consult the rele-vant user’s manual.The chapters in this guide are organized by task. They are intended to help you familiarize yourself with the ChemOffice applications and start using them as quickly and efficiently as possible. New users should read the Chem-BioFinder & BioViz chapter to get an overview of the product and how it works. The Tutorials chapter demonstrates most of the features of the application. Perform the tutorials in the order they are presented. Experienced users can skip to subsequent chapters, which provide more detailed information.
ConventionsThe following notations are used throughout this guide:
15

284 ChemBioFinder & BioVizChapter 15
• The following symbol indicates that a fea-ture is available in the Ultra version only:
• The following symbol indicates that a fea-ture is available in both Pro and Ultra ver-sions, but not in Standard version:
Special formats
CAUTION
Cautions are used to warn you of situations that might cause a possible loss of data.
NOTE: Notes are used to highlight important information.
TIP: Tips are used to present information sup-plemental to the main text.
Shortcut key sequences are indicated with a + sign, for example: “Use the command: Ctrl+H to toggle hidden Hydrogens and lone pairs.”
A bold font is used to refer to the User Inter-face, for example “Click File>Save”.
Additional informationAdditional sources of ChemOffice information are:
• The Quick Reference Cards• The Help system• CambridgeSoft Web Pages• http://CambridgeSoft.com/services
Quick reference cardThe ChemOffice Quick Reference Cards are located in the back of the printed manual. The cards summarize ChemOffice Desktop appli-cation commands and features.
Help systemChemOffice applications provide some or all of the following types of Help:
• Help—An HTML reference guide.• ToolTips—Short descriptions of user inter-
face objects displayed by pointing.• Status Bar—The lower left corner of the
screen displays useful information as you work.

ChemBioFinder & BioViz 285User Guide
The User InterfaceChemBioFinder 12.0 is a database manage-ment system that allows storage, retrieval, and searching of molecular structures, text, and numerical data. You can create structures in either Chem & Bio Draw or with the built-in Chem & Bio Draw ActiveX control to store data in your Chem-BioFinder 12.0 database, and add related numerical or textual data and comments. You can use the Chem & Bio 3D ActiveX control to view the structures.The general steps for using ChemBioFinder 12.0 are as follows:
• Create a form• Create or open a database and link it to the
form.• Add or manipulate data• Perform a search.
These steps are described in the Chem-BioFinder 12.0 Tutorials, and in the detailed reference material in the manual.
The ChemBioFinder User InterfaceThe ChemBioFinder 12.0 User Interface (UI) consists of menus, toolbars and the form win-dow. The central part of the form window con-tains the work space where you create and
view structures and data. The toolbars contain icons that change the way the pointer behaves or that perform actions corresponding to menu commands.The components of the ChemBioFinder 12.0 UI are described below
16
Screen Ele-ment
Description
BioViz window Displays plotted data from ChemBioFinder 12.0 data-bases.
Current list size Displays the number of records through which you are browsing. Might be less than the total database size if you have recently performed a search.
Current record Displays the position within the current hit list of the record you are viewing.
Control box A data box containing an ActiveX control.
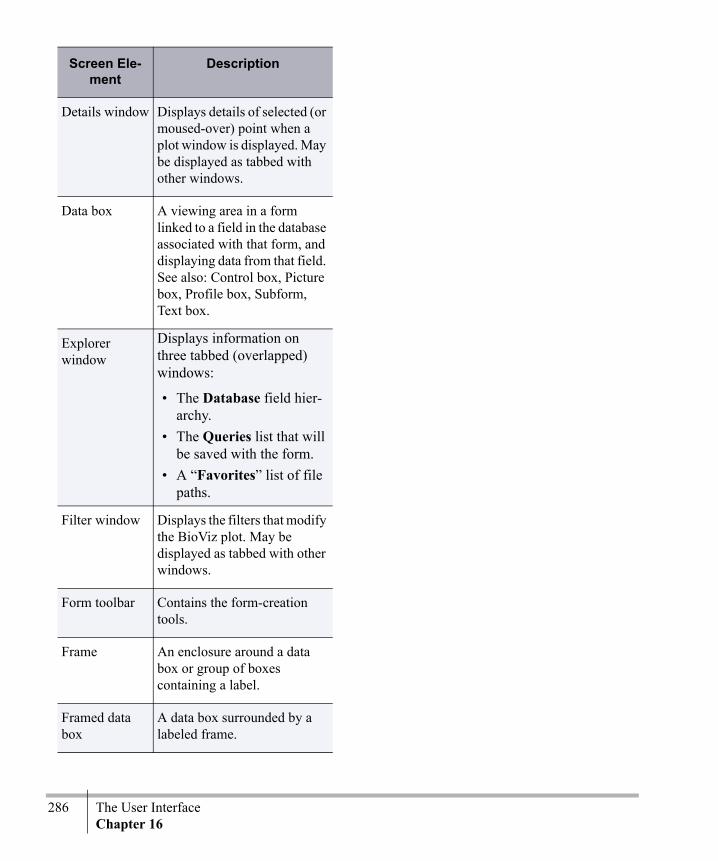
286 The User InterfaceChapter 16
Details window Displays details of selected (or moused-over) point when a plot window is displayed. May be displayed as tabbed with other windows.
Data box A viewing area in a form linked to a field in the database associated with that form, and displaying data from that field. See also: Control box, Picture box, Profile box, Subform, Text box.
Explorer window
Displays information on three tabbed (overlapped) windows:
• The Database field hier-archy.
• The Queries list that will be saved with the form.
• A “Favorites” list of file paths.
Filter window Displays the filters that modify the BioViz plot. May be displayed as tabbed with other windows.
Form toolbar Contains the form-creation tools.
Frame An enclosure around a data box or group of boxes containing a label.
Framed data box
A data box surrounded by a labeled frame.
Screen Ele-ment
Description

ChemBioFinder & BioViz 287User Guide
Main form Displays data contained in one record of the database. To keep the display from getting clut-tered, tabbed pages may be added for less important data.
Main toolbar Contains icons representing general-purpose menu commands such as copying, saving, and printing.
Menu bar Contains all the commands specific to the application for managing forms, tables, databases, and their contents.
New Record indicator
Displays ADD when you adding a new record that had not been committed to the database.
Output window Displays Python output. May be displayed as tabbed with other windows.
Picture box Displays a graphic. Picture boxes may be either Fixed, that is, they remain the same for all records in the database, and are linked to a particular graphic file, or associated with a picture Field, in which case there could be a different graphic in each record.
Profile box Displays Compound Profiles.
Query indicator Displays QRY when you enter a search query.
Screen Ele-ment
Description
Read-only indi-cator
Displays READ if the database is read-only.
Record toolbar Contains icons for commands in the Record menu. Click an icon to perform the command.
Search toolbar Contains commands in the Search menu.
Status bar Displays information about the item opened in the Chem-BioFinder window.
Structure box Displays the chemical struc-ture of the current record.
Structure window
Displays the chemical struc-ture of the selected (or moused-over) point when a plot window is displayed. May be displayed as tabbed with other windows.
Subform Displays relational informa-tion from a different database, or a different data table within the same database.
Text box Displays text. Text boxes are Fixed (text fields are displayed in text data boxes) and may be formatted in the Box Proper-ties dialog box.
Text Format toolbar
Used to format text in Text and Memo fields.
Screen Ele-ment
Description
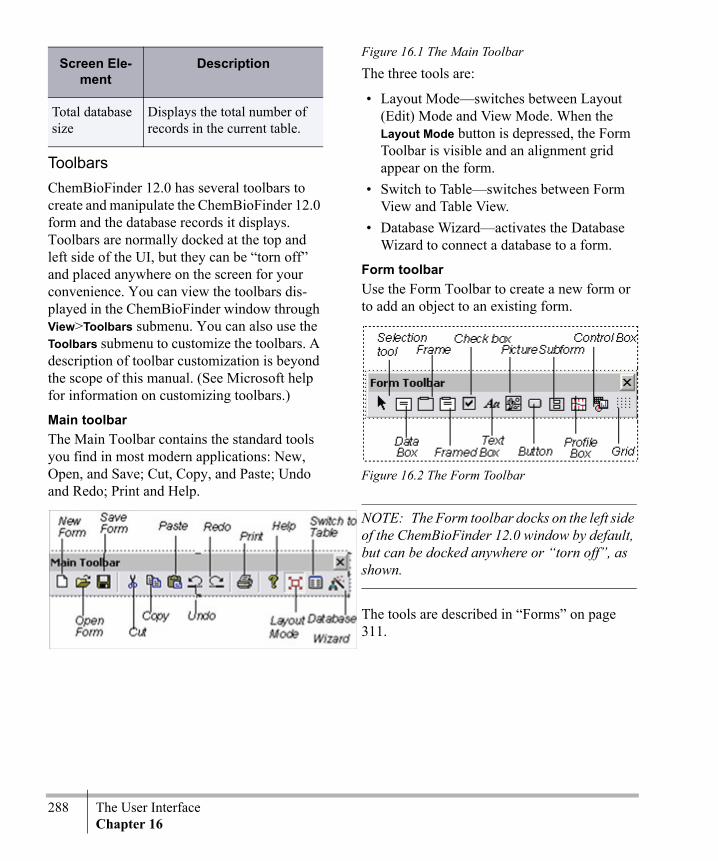
288 The User InterfaceChapter 16
ToolbarsChemBioFinder 12.0 has several toolbars to create and manipulate the ChemBioFinder 12.0 form and the database records it displays. Toolbars are normally docked at the top and left side of the UI, but they can be “torn off” and placed anywhere on the screen for your convenience. You can view the toolbars dis-played in the ChemBioFinder window through View>Toolbars submenu. You can also use the Toolbars submenu to customize the toolbars. A description of toolbar customization is beyond the scope of this manual. (See Microsoft help for information on customizing toolbars.)
Main toolbarThe Main Toolbar contains the standard tools you find in most modern applications: New, Open, and Save; Cut, Copy, and Paste; Undo and Redo; Print and Help.
Figure 16.1 The Main Toolbar
The three tools are:
• Layout Mode—switches between Layout (Edit) Mode and View Mode. When the Layout Mode button is depressed, the Form Toolbar is visible and an alignment grid appear on the form.
• Switch to Table—switches between Form View and Table View.
• Database Wizard—activates the Database Wizard to connect a database to a form.
Form toolbarUse the Form Toolbar to create a new form or to add an object to an existing form.
Figure 16.2 The Form Toolbar
NOTE: The Form toolbar docks on the left side of the ChemBioFinder 12.0 window by default, but can be docked anywhere or “torn off”, as shown.
The tools are described in “Forms” on page 311.
Total database size
Displays the total number of records in the current table.
Screen Ele-ment
Description

ChemBioFinder & BioViz 289User Guide
Search toolbarThe Search Toolbar contains the tools you need to query the database and work with the hitlists that the query produces.
Figure 16.3 The Search Toolbar
Record toolbarThe Record Toolbar contains the tools you need to browse a database or hitlist. It also has tools for adding, deleting, and changing records.
Figure 16.4 The Record Toolbar
Text format toolbarThe Text Format Toolbar contains standard text formatting tools that you can use when
entering or editing information in data and text fields.
Figure 16.5 The Text Toolbar
1- Font2- Point size3- Bold4- Italics5- Underline6- Subscript7- Superscript8- Color9- Left alignment10- Center alignment11- Rigt alignment12- Bullets
The status barWhile you move among records, counters in the lower right corner of the window change to indicate the current record, the current list size, and the total size of the database. The lower left corner of the window displays help for menu items and other information.When you first open a form, the current list size equals the total database size. The total database size changes only when you add or delete records. If you search to find a subset of the entries in the database, then the current list size changes to indicate the number of hits in the search.To the left of these counters are three other indicators that show the general status of the database. The first displays the word READ

290 The User InterfaceChapter 16
when you are using a read-only database, such as one that is on a CD-ROM, a read only form file, or if you have selected Open as read-only on the open file dialog box.The second indicator displays the word ADD when you are entering a new record.The third displays QRY when you are entering a query. To hide or show the Status Bar:
Select or deselect View>Status Bar.
More UI features
Style button for text and frame boxesThe Box Properties dialog makes the Style but-ton available for frames and plain text labels. This button opens the Box Style dialog box, where you can set frame type, printability, and other display characteristics.
Read-only structure box optionThe Box Style dialog has a check box Box is read-only. This applied to text, numeric data boxes and structure boxes. If you mark a struc-ture box read-only, the structure cannot be edited except in query mode.
Automatic frame label updatesThe label of a framed box is updated if you change the field it displays.
ThemesThemes let you customize the UI style to your preference. Options include WinXP, Office 2003, Office 2007, and Whidbey. See “Chem-BioFinder 12.0 opening options” on page 447 for more information.
Resizable dialog boxesThe Box Properties, Plot Properties, Data Import and Data Export dialog boxes, and the script editor, can be resized, allowing you to see more in text windows, tree controls, and so forth. The position and size is remembered during the current ChemBioFinder 12.0 ses-sion.
Opening ChemBioFinder 12.0In default mode, ChemBioFinder 12.0 opens with the ChemBioFinder startup dialog. This dialog lets you:From the New tab
• Blank Form—Open a blank form to create your own.
• Database Connection—Open a blank form and connect it to a database. You can create the form manually or automatically. For more information, see “Connecting a data-base to a form” on page 295.
• Database Wizard—Helps you set up a data-base connection.
From the Existing tab
• Browse to an existing form in your file sys-tem.
From the Recent tab
• Open a form on the recently used file list.You can choose whether the ChemBioFinder 12.0 startup dialog is displayed when Chem-BioFinder 12.0 opens by doing the following:
1. Go to File>Preferences.2. In the Preferences dialog box, click the
General tab.

ChemBioFinder & BioViz 291User Guide
3. Select or deselect Show startup dialog.If you choose to hide the ChemBioFinder 12.0 dialog box, ChemBioFinder 12.0 will open a new blank form by default when you open the application.
To open the ChemBioFinder 12.0 dialog box when the preference is set to hide, go to File>New.
Using ChemBioFinder 12.0 with databases ChemBioFinder 12.0 comes with the Microsoft Jet database engine. ChemBioFinder 12.0 maintains its own table of chemical informa-tion—structure, formula, and molecular weight—and relies on Jet to create a database system for managing the rest of the data. The data created by Jet is stored in an MS Access database file (MDB file). If you have MS Access installed you can use it with the rela-tional part of the database.You can use ChemBioFinder 12.0 to add chemical structures to a database you have developed. If your database was developed in Microsoft Access, you can open it in Chem-BioFinder 12.0.
The database modelA database is a collection of information. In ChemBioFinder 12.0 the information is orga-nized into increasing levels of complexity. At
the simplest level is the data item itself, for example a molecular weight value.
Figure 16.6 A data item in the database
At the next level is a field, a group of data items defining one type of data. Fields are gen-erally set up once and rarely modified.
Figure 16.7 A data field in a database

292 The User InterfaceChapter 16
At the next level is the record, a set of data items (one for each field) defining a single entry.
Figure 16.8 A record in a database
A collection of records is a table. A table is defined by a set of fields, and a set of records which grows as entries are added.In spreadsheet terminology:
• A data item is found in a cell.• A field corresponds to a column.• A record corresponds to a row. • A table corresponds to a worksheet.
A database is a storehouse for tables–possibly one, possibly more than one. A database con-taining only one table is known as a simple (or flat or flat-file) database.
Databases containing multiple tables are called relational. For more on relational databases see “Relational Data and Subforms” on page 399A form displays data from a single table, but may contain subforms that display data from other tables. If the tables have a field in com-mon, then any record retrieved in the form calls up the related records in the subform.
Understanding forms and databasesDatabases are where data is stored. A form dis-plays the information stored in the database. No data is stored in a form. The form acts like a window, letting you select which fields and tables you want to view.While no data is stored in forms, some things are saved with a ChemBioFinder 12.0 form. BioViz plots, database queries (depending on a preference setting), file paths of linked graph-ics, and certain settings are saved with each form.You can create more than one form to access the same database. For example, you may want to create one sample form for working with structural data and a more complicated one to include literature or lab data. By switching between forms, you can look at just those fields you want to see.

ChemBioFinder & BioViz 293User Guide
TutorialsThe general steps for using ChemBioFinder 12.0 are:
1. Create a form.2. Create or open a database and link it to the
form.3. Add or manage data.4. Perform a search.
The tutorials introduce you to ChemBioFinder 12.0 basic functions. You may want to use the Quick Reference card while you perform the tutorials.We recommend performing the tutorials in the sequence they are presented because each tuto-rial develops on and refers to the previous ones.
Sample databasesThe Samples directory located in the \ChemOffice 2010\samples folder contains several small databases, forms, and sample scripts. The Cs_Demo database contains about 300 structure covering a range of structural types. The database contains two tables, that are visi-ble using the form Cs_Demo.cfx. This is the form used in the following tutorials. Demo.cfx is a simpler form which displays only the main table of the same database.
CAUTION
We recommend you make a working copy of the database before experimenting with it. If you make changes to the data or structures in the database, the examples in the tutorials may no longer give the documented results.
To copy the Cs_Demo.cfx database:
1. Open Windows Explorer. 2. Create a folder for the database copies. 3. Select all Cs_Demo.* files. 4. Right-click, then click Copy. 5. Select the folder you created for the data-
base copies. 6. Right-click then click Paste.
You can now experiment with adding, modify-ing, and deleting data in the copies with no effect on the Cs_Demo database.
Tutorial 1: Creating formsForms let you to display your data in a custom-ized format, to browse and search through your database, and to interact with other applica-tions, such as Chem & Bio Draw and Chem & Bio 3D.You create forms using the Form toolbar.The Form toolbar only appears when you select
17
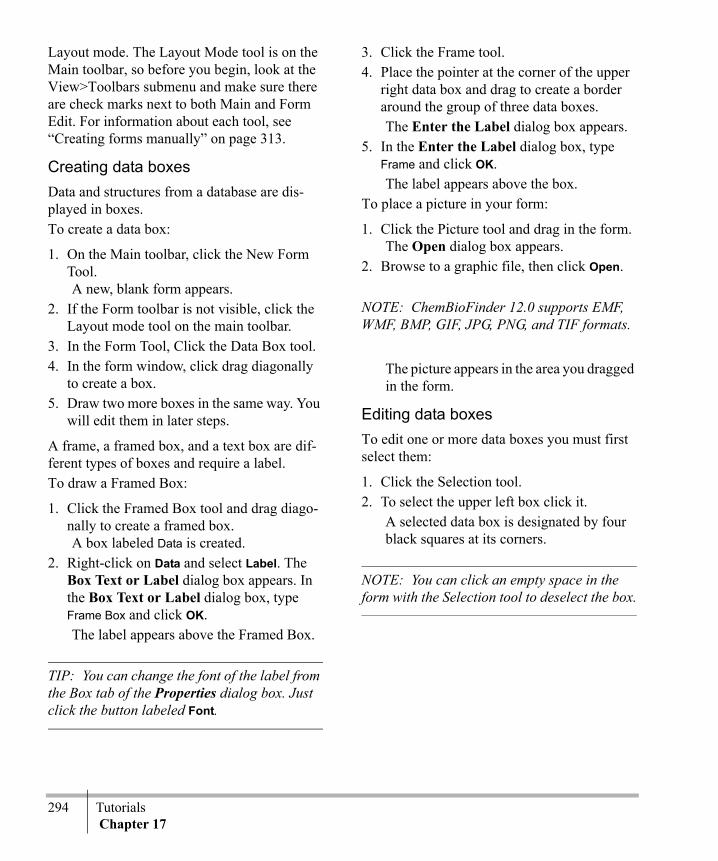
294 Tutorials Chapter 17
Layout mode. The Layout Mode tool is on the Main toolbar, so before you begin, look at the View>Toolbars submenu and make sure there are check marks next to both Main and Form Edit. For information about each tool, see “Creating forms manually” on page 313.
Creating data boxesData and structures from a database are dis-played in boxes. To create a data box:
1. On the Main toolbar, click the New Form Tool.A new, blank form appears.
2. If the Form toolbar is not visible, click the Layout mode tool on the main toolbar.
3. In the Form Tool, Click the Data Box tool.4. In the form window, click drag diagonally
to create a box. 5. Draw two more boxes in the same way. You
will edit them in later steps.
A frame, a framed box, and a text box are dif-ferent types of boxes and require a label.To draw a Framed Box:
1. Click the Framed Box tool and drag diago-nally to create a framed box.A box labeled Data is created.
2. Right-click on Data and select Label. The Box Text or Label dialog box appears. In the Box Text or Label dialog box, type Frame Box and click OK.The label appears above the Framed Box.
TIP: You can change the font of the label from the Box tab of the Properties dialog box. Just click the button labeled Font.
3. Click the Frame tool.4. Place the pointer at the corner of the upper
right data box and drag to create a border around the group of three data boxes.The Enter the Label dialog box appears.
5. In the Enter the Label dialog box, type Frame and click OK.The label appears above the box.
To place a picture in your form:
1. Click the Picture tool and drag in the form.The Open dialog box appears.
2. Browse to a graphic file, then click Open.
NOTE: ChemBioFinder 12.0 supports EMF, WMF, BMP, GIF, JPG, PNG, and TIF formats.
The picture appears in the area you dragged in the form.
Editing data boxesTo edit one or more data boxes you must first select them:
1. Click the Selection tool.2. To select the upper left box click it.
A selected data box is designated by four black squares at its corners.
NOTE: You can click an empty space in the form with the Selection tool to deselect the box.
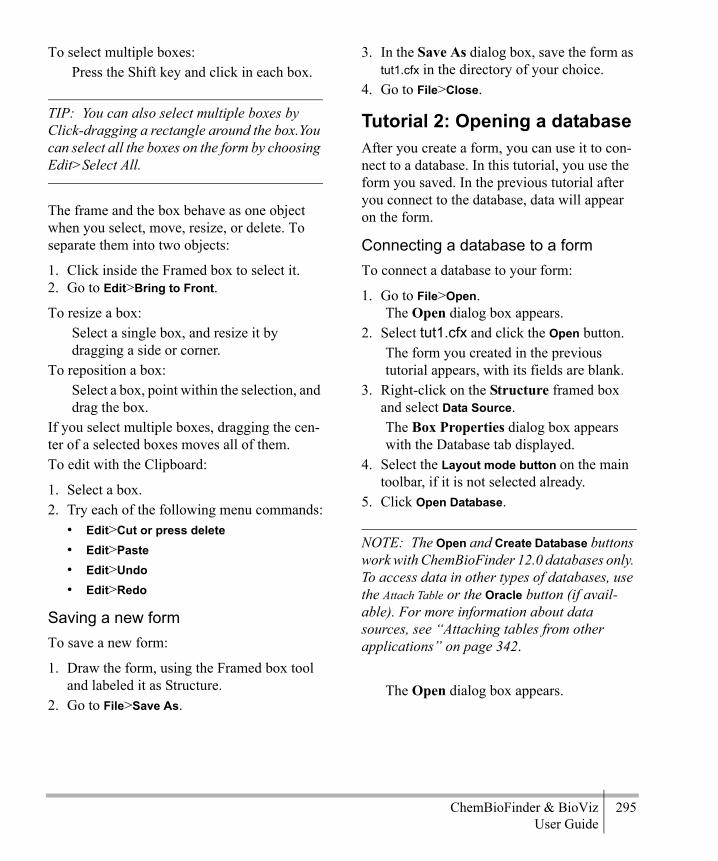
ChemBioFinder & BioViz 295User Guide
To select multiple boxes:Press the Shift key and click in each box.
TIP: You can also select multiple boxes by Click-dragging a rectangle around the box.You can select all the boxes on the form by choosing Edit>Select All.
The frame and the box behave as one object when you select, move, resize, or delete. To separate them into two objects:
1. Click inside the Framed box to select it.2. Go to Edit>Bring to Front.
To resize a box:Select a single box, and resize it by dragging a side or corner.
To reposition a box:Select a box, point within the selection, and drag the box.
If you select multiple boxes, dragging the cen-ter of a selected boxes moves all of them.To edit with the Clipboard:
1. Select a box.2. Try each of the following menu commands:
• Edit>Cut or press delete• Edit>Paste • Edit>Undo • Edit>Redo
Saving a new formTo save a new form:
1. Draw the form, using the Framed box tool and labeled it as Structure.
2. Go to File>Save As.
3. In the Save As dialog box, save the form as tut1.cfx in the directory of your choice.
4. Go to File>Close.
Tutorial 2: Opening a databaseAfter you create a form, you can use it to con-nect to a database. In this tutorial, you use the form you saved. In the previous tutorial after you connect to the database, data will appear on the form.
Connecting a database to a formTo connect a database to your form:
1. Go to File>Open.The Open dialog box appears.
2. Select tut1.cfx and click the Open button.The form you created in the previous tutorial appears, with its fields are blank.
3. Right-click on the Structure framed box and select Data Source.The Box Properties dialog box appears with the Database tab displayed.
4. Select the Layout mode button on the main toolbar, if it is not selected already.
5. Click Open Database.
NOTE: The Open and Create Database buttons work with ChemBioFinder 12.0 databases only. To access data in other types of databases, use the Attach Table or the Oracle button (if avail-able). For more information about data sources, see “Attaching tables from other applications” on page 342.
The Open dialog box appears.
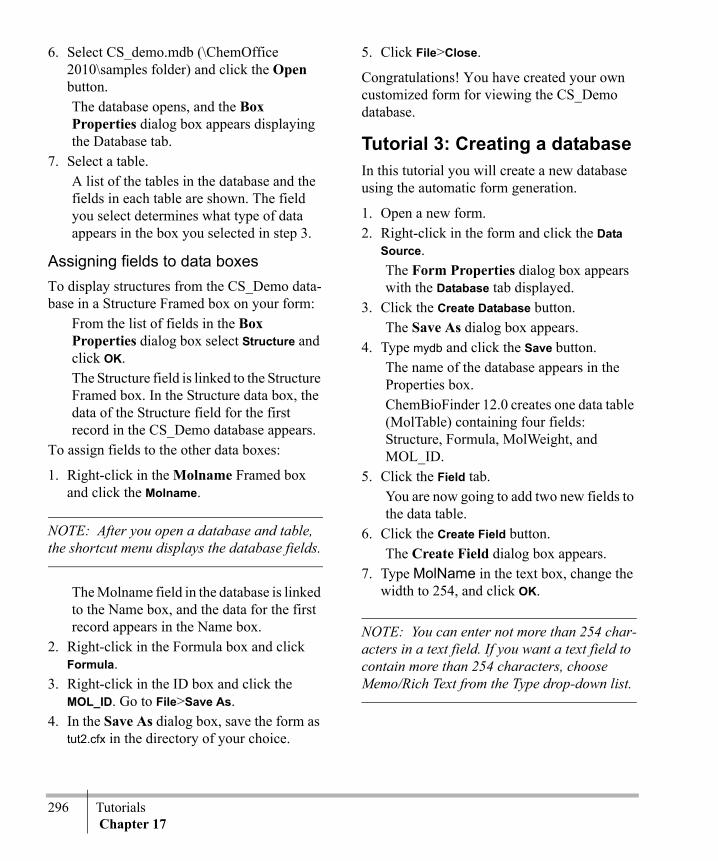
296 Tutorials Chapter 17
6. Select CS_demo.mdb (\ChemOffice 2010\samples folder) and click the Open button.The database opens, and the Box Properties dialog box appears displaying the Database tab.
7. Select a table.A list of the tables in the database and the fields in each table are shown. The field you select determines what type of data appears in the box you selected in step 3.
Assigning fields to data boxesTo display structures from the CS_Demo data-base in a Structure Framed box on your form:
From the list of fields in the Box Properties dialog box select Structure and click OK.The Structure field is linked to the Structure Framed box. In the Structure data box, the data of the Structure field for the first record in the CS_Demo database appears.
To assign fields to the other data boxes:
1. Right-click in the Molname Framed box and click the Molname.
NOTE: After you open a database and table, the shortcut menu displays the database fields.
The Molname field in the database is linked to the Name box, and the data for the first record appears in the Name box.
2. Right-click in the Formula box and click Formula.
3. Right-click in the ID box and click the MOL_ID. Go to File>Save As.
4. In the Save As dialog box, save the form as tut2.cfx in the directory of your choice.
5. Click File>Close.
Congratulations! You have created your own customized form for viewing the CS_Demo database.
Tutorial 3: Creating a databaseIn this tutorial you will create a new database using the automatic form generation.
1. Open a new form.2. Right-click in the form and click the Data
Source.The Form Properties dialog box appears with the Database tab displayed.
3. Click the Create Database button. The Save As dialog box appears.
4. Type mydb and click the Save button.The name of the database appears in the Properties box.ChemBioFinder 12.0 creates one data table (MolTable) containing four fields: Structure, Formula, MolWeight, and MOL_ID.
5. Click the Field tab.You are now going to add two new fields to the data table.
6. Click the Create Field button.The Create Field dialog box appears.
7. Type MolName in the text box, change the width to 254, and click OK.
NOTE: You can enter not more than 254 char-acters in a text field. If you want a text field to contain more than 254 characters, choose Memo/Rich Text from the Type drop-down list.
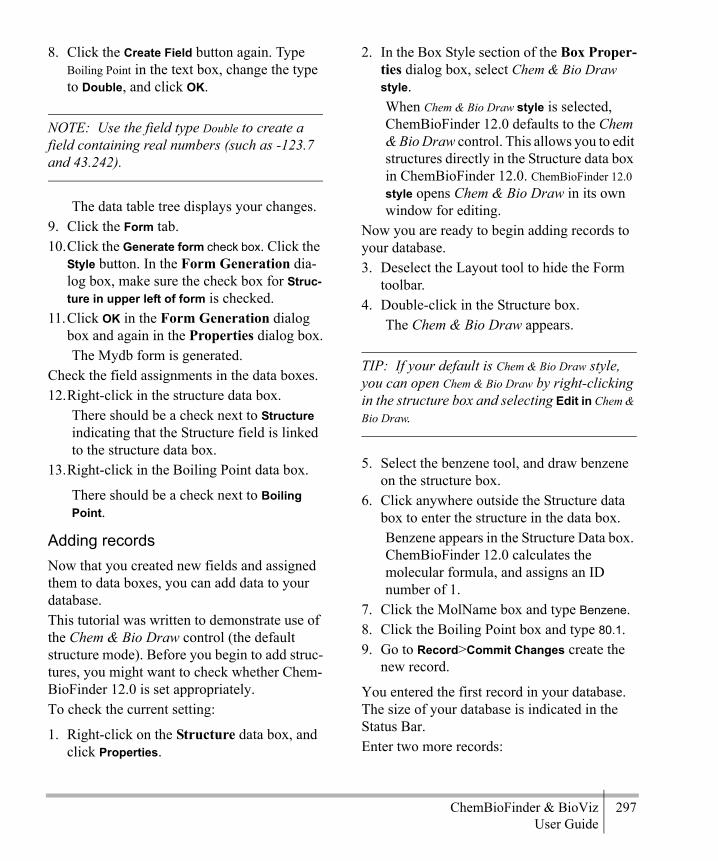
ChemBioFinder & BioViz 297User Guide
8. Click the Create Field button again. Type Boiling Point in the text box, change the type to Double, and click OK.
NOTE: Use the field type Double to create a field containing real numbers (such as -123.7 and 43.242).
The data table tree displays your changes.9. Click the Form tab.10.Click the Generate form check box. Click the
Style button. In the Form Generation dia-log box, make sure the check box for Struc-ture in upper left of form is checked.
11.Click OK in the Form Generation dialog box and again in the Properties dialog box.The Mydb form is generated.
Check the field assignments in the data boxes.12.Right-click in the structure data box.
There should be a check next to Structure indicating that the Structure field is linked to the structure data box.
13.Right-click in the Boiling Point data box.
There should be a check next to Boiling Point.
Adding recordsNow that you created new fields and assigned them to data boxes, you can add data to your database.This tutorial was written to demonstrate use of the Chem & Bio Draw control (the default structure mode). Before you begin to add struc-tures, you might want to check whether Chem-BioFinder 12.0 is set appropriately.To check the current setting:
1. Right-click on the Structure data box, and click Properties.
2. In the Box Style section of the Box Proper-ties dialog box, select Chem & Bio Draw style.When Chem & Bio Draw style is selected, ChemBioFinder 12.0 defaults to the Chem & Bio Draw control. This allows you to edit structures directly in the Structure data box in ChemBioFinder 12.0. ChemBioFinder 12.0 style opens Chem & Bio Draw in its own window for editing.
Now you are ready to begin adding records to your database.3. Deselect the Layout tool to hide the Form
toolbar.4. Double-click in the Structure box.
The Chem & Bio Draw appears.
TIP: If your default is Chem & Bio Draw style, you can open Chem & Bio Draw by right-clicking in the structure box and selecting Edit in Chem & Bio Draw.
5. Select the benzene tool, and draw benzene on the structure box.
6. Click anywhere outside the Structure data box to enter the structure in the data box.Benzene appears in the Structure Data box. ChemBioFinder 12.0 calculates the molecular formula, and assigns an ID number of 1.
7. Click the MolName box and type Benzene.8. Click the Boiling Point box and type 80.1.9. Go to Record>Commit Changes create the
new record.
You entered the first record in your database. The size of your database is indicated in the Status Bar.Enter two more records:

298 Tutorials Chapter 17
1. Go to Record>Add New Record.2. Add a record for n-Pentane, with bp = 36.1.3. Repeat step1 and then add a record for
Cyclohexane (shown below), with a bp = 80.7.
NOTE: After you have two or more records in your database, you can commit changes by moving to a different record using the Record tools.
4. Click File>Save.
NOTE: Choose Save to save the form. Choose Commit Changes to save the data in your database.
Tutorial 4: Searching a database
NOTE: Select the Over Current List command and add it to the instructions
ChemBioFinder 12.0 helps you organize and find information. One way to find information is to browse through the database one record at a time. This is a good way to see some of the information available. However, because data-bases can be very big, browsing is often ineffi-cient.Searching a database is like using the index of a book. With an index, you can quickly focus on the few pages you are interested in. When you search a database, you find only those few records that have the information you look for. After you have this smaller collection (a hit list), you can then browse it much more effi-ciently than you could the whole database.ChemBioFinder 12.0 performs the following types of searches:
• Text and structure searches, demonstrated in Tutorial 4.
• Reaction searches, demonstrated in Tutorial 5.
In this tutorial, you will learn how to search substructures and text in the CS_Demo Data-base. This database is included with Chem-BioFinder 12.0 as a sample database of approximately 300 organic and inorganic com-pounds.
Opening the demo databaseTo open the CS_Demo database:
1. Start ChemBioFinder 12.0 and click the Existing tab on the Open dialog box.If ChemBioFinder 12.0 is already running, click File>New to open the dialog box, or access CS_Demo directly from the Favorites tab of the Explorer Window.
2. Navigate to the...C:\Documents and Set-tings\All Users\Application Data\CambridgeSoft\ChemOffice2009\ChemBioFinder\Samples.
3. In the Samples directory, select CS_demo.cfx and click the Open button.The CS_Demo database opens in ChemBioFinder 12.0.
Before you begin searching, open the Explorer window, if it is not already open.4. Go to View>Explorer Window.5. Click the Queries tab.
TIP: The default, set in the Preferences dialog box, is to save all queries listed in the Queries tree. If you don’t want to save a particular query, delete it before closing the form.
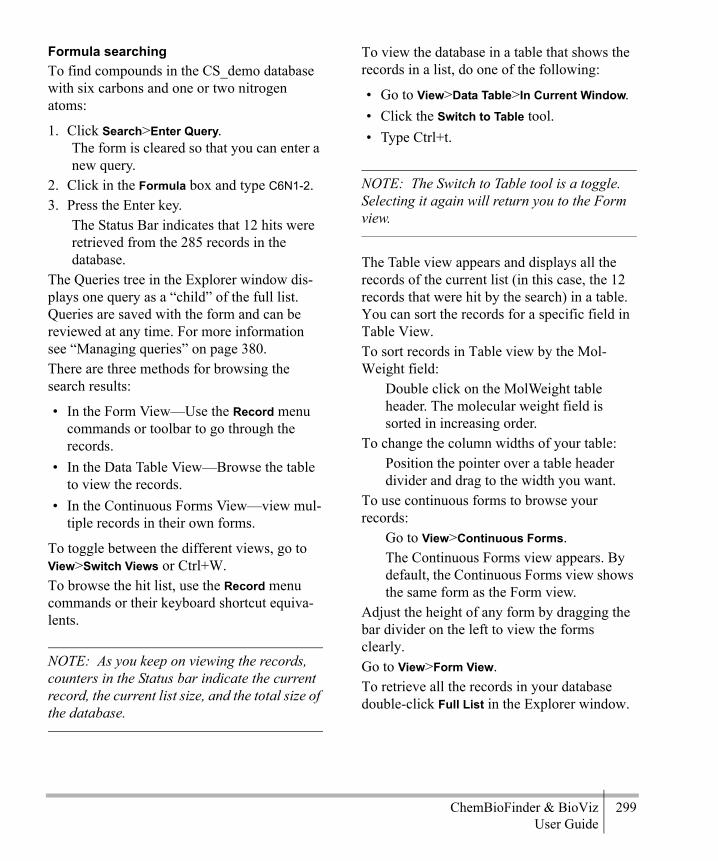
ChemBioFinder & BioViz 299User Guide
Formula searchingTo find compounds in the CS_demo database with six carbons and one or two nitrogen atoms:
1. Click Search>Enter Query.The form is cleared so that you can enter a new query.
2. Click in the Formula box and type C6N1-2.3. Press the Enter key.
The Status Bar indicates that 12 hits were retrieved from the 285 records in the database.
The Queries tree in the Explorer window dis-plays one query as a “child” of the full list. Queries are saved with the form and can be reviewed at any time. For more information see “Managing queries” on page 380.There are three methods for browsing the search results:
• In the Form View—Use the Record menu commands or toolbar to go through the records.
• In the Data Table View—Browse the table to view the records.
• In the Continuous Forms View—view mul-tiple records in their own forms.
To toggle between the different views, go to View>Switch Views or Ctrl+W.To browse the hit list, use the Record menu commands or their keyboard shortcut equiva-lents.
NOTE: As you keep on viewing the records, counters in the Status bar indicate the current record, the current list size, and the total size of the database.
To view the database in a table that shows the records in a list, do one of the following:
• Go to View>Data Table>In Current Window.• Click the Switch to Table tool.• Type Ctrl+t.
NOTE: The Switch to Table tool is a toggle. Selecting it again will return you to the Form view.
The Table view appears and displays all the records of the current list (in this case, the 12 records that were hit by the search) in a table. You can sort the records for a specific field in Table View.To sort records in Table view by the Mol-Weight field:
Double click on the MolWeight table header. The molecular weight field is sorted in increasing order.
To change the column widths of your table:Position the pointer over a table header divider and drag to the width you want.
To use continuous forms to browse your records:
Go to View>Continuous Forms. The Continuous Forms view appears. By default, the Continuous Forms view shows the same form as the Form view.
Adjust the height of any form by dragging the bar divider on the left to view the forms clearly.Go to View>Form View.To retrieve all the records in your database double-click Full List in the Explorer window.

300 Tutorials Chapter 17
Name searchingTo find all compounds in the CS_Demo data-base with molecular names starting with “benz:”
1. Switch to the Form View, if you are not already in it.
2. Go to Search>Enter Query.
TIP: Although the tutorials describe the use of the Search menu, you may find using the Search toolbar more convenient. The icons on the tool-bar match those you have already seen on the Search menu. Clicking the Find icon is equiva-lent to pressing the Enter key when you are ready to begin your search. See “Queries” on page 357 for information on more advanced use of the Search toolbar.
The form is cleared so that you can enter a new query.
3. Click the Molecule Name box, and type benz*.
4. Press the Enter key.12 hits are returned with names starting with “benz”.
5. Click View>Data Table>In Current Window. The Table view appears. Browse to verify that the molecular names are correct.
NOTE: Notice that this search gave you “ben-zene” but not “bromobenzene.” The query you entered above is an “anchored substring” and only gives you strings starting with the indi-cated substring. For more information on how to specify text searches, see “Text searches” on page 357.
Numerical searchingTo search in the CS_Demo Database for com-pounds with molecular weights between 90 and 100:
1. Switch to the Form View, if you are not already in it.
2. Click Search>Enter Query.The form is cleared so that you can enter a new query.
3. Click in the Molecular Weight box and type 90-100.
4. Press the Enter key.You get 11 hits with molecular weights between 90 and 100.
5. Go to View>Data Table>In Current Window. The Table view appears.
NOTE: A molecular weight query is a decimal value or range. The precision of the search depends on the number of significant digits entered. For more information on molecular weight searching, see “Numeric searches” on page 358.
Substructure searching To enter a query and search for a substructure:
1. Click Search>Enter Query.The form is cleared to allow you to enter your search terms. The status indicator in the status bar is changed to remind you that you are in query mode and the color of the form may change
2. Double-click in the Structure box.A blue box is displayed around the Structure box and the Chem & Bio Draw control appears.
3. Draw benzene.
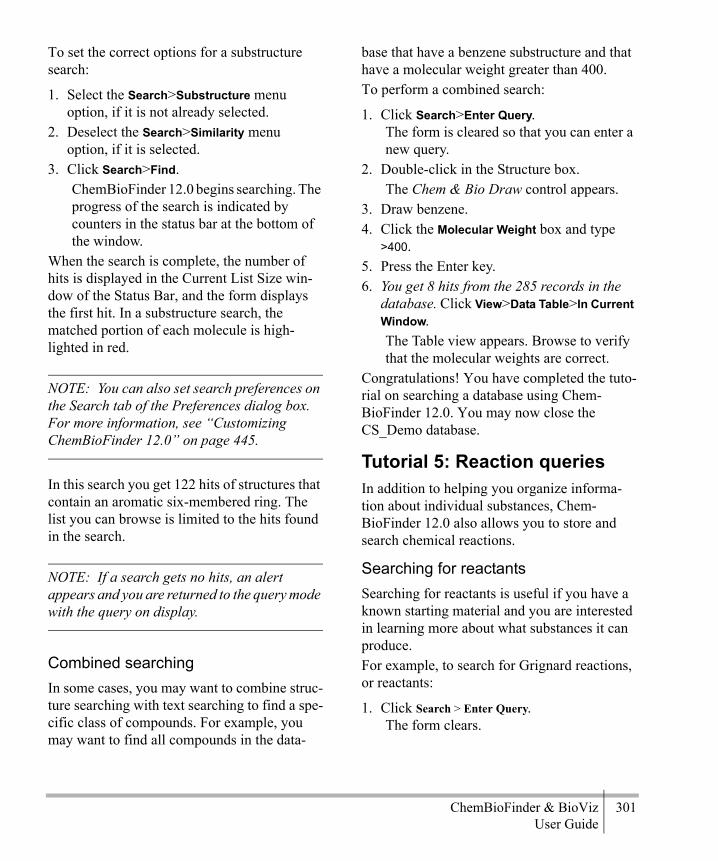
ChemBioFinder & BioViz 301User Guide
To set the correct options for a substructure search:
1. Select the Search>Substructure menu option, if it is not already selected.
2. Deselect the Search>Similarity menu option, if it is selected.
3. Click Search>Find.ChemBioFinder 12.0 begins searching. The progress of the search is indicated by counters in the status bar at the bottom of the window.
When the search is complete, the number of hits is displayed in the Current List Size win-dow of the Status Bar, and the form displays the first hit. In a substructure search, the matched portion of each molecule is high-lighted in red.
NOTE: You can also set search preferences on the Search tab of the Preferences dialog box. For more information, see “Customizing ChemBioFinder 12.0” on page 445.
In this search you get 122 hits of structures that contain an aromatic six-membered ring. The list you can browse is limited to the hits found in the search.
NOTE: If a search gets no hits, an alert appears and you are returned to the query mode with the query on display.
Combined searchingIn some cases, you may want to combine struc-ture searching with text searching to find a spe-cific class of compounds. For example, you may want to find all compounds in the data-
base that have a benzene substructure and that have a molecular weight greater than 400. To perform a combined search:
1. Click Search>Enter Query.The form is cleared so that you can enter a new query.
2. Double-click in the Structure box.The Chem & Bio Draw control appears.
3. Draw benzene.4. Click the Molecular Weight box and type
>400.5. Press the Enter key.6. You get 8 hits from the 285 records in the
database. Click View>Data Table>In Current Window. The Table view appears. Browse to verify that the molecular weights are correct.
Congratulations! You have completed the tuto-rial on searching a database using Chem-BioFinder 12.0. You may now close the CS_Demo database.
Tutorial 5: Reaction queriesIn addition to helping you organize informa-tion about individual substances, Chem-BioFinder 12.0 also allows you to store and search chemical reactions.
Searching for reactantsSearching for reactants is useful if you have a known starting material and you are interested in learning more about what substances it can produce. For example, to search for Grignard reactions, or reactants:
1. Click Search > Enter Query.The form clears.

302 Tutorials Chapter 17
2. Double-click in the Structure box.The ChemDraw control appears.
3. Draw the following:
Figure 17.9 Entering a reactant in a query
This structure represents a carbon atom bonded to a magnesium atom, which is bonded to any type of halogen. The arrow at the right indicates that you are looking for this substructure as a reactant.
4. Select the Search>Substructure menu option, if it is not already selected.
5. Deselect the Search>Similarity menu option, if it is selected.
6. Click Search>Find.ChemBioFinder 12.0 begins searching. The progress of the search is indicated by counters in the status bar at the bottom of the window.
When the search is complete, the number of hits is displayed in the Current List Size win-dow of the Status Bar, and the form displays the first hit. In a substructure search, the matched portion of each molecule is high-lighted in red.You get 3 hits—reactions in which an alkyl magnesium halide is consumed. Browse the list of three hits as in previous tutorials.
Searching for productsIn the next exercise, you search for information on a particular reaction product. Searching for
products of reactions is very common in syn-theses, where you know what you are aiming for but you do not know how to produce it. In this example, we look for reactions that close a ring alpha to a carbonyl.To perform a reaction product search:
1. Click the Search > Enter Query.The form is cleared so that you can enter a new query.
2. Double-click on the Structure data box.The ChemDraw control appears.
3. Draw the following:
4. Switch to either selection tool (Lasso or Marquee) and select the single bond next to the double bond.
5. Right-click, point to Topology, and choose Ring.
6. Select the remaining single bond.7. Right-click and select Topology > Ring.
Right-click again and select Reaction Center > Make/Break. Your structure should now look like this:
Figure 17.10 Product query with topology and reac-tion center indicators
The arrow at the left indicates that you are looking for this substructure as a product.

ChemBioFinder & BioViz 303User Guide
8. Press the Enter key.You get 3 hits containing a product with a carbonyl ring that was formed during the course of the reaction.
Figure 17.11 One of the product query hits
Searching by reaction typeIn many cases, you have some idea of both your starting materials and your products, but are looking for some information on how to get from one to the other. For example, to search for reactions that reduce a carbonyl to an alcohol:
1. Click Search > Enter Query.The form is cleared.
2. Double-click in the Structure box.3. Draw the following:
Figure 17.12 A reaction type query structure
4. Press the Enter key.Browse through the 23 hits. Each of the reactions found shows the transformation of a carbon-oxygen double bond to a carbon-oxygen single bond.This hit list includes reductions of aldehydes, acids, and ketones.
Search over listIn this example, you start with the previous list and search again to get only ketone reduction reactions.To search over a list:
1. If you are not continuing directly from the last example, double-click the previous query in the Query Tree to make sure it is the active hitlist.
2. Click the Search>Over Current List from the menu.
3. Double-click in the Structure box.4. Draw the following:
a. Using a Selection tool, right-click on the double bond and set Reaction Center bond properties to Change.
b. Using the Text tool, select one of the carbon atoms. Type [NOT O,H] (all uppercase, with brackets as indicated) and press the Enter key to replace it.
Cl
HOOH
O
O
H
H Cl
HO
Cl
O
O
H
H
O OH

304 Tutorials Chapter 17
c. Still using the Text tool, select the label, right-click and choose Repeat Last Label.
d. Double-click on the other carbon atom to reproduce the label. The structure now looks like this:
Figure 17.13 Modified reactant query
You have specified a search for ketones by adding the restriction that the atoms adjacent to the carbon must not be oxygen atoms or hydrogen atoms. You also specified that the double bond had to change, not be broken.
5. Press the Enter key.You get 13 hits. Each reaction shows the reduction of a ketone to an alcohol. In the Queries Tree, this search is shown as a “child” of the first query.
Figure 17.14 A child search in the queries tree
TIP: If you plan to do several searches over a hitlist, use the Set Domain to Current List com-mand rather than Search Over Current List. Setting a domain eliminates the need to keep restoring the original hitlist.
Tutorial 6:Creating a BioViz chartBioViz charts are created from the View>Bio-Viz Plots submenu, or from the data field con-text menu. Existing plots can be displayed (when not visible) or removed from the form with the View menu. You may create a plot based on any numerical field in the database. The following options are available:
• Line plots with one or two variables• Scatter plots with one or two variables• Histograms (X-axis variable only).
Single variable plotsA single variable plot displays a Y-coordinate variable vs. the record number.To create a single variable plot:
1. Point to BioViz Plots on the View menu:

ChemBioFinder & BioViz 305User Guide
2. Select New to open the BioViz Plot Proper-ties dialog box:
Figure 17.15 Plot properties
3. Click One Variable in the Dimension box.The X-coordinate is grayed out and the Analysis tab is not displayed.
4. Select any numerical field from the drop-down menu for the Y-coordinate.
5. Enter a name for the plot (optional).
TIP: Note the Point Limit field on the lower right side of the Properties dialog box in Figure above. Plotting a large dataset can be very slow. As a safely precaution, the default is set to 500, meaning only the first 500 points in the
dataset will be plotted. On most computers, this will take no more than a few seconds. To plot a larger dataset, reset this value as necessary.
6. Click OK.The Plot appears in a new window.
7. Click the Notes tab to view addition infor-mation. For example, points will not be plotted if they are missing Y values. This is reported in the Notes.
Alternate context menu procedureTo produce a single variable scatter plot, right click in a numerical field, point to BioViz Plot,
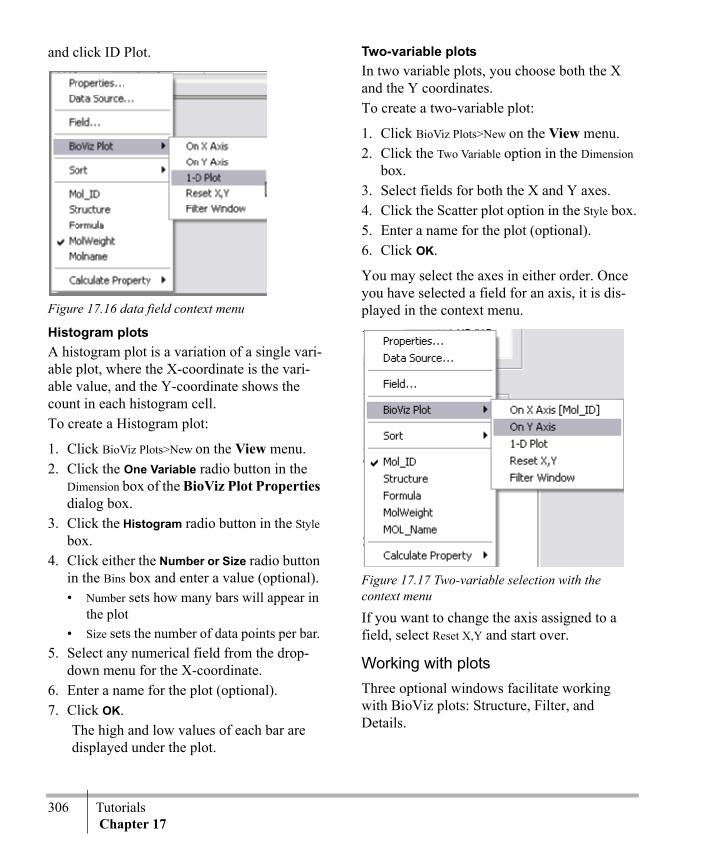
306 Tutorials Chapter 17
and click ID Plot.
Figure 17.16 data field context menu
Histogram plotsA histogram plot is a variation of a single vari-able plot, where the X-coordinate is the vari-able value, and the Y-coordinate shows the count in each histogram cell.To create a Histogram plot:
1. Click BioViz Plots>New on the View menu.2. Click the One Variable radio button in the
Dimension box of the BioViz Plot Properties dialog box.
3. Click the Histogram radio button in the Style box.
4. Click either the Number or Size radio button in the Bins box and enter a value (optional). • Number sets how many bars will appear in
the plot • Size sets the number of data points per bar.
5. Select any numerical field from the drop-down menu for the X-coordinate.
6. Enter a name for the plot (optional).7. Click OK.
The high and low values of each bar are displayed under the plot.
Two-variable plotsIn two variable plots, you choose both the X and the Y coordinates.To create a two-variable plot:
1. Click BioViz Plots>New on the View menu.2. Click the Two Variable option in the Dimension
box.3. Select fields for both the X and Y axes.4. Click the Scatter plot option in the Style box.5. Enter a name for the plot (optional).6. Click OK.
You may select the axes in either order. Once you have selected a field for an axis, it is dis-played in the context menu.
Figure 17.17 Two-variable selection with the context menu
If you want to change the axis assigned to a field, select Reset X,Y and start over.
Working with plotsThree optional windows facilitate working with BioViz plots: Structure, Filter, and Details.

ChemBioFinder & BioViz 307User Guide
• Structure — displays structures of data points as you mouse over them; used when the form is not visible or is displaying a dif-ferent record.
• Details — displays data for selected fields, either from the database or from child tables, as you mouse over data points; used when the form is not visible or is displaying a different record.
• Filters — displays filter bars for those fields being used to modify the plot.
TIP: In order to see some of the features described below, you will need to “tile” the windows to view the form and the plot simulta-neously.
FiltersFilters can be used in two different ways:
• Filter a plotted variable to reduce its range• Filter on other variables to add other dimen-
sions to the plot.
To activate filters, click the View > Filter Window or use the context menu (Right-click menu) for plots. When the filter window opens, Right-click in it to select or deselect fields. There is no limit to the number of filters that can be applied to a plot.
NOTE: Filters act on all active plots, not just the one displayed.
AutoscaleWhen you filter a plot, you may want to expand the scale to better display the remain-ing points. If you select Autoscale on the BioViz context menu, the scale will readjust automati-
cally every time you adjust a filter. Autoscale is a toggle that remains in effect until you can-cel it. Alternately, you can make all of your filter adjustments without changing the scale, then select Rescale to All Points on the BioViz context menu.
ZoomThe BioViz zoom feature is a toggle activated from the BioViz context menu. To expand a portion of a BioViz plot:7. Select Zoom on Drag on the BioViz context
menu. A check mark appears next to the command when it is selected. To deselect, click the command again.
8. Drag over a section of the plot.When you release the mouse button, the scale expands to show the points selected.
While the initial view is the area you selected, you may use the scroll bars to view any part of the plot at the expanded scale. Clicking either the X or Y Zoom Button will return that axis to the original scale, while leaving the other axis at the expanded scale. Clicking Unzoom on the BioViz context menu will restore the original scale to both axes simultaneously.You may repeat zoom, that is, zoom in on an area in an already expanded scale. If you have performed multiple zooms, the Zoom button acts as an Undo control, reversing one step at a time.
Statistical analysisYou can perform statistical analyses on plots using the Analysis tab on the BioViz Plot Prop-erties dialog box. The tab is available only for two-variable plots.
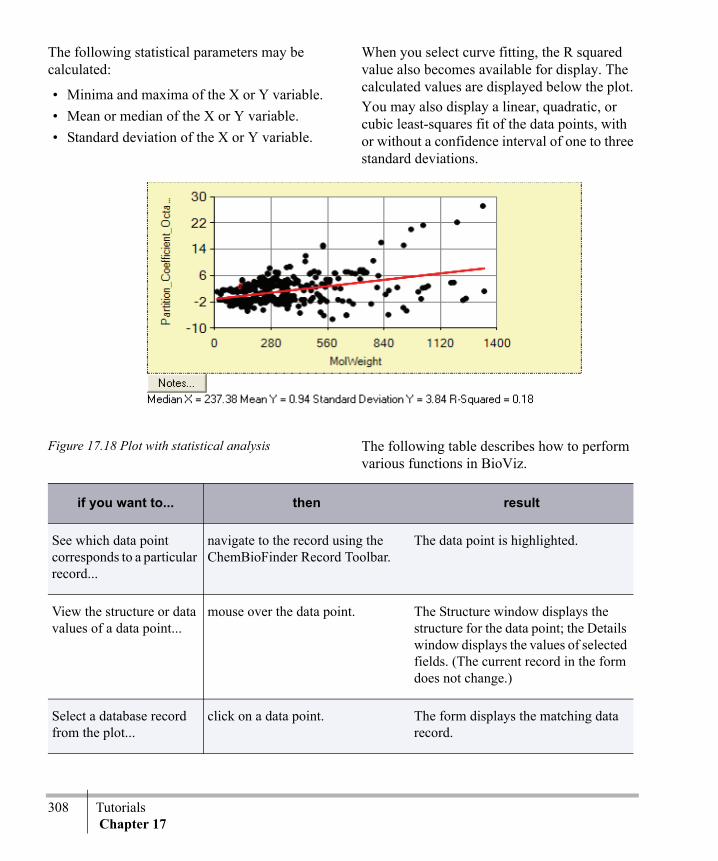
308 Tutorials Chapter 17
The following statistical parameters may be calculated:
• Minima and maxima of the X or Y variable.• Mean or median of the X or Y variable.• Standard deviation of the X or Y variable.
When you select curve fitting, the R squared value also becomes available for display. The calculated values are displayed below the plot. You may also display a linear, quadratic, or cubic least-squares fit of the data points, with or without a confidence interval of one to three standard deviations.
Figure 17.18 Plot with statistical analysis The following table describes how to perform various functions in BioViz.
if you want to... then result
See which data point corresponds to a particular record...
navigate to the record using the ChemBioFinder Record Toolbar.
The data point is highlighted.
View the structure or data values of a data point...
mouse over the data point. The Structure window displays the structure for the data point; the Details window displays the values of selected fields. (The current record in the form does not change.)
Select a database record from the plot...
click on a data point. The form displays the matching data record.

ChemBioFinder & BioViz 309User Guide
Tutorial 7: Working with subforms
Subforms allow you to display relational data. If you have a database containing two or more data tables, and these data tables share a com-
Display plotted variable(s) for a query...
select (or create) the query. The plot displays the current query.
Create a query from the plot...
On the BioViz context menu:
1. If a check mark appears next to Zoom on Drag, click to deselect it.
2. Drag over the points of inter-est to select them.
3. Click Selection to List on the context menu.
The selected points become a new query.
Prevent a plot from changing when you select queries or change vari-ables...
check the Lock option in the BioViz Plot Properties dialog box.
The plot is locked to a given dataset. Note that filters will be locked as well.
Expand the plot to view individual data points...
Select Zoom on Drag on the BioViz context menu.
Dragging over a section of the plot enlarges it, rather than selecting the points.
Change the color of the data points...
In the Queries control, select Change Color on the Queries context menu. Note that you cannot change the color of the Full List, only of daughter lists.
The data points are displayed in the color you select.
Plot multiple datasets (overlay)...
With the Full List selected, click Color on Plot on the Queries context menu for each query you want to overlay. Alternately, click the query or the colored box next to it.
A check mark appears in the box next to the query name, and the data points are displayed in the color assigned to the query.
if you want to... then result

310 Tutorials Chapter 17
mon, linking field, then you can display data from both tables. Whenever the value of the linking field changes in the main form, the sub-form only displays those records from its table which have the same value in the linking field. You can also use subforms to display data from different databases.In this tutorial, you open the CS_Demo data-base and display the MolTable in the main form. Then you display the Synonyms table of the CS_Demo database in a subform. By defin-ing the MOL_ID field as the linking field, you display the two sets of data relationally.
Creating a subformTo create a subform:
1. Open your ChemBioFinder 12.0 form tut1.cfx.Opening this form connects you to the CS_Demo.mdb database.
2. Make some space on the right side of the form by rearranging the data boxes and making them smaller.
3. Click the Subform tool.4. In the form, drag to create a large subform.
TIP: If you cannot make room on the right side of your form, you can put the subform at the bottom of the form.
When you release the mouse button the Subform Properties dialog box appears.
5. Click the Form tab, then select Synonyms from the hierarchical tree display.
6. Click the Generate form check box, then click the Style button.
7. Select the Plain form, deselect all of the fields to be included except Synonym, and click the OK button.You are returned to the Subform Properties dialog box.
8. Click the Subform tab.9. SYN_ID already appears as the default in the
Link to SYNONYMS field section. Using the drop-down menu, choose MOL_ID for the Link from MOLTABLE field.
10.Click the OK button.You have just selected the data source for your subform and linked it to the main form.
The MOL_ID field links the main form and subform. Clicking in either form activates it.To test this:
1. Click anywhere outside the subform box, and browse your database using the Record tools.As each molecule record of the MolTable is displayed, the subform shows the first matching ID from the Synonyms table.
2. Click inside the subform box.Now when you browse, you are browsing only the entries in the subform.
To display all of the synonyms:
1. Toggle out of Layout mode.Double-click in the subform box to switch to Table view. Save and close the file:
1. Click File > Save.2. Click File > Close.
Congratulations! You have completed the ChemBioFinder 12.0 Tutorials.

ChemBioFinder & BioViz 311User Guide
FormsYou use forms to interact with information in a database. A ChemBioFinder 12.0 form is com-posed of data boxes for viewing or modifying data items, such as structures, numbers, text, or pictures. A form can also contain subforms for relational access to different data tables and different databases.You can create a form in the following ways:
• Automatically, using the Form Generator dialog box.
• Manually, using the Form tools.• With the Database Tree.
The example below shows a form displaying a single record of information from a database.
Figure 18.1 Form, showing a single record.
Creating a form consists of creating a layout (see “Creating forms manually” on page 313),
and setting box properties (See “Setting box properties” on page 318.), tabs (See “Creating and editing tabs” on page 318.), and security ( See “Securing forms” on page 327.). You can edit your form at any time (see “Edit-ing forms” on page 324 and “Changing form layout” on page 327).The first step in designing a form is selecting the database and deciding which fields to include.
Creating forms automaticallyUse the Form Generation dialog box to create a form or change the layout of an existing form. In the dialog box, you choose the form style and properties from pre-defined options.To begin creating a new form:
1. Right-click on a blank area of the current form and select Data Source.The Form Properties dialog box appears.
2. In the Form Properties dialog box, select the Form tab.
18

312 FormsChapter 18
3. Select the Generate form check box, then click the Style... button.The Form Generation dialog box appears. In the left panel, all the fields are selected by default.
Figure 18.2 The Form Generation dialog box
4. Deselect those fields in the Choose fields to be included section that you want to exclude from the form.
5. To have a Structure box in the upper left corner of the form, select the Structure in upper left of form check box.If you do not select this option, the boxes are generated in the order they appear in the list.
6. Select the Form style you want:
7. Use the thumb wheel arrows to select the number of columns, from one to four, in the Columns: list.
8. Use the Grid size: drop-down menu to choose the size and spacing of the boxes and grid as follows:
9. Click the OK button in the Form Generation dialog box.Your form settings are saved.
Table 18.1 Form style options
If you want the boxes to
Then, in the Form style section, click
be surrounded by a frame
Framed.
be labeled above Titled.
be labeled to the left Labeled.
not be labeled Plain.
Table 19 Grid size options
If you want the boxes to be
Then, for Grid Size, choose
larger and spaced further apart
Large.
medium, relative to the Large and Small settings
Medium.
smaller and spaced closer together
Small.
Table 18.1 Form style options
If you want the boxes to
Then, in the Form style section, click

ChemBioFinder & BioViz 313User Guide
10.Click the OK button in the Form Properties dialog box.A warning dialog box appears allowing you to create a new form or replace the existing form. Click No to create a new form, Yes to replace the existing form.
Figure 18.3 New form warning box.
Saving a formIn most non-database applications—including Chem & Bio Draw and Chem & Bio 3D—you edit data on the screen, but your changes are not made permanent until you click File>Save, or type Ctrl+S.In database programs such as ChemBioFinder 12.0, your changes are automatically and per-manently saved to the database when you switch records. This is “committing” the changes. You then have the opportunity to revert to the original data by clicking Record>Undo Changes. The File>Save menu command refers only to changes made on the form itself, such as the position of boxes. Choosing the File>Save menu command has no effect on changes you make to data stored in the database. Saving a form also saves subforms and changes that you make to subforms.
After you create a form, you can save it. When you retrieve the saved form, it automatically opens a connection to the database defined in the forms.
To save a form as .cfx file:
1. Click File>Save. To save the form under a new file name, use File>Save As.The Save dialog box appears.
2. Choose the directory in which you want to save the form, type a filename, and click the Save button.ChemBioFinder 12.0 saves the form with a CFX extension
NOTE: While saving, if you select All Files in the Save as type dialog box, you will see files with .msf and .msk extensions. A file with the extension .msf is a multiple sequence file. A file with .msk extension is a mask file.
Creating forms manuallyYou create a form and define it by using the Form tools to create objects and the Box Prop-erties dialog box to set the form properties.• To create a new form, do one of the follow-
ing:• Click File>New.• Click the New File icon on the Main Tool-
bar.• To create form with the database tree
The Database Tree is the same familiar tree as in the Database Properties dialog, showing the tables (or views) and columns of the currently-open database. When you open or activate a form or subform, or change databases, the tree updates to display the current database, and
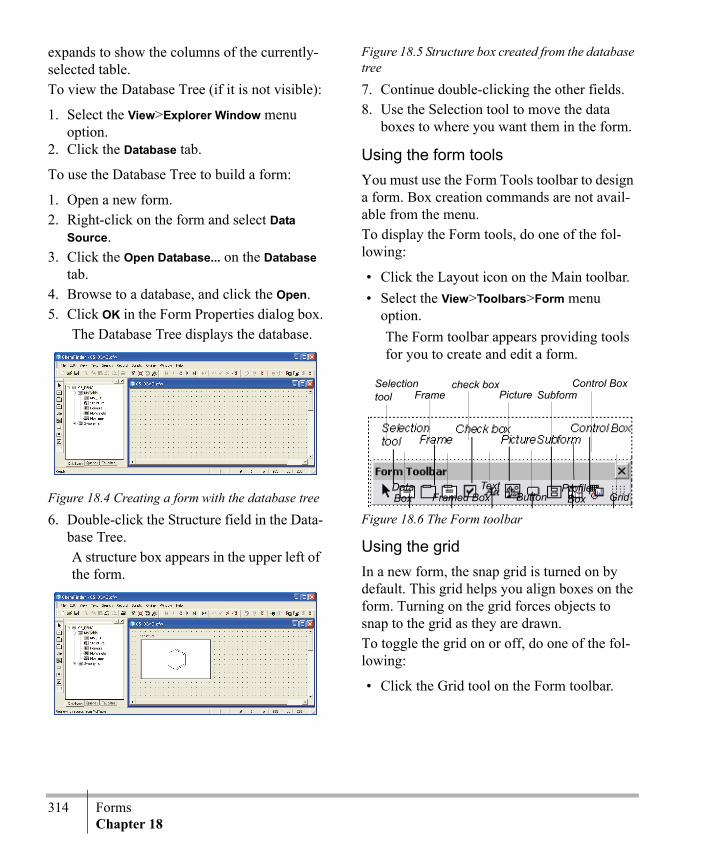
314 FormsChapter 18
expands to show the columns of the currently-selected table.To view the Database Tree (if it is not visible):
1. Select the View>Explorer Window menu option.
2. Click the Database tab.
To use the Database Tree to build a form:
1. Open a new form.2. Right-click on the form and select Data
Source.3. Click the Open Database... on the Database
tab.4. Browse to a database, and click the Open.5. Click OK in the Form Properties dialog box.
The Database Tree displays the database.
Figure 18.4 Creating a form with the database tree
6. Double-click the Structure field in the Data-base Tree.A structure box appears in the upper left of the form.
Figure 18.5 Structure box created from the database tree
7. Continue double-clicking the other fields.8. Use the Selection tool to move the data
boxes to where you want them in the form.
Using the form toolsYou must use the Form Tools toolbar to design a form. Box creation commands are not avail-able from the menu. To display the Form tools, do one of the fol-lowing:
• Click the Layout icon on the Main toolbar.• Select the View>Toolbars>Form menu
option.The Form toolbar appears providing tools for you to create and edit a form.
Figure 18.6 The Form toolbar
Using the grid In a new form, the snap grid is turned on by default. This grid helps you align boxes on the form. Turning on the grid forces objects to snap to the grid as they are drawn.To toggle the grid on or off, do one of the fol-lowing:
• Click the Grid tool on the Form toolbar.
SelectionFrame Subformtool Picture
GridProfile
Framed Box
check box
Button Box
Control Box
DataBox
Text

ChemBioFinder & BioViz 315User Guide
• Select/deselect the View>Grid menu option.
NOTE: You can change the grid spacing using the Preferences dialog box. See “Setting prefer-ences” on page 445..
Creating boxesA ChemBioFinder 12.0 form is composed of a collection of boxes that display data from the associated database, or other information. Each box displays one data item of the current record. To create a data box, use one of the tools on the Form toolbar.
NOTE: The Form toolbar is not visible unless the Layout button is selected.
The Data Box displays a data item or structure. Use it to display any data from a database, including text, numbers, dates, molecules, reactions, or pictures. It is the only box that allows you to edit data in the database. Data boxes do not have labels, but you can label them by adding a Frame or Plain Text. You can also use the Data Box to display static data not from a database.To draw a Data Box:
1. Click the Data Box tool.2. On the form, drag diagonally to create a
box.
To specify what type of data is displayed in the box, See “Setting box properties” on page 318.. If the form already has a database open, you can right-click in the data box, select Field... and choose from a list of the available fields.
Creating framesThe Frame tool allows you to create an enclo-sure with a label surrounding a data box or group of boxes. When you draw a new frame, you are automatically prompted for a text label to be attached to it.To create a frame:
1. Click the Frame tool.2. On the form, drag diagonally to create a
frame.A framed box appears with the label Data. To change the label:
3. Right-click on the label and choose Label from the drop-down menu.The Enter the label dialog box appears.
4. Type the label you want to attach to the frame.
5. Click OK.A fixed label appears on the frame.
To change a label:
1. Right-click on the edge of a frame and select Label.
2. Enter the new label in the text box.
Another way to change a frame’s label is in the Box Properties dialog. For more information, See “Setting box properties” on page 318..You can use a frame to show “live” data from the database. If a frame is connected to a data-base field, it is updated automatically as you browse or search. For example, you might place a frame around a structure field, where the label on the frame represents the name of the current structure. The label changes every time the structure does. You must use Box Properties to set up a live data connection for a frame.
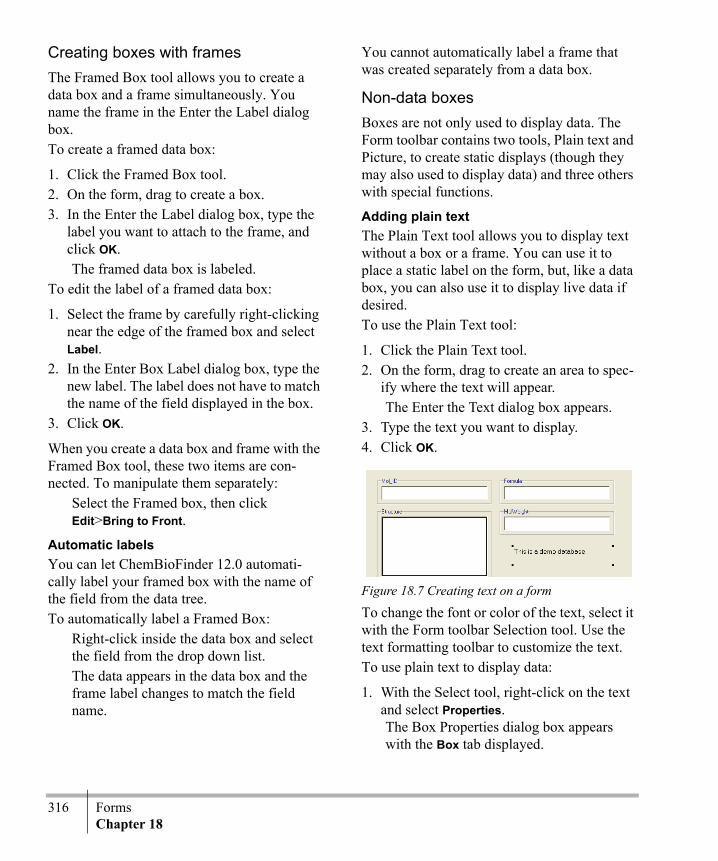
316 FormsChapter 18
Creating boxes with framesThe Framed Box tool allows you to create a data box and a frame simultaneously. You name the frame in the Enter the Label dialog box.To create a framed data box:
1. Click the Framed Box tool.2. On the form, drag to create a box.3. In the Enter the Label dialog box, type the
label you want to attach to the frame, and click OK.The framed data box is labeled.
To edit the label of a framed data box:
1. Select the frame by carefully right-clicking near the edge of the framed box and select Label.
2. In the Enter Box Label dialog box, type the new label. The label does not have to match the name of the field displayed in the box.
3. Click OK.
When you create a data box and frame with the Framed Box tool, these two items are con-nected. To manipulate them separately:
Select the Framed box, then click Edit>Bring to Front.
Automatic labelsYou can let ChemBioFinder 12.0 automati-cally label your framed box with the name of the field from the data tree. To automatically label a Framed Box:
Right-click inside the data box and select the field from the drop down list.The data appears in the data box and the frame label changes to match the field name.
You cannot automatically label a frame that was created separately from a data box.
Non-data boxesBoxes are not only used to display data. The Form toolbar contains two tools, Plain text and Picture, to create static displays (though they may also used to display data) and three others with special functions.
Adding plain textThe Plain Text tool allows you to display text without a box or a frame. You can use it to place a static label on the form, but, like a data box, you can also use it to display live data if desired.To use the Plain Text tool:
1. Click the Plain Text tool.2. On the form, drag to create an area to spec-
ify where the text will appear.The Enter the Text dialog box appears.
3. Type the text you want to display.4. Click OK.
Figure 18.7 Creating text on a form
To change the font or color of the text, select it with the Form toolbar Selection tool. Use the text formatting toolbar to customize the text.To use plain text to display data:
1. With the Select tool, right-click on the text and select Properties.The Box Properties dialog box appears with the Box tab displayed.

ChemBioFinder & BioViz 317User Guide
2. Select a field from the data table.The Data: text box becomes grayed out, and the Data Source selection switches to Field.
3. Click OK.The contents of the field are displayed in plain text.
Adding picturesThe Picture tool allows you to create a Picture Box to display a bitmap (BMP, GIF, etc.) or Windows metafile (WMF, EMF) picture. It can display a static file, or a live one stored in a picture column of a database. To create a static picture:
1. Click the Picture tool.2. On the form, drag to create an area for the
picture to occupy.The Open dialog appears.
3. In the Open dialog box, select the file you want to display, then click the Open button.The picture appears in your form.
NOTE: The file is not actually embedded in the form. Only its filename is saved with the form. If you move or rename the file, the form will not display the corresponding picture. However, if you make changes to the picture and keep its filename the same, the picture in the form will be updated.
To create a Picture box linked to a field.You must have a picture field in the database. See “Creating fields” on page 343. for more information.
1. Click the Picture tool.2. On the form, drag to create an area for the
picture to occupy.The Open dialog appears.
3. Click the Cancel.A blank box appears in the form.
4. Right-click in the box and click Properties.5. In the Box Properties dialog box, select the
picture field you want to link to the box and click OK.The picture field item appears in the box.
To read in a picture file or to replace a picture in a Picture Box:
1. Right-click a picture and click Read File.The Open dialog box appears.
2. In the Open dialog box, select the file you want to display in the Picture Data Box, then click the Open.The new picture is displayed in the Picture Box.
NOTE: If the Picture box is linked to a Picture field, you must click the Commit changes tool to save the picture in the database.
To save a file from a Picture Data Box:
1. Right-click on the Picture Box and select Save File.
2. In the Save As dialog box, type a file name, then click the Save.The picture is saved.
Adding a check boxThe check box tool allows you to add check boxes to your form. A check box can be assigned to either a Boolean or an Integer field. To add a check box:
1. Click the check box tool. 2. On the form, drag an area large enough for
the text next to the check box.The Enter the label dialog box appears.
3. Type in the text and click OK.

318 FormsChapter 18
4. Right-click, and select a Boolean or Integer field from the field list to assign to the check box.
Adding a buttonButtons on the form are used to activate scripts. To place a button on a form:
1. Write a script using the ChemBioFinder 12.0 Automation Language (CAL).
2. Click the Button tool on the Form toolbar.3. On the form, drag to draw a button.
The Enter the Label dialog box appears.4. Enter a label. The text can be descriptive
(“Click to browse”) and does not have to correspond to the name of the script.
5. Click OK.
For more information about using a button to run a script, See “Using scripts” on page 461..
Adding a subformThe Subform tool is used to create a subform box to display data from a related data table. See “Relational Data and Subforms” on page 399. for more information
Adding a profileThe Profile box tool creates a profile box on a form. Compound profiles are a new feature in ChemBioFinder 12.0. See “Compound Pro-files” on page 405. form more information.
Adding a controlThe Control box tool is used to embed an ActiveX control in a form. You can use this to display a calendar, spreadsheet, chart, spec-trum, picture, web link, and so forth. See “Embedding ActiveX controls” on page 452. for more information.
Creating and editing tabsIf you have a large number of fields in a data-base, you can access information more easily, and make the form less cluttered, by using tabs to divide a long form into smaller parts con-tained on separate tabs. To create tabs on a form:
Right-click an empty part of a form and select Add Tab context.Two tabs appear in the lower left corner of the form. Clicking on the second tab will present you with a new empty form.
To rename a tab:
1. Right-click the tab and click Rename Tab.The Tab Name dialog box appears.
2. Type a name for the tab and click OK.The new name appears on the tab.
To remove a tab:Right-click the tab and click Delete Tab context.The tab is removed.
Setting box propertiesUse the Box Properties dialog box to set ChemBioFinder 12.0 form attributes, includ-ing: data source, display type, font, and box style.To open the Box Properties dialog box:
Right-click on a data box and click Properties.The Box Properties dialog box appears.
NOTE: The “Properties” option is only avail-able in Layout mode.

ChemBioFinder & BioViz 319User Guide
Setting data box stylesUse the Box Properties dialog box to change the style of a data box on a form. For example, you can change a data box to a frame or pic-ture.The Box Style menu only shows applicable styles for each field. For example, you cannot show a real number in a Picture.For information about field types, See “Creat-ing fields” on page 343.. Choose from the following styles:
• Data Box—displays alphanumeric data. Can display multiple lines of data.
• Frame—displays alphanumeric data. Can display a single line of data.
• Plain Text–displays alphanumeric data. Text data can be displayed in multiple lines. (Use Ctrl+Enter to start a new line.) You set the field size when you create the field, up to a maximum of 254 characters.
• Picture–displays Windows metafile data. Pictures are scaled to fit within picture boxes, with fixed height to width ratios.
• Formula–displays any kind of text but num-bers are subscripted. Formulas are pre-sented in modified Hill order, as follows: If a substance contains both carbon and hydrogen, the carbons are listed first, fol-lowed by the hydrogen atoms, followed by other elements alphabetically by element symbol. If a substance contains carbon, the carbons are listed first, followed by other elements alphabetically by element symbol. Otherwise, all elements are listed alphabeti-cally by element symbol.
• Button–used to create buttons to actuate scripts. Buttons display button labels.
• Rich Text—displays styled data in multiple lines. (Use Ctrl+Enter to start a new line.) You can format the text with the Text For-mat toolbar. If the data in a field contains rich text, markup characters are displayed.
• Structure (Chem & Bio Draw style)–displays chemical structures or reactions. Reactions are laid out for best fit with the box and the layout may change if the box is reshaped. The box defaults to using the Chem & Bio Draw Control to create and edit structures, but you can reset the preference. For more information, See “Setting preferences” on page 445.
• Structure (ChemBioFinder style)–as above, but defaults to opening Chem & Bio Draw to create and edit structures.
• Structure (Chem & Bio 3D style)–as above, but defaults to display 3D structures.
To set the box style:
1. Right-click in the data box you want to change and click Properties.The Box Properties dialog box appears.
2. Choose the box style from the Box Style drop-down menu.
3. Click OK.
Viewing structuresYou can display structures in a structure box in three styles:
• ChemBioFinder• Chem & Bio Draw
• Chem & Bio 3D
In ChemBioFinder style, the Chem & Bio Draw application opens when you want to edit struc-tures or create a query. (This mode of opera-tion was used in all earlier versions of ChemBioFinder11.0.)
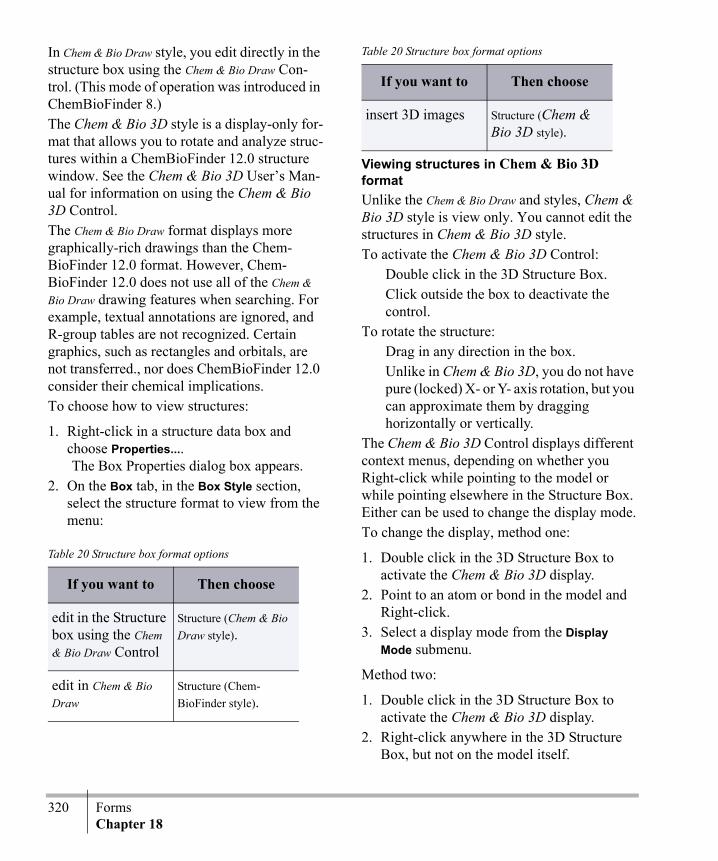
320 FormsChapter 18
In Chem & Bio Draw style, you edit directly in the structure box using the Chem & Bio Draw Con-trol. (This mode of operation was introduced in ChemBioFinder 8.)The Chem & Bio 3D style is a display-only for-mat that allows you to rotate and analyze struc-tures within a ChemBioFinder 12.0 structure window. See the Chem & Bio 3D User’s Man-ual for information on using the Chem & Bio 3D Control.The Chem & Bio Draw format displays more graphically-rich drawings than the Chem-BioFinder 12.0 format. However, Chem-BioFinder 12.0 does not use all of the Chem & Bio Draw drawing features when searching. For example, textual annotations are ignored, and R-group tables are not recognized. Certain graphics, such as rectangles and orbitals, are not transferred., nor does ChemBioFinder 12.0 consider their chemical implications.To choose how to view structures:
1. Right-click in a structure data box and choose Properties....The Box Properties dialog box appears.
2. On the Box tab, in the Box Style section, select the structure format to view from the menu:
Viewing structures in Chem & Bio 3D formatUnlike the Chem & Bio Draw and styles, Chem & Bio 3D style is view only. You cannot edit the structures in Chem & Bio 3D style. To activate the Chem & Bio 3D Control:
Double click in the 3D Structure Box.Click outside the box to deactivate the control.
To rotate the structure:Drag in any direction in the box.Unlike in Chem & Bio 3D, you do not have pure (locked) X- or Y- axis rotation, but you can approximate them by dragging horizontally or vertically.
The Chem & Bio 3D Control displays different context menus, depending on whether you Right-click while pointing to the model or while pointing elsewhere in the Structure Box. Either can be used to change the display mode.To change the display, method one:
1. Double click in the 3D Structure Box to activate the Chem & Bio 3D display.
2. Point to an atom or bond in the model and Right-click.
3. Select a display mode from the Display Mode submenu.
Method two:
1. Double click in the 3D Structure Box to activate the Chem & Bio 3D display.
2. Right-click anywhere in the 3D Structure Box, but not on the model itself.
Table 20 Structure box format options
If you want to Then choose
edit in the Structure box using the Chem & Bio Draw Control
Structure (Chem & Bio Draw style).
edit in Chem & Bio Draw
Structure (Chem-BioFinder style).
insert 3D images Structure (Chem & Bio 3D style).
Table 20 Structure box format options
If you want to Then choose

ChemBioFinder & BioViz 321User Guide
3. Select a display mode from the View>Model Display>Display Mode submenu.
For more information on the Chem & Bio 3D Control, see the Chem & Bio 3D User’s Man-ual.
Setting fixed and live dataIn the Box Properties dialog box, you can des-ignate whether the data source is fixed or from a field. Fixed data is attached to the form and does not change as you browse. Data from a field is stored in the database and is different for each record. As you browse, the record dis-play updates according to the contents of the field.To specify live data for a data box:
1. In the Box tab, select the field to associate, and then click the Field radio button.
2. Click OK.The box display updates as you change records.
To specify fixed data for a data box:
1. In the Box tab, select the field to associate, and click the Fixed radio button.
2. Type a label in the text box. If you choose a structure or picture field, click the browse tool to browse to the file to display.
3. Click OK.The box display is fixed.
Adding a data box menuYou can add a menu containing a list of choices to a data box so you can choose an item from it to appear in the data box. To add a menu:
1. Right-click on a data box and click Proper-ties.The Box Properties dialog box appears.
2. On the Box tab, click the With drop-down choices check box.The Choices tab appears.
3. Take the appropriate action:
4. Click OK to close the dialog box, then click in the data box.A button appears in the lower right corner of the box when you click in the box.
5. Click the button to display the menu.6. Select any item on the menu—the text
appears in the top left corner of the box and the button disappears.Click within the data box to make the button reappear.
Adding a scroll barsScroll bars are used to accommodate lengthy data when there is limited space for the data box.
Table 21 Menu list options
If you want to Then click
use a list from a database table as the data box menu
From table and follow the instruc-tions at the bottom of the dialog box.
create your own list for the data box menu
Fixed list of choices and follow the instructions at the bottom of the dialog box.
use a list from a database table and add your own items to the data box menu
a. From table. A list appears.
b. Click Fixed list of choices, and edit the list.

322 FormsChapter 18
To add a scroll bar:
1. Right-click a data box and click Properties.The box properties dialog box appears.
2. In the Box style section, select the With scroll bars check box
3. Click OK.The scroll bar appears on the bottom right in the data box.
Hiding data boxes You can show or hide boxes when switching between query and browse mode. For example, you can hide non-searchable data boxes during query entry, or show only those data boxes that display information useful for query entry.When you are in form layout mode, all boxes are visible, regardless of the setting.To hide data boxes:
1. Right-click on the box and click Properties.2. In the Box Style area, select the Hidden in
Browse Mode check box or the Hidden in Query Mode check box.
3. Click OK.4. Deselect the Layout Mode to view the
results.
Customizing textUse the Text Format toolbar to customize text fonts, sizes, styles, colors, and alignment in form boxes. All of the standard text formatting options are available.
To display the Text Format toolbar:Select the View>Toolbars>Text Format menu option.The Text Format toolbar appears.
NOTE: Text copied from a word processor such as Microsoft Word retains its styles when pasted into a Rich Text box.
The text format toolbar is active:
• When you are editing a memo field in a rich text box. In this case, font changes apply only to the current selection within the text.
• When you are editing in a regular data (or structure) box. Font changes apply to the entire contents of the box.
• When you are in form edit mode, with the selector tool active, and one or more boxes are selected. Font changes apply to all selected boxes (except frames around data boxes).
Customizing fontsAll labels on ChemBioFinder 12.0 objects can be edited to your specifications. You can edit any label’s font, font style, size, and color.To set the font for a label:
1. Click on the label to select it.2. Right-click and select Properties.3. On the Box tab of the Box Properties dia-
log box, click Font.The Font dialog box appears.
4. Set the text font, style, size, and color.The sample area previews the font.
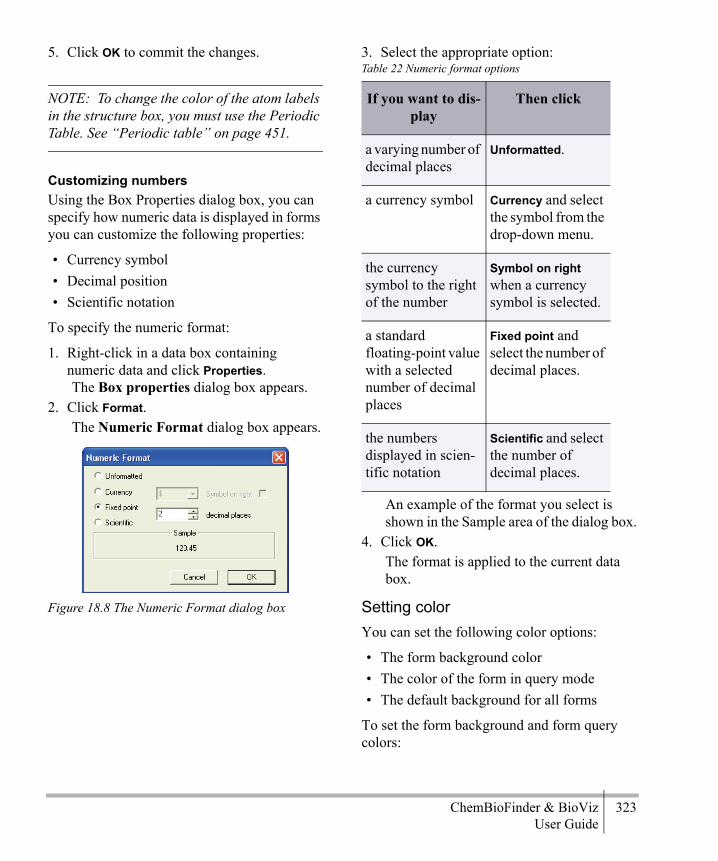
ChemBioFinder & BioViz 323User Guide
5. Click OK to commit the changes.
NOTE: To change the color of the atom labels in the structure box, you must use the Periodic Table. See “Periodic table” on page 451.
Customizing numbersUsing the Box Properties dialog box, you can specify how numeric data is displayed in forms you can customize the following properties:
• Currency symbol• Decimal position• Scientific notation
To specify the numeric format:
1. Right-click in a data box containing numeric data and click Properties.The Box properties dialog box appears.
2. Click Format.The Numeric Format dialog box appears.
Figure 18.8 The Numeric Format dialog box
3. Select the appropriate option:
An example of the format you select is shown in the Sample area of the dialog box.
4. Click OK.The format is applied to the current data box.
Setting colorYou can set the following color options:
• The form background color• The color of the form in query mode• The default background for all forms
To set the form background and form query colors:
Table 22 Numeric format options
If you want to dis-play
Then click
a varying number of decimal places
Unformatted.
a currency symbol Currency and select the symbol from the drop-down menu.
the currency symbol to the right of the number
Symbol on right when a currency symbol is selected.
a standard floating-point value with a selected number of decimal places
Fixed point and select the number of decimal places.
the numbers displayed in scien-tific notation
Scientific and select the number of decimal places.

324 FormsChapter 18
1. Right-click in a data box and click Proper-ties.The Box Properties dialog box appears.
2. Click the Form tab to display the Form properties.
Figure 18.9 Form properties dialog box
3. Take the appropriate action:
The Color dialog box appears.
Figure 18.10 The Color picker dialog box
4. Select a color.5. Click OK.
The Form or Query Background changes to reflect the color you choose.
To set the default background color:
1. Click File>Preferences.The Preferences Dialog Box appears.
2. Click the Color tab.3. On the Color tab, click the Form Back-
ground.4. In the Color dialog box, select a color and
click OK.The color you choose becomes the default form background color.
Editing formsYou can move or resize boxes and other objects on your form with the Selection tool and the items in the Edit menu.
Selecting objects on a formUse the Selection tool to choose data boxes and other objects on a form that you want to move, resize, or delete. When the selection tool is active, the Edit menu commands apply to the boxes them-selves. When the selection tool is not active, the Edit Menu commands apply to the contents of the active data box.To select an object on a form:
Click the Selection tool on the Form toolbar, then click an object on the form to select it.A highlight appears around the object indicating that it is selected.
To select multiple objects on a form:
1. Click the Selection tool on the Form tool-bar.
2. Do one of the following:• Press the Shift key and click on the multi-
ple objects.• Drag the Selection tool around the boxes
you want to select.To select all the objects in the form:
Click Edit>Select All.
Table 23 Background color options
To set the back-ground color of
the...
Click...
database form the Form Back-ground.
query form the Query Back-ground.

ChemBioFinder & BioViz 325User Guide
Moving objectsUse the Selection tool to move data boxes or other objects to a different place on a form.To move objects on a form:
1. Click the Selection tool on the Form tool-bar.
2. Select the object to move.3. Drag the object to a different place.
NOTE: To move a subform, you must drag the title bar of the subform, not its contents.
If an object is nearly in the right place, you can “nudge” it to get it exactly aligned.To move an object one pixel at a time:
1. Select the object you want to move.2. Press an arrow key in the direction you
want to move the objects. The objects move one pixel in the direction of the arrow key.
Resizing objectsUse the Selection tool to resize a data box or any other object on the form.
NOTE: You cannot resize more than one object at a time or simultaneously resize a box and its frame, unless you create a framed box using the Framed Box tool. For more information, See “Creating boxes with frames” on page 316..
To resize objects on a form:
1. Click the Selection tool on the Form tool-bar.
2. Position the pointer over an edge or corner of the object until the pointer is a double-headed arrow.
3. Drag in the direction you want to resize.
If an object is nearly the right size, you can make small adjustments to get it exactly the size you want.To resize objects one pixel at a time:
1. Select the object you want to resize.2. Place the mouse pointer over an edge or
corner of the object until it is a double-headed arrow.
3. Press an arrow key in the direction you want to resize the object.The edge of the object moves one pixel in the direction of the arrow key.
Deleting objectsUse the Selection tool to remove data boxes and other objects from a form.To remove objects from a form:
1. Click the Selection tool on the Form tool-bar.
2. Select the object you want to delete.
TIP: Use Shift+click to select multiple objects.
3. Do one of the following:• Click Edit>Clear.• Use the Backspace key.The object is removed from the form.
Reversing and restoring changesUse the Main Toolbar icons or the Edit menu to reverse or restore recent changes to a form.
326 FormsChapter 18
To reverse or restore changes:Click Edit>Undo to reverse a change., or click the Undo icon.Click Edit>Redo. to reverse a change., or click the Redo icon.
NOTE: Undo and Redo work over multiple changes. Either command can be used repeat-edly to reverse multi-step operations.
Ordering objectsThe Bring to Front and Send to Back commands place data boxes in a specific sequence. They have two effects:
• Select which overlapping data box is on top.
• Set the order in which the cursor moves when you press the Tab key.
To put a box on top or bottom:
1. Click the box to select it.2. Do one of the following:
• Click Edit>Bring to Front to put it on top, or
• Click Edit>Send to Back to put it on the bottom
The order in which data boxes are created is the order in which the cursor moves as you press the Tab key. You can set which data box the cursor moves to first or last. To set the cursor to move to a data box first:
1. Select the data box.2. Click Edit>Send to Back.3. Press the Tab key.
The cursor moves to the box you set. To set the cursor to move to a data box last:
1. Select the data box.2. Click Edit>Bring to Front.
The box you set is the last box the cursor moves to when you press Tab repeatedly.
Aligning and distributing objectsYou can line up objects relative to each other by aligning them and space objects at an equal distance apart by distributing them.
NOTE: In framed dialog boxes, the inner data box is aligned, not the frame.
To line up objects on a form:
1. Press the Shift key and click the objects to align.
ChemBioFinder & BioViz 327User Guide
2. Use the Edit>Align submenu to take the appropriate action:
The form objects line up according to your choice.
To space objects on a form evenly:
1. Press the Shift key and click the objects to distribute.
2. Use the Edit>Distribute submenu to take the appropriate action:
The form objects are spaced according to your choice.
Changing form layoutChanging a form layout is the same as auto-matically creating a new form. When you have created a new form, you can use it to replace the old form or save it as an alternate form. See “Creating forms automatically” on page 311. for details.
Securing formsYou can control the options available to users of your forms by setting the security options. You can also provide the database connection information used to log on to an MS Access database. MS Access provides a security sys-tem that allows the creation and management of usernames and passwords, and the assign-ment of permissions to those usernames. MS username password account information is stored in the Workgroup Information file (.mdw, .mda). For more information about securing an MS Access database, See “Open-ing a secured MS Access database” on page 335.
Table 24 Object alignment options
If you want to line up along the
Then choose
top edge of the first object you place on the form
Top.
middle of an object in a vertical line
Vertical Center.
bottom edge of an object
Bottom.
left edge of an object
Left.
middle of an object in a horizontal line
Horizontal Center.
right edge of an object
Right.
Table 25 Object spacing options
If you want to space objects evenly between the
Then choose
outer boxes of the form
Vertically.
left and right of the form
Horizontally.

328 FormsChapter 18
Setting security optionsTo set what ChemBioFinder 12.0 form options are available to users:
1. Right-click in the form you want to secure, and click the Properties.The Box Properties Dialog box appears, with the Form tab displayed.
2. Click Security.
NOTE: The Security button does not appear if the security on your form has been set to not allow access to the Security options.
The Form Security dialog box appears.
Figure 18.11 The Form Security dialog box
TIP: The lower left corner of the dialog box indicates whether security is defined.
3. Type the Username to use for logon in the Username box. The Enable button becomes available.
4. Type the Password to use for logon in the Password box.
NOTE: Use of a password is optional.
5. To enforce Workgroup Security in an MS Access Workgroup Administrator database
you must specify a Workgroup Information File. Take the appropriate action:
NOTE: Enforcing workgroup security is optional.
The following steps refer to the options in the Enable/Disable section of the dialog box.
1. Click the plus sign (+) next to Database Security to display the options; take the appropriate action:
Table 26 Workgroup naming options
If you want to Then
enter a work-group file name
Type the name of the MS Access Workgroup database in the Work-group Information File box.
browse for the workgroup file
Click File and select the file.
Table 27 Database security options
If you want users to...
then select...
be prompted to log on with a username password to open a form
Password to open form
use a username pass-word to log on to the MS Access database (MDB files)
Logon to MS Access database

ChemBioFinder & BioViz 329User Guide
2. Click the plus sign (+) next to Forms to dis-play the options; take the appropriate action:
3. Click the plus sign (+) next to Automation to display the options; take the appropriate action:
be prompted to log on to a database with a username pass-word when the form is open
Prompt for data-base logon
use a username pass-word to open the molecule database (MST files)
Protect molecule database
be able to access the Form Security dialog box
Security dialog available.
encounter all of the above options
Database security.
Table 28 Forms security options
If you want users to...
Then select...
open or create data-bases
Open/create data-base
create forms Create new forms
open forms Open other forms
Table 27 Database security options
If you want users to...
then select...
edit forms Save changed forms
change the layout of a form
Change form layout
use all of the above options
Forms
Table 29 Automation security options
If you want users to Then click
access OLE automa-tion writing and programming
Allow CAL/OLE Automation access
NOTE: Must be checked to enable export to Excel
use scripts Can use scripts menu
edit scripts Edit scripts
use all of the above options
Automation
Table 28 Forms security options
If you want users to...
Then select...

330 FormsChapter 18
4. Click the plus sign (+) next to Edit to dis-play the options; take the appropriate action:
5. Click the plus sign (+) next to Browse to display the options; take the appropriate action:
6. Click the plus sign (+) next to Search to dis-play the options; take the appropriate action:
Table 30 Editing security options
If you want users to Then click
clear forms Clear
delete relational and structural data
Cut
copy relational and structural data and multiple table rows to the clipboard
Copy
paste relational and structural data from the clipboard
Paste
Perform all of the above functions
Cut/copy/paste
Table 31 Browsing security options
If you want users to Then click
browse databases Browse database records
view data in forms in a table
View form as table
view data in contin-uous view
View in continuous forms view
edit and view struc-tures in Chem & Bio Draw
Edit/view struc-tures in Chem & Bio Draw
view structures in Chem & Bio 3D
View structures in Chem & Bio 3D
perform all of the above options
Browse
Table 32 Searching security options
If you want users to Then click
submit queries Query database records
use current hit list for searching
Search over current list
search the entire data-base
Search over full database
save and manipulate hit lists
Enable hit list tools
search exact structure only
Full structure
search substructures only
Substructure
search similar struc-tures only
Similarity
Table 31 Browsing security options
If you want users to Then click

ChemBioFinder & BioViz 331User Guide
7. Click the plus sign (+) next to Update records to display the options; take the appropriate action:
8. To allow users to import data SDFiles or RDFiles select Import data.
9. To allow users to export data, including delimited text files select Export data
10.Click the plus sign (+) next to Print to dis-play the options; take the appropriate action:
To complete setting security:
1. Click Enable.2. Click OK.
The options you choose are applied to the form.
Disabling securityTo disable security and reset defaults:
1. Right-click in the form and click Properties.2. In the Form tab of the Form Properties dia-
log box, click Security.The Form Security dialog box appears.
3. In the Form Security dialog box, click Dis-able.The Validate Security dialog box appears.
NOTE: This form only appears if you entered a password when you enabled security. See “Setting security options” on page 328.
4. Enter your password, then click OK.Security is disabled and the defaults are reset. “Security Disabled” appears in the lower left corner of the Form Security dialog box.
Overriding securityIn order to edit security options, you must tem-porarily remove security. In this case, you should use the Override option rather than the Disable option.To temporarily disable security:
1. Right-click in the form and click Properties.
use all of the above options
Searching
Table 33 Update security options
If you want users to be able to
Then click
update database records
Update records
add database records Add new records
delete database records
Delete records
Table 34 Printing security options
If you want users to Then click
print a single record only.
Single record
Print several records Several records
Use print preview mode Print preview
Table 32 Searching security options
If you want users to Then click
perform all of the above functions
Table 34 Printing security options
If you want users to Then click

332 FormsChapter 18
2. In the Form tab of the Form Properties dia-log box, click Security.The Form Security dialog box appears.
3. In the Form Security dialog box, click Over-ride Security.The Validate Security dialog box appears.
NOTE: This form only appears if you entered a password when you enabled security. See “Set-ting security options” on page 328.
4. Enter your password, then click OK.You are allowed to edit the security options. “Security Overridden” appears in the lower left corner of the Form Security dialog box.
5. When you have completed your changes, click Override Security to toggle security back on. “Security Enabled” appears in the lower left corner of the Form Security dialog box.

ChemBioFinder & BioViz 333User Guide
DatabasesYou work with data within ChemBioFinder 12.0 by entering it into a database, editing it, and interfacing with Chem & Bio Draw and Chem & Bio 3D.You can perform all of these functions on data using the commands in the menus, or you can use the buttons in the Record toolbar for most of these functions.
Figure 19.1 Database functions on the Record toolbar
Selecting a databaseA ChemBioFinder 12.0 form does not store data directly, but is simply the window through which you look at data. When creating a form, you need to specify the source of the data to display. A form displays data from a single
table in a database. To specify the data source for a form, you must open or create a database, and then select a table.If you want to view data from more than one table, you must create a form for each table. Typically, you create a main form for one main table and a subform for each other table. For more information, See “Relational Data and Subforms” on page 399.You can connect a database to the form before creating boxes, or any time after. If the form is already connected to a database, you can change the database or the data source. If the form has boxes with fields connected to them, then the boxes automatically connect to fields of the same name in the newly-opened data-base.
Opening an existing chemical databaseTo open a database to associate with a form:
1. Right-click on the form and click Data Source.The Form Properties dialog box appears.
19
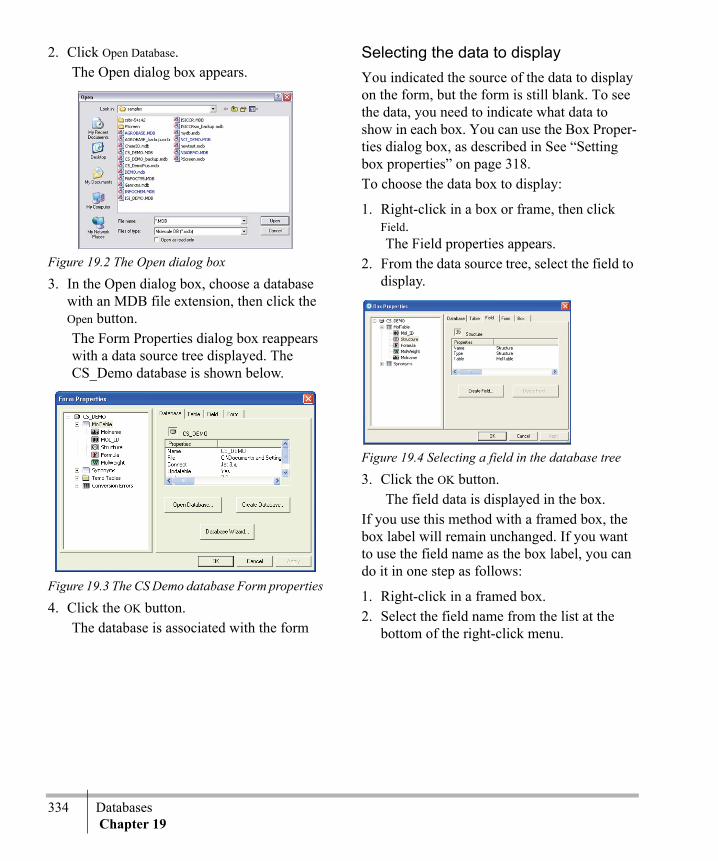
334 Databases Chapter 19
2. Click Open Database. The Open dialog box appears.
Figure 19.2 The Open dialog box
3. In the Open dialog box, choose a database with an MDB file extension, then click the Open button.The Form Properties dialog box reappears with a data source tree displayed. The CS_Demo database is shown below.
Figure 19.3 The CS Demo database Form properties
4. Click the OK button.The database is associated with the form
Selecting the data to displayYou indicated the source of the data to display on the form, but the form is still blank. To see the data, you need to indicate what data to show in each box. You can use the Box Proper-ties dialog box, as described in See “Setting box properties” on page 318.To choose the data box to display:
1. Right-click in a box or frame, then click Field.The Field properties appears.
2. From the data source tree, select the field to display.
Figure 19.4 Selecting a field in the database tree
3. Click the OK button.The field data is displayed in the box.
If you use this method with a framed box, the box label will remain unchanged. If you want to use the field name as the box label, you can do it in one step as follows:
1. Right-click in a framed box. 2. Select the field name from the list at the
bottom of the right-click menu.

ChemBioFinder & BioViz 335User Guide
The frame receives the field name and the data is displayed in the box.
Figure 19.5 Selecting a field name from the context menu.
Opening a secured MS Access databaseTo open a secured Microsoft Access database in ChemBioFinder 12.0, you need to set the appropriate permissions in MS Access.
NOTE: If your database was created in MS Access 97 (as, for example, were some of the ChemBioFinder 12.0 sample databases), and you are using a newer version of Access, you must convert the database before you can edit it. These instructions assume a database cre-ated in Access 2002. Other versions may differ slightly as to options and procedures.
To set the permissions:
1. Open the desired database in MS Access.
2. Click Tools>Security>User and Group Permissions.
Figure 19.6 User and Group Permissions dialog box
3. Select the Users or Groups radio button to assign permissions to individuals or groups.
4. Select an Object Type from the drop-down menu.
5. Select the permissions you want to assign for that object type to each user or group.
6. Click the Apply button.7. When you have finished assigning permis-
sions, click the OK button.8. Open the database in ChemBioFinder 12.0.
Creating a databaseYou can create a new, empty database and associate it with a form.To create a database:
1. Open an existing form, or create a new one.2. Right-click in the form and click Properties.
The Box Properties dialog box appears.3. Click the Box Properties Database tab, then
click the Create Database... button.The Save As dialog box appears.
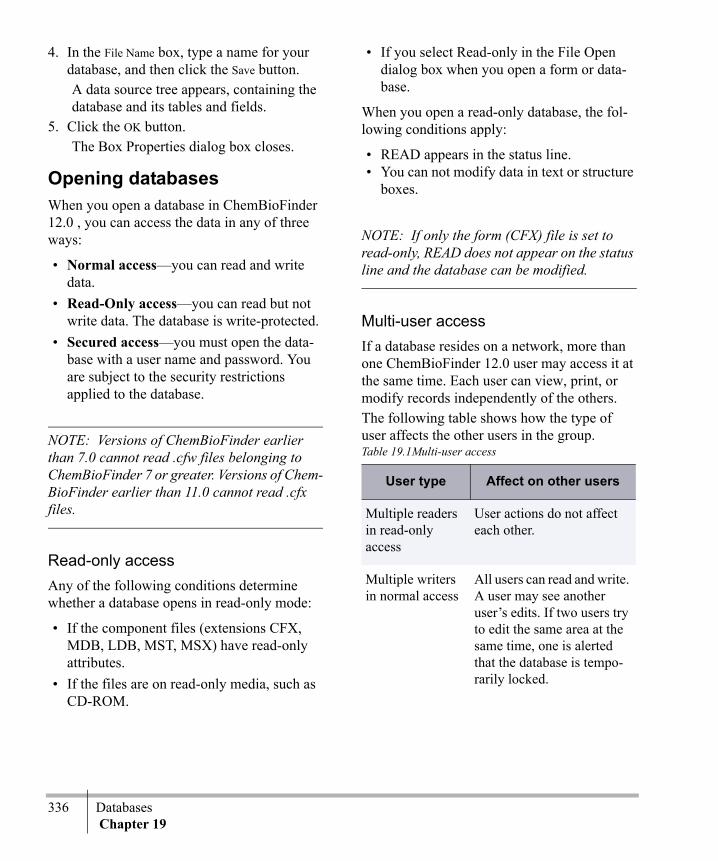
336 Databases Chapter 19
4. In the File Name box, type a name for your database, and then click the Save button.A data source tree appears, containing the database and its tables and fields.
5. Click the OK button.The Box Properties dialog box closes.
Opening databasesWhen you open a database in ChemBioFinder 12.0 , you can access the data in any of three ways:
• Normal access—you can read and write data.
• Read-Only access—you can read but not write data. The database is write-protected.
• Secured access—you must open the data-base with a user name and password. You are subject to the security restrictions applied to the database.
NOTE: Versions of ChemBioFinder earlier than 7.0 cannot read .cfw files belonging to ChemBioFinder 7 or greater. Versions of Chem-BioFinder earlier than 11.0 cannot read .cfx files.
Read-only accessAny of the following conditions determine whether a database opens in read-only mode:
• If the component files (extensions CFX, MDB, LDB, MST, MSX) have read-only attributes.
• If the files are on read-only media, such as CD-ROM.
• If you select Read-only in the File Open dialog box when you open a form or data-base.
When you open a read-only database, the fol-lowing conditions apply:
• READ appears in the status line.• You can not modify data in text or structure
boxes.
NOTE: If only the form (CFX) file is set to read-only, READ does not appear on the status line and the database can be modified.
Multi-user accessIf a database resides on a network, more than one ChemBioFinder 12.0 user may access it at the same time. Each user can view, print, or modify records independently of the others.The following table shows how the type of user affects the other users in the group.Table 19.1Multi-user access
User type Affect on other users
Multiple readers in read-only access
User actions do not affect each other.
Multiple writers in normal access
All users can read and write. A user may see another user’s edits. If two users try to edit the same area at the same time, one is alerted that the database is tempo-rarily locked.
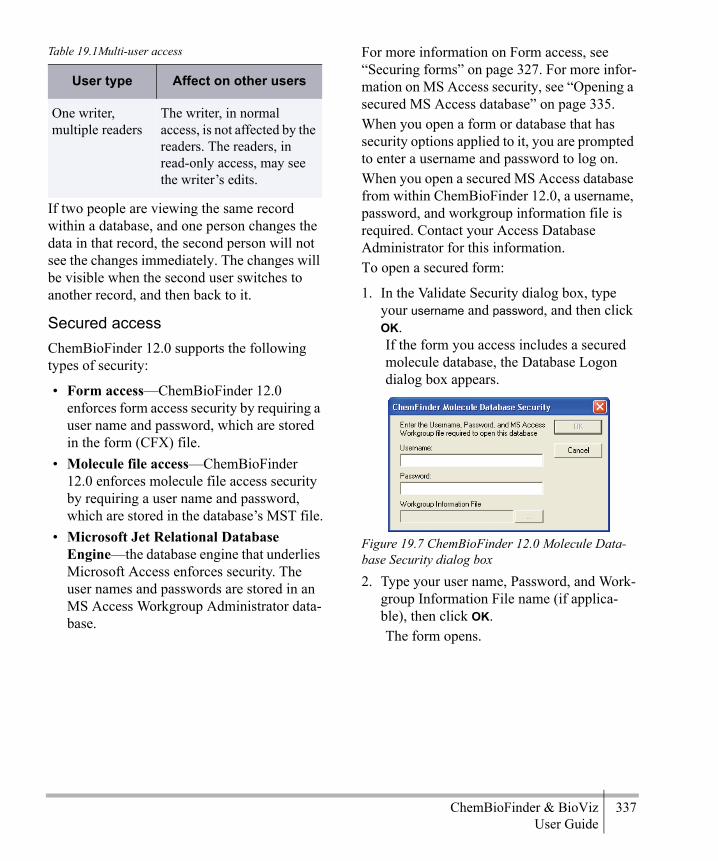
ChemBioFinder & BioViz 337User Guide
If two people are viewing the same record within a database, and one person changes the data in that record, the second person will not see the changes immediately. The changes will be visible when the second user switches to another record, and then back to it.
Secured accessChemBioFinder 12.0 supports the following types of security:
• Form access—ChemBioFinder 12.0 enforces form access security by requiring a user name and password, which are stored in the form (CFX) file.
• Molecule file access—ChemBioFinder 12.0 enforces molecule file access security by requiring a user name and password, which are stored in the database’s MST file.
• Microsoft Jet Relational Database Engine—the database engine that underlies Microsoft Access enforces security. The user names and passwords are stored in an MS Access Workgroup Administrator data-base.
For more information on Form access, see “Securing forms” on page 327. For more infor-mation on MS Access security, see “Opening a secured MS Access database” on page 335. When you open a form or database that has security options applied to it, you are prompted to enter a username and password to log on.When you open a secured MS Access database from within ChemBioFinder 12.0, a username, password, and workgroup information file is required. Contact your Access Database Administrator for this information.To open a secured form:
1. In the Validate Security dialog box, type your username and password, and then click OK.If the form you access includes a secured molecule database, the Database Logon dialog box appears.
Figure 19.7 ChemBioFinder 12.0 Molecule Data-base Security dialog box
2. Type your user name, Password, and Work-group Information File name (if applica-ble), then click OK.The form opens.
One writer, multiple readers
The writer, in normal access, is not affected by the readers. The readers, in read-only access, may see the writer’s edits.
Table 19.1Multi-user access
User type Affect on other users

338 Databases Chapter 19
Browsing databasesYou can browse a database using the buttons on the Record toolbar.
Figure 19.8 Browse functions on the Record toolbar
To Browse:
• Click First Record to display the first record in the database.
• Click Previous Record to display the record before the currently shown record.
• Click Next Record to display the record after the currently shown record.
• Click Last Record to display the last record in the database.
NOTE: The current record number is displayed in the Status Bar.
Go directly to a specific record as follows:
1. Click Record>Go To Record.The Record Number dialog box appears.
2. Type the number of the record (within the current list) to display, and click OK.The specified record is displayed.
NOTE: Record numbers are temporary, refer-ring only to positions within the current list in its current sort order. For example, if you have
done a search that found ten hits, then the only valid record numbers are 1–10. If you want to move to a specific absolute location in a data-base, you must run a search for a value in a field that identifies that location.
The data tableSometimes browsing through a data record set is more convenient if the data is presented in tabular format.
NOTE: You cannot add or modify records while viewing data in a table.
To display data in a table:Click View>Data Table>In Separate Window (or type Ctrl+T).A list window containing the fields and records in the form appears.
Figure 19.9 Data Table view in a separate window
To display a particular record in the form: Click the record’s entry in the list window.
By default, the fields in the Data Table are dis-played in the order in which they were created.To reorder the columns in the Data Table:
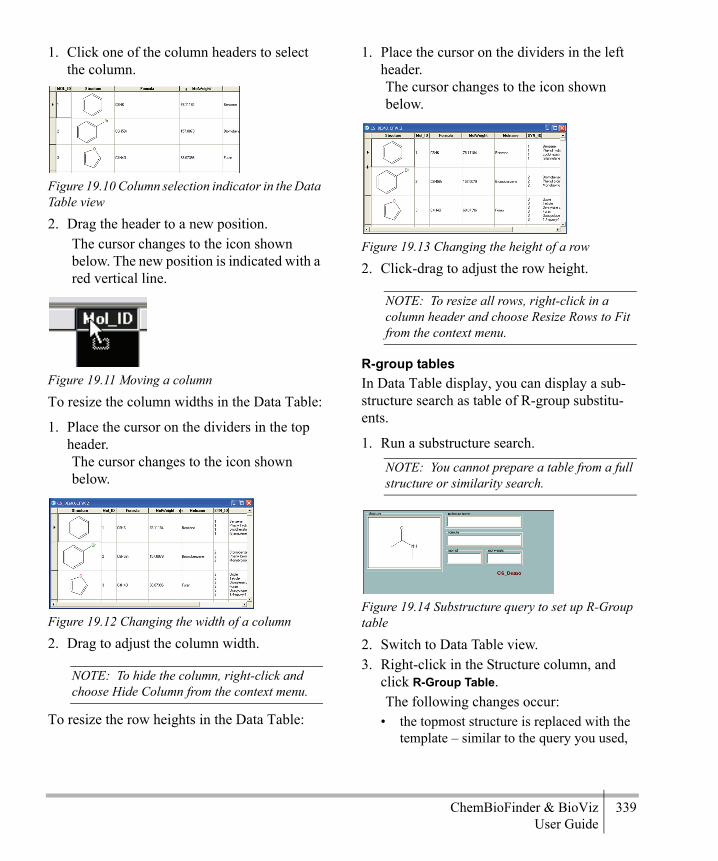
ChemBioFinder & BioViz 339User Guide
1. Click one of the column headers to select the column.
Figure 19.10 Column selection indicator in the Data Table view
2. Drag the header to a new position. The cursor changes to the icon shown below. The new position is indicated with a red vertical line.
Figure 19.11 Moving a column
To resize the column widths in the Data Table:
1. Place the cursor on the dividers in the top header. The cursor changes to the icon shown below.
Figure 19.12 Changing the width of a column
2. Drag to adjust the column width.
NOTE: To hide the column, right-click and choose Hide Column from the context menu.
To resize the row heights in the Data Table:
1. Place the cursor on the dividers in the left header. The cursor changes to the icon shown below.
Figure 19.13 Changing the height of a row
2. Click-drag to adjust the row height.
NOTE: To resize all rows, right-click in a column header and choose Resize Rows to Fit from the context menu.
R-group tablesIn Data Table display, you can display a sub-structure search as table of R-group substitu-ents.
1. Run a substructure search. NOTE: You cannot prepare a table from a full structure or similarity search.
Figure 19.14 Substructure query to set up R-Group table
2. Switch to Data Table view.3. Right-click in the Structure column, and
click R-Group Table.The following changes occur:
• the topmost structure is replaced with the template – similar to the query you used,
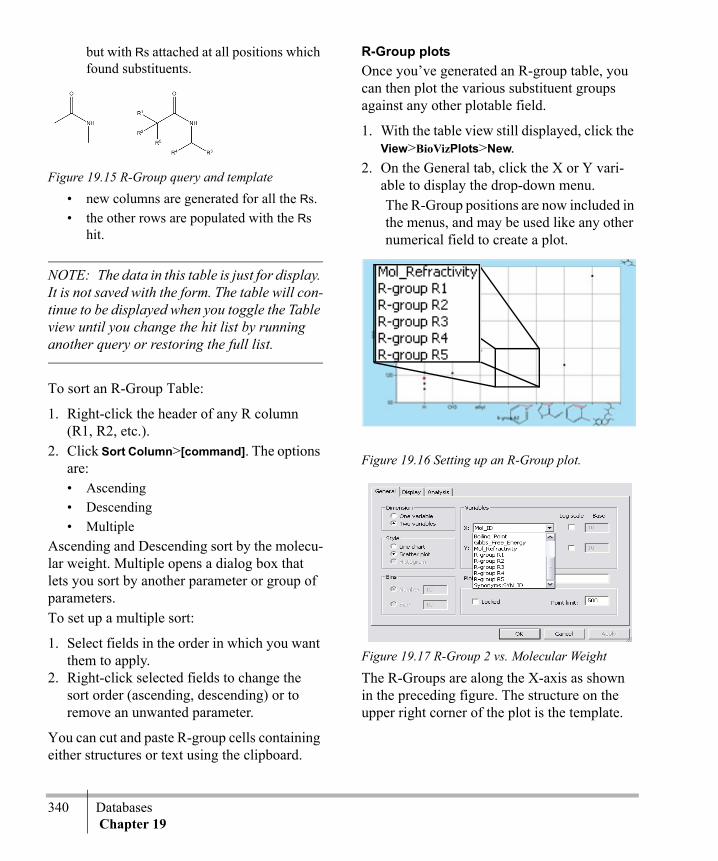
340 Databases Chapter 19
but with Rs attached at all positions which found substituents.
Figure 19.15 R-Group query and template• new columns are generated for all the Rs.• the other rows are populated with the Rs
hit.
NOTE: The data in this table is just for display. It is not saved with the form. The table will con-tinue to be displayed when you toggle the Table view until you change the hit list by running another query or restoring the full list.
To sort an R-Group Table:
1. Right-click the header of any R column (R1, R2, etc.).
2. Click Sort Column>[command]. The options are:• Ascending• Descending• Multiple
Ascending and Descending sort by the molecu-lar weight. Multiple opens a dialog box that lets you sort by another parameter or group of parameters. To set up a multiple sort:
1. Select fields in the order in which you want them to apply.
2. Right-click selected fields to change the sort order (ascending, descending) or to remove an unwanted parameter.
You can cut and paste R-group cells containing either structures or text using the clipboard.
R-Group plotsOnce you’ve generated an R-group table, you can then plot the various substituent groups against any other plotable field.
1. With the table view still displayed, click the View>BioVizPlots>New.
2. On the General tab, click the X or Y vari-able to display the drop-down menu.The R-Group positions are now included in the menus, and may be used like any other numerical field to create a plot.
Figure 19.16 Setting up an R-Group plot.
Figure 19.17 R-Group 2 vs. Molecular Weight
The R-Groups are along the X-axis as shown in the preceding figure. The structure on the upper right corner of the plot is the template.
RGroupPlot.tif

ChemBioFinder & BioViz 341User Guide
Creating a databaseInstead of opening an existing database, you may want to create a new, empty one. To create a new database using the automatic form generation technique, See “Tutorial 3: Creating a database” on page 296.. The follow-ing procedure results in a simple database with one table for storing structures. To create a database:
1. Right-click in the form and click Properties.2. On the Database tab, click the Create Data-
base.The Save As dialog box appears.
3. Choose the directory to which you want to save the database.
4. Specify a name for the database, and click Save.
ChemBioFinder 12.0 creates the database con-taining one table (called MolTable) with four fields:
• Structure• Formula• Molecular weight• Mol_ID
The Mol_ID field corresponds to a column in the table where a numeric ID is automatically entered as each structure is registered. The other fields represent information stored in the structural portion of the database, linked to the assigned ID.The Formula and Molecular weight data are automatically calculated from a structure. These internal fields cannot be edited or deleted.After creating a database, you can create fields for storing other types of data. It is not neces-
sary to create the entire set of fields before working with the database. You may add more fields later.
Creating tablesThere is no limit to the number of tables a data-base can contain. You may want multiple tables in a database in order to manage rela-tional data, or simply to organize different col-lections of information in the same place. A table must contain at least one column. When you create a new table, ChemBioFinder 12.0 creates a numeric column called ID. You can use this column to store integer data, or delete it and replace it with your own columns.Table names must:
• Begin with a letter• Not contain punctuation characters• Not be the same as a table already on dis-
play
To create a new, empty table:
1. Right-click in the form and click Properties.The Box Properties dialog box appears.
2. Click the Table tab.The Table tab appears:
3. Click the Create Table... .The Create Table dialog box appears.
4. Type a name for the new table, then click OK.The table appears in the Data Source tree.
Deleting tablesTo delete a table from the database:
1. Right-click in the form and click Properties.The Box Properties dialog box appears.
2. Click the Table tab.The Table tab appears:

342 Databases Chapter 19
3. In the data source tree, select the table to delete.
4. Click the Delete Table... .A dialog box appears giving you the option of completing the deletion or cancelling.
5. Click Yes to delete the table.The table and all data it contains are immediately deleted from the database.
CAUTION
You cannot undo a deleted table. Before you delete a table, create a backup copy of the data-base to prevent accidental loss of data. For more information, see “Backing up databases” on page 346.
Attaching tables from other applicationsYou can use ChemBioFinder 12.0 to add chemical structures to a database you have already developed. If your database was devel-oped in Microsoft Access, you can open it directly in ChemBioFinder 12.0. can also work with data from other file-based databases such as dBASE and xBase clones, but in this case you must open or create a ChemBioFinder 12.0 database and attach the table to link to tables in the data source. After you attach a table, it appears and functions as if it were part of your local ChemBioFinder 12.0 database.The procedure you use depends on whether the tables you want to attach are from a file-based (Access, FoxPro, dBASE) or non file-based (Oracle) database system.
Attaching files from a file-based databaseTo attach a file-based database table:
1. Right-click in the form and click Properties.2. Click the Table tab, then click the Attach
Table. The Attach Table dialog box appears.
3. Click the Open MS Access Database... .The Open dialog box appears.
NOTE: The list of file types available in the Attach Table Open dialog varies from one computer to another. The files for which you have drivers installed shown. For example, if Paradox is not installed, you may not have Paradox drivers on your system or in the drop-down list.If the database type you wish to access is not on the list, it may not be a file-based system, and you need to connect using ODBC. For detailed instructions, see “Attaching files from a non file-based database” on page 342.
4. Choose the database to access, then click OK.
5. In the tree diagram, click the table you want to attach, then click OK.The newly-attached table appears in the tree diagram in the Form Properties dialog box.
6. Click the Form Properties OK.
Attaching files from a non file-based databaseIf the database you want to attach is not file-based, such as Oracle, you can attach it using Microsoft's Open Database Connectivity (ODBC).To attach a non-file-based database table:
1. Right-click in the form and click Properties.2. Click the Table tab, then click the Attach
Table. The Attach Table dialog box appears.
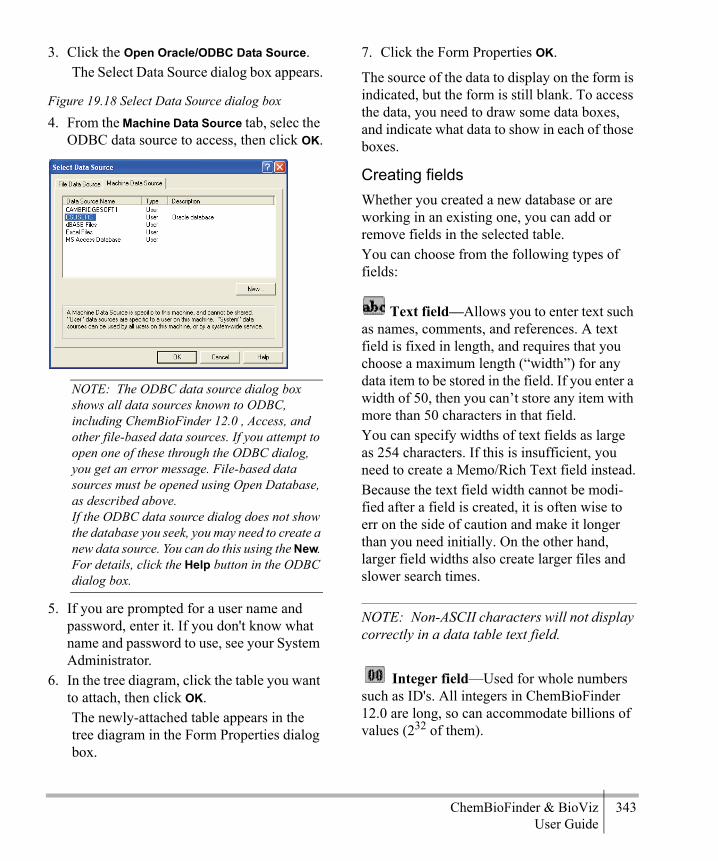
ChemBioFinder & BioViz 343User Guide
3. Click the Open Oracle/ODBC Data Source.The Select Data Source dialog box appears.
Figure 19.18 Select Data Source dialog box
4. From the Machine Data Source tab, selec the ODBC data source to access, then click OK.
NOTE: The ODBC data source dialog box shows all data sources known to ODBC, including ChemBioFinder 12.0 , Access, and other file-based data sources. If you attempt to open one of these through the ODBC dialog, you get an error message. File-based data sources must be opened using Open Database, as described above.If the ODBC data source dialog does not show the database you seek, you may need to create a new data source. You can do this using the New. For details, click the Help button in the ODBC dialog box.
5. If you are prompted for a user name and password, enter it. If you don't know what name and password to use, see your System Administrator.
6. In the tree diagram, click the table you want to attach, then click OK.The newly-attached table appears in the tree diagram in the Form Properties dialog box.
7. Click the Form Properties OK.
The source of the data to display on the form is indicated, but the form is still blank. To access the data, you need to draw some data boxes, and indicate what data to show in each of those boxes.
Creating fieldsWhether you created a new database or are working in an existing one, you can add or remove fields in the selected table.You can choose from the following types of fields:
Text field—Allows you to enter text such as names, comments, and references. A text field is fixed in length, and requires that you choose a maximum length (“width”) for any data item to be stored in the field. If you enter a width of 50, then you can’t store any item with more than 50 characters in that field. You can specify widths of text fields as large as 254 characters. If this is insufficient, you need to create a Memo/Rich Text field instead.Because the text field width cannot be modi-fied after a field is created, it is often wise to err on the side of caution and make it longer than you need initially. On the other hand, larger field widths also create larger files and slower search times.
NOTE: Non-ASCII characters will not display correctly in a data table text field.
Integer field—Used for whole numbers such as ID's. All integers in ChemBioFinder 12.0 are long, so can accommodate billions of values (232 of them).
344 Databases Chapter 19
Double field—Used for real numbers such as physical constants and unit prices. Real numbers in ChemBioFinder 12.0 are double-precision. In ChemBioFinder 12.0 12, double fields can serve as ID fields.
Picture field—Allows you to store a bit-map file (BMP,GIF, JPEG, PNG, or TIFF) or Windows metafile (WMF, EMF), such as a spectrum or experimental setup, as a data item in a database. A Picture box on a form may be used to dis-play a static picture attached to the form, such as a logo, or it may be used to show pictures stored in the database which change as you move from record to record. If you import a database containing pictures (type Long Binary or BLOB) they will be interpreted as pictures and the form generator will create a picture box for it.
Memo/Rich Text field—Used to display text. Memo fields can be of any length. Because memo fields are less structured, searching them can be slower than searching a text field. Additionally, memo fields cannot be sorted. To search for text:
1. Right-click in a memo or plain text field and select Find Text.The Find Text dialog box appears.
2. Enter the text and the match conditions.3. Click either the Forward or Backward to
search.4. To search for the next occurrence, do one of
the following:• Click Find Next.• Use the F3 key.
Memo fields can store Styled Text. For more information, see “Styled text” on page 352.
Date field—Allows you to store dates. The dates are displayed according to the set-tings in the Windows Regional Settings control panel.
Structure field—Consists of four fields: a numeric ID stored in the relational database, plus three fields (Structure, Formula, Mol-Weight) that take data from the Chem-BioFinder 12.0 structure database files.
Boolean—Used with check boxes. When searching Boolean fields, you can only search for ON. This is because ChemBioFinder 12.0 automatically clears all fields when activating the Queries form.You can create more than one set of structure fields in a table. Each is assigned a unique set of names, and each refers to its own ID column in the table, although all structural data is taken from the same structure database files.To create a field:
1. Right-click in the form and click Properties.The Box Properties dialog box appears.
2. Click the Field tab.The Field properties appear.
3. Click the Create Field. The Create Field dialog box appears.
4. In the Name box, type a name.5. In the Type box, choose a data type from the
drop-down menu.6. For text fields only, type a width (number
of characters) in the Width box, or use the thumb wheels to select a value.
7. Click OK.The name of the new field appears in the data source tree.
m

ChemBioFinder & BioViz 345User Guide
Deleting fieldsJust as you can create any field and assign it to a data box at any time, you can modify the database by deleting fields from the selected table.To delete a field:
1. Right-click in the form and click Properties.The Box Properties dialog box appears.
2. Click the Field tab.The Field properties appear.
3. In the field list, select the field to be deleted.
4. Click the Delete Field.5. When prompted whether you want to delete
the selected field, click OK to delete or click Cancel to leave it unmodified.
CAUTION
When you delete a field, all data contained in the field is also deleted. You are not warned explicitly about this.
Adding multiple structuresYou can include more than one structure on the same form by creating multiple structure col-umns in a table. Each structure column you create represents four types of data:
• The structure displayed as a diagram.• The Molecule ID, which connects the struc-
ture to a record in a relational table.• The formula derived from the structure.• The molecular weight derived from the
structure.
To create multiple structure columns in a table:
1. Click File>Database.The Form Properties dialog box appears.
2. Create or open a database.3. Click the Field tab.4. Select the Table in which you want to create
new structure columns.5. Click the Create Field.
The Create Field dialog box appears.6. Select Structure from the Type drop-down
list.An uneditable name is assigned to the field.
7. Click OK.Four new fields appear in the list and are named to belong to the same set of structure columns.
8. Connect the new fields to boxes by right-clicking on the appropriate data box and choosing the field from the context menu field list.
Non-chemical databasesIf you opened a database that you created using a program other than ChemBioFinder 12.0 and you want to add structures to it, you can create structure fields in any modifiable (non-attached) table.To create a structure field:
1. Open a database.2. Right click and select Properties.3. In the database tree, click the table to which
you want to add structures.4. Click the Field tab.5. Click the Create Field.
The Create Field dialog box appears.6. Choose Structure from the Type drop-down
list, then click OK.
You do not provide a name or other details when you create Structure columns. Chem-

346 Databases Chapter 19
BioFinder 12.0 automatically creates four col-umns and names them. These columns contain no data until you enter structures into the data-base.
Backing up databasesTo back up the current ChemBioFinder 12.0 database:
1. Click File>Copy Database.A Save As dialog box appears. By default, your copy is named YourDatabase_copy.cfx.
2. Rename your copy (if you wish), select a location, and click OK.A complete set of ChemBioFinder 12.0 database files is created in the selected location.
Moving databasesChemBioFinder 12.0 saves only the definition of the form and information for connecting to the database in the CFX file. The actual data are stored in files with MSX and MST exten-sions for structure data, and in files with an MDB extension for non-structural data. If you want to move a database to another computer, you must move (for a default ChemBioFinder 12.0 database) at least four separate files. This number might be greater if you have several forms that access the same database.
NOTE: The MSX, MST, and MDB files all have the same file name, but the name of the CFX files might be different depending on how you saved them.
After you move the database to its new loca-tion, open your forms to make sure the data source links have been retained. If Chem-
BioFinder 12.0 cannot locate the data source and displays an empty form, you will need to use the File>Database menu command to reconnect to the data source.If the form is connected to a remote data source on a network, you have fewer files to move. The data source can remain on the remote machine, and you only move the CFX file that contains your form for accessing the data. You may need to reconnect it to the data source if it is not done automatically. This situ-ation is common in large organizations where several people access the same central data source.
Creating a portal databaseTo carry out certain operations, such as sorting structural data, ChemBioFinder 12.0 needs to create temporary tables in a database. This can-not be done in a read-only source such as a data CD.Instead of accessing the read-only source directly, you can create a portal database–a local, writable database with attachments to the external tables of interest. The portal looks and behaves just like the target database, but with-out the limitations. ChemBioFinder 12.0 creates a portal database when needed. For example, if you are using a database CD, perform a search, and attempt to sort by formula, a message appears that offers to create a local database, attach the current table, save the form, and proceed with the sort. If you create the local database, you can use the new form to get the data with full function-ality and performance.
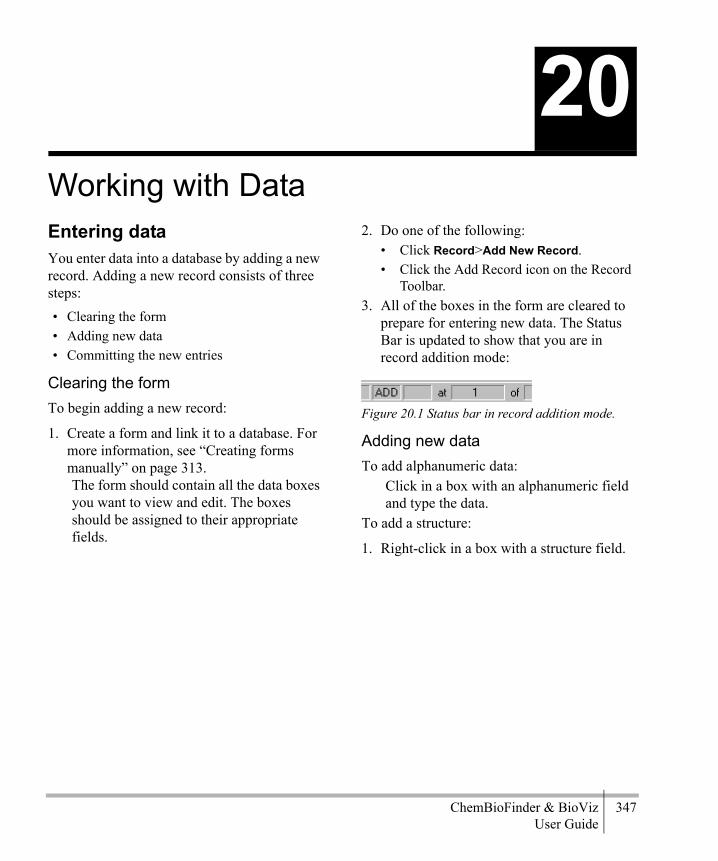
ChemBioFinder & BioViz 347User Guide
Working with DataEntering data You enter data into a database by adding a new record. Adding a new record consists of three steps: • Clearing the form• Adding new data• Committing the new entries
Clearing the formTo begin adding a new record:
1. Create a form and link it to a database. For more information, see “Creating forms manually” on page 313.The form should contain all the data boxes you want to view and edit. The boxes should be assigned to their appropriate fields.
2. Do one of the following:• Click Record>Add New Record.• Click the Add Record icon on the Record
Toolbar.3. All of the boxes in the form are cleared to
prepare for entering new data. The Status Bar is updated to show that you are in record addition mode:
Figure 20.1 Status bar in record addition mode.
Adding new dataTo add alphanumeric data:
Click in a box with an alphanumeric field and type the data.
To add a structure:
1. Right-click in a box with a structure field.
20
348 Working with DataChapter 20
2. Do one of the following:
NOTE: See the Chem & Bio Draw User’s Guide for information about using Chem & Bio Draw.
Committing the new dataWhen you finish entering all of the data items, do one of the following:
• Click the Commit button on the Add Record Toolbar.
• Click the Commit Changes icon on the Record Toolbar.
• Click Record>Commit Changes.• Perform another action such as moving to
another record or printing.
The new record is added to the database.
NOTE: Selecting Commit Changes (or moving to another record if you have two or more records) saves the data to the database. Do not use File>Save; clicking File>Save saves changes to the form layout, not changes to data in the database.
Duplicating recordsYou can create a new record by modifying an existing one. To duplicate a record:
Click Record>Duplicate Record.You are in Add Mode and the form fills with data from the previously displayed record. When you commit the changes, you create a new record whose fields contain the data displayed. Before committing the
Table 20:
If you want to... Then...
draw a structure, Chem & Bio Draw mode
1. Double-click in the structure box.The Chem & Bio Draw Control appears.
2. Draw the new structure in the Structure box.
3. Click outside to box to complete the structure.
draw a struc-ture, Chem-BioFinder 12.0 mode
1. Double-click in the structure box, or Right-click and select Edit in Chem & Bio Draw.Chem & Bio Draw opens.
2. Draw the new structure in the Chem & Bio Draw window.
3. Click File>Exit and Return to, or type Ctrl+W to return to ChemBioFinder 12.0 and insert the structure.
import a struc-ture, Chem-BioFinder 12.0 or Chem & Bio Draw mode
1. Right-click in the struc-ture box, and click Read Structure.The Open dialog box appears.
2. Browse to a structure file, then click OK.The file is inserted into ChemBioFinder 12.0.
ChemBioFinder & BioViz 349User Guide
duplicate, you can modify fields or structure and commit changes just as you would with any other new record.
NOTE: When duplicating records, only those fields that are visible on the form are dupli-cated. Data in fields present in the database but not visible on the form are not copied into the new record. The new record has a new Mol_ID.
Undoing data entryBefore committing a new data entry, you can revert the contents of the form to its previous unmodified state.To undo your changes, do one of the follow-ing:
• Click Record>Undo Changes.• Click the Undo Changes icon on the Record
Toolbar.
After you commit the changes, they cannot be undone.
Editing dataModifying the data in a database is performed by directly changing the data items on the form and committing those changes.
NOTE: The Formula and MolWeight fields are automatically calculated by ChemBioFinder 12.0 from the Structure field and cannot be edited by the user. The MOL_ID field is also set automatically by ChemBioFinder 12.0 and cannot be edited.
To edit data:Click the data box whose data item you want to edit.If you click on a Structure data or a picture box it is highlighted. If you click on a data box containing alphanumeric data, a cursor appears in the data box.
To edit alphanumeric data:
1. Replace it with the text or number you want.
2. Do one of the following:• Click Record>Commit Changes.• Click the Commit Changes icon. • Move to a different record.
NOTE: Moving to a different record always commits changes first.
Editing structuresYou can edit structures by using the Chem & Bio Draw drawing tools. You can also neaten the appearance of a structure by cleaning it up. The Clean Structure command is used to neaten the appearance of molecules by regularizing bond lengths and angles. Since the degree of change required cannot be determined a priori, the Clean Structure command begins gently. You may need to repeat the command to get the changes you wish. For more details about how the command works, see “Structure Clean Up” in Chapter 4: Advanced Drawing Techniques of the Chem & Bio Draw User’s Guide.Before committing a data entry, you can revert to the previous unmodified record by choosing Undo Changes from the Record menu.To edit structural data:
1. Do one of the following:

350 Working with DataChapter 20
• In Chem & Bio Draw mode: Double-click the structure box.
The Chem & Bio Draw Control appears.• In ChemBioFinder 12.0 mode: Double-
click the structure box.Chem & Bio Draw opens and the structure appears in the From ChemBioFinder 12.0 window.
• In either mode: Right-click in the structure box and click Edit in Chem & Bio Draw.
Chem & Bio Draw opens and the structure appears in the From ChemBioFinder 12.0 window.
2. Edit the structure.3. Click in the ChemBioFinder 12.0 form or
close the Chem & Bio Draw window by typing Ctrl+W when you are finished.
4. Click Record>Commit Changes. Click the Commit Changes icon, or move to a differ-ent record.The changes are stored.
To clean up a structure:
1. Right-click in the box containing the struc-ture, and click Clean Structure.
2. To save the cleaned up structure, do one of the following:• Click Record>Commit Changes.• Click the Commit Changes icon.
Working with structures using Chem & Bio DrawEnter or edit Chem & Bio Draw structures in data boxes of the Structure field type. You can work in Chem & Bio Draw directly, or work in the Structure data box using the Chem & Bio Draw Control. You choose the default in the Struc-ture data box Box Properties.
To set the preference:
1. Right-click in the Structure box.2. Click Properties.3. Use the drop-down menu in the Box Style
section to choose your default:• Chem & Bio Draw style to use the Chem & Bio
Draw Control.• ChemBioFinder 12.0 style to edit in Chem
& Bio Draw.
TIP: When Chem & Bio Draw style is the default, you still have the option of editing directly in Chem & Bio Draw. Just right-click in the Structure box and choose Edit in Chem & Bio Draw.
To edit a structure:Double-click in the structure data box.Chem & Bio Draw opens or the Chem & Bio Draw Control appears, depending on your default.
If you already have a structure in a data box, that structure appears in the edit window. You can modify and manipulate the structure just like any other Chem & Bio Draw structure. If there is no structure in the Structure data box, the edit window is blank. You can draw a structure to store in the ChemBioFinder 12.0 database. When you have finished, do one of the follow-ing:
• If you are editing in Chem & Bio Draw, click File>Exit and Return to Structure or type Ctrl+W.
• If you are editing with the Chem & Bio Draw Control, click outside the Structure box.
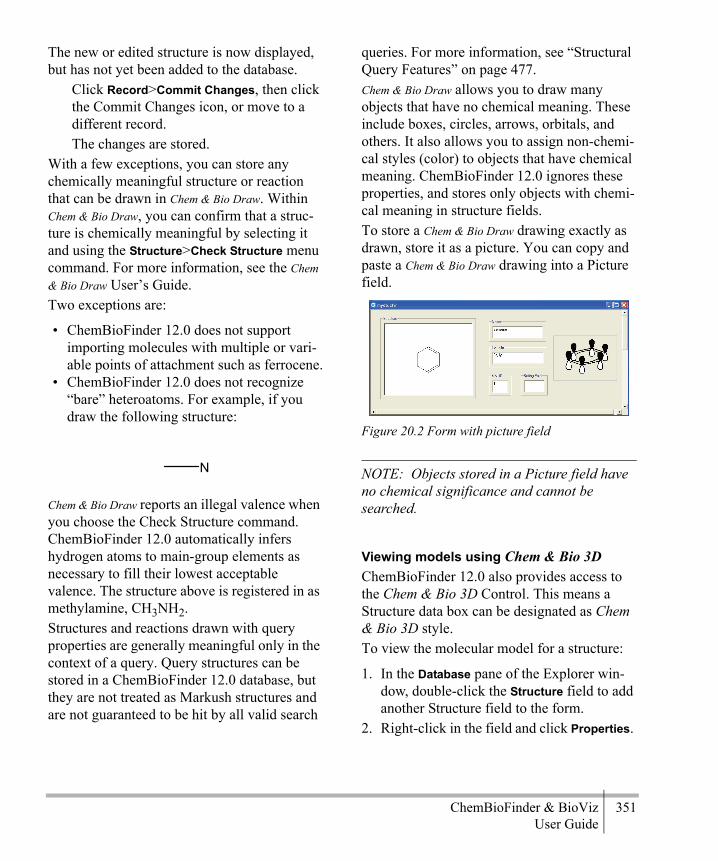
ChemBioFinder & BioViz 351User Guide
The new or edited structure is now displayed, but has not yet been added to the database.
Click Record>Commit Changes, then click the Commit Changes icon, or move to a different record.The changes are stored.
With a few exceptions, you can store any chemically meaningful structure or reaction that can be drawn in Chem & Bio Draw. Within Chem & Bio Draw, you can confirm that a struc-ture is chemically meaningful by selecting it and using the Structure>Check Structure menu command. For more information, see the Chem & Bio Draw User’s Guide. Two exceptions are:
• ChemBioFinder 12.0 does not support importing molecules with multiple or vari-able points of attachment such as ferrocene.
• ChemBioFinder 12.0 does not recognize “bare” heteroatoms. For example, if you draw the following structure:
Chem & Bio Draw reports an illegal valence when you choose the Check Structure command. ChemBioFinder 12.0 automatically infers hydrogen atoms to main-group elements as necessary to fill their lowest acceptable valence. The structure above is registered in as methylamine, CH3NH2. Structures and reactions drawn with query properties are generally meaningful only in the context of a query. Query structures can be stored in a ChemBioFinder 12.0 database, but they are not treated as Markush structures and are not guaranteed to be hit by all valid search
queries. For more information, see “Structural Query Features” on page 477.Chem & Bio Draw allows you to draw many objects that have no chemical meaning. These include boxes, circles, arrows, orbitals, and others. It also allows you to assign non-chemi-cal styles (color) to objects that have chemical meaning. ChemBioFinder 12.0 ignores these properties, and stores only objects with chemi-cal meaning in structure fields.To store a Chem & Bio Draw drawing exactly as drawn, store it as a picture. You can copy and paste a Chem & Bio Draw drawing into a Picture field.
Figure 20.2 Form with picture field
NOTE: Objects stored in a Picture field have no chemical significance and cannot be searched.
Viewing models using Chem & Bio 3DChemBioFinder 12.0 also provides access to the Chem & Bio 3D Control. This means a Structure data box can be designated as Chem & Bio 3D style. To view the molecular model for a structure:
1. In the Database pane of the Explorer win-dow, double-click the Structure field to add another Structure field to the form.
2. Right-click in the field and click Properties.
N

352 Working with DataChapter 20
3. In the Box Style section, select Structure (Chem & Bio 3D style) from the drop-down menu.The Structure field displays a 3D structure.
Figure 20.3 Form with 3D structure field.
To rotate the model or modify the display, dou-ble-click in the field. The default tool is the rotation tool, but it also can be used to select atoms or bonds. If you right-click in the field, the context menu displayed is the Chem & Bio 3D control context menu, giving you access to Chem & Bio 3D commands. See the Chem & Bio 3D User’s Guide for more information about using Chem & Bio 3D.
NOTE: Unlike interaction with Chem & Bio Draw, changes you make to a model within Chem & Bio 3D are not transmitted back to ChemBioFinder 12.0 , and thus are not saved. You can put a picture of the Chem & Bio 3D model into a database by saving the Chem & Bio 3D model as a bitmap or metafile and inserting it into a Picture field. The picture does not retain a connection table and cannot be edited.
Styled textMake changes to text fonts, sizes, styles, col-ors, and alignment with the tools on the Text menu or the Text Format toolbar. To display the Text Format toolbar, if it is not visible:
Click View>Toolbars>Text Format.The Text Format Tool appears.
.
1- font2- point size3- bold4- italics5- underline6- subscript7- superscript8- color9- left alignment10- center alignment11- right alignment12- bulletsUse the toolbar to format text in Plain Text or Memo/Rich Text data fields.
Undoing changesBefore committing your text changes, you can revert to the previous unmodified state.To undo your changes, do one of the follow-ing:
• Click Edit >Undo.

ChemBioFinder & BioViz 353User Guide
• Click the Undo icon on the Main Toolbar.
After you commit the changes, they cannot be undone.
Redoing changesWhen you undo an action, the Redo command becomes active. You can reverse the effect of the Undo command by choosing the Redo command.To redo the last action performed, do one of the following:
• Click Edit>Redo.• Click the Redo icon.
The last action undone is reinstated.
Deleting dataYou can delete the contents of individual fields by using the Delete or Backspace keys. You cannot delete a structure, formula, molecular weight or Mol_ID.To delete an entire record:
1. Move to the record that you want to delete using the Record commands or toolbar.
2. Do one of the following:• Click Record>Delete Record.• Click the Delete Record icon.The record is permanently removed.
NOTE: You can delete multiple records if you use the Table view.
Sorting dataYou can sort the database by most types of data in a form. Sorting on the Mol_ID field, the molecular weight field, or any other numeric field arranges the current list in increasing or
decreasing numeric order according to that field. Sorting on the structure field arranges the list by increasing number of atoms contained in the structure. Implicit hydrogens are not counted. Sorting on the formula field orders the records by increasing C-H-N count (for compounds containing carbon) followed alpha-betically by any other elements. Formulas for compounds without carbon are sorted in alpha-betical order. Sorting by text fields such as molecular name sorts the records alphabeti-cally.After sorting, the database must be reset to its original state before you can update it.
NOTE: You cannot edit records sorted by for-mula or molecular weight. However, if you attempt to sort on one of these fields, Chem-BioFinder 12.0 offers to set up a database (a portal database) which allows the operation. For details, see “Attaching tables from other applications” on page 342.
To sort on a field:
• In the Form View, right-click in the field you want to sort by, and click Sort>Ascend-ing or Sort>Descending.
• In the Data Table View, double-click on the table header of the field you want to sort by.
The table is sorted in ascending order by the column you selected. Double-clicking again will sort in descending order.
TIP: There is also a context menu option for sorting in Data Table view. Right-click in a col-umn and choose Sort Column.
354 Working with DataChapter 20
Sorting in languages other than EnglishText that you sort must be in the same lan-guage as the default language of the system on which the database was created, or an incorrect sort order can occur. The ChemBioFinder 12.0 sample databases, created in English, can be sorted correctly using the following languages:
• English• German • French• Portuguese• Italian• Modern Spanish
If you want to sort text in a different language than the one in which the database was created, perform the following procedure:
1. On a computer using the same language as the text you want to sort, open MS Access.
2. Open the MDB file you want to sort.3. Compact the database: click Tools>Data-
base Utilities>Compact Database.4. After the database is compacted, close MS
Access.The correct sort information is written into the database. When you perform a sort in ChemBioFinder 12.0, the sort order will be correct.
Resetting the databaseTo reset the database to its original state:
Click Search>Retrieve All.
Changing the database schemeYou can create or remove fields or tables in an existing or new database as long as the data-base is not read-only and you have permission to modify it. You may also attach, or link, tables from external data sources. Use the Box Properties dialog box to perform the following procedures:
Do one of the following:• Click File>Database.• Right-click any empty space in the form
window and click Data Source.The Box Properties dialog box appears, with the Database tab displayed.
To add a field:
1. Click the Field tab.2. If there is more than one table, select the
table that will contain the new field.3. click the Create Field... . The Create Field
dialog box appears.4. Replace the default name (New_Field),
select a data type, and adjust the field width (optional). Click OK when you have fin-ished.
To delete an existing field:
1. Select a field.2. Click the Delete Field... .
A warning box comes up, asking if you really mean to delete a field.
3. Click Yes to delete the field.
CAUTION
All data entered in the field, will be lost as soon as you click the YES button.

ChemBioFinder & BioViz 355User Guide
To add a table:
1. Click the Table tab. Do one of the follow-ing:
2. Click Create Table.3. Enter a name in the Create Table dialog box.
The new table is created, with a default field named ID.
To remove a table:
1. Select a table.2. Click the Delete Table....3. Click YES in the warning box.
CAUTION
All data in all fields in the table will be lost.
To attach a table from another database:
1. Click the Table tab.2. Click Attach Table.
The Attach Table dialog box appears.3. Select the type of database – MS Access or
Oracle/ODBC.4. For MS Access, browse to the MDB file
containing the table. Select a table, and click OK.

356 Working with DataChapter 20
ChemBioFinder & BioViz 357User Guide
QueriesYou can search the database by querying any field or combination of fields. You can specify a chemical structure and/or text as the query. When searching text or numbers, you can use wildcards or specify a numerical range. When structure searching, you can search by sub- or full structure, search for an exact match, simi-larity, or tautomerism, and specify how stere-ochemistry will be matched. You can also combine structure searching with text or numerical searching. A Find Structure com-mand performs “duplicate”, “error”, “isotopic label”, and other special structure searches.The chapter describes the different types of searches and how to set up and manage searches. It concludes with some examples of advanced techniques.
Text searchesChemBioFinder 12.0, like all databases, sup-ports text searching. You can search any alpha-numeric field for strings of text. Use text searching, for example, to find chemical names, or comments in a reference field. For text searches, ChemBioFinder 12.0 inter-prets the query, then passes it as Structured Query Language (SQL) to the relational data-base. The following rules apply to these queries:
• When searching a normal text or memo field, a plain text string is taken as an “unanchored substring”, if you are not doing Full Word search. An asterisk is added automatically at each end of the string, and the hits include any string con-taining the search string. Thus, if you search for ‘benz’, it gets converted to ‘*benz*’ and returns benzene and fluroben-zene.
• When searching a normal text or memo field with wildcard, the string is taken as an “anchored substring”. Thus, if you search for ‘benz*’ it gets anchored to the left and returns words beginning with ‘benz’.
• Text strings may contain wild cards or Boolean operators. Standard wild cards are % and *. These characters are equivalent and hit any string. Other wild cards are also possible. If wildcards are present, they override the above defaults.
NOTE: Using wildcards or a “=” in memo fields may lead to unexpected results. This is because a memo field may contain formatting information surrounding the text you see, so a search like benz* may give no hits. Using *benz*, however, will give the same results in a memo field as in a plain text field.
• A check box in the Search Preferences dia-log allows you to request a full-word
21
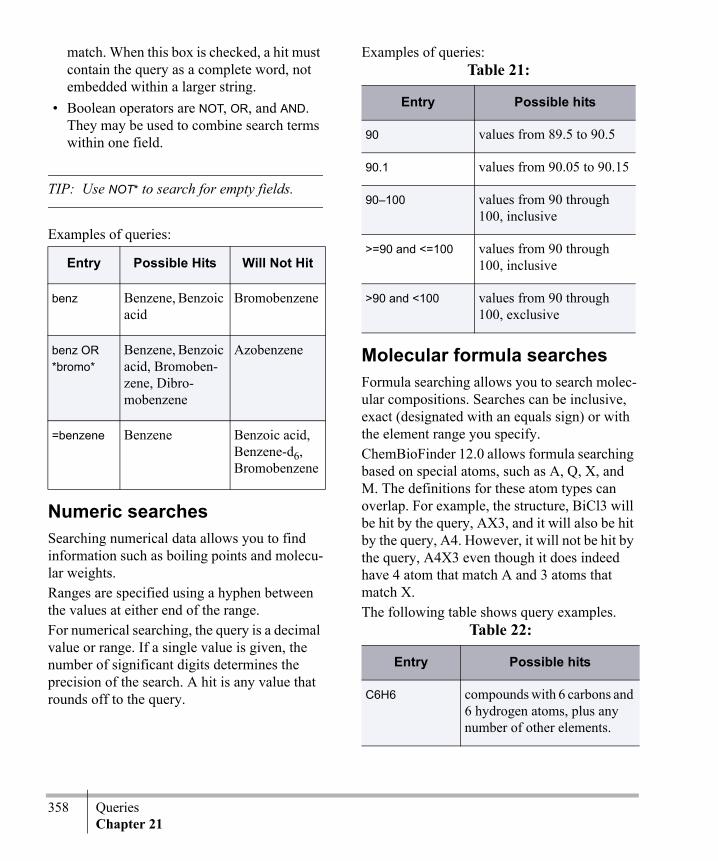
358 QueriesChapter 21
match. When this box is checked, a hit must contain the query as a complete word, not embedded within a larger string.
• Boolean operators are NOT, OR, and AND. They may be used to combine search terms within one field.
TIP: Use NOT* to search for empty fields.
Examples of queries:
Numeric searchesSearching numerical data allows you to find information such as boiling points and molecu-lar weights.Ranges are specified using a hyphen between the values at either end of the range. For numerical searching, the query is a decimal value or range. If a single value is given, the number of significant digits determines the precision of the search. A hit is any value that rounds off to the query.
Examples of queries:
Molecular formula searchesFormula searching allows you to search molec-ular compositions. Searches can be inclusive, exact (designated with an equals sign) or with the element range you specify.ChemBioFinder 12.0 allows formula searching based on special atoms, such as A, Q, X, and M. The definitions for these atom types can overlap. For example, the structure, BiCl3 will be hit by the query, AX3, and it will also be hit by the query, A4. However, it will not be hit by the query, A4X3 even though it does indeed have 4 atom that match A and 3 atoms that match X.The following table shows query examples.
Entry Possible Hits Will Not Hit
benz Benzene, Benzoic acid
Bromobenzene
benz OR *bromo*
Benzene, Benzoic acid, Bromoben-zene, Dibro-mobenzene
Azobenzene
=benzene Benzene Benzoic acid, Benzene-d6, Bromobenzene
Table 21:
Entry Possible hits
90 values from 89.5 to 90.5
90.1 values from 90.05 to 90.15
90–100 values from 90 through 100, inclusive
>=90 and <=100 values from 90 through 100, inclusive
>90 and <100 values from 90 through 100, exclusive
Table 22:
Entry Possible hits
C6H6 compounds with 6 carbons and 6 hydrogen atoms, plus any number of other elements.
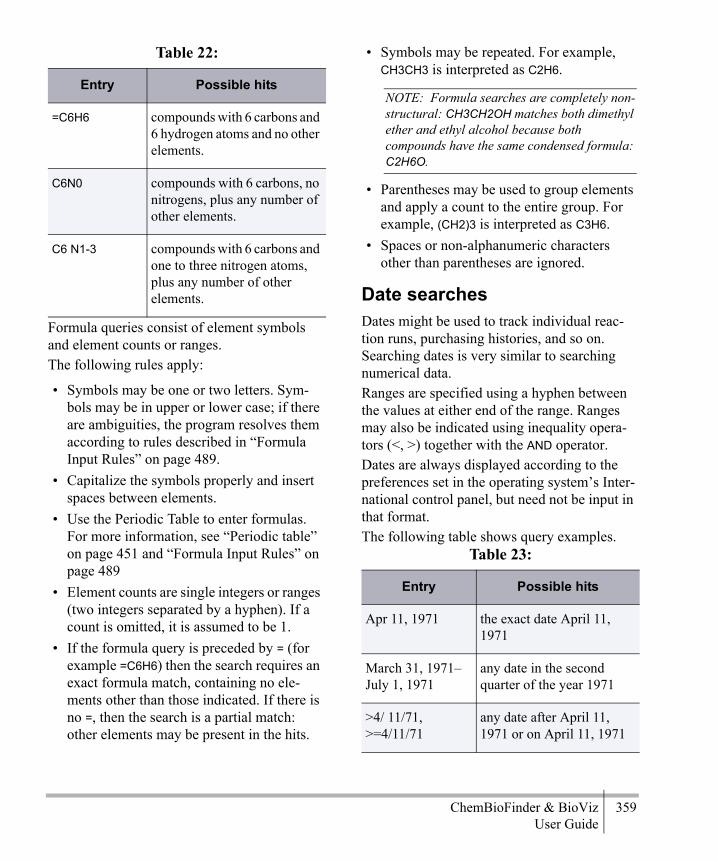
ChemBioFinder & BioViz 359User Guide
Formula queries consist of element symbols and element counts or ranges. The following rules apply:
• Symbols may be one or two letters. Sym-bols may be in upper or lower case; if there are ambiguities, the program resolves them according to rules described in “Formula Input Rules” on page 489.
• Capitalize the symbols properly and insert spaces between elements.
• Use the Periodic Table to enter formulas. For more information, see “Periodic table” on page 451 and “Formula Input Rules” on page 489
• Element counts are single integers or ranges (two integers separated by a hyphen). If a count is omitted, it is assumed to be 1.
• If the formula query is preceded by = (for example =C6H6) then the search requires an exact formula match, containing no ele-ments other than those indicated. If there is no =, then the search is a partial match: other elements may be present in the hits.
• Symbols may be repeated. For example, CH3CH3 is interpreted as C2H6.
NOTE: Formula searches are completely non-structural: CH3CH2OH matches both dimethyl ether and ethyl alcohol because both compounds have the same condensed formula: C2H6O.
• Parentheses may be used to group elements and apply a count to the entire group. For example, (CH2)3 is interpreted as C3H6.
• Spaces or non-alphanumeric characters other than parentheses are ignored.
Date searchesDates might be used to track individual reac-tion runs, purchasing histories, and so on. Searching dates is very similar to searching numerical data. Ranges are specified using a hyphen between the values at either end of the range. Ranges may also be indicated using inequality opera-tors (<, >) together with the AND operator. Dates are always displayed according to the preferences set in the operating system’s Inter-national control panel, but need not be input in that format.The following table shows query examples.
=C6H6 compounds with 6 carbons and 6 hydrogen atoms and no other elements.
C6N0 compounds with 6 carbons, no nitrogens, plus any number of other elements.
C6 N1-3 compounds with 6 carbons and one to three nitrogen atoms, plus any number of other elements.
Table 22:
Entry Possible hits
Table 23:
Entry Possible hits
Apr 11, 1971 the exact date April 11, 1971
March 31, 1971–July 1, 1971
any date in the second quarter of the year 1971
>4/ 11/71, >=4/11/71
any date after April 11, 1971 or on April 11, 1971
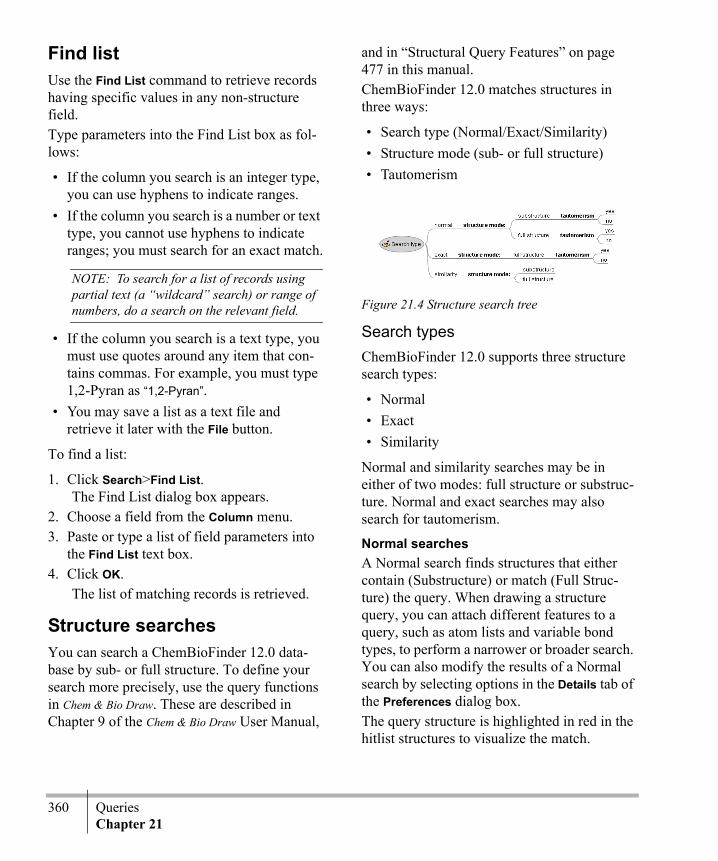
360 QueriesChapter 21
Find listUse the Find List command to retrieve records having specific values in any non-structure field. Type parameters into the Find List box as fol-lows:
• If the column you search is an integer type, you can use hyphens to indicate ranges.
• If the column you search is a number or text type, you cannot use hyphens to indicate ranges; you must search for an exact match.
NOTE: To search for a list of records using partial text (a “wildcard” search) or range of numbers, do a search on the relevant field.
• If the column you search is a text type, you must use quotes around any item that con-tains commas. For example, you must type 1,2-Pyran as “1,2-Pyran”.
• You may save a list as a text file and retrieve it later with the File button.
To find a list:
1. Click Search>Find List.The Find List dialog box appears.
2. Choose a field from the Column menu.3. Paste or type a list of field parameters into
the Find List text box.4. Click OK.
The list of matching records is retrieved.
Structure searchesYou can search a ChemBioFinder 12.0 data-base by sub- or full structure. To define your search more precisely, use the query functions in Chem & Bio Draw. These are described in Chapter 9 of the Chem & Bio Draw User Manual,
and in “Structural Query Features” on page 477 in this manual.ChemBioFinder 12.0 matches structures in three ways:
• Search type (Normal/Exact/Similarity)• Structure mode (sub- or full structure)• Tautomerism
Figure 21.4 Structure search tree
Search typesChemBioFinder 12.0 supports three structure search types:
• Normal• Exact• Similarity
Normal and similarity searches may be in either of two modes: full structure or substruc-ture. Normal and exact searches may also search for tautomerism.
Normal searchesA Normal search finds structures that either contain (Substructure) or match (Full Struc-ture) the query. When drawing a structure query, you can attach different features to a query, such as atom lists and variable bond types, to perform a narrower or broader search. You can also modify the results of a Normal search by selecting options in the Details tab of the Preferences dialog box.The query structure is highlighted in red in the hitlist structures to visualize the match.

ChemBioFinder & BioViz 361User Guide
Exact searchesThe Exact search type, also known as an Iden-tity search, is intended for use in compound registration, when you must know if a perfectly identical copy of your query compound is already present in the database. The target must be chemically identical to the query, including stereochemistry, charges, and iso-topy. It is a convenient shorthand for full struc-ture, same-stereochemistry, and appropriate settings of all the other options. Thus, generic atom and bond types such as R, A, and Dou-ble-or-Aromatic in the query will match corre-sponding atom and bond types in the target only if they are also of the same generic type. In other words, an atom labeled “R” in the query must find a matching atom labeled “R” in the target to produce a hit. If the stereochem-istry of the query is unspecified, it will only hit targets which do not specify stereochemistry. The only variable in an exact match search is whether or not it is tautomerically flexible. The Details tab in the Preferences dialog box is unavailable for Exact searches.
Similarity searchesA Similarity search finds targets that “look like” the query. Similarity searches are by their nature “fuzzy”. What “looks like” means is obviously subject to interpretation and depends on the application. In medicinal applications the drug absorption properties are relevant. In a toxicological context the metabolism is of interest. For database queries, the similarity in functional groups is what is measured. A quan-titative measure of similarity, know as the Tan-imoto algorithm after its discoverer, is calculated. For more information, see Appen-dix ChemBioFinder-D: .Similarity searches may be either full- or sub-structure. In a substructure similarity search
there is no penalty if the target contains extra, non-similar aspects. In a Full Structure similar-ity search, the results are guaranteed to include all hits you would obtain from a substructure search with the same query. Usually, they include additional hits. For this reason, similar-ity searches are useful if you have a general idea of the types of compounds you are look-ing for, but don’t have a precise conception of the target compound.Unlike exact searches, similarity searches do not highlight matched portions of the target compounds. Similarity searching matches gen-eral structural features and not specific atoms and bonds, so highlighting specific areas would not be appropriate.You can adjust the degree of similarity (from 0 to 100%) necessary to produce a hit by using the slider on the Search Type tab of the Prefer-ences dialog box.
Structure modesThe term “Structure Mode” refers to whether the query defines a substructure of the com-pounds in the database being searched, or the full structure. In this context, it is important to note that “full structure” does not mean the same as “exact”. When you specify the “Exact” search type, the structure mode is always full structure, but you may choose the full structure mode with any of the three search types. See “Full structure searches” on page 362 and “Exact searches” on page 361 for more details.
Substructure searchesA substructure search finds structures that con-tain the query, plus any additional attachments at the open positions. This is the default search mode. The substructure is highlighted in red in the hit-list structures. Using the ChemDraw

362 QueriesChapter 21
ActiveX toolbar, you can attach different fea-tures to a query, such as atom lists and variable bond types, to perform a narrower or broader search. For more information about what query features you may use and how these features affect a search, see “Changing the scope of a search” on page 483.
NOTE: In searching substructures, Chem-BioFinder 12.0 finds the substructure query regardless of its orientation or drawing presen-tation in the targeted molecules. Bonds shown in bold above are actually highlighted in red in ChemFinder 12.0.
Full structure searchesA full structure search finds structures that completely match the query. If you do not specify stereochemistry, or use generic atom or bond labels, you may get more than one hit. You may also get more than one hit if there are duplicates in the database. For more informa-tion, see “Stereochemistry” on page 363 and “Exact searches” on page 361.
Fragment searchesYou can draw more than one structure or struc-ture fragment in your substructure search query. In the Details tab of the Preferences dia-log box, you may allow fragments to overlap in the target structure. For example, if you perform the following sub-structure query with Query fragments may over-lap in target selected:
Figure 21.5 Fragment query
The hit list will include the following:
Figure 21.6 Example of substance hit in a fragment query
The dot indicates an atom shared between the two fragments. The hit list will not include this molecule if the overlap option is deselected.
Tautomeric searchesA tautomeric search is one in which the loca-tion of single and double bonds may vary from query to target. A hit occurs if, in addition to the atom types matching, the target possesses a tautomeric form whose bond orders match the query’s. Which tautomers are recognized is under some degree of control. Tautomers of the form:
Figure 21.7 Tautomeric structure
are always recognized when at least one of X and Z is not carbon. The lone pair may include a migrating proton. It is also possible to include tautomers in which X and Z may both be carbon. The choice must be made at the time the database is created or upgraded, because it affects how structures are stored.Mesomers (resonance structures) are also picked up in tautomeric searches. Tautomerism involving formation or cleavage of sigma bonds is not currently supported. The principal categories are ring-chain tautomerism, as in the open vs. cyclic forms of sugars, and valence tautomerism.Tautomeric searching is slower than non-tauto-meric, but is the mode of choice when you

ChemBioFinder & BioViz 363User Guide
think the target might have a slightly different layout of double bonds.
NOTE: If the database has not been indexed, the tautomer searches may be slow.
StereochemistryYou can specify whether or not you want a structure search to consider stereochemistry. Given a structure with one or more stereo-centers, you can store four different possibili-ties:
• A given absolute configuration. To specify this, centers must be drawn with stereo bonds, and the entire structure marked Abs (CHIRAL).
• A racemic mixture of the drawn configura-tion and its mirror image. This is drawn as above, but without the Abs (CHIRAL) mark.
• An unmarked structure, representing unknown stereochemistry, or a mixture of all possible stereo-isomers.
• A given relationship between centers. That is, a known orientation of the substituents with respect to each other, rather than a known absolute configuration. To specify this, centers are drawn, not with the stan-dard hashed and wedged bonds, but with thick stereo bonds.
If these options are checked in the Search tab of the Preferences dialog, then any stere-ochemistry indicated on the query must be matched by the target. For more information on changing searching preferences, see “Set-ting search details preferences” on page 370.
3D Properties3D queries are particularly useful in pharma-cophore searching where you are looking for a particular 3D relationship among atoms and bonds, for example in a series of potential receptor ligands. You can create a 3D query in Chem & Bio Draw Pro by adding geometries (lines, planes, etc.) and constraints (specified as ranges) to a query structure. For example, you might specify that two atoms must be between 4Å and 5Å apart, or that two planes must be separated by 80-100°. ChemBioFinder 12.0 can then use these properties to refine a search. See the Chem & Bio Draw User’s Manual for information on how to add 3D properties to structures.
NOTE: The 3D Properties feature is available in Both Pro and Ultra 12.0, but not in Standard version.
Searching with R-groupsChemBioFinder 12.0 supports queries using R-tables, including multiple R-tables. Queries containing large numbers of R-groups or large numbers of R-values are not advisable how-ever, because ChemBioFinder 12.0 pre-pro-cessing expands the query, substituting all combinations from the R-group table(s).
Alternative groupsInstead of submitting multiple queries on structures that share a common substructure, you can submit a single query with the parent structure and variable functional groups or substructures. The parent structure is drawn

364 QueriesChapter 21
with attachment point(s) that refer to a list of alternative groups that you define.
Figure 21.8 Alternative groups
Defining an alternative groupTo define an alternative group:
1. Click the query icon to begin the search.2. Right-click in the structure window and
click the Edit in Chem & Bio Draw.
TIP: You want to open Chem & Bio Draw because you will need more space than the structure window provides.
Chem & Bio Draw opens to a new page.3. Draw the parent compound. 4. Label the atom where the alternate groups
will attach with a generic label such as R.
5. Click the Alternative Group query tool.6. Drag with the tool in an open part of the
page to create an area large enough to draw the alternative groups.
7. Type a title in the Alternative Group Title box. The title must match the atom label in the parent structure, but we’ll use R in this example).

ChemBioFinder & BioViz 365User Guide
1- Title boxFigure 21.9 Adding a title to an alternative group
8. Draw the substructure fragments in the Alternative Group box. Use the single bond tool to define a fragment, and the text tool, atom HotKeys, or Nicknames to create atom labels for each variable.
Figure 21.10 Adding the alternative groups
9. Add the Attachment Points:a. Click the diamond shaped Attachment
Point tool on the Chemical Symbols pal-ette.
b. Click the open atom position on each substructure fragment.
TIP: Alternatively, the HotKey “.”(period) can be used to add attachment points.
Figure 21.11 Completed alternative group query
NOTE: In the above procedure, the parent structure was drawn, then the R-Group table was added. In fact, the order doesn’t matter. You may create the R-Group table first, then draw the parent structure. In either case, as soon as a generic atom label in the structure matches the group title in the R-Group table, a hollow attachment point symbol appears next to the label in the parent structure.
10.Type Ctrl+W to return to ChemBioFinder 12.0. The structure and the R-Group table appear in the structure window.
11.Continue the query as usual.

366 QueriesChapter 21
Reaction searchesYou can search and store reactions. In a reac-tion, one or several compounds (reactants) are transformed into other compounds (products). Individual reactants (or products) are separated from each other with plus signs. The reactants are separated from the products with an arrow.Reactions may have multiple steps, for exam-ple(A) (B) (C) (D). Here, (A) is the reactant and (D) is the product. (B) and (C) are intermediates for the complete reaction.A multi-step reaction is actually a shorthand notation for many related reactions. In the example above, (B) is an intermediate for the complete reaction, but it is also a reactant rela-tive to (C) or (D). It is also a product relative to (A). The complete reaction implies many sub-reactions, such as:(B) (D) and (A) (B).
Reaction centersThe most important part of a reaction is the part that actually changes from the reactants to the products. This part, which probably includes a number of atoms and bonds, is called the reaction center. For example, only the bold bond in the figure below (and the two atoms on either side) is part of the reaction center. The rest of the structure is unchanged from the reactant to the product:
Figure 21.12 Reaction center example
By default, ChemBioFinder 12.0 considers reaction centers whenever you search for reac-tions. ChemBioFinder 12.0 assumes that any
atoms and bonds that change in the query must be part of the reaction center of the target. For example:
does not hit
Figure 21.13 Query does not hit because it does not contain the reaction center.
when the Reaction query must hit reaction cen-ter preference is selected. Even though there is a C-F bond in the target reactant and a C-Cl bond in the target product, these bonds do not participate in the reaction, which really affects another part of the compound. If you deselect the Reaction query must hit reaction center preference, this query hits the target above.When creating reaction queries, it is important to consider what sort of information you are really looking for. Suppose you want to con-vert n-decanal to n-decanol:
Figure 21.14 Reduction of n-decanal
Are you really interested only in these two compounds? You might be interested in any reaction that converts a straight-chain aldehyde to the alcohol:
Figure 21.15 Generic aldehyde reduction query

ChemBioFinder & BioViz 367User Guide
Since the corresponding n-octanal n-octanol reaction would probably occur under very similar conditions, it is a reasonable thing to look at. Generally, you want to use substruc-ture queries that include little beyond the reac-tion center in question when you are searching for reactions.
NOTE: ChemBioFinder 12.0 supports several query properties to allow you to specify exactly how a bond participates in a reaction center. For more information about these properties, see “Setting search details preferences” on page 370.
Atom-to-atom mappingThe second most important part of reaction searching is the atom-to-atom map. You can specify maps in Chem & Bio Draw, where they are stored as part of the data about a reaction. Maps are used during searching to resolve cer-tain types of structure search hits. Atom-to-Atom mapping does not affect the search result when a query reaction is done with or without reaction map.Consider a simple esterification reaction:
Figure 21.16 Esterification example
Does the ester oxygen come from the acid or the alcohol? You specify the fate of individual atoms through an atom-to-atom map. In real-ity, the ester oxygen in this reaction originates
in the alcohol, so the atom-to-atom map looks like this:
Figure 21.17 Atom map of esterification
By matching numbers across the arrow, you can see where atoms move during the course of the reaction. The other reaction (not observed experimentally), where the ester oxygen comes from the acid, would be mapped like this:
Figure 21.18 Alternate possible atom map for ester-ification
ChemBioFinder 12.0 uses atom-to-atom map information to determine reacting centers for reactions. If only some atoms are mapped, ChemBioFinder 12.0 uses that information and does not worry about the specific fates of the other atoms. For example, if you don’t know (or don’t care) about the mapping of some atoms, you can leave them unspecified in the atom-to-atom map. By default, atom-to-atom mapping is not dis-played within ChemBioFinder 12.0. To turn on this display, select Atom-to-Atom Map on the Structure sub-menu of the View menu. For more information, see “Changing options with the view menu” on page 448.
NOTE: For information about specifying atom-to-atom maps with Chem & Bio Draw, see the Chem & Bio Draw User’s Guide.

368 QueriesChapter 21
Searching for reactantsIf you know what starting materials you are interested in but don’t know their products, you might perform a reactants query. A reac-tants query is very similar to a reaction search, except that there is nothing to the right of the arrow. For example, consider the query:
Figure 21.19 Sample reactants query
If you are doing a substructure search, this finds any reactions in which maleic anhydride or a compound containing a maleic anhydride substructure is consumed or transformed.
Searching for productsIf you know the desired end product but not how to get there, you can do a products query. A products query is similar to a reaction search, except that there is nothing to the left of the arrow. For example, consider the query:
Figure 21.20 Sample products query
If you are doing a substructure search, this finds any reactions in which bicyclo[2.2.1]hep-tane or a compound containing this substruc-ture is produced.
Searching for intermediatesRarely, you may be looking for reactions for which you only know something about an
intermediate. An Intermediate Search is very similar to a normal reaction search, except that there are arrows on both sides of the target structure. For example, consider the query:
Figure 21.21 Sample intermediates query
This finds any reactions containing the Ketene structure shown as an intermediate.
NOTE: ChemBioFinder 12.0 cannot predict products or intermediates of reactions. It finds this information only if it is already present in the database.
Combined searchesYou can combine structure searching with text searching to find a specific class of com-pounds. For example, you may want to find all compounds in the database whose names end in mycin and whose structures contain a phenyl ring. Because you are entering multiple queries in different data boxes, there is an implicit AND condition between data items in different fields. To perform a combined search:
1. Do one of the following to clear the form:• Click Search>Enter Query.• Click the Enter Query icon on the Search
toolbar.2. Enter the structural query, if any.3. Enter the text and/or numeric queries in the
appropriate boxes.4. Do one of the following:
• Click Search>Find.• Click the Find icon on the Search Toolbar.
R C C O
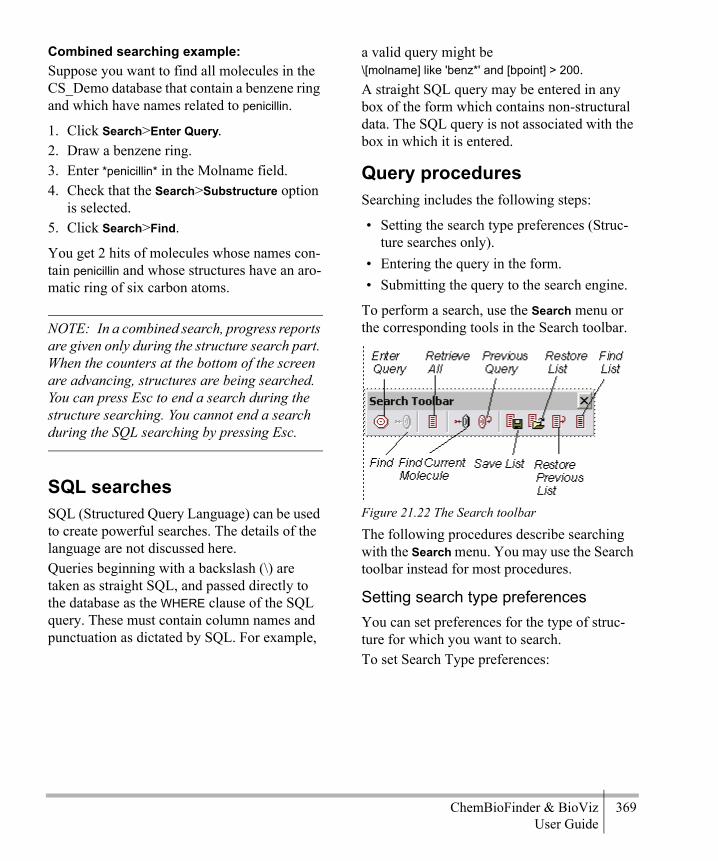
ChemBioFinder & BioViz 369User Guide
Combined searching example:Suppose you want to find all molecules in the CS_Demo database that contain a benzene ring and which have names related to penicillin.
1. Click Search>Enter Query.2. Draw a benzene ring.3. Enter *penicillin* in the Molname field.4. Check that the Search>Substructure option
is selected. 5. Click Search>Find.
You get 2 hits of molecules whose names con-tain penicillin and whose structures have an aro-matic ring of six carbon atoms.
NOTE: In a combined search, progress reports are given only during the structure search part. When the counters at the bottom of the screen are advancing, structures are being searched. You can press Esc to end a search during the structure searching. You cannot end a search during the SQL searching by pressing Esc.
SQL searchesSQL (Structured Query Language) can be used to create powerful searches. The details of the language are not discussed here.Queries beginning with a backslash (\) are taken as straight SQL, and passed directly to the database as the WHERE clause of the SQL query. These must contain column names and punctuation as dictated by SQL. For example,
a valid query might be\[molname] like 'benz*' and [bpoint] > 200.A straight SQL query may be entered in any box of the form which contains non-structural data. The SQL query is not associated with the box in which it is entered.
Query proceduresSearching includes the following steps:
• Setting the search type preferences (Struc-ture searches only).
• Entering the query in the form. • Submitting the query to the search engine.
To perform a search, use the Search menu or the corresponding tools in the Search toolbar.
Figure 21.22 The Search toolbar
The following procedures describe searching with the Search menu. You may use the Search toolbar instead for most procedures.
Setting search type preferencesYou can set preferences for the type of struc-ture for which you want to search.To set Search Type preferences:
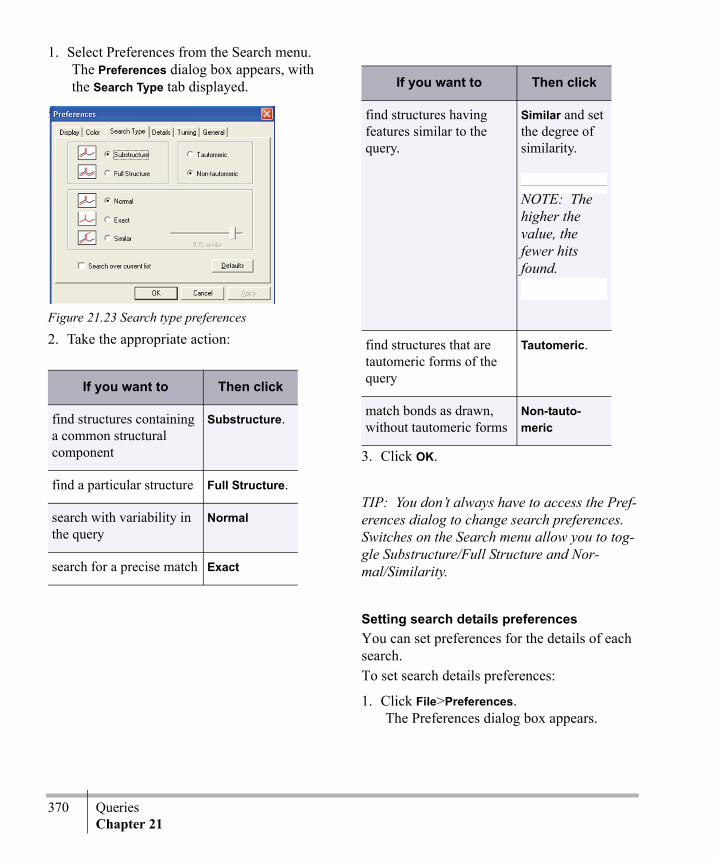
370 QueriesChapter 21
1. Select Preferences from the Search menu.The Preferences dialog box appears, with the Search Type tab displayed.
Figure 21.23 Search type preferences
2. Take the appropriate action:
3. Click OK.
TIP: You don’t always have to access the Pref-erences dialog to change search preferences. Switches on the Search menu allow you to tog-gle Substructure/Full Structure and Nor-mal/Similarity.
Setting search details preferencesYou can set preferences for the details of each search.To set search details preferences:
1. Click File>Preferences.The Preferences dialog box appears.
If you want to Then click
find structures containing a common structural component
Substructure.
find a particular structure Full Structure.
search with variability in the query
Normal
search for a precise match Exact
find structures having features similar to the query.
Similar and set the degree of similarity.
NOTE: The higher the value, the fewer hits found.
find structures that are tautomeric forms of the query
Tautomeric.
match bonds as drawn, without tautomeric forms
Non-tauto-meric
If you want to Then click

ChemBioFinder & BioViz 371User Guide
2. Click the Details tab.The Details tab appears.
3. Take the appropriate action:
If you want to Then click
Allow uncharged non-carbon atoms in the query to match charged atoms in the target.
NOTE: Charged atoms in the query must always match charged atoms in the target, regardless of this setting.
Hit any charge on heteroatom.
Allow uncharged carbon atoms in the query to match charged carbon atoms in the target.
NOTE: Charged atoms in the query must always match charged atoms in the target, regardless of this setting.
On carbon.
Allow hits to contain molecular fragments in addition to the structure hit by the query.
Permit extraneous fragments in full structure searches.
Run a search that ignores differences merely due to salt state and presence of solvents.
• Ignore salts and solvents.
• Hit any charge on heteroa-tom.
• On carbon.• Permit extra-
neous frag-ments in full structure searches.
Allow fragments in the query to overlap (share one or more atoms) in the target.
Query fragments can overlap in target.
Require that any reac-tion center present in the query overlap with reaction centers in the target. This preference applies only to reaction searching.
Reaction query must hit reaction center.
Prohibit generic struc-tures from hitting any other structures in a query.
Generics hit only generics.
Require full-word text matching. If you do not check this box, the query will hit any matching text frag-ment.
Text: match full word only
If you want to Then click

372 QueriesChapter 21
TuningThe Tuning tab of the Preferences dialog box has settings for special query conditions. On this tab, there are check boxes for:• full word text matching• case-insensitive matching (for Oracle)• matching stereochemistry
The only box that is checked by default is the Match Stereochemistry box. See the figure below:
Setting stereochemical search preferencesThe Stereochemical Search Preferences dialog box is activated from the Tuning tab of the Pref-erences dialog box. To set Stereochemical preferences:
1. Click File>Preferences.The Preferences dialog box appears.
2. Click the How button on the Tuning tab of the Preferences dialog box.The Stereochemical Search Preferences dialog box appears.
Figure 21.24 Stereochemistry search preferences
Require that the stere-ochemistry of the target structure match that of the query structure.
Match stereochem-istry and click How to set how the stere-ochemistry is matched.
If you want to Then click

ChemBioFinder & BioViz 373User Guide
3. Set the Tetrahedral stereo center hits:
NOTE: When Thick bonds represent relative stereochemistry box is cleared (default), thick bonds are interchangeable with hash/wedge bonds. When the box is checked, and Tetrahedral stereo center hits is set to Same, a query marked with thick bonds will only hit a target that has the same relative relationship between centers.
4. Set the Double bond hits:
5. Click OK.
Entering query modeTo clear the form and enter Query Mode:
Click Search>Enter Query.You are in Query mode.
In Query mode:
• The form background color changes.• QRY appears in the status bar.• Form boxes which do not permit data entry
become editable for entry of queries.• Form boxes are displayed according to their
visibility properties. For more information, see “Hiding data boxes” on page 322.
Entering and submitting a query To enter the query:
1. Position the cursor over the field you want to search and click to select it.
2. Enter the query in the data boxes.
If you want a tetrahe-dral stereocenter in
the query to...
Then...
match the target exactly. in Tetrahedral stereo center hits, click Same.
match same or opposite configuration at the center of the target.
in Tetrahedral stereo center hits, click Either.
match any target. in Tetrahedral stereo center hits, click Any.
match a relative rela-tionship between centers
click Thick bonds represent relative stereochemistry.
If you want the con-figuration of a dou-
ble bond in the query to
Then in
match the target struc-ture exactly.
Double bond hits, click Same.
match any configura-tion in the target.
Double bond hits, click Any.

374 QueriesChapter 21
3. Click the Search on the Query Mode box.
ChemBioFinder 12.0 searches. The number of hits is shown in the Status Bar at the lower right corner of the window.
NOTE: If a search gets no hits or an error occurs, an alert appears and you are returned to Query mode to enter a different query or modify the current one.
The hit list is a subset of the complete data-base. You can browse it as you would any database using the Record commands in the Record menu or toolbar. For example, to view the hits in tabular form:
Click View>Data Table.
Stopping a searchTo stop a structure search in progress, press the Esc key. The query stops and you return to browse mode.
NOTE: Only queries that involve structural data (structure, molecular formula, and molec-ular weight searches) can be stopped in this manner. SQL searches and searches that involved non-structural data cannot be aborted.
Refining a searchYou can refine a hit list of one or more records by entering a query that searches only the hit list, not the entire database.To refine a search:
1. Verify that the Search>Over Current List menu option is selected.
2. Do one of the following:• Click Search>Enter Query.• Click the Enter Query icon on the Search
toolbar.ChemBioFinder 12.0 searches over the previously retrieved hit list. If no hits are found, a message appears asking whether to search over the entire database.
As long as the Over Current List switch is on, each search further refines the current list. Use the Retrieve All command to reset. You may also use the Restore Previous List command, which acts like a “Back” button. Restore Previ-ous List goes back one in the history, including any “Retrieve All”s you might have done.
Entering a structural queryTo begin a structural query:
1. Do one of the following to clear the form:• Click Search>Enter Query.• Click the Enter Query icon on the Search
toolbar.2. Do one of the following to place a structure
into a data box: • Double-click in the structure box and edit
with the Chem & Bio Draw Control.• Right-click and click Edit in Chem & Bio
Draw.• Right-click and click Read Structure to
open an existing molecule file.• Use Edit>Paste to insert a structure from
the clipboard.3. Click Search>Preferences.4. Click the Search Type tab.5. Select the appropriate options. Optionally,
select options on the Details tab as well.6. Do one of the following:
• Click Search>Find.• Click the Find icon on the Search Toolbar.

ChemBioFinder & BioViz 375User Guide
The status bar counters indicate search progress. When the search is complete, the form displays the first hit. The list you can browse is limited to the hits. For Normal or Exact searches, the hit portion of each mole-cule is highlighted in red. If a search doesn’t find any hits, you are returned to query mode.
TIP: You can change the highlight color in the preferences dialog. For example, to show no highlighting, choose black as the highlight color. See “Color preferences” on page 446 for more information.
Using the current molecule as a queryAs you browse through a database, you may submit any structure on the screen as the struc-tural query. Often, you use similarity or sub-structure searches (see above) with this type of query to find related compounds.To use the current molecule for a query:
1. Using the Record commands, go to the record containing the structure that you want to use as a query.
2. Click Search>Current Mol As Query.All boxes of the form are cleared except the structure so that the molecule on display can be used as part of the query. You can then continue with the query as if you had drawn the structure from scratch.
Finding the current moleculeThe Find Current Molecule command, located in the Search menu and on the Search toolbar, is similar to the Current Mol as Query com-mand discussed above. As you browse through the database you may find a molecule that interests you, and want to find other related records.
The Find Current Molecule feature lets you perform a quick structural search of the struc-ture currently being displayed on the form. However, this feature does not allow you to enter other search terms. The type of structure search (complete structure, substructure, and/or similarity) is determined by what you have selected in the Search menu.To find the current molecule:
1. Browse to the record containing the struc-ture of interest.
2. From the Search menu, choose the type of structure search you want to perform.
3. Do one of the following:• Click Search>Find Current Mol.• Click the Find Current Molecule icon on
the Search Toolbar.ChemBioFinder 12.0 begins the search and displays the search status on the lower right corner of the status bar. When the search is complete, the form displays the first hit, and the list you can browse is restricted to the records hit by the query.
Entering a reaction queryThe general procedure for creating a reaction query is very similar to creating a structural query.
1. Do one of the following to clear the form:• Click Search>Enter Query.• Click the Enter Query icon on the Search
toolbar.The form clears.
2. Enter the query:• Double-click in the Structure box.• The Chem & Bio Draw Control appears.• Draw the structure or substructure or reac-
tion in the From ChemBioFinder 12.0 window.
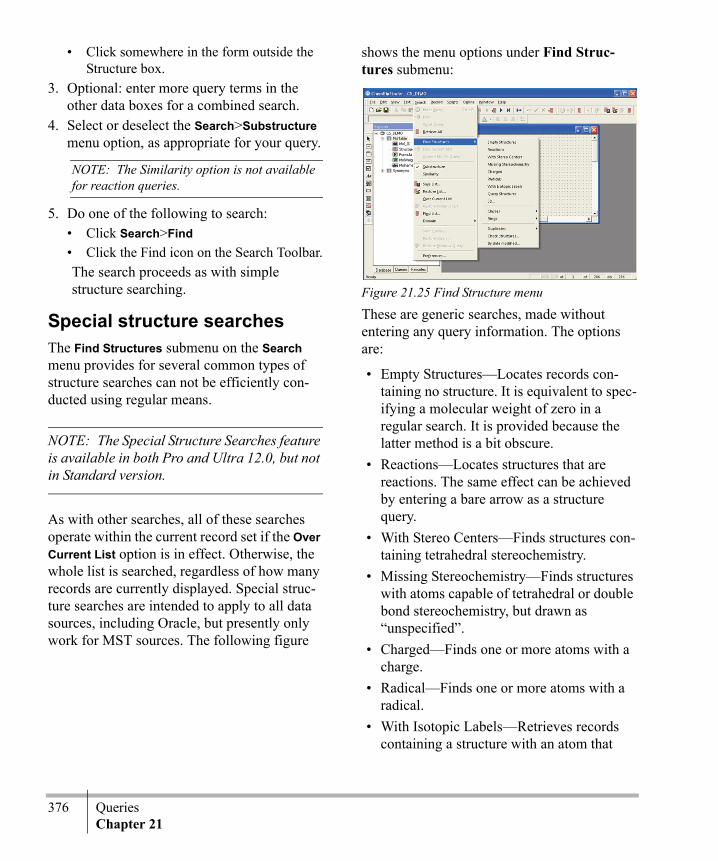
376 QueriesChapter 21
• Click somewhere in the form outside the Structure box.
3. Optional: enter more query terms in the other data boxes for a combined search.
4. Select or deselect the Search>Substructure menu option, as appropriate for your query.
NOTE: The Similarity option is not available for reaction queries.
5. Do one of the following to search:• Click Search>Find• Click the Find icon on the Search Toolbar.The search proceeds as with simple structure searching.
Special structure searchesThe Find Structures submenu on the Search menu provides for several common types of structure searches can not be efficiently con-ducted using regular means.
NOTE: The Special Structure Searches feature is available in both Pro and Ultra 12.0, but not in Standard version.
As with other searches, all of these searches operate within the current record set if the Over Current List option is in effect. Otherwise, the whole list is searched, regardless of how many records are currently displayed. Special struc-ture searches are intended to apply to all data sources, including Oracle, but presently only work for MST sources. The following figure
shows the menu options under Find Struc-tures submenu:
Figure 21.25 Find Structure menu
These are generic searches, made without entering any query information. The options are:
• Empty Structures—Locates records con-taining no structure. It is equivalent to spec-ifying a molecular weight of zero in a regular search. It is provided because the latter method is a bit obscure.
• Reactions—Locates structures that are reactions. The same effect can be achieved by entering a bare arrow as a structure query.
• With Stereo Centers—Finds structures con-taining tetrahedral stereochemistry.
• Missing Stereochemistry—Finds structures with atoms capable of tetrahedral or double bond stereochemistry, but drawn as “unspecified”.
• Charged—Finds one or more atoms with a charge.
• Radical—Finds one or more atoms with a radical.
• With Isotopic Labels—Retrieves records containing a structure with an atom that
ChemBioFinder & BioViz 377User Guide
either has a mass number, or has an Isotopic Abundance attribute.
• Query Structures—Locates structures with any generic variability such as atom types (R, A, M, Q, X, Alkyl, Aliphatic, EDG, EWG), bond types (single-or-double, etc.), variable charge, element lists ([C,N,O]), ring bond count, etc.
• 3D—Locates structures that could be tar-gets in a 3D search. These are structures scaled in Angstroms and having Z coordi-nates. Both conditions must be met. Struc-tures that meet only one of these conditions can be found by using the Check structures search.
NOTE: The 3D feature is available in both Pro and Ultra 12.0, but not in Standard version.
• Classes—Provides the following search options (selectable from a submenu):• Hydrocarbons: Finds structures with Car-
bon and Hydrogen only. If there are more than one fragments, they must all be hydrocarbons.
• Aliphatics: Finds structures with a carbon-carbon bond (or methane) and no rings.
• Alicyclics: Finds structures having a car-bocyclic ring that is not aromatic or antiar-omatic.
• Aromatics (4n+2): Finds structures con-taining one or rings with a 4n+2 electron system. Includes pyrrole and charged rings.
• Antiaromatics (4n): Finds structures con-taining one or more rings with a 4n elec-tron system.
• Aromatics (Cyclically alternating): Finds structures containing one or more rings that have 4n+2 bonds, distributed as alter-
nating single and double bonds. This is the criterion for "delocalized" used since ChemFinder 10.
• Natural products: Finds structures con-taining a carbon and at least nitrogen or oxygen.
• Alkaloids: Finds structures with MW>200, and containing carbon and basic nitrogen.
• Heterocycles: Finds structures having a ring containing a heteroatom.
• Metals: Finds structures containing a metal bond.
• Organometallics: Finds structures contain-ing a metal-carbon bond.
• Organics: Finds structures having a car-bon atom.
• Inorganics: Finds structures lacking car-bon.
• Salts: Finds structures that can be consid-ered as salts.
• Rings—Finds any of the following types of ring structures (selectable from a submenu):• Bridged: Systems. For example, two rings
share more than one bond.• Spiro: Systems. For example, two rings
sharing just one atom.• Fusion: Systems. For example, structures
with a ring fusion (two rings sharing one bond).
• Highly condensed—Rings sharing at least four bonds with others in the group, where the group has at least seven rings.
• Necklace—A ring bridging at least one other ring half its size or less.
• Polyhedra—A group of rings each of which is fused to at least two others in the group.
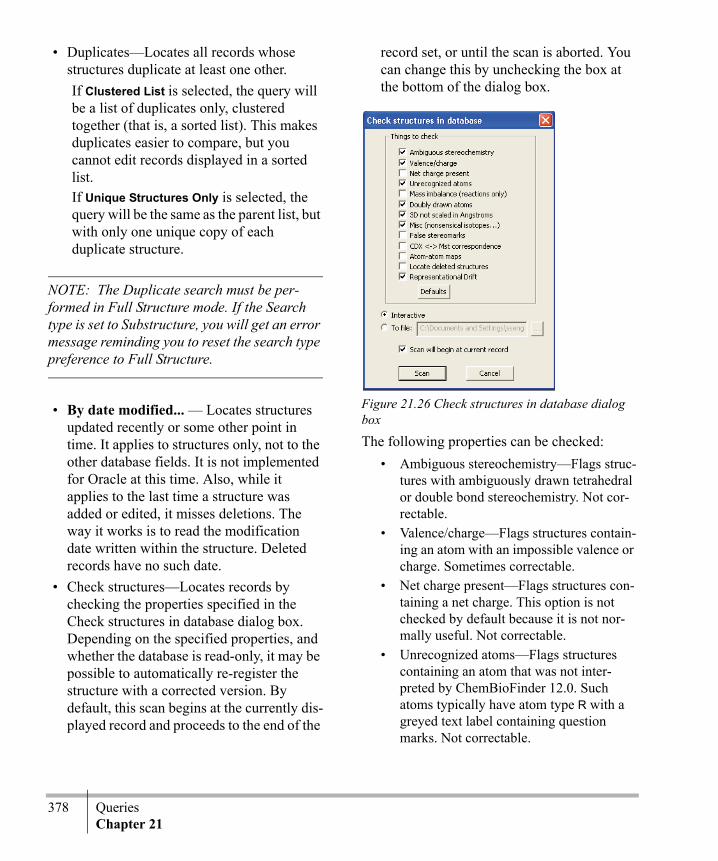
378 QueriesChapter 21
• Duplicates—Locates all records whose structures duplicate at least one other. If Clustered List is selected, the query will be a list of duplicates only, clustered together (that is, a sorted list). This makes duplicates easier to compare, but you cannot edit records displayed in a sorted list. If Unique Structures Only is selected, the query will be the same as the parent list, but with only one unique copy of each duplicate structure.
NOTE: The Duplicate search must be per-formed in Full Structure mode. If the Search type is set to Substructure, you will get an error message reminding you to reset the search type preference to Full Structure.
• By date modified... — Locates structures updated recently or some other point in time. It applies to structures only, not to the other database fields. It is not implemented for Oracle at this time. Also, while it applies to the last time a structure was added or edited, it misses deletions. The way it works is to read the modification date written within the structure. Deleted records have no such date.
• Check structures—Locates records by checking the properties specified in the Check structures in database dialog box. Depending on the specified properties, and whether the database is read-only, it may be possible to automatically re-register the structure with a corrected version. By default, this scan begins at the currently dis-played record and proceeds to the end of the
record set, or until the scan is aborted. You can change this by unchecking the box at the bottom of the dialog box.
Figure 21.26 Check structures in database dialog box
The following properties can be checked:• Ambiguous stereochemistry—Flags struc-
tures with ambiguously drawn tetrahedral or double bond stereochemistry. Not cor-rectable.
• Valence/charge—Flags structures contain-ing an atom with an impossible valence or charge. Sometimes correctable.
• Net charge present—Flags structures con-taining a net charge. This option is not checked by default because it is not nor-mally useful. Not correctable.
• Unrecognized atoms—Flags structures containing an atom that was not inter-preted by ChemBioFinder 12.0. Such atoms typically have atom type R with a greyed text label containing question marks. Not correctable.
ChemBioFinder & BioViz 379User Guide
• Mass imbalance—Flags reactions in which the molecular formulae of reactants is different from products. Not correct-able.
• Doubly drawn atoms—Flags structures in which two atoms are very close together and at least one of which lacks a label. (Also, to qualify as a doubly drawn pair, the combined valence of explicit bonds must not exceed the capacity of either atom.) You get this sort of structure when attempting to draw a bond from an exist-ing atom, but miss and accidentally create a new atom. Chem & Bio Draw flags these cases with a wavy red box.
• 3D not scaled in Angstroms—Flags struc-tures with Z coordinates or 3D not scaled in Angstroms. Such structures will not be struck in a 3D search.
NOTE: The 3D not scaled in Angstroms feature is available in both Pro and Ultra 12.0, but not in Standard version.
• Miscellaneous—Presently, this checks one thing: that isotopic masses seem reason-able.
• False stereomarks—flags stereochemical indicators such as a wedged bond on an atom that is incapable of stereochemistry because of its geometry. In a normal search, such indicators are ignored. The option allows you to find all such stere-ochemical indications and correct any errors.
• CDX <-> Mst correspondence: Checks whether the chemical interpretation of the original CDX drawing remains same in the latest version of the software. It also checks whether the stored internal struc-tures need to be regenerated from the CDX.
• Atom-atom maps: Checks whether the quality of auto-generated maps is satisfac-tory. However, user-defined maps are not checked, and are considered legitimate.
• Locate deleted structures: Identifies struc-tures that have been deleted from structure boxes.
• Representational Drift: Checks several invisible aspects of stored chemical struc-tures and ensures that the stored chemical structures are up to date with the latest software version.
NOTE: When the Interactive option is selected, the application displays dialog boxes with warnings and errors, if any. However, if you select the To file option, you need to provide the path for storing the log file containing warnings and errors. In this case, errors and warnings are not displayed in dialog boxes.
To perform a Check structures search:
1. Select the categories of interest.2. Click the Scan.
When a structure is flagged, its record is displayed, the offending atom or bond (if any) is “flashed” and an alert offers the user several choices.
The options are:
if you want to... then click...
ignore the error and continue checking the same structure.
Don’t know or Ignore

380 QueriesChapter 21
Managing queriesThe Queries Tree Control in the Explorer win-dow maintains a list of search queries from the
current and previous sessions. Queries are associated with forms, and the query list is saved when you save the form. When you open or activate an existing form, the tree updates to show only the queries for that form.Each time you carry out a search or list opera-tion, a new query is generated in the tree. A name is assigned to the query, and it is dis-played in the tree along with the size of the list (number of hits) and a brief description. The generated name is “Q<n>*”, where n is a sequential number, and * indicates that the query has not been named or marked for sav-ing.
CAUTION
Depending on your preference settings, unnamed queries may be automatically dis-carded. See “Saving and restoring lists” on page 382 for details.
To activate the Queries tree control:
1. Click the View>Explorer Window menu option.
2. Click the Queries tab on the Explorer win-dow to display the Queries tree.
Queries are listed as “children” of the database (displayed as Full List). When you select Search Over Current List from the Search menu before performing a query, it is displayed as a “child” of the previous list. (The current list is
rewrite the MST record, thus correcting the problem.
is unspecified or has stereo
Continue the scan from the next structure.
Skip to Next Struc-ture
stop the scan.This leaves you on the last record that exhibited a problem
Stop Scanning
“flash” the problematic atom or bond.
This button only appears when the error revolves around an atom or bond. Clicking the button creates a circle that moves toward the atom/bond, drawing the eye to it.
Flash
View details about a warning message.
Help
Fix the error automati-cally.
Auto-Fix
if you want to... then click...

ChemBioFinder & BioViz 381User Guide
indicated with a frame around the colored box.).
Figure 21.27 The Queries tree
To restore a query:Double-click a query.
TIP: Double-clicking the root item, Full List, has the same effect as choosing Retrieve All from the Search menu.
The Queries context menuWhen you right-click on a query, you display a menu with commands to manage the query.
if you want to... then choose...
repeat the search using the selected query. (This is the same as double-clicking on the query.)
Rerun
database(full list)
Current List
(marked witha frame)
Search overCurrent listquery(child list)
merge the hits of the selected query with the current list. See “Restoring a hit list” on page 383 for details.
Restore List
apply the query’s color to a plot of the intersection of the selected query with the current list. (This is the same as single-click on the query.)
Color On Plot
choose a different query icon color from the color picker dialog.
Change Color
modify the query and/or rerun it.
Restore Query goes to Query mode and displays the struc-ture. You may modify the query, then rerun it manually.
Restore Query
save the query to a separate file, with extension .cfq.
Save Query...
mark the query so it will be saved (as named) when the form is saved.
This has no effect unless the Query Saving preference has been set to Discard unnamed queries. See “Saving and restoring lists” on page 382.
Keep
if you want to... then choose...

382 QueriesChapter 21
You also use the context menu to display the Query Properties dialog box. In this dialog box, you can modify the query name, add a comment, or change the color used in plots. Text entered in the Comments box will replace the standard description displayed along with the number of hits.
Figure 21.28 The Query Properties dialog box
DomainsIf you are browsing a list other than the full data-base, you can make it seem that the database con-sists only of the current “child” list.
Click Search>Domains>Set Domain to Current List. The current list acts like a full database. For example, a Retrieve All command will retrieve only this list; without selecting Search Over Current List, searches will go over it only, etc.
To reset searches to the full database:Click Search>Domains>Reset to Full Database.
NOTE: Set Domain to Current List remains in effect until cancelled. If you save the form, it will be saved with the form file and will still be in effect when you open the form again.
Saving and restoring listsYou can save queries individually as .cfq files or automatically when saving the form. The old commands for saving and restoring lists (as .cfq files) still appear on the Search menu, and on the context menu displayed when you right-click on a specific query. If you close a form without having saved your queries (or other changes), you are prompted to save or discard changes. On the General tab of the Preferences dialog box, there is an option to save all queries (the default), or only those that have been renamed. If you select this option, there are two ways to save a query with the form:
• Rename the query, either with the Rename command in the context (right-click) menu, or from the query properties dialog box (also accessed from the context menu.)
delete the selected query from the tree.
The next time you save the form, this query will be lost. If you delete by mistake, you can close and reopen the form without saving.
Remove
rename the query.
When the Query Saving prefer-ence has been set to Discard unnamed queries, this has the same effect as Keep.
Rename
for all queries at the same depth in the tree, sort alphabet-ically by name.
Sort Folder
if you want to... then choose...

ChemBioFinder & BioViz 383User Guide
• Mark the query with the Keep command on the context menu. Query saved in this way retain their standard name.
Figure 21.29 General preferences
Saving a hit listCreate a query and perform the search. See “Entering and submitting a query” on page 373 and “Entering a structural query” on page 374 for more information.
1. When you have received the hit list, click Search>Save List.The Save As dialog appears.
2. Type a filename for the hit list, and click the Save button.
The file consists of a list of values of the pri-mary key of each record in the hit list. If there is no primary key, the molecule ID is used.To edit a saved hit list, open the text file with a text editor such as Notepad and edit the values you want changed.
Restoring a hit listOnce you have saved a hit list, you can per-form another search and then integrate the results from the second search with the results
from the first. Thus, you can perform Boolean operations on different searches.There are two ways to integrate the results of two searches:Browsing to the saved list:
1. Perform a search and save the hit list.2. Perform another search.3. Click Search>Restore List.
The Open dialog appears.4. Browse to the previously saved list you
want to integrate with the current hit list, and click the Open button.The Restore/Merge List dialog box appears.
Figure 21.30 The Restore/Merge List dialog box
5. Select the integration option and click OK.• Replace—discards the current hit list and
displays the records from the hit list you chose to open.
• Intersect—displays only those records that appear in both the current hit list and in

384 QueriesChapter 21
the saved hit list. This is a Boolean AND operation.
• Subtract—displays only those records that are in the current hit list but are not in the saved hit list. For example, if the current list contains records, 1, 2, 3, 4, and 5, and the restored list contains records 4, 5, 6, and 7, then only records 1, 2, and 3 will be displayed. This is a Boolean NOT opera-tion; it shows the records in the current list that are not also in the restored list.
• Union—displays all records in either the current list or the saved hit list. This is a Boolean OR operation.
• Subtract from—displays only those records that are in the saved hit list but are not in the current hit list. This is the same as Subtract, but with the order of the lists reversed.
The hit lists are integrated. You can browse and save this new hit list just as any other hit list.
Drag and Drop list merge:
1. Perform a search and save the hit list.2. Perform another search and save the list.
Two saved queries are shown in the figure below:
3. Simply drag one query item in the tree on top of another.Restore/Merge dialog comes up allowing you to choose the logic to be applied to the merge: replace, intersect, subtract, union, and subtract from.
A successful merge results in a new list.
NOTE: If you merge two lists and get an empty result, an alert appears and the list reverts to the previous list.
Search examplesThe following are examples of searching options. By specifying atom and bond proper-ties, you see how to use the query functions in Chem & Bio Draw to search the database more effectively. All substructure search query prop-erties recognized by ChemBioFinder 12.0 are listed and described in “Structural Query Fea-tures” on page 477
Multiple hit listsA detailed example of how you can use hitlist management to perform specific, sophisticated searches follows.

ChemBioFinder & BioViz 385User Guide
Suppose you want to search for all compounds in the CS_Demo database that contain a ben-zene substructure and have molecular weights between 50 and 200. After you perform this combined search, you want to find which of these compounds do not contain a carbon-nitrogen bond. By integrating hitlists, you can perform this search.To create the hitlist for the first part of this search:
1. Open the CS_Demo database.2. Create the first query by drawing benzene
in the Structure data box and entering 50-200 in the Molecular Weight Data Box.
3. Search the query.You get 75 hits.
4. Click Search>Save List.5. Save the hitlist as benz.txt.
To create another hitlist for the second part of the search:
1. Draw the query shown below in the Struc-ture Data Box.
2. Search the query.You get 103 hits.
3. Click Search>Save List.4. Save the hit list as c-n.txt.
Integrate the two hitlists:
1. Click Search>Restore List.2. In the Open dialog box, open the benz.txt
file.3. In the Restore List dialog box, click the
Replace radio button, then click OK.You return to your first list of 75 hits
4. Click Search>Restore List.
5. In the Open dialog box, open the c-n.txt file.6. In the Restore List dialog, click the Subtract
radio button, then click OK.The hit list is reduced to the 60 records with compounds containing a benzene substructure, not containing a C-N substructure, and having molecular weights between 50 and 200.
If you had chosen the Replace option in the last step, then only the C-N records would be dis-played. Choosing Intersect would display those records in either list. Finally, choosing Union would display all records from both lists.
Using atom listsUsing the text tool in Chem & Bio Draw, you can enter in a structural query a list of possible atom types, one of which must match in the target compound.If you want to search for molecules containing a benzene ring with an ether, amine or phos-phane group, a query might look like the fol-lowing:
Figure 21.31 Atom list query
Atom types and bond typesTo broaden or narrow a search query, you can define the properties of the atoms and bonds in a structural query. These properties are defin-able in Chem & Bio Draw Pro using the Atom Properties and Bond Properties dialogs acces-sible from the Structure menu. See “Structural Query Features” on page 477 for more infor-mation.Suppose you want to find all molecules that contain a non-oxygen chalcogenide bonded to
CN
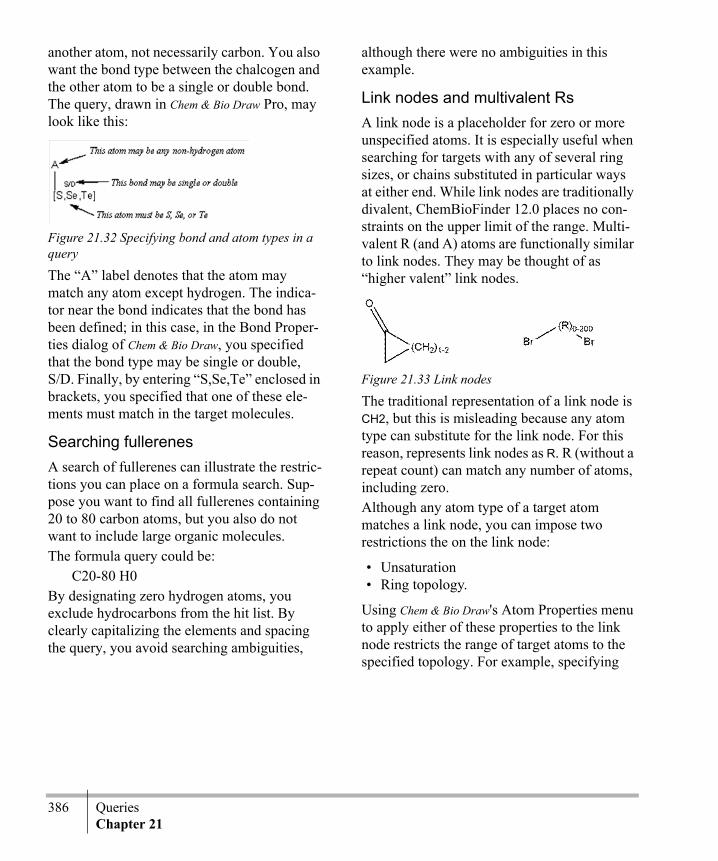
386 QueriesChapter 21
another atom, not necessarily carbon. You also want the bond type between the chalcogen and the other atom to be a single or double bond. The query, drawn in Chem & Bio Draw Pro, may look like this:
Figure 21.32 Specifying bond and atom types in a query
The “A” label denotes that the atom may match any atom except hydrogen. The indica-tor near the bond indicates that the bond has been defined; in this case, in the Bond Proper-ties dialog of Chem & Bio Draw, you specified that the bond type may be single or double, S/D. Finally, by entering “S,Se,Te” enclosed in brackets, you specified that one of these ele-ments must match in the target molecules.
Searching fullerenesA search of fullerenes can illustrate the restric-tions you can place on a formula search. Sup-pose you want to find all fullerenes containing 20 to 80 carbon atoms, but you also do not want to include large organic molecules. The formula query could be:
C20-80 H0By designating zero hydrogen atoms, you exclude hydrocarbons from the hit list. By clearly capitalizing the elements and spacing the query, you avoid searching ambiguities,
although there were no ambiguities in this example.
Link nodes and multivalent RsA link node is a placeholder for zero or more unspecified atoms. It is especially useful when searching for targets with any of several ring sizes, or chains substituted in particular ways at either end. While link nodes are traditionally divalent, ChemBioFinder 12.0 places no con-straints on the upper limit of the range. Multi-valent R (and A) atoms are functionally similar to link nodes. They may be thought of as “higher valent” link nodes.
Figure 21.33 Link nodes
The traditional representation of a link node is CH2, but this is misleading because any atom type can substitute for the link node. For this reason, represents link nodes as R. R (without a repeat count) can match any number of atoms, including zero.Although any atom type of a target atom matches a link node, you can impose two restrictions the on the link node:
• Unsaturation • Ring topology.
Using Chem & Bio Draw's Atom Properties menu to apply either of these properties to the link node restricts the range of target atoms to the specified topology. For example, specifying

ChemBioFinder & BioViz 387User Guide
the link node to be aromatic would give the following results.:
Figure 21.34 Results of a link node query
Searching more than one substructureA substructure search may contain more than one substructure unit. Suppose you want to find all compounds in the CS_Demo database which contain a benzene substructure and another substructure unit containing chlorine bonded to any atom. A structure query, as
drawn in Chem & Bio Draw would look like this:
Figure 21.35 Structure query with two substructures
You should get five hits. Browse the hits. By specifying the query as above, you obtain hits such as benzyl chloride, shown below, where the substructure units are not connected.
Figure 21.36 Benzyl chloride, hit by query with two substructures
The substructure units can overlap; they can share a common atom. Examples of this over-lap are shown below..
Figure 21.37 Overlapping substructures in the hit list
Query Results
Will hit
Will not hit

388 QueriesChapter 21
ChemBioFinder & BioViz 389User Guide
Importing and Exporting DataYou can move data into and out of a database if the data is in a supported file format. You can import single files, import or export data-bases, or add data to an existing database.
Supported file formatsChemBioFinder 12.0 allows you work with individual chemical structures and reactions in various file formats. The supported formats are:
• Chem & Bio Draw (cdx)• Chem & Bio Draw XML (cdxml)• Connection Table (ct)• Delimited text (csv, txt)• MDL Molfile and V3000 (mol)• MDL RXNfile and Rxn V3000 (rxn)• MDL RDFile (rdf)• MDL SDFile (sdf)• MDL Sketch (skc)• MDL Graphic (tgf)• SMD 4.2 (smd)
Supported formats for output files only:
• Bitmap (bmp)• XML (cfxml)• Encapsulated Postscript (eps)• GIF (gif)
• Microsoft Word (doc)• TIFF (tif)• Windows metafile (wmf)
For information on the .cdx, .ct, and .cdxml file formats, see the Chem & Bio Draw Users Guide. For information on MDL file formats, see http://www.mdli.com/ (A document describ-ing the file formats is available in PDF format.)
Importing dataChemBioFinder 12.0 allows you to import Chem & Bio Draw structures, Structure Data files (SDFiles) and Reaction Data files (RDFiles) directly into a database. In addition, you can import text files that are comma or tab delimited.
• May be up to 64 characters long.• May include any combination of letters,
numbers, spaces, and special characters except a period (.), an exclamation point (!), an accent grave (`), or brackets ([ ]).
• Must not begin with leading spaces.• Must not include control characters (ASCII
values 0 through 31).• Must not include a double quotation mark
(“) in table, view, or stored procedure names.
22
390 Importing and Exporting DataChapter 22
Importing structuresChemBioFinder 12.0 imports structure files directly into a database. You can choose to replace the existing records, append new records, or merge the data, eliminating dupli-cates. The general procedure for importing structures is:
1. Use the File>Import submenu, to choose the type of structure file to import. The Open Chemical Structures dialog box appears.
2. Browse to a folder containing structures. 3. Select a file or files (using Ctrl+click or
Shift+click) and click the Open button. The Data Import dialog box appears.
4. Click the File button, and select a database to import into.
NOTE: You can also type in a name to create a new database file.
5. Choose the type of import: Overwrite, Append, or Merge. If you have selected Merge, click the Merge tab and choose the matching field, match options, and logging options.
6. Select the fields to be imported with the check boxes.• Optional: Double-click the field name to
change the name of the field, field type, and width in the Data Field Import dialog box.
• Optional: Click the Logging tab to change details of the log file.
• Optional: Click the Form Style tab to select the style of boxes that will be cre-ated for new fields.
• Optional: Click the Advanced tab to set the Advanced options. Import only part of a file by setting the starting point. You
may indicate a starting point by line num-ber, byte number, or record number. Also, select the version of the ChemBioFinder database to be created. Versions back to 7.0 are supported. In addition, import structures only by selecting the check box and enter duplicate reagent values by checking the Store redundant reagents check box.
NOTE: In SD and RD files, reagents and catalysts are specified in each record. ChemBioFinder 12.0 stores them in subtables. Thus, if the same reagent appears in more than one record, ChemBioFinder 12.0 only needs to store it once. You can over-ride this default with the check box.
7. When you have finished selecting your options, click the Import button. The struc-tures are imported to the specified database.
Structure and reaction ChemBioFinder 12.0 allows you to import Structure Data files (SDFiles) and Reaction Data files (RDFiles) directly into a database. Since these files contain both structures and data, ChemBioFinder 12.0 creates fields in the database to accommodate the incoming data.In RDFiles, incoming data may be hierarchical and complex. When loading RDFiles, Chem-BioFinder 12.0 converts the data to a relational form, creating new tables as necessary and generating linking data.
NOTE: When importing RD files, boxes and subforms are created and positioned automati-cally.
If you have a blank form when you import, ChemBioFinder 12.0 creates boxes on the main form. If you have a form with boxes

ChemBioFinder & BioViz 391User Guide
when you import, new boxes are created on tabbed forms.You can import with a form linked to a data-base, a blank form, or no form. If you import with no form, ChemBioFinder 12.0 creates a new form. Selections you make on the Form Style tab of the Data Import dialog box deter-mine what the form will look like.To import structure and reaction data files:
1. Use the File>Import submenu, to choose the type of structure file to import. The Open dialog box appears.
2. Choose the file to import and click the Open. The Data Import dialog box appears.
The Import dialog box scans the file to deter-mine what data fields are present and how much space to allow for them in the database. The number of records scanned is shown in the status bar. If the input file is large, the scan may take a while.To interrupt the scan, press the Esc key. A message box appears to confirm whether you really want to stop. The scan continues until you click Yes.
To abort the scan, click Stop scanning.
NOTE: You should let the scan go to comple-tion so that all needed fields are created in the database before loading.
Using log filesDuring the import, ChemBioFinder 12.0 cre-ates a log file of the actions taken. The log file (.log) is a text file that is created alongside the input file and overwrites any previous log file. The log records data of your choice form the following options during the import.
• Errors: Errors and warnings• General data: Information about the input
file and import process• Records processed: Logs an entry for each
record of the input file• Structures registered: Logs an entry for
each structure stored in the database• Data registered: Shows each data item
stored in the database• Database schema: Shows input fields found
and columns generated
The log file for an RDFile import additionally presents an overview of the data table hierar-chy within the RDFile.You can choose whether to create the log file or not. If you choose to create the log file, you can save it with a different name or append to an existing log file.
Importing from a specified locationYou can start an import from an arbitrary loca-tion in an SDFile or RDFile, such as a byte or line number. To set the location from which to import:

392 Importing and Exporting DataChapter 22
1. Click the Advanced tab of the Date Import dialog box.
2. Select the appropriate options.
3. Click Import.
Reading a structureIn addition to importing, ChemBioFinder 12.0 can read files of any of the supported structural formats. For example, if you have structures stored in Chem & Bio Draw format, you can
open them directly from ChemBioFinder 12.0 without having to import or redraw them.To read a structure from a file into a structure box:
1. Right-click in the structure box, and click the Read Structure context menu command. The Open dialog box appears.
2. Choose the file to read.3. Click the Open. The structure is read into
the structure box. The database is not affected by this operation until you choose Commit Changes or move off of the record.
Drag and dropYou can drag certain types of files from the Windows Explorer or Desktop onto Chem-BioFinder 12.0. The following table summa-rizes the ChemBioFinder 12.0 Drag and Drop options. Table 24:
To start from Click
the beginning of the SDFile or RDFile
beginning.
a specified line number
line and type the line number.
a specified byte number
byte and type the byte number.
a specified record record and type the record number.
type of file sup-ported file
types
comments
Structure • CDX• SKC• MOL• MST
Must be dropped into a structure box.
Graphic • WMF• EMF• BMP• GIF• PNG• TIF
Must be dropped into a picture box.
Form • CFW Does not need to be dropped onto an existing form.

ChemBioFinder & BioViz 393User Guide
Multiple files can be dropped at once, but you cannot mix types (as defined in column 1 of the table). If several structure or graphic files are dropped at once, they are loaded into suc-cessive ChemBioFinder 12.0 records. If only one is dropped, you are asked if you wish to append the structure/graphic in a new record or overwrite the existing record. If more than five structures/graphics are dropped, an alert will ask you if you wish to proceed. Dropping one or more form files opens the forms, without affecting the current form and database.
Importing text You can import comma or tab delimited text files. The Import Delimited Text command uses the same dialog and has most of the same features as Import SDFile. Delimited text (DT) differs from SD files in that:
• DT files cannot contain structures.• DT files are not as well defined, and require
interpretation in order to determine field names and delimiter type.
To import text records into a new database:
1. Open a new, blank form.2. Click the File>File Import>Delimited Text
menu command.3. In the File Open dialog, browse to select the
input file.
• The input file is scanned to determine the field delimiter. If the file extension is “.csv,” the delimiter is taken to be comma. If the extension is “.txt,” the first few lines of the file are examined for the presence of com-mas or tabs. If one or the other is found, it is taken as the delimiter. If not, an alert is pre-sented.
• This alert will appear in two cases:
• The input file contains only a single col-umn.The alert can be ignored (click OK).
• The input file has some delimiter between fields other than tab or comma.
In this case you must specify the delimiter using the File Export dialog box.
To specify the delimiter using the Role Export dialog box:
1. Click Cancel to dismiss the alert and abort the import.
2. Open a form containing data, and retrieve a small hit list.
3. Click the File>Export>Other menu com-mand. The File Export dialog box appears.
4. Click the Text Options tab.5. Choose the Other option, and specify a
delimiter.6. Click the Export button to save the choice
(and carry out an export)7. Go back to step 1 of the import procedure to
begin the import again.
TIP: Once you have specified a delimiter, it will be remembered and you will not have to repeat this operation.
The input file scan also determines the names and types of the data fields in the input file. Field names must appear in the first line of the file, in the correct order, separated by the same delimiter as the data items. Field types are determined by examining all the data in each column, using the same rules as for SD import: if all items in one column are integers, then the field type is set to integer, and so on. Widths of
394 Importing and Exporting DataChapter 22
text fields are set to accommodate the largest item in the file.
Exporting data You can create a new SDFile, RDFile, ASCII text, or MS Word file by exporting records from an existing database. Text files can be saved in text (*.txt) format, or in the Comma Separated Value (*.csv) format readable by most spreadsheets. When you export a file, all records in the current hit list are exported. You can include or exclude fields to be exported from a checklist. The Data Export dialog box is similar to the Data Import dialog box. It gives you options for file naming and file type selection, and lets you select which fields will be exported. If you save to an existing file, you have the option to replace or append the records.The Text Options tab of the dialog box con-tains options relevant to both text file export and structured text export. It also has an option (Prefix output filenames) relevant to Oracle subform data, and an option to select only the fields on the current tab (for tabbed Chem-BioFinder 12.0 forms).To export a file:
1. Use the File>Export submenu to select the output file type.The Data Export dialog box appears.
2. Type a name and path for the file, or click the File button and browse to an existing file.
3. Select/deselect the fields you want to export.
4. Click the Text Options tab and choose appropriate options.
NOTE: Choosing Comma delimited does not automatically set the file type. Text files (*.txt) may be either tab delimited or comma delimited. If you want to export in the Comma Separated Value (*.csv) format, you must name your file accordingly–either by typing the name or selecting the file type from the Save As dialog box.
5. Click the Export button.The file is exported.
Saving structuresSaving structures is similar to exporting them, without the fuss. To save the structure on display:
1. Right-click in the structure data box, and click the Save Structure context menu com-mand.The Save As dialog box appears.
2. Choose the destination directory.3. Type the file name and choose a file format.4. Click the Save.
The structure is saved to the indicated file. You can read these files with any application that supports the specified file format.
NOTE: To save most of the file types listed above, you must have ChemDraw ActiveX Con-trol Pro installed.
Using copy-paste with structuresYou can copy structures and paste them into Chem & Bio Draw or ISIS/Draw. You can also use the Copy As command to copy the structure as a text string.

ChemBioFinder & BioViz 395User Guide
The structure Copy As command has three options.
• The Name command invokes the CS Struct>Name ™ utility. Struct>Name gen-erates systematic chemical names with proper CIP stereochemistry descriptors.
• The SMILES command creates a SMILES string. A SMILES string is a standard way to describe a chemical structure in a line of text. Several software packages use SMILES strings as a way to enter and store chemical structure information.
• The InChI™ command invokes the CambridgeSoft implementation of the IUPAC InChI™ algorithm. The InChI™ algorithm takes a chemical structure and converts it into an alphanumeric string. A key aspect of the InChI™ algorithm is that the generated string is independent of the way that a structure is drawn, producing a consistent alphanumeric representation of different structural representations of the same structural formula (canonicalization).
NOTE: InChI™ is a registered trademark of the International Union of Pure and Applied Chemistry. InChI™ Material in ChemBioFinder 12.0 is © IUPAC 2008 .
All three commands place the data on the Clip-board, allowing it to be copied into other appli-cations.To copy a structure as a name or InChI™ string:
1. Click in the Structure box to select it.2. Right-click, and click the Copy As>Name or
Copy As>InChI submenu command.3. Paste the data into the other application
using Ctrl+V or the Edit>Paste menu com-mand.
Exporting an ASCII fileDelimited text files may be the most universal file format used by non-chemical applications. In a delimited text file, each line represents a record, and all fields in the record are listed in order from left to right, separated by some character such as a tab or a comma. Individual records are separated by carriage returns. ChemBioFinder 12.0 allows you to include a header line at the start of the file that lists the names of all of the fields. It also allows you to append to, or overwrite, existing text files.You can import a delimited text file saved by ChemBioFinder 12.0 into many other applica-tions, including spreadsheets and external data-base systems. Choose the .csv file format to export to spreadsheets, and the .txt format for general export.
NOTE: In delimited text files, structures are automatically exported as SMILES strings.
Exporting a Word fileThe export to MS Word option is similar to the other export options, however a couple of points are worth noting:
• Export to Word is much slower than to other formats. For this reason, you should probably limit the use of this option to rela-tively short hitlists.
• You can speed up the export by not export-ing the structure field.
• Structures are exported as OLE objects, and can be edited in Word with the Chem & Bio Draw Control.
• If you should, by accident, begin exporting a large database, you can terminate the

396 Importing and Exporting DataChapter 22
export by bringing ChemBioFinder 12.0 to the front and pressing the Esc key.
Exporting to SDFileWhen you export to SDFile, you are allowed to export subform fields. Each subform field is exported to a separate record in the SDFile, but separate subform records are concatenated into a single multi-line text block.To export subforms:
1. Click the File>Export>SDFile menu com-mand.The Data Export dialog box appears.
2. Click the Text Options tab, and select the Export subform data check box.
3. Return to the Export tab. In the Field col-umn of the Data Fields table, all subform fields now appear with checks in the check box next to the field name. Deselect any subform fields you do not wish to export (and select those main form fields you do wish to export).
4. Click the Export button.
NOTE: Re-importing a file of this type will not regenerate the original database! It will bring back the data, but not in the subtables and sub-forms you started with. To do this, export to cfxml.
When exporting to SDFile, you may append to, or overwrite, existing SD files. This option is only available for SD files and delimited text exports.
Exporting to STATISTICATo export data to STATISTICA:
1. Create or open a database.
2. Click File > Export > To STATISTICA. The Data Export dialog box appears:
NOTE: The preceding dialog box will appear only if STATISTICA is installed.
3. Specify a name for the output .xml file to which data is to be exported.
4. Click the Text Options tab. The following dialog box appears:
5. Set the text file export options based on the type of data you need to export.
6. Click the Export button. Once data is exported, STATISTICA is launched and the data is imported into STATISTICA. There-after, the analysis tools available in STA-

ChemBioFinder & BioViz 397User Guide
TISTICA can be used to analyse the exported data.
NOTE: Structure fields are not exported because STATISTICA can not process structure fields.
PrintingYou can print out all or part of your database.To print a database:
1. Before printing, decide if you want to print a table view or a form view. Set Chem-BioFinder 12.0 to the appropriate view.
2. Click the File>Print Setup menu command.3. In the Print Setup dialog box, set the
printer, paper size (default: US Letter), and page orientation desired. Click OK when you have finished.
TIP: Settings in this dialog box affect the Page Setup, so it’s best to start here.
4. Click the File>Page Setup menu command.
5. In the Page Setup dialog box, set the mar-gins and units (cm/inch), layout, and other options.• The Header option prints the file path at
the top of the page.• The Footer option prints the date, time and
record number at the bottom of the page.Click OK when you have finished.
6. Click the File>Print Preview menu com-mand to check the settings.
7. Click the File>Print menu command or the printer icon on the main tool bar.The Print dialog box appears.
8. Set the print range and number of copies. You may also select a different printer than the default.
NOTE: ChemBioFinder 12.0 defaults to printing a single page. This is indicated by the option labeled “Selection”. If, for example, you are printing in Form view and you set the layout in Page Setup to three per page, you will print the record selected and the next two records. If your layout is one per page (the default), you will print only the selected record. Note also that if a subform is selected, the entire record with the subform is printed.
9. Click OK when you have finished.

398 Importing and Exporting DataChapter 22

ChemBioFinder & BioViz 399User Guide
Relational Data and Subforms Subforms allow you to work with multiple data tables in a relational database. You should be familiar with working with ChemBioFinder 12.0 forms and databases before proceeding to subforms.
Access relational data A subform is a special box within a form that behaves like a separate form file. A subform is used to display information stored within a database, but it usually displays data from a different database (or different table within the same database) than the main form. A subform is usually linked to the main form, so that retrieval of data in the main form also retrieves related records in the subform.Like other types of boxes, you can move select and resize a subform on the main form. How-ever, you cannot select it by clicking inside it. You must click the title bar. When you click inside a subform, you activate the miniature form inside the box and can work within it.Below are examples of subform use:
• You have data that is associated in a “one-to-many” relationship. For example, you want to view a chemical structure together with its physical properties, stored in a separate table.
• You are running a stockroom and you want to store package sizes and prices in the
same place because they are related. Each chemical may be available in lots of pack-age sizes, and you wouldn’t want to re-draw the structure every time you added a new package. You can use a subform so the physical property information is entered once in the main form and the package sizes and prices are entered many times in the subform.By linking these two data tables with a linking field you can make these tables relational; one table can interact with the other. The contents of a linking field are not important, as long as they are different for each record in the main form. Various forms of ID numbers are often used as linking fields. As you browse through the main form, corresponding records in the subform appear.
Creating a subformYou create a subform, place form objects on it, and connect the subform to a database just as you do a regular form. For detailed information on these procedures, see “Forms” on page 311.
For users of version 8.0 and earlierCreating and linking subforms in Chem-BioFinder 12.0 was simplified in version 8.5.
23

400 Relational Data and SubformsChapter 23
Users of previous versions should note the fol-lowing changes:
• There is now a single dialog box which sets properties of both the subform box and its subform. You set all of the details in one place, in a single operation.
• In the new dialog box, the Database, Table, and Field tabs reflect the data source of the subform, not the parent form. The database tree control in the dialog box also shows subform data source. You can use the Explorer window to display the tree control of the parent data source, if they are differ-ent.As before, the Form tab shows properties of the subform, while the Subform tab shows properties of the box and the linkage between the subform and its parent.
• When creating a new subform, you get the same dialog box by clicking within the sub-form as by clicking on the box header.
• For convenience, the dialog box comes up automatically whenever you create a new subform box.
• After you have created a subform, the sub-form tool is deselected. This prevents the frequent mistake of drawing a subform box, then trying to draw a data box within it and getting another subform.
Creating a subform manuallyTo create a subform:
1. Start ChemBioFinder 12.0 and open or cre-ate a form.The form should have at least one data box, and be linked to an existing database.
2. Click the Subform button on the Form tool-bar.
3. Click somewhere in the form and drag to create a data box.When you release the mouse button the Subform Properties dialog box appears.
By default, newly created subforms are associ-ated with the same database as the main form. To use a different database as the data source for the subform:
1. Click the Open Database button.The Open dialog box appears.
2. Choose a database and click the Open but-ton.
3. Select the table to be linked (in this case, Synonyms).
4. Click the Form tab. Select the Generate form check box. If you want to set the style, click the Style button. See “Creating forms auto-matically” on page 311 for details on Form style.
5. Click the Subform tab. The tab should con-tain reasonable data (Link To SYNONYMS (subform) = SYN_ID, Title = Synonyms) based on the choices made so far.
6. Choose Mol_ID from the Link from MOLTABLE (main form) drop-down menu.
NOTE: To use the subform relationally to the main form, the two forms must have one field in common. This Linking Field must share the same data type (text, integer, real) as a field in the main form. The fields do not need to have the same name.
7. Modify box properties as desired. You may want to change the box title, font, or pres-ence of scrollbars.
8. Click OK. The new subform appears show-ing one synonym.

ChemBioFinder & BioViz 401User Guide
9. Optional: double-click in the subform to switch it to table view. The Subform is connected to the database you chose.
In this example, when a record is retrieved in the main form, its Molname is used to search the Synonym field of the Synonyms table of CS_Demo. The subform displays the hits from this search.
Subform generatorAutomatic subform generation is part of auto-matic form generation (see “Creating forms automatically” on page 311). To generate a subform:
1. Right-click on a blank area of the current form and click the Data Source... context menu command.The Form Properties dialog box appears.
2. In the Form Properties dialog box, select the Form tab.
3. Select the Generate form check box, then click the Style... button.The Form Generation dialog box appears.
4. Click the Subforms button.The Subform Generation dialog box appears.
5. For each subform you want to include:a. Choose a field in the Link from box to
specify the linking field of the parent form.
b. Expand the table you want to display in the subform in the Link to box, and select the linking field of the subform.
c. Click the Add button to append the selected subform to the list being gener-ated.
6. When you have added all subform links, click OK to close the dialog box and return to the Form Generation dialog.
Change existing subform layoutYou can use the Form Generator to automati-cally change the overall layout of an existing subform.To change the layout of an existing subform:
1. Right-click on the title bar of the subform data box and click the Properties... context menu command.The Box Properties dialog box appears.
2. In the Box Properties dialog box, select the Form tab.
3. Select the Generate form check box, then click the Style... button.The Form Generation dialog box appears. In the left panel, all of the Fields are selected by default.
4. Deselect those fields in the Choose fields to be included section that you want to exclude from the form.
5. In the Form style section, select the form options you want. For a detailed description of the options, see “Creating forms auto-matically” on page 311.
6. Click OK.7. Click the Properties dialog box.
A warning dialog box appears allowing you to create a new form or replace the existing form. Click No to create a new form, Yes to replace the existing form.The subform is automatically changed.
Working with subformsYou must select a subform to work with it. The subform title bar is highlighted when the sub-form is selected. After a subform is selected,
402 Relational Data and SubformsChapter 23
the toolbars affect the subform. You can use the Record tools to browse the subform and add records.To select a subform:
Click anywhere in the subform.To return to the main form:
Click the main form.To select a subform box:
With the selection tool, click in the title bar.
Searching a subformYou search a subform the same way you search the main form. You can search a sub-form and the main form simultaneously.To search a subform:
1. Click the Search>Enter Query menu com-mand to clear the subform and main form.
TIP: You can also click the Enter Query icon on the Search Toolbar or type Ctrl+F.
2. Enter a query in the subform data box. See “Queries” on page 357 for details on enter-ing queries.
3. Click the Search>Find menu command.If the subform is linked to the main form the hit list contains the main form records related to the matches in the subform search. You can browse and save this hit list just as you would a hit list from a main form search.
If the subform is not linked to the main form, it behaves independently of the main form and is searched separately.
Viewing subform data in a tableIf you have more than one record in the sub-form associated with a single record in the
main form, it may be more convenient to view the subform as a table while you browse through the main form. The table view shows you the complete list of related records for each entry in the main form.To display a subform in Table view:
• Select the subform and do one of the fol-lowing:• Double-click on a record in the table.• Click the View>Data Table>In Current
Window menu command.• Type Ctrl+T• Click the Switch to Table tool. A table view of the records in the subform appears.
To return to the Form view, repeat the above action.
Subform plotsA third type of view is the plot view. You can use BioViz to create a 1-D, 2-D, or histogram plot of any numerical field(s) of the data table connected to the subform. To create a subform plot:
You must be working with a form that has a subform with at least one column of numeric data.
1. Click the subform box to activate it.2. Click the View>Subform Plot View toggle.
The BioViz Plot Properties dialog box appears.
3. Set up the plot. See “Creating a plot” on page 425 for more information.
NOTE: For 2-D plots, both numeric fields must be in the data table associated with the subform data box.
The plot appears in the subform data box.
ChemBioFinder & BioViz 403User Guide
Subform plots have less functionality than reg-ular BioViz plots. While mousing over a point will highlight it, selection, filtering, and color-ing are disabled. Since selection is disabled, subform plots are always in “zoom on drag” mode. Use Control+W to toggle between the form, table, and plot views. The Switch to Table tool only toggles between form and table, as does double-clicking in the subform.
TIP: The subform remains selected until you click the main form, so you can only browse in the subform. If a plot is displayed, browsing does nothing.
If you toggle the main form to table view when a subform plot is displayed, the plot is dis-played as a graphic rather than an active plot.
Using scripts in subformsYou can specify a CAL script to be executed when you click an item in a subform in table view. The subform can then be used as a list selection box. The script can use CAL com-mands to retrieve the clicked item, and perform an action on it. For more information about CAL, see “CAL Commands” on page 497.To specify a CAL script:
1. Right-click on the subform header and click the Properties... context menu command.The Subform Properties dialog box appears.
2. In the Table script box, type the name of a CAL script or click the Edit button and select a script.
3. Click OK.In Table view, the entries are blue and underlined indicating that they are hot linked to a script.
4. Click any of the hot links to run the script.

404 Relational Data and SubformsChapter 23

ChemBioFinder & BioViz 405User Guide
Compound ProfilesCompound Profiles, a way of visually compar-ing and ranking structures based on values of selected properties. A compound profile is a graph, or, more typi-cally, a series of graphs, each of which plots the value of a numerical field in the database on a vertical bar color-coded to show regions of “cost”, or undesirability. These regions are defined by a cost profile associated with the field. In the profile, costs are normalized to score between 0 and 1, where the ideal is
assigned the value of zero, and the slope of the deviation to maximum (1) is user-defined.
NOTE: The function is a normalizing linear spline.
Figure 24.1 IC50 profile.
The cost profile is designed by the user to reflect their opinion of what constitutes a “good value” for a property. The user can adjust the cost profile to reflect how unhappy they would be when a compound deviates from the ideal value by changing the range of values at zero and the slope of the line to one. For example, a user might want a drug candi-date to have a good solubility (in units of
24

406 Compound ProfilesChapter 24
mg/ml) and good biological activity (in units of nm). They might be willing to sacrifice some activity to get better solubility, so the cost function for solubility would be adjusted to penalize any deviation from some “ideal” range more severely than the corresponding cost function for activity. The default display preference is to have white regions in the bars represent ideal values, darker regions increasing deviation from the ideal.The normalization function permits properties of different types to be compared. A score, the total deviation from “ideal” of all fields, is dis-played. Each property can be assigned a weight to adjust its effect on the overall calculation. The score is the same for a given compound regardless of whether or not you’ve done a sort, or where the compound appears within a hitlist. A “bad” compound has a high score.
Figure 24.2 A compound profile for MW, LogP, and IC50.
A compound profile is useful as a visual indi-cation of the “quality” of each compound. As such, it is most useful in table view, where you can see and compare several profiles at once. The highest benefit comes from using profiles in sort/search operations. You can pose one compound as the query, and then sort the remaining ones by deviation from that query.
Creating a compound profileProfiles are displayed on the form in a special data box, created with the Profile tool. To create a Profile box:
The database connected to the form or subform you are working with must have at least one numeric field.
NOTE: You can also include structure field in profile.
1. Click the Profile tool on the Form toolbar.
score
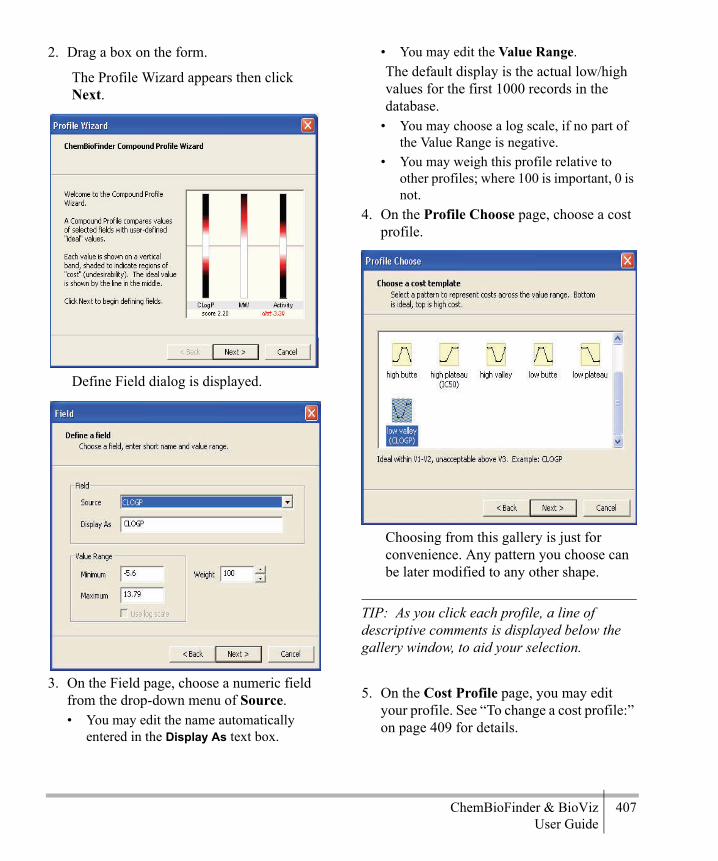
ChemBioFinder & BioViz 407User Guide
2. Drag a box on the form.
The Profile Wizard appears then click Next.
Define Field dialog is displayed.
3. On the Field page, choose a numeric field from the drop-down menu of Source. • You may edit the name automatically
entered in the Display As text box.
• You may edit the Value Range.The default display is the actual low/high values for the first 1000 records in the database.
• You may choose a log scale, if no part of the Value Range is negative.
• You may weigh this profile relative to other profiles; where 100 is important, 0 is not.
4. On the Profile Choose page, choose a cost profile.
Choosing from this gallery is just for convenience. Any pattern you choose can be later modified to any other shape.
TIP: As you click each profile, a line of descriptive comments is displayed below the gallery window, to aid your selection.
5. On the Cost Profile page, you may edit your profile. See “To change a cost profile:” on page 409 for details.

408 Compound ProfilesChapter 24
6. The Profile page of the wizard has an “add another field” check box that changes the Finish button to a Next button. Click Next to repeat the procedure for each profile you want to add. When you have added all of your profiles, click the Finish button. The profiles are displayed in the data box.
Editing a compound profileYou can edit any of the characteristics of a compound profile with the Compound Profile Editor.To edit a profile:
Double-click in the profile data box.The Compound Profile Editor appears.
To add a new profile:Right-click in the editor window, then click the Add Field context menu command.
To delete a profile:
1. On the Profile tab, click one of the profiles to select it.
2. Right-click in the editor window, then click the Remove Field context menu command.
To change the order of the profiles:
1. On the Profile tab, click one of the profiles to select it.
2. Right-click in the editor window, then click the <Move Left or >Move Right context menu command.
To change the field associated with a profile:
1. On the Profile tab, click one of the profiles to select it.
2. Click the Field tab. Change the Source with the drop-down menu. Change any of the other variables as required.
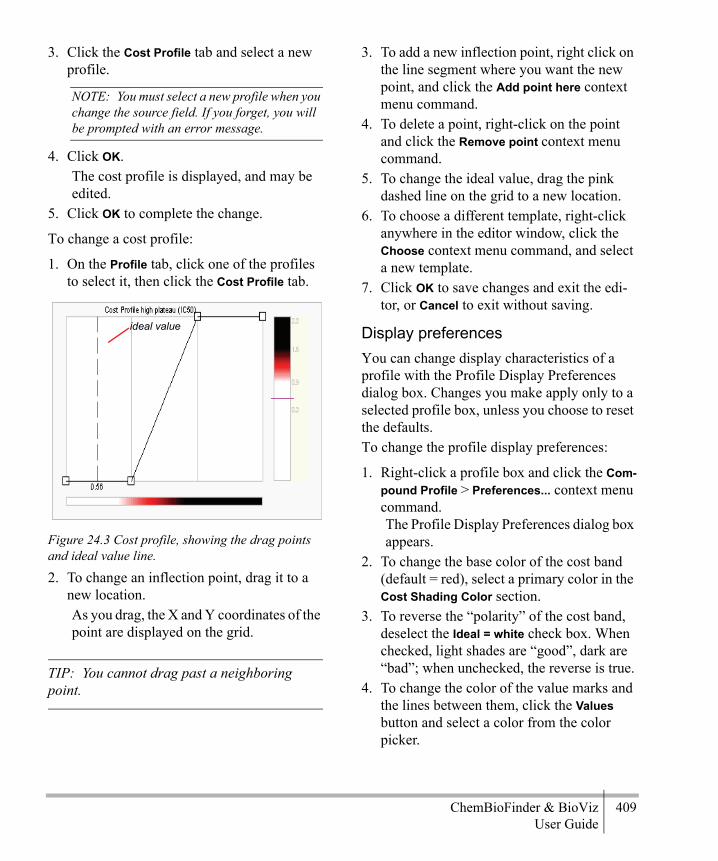
ChemBioFinder & BioViz 409User Guide
3. Click the Cost Profile tab and select a new profile.
NOTE: You must select a new profile when you change the source field. If you forget, you will be prompted with an error message.
4. Click OK. The cost profile is displayed, and may be edited.
5. Click OK to complete the change.
To change a cost profile:
1. On the Profile tab, click one of the profiles to select it, then click the Cost Profile tab.
Figure 24.3 Cost profile, showing the drag points and ideal value line.
2. To change an inflection point, drag it to a new location. As you drag, the X and Y coordinates of the point are displayed on the grid.
TIP: You cannot drag past a neighboring point.
3. To add a new inflection point, right click on the line segment where you want the new point, and click the Add point here context menu command.
4. To delete a point, right-click on the point and click the Remove point context menu command.
5. To change the ideal value, drag the pink dashed line on the grid to a new location.
6. To choose a different template, right-click anywhere in the editor window, click the Choose context menu command, and select a new template.
7. Click OK to save changes and exit the edi-tor, or Cancel to exit without saving.
Display preferencesYou can change display characteristics of a profile with the Profile Display Preferences dialog box. Changes you make apply only to a selected profile box, unless you choose to reset the defaults.To change the profile display preferences:
1. Right-click a profile box and click the Com-pound Profile > Preferences... context menu command.The Profile Display Preferences dialog box appears.
2. To change the base color of the cost band (default = red), select a primary color in the Cost Shading Color section.
3. To reverse the “polarity” of the cost band, deselect the Ideal = white check box. When checked, light shades are “good”, dark are “bad”; when unchecked, the reverse is true.
4. To change the color of the value marks and the lines between them, click the Values button and select a color from the color picker.
ideal value
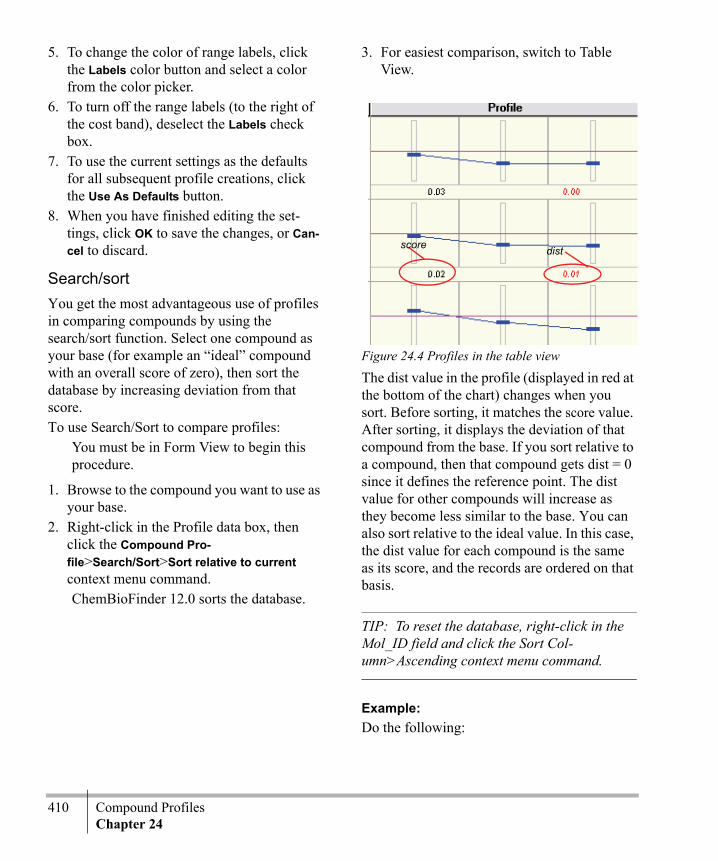
410 Compound ProfilesChapter 24
5. To change the color of range labels, click the Labels color button and select a color from the color picker.
6. To turn off the range labels (to the right of the cost band), deselect the Labels check box.
7. To use the current settings as the defaults for all subsequent profile creations, click the Use As Defaults button.
8. When you have finished editing the set-tings, click OK to save the changes, or Can-cel to discard.
Search/sortYou get the most advantageous use of profiles in comparing compounds by using the search/sort function. Select one compound as your base (for example an “ideal” compound with an overall score of zero), then sort the database by increasing deviation from that score.To use Search/Sort to compare profiles:
You must be in Form View to begin this procedure.
1. Browse to the compound you want to use as your base.
2. Right-click in the Profile data box, then click the Compound Pro-file>Search/Sort>Sort relative to current context menu command.ChemBioFinder 12.0 sorts the database.
3. For easiest comparison, switch to Table View.
Figure 24.4 Profiles in the table view
The dist value in the profile (displayed in red at the bottom of the chart) changes when you sort. Before sorting, it matches the score value. After sorting, it displays the deviation of that compound from the base. If you sort relative to a compound, then that compound gets dist = 0 since it defines the reference point. The dist value for other compounds will increase as they become less similar to the base. You can also sort relative to the ideal value. In this case, the dist value for each compound is the same as its score, and the records are ordered on that basis.
TIP: To reset the database, right-click in the Mol_ID field and click the Sort Col-umn>Ascending context menu command.
Example:Do the following:
distscore

ChemBioFinder & BioViz 411User Guide
1. In the CS Demo database, create a profile with one field, Molweight, and a cost pro-file such that values below 100 are ideal, and above 100 increasingly bad.
2. Browse through the compounds.Benzene (mw 78) falls in the ideal region, so it has a cost of zero and a score of zero. Buckyball fullerene (mw 800+) falls way outside the ideal, so it has a high cost and a score of 1.
3. Right-click in the profile box.4. Click the Compound Pro-
file>Search/Sort>Sort relative to ideal con-text menu command.
5. Click the Switch to Table icon to make it easier to compare the profiles.The compounds are ordered by dist value from 0.00 to 1.00. Note that the score and dist values are the same.
6. Browse to bromobenzene (mw 157).The score for this compound is not ideal. It will be approximately 0.1, depending on how you set the profile.
TIP: You can sort by Molname or MW to find the compound more easily.
7. Click the Switch to Table icon again to return to form view.
8. Right-click in the Profile data box, then click the Compound Pro-file>Search/Sort>Sort relative to current context menu command.
9. Switch back to Table View are browse the results.Bromobenzene is at the top of the list. Other compounds with similar scores follow. Note that the score and dist values are no longer equal.
CustomizingThe gallery of cost profile templates shown in the Cost Profile Chooser dialog box was designed to help you get started. Some are based on user experience, other chosen to pro-vide the most common cost profile patterns. As you work with the compound profiler, you will develop your own templates and may want to substitute them in the chooser.The templates are taken from files stored in the ...\ChemBioFinder\system\profiles\ folder. The files have a CPX extension, and the name of each file is the name given to the template. The Cost Profile Chooser displays all files in this directory having the CPX extension. The inter-nal format is XML, readable in Notepad. To remove a template from the chooser, delete the corresponding file, or move it to another location, or change its extension.To add or modify a template:
1. Double-click in the profile data box to open the Profile Editor, then click the Cost Profile tab.
2. Edit the profile until it looks the way you want.
3. Right-click in the edit window, then click the Save... context menu command.
4. When prompted, enter a line of descriptive comments to be displayed underneath the chooser window, and click OK.
5. Type the name you want to appear in the chooser, and click the Save button.

412 Compound ProfilesChapter 24
ChemBioFinder & BioViz 413User Guide
ChemBioFinder/OracleUsers familiar with ChemBioFinder 12.0 will find that, for the most part, Chem-BioFinder/Oracle operates the same way. You should be able to open a database, browse, search, register, load and so forth, without wor-rying about what sort of database is on the back end. In practice, however, there are sev-eral visible differences and a lot of invisible ones.When you open an Oracle database in Chem-BioFinder/Oracle, you enter a new body of code which connects directly to Oracle, and carries out all searches and transactions on the server. This new mode of operation requires a different underlying technology, based on Microsoft ActiveX Data Objects, and a differ-ent philosophy in some aspects of usage, such as the handling of lists, and new features, such as index management. All of these are described in this document. In ChemBioFinder/Oracle:
• Searches are carried out on the server, including structure searches.
• Search results are automatically deposited directly into tables in the Oracle database.
• Hitlists are not saved in files, but to other tables in Oracle.
• Saved lists can be annotated, and on restore can be selected from a pick-list directory.
• When working with large databases, you can choose a new mechanism which elimi-nates certain slow operations associated with large record sets (e.g., Move Last). This is a user choice because there are trade-offs involved.
• You cannot create an Oracle database, but if you have the privileges you can create a table within one. This causes import opera-tions to work somewhat differently.
• To improve performance, you can create indexes on selected columns.
Other more subtle differences are noted in the sections below.Structure search speed is very fast in Chem-BioFinder. The fast speed comes from two fac-tors: improvement of the SQL so that hits are added much faster to the hitlist table, and an optimization of certain frequent operations and improved screening efficiency that improves structure search speed in all CambridgeSoft products.
SetupBefore you can make use of the Chem-BioFinder/Oracle, your machine must be con-figured as an Oracle client. If you are already a user of the CS Oracle Cartridge, you are proba-bly all set. If not, you will need to enlist the
25

414 ChemBioFinder/OracleChapter 25
help of an Oracle administrator to set up the server and set you up as a client.For ChemBioFinder 12.0 installation instruc-tions, see the readme.txt included on the distri-bution media.Ideally, ChemBioFinder/Oracle should access any existing Oracle database in any format. In practice, there are some limitations. See “Pre-setup procedures” on page 539 for notes and recommendations about preparing an Oracle database for use with ChemBioFinder/Oracle.
Opening an Oracle databaseTo open an Oracle database:
1. Right-click in the form and click the Data Source... context menu command to open the Database tab of the Box Properties dia-log box.
2. Click the Oracle Database button. The CS Oracle Connection dialog opens.
NOTE: The Oracle Database button is available to any user. There is no check to see whether the machine is a valid Oracle client.
3. Enter values for Host name, User name, and Password — the same values you use to log in from any Oracle client. OR:
• Choose a name from the drop-down list of recently-used items. When you choose an item from this list, it automatically fills in the user name, and the password if Save password was checked when the item was created.NOTE: The first time you bring up the Oracle Connection dialog box there is no list of recent items, so ChemBioFinder 12.0 offers to create one for you. If you accept, it generates a list of
all available hosts, as found in the file tnsnames.ora created during Oracle client configuration.
• The database is opened and the list of tables displayed.
NOTE: The list of tables shown in the tree consists of all tables and views owned by the current user, plus those to which the user has been granted certain privileges. To see the details, you can turn on SQL tracing while a database is being opened.
4. Proceed as you would for any Chem-BioFinder 12.0 database: click to select the table you want to display, set other desired options, and check the box on the Form tab if you want to generate a form automati-cally.The Oracle tab of the dialog, described in “Setting Oracle preferences” on page 417 The features on this tab are mainly for advanced users and do not require adjustment.
NOTE: The Oracle tab appears in the Properties dialog only when an Oracle database is open.
5. Click OK.The database opens, in a display form if you requested one.
The Database Wizard can also be used to open an Oracle database. A button on the Wizard labeled CS Oracle Cartridge brings up the appropriate Oracle parts of the process.When you have opened an Oracle database, note that some Properties dialog tabs show entries not available in ChemBioFinder 12.0, including:
• Database tab: CS Oracle Cartridge version if any.
ChemBioFinder & BioViz 415User Guide
• Table tab: Table owner name; name of pri-mary index if any.
• Field tab: Oracle native data type name; name of associated index if any.
When you open an Oracle database and select a table, ChemBioFinder/Oracle gathers infor-mation about the columns. If you open a table you know to contain structures, and Chem-BioFinder/Oracle does not show a structure (or formula or molweight) column, then it may be necessary to set up some configuration infor-mation about the table. For details, see “Con-figuring via CF_SETTINGS table” on page 540.
SearchingFrom the user's point of view, searching in ChemBioFinder/Oracle works basically the same way as in ChemBioFinder 12.0: you enter a query, search, then work with the hitlist. Internally, however, the Chem-BioFinder/Oracle machinery is quite different.There are three types of table involved in han-dling hit lists. All are created in your own tablespace. One is global, applying to all lists saved from any table; others are connected to the particular table or view being searched.
• CF_HITLISTS. The directory of all saved lists. This table is created the first time any list is saved.
• SAVED_tablename: All lists which have been explicitly saved from a given table or view. This is created the first time a list is saved.
• HITS_tablename: All lists automatically saved after every search over a given table
or view. This table is created the first time a search or list operation is carried out and is deleted at the end of the session.
Here's what happens when you present a query to ChemBioFinder/Oracle:
1. If the query contains a structure, it is con-verted to a text representation and copied to a temporary table.NOTE: The table is called temp_queries. It is created in the CSCartridge tablespace, and removed as soon as the search is finished or interrupted. ChemBioFinder 12.0 does not yet handle the case of multiple structure boxes where more than one contains a query.
2. The query is converted to a SQL select statement. Query components in form boxes are ANDed together (just as in Chem-BioFinder 12.0), where the structural parts are calls into the CS Oracle Cartridge struc-ture search functions.
3. The hits table is created, if it does not already exist.
4. A unique ID is assigned to the new list which will result from the search.
5. The select statement is wrapped in a larger SQL statement which will cause the results to be deposited directly into the hits table.
6. The SQL is executed.7. When the search is complete, the results are
new rows in the hits table. Each row con-tains the new list ID alongside the ID of a record from the searched table.
8. The final list is prepared by a join, selecting rows from the main table which have record

416 ChemBioFinder/OracleChapter 25
ID's matching those of the new list in the hits table. The resulting list is ready to browse, save, export, etc.
NOTE: Text searches in Oracle are case sensi-tive. You will get different hits from the query “benz*” than from “Benz*.”
SortingCertain sort operations require a Chem-BioFinder 12.0 system table, CF$_SORT, that may not exist in your current form. If the table does not exist, you will be alerted the first time you attempt such a search in an Oracle data-base. To create the CF$_SORT table:
1. Open a new form, then click the File>Data-base menu command. The Form Properties dialog box opens.
2. On the Database tab, click the Oracle Data-base... button.
3. Log in as the owner of the schema where your ChemBioFinder 12.0 system tables are located. Typically this will be Chem-BioFinder
NOTE: If you do not have privileges to log in as this user, consult a system administrator.
4. Click the Oracle tab of the dialog box, then click the Prepare Schema button. ChemBioFinder 12.0 will create the one new table needed, without modifying any of the others.
NOTE: If this button is dimmed, it means you are not logged in as the owner of the current schema.
5. Go back to your original form and repeat the sort.
TIP: You may have to click Refresh Session Data on the Oracle tab before the sort will work.
Subform value aggregateIn an Oracle database, ChemBioFinder 12.0 allows sorting the main list over subform field aggregate values. If, for example, you have a subform showing a column of test values where there are multiple records in the sub-form for each main record, you can sort the main hitlist based on the sum or average of the set of test values for each record. To sort by aggregate:
1. Click the Record>Sort menu command to bring up the Sort Multiple dialog box.
2. Click a subform value in the left-hand box to sort by.
3. In the right-hand box, right-click the Fxn column and choose a function from the popup menu: MIN, MAX, AVG, or SUM.
4. Click OK. The hitlist is sorted by the selected value(s).
NOTE: AVG and SUM are available only for numeric fields; MIN and MAX can also be used for text fields.
Handling lists There are differences between ChemBioFinder 12.0 and ChemBioFinder/Oracle in working with hitlists:

ChemBioFinder & BioViz 417User Guide
• Save List does not bring up a file dialog in ChemBioFinder/Oracle; instead, it presents a dialog in which you enter a name and a line of comments for each list.
• Restore List presents a dialog in which you choose from the available saved lists (see screen shot below).
• Restore Previous List is no longer dimmed after you have done a single search; it is available, and will return you to the full list. (This is true also in ChemBioFinder 12.0.)
• Over Current List, Omit From List, and Find List work as before.
Setting Oracle preferencesWhen you are working with an Oracle data-base, the Properties dialog contains a tab for Oracle settings. Items currently in this tab are as follows:
• Auto-sort on. Displays the default sort field. All lists will be sorted in ascending order over this field if no other sort criterion has been specified. At present, the auto-sort field is always the primary key, and cannot be changed.
• Primary key. Names the primary key of the current table, if any.
• Saved hits. Displays the name of the table in which saved hitlists are stored for the current form, if one has been created.
• Records per retrieve. Sets the size of the ADO recordset cache, that is, the number of records brought to the client for each retrieve operation. This value can be adjusted for better performance, but in practice it does not have much effect.
• Cache ID's for faster moves. Checking this box enables a new record-retrieval scheme designed for more efficient browsing of large lists; details are given in “Fast-move caching scheme” on page 540. The state of this check box is saved with the formfile. Currently, when you check or uncheck this box, you must save and reopen the form before proceeding.
• SQL Trace to file. Check this box to gener-ate a text file of the SQL being sent from ChemBioFinder 12.0 to Oracle. To specify an output file, enter a pathname or use the browse button. The file is never overwrit-ten: new data are always appended. Tracing begins when this box is checked, and ends when it is unchecked. If you exit Chem-BioFinder 12.0 with tracing in effect, it will be in effect the next time you start up, and you will be given a quick warning about it on the status bar.
CAUTION
The trace file can become very large if you turn on this feature and forget about it.
Updating and adding dataIf you have privileges to add, update, and delete in the table connected to your form, then
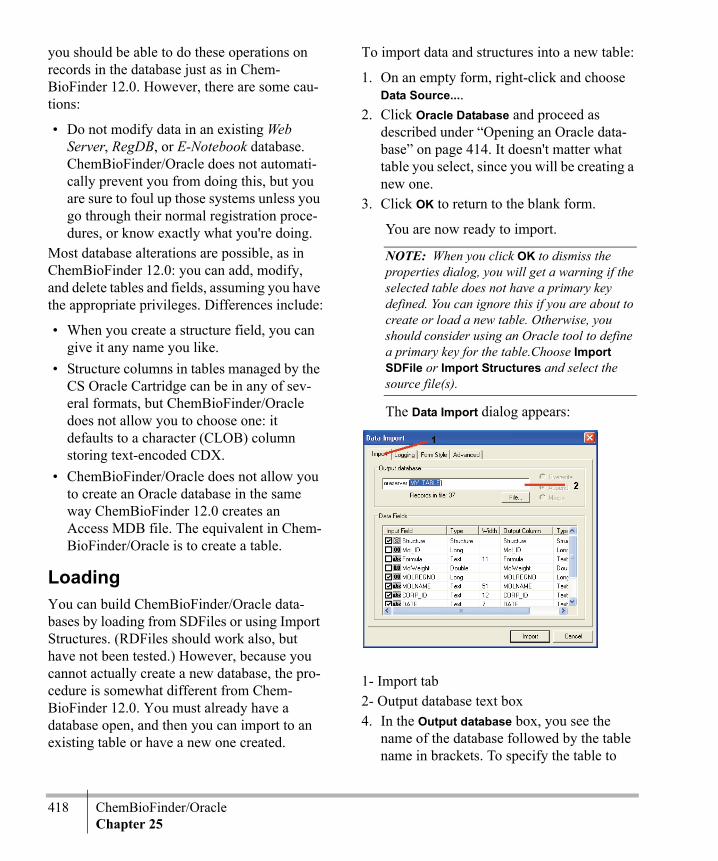
418 ChemBioFinder/OracleChapter 25
you should be able to do these operations on records in the database just as in Chem-BioFinder 12.0. However, there are some cau-tions:
• Do not modify data in an existing Web Server, RegDB, or E-Notebook database. ChemBioFinder/Oracle does not automati-cally prevent you from doing this, but you are sure to foul up those systems unless you go through their normal registration proce-dures, or know exactly what you're doing.
Most database alterations are possible, as in ChemBioFinder 12.0: you can add, modify, and delete tables and fields, assuming you have the appropriate privileges. Differences include:
• When you create a structure field, you can give it any name you like.
• Structure columns in tables managed by the CS Oracle Cartridge can be in any of sev-eral formats, but ChemBioFinder/Oracle does not allow you to choose one: it defaults to a character (CLOB) column storing text-encoded CDX.
• ChemBioFinder/Oracle does not allow you to create an Oracle database in the same way ChemBioFinder 12.0 creates an Access MDB file. The equivalent in Chem-BioFinder/Oracle is to create a table.
LoadingYou can build ChemBioFinder/Oracle data-bases by loading from SDFiles or using Import Structures. (RDFiles should work also, but have not been tested.) However, because you cannot actually create a new database, the pro-cedure is somewhat different from Chem-BioFinder 12.0. You must already have a database open, and then you can import to an existing table or have a new one created.
To import data and structures into a new table:
1. On an empty form, right-click and choose Data Source....
2. Click Oracle Database and proceed as described under “Opening an Oracle data-base” on page 414. It doesn't matter what table you select, since you will be creating a new one.
3. Click OK to return to the blank form.
You are now ready to import.
NOTE: When you click OK to dismiss the properties dialog, you will get a warning if the selected table does not have a primary key defined. You can ignore this if you are about to create or load a new table. Otherwise, you should consider using an Oracle tool to define a primary key for the table.Choose Import SDFile or Import Structures and select the source file(s).
The Data Import dialog appears:
1- Import tab2- Output database text box4. In the Output database box, you see the
name of the database followed by the table name in brackets. To specify the table to

ChemBioFinder & BioViz 419User Guide
load, edit the table name by typing between the brackets. If you want to create a new table, enter the name you wish to give it. If you want to append to an existing table, enter its name.
5. Set other options as desired, and click Import to begin the process.
TIP: for text fields being imported, make them wider than the value determined by the input scan. (To do this, double-click the name under Input Field and enter a larger Width value.) Oth-erwise you might have problems if you append more records later.
6. After importing, you should create a pri-mary key and index; see “Indexing” on page 419.
To append to an existing table follow the pro-cedure above except:
• Step 1: You can start with an existing form instead of a blank one
• Step 2: You should select the target table. When you do, there will be no need to edit the table name in Step 5.
IndexingAs every Oracle administrator knows, a key to good performance is to index certain columns so that searches over them become fast look-ups. If you intend to create, load, or manage tables, then you are an administrator, and need to know something about indexing. Chem-BioFinder/Oracle provides a few tools to assist you.There are two types of index of interest to ChemBioFinder/Oracle:
• Structure indexes. Any column containing structures should have an index created by the CS Oracle Cartridge. If there is no index, searching is still possible, but very slow.
• Primary keys. A table containing a column of structures should also have a column of unique record identifiers for use in various list-handling operations. Preferably this column is of type INTEGER and is desig-nated as the primary key of the table.
ChemBioFinder 12.0 provides information about these indexes, and allows you to create or recreate them if necessary.To create a structure index:
1. Right-click on the structure box of an Oracle-connected form, and choose Proper-ties....
2. Go to the Field tab of the dialog. If the selected field is indexed, the index name is shown in the properties box. In the example below, the index is named IX50.
1- Field name

420 ChemBioFinder/OracleChapter 25
2- Index name
NOTE: If there is no index, or the field is not indexable, the Index line does not appear in the list.
3. If there is no index, click Create Index.
NOTE: If this button does not appear, it means the selected field is not a candidate for indexing.
4. In the Create Index dialog, provide a name for the new index and click OK.
The index is created.You will get an error message from Oracle if:
• You provide an index name which is already in use, OR...
• The column already has an index.
ChemBioFinder/Oracle does not provide a direct way to delete or overwrite an index, but the CAL SQL command can be used for this purpose.To create a primary key index:
The process is the same as for a structure index, except that you carry it out on a field of type Long. This creates an index on the
field and also designates it as the primary key. It will fail unless the column already contains unique, non-null values.
NOTE: A new button, Set As Structure, may appear if you have selected a certain type of column. This is an advanced feature described in “Configuring via CF_SETTINGS table” on page 540.
TIP: If you want to create a primary key, but don't have a column of unique integer values, you can create one using a CAL script. For example (assuming you've already created a column and form box called “ID”):
loopputdata ID $indexrecord commitrecord nextendloop
CALSome new features have been introduced into ChemBioFinder 12.0 Automation Language (CAL) to support Oracle. Some are not specific to Oracle, but of general utility:
• SQL command. When you are connected to an Oracle database, you can pass any SQL command which does not return records. The format is simply SQL <command> where the command is not quoted. Example:
SQL create table mytable (id inte-ger).
• CURR_TABLE variable. This variable con-tains the name of the table connected to the

ChemBioFinder & BioViz 421User Guide
current form. This works whether or not you are in Oracle. Example: MSG Current table is
$CURR_TABLE
• OPENDB allows change of table. Normally this command takes the name of a database, followed optionally by the name of a table in angle brackets. In ChemBioFinder 12.0, it can now take just the table name, and causes the form to become attached to a dif-ferent table in the current database — as if you had brought up Properties and clicked a different table name. Example:
OPENDB <CHEM_STRUCTS>causes the current form to be connected to the table CHEM_STRUCTS.
• STATMSG command displays a message on the status bar. Format: STATMSG <mes-sage>.Example: STATMSG Search is now in
progress...• SEARCH SAVE LIST, RESTORE LIST
work with Oracle. Normally you can follow either of these commands with the name of a file; in ChemBioFinder/Oracle you can instead provide a list name.

422 ChemBioFinder/OracleChapter 25

ChemBioFinder & BioViz 423User Guide
BioVizWith BioViz, you can identify trends and cor-relations in your data, and within subsets of your data, without the extra step of exporting to another application. You can have as many plot windows as you like, each showing a dif-ferent visualization of data from the current form. BioViz is designed to be used with the Struc-ture Window and the Queries Tree. While not necessary to creating visualizations, they offer considerable convenience when working with plots. Before working with BioViz, go to the View menu and activate the Structure and Explorer windows. The Structure window gives you a way to display structures without taking up room on the form. The Queries Tree in the Explorer Window gives you an easy way to track multiple hitlists.To create a new plot, view an existing plot, or delete a plot, use the BioViz Plots submenu of the View menu. Plots are saved with the form and will come back when it is opened, though they may be hidden.
Changes in version 11
User-customizable styles
Point shapesYou can select one of six shapes for data points: square, circle, triangle, diamond, cross,
or star. Selected or moused-over points retain the same display as in earlier versions: the selected point is displayed as a double hollow red circle, and points being moused-over (pointed at) are displayed as red solid with a black circle.Point shape selection is from the Display tab of the BioViz Plot Properties dialog box.
AxesYou can set both the content and the font used for each axis. The default X and Y labels are the names of the fields plotted, but you can now enter any text in any font to override the default. You may also choose whether or not to display the X and/or Y grids by using the check box next to each label.
TIP: Labels are “sticky”, that is, the labels used for the previous plot are the defaults for the next plot created. If you entered axis labels for Plot 1 and want to use default labels for Plot 2, you must go to the Display tab to delete the label entries when you create Plot 2.
LegendYou can add a legend or comments to be dis-played on the plot.
26
424 BioVizChapter 26
1. Right-click in the plot, then click the Prop-erties... context menu command.The BioViz Plot Properties dialog box appears.
TIP: You must right-click either in the plot area or in the top border. Clicking any other border brings up different context menus. See “Changing the display” on page 433 for details.
2. On the Display tab, enter your legend in the Comment text box. You may also enter a font and point size for the legend.
3. Click OK to display the legend.
The default position for the legend is in the upper right corner of the plot. After you have created it, you may position it where you want by dragging it.To remove the legend, open the BioViz Plot Properties dialog box and delete the text in the Comment box.
Background colorYou can choose any background color you want for a chart. A Color...button on the Dis-play tab of the BioViz Plot Properties dialog box opens a color picker dialog box.
Other changes
Extended state saving. Filter slider positions and colored-by state of plots are now saved with the form.Improved Filter display. See “Filtering” on page 430 for details. Improved statistical display. See “Statistical analysis” on page 428 for details.Improved Histogram bar coloring. See “His-tograms” on page 425 for details.
Changes in version 10
Removal of empty pointsIn version 9, a point which has an X value, but not a Y value, is represented as a so-called “empty” point on the plot with a distinctive marker. If there is a Y value, but no X value, the point is simply omitted (though noted). Version 10 omits both “empty” X and “empty” Y points. All omitted points are noted, and may be reviewed by clicking the Notes button at the bottom of the chart.
Selection and mouse-oversTo facilitate viewing selected points when que-ries are displayed, the selected point is dis-played as a double hollow red circle. Points being moused-over (pointed at) are displayed as red solid with a black circle. Mousing over a selected point displays a double hollow red cir-cle surrounded by a black circle. Points belonging to queries are displayed as solid col-ored points without circles.
Details windowThe Details Window displays field values (other than Structure) when viewing a BioViz plot. To display the Details window, select it from the View menu. The window floats by default, but can be docked with other windows. To add new fields to the Details Window:
1. Right click in the Details Window.2. Select the field to be displayed.
A check mark appears next to the selected field. Fields display in the order you select them.
3. To remove a field from the Details Window, right-click and deselect it.
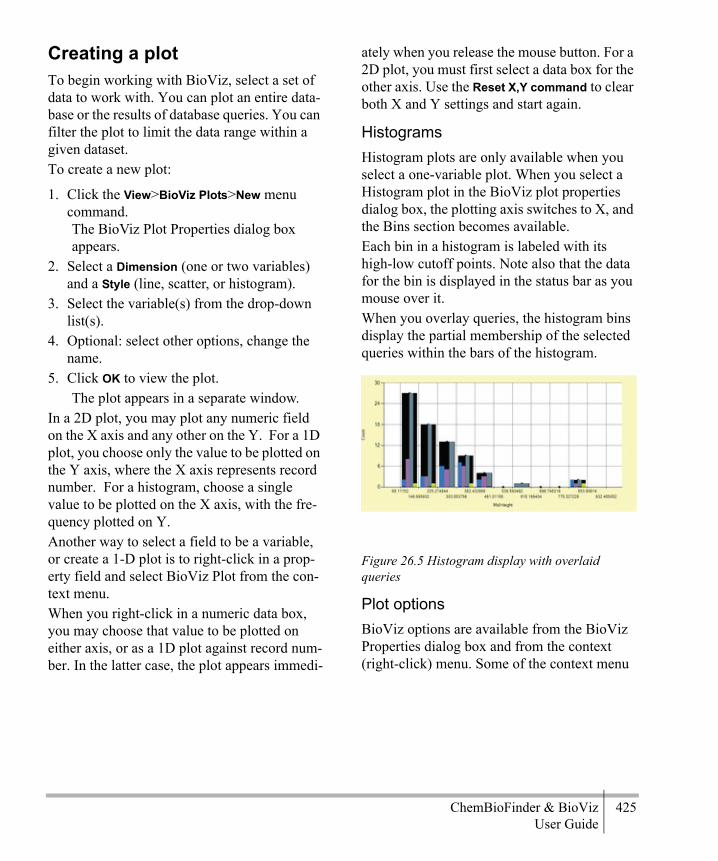
ChemBioFinder & BioViz 425User Guide
Creating a plotTo begin working with BioViz, select a set of data to work with. You can plot an entire data-base or the results of database queries. You can filter the plot to limit the data range within a given dataset. To create a new plot:
1. Click the View>BioViz Plots>New menu command.The BioViz Plot Properties dialog box appears.
2. Select a Dimension (one or two variables) and a Style (line, scatter, or histogram).
3. Select the variable(s) from the drop-down list(s).
4. Optional: select other options, change the name.
5. Click OK to view the plot.The plot appears in a separate window.
In a 2D plot, you may plot any numeric field on the X axis and any other on the Y. For a 1D plot, you choose only the value to be plotted on the Y axis, where the X axis represents record number. For a histogram, choose a single value to be plotted on the X axis, with the fre-quency plotted on Y.Another way to select a field to be a variable, or create a 1-D plot is to right-click in a prop-erty field and select BioViz Plot from the con-text menu.When you right-click in a numeric data box, you may choose that value to be plotted on either axis, or as a 1D plot against record num-ber. In the latter case, the plot appears immedi-
ately when you release the mouse button. For a 2D plot, you must first select a data box for the other axis. Use the Reset X,Y command to clear both X and Y settings and start again.
HistogramsHistogram plots are only available when you select a one-variable plot. When you select a Histogram plot in the BioViz plot properties dialog box, the plotting axis switches to X, and the Bins section becomes available.Each bin in a histogram is labeled with its high-low cutoff points. Note also that the data for the bin is displayed in the status bar as you mouse over it. When you overlay queries, the histogram bins display the partial membership of the selected queries within the bars of the histogram.
Figure 26.5 Histogram display with overlaid queries
Plot optionsBioViz options are available from the BioViz Properties dialog box and from the context (right-click) menu. Some of the context menu
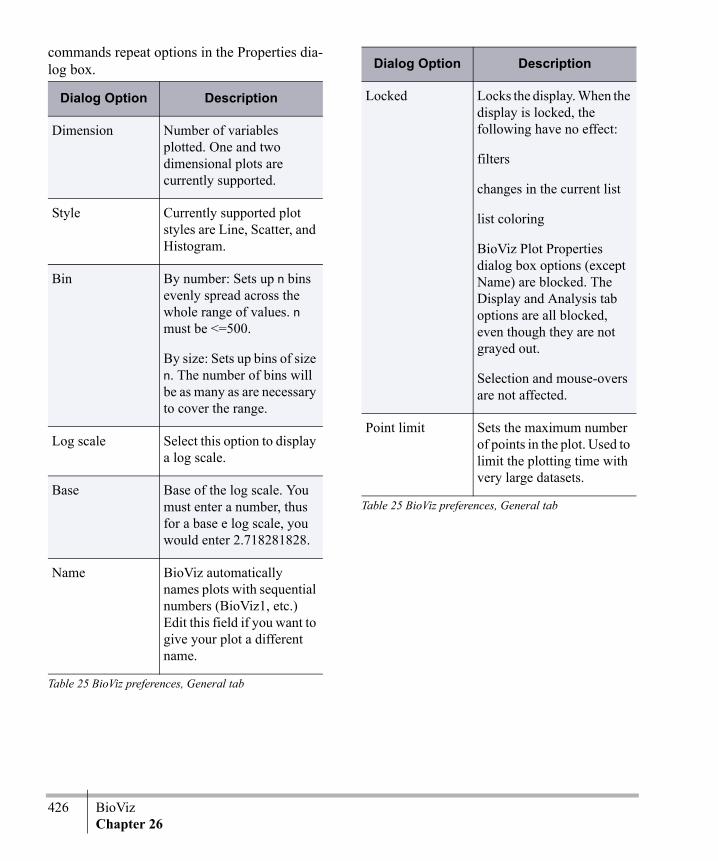
426 BioVizChapter 26
commands repeat options in the Properties dia-log box.
Dialog Option Description
Dimension Number of variables plotted. One and two dimensional plots are currently supported.
Style Currently supported plot styles are Line, Scatter, and Histogram.
Bin By number: Sets up n bins evenly spread across the whole range of values. n must be <=500.
By size: Sets up bins of size n. The number of bins will be as many as are necessary to cover the range.
Log scale Select this option to display a log scale.
Base Base of the log scale. You must enter a number, thus for a base e log scale, you would enter 2.718281828.
Name BioViz automatically names plots with sequential numbers (BioViz1, etc.) Edit this field if you want to give your plot a different name.
Table 25 BioViz preferences, General tab
Locked Locks the display. When the display is locked, the following have no effect:
filters
changes in the current list
list coloring
BioViz Plot Properties dialog box options (except Name) are blocked. The Display and Analysis tab options are all blocked, even though they are not grayed out.
Selection and mouse-overs are not affected.
Point limit Sets the maximum number of points in the plot. Used to limit the plotting time with very large datasets.
Dialog Option Description
Table 25 BioViz preferences, General tab
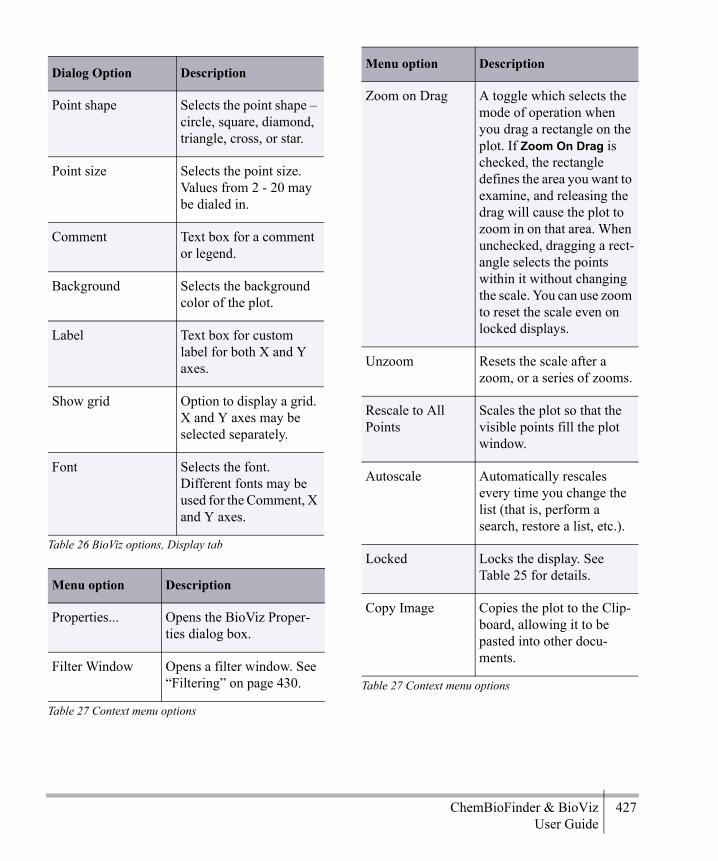
ChemBioFinder & BioViz 427User Guide
Dialog Option Description
Point shape Selects the point shape – circle, square, diamond, triangle, cross, or star.
Point size Selects the point size. Values from 2 - 20 may be dialed in.
Comment Text box for a comment or legend.
Background Selects the background color of the plot.
Label Text box for custom label for both X and Y axes.
Show grid Option to display a grid. X and Y axes may be selected separately.
Font Selects the font. Different fonts may be used for the Comment, X and Y axes.
Table 26 BioViz options, Display tab
Menu option Description
Properties... Opens the BioViz Proper-ties dialog box.
Filter Window Opens a filter window. See “Filtering” on page 430.
Table 27 Context menu options
Zoom on Drag A toggle which selects the mode of operation when you drag a rectangle on the plot. If Zoom On Drag is checked, the rectangle defines the area you want to examine, and releasing the drag will cause the plot to zoom in on that area. When unchecked, dragging a rect-angle selects the points within it without changing the scale. You can use zoom to reset the scale even on locked displays.
Unzoom Resets the scale after a zoom, or a series of zooms.
Rescale to All Points
Scales the plot so that the visible points fill the plot window.
Autoscale Automatically rescales every time you change the list (that is, perform a search, restore a list, etc.).
Locked Locks the display. See Table 25 for details.
Copy Image Copies the plot to the Clip-board, allowing it to be pasted into other docu-ments.
Menu option Description
Table 27 Context menu options

428 BioVizChapter 26
Statistical analysisYou can perform statistical analysis on BioViz plots. When you specify two variables, a third
tab appears on the BioViz Properties dialog box.
Figure 26.6 The Analysis tab appears when two variables are specified.
For descriptive statistics, minimum, maximum, mean, median, and standard deviation can be calculated for both X and Y variables. R-
Selection to List Creates a hitlist from selected data points. The list is displayed in the Queries Tree and is treated and saved like any other search query.
You cannot use Restore Query on a list selected this way, but you can use Restore List to retrieve the records.
Menu option Description
Table 27 Context menu options
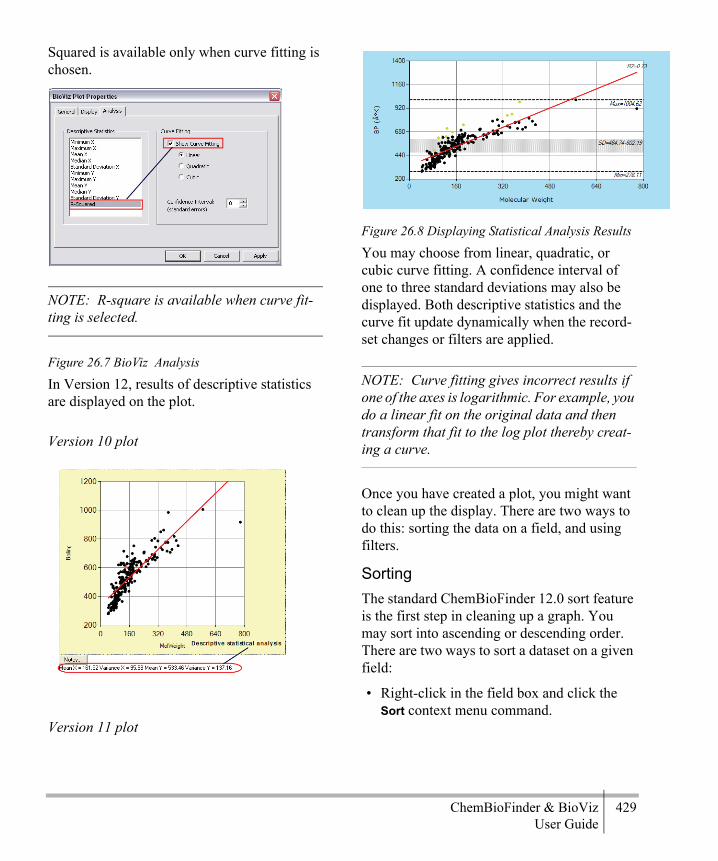
ChemBioFinder & BioViz 429User Guide
Squared is available only when curve fitting is chosen.
NOTE: R-square is available when curve fit-ting is selected.
Figure 26.7 BioViz Analysis
In Version 12, results of descriptive statistics are displayed on the plot.
Version 10 plot
Version 11 plot
Figure 26.8 Displaying Statistical Analysis Results
You may choose from linear, quadratic, or cubic curve fitting. A confidence interval of one to three standard deviations may also be displayed. Both descriptive statistics and the curve fit update dynamically when the record-set changes or filters are applied.
NOTE: Curve fitting gives incorrect results if one of the axes is logarithmic. For example, you do a linear fit on the original data and then transform that fit to the log plot thereby creat-ing a curve.
Once you have created a plot, you might want to clean up the display. There are two ways to do this: sorting the data on a field, and using filters.
SortingThe standard ChemBioFinder 12.0 sort feature is the first step in cleaning up a graph. You may sort into ascending or descending order. There are two ways to sort a dataset on a given field:
• Right-click in the field box and click the Sort context menu command.

430 BioVizChapter 26
• Display the Data table view, and double-click on the table header of the field you want to sort.
FilteringBioViz filters limit the display of a variable by trimming either end of the range, that is, you can eliminate high points, low points, or both from the display. Filters can be set for either or both plotted variables. You may also filter the dataset on other variables, up to a total of 31 filters per chart.
Figure 26.9 Filter sliders
Filters are set in the filter window. If the window is not visible, check the box next to Filter Window on the View menu. When a filter is set:
• All plots associated with a given form are affected, unless the plot is locked before applying the filter.
• Points missing a value for a given field are hidden whenever the filter for that field is visible.
The range is displayed in black below the slider, and the set points in red above the slider. Filter name is centered, rather than on
New filter style
Old filter style
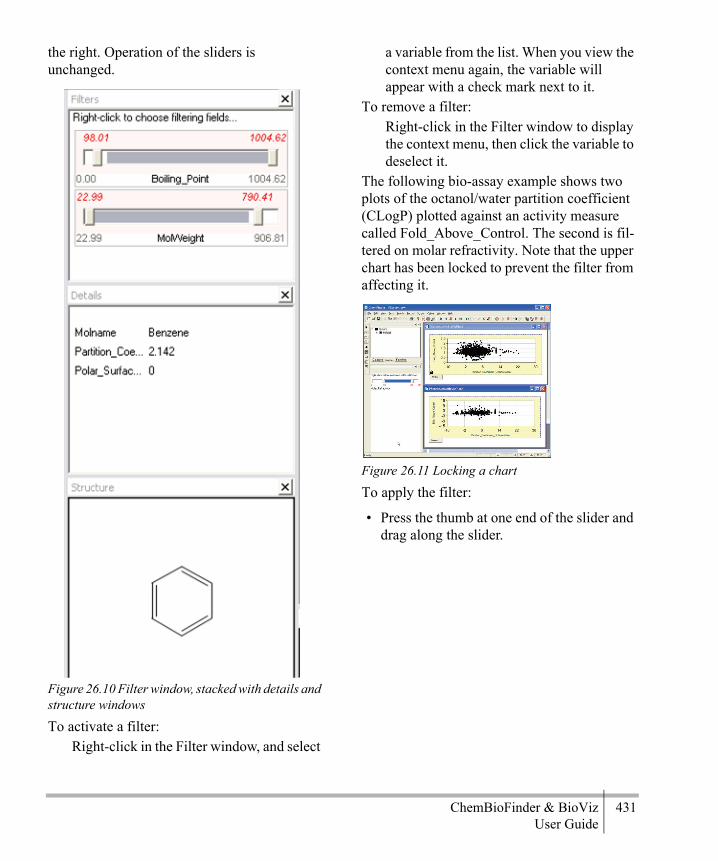
ChemBioFinder & BioViz 431User Guide
the right. Operation of the sliders is unchanged.
Figure 26.10 Filter window, stacked with details and structure windows
To activate a filter:Right-click in the Filter window, and select
a variable from the list. When you view the context menu again, the variable will appear with a check mark next to it.
To remove a filter:Right-click in the Filter window to display the context menu, then click the variable to deselect it.
The following bio-assay example shows two plots of the octanol/water partition coefficient (CLogP) plotted against an activity measure called Fold_Above_Control. The second is fil-tered on molar refractivity. Note that the upper chart has been locked to prevent the filter from affecting it.
Figure 26.11 Locking a chart
To apply the filter:
• Press the thumb at one end of the slider and drag along the slider.

432 BioVizChapter 26
• In the bottom diagram, the plot is limited to Molar_Refractivity from 10 to 33.
Figure 26.12 Histogram Filtering
Filter slider adjustmentOnce the top and/or bottom of the range has been set, you can move the entire range. For example, the Boiling Point filter has been set to display a range of about 250° —from 501.3°K to 753°K.
Figure 26.13 Filter Slider Adjustments
By dragging the blue part of the slider, you can view any 250° range of the chart that you want. The range being displayed has been moved to 651.5°K—903.2°K. The size of the range hasn’t changed, just its location.
Plotting queriesWhen you perform queries (see “Queries” on page 357), and have one or more hitlists
attached to your form, the BioViz plot displays the results of the current hitlist. You can dis-play overlays by selecting hitlists rather than making them current. For example, shows results of a screening test relative to a control.
Figure 26.14 Screening test results
To remove outliers more than 2.5SD from the control:
• Search for “<2.5 and >-2.5” in the SDs Above Control field.
• The plot displays the results for the hitlist.
NOTE: By default, the hits are shown on the same scale as the original list, which may cause them to cluster in one sector of the window. If this happens, right-click the plot and choose Rescale to All Points or Auto-scale. Rescale to All Points operates on the current datapoints only; Auto-scale sets a switch so that all subsequent searches and list operations will automatically rescale the plot.
To display the results of an overlay on the full list:
1. Open the Queries pane of the Explorer Win-dow.
2. Double-click on the Full List to make it the current list.
A
B

ChemBioFinder & BioViz 433User Guide
3. Click the query to select it for display, over the current list.
Figure 26.15 : Using overlays
Selecting a list by single-clicking in the queries tree (or choosing Color On Plot from the tree context menu) causes points on the plot to be recolored. The recolored points are those which are on both the selected list and the plot-ted one. You may color more than one list at a time. When a list is colored on the plot, its item in the queries tree is shown with a check mark; clicking it a second time uncolors it and removes the check mark.
Synchronization of plotsMultiple plots attached to a form are synchro-nized. If you select (mouse over) a point in one plot, the same point is highlighted in all other plots (and the related structure is displayed in the Structure Window).This behavior is slightly modified if one of the plots is a histogram. You must select (not mouse over) a histogram bar to highlight points in other plots. Mousing over a point in a
line or scatter plot will highlight the point in the center of the corresponding histogram bar.
Figure 26.16 Synchronized histogram
Changing the displayOnce you have selected data points and pro-duced a plot, there are several options for mod-ifying the display.
• Changing Colors–to change the color of a plot:a. Open the Queries pane of the Explorer
window.b. Right-click a list and click the Change
Color... context menu command.c. Select a new color from the color menu.• Selection and Zooming–to select a part of
the plot and zoom in:To select part of the plot:
a. Drag a rectangle across a portion of the plot. The portion of the plot is displayed in red.
b. To select more than one section, use Shift+drag or Ctrl+drag.
To zoom-in on part of the plot:a. Right-click in the plot and click the
Zoom on Drag context menu command.
Selected query shows a check mark (b)

434 BioVizChapter 26
This is a toggle switch–choose it again to deselect.
b. Drag a rectangle across a portion of the plot.
This time, when you release the mouse button, the plot display zooms in to show only the points selected. When the plot is zoomed, scrollbars appear. Use these to reposition your view of the zoomed plot. Click the “circled-point” icon on a scrollbar to restore that axis to the previous zoom.Right-click and click the Unzoom context menu command to restore to the full view.
• Changing the Style–you can change the style of an existing plot. For example, you can turn a scatter plot into a histogram.a. Right-click in the plot and click the
Properties... context menu command.
b. In the properties dialog box, select the style and click OK.
The plot displays in the new style.• Changing Fields—you can change the field
plotted on the X or Y axis with the context menu. a. Point in the area of the numbers just
below or to the left of an axis.b. Right-click. The context menu displays
a list of plottable fields.c. Select a different field to plot on that
axis.
NOTE: You can only change fields when the chart is not locked.
In Data Table display, you can display a sub-structure search as table of R-group substitu-ents.

ChemBioFinder & BioViz 435User Guide
BioSARThis section explains how to export a data form from BioSAR and view it as an equiva-lent form in ChemBioFinder. Once in Chem-BioFinder, you can manage the form using a variety of features.
Starting the BioSAR browserTo use BioSAR, you must have Internet Explorer 5.5 (with SP2) or greater installed.To start BioSAR:
1. In Internet Explorer, log into the ChemOffice Enterprise portal.
2. In the Enterprise screen, under BioSAR Enterprise, open a query form using either of these links:• Open Form• Manage your forms
Performing searches in BioSARBefore exporting a BioSAR data form to ChemBioFinder, you need to search on the data in the BioSAR database.
1. In BioSAR, open a query form of your choosing.
2. In the form, enter your search criteria and click the Search button.
Exporting the data form to ChemBioFinderAfter the search is complete, you are ready to export the data form to ChemBioFinder.To export the form:
1. Click the Display In BioViz button. If the button is not visible, you may need to edit the BioSAR form properties. See your administrator.
2. When prompted to either save the form file or open it, select Open. ChemBioFinder will launch.
3. At the Oracle login, provide your user name and password.
NOTE: If you don’t want to view the form now, simply save the file. You can open the file in ChemBioFinder at any time.
ChemBioFinder file typesWhenever you export a data form, BioSAR creates a file with the extension .bsbxml. ChemBioFinder reads this file, and opens the form, linking it directly into the database.The .bsbxml file is read-only. Although Chem-BioFinder doesn’t allow you to modify the .bsbxml file itself, you can still edit the form and save your changes. When saved, the form file is assigned the ChemBioFinder extension
27
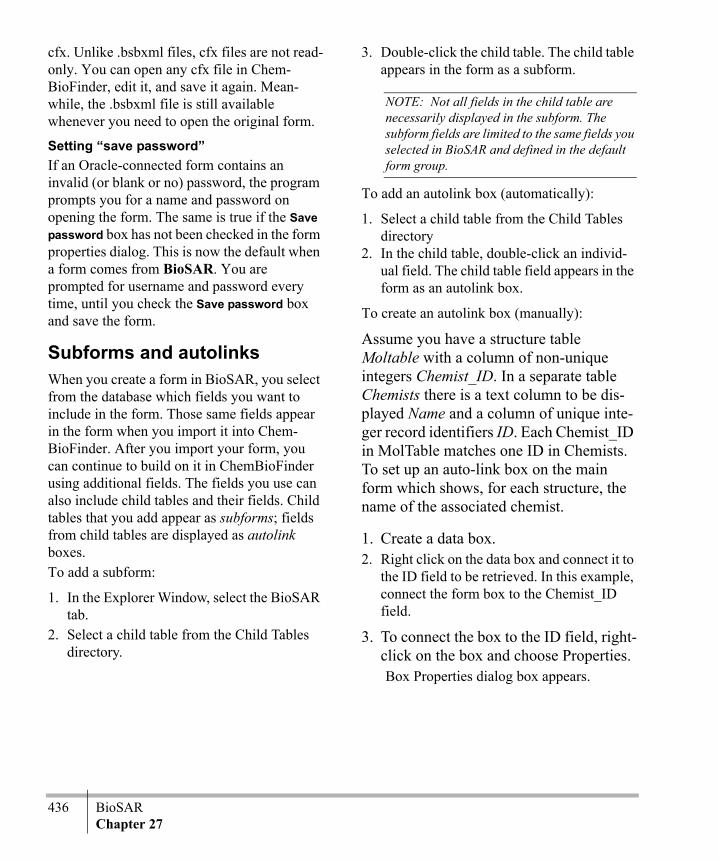
436 BioSARChapter 27
cfx. Unlike .bsbxml files, cfx files are not read-only. You can open any cfx file in Chem-BioFinder, edit it, and save it again. Mean-while, the .bsbxml file is still available whenever you need to open the original form.
Setting “save password”If an Oracle-connected form contains an invalid (or blank or no) password, the program prompts you for a name and password on opening the form. The same is true if the Save password box has not been checked in the form properties dialog. This is now the default when a form comes from BioSAR. You are prompted for username and password every time, until you check the Save password box and save the form.
Subforms and autolinksWhen you create a form in BioSAR, you select from the database which fields you want to include in the form. Those same fields appear in the form when you import it into Chem-BioFinder. After you import your form, you can continue to build on it in ChemBioFinder using additional fields. The fields you use can also include child tables and their fields. Child tables that you add appear as subforms; fields from child tables are displayed as autolink boxes.To add a subform:
1. In the Explorer Window, select the BioSAR tab.
2. Select a child table from the Child Tables directory.
3. Double-click the child table. The child table appears in the form as a subform.
NOTE: Not all fields in the child table are necessarily displayed in the subform. The subform fields are limited to the same fields you selected in BioSAR and defined in the default form group.
To add an autolink box (automatically):
1. Select a child table from the Child Tables directory
2. In the child table, double-click an individ-ual field. The child table field appears in the form as an autolink box.
To create an autolink box (manually):
Assume you have a structure table Moltable with a column of non-unique integers Chemist_ID. In a separate table Chemists there is a text column to be dis-played Name and a column of unique inte-ger record identifiers ID. Each Chemist_ID in MolTable matches one ID in Chemists. To set up an auto-link box on the main form which shows, for each structure, the name of the associated chemist.
1. Create a data box.2. Right click on the data box and connect it to
the ID field to be retrieved. In this example, connect the form box to the Chemist_ID field.
3. To connect the box to the ID field, right-click on the box and choose Properties. Box Properties dialog box appears.

ChemBioFinder & BioViz 437User Guide
4. Check the option"With choices or auto-link". Checking this will automatically brings up the Choices tab.
In the Choices tab:• If the "Auto-link via" box is unchecked,
the dialog lets you define a set of choices for data input.
• If the box is checked, then you have to define both a set of input choices and an auto-link connection.
TIP: To prevent the drop-down choice menu from appearing, check the "Hide menu" box. This applies only if you have set up auto-link.
5. Select the "From table" radio button. In the data source tree, locate the subtable and click the column of data to be displayed in the box (in this case, "Name" under "Chem-ists").
6. The label, Name, after the radio button, From table, updates to show your choice,
and the “Auto-link via”check box becomes available.
NOTE: An auto-link cannot be set up if you are entering a fixed list of choices.
7. Check the "Auto-link via" box. From the drop-down menu, choose the column of the subtable ( in this case “Name” under “Chemist”) which is to be matched against the column ID.
NOTE: The columns shown in the drop-down menu should match the type of the fields to be linked, i.e., if the ID is numeric, then only numeric fields may be linked.
8. The form box displays a chemist's name.
Multiple sortChemBioFinder’s multiple sort feature lets you rearrange the hitlist based on one or more form fields you specify. For example, you can first sort the list by Reg number and then further arrange the list in order of Full reg number.
Sorting by main form fieldsTo sort the hitlist using fields in the main form:
1. Click the Record>Sort... menu command.The Sort Multiple window appears.
2. In the Sort Multiple window, select from the left pane the field by which you want to sort. To sort by multiple fields, select the fields in the order you want to sort.
3. By default, each field is sorted in ascending order. To reverse the order, right-click the field name in the right pane and click Descending in the pop-up menu. To remove

438 BioSARChapter 27
a field, right-click the field and select Remove.
4. Click OK when finished.
Sorting by subform fieldsJust as in the main form, you select in the sub-form the fields you want and the order you want them to be sorted. You also indicate which value in each field you want Chem-BioFinder to sort by–the minimum value, the maximum, average of the values, or the sum.To sort the main form using subform fields:
1. Click the Record>Sort... menu command.2. In the Sort Multiple window, select from
the left pane the subform field by which you want to sort the hitlist. The subform field is displayed in the format, subform name: field name.To sort the hitlist by more than one field, select the fields in order of priority.
3. To reverse the order in which values will be sorted, right-click the field name in the right pane and select Descending in the pop-up menu.
4. Also in the pop-up menu, select the value in the field you want ChemBioFinder to sort by–max, min, average, or sum. The default is Min.
5. Click OK when finished.
Query hitlistsThe Queries tab in the Explorer window main-tains a list of search queries from the current
and previous sessions. Queries are associated with forms. So, the query hitlist is saved when you save the form.
Viewing the query listWhen you open an existing form, the tree updates to show only the queries for that form.The Explorer Window must be visible to view the Queries control. If it isn’t visible, do the following:
1. Click the View>Explorer Window menu command.
2. Click the Queries tab to display the Queries tree.
Query list operationsEach time you perform a search or list opera-tion, a new query is generated in the tree. ChemBioFinder assigns a name to the query and displays it in the tree along with the size of the list (number of hits) and a brief description. The generated name is Q<n>*, where n is a sequential number and * indicates that the query has not been renamed or marked for sav-ing. (See “Saving query lists” on page 441.)To perform list operations, begin by perform-ing a simple search. For example, you can search the database for all compounds that have a molecular weight less than 250g/mol:
1. Click the Enter Query icon on the Search toolbar or menu. The form goes into query mode.
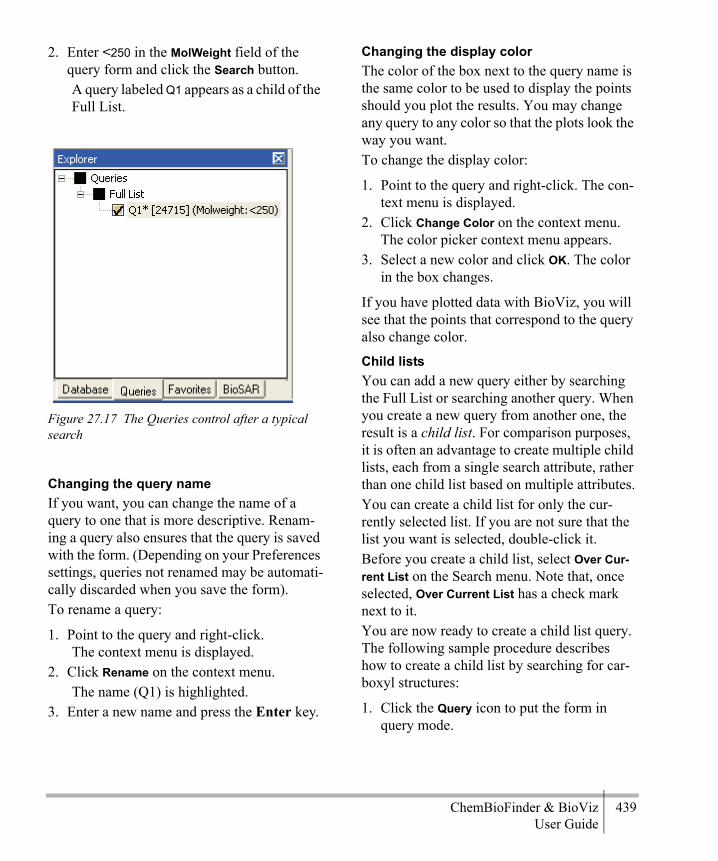
ChemBioFinder & BioViz 439User Guide
2. Enter <250 in the MolWeight field of the query form and click the Search button.A query labeled Q1 appears as a child of the Full List.
Changing the query nameIf you want, you can change the name of a query to one that is more descriptive. Renam-ing a query also ensures that the query is saved with the form. (Depending on your Preferences settings, queries not renamed may be automati-cally discarded when you save the form). To rename a query:
1. Point to the query and right-click. The context menu is displayed.
2. Click Rename on the context menu. The name (Q1) is highlighted.
3. Enter a new name and press the Enter key.
Changing the display colorThe color of the box next to the query name is the same color to be used to display the points should you plot the results. You may change any query to any color so that the plots look the way you want.To change the display color:
1. Point to the query and right-click. The con-text menu is displayed.
2. Click Change Color on the context menu. The color picker context menu appears.
3. Select a new color and click OK. The color in the box changes.
If you have plotted data with BioViz, you will see that the points that correspond to the query also change color.
Child listsYou can add a new query either by searching the Full List or searching another query. When you create a new query from another one, the result is a child list. For comparison purposes, it is often an advantage to create multiple child lists, each from a single search attribute, rather than one child list based on multiple attributes.You can create a child list for only the cur-rently selected list. If you are not sure that the list you want is selected, double-click it.Before you create a child list, select Over Cur-rent List on the Search menu. Note that, once selected, Over Current List has a check mark next to it.You are now ready to create a child list query. The following sample procedure describes how to create a child list by searching for car-boxyl structures:
1. Click the Query icon to put the form in query mode.
Figure 27.17 The Queries control after a typical search

440 BioSARChapter 27
2. Double-click in the Structure window. The ChemDraw toolbar appears.
3. Using the bond tool, create a carboxyl structure.
4. When you have finished creating the struc-ture, click outside the Structure window.
5. Click the Search button.
The new list is created as a child of the previ-ous list.
Figure 27.18 In this example, Q1 is a child list of a parent list named MW Filter.
Creating multiple child listsYou can run similar queries, each with differ-ent attributes and displayed as a child of the parent query.
Figure 27.19 Several child lists of the parent list MW Filter.
To create another child list, you must first select the parent list. To select the parent, do either of the following:
• Double-click the parent list• With a child list selected, click Restore Pre-
vious List on the Search menu or toolbar.
You can verify that you have selected the par-ent list by viewing the status bar information. With the parent list selected, you can add another child list to your query.
Figure 27.20 The value “1187” in the status bar indicates that the parent list in figure 5 has been selected. “38547” is the number of entries in the full list.
Merging lists with drag-and-dropIn some situations you might want to merge two lists using drag-and-drop. The result is a new list that has attributes based on the merged lists.
1. Select a list and drag it onto another list. The Restore/Merge List dialog opens.
2. Select the type of merge you want, in the Restore/Merge List dialog box.

ChemBioFinder & BioViz 441User Guide
3. Click OK. A new list is displayed with the merged criteria you selected.
Figure 27.21 Restore/Merge List dialog
Saving query listsWhen you transfer data to ChemBioFinder 12.0 from BioSAR Browser, ChemBioFinder 12.0 opens a file of type .bsbxml and creates a form to simulate the BioSAR setup. At the same time, it restores whatever hitlist was in effect in BioSAR. In ChemBioFinder 12.0, the BioSAR hitlist is automatically saved when you save, close and reopen a file. This is differ-ent from the default in previous versions.
DomainsThe Domain feature in ChemBioFinder allows you to create a subset of a database. Once cre-ated, a domain acts as if it is a full database. Any database searches you perform are limited to only the domain. Any hitlists you create will be added to the query tree as if you are work-ing with the full database.
Creating a domainBefore you create a domain, you must run a query to define the subset of the database with
which you want to work. This subset becomes the domain.
TIP: If you want your domain to have a partic-ular order, sort before creating the domain. The order will be preserved for all subsequent use.
To create a domain:
1. Select a query by double clicking on it.2. Click the Search>Domain>Set Domain to
Current List menu command.
Query control displayWhen you run queries in a domain, they will not be displayed as child queries of the domain unless you select Over Current List on the Search menu and specify the domain as the active list.
Cancelling the domainIf you no longer want to use a domain, click the Search>Domain>Reset to Full Database command again to cancel it.
Creating an mdb databaseWhen working with a large, Oracle-based data-base on a server, it is sometimes convenient to store a subset of the database (dataset) as a local database. ChemBioFinder local databases are Microsoft Access-based (file extension: MDB), so the exported dataset must take into account Access naming rules and limitations.
Access database rules
• May be up to 64 characters long.• May include any combination of letters,
numbers, spaces, and special characters except a period (.), an exclamation point (!), an accent grave (`), or brackets ([ ]).
442 BioSARChapter 27
• Must not begin with leading spaces.• Must not include control characters (ASCII
values 0 through 31).• Must not include a double quotation mark
(“) in table, view, or stored procedure names.
Creating a local copy of a databaseIf you frequently use a set of data that never changes, consider exporting the data as a local ChemBioFinder database. Having a local data-base often makes many common tasks run faster; tasks such as browsing, searching, plot-ting, and analyzing.Creating a local database requires two steps:
1. Exporting the dataset as a CFXML file and 2. Importing the file back into Chem-
BioFinder. Once you import the file, save it as a CFX file. It will then be available for you to use whenever you need it.
Exporting the datasetTo export a dataset:
1. Run a query to create the dataset.2. Click the File>Export>CFXML menu com-
mand.The Data Export window opens.
3. Select the options you want to apply to the exported dataset:• In the Data Export dialog box, select a
path and file name for the new database. Use the File button to browse for a loca-tion.
• In the lower half of the dialog box, all data fields are selected for inclusion in the exported database by default. Clear the appropriate check boxes to deselect fields you want to omit.
• Check the field names to ensure each one complies with Access database rules (If
necessary, edit the field name by double-clicking it).
• On the Text Options tab, select a delimiter and other options you want to include: subform data, empty records, and headers. You also have an option to save structures in CDX or CDXML format.
4. After you have made your selections, click the Export button.
Importing the cfxml fileOnce you have saved the dataset in CFXML format, you must bring it back into Chem-BioFinder to save it as an MDB file.
NOTE: To avoid conflicts with field name/type definitions, close the master database before importing and open a blank form.
1. In a blank form, click the File>Import> CFXML menu command and open the file. The Data Import dialog is displayed.
2. Select/deselect the fields you want to import and the options you want to apply to the file.
3. After you make your selections, click the Import button. Your dataset is imported into an Access database.
Exporting to an Excel spreadsheetWhen you export a BioSAR-derived form with multiple subforms into an Excel spreadsheet, you must take precautions to get all of the sub-forms correctly exported. This is because the exporter normally uses only the field names, and the BioSAR subforms show the same set of fields from different assay tables. On export, they will collide, and the data will not come over correctly.

ChemBioFinder & BioViz 443User Guide
To prevent this, ChemBioFinder 12.0 has an option on the Text Options tab of the Data Export dialog box — Prefix output fieldnames. When this box is checked, the output names will match the input names, which are prefixed for subform fields.
Tips for optimizing performanceWhen working with a large data base or multi-ple forms, you will want to ensure that you can still work efficiently. To do so, there are a few techniques you can use to improve Chem-BioFinder’s performance, even when you are working with a lot of data.
Use domain-linked formsUsing a domain offers a significant speed advantage compared to working with the full database. If you choose Retrieve All after per-forming some queries, you will get only the domain as the full database. Since the domain is typically much smaller than the database it was created from, the query and restore com-mands are executed much faster.Another advantage is that the domain is “non-volatile”, that is, the view remains on the server until you delete it. If you routinely work with a particular subset of a large database, creating a domain eliminates the need to per-
form the initial routine query or create a local database. You only need to save the domain information by saving the form. The next time you open that form, you see only the domain.A third advantage is that the sort order at the time of creation is preserved. Sorting is a time consuming operation. By using a domain, you can sort once and save the preferred order.To more information, including how to create a domain, see Saving query lists.
Minimize child tables on a single tabWhenever a subform appears on screen, Chem-BioFinder automatically updates the data from the server. If you have a lot of subforms on a single tab, ChemBioFinder must update all of them at once, potentially slowing down your work. So, if you have subforms you need to see only occasionally, put them on other tabs of the form, so they will not be updated until you activate those tabs.
Remove plots that you are not usingPlots that are visible all take at least some pro-cessing and closing a plot window still doesn’t remove it from memory. If you have generated plots you no longer need, use the View>BioViz Plots>Remove menu command to delete them, then save the form.

444 BioSARChapter 27
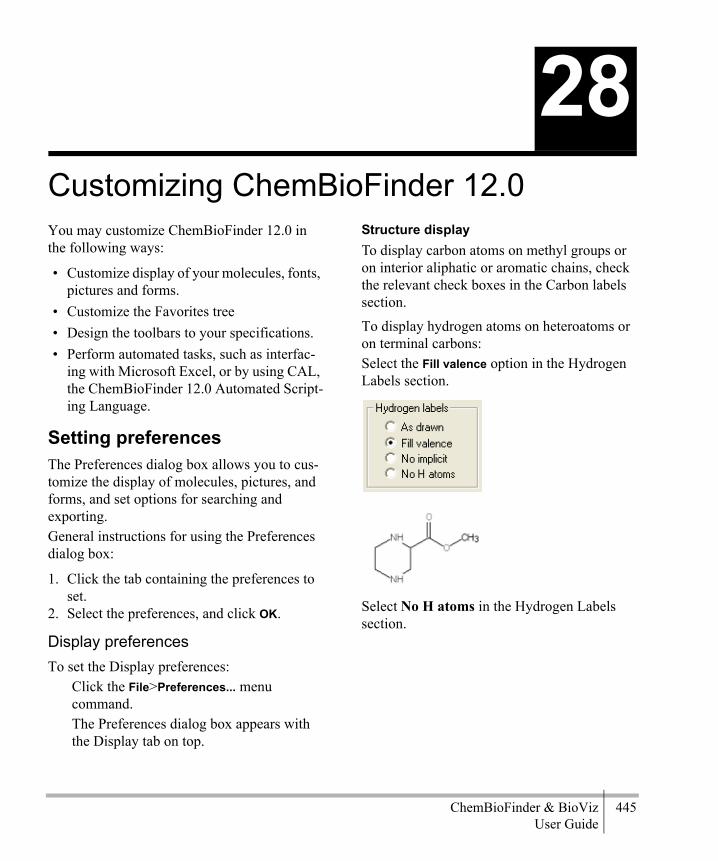
ChemBioFinder & BioViz 445User Guide
Customizing ChemBioFinder 12.0You may customize ChemBioFinder 12.0 in the following ways:
• Customize display of your molecules, fonts, pictures and forms.
• Customize the Favorites tree• Design the toolbars to your specifications.• Perform automated tasks, such as interfac-
ing with Microsoft Excel, or by using CAL, the ChemBioFinder 12.0 Automated Script-ing Language.
Setting preferencesThe Preferences dialog box allows you to cus-tomize the display of molecules, pictures, and forms, and set options for searching and exporting.General instructions for using the Preferences dialog box:
1. Click the tab containing the preferences to set.
2. Select the preferences, and click OK.
Display preferencesTo set the Display preferences:
Click the File>Preferences... menu command.The Preferences dialog box appears with the Display tab on top.
Structure displayTo display carbon atoms on methyl groups or on interior aliphatic or aromatic chains, check the relevant check boxes in the Carbon labels section.
To display hydrogen atoms on heteroatoms or on terminal carbons:Select the Fill valence option in the Hydrogen Labels section.
Select No H atoms in the Hydrogen Labels section.
28

446 Customizing ChemBioFinder 12.0Chapter 28
NOTE: Selecting No implicit means these types are displayed without implicit hydrogens.
Using keyboard shortcutsWhen using a form, you can use keyboard shortcuts to show or hide atom-to-atom maps, reaction centers, atom numbers, and bond numbers.
To use keyboard shortcuts:Select the Enable keyboard shortcuts check box on the Display tab of the Preferences dialog box.When keyboard shortcuts are enabled, the fol-lowing keys toggle these properties:
• A: show/hide atom numbers• B: show/hide bond numbers• M: show/hide atom-to-atom maps• R: show/hide reaction centers• S: show/hide stereochemistry
Scaling structuresTo scale each structure so that it is as large as possible within its structure box:
Click the Fit to box radio button in the Structure Scaling section of the Display tab.
To display all structures with a constant bond length:
1. Click the Uniform bond length radio button in the Structure Scaling section of the Dis-play tab.
2. Select the bond length percentage.With Uniform bond length selected, structures may be reduced in size if they are too large to fit within the structure box, but they will never be enlarged.
Framing picturesTo select whether the pictures in a form are surrounded by a border:
Select the Framed radio button in the Pictures section of the Display tab.
Grid spacingTo set the grid spacing (in pixels) on a form:
Type in a number, or press the up and down arrows to change the current value by one unit in the Grid Spacing section of the Display tab.
Choosing a small grid spacing allows you to place objects more precisely by snapping to a tighter matrix.
Color preferencesTo set the color preferences:
Click the Color tab of the Preferences dialog box.
The color tab allows you to specify the color of various interface elements. To set a color:
1. Click the button corresponding to the inter-face element you want to change.The color dialog box appears.
2. Select the new color.
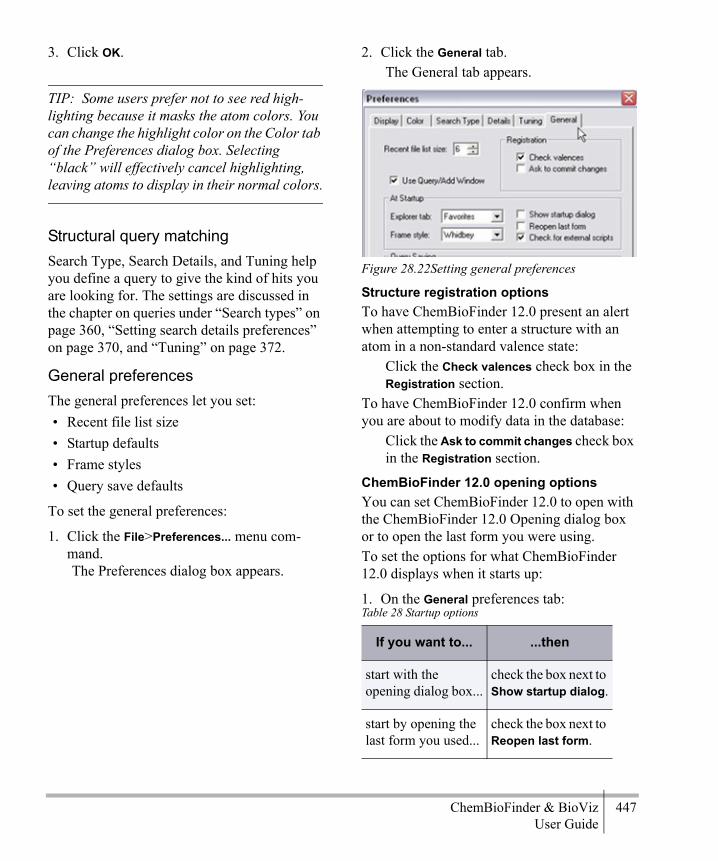
ChemBioFinder & BioViz 447User Guide
3. Click OK.
TIP: Some users prefer not to see red high-lighting because it masks the atom colors. You can change the highlight color on the Color tab of the Preferences dialog box. Selecting “black” will effectively cancel highlighting, leaving atoms to display in their normal colors.
Structural query matchingSearch Type, Search Details, and Tuning help you define a query to give the kind of hits you are looking for. The settings are discussed in the chapter on queries under “Search types” on page 360, “Setting search details preferences” on page 370, and “Tuning” on page 372.
General preferencesThe general preferences let you set:• Recent file list size• Startup defaults• Frame styles• Query save defaults
To set the general preferences:
1. Click the File>Preferences... menu com-mand.The Preferences dialog box appears.
2. Click the General tab.The General tab appears.
Figure 28.22Setting general preferences
Structure registration optionsTo have ChemBioFinder 12.0 present an alert when attempting to enter a structure with an atom in a non-standard valence state:
Click the Check valences check box in the Registration section.
To have ChemBioFinder 12.0 confirm when you are about to modify data in the database:
Click the Ask to commit changes check box in the Registration section.
ChemBioFinder 12.0 opening optionsYou can set ChemBioFinder 12.0 to open with the ChemBioFinder 12.0 Opening dialog box or to open the last form you were using.To set the options for what ChemBioFinder 12.0 displays when it starts up:
1. On the General preferences tab: Table 28 Startup options
If you want to... ...then
start with the opening dialog box...
check the box next to Show startup dialog.
start by opening the last form you used...
check the box next to Reopen last form.

448 Customizing ChemBioFinder 12.0Chapter 28
2. Click OK.
Setting the recent file list sizeYou can set the number of files you opened recently that ChemBioFinder 12.0 shows.To set the list size for the most recent files opened:
Type in a number (from 0 to 16), or press the up and down arrows to change the current value by one unit in the Recent file list size: option on the General preferences tab.
Changing options with the view menuSeveral structure display options can be set from the View menu, including Atom Num-bers, Reaction Centers, Stereochemistry, and Atom Maps in reactions.To display reaction centers:
Select the View>Structure>Reaction Centers menu option.
Figure 28.23Viewing reaction centers
With reaction centers shown, any bond that changes in the course of a reaction is colored. Additionally, any atoms that participate in reaction centers are circled if none of their adjacent bonds participate in the reaction center.
Figure 28.24Visualization of reaction centers
use a default script... check the box next to Check for external scripts
change which window is on top in the Explorer window
select an entry from the Explorer tab: drop-down menu.
select a different theme
select an entry from the Frame style: drop-down menu.
Table 28 Startup options
If you want to... ...then

ChemBioFinder & BioViz 449User Guide
To display atom-to-atom maps:Click the View>Structure>Atom-to-Atom Map menu option.With atom-to-atom maps shown, equivalent atoms in reactants and products are colored the same.
Figure 28.25Atom-to-atom maps
These two preferences affect only the display of reactions. Not checking the boxes means these types are displayed as all other atoms and bonds.
Favorites treeThe Favorites Tree is a user-constructed col-lection of file system objects. It may include folders, subfolders, ChemBioFinder 12.0 forms, structure files, and documents of all kinds. Its purpose is to allow you to collect,
organize, and access the data and documents you use regularly.
Figure 28.26The Favorites tree

450 Customizing ChemBioFinder 12.0Chapter 28
You can open items in the Favorites Tree from within ChemBioFinder 12.0 by double-click-ing them:
There are two ways to add items to the Favor-ites Tree:
• Drag one or more files from Windows Explorer into the Favorites window.
• Use the context menu.
To create a new folder in the Favorites Tree:
1. Point to the “parent” folder. (The new folder will be a subfolder of this folder.)
2. Right-click and click the New Folder con-text menu command.
3. Type in a new name for the folder.
To add an item to a folder:
1. Point to a folder.2. Right-click and click the New Item... context
menu command.A File dialog box opens.
3. Browse to the file you want to add, select it, and click the Open button.The item is added to the folder.
To rearrange items or folders in the tree:Drag the item to a new location.
To resort a folder or subfolder alphabetically:Right-click on the folder and click the Sort Folder context menu command.
ToolbarsChemBioFinder 12.0 lets you format your tool-bars. You can Customize the toolbars by drag-ging buttons on or off. To open the Customize dialog box:
Click the View>Toolbars>Customize menu command.The Customize dialog box appears.
Figure 28.27Customizing toolbars
To add an option to a toolbar that is already in the ChemBioFinder 12.0 window:
1. Click the Commands tab in the Customize dialog box.
Table 29 Favorites tree options
if the file is… double-clicking will…
a ChemBioFinder 12.0 form,
open it.
a ChemBioFinder 12.0 script,
execute it.
an SD- or RDFile, load it.
a ChemBioFinder 12.0 query,
restore it.
any other type of document,
open it in its source application.
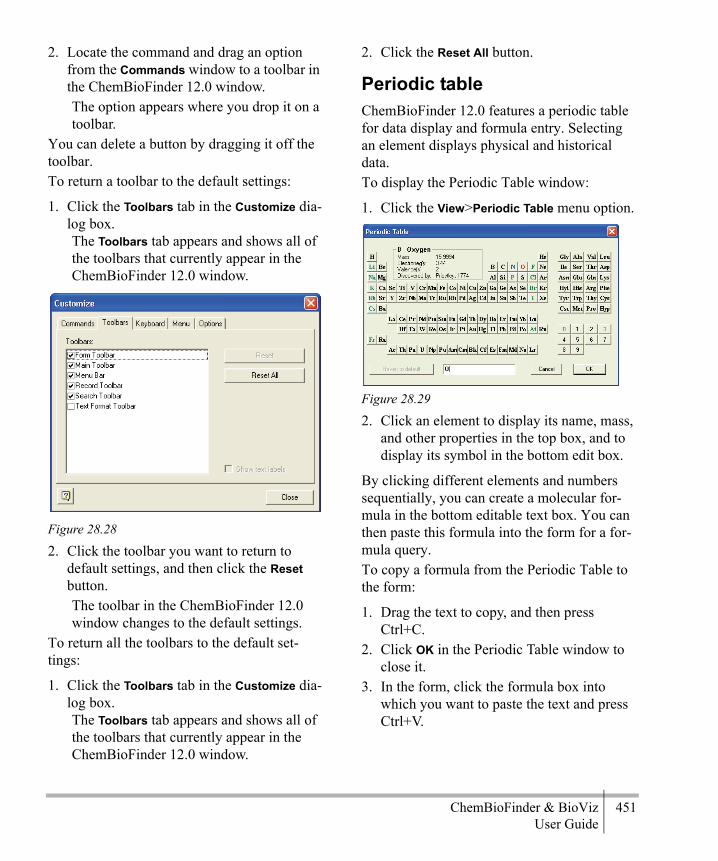
ChemBioFinder & BioViz 451User Guide
2. Locate the command and drag an option from the Commands window to a toolbar in the ChemBioFinder 12.0 window.The option appears where you drop it on a toolbar.
You can delete a button by dragging it off the toolbar.To return a toolbar to the default settings:
1. Click the Toolbars tab in the Customize dia-log box.The Toolbars tab appears and shows all of the toolbars that currently appear in the ChemBioFinder 12.0 window.
Figure 28.28
2. Click the toolbar you want to return to default settings, and then click the Reset button.The toolbar in the ChemBioFinder 12.0 window changes to the default settings.
To return all the toolbars to the default set-tings:
1. Click the Toolbars tab in the Customize dia-log box.The Toolbars tab appears and shows all of the toolbars that currently appear in the ChemBioFinder 12.0 window.
2. Click the Reset All button.
Periodic tableChemBioFinder 12.0 features a periodic table for data display and formula entry. Selecting an element displays physical and historical data. To display the Periodic Table window:
1. Click the View>Periodic Table menu option.
Figure 28.29
2. Click an element to display its name, mass, and other properties in the top box, and to display its symbol in the bottom edit box.
By clicking different elements and numbers sequentially, you can create a molecular for-mula in the bottom editable text box. You can then paste this formula into the form for a for-mula query.To copy a formula from the Periodic Table to the form:
1. Drag the text to copy, and then press Ctrl+C.
2. Click OK in the Periodic Table window to close it.
3. In the form, click the formula box into which you want to paste the text and press Ctrl+V.

452 Customizing ChemBioFinder 12.0Chapter 28
To display data about the selected element in the Element Editor, do one of the following:
• Display the desired element and click the display box at the top of the Periodic Table window.
• Double-click the desired element button.
Figure 28.30
The Element Editor displays properties of the selected element. The color of the element is shown in the periodic table for that element and in any structure data boxes in which that element is present. To change the color of an element:
1. Click the Color button in the Element Editor2. Select a color from the Color dialog box
and click OK.3. Click OK in the Element Editor.
To reset an element’s color to the default:Click Revert to Default in the Element Editor.
NOTE: The data of the Periodic Table is stored in a tab-delimited ASCII file called CS Chem-BioFinder 12.0 Custom Elements.txt located in your ChemBioFinder 12.0 system directory. It
can be easily edited with a text editor or spread-sheet program if you want to change default data values.
Embedding ActiveX controlsYou can embed most windowed ActiveX con-trols on a form. For stand-alone controls, you can embed the control and use it immediately. If the control needs programming, or if you want the control to manage ChemBioFinder data, you will need to customize its behavior using Python scripts. To embed a control:
1. Select the Control box tool on the Forms toolbar.
2. Drag a rectangle on the form.The Insert Control dialog box appears.
3. Select a control from the list.The control appears in the Control box.
Figure 28.31Adding a spreadsheet to a form
NOTE: Not all controls listed are suitable for use in a Control box, but appropriate error messages should be displayed in such cases.
Customizing controlsThe behavior of an embedded control can be customized by adding Python scripts to the

ChemBioFinder & BioViz 453User Guide
form to perform custom actions at given times. The control can be accessed via the Automa-tion interface through the Control property of the corresponding Box object, which is obtained from the Boxes collection of the Doc-ument object. Contact CambridgeSoft support at http://www.cambridgesoft.com/services for information on using the Automation inter-face.
Scripting
CALChemBioFinder 12.0 is equipped with its own scripting language, the ChemBioFinder Auto-mation Language (CAL). CAL is used to oper-ate the program from the keyboard, or to create custom scripts for automating simple opera-tions such as switching between forms or send-ing data to Microsoft Excel.CAL scripts are stored in text files, with their pathnames stored in forms. In ChemBioFinder 12.0, you have the option of storing scripts directly in form files. Scripts created in Chem-BioFinder 12.0 are stored internally by default. When you open a form which references exter-nal script files, you will be prompted to store the script internally.If you choose to convert the external script files to internal, the scripts will be saved when the form is saved, and the original script files may be deleted. Scripts originally saved as internal may be also be saved externally.
TIP: You can save the form with a different name, and the original will remain untouched (in which case deleting the script files would not be a good idea).
If you choose to leave the form unmodified, the alert will continue to show up every time the form is opened. To suppress the prompt:
1. Click the File>Preferences... menu com-mand.
2. Click the General tab.3. Deselect the Check for external scripts
check box, then click OK.
To execute CAL commands:
1. Click the Scripts>Command Line menu command.The Enter CAL Command dialog box appears.
2. Type in a single CAL command. Click the Help button to see CAL Scripting Help.
3. Click the Execute button to run the com-mand.You can keep entering commands, one by one.
4. When you have finished running com-mands, click the Done.
The Command drop-down list contains previ-ously entered commands. To rerun a previously entered command:
1. Select the command from the list.2. Click the Execute button.
For detailed information about the command language, see “CAL Commands” on page 497.
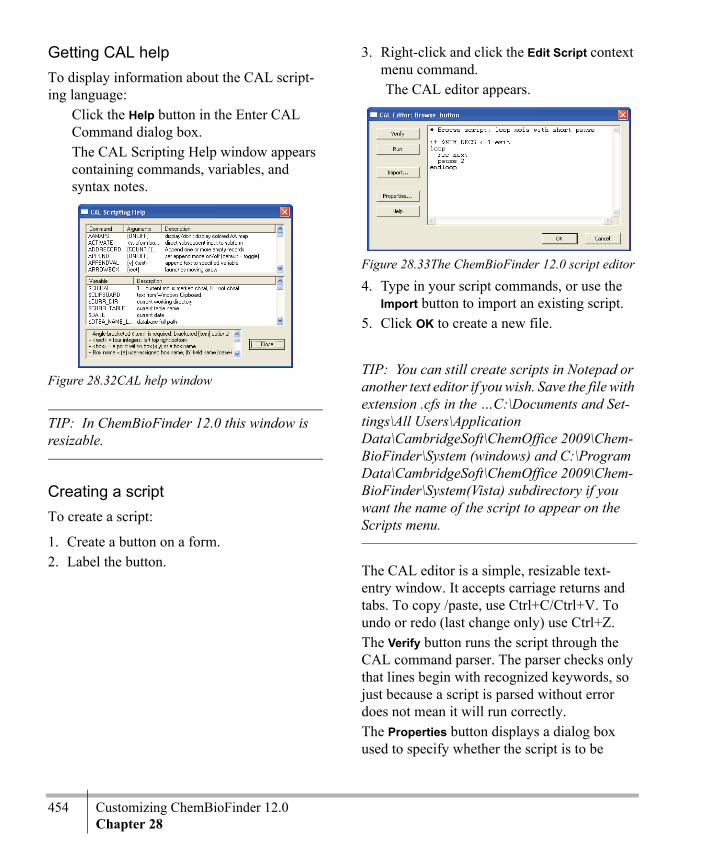
454 Customizing ChemBioFinder 12.0Chapter 28
Getting CAL helpTo display information about the CAL script-ing language:
Click the Help button in the Enter CAL Command dialog box.The CAL Scripting Help window appears containing commands, variables, and syntax notes.
Figure 28.32CAL help window
TIP: In ChemBioFinder 12.0 this window is resizable.
Creating a scriptTo create a script:
1. Create a button on a form.2. Label the button.
3. Right-click and click the Edit Script context menu command.The CAL editor appears.
Figure 28.33The ChemBioFinder 12.0 script editor
4. Type in your script commands, or use the Import button to import an existing script.
5. Click OK to create a new file.
TIP: You can still create scripts in Notepad or another text editor if you wish. Save the file with extension .cfs in the …C:\Documents and Set-tings\All Users\Application Data\CambridgeSoft\ChemOffice 2009\Chem-BioFinder\System (windows) and C:\Program Data\CambridgeSoft\ChemOffice 2009\Chem-BioFinder\System(Vista) subdirectory if you want the name of the script to appear on the Scripts menu.
The CAL editor is a simple, resizable text-entry window. It accepts carriage returns and tabs. To copy /paste, use Ctrl+C/Ctrl+V. To undo or redo (last change only) use Ctrl+Z. The Verify button runs the script through the CAL command parser. The parser checks only that lines begin with recognized keywords, so just because a script is parsed without error does not mean it will run correctly.The Properties button displays a dialog box used to specify whether the script is to be

ChemBioFinder & BioViz 455User Guide
stored in an external file or internally, and to provide a file path or script name. You can assign a script any name you like, but the name must be unique among scripts on the current form.The OK button saves the script. The Run button saves the script and runs it.To execute a script not assigned to a button:
Choose the script from the Scripts menu.
NOTE: To execute a script that does not appear on the menu, use the Command line and enter “Call <script filename>”.
Debugging a scriptYou can step through a script line-by-line when debugging it.To view a script line-by-line:
1. Click the Scripts>Command Line menu command.The Enter CAL Command dialog box appears.
2. Type “step on” and click Execute. This turns on the step mode, where each step is displayed.
3. Run a CAL script by doing one of the fol-lowing:
4. Press any key except Escape to execute the command and go to the next command.As each step is encountered, it is displayed in the status line.
5. Press the Esc key to stop debugging the script.
6. Type step off in the Enter Script Command dialog box, to exit the debugging mode.
Trigger scriptsTrigger scripts run in response to certain pre-defined events. A trigger script can, for exam-ple, automatically load a box with data calculated from the contents of another box whenever you move to a new record.You access a trigger script from the Run script on listbox in the Form tab of the Properties dia-log box. The listbox shows the available trig-ger events, and allows you to create, edit, enable, or disable scripts for each event.To run a script on an event:
1. Right-click in the form and click the Prop-erties... context menu command.
2. Click the Form tab.3. Click the check box of the desired event in
the Run script on: list box. If an event is not checked, no script will run on that event, even if one is available.
Table 30
If your script Then
appears in the Scripts menu.
choose the appro-priate script.
does not appear in the Scripts menu.
type call and the name of your script in the Enter Script Command dialog box, then click Execute.
Table 30
If your script Then

456 Customizing ChemBioFinder 12.0Chapter 28
4. Click the event name to highlight the row of the listbox. (Clicking in a check box does not select the row.)
5. Click the Edit button to write or edit the script in the CAL Editor.
6. Click OK to return to the form. The script will automatically be executed at the specified event.
7. Click OK in the Box Properties dialog box.8. Save the form if you wish to keep the
changes.
Python™A Python interpreter is embedded in Chem-BioFinder 12.0— the language components reside outside ChemBioFinder 12.0 as well as available from within it and appear to be built in. In the same way you can develop complex macros inside Microsoft Word or Excel using Visual Basic, you can develop scripts inside ChemBioFinder 12.0 using Python. The Output window facilitates Python in ChemBioFinder 12.0 The script editor is used with either CAL or Python. It’s default config-uration is Python interactive.
About PythonPython is a full-featured, cross-platform pro-gramming language used to develop applica-tions, controls, DLLs, command-line utilities, and so forth. The language is Open Source, maintained and supported by a large commu-nity of developers. Python is available in ChemBioFinder 12.0 in the same ways as CAL. In both cases, a script can:
• be connected to and activated from a but-ton, form trigger event, or hyperlink in a subform table.
• be developed and executed in command mode, one line at a time.
• provide direct access to data in boxes on the ChemBioFinder form.
• be saved to an external file or stored inter-nally in the form.
But Python is far superior to CAL in many ways:
• Python is a complete programming lan-guage, not just a set of commands. It allows calls to system functions, access to data-bases, OLE Automation, file I/O, program flow control, data structures, object-ori-ented and structured programming, and all other features offered by a modern lan-guage.
• Python can be developed interactively in the ChemBioFinder 12.0 Script Editor, a development environment similar to IDLE, PythonWin, and others. This environment combines line-by-line execution with pro-gram construction, convenient for develop-ment and debugging.
• Python scripts can operate ActiveX controls that is also available in ChemBioFinder 12.0 form boxes.
• Python communicates with ChemBioFinder 12.0 via OLE Automation, allowing it to access documents, record sets, data, form boxes, structures, CAL commands.
• Python in ChemBioFinder 12.0 is inte-grated with ChemScript®, the chemical structure processing language from CambridgeSoft. ChemScript is an extension to Python which allows carrying out detailed analysis or manipulation of mole-cules, reactions, and models.
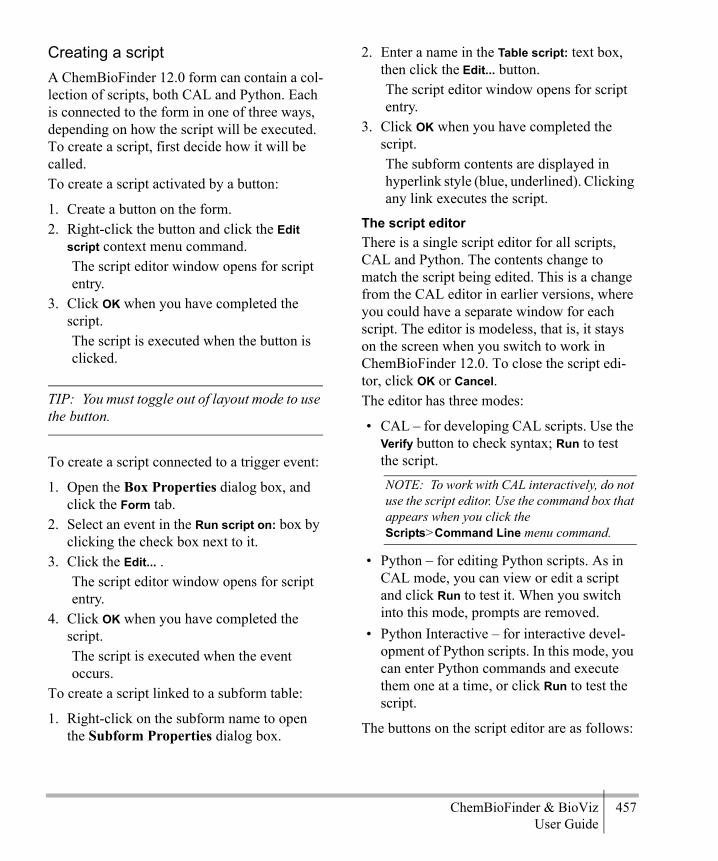
ChemBioFinder & BioViz 457User Guide
Creating a scriptA ChemBioFinder 12.0 form can contain a col-lection of scripts, both CAL and Python. Each is connected to the form in one of three ways, depending on how the script will be executed. To create a script, first decide how it will be called.To create a script activated by a button:
1. Create a button on the form.2. Right-click the button and click the Edit
script context menu command.The script editor window opens for script entry.
3. Click OK when you have completed the script.The script is executed when the button is clicked.
TIP: You must toggle out of layout mode to use the button.
To create a script connected to a trigger event:
1. Open the Box Properties dialog box, and click the Form tab.
2. Select an event in the Run script on: box by clicking the check box next to it.
3. Click the Edit... .The script editor window opens for script entry.
4. Click OK when you have completed the script.The script is executed when the event occurs.
To create a script linked to a subform table:
1. Right-click on the subform name to open the Subform Properties dialog box.
2. Enter a name in the Table script: text box, then click the Edit... button.The script editor window opens for script entry.
3. Click OK when you have completed the script.The subform contents are displayed in hyperlink style (blue, underlined). Clicking any link executes the script.
The script editorThere is a single script editor for all scripts, CAL and Python. The contents change to match the script being edited. This is a change from the CAL editor in earlier versions, where you could have a separate window for each script. The editor is modeless, that is, it stays on the screen when you switch to work in ChemBioFinder 12.0. To close the script edi-tor, click OK or Cancel. The editor has three modes:
• CAL – for developing CAL scripts. Use the Verify button to check syntax; Run to test the script.NOTE: To work with CAL interactively, do not use the script editor. Use the command box that appears when you click the Scripts>Command Line menu command.
• Python – for editing Python scripts. As in CAL mode, you can view or edit a script and click Run to test it. When you switch into this mode, prompts are removed.
• Python Interactive – for interactive devel-opment of Python scripts. In this mode, you can enter Python commands and execute them one at a time, or click Run to test the script.
The buttons on the script editor are as follows:

458 Customizing ChemBioFinder 12.0Chapter 28
• Verify – checks a CAL script for syntax errors. This button does not apply to Python.
• Run – executes a script; used for testing.• Import... – loads a new script from a text
file.• Properties... – Opens a dialog box with two
options: save script internally (with the ChemBioFinder 12.0 form) or save script as an external text file.
• Help – opens the CAL Help window or Python manual.
Interactive modeThe Python Interactive Mode is modelled on standard Python environments such as IDLE and PythonWin. In this mode:
• Type cfhelp for a page of tips and samples of ChemBioFinder 12.0-specific program-ming.
• At each new line, the window shows the Python prompt (>>>). After the prompt, you can enter any Python command, then press Enter. The command is executed immediately, and a new prompt is displayed on the next line.
• The first time you execute a command in the window, there is a short delay while Python is initialized. If it is not already visi-ble, the Output Window then opens, show-ing a ChemBioFinder header and the output of your command.
• If the line you enter ends with a colon, then it is taken as the beginning of a compound (multi-line) statement. After you press Enter, the next line begins with the continu-ation prompt (...) and is indented. The state-ment is not executed until you press Enter twice in a row, that is, you must enter a
blank line to terminate the compound state-ment.
• You can execute commands other than the one you just typed. Position the cursor on any line and press Enter. The command under the cursor is executed. If the line is part of a compound statement, the entire statement executes. Afterwards you are not given a new prompt, and the cursor does not move (unless it was positioned at the end of the line, in which case it inserts a new line and moves to it).
• If you copy text into the window, it is not automatically executed. You can execute pasted code a line at a time by positioning the cursor on each line and pressing Enter.
• If you switch from interactive to standard Python mode, all prompts are removed and the text is shifted left. Line-by-line execu-tion is then disabled, and you can edit the text freely.
The output windowThe output window is a dockable window for displaying output from scripts. The window comes up automatically the first time it is needed. The text in the window is not editable, but can be copied to the Windows Clipboard for pasting into other applications. Standard keyboard accelerators such as select all (Ctrl+A) or copy (Ctrl+C) can be used.To generate output in the window from a CAL script, use the OUTPUT_STR command.:OUTPUT_STR string or phrase
which echoes string or phrase into the win-dow, followed by a carriage return. The string should not be quoted.The string goes through the CAL translator and may be modified with regard to spacing or internal quoting. To prevent translation and

ChemBioFinder & BioViz 459User Guide
have the string taken verbatim, precede it with a backslash character:OUTPUT_STR \use this as written
Output from a Python script uses the same mechanism. To copy text or clear the output window:
Right-click anywhere in the window and choose the desired command from the context menu.
Programming in PythonA description of the Python language is beyond the scope of this manual. However, to learn more about Python, you will find numer-ous books and Internet resources on Python, as well as the Python Help file. This section cov-ers programming topics with specific applica-tion to ChemBioFinder.Python operates on your data through the ChemBioFinder OLE Automation interface. This interface provides external access to a library of the objects you work with in Chem-BioFinder – application, document (form), recordset, fields, boxes, and others. The inter-face is documented on the ChemBioFinder SDK site. You may find it more convenient, however, to use an object browser to see the library in its current form.To illustrate, we will develop an example Python script. Suppose you have a form open, you perform a search, and get a hitlist. You would like to generate a report that contains a set of records in formatted blocks showing spe-cific data items.You can perform this task using the script shown below. You can copy and paste the script into the Script Editor to try it or use it as a template:# ChemFinder Python script 'Gener-ate Report'
# Created Wednesday, November 01, 2006, 10:55 AM
# Loop records printing name and formulafrom win32com.client import GetAc-tiveObject
cfapp = GetActiveOb-ject("ChemFinder11.Application")
cfdoc = cfapp.ActiveDocument
cfrset = cfdoc.Recordset
namefield = cfdoc.Fields("mol-name")
fmlafield = cfdoc.Fields("for-mula")
recno = 1
cfrset.MoveFirst()
while (not cfrset.EOF):
molname = cfrset.Value(name-field.index)
formula = cfr-set.Value(fmlafield.index)
print 'Rec',str(recno),': Name =',molname,'; Formula =',formula
cfrset.MoveNext()
recno = recno + 1
namefield = 0

460 Customizing ChemBioFinder 12.0Chapter 28
fmlafield = 0
cfrset = 0
cfdoc = 0
cfapp = 0
Notes
• Lines 1-2: Comments beginning with # are ignored. ChemBioFinder generates lines like these whenever you create a new script.
• Line 3: It's a good idea to add your own comment telling what a script is designed to do.
• Line 4: Import statements are used to declare and execute code from external Python modules. This one says we want to use a specific routine (GetActiveObject) from a module in the Win32 extension library (win32com.client).
• Lines 5-7: Obtain the currently-running ChemBioFinder application object -- the one from which the script was launched -- along with its active document and record-set. Assign them variable names.
• Lines 8-9: Identify the fields to be included in the report, and get corresponding field objects from the document.
• Lines 10-11: Prepare to loop records. Call-ing MoveFirst ensures that you loop the entire list. If you omit this or comment it out, the loop begins at the current record.
• Line 12: Begin the loop, go until the record-set reaches EOF after the last record. A colon at the end of a line indicates it is the first of a compound statement.
• Lines 13-14: Retrieve data, using the Value method of the recordset.
• Line 15: Format and output the record data. Our simple example just prints a line to the output window.
• Lines 16-17: Proceed to the next record. • Lines 18-22: Objects created in a script
must be freed before leaving. Without this, you may find it impossible later to exit ChemBioFinder. An object can be freed by setting it to zero.
Rec 1 : Name = Bromobenzene ; For-mula = C6H5Br
Rec 2 : Name = 3-Bromobenzoic acid ; Formula = C7H5BrO2
Rec 3 : Name = 6,6'-Dibromoindigo ; Formula = C16H8Br2N2O2
Rec 4 : Name = 3-Bromophenol ; For-mula = C6H5BrO
Caveats
• Subforms are not supported by the CF Automation interface. If you need to work with subform data, you will have to use CAL for the time being.
• Running Python scripts cannot currently be interrupted. Be warned before trying the above script on a long hitlist! Once it starts running, it will not stop until finished or until you kill ChemBioFinder in Task Man-ager. We are working on this problem.
• If after you have run a script, you try to exit ChemBioFinder and it refuses to exit, it means the script created a ChemBioFinder object and failed to release it.

ChemBioFinder & BioViz 461User Guide
Methods of communicationThere are two general methods of communi-cating with other Windows applications such as Microsoft Excel: by using a script within ChemBioFinder 12.0, or by using a Visual Basic procedure within the other application. The following is an overview of each method.
Using scriptsA ChemBioFinder 12.0 (CAL) script can com-municate with other Windows applications using either of two commands:EXEC—to start an application and possibly pass information on the command line. DDE—to communicate using Dynamic Data Exchange with a DDE-ready application.Using EXEC is straightforward, but limited. You can start all Windows applications by this command. Most can be passed a filename on the command line, such that the specified file is opened (or printed) on startup. A few appli-cations can accept more detailed instructions. Consult the application’s manual for informa-tion about how it can be operated using the command line.If you have Visual Basic or similar program-ming language, you can extend the power of EXEC. You can write an application using the advanced features of Visual Basic, and then call the application from within Chem-BioFinder 12.0 using the EXEC command.Using DDE is more complicated. You can operate most Microsoft Office components and many other programs to varying extents with DDE. For example, practically every com-mand on the Excel menu can be executed by DDE. The syntax is rather difficult, but can usually be worked out by experimenting and consulting ChemBioFinder 12.0 help. An example is given below.
DDE is the most direct way of using Excel to view data from ChemBioFinder 12.0. To use MS Excel to view ChemBioFinder 12.0 data:
1. Start MS Excel. You can start it manually using a CAL script or by starting the appli-cation in Windows.
2. In ChemBioFinder 12.0, obtain the hit list you want to transmit to Excel. If you want to work with the entire database, click the Search>Retrieve All menu command.
3. Execute a short CAL script (below) which exports the hit list as comma-delimited text to a temporary file, then instructs Excel with DDE to load that file into a spread-sheet.
4. Activate Excel to work with the data in the spreadsheet.
This procedure takes data one way, from ChemBioFinder 12.0 to Excel. Returning mod-ified data from Excel to ChemBioFinder 12.0 can be done using other techniques described in this chapter.Here is a script to start up Excel:*RUNEXCEL.CFS – script to start Excel*EXEC “c:\msoffice\excel\excel.exe”
If the Excel program is on your search path, you can eliminate the complete pathname and just give the executable name (“exec excel.exe”); if not, you may need to modify this script to indicate where EXCEL.EXE is located on your system.Here is a script to transfer the current hit list from ChemBioFinder 12.0 to Excel:*TOEXCEL.CFS – script to send data*to Excel

462 Customizing ChemBioFinder 12.0Chapter 28
*WRITETEXT C:\DATA.TMPDDE Excel System [OPEN(“C:\DATA.TMP”)]DDE Excel System [COLUMN.WIDTH(1,”C1:C4”,,3,1)]
The first line writes out the current Chem-BioFinder 12.0 hit list as a temporary delimited ASCII file. By default, all fields that appear in boxes on the current form—except structure, but including formula and molecular weight—are written. The second line instructs Excel to open the file. Excel can automatically recog-nize the file format as tab-delimited. The third line instructs Excel to auto-size column widths 1–4 to fit their contents.
NOTE: This example requires that the text export delimiter be set to TAB. otherwise Excel may not read the file correctly. To check this, click the File>Export menu command then open the Text Options tab of the Data Export dialog box.
You can include either or both of these scripts on the Scripts menu, and you can activate them with buttons on the form. To include a script on the Scripts menu, give it a filename with extension CFS, and place it in the Chem-BioFinder 12.0 System directory, or in the directory containing the ChemBioFinder 12.0 application. To activate a script from a button, label the button with a script filename or string which can be converted into a filename. For example, if TOEXCEL.CFS exists in the Chem-BioFinder 12.0 System directory, label a but-ton “ToExcel” to start the script. For more information, see “Adding a button” on page 318.
Using Visual BasicThe second method of communicating between ChemBioFinder 12.0 and other appli-cations such as Excel is using OLE Automa-tion. ChemBioFinder 12.0 is an OLE Automation server, meaning that it offers a collection of data management capabilities to outside programs capable of communicating with OLE objects. While this collection is cur-rently fairly small, it is adequate for a variety of data retrieval and search tasks. This feature allows you to write a custom Visual Basic pro-cedure that directly retrieves and manipulates data from ChemBioFinder 12.0.The general procedure for accessing Chem-BioFinder 12.0 data from within a Visual Basic script is as follows.
1. Create a ChemBioFinder 12.0 Document object, typically passing a filename so that you open a form complete with its database connection.
2. Use methods of the Document object to move through the database, search, and access data. Document methods include some that access Field objects, used to query the data in the database, and Mole-cule objects, for accessing details of molec-ular structures.
For more information, see the CambridgeSoft SDK web site: http://www.cambridgesoft.com/services/docu-mentation/sdk/
Using Microsoft AccessThe methods described above for communicat-ing between ChemBioFinder 12.0 and Excel apply also to Access. You can start Access using the EXEC command. You can send it DDE commands contained in a CAL script,

ChemBioFinder & BioViz 463User Guide
although Access provides fewer capabilities with DDE than does Excel. Or you can write programs using Access Basic that rely on the OLE Automation methods found in Chem-BioFinder 12.0. In addition, you can use Access directly to operate on a Chem-BioFinder 12.0 database.A ChemBioFinder 12.0 molecule database consists of three components: the structure storage files (with file extensions MST and MSX), the data storage files, which include a Microsoft Access database (file extensions MDB and LDB), and the forms (with file extension CFX) used to view the structures and the data. For more information, see “Database File Types” on page 463.If you have Access on your system, double-clicking an MDB file in Explorer starts up Access and opens the specified database.When you open a ChemBioFinder 12.0 data-base in Access, you will see the same tables as displayed in the ChemBioFinder 12.0 Database dialog box, including the main structure table (usually named “MolTable”), but you will not see columns for structure, formula, or molecu-lar weight. These fields cannot be manipulated directly using Access.The following are some of the operations you can perform on a ChemBioFinder 12.0 data-base using Access. Most of these capabilities are not available through the current version of ChemBioFinder 12.0:
• Compress or repair the database.• Change column (field) or names or formats.• Change table names.• Add or delete columns or tables.• Import or export tables.• Load non-structural data from various file
types, including delimited ASCII, Excel, or Word.
• Move quantities of data from one column or row to another.
• Carry out complex queries on non-struc-tural data.
• Permanently change the sort order of a table.
For more information about these actions, please consult the Microsoft Access User’s Guide.Do not add or delete records to the MolTable within Access, because the data component of the database will become out of synchrony with the structure component.
Database File TypesChemBioFinder 12.0 databases are supported by a library called MstLib. This library con-tains a number of files for supporting the struc-ture column. In addition, ChemBioFinder 12.0 uses additional screening files for improving performance of search operations.The following table lists the various file types used by ChemBioFinder 12.0:

464 Customizing ChemBioFinder 12.0Chapter 28
NOTE: When .MSS extension is missing, the .MSX extension is used, but the quality of the
search is lower.
Extension Purpose
.MST Structure Storage
.MSI Screen: Tradi-tional
.MSX Screen: Tradi-tional
.MSF Screen: Full Exact
.MSK Screen: Skeletal
.MSS Screen: Simi-larity
.MS3 Screen: 3-D
.MSH Screen: Hash
.CFW ChemBioFinder Form
.CFX ChemBioFinder Form
.CFS ChemBioFinder Script
.MDB MS Access data-base
.LDB Locks on data-base

Chem & Bio Office 2010 User Guide 465ChemBioFinder
ChemFinder/OfficeOverviewChemFinder/Office lets you search data sources (documents and databases) to find chemical structures so that you do not need to search manually. Using ChemFinder/Office, you can browse the following types of files for chemical informa-tion:
• MS Word documents• MS Excel spreadsheets• ChemFinder databases• ChemDraw files• SD files• Isis/Draw files
In addition to browsing, ChemFinder/Office can search files by:
• Chemical structure• Chemical formula• Molecular weight• Draw structures you want to find with the
ChemDraw plug-in. ChemFinder/Office can search for the whole structure, a sub-structure, or a structure similar to the one you draw.
When searching by structure, you can specify a search by:
• Substructure• Full structure• Similarity• Identity
You can save frequently-used collections of data sources (documents and databases) in Data Source Definition (.dsd) files. Instead of checking many data sources that you want ChemFinder/Office to search, Chem-Finder/Office can search one DSD file. You can also generate and store combinatorial libraries from experiments performed with generic reactions. For more information, see “CombiChem” on page 491.ChemFinder/Office helps you to build data-bases by extracting information from various sources and exporting to another source.
The user interface (UI)ChemFinder/Office is installed when you install ChemOffice Ultra. The UI window, titled “Find Chemical Structures”, is shown in the following illustration:
Selecting files to search Use the File menu or the Look In tab to tell ChemFinder/Office where to look for struc-tures.
29

Adm
inistrator
466 ChemFinder/OfficeChapter 29
Selecting files from the file menuUse the File menu to look for a structure in a specific file or data source:
1. From the File menu, choose Open.The Open dialog box appears.
2. Select a file or data source you want to search by doing one of the following:• In the File Name text box, type the name
of the file to search.• Use the directory tree in the Open window
to browse to a file to search.3. Click Open.
When you select a single file, the first structure in the file appears in the Structure window as soon as you open the file. You can browse through the file using the forward and back arrows in the Search Record toolbar.
Selecting files with the look in tabUse the Look In tab window to search for a structure in multiple files. The Look In tab window shows all the documents and data-bases (data sources) on your mapped network, CD-ROM, floppy, and hard drives. You can select entire folders to search, or multiple indi-vidual files, by using the check boxes next to the file names.To look for a structure in specific files or data sources:
1. Click the Look In tab.The files and data sources appear in a tree directory.
Figure 29.1 Files and data sources tree
NOTE: You can set Preferences to keep the file names hidden in the directory tree. For more information, see “Changing preferences” on page 475.
2. In the Select files of type box, use the drop-down menu to choose types of files in which to search.
• You can select all data sources or files with the following extensions:• .cdx and .mol• .doc and .xls• CFX• .sdf

Chem & Bio Office 2010 User Guide 467ChemBioFinder
3. Click the box next to the file(s) or data source(s) that you want to search.
For example, you want to find a specific ben-zene file you saved. However, you are not sure what part of ChemDraw you saved it in. Click the ChemDraw box and all of the ChemDraw files are searched.When you have selected your data sources, return to the Structure window by clicking the Structure tab.
Searching by chemical structure You can find chemicals based on their struc-ture with ChemFinder/Office.
NOTE: Any search method that you use in ChemFinder you can also use in Chem-Finder/Office
To search by chemical structure only:
1. Open ChemFinder/Office.The Find Chemical Structures - Data Source window, appears.
2. Do one of the following:• From the Look In tab, select files to
search.
• From the File menu select Open, or choose a file name from the most recently used list of files.
For more information about opening files to search through, see “Searching DSD files” on page 470.
3. Click New Search.4. Click Edit Structure.
The ChemDraw plug-in tools palette appears.
5. Selecting appropriate ChemDraw tools, click in the Structure window and draw the structure you want to search for.
Figure 29.2 Drawing a query structure
For more information about using the ChemDraw plug-in, see the ChemDraw User’s Guide.
6. Alternately, you can select a structure from ChemDraw or from a ChemFinder database and paste it in the Structure window using the right-click menu.
N

Adm
inistrator
468 ChemFinder/OfficeChapter 29
7. Click Find Now.
NOTE: If the Find Now button is grayed out, you have not selected a file or directory to search. Click the Look In tab and make a selection.
ChemFinder/Office shows all of the files with the structure that you specify in the Hit List window shown below. Each entry in the Hit List is a record or a hit.
Figure 29.3 Data source window with hit list
8. Use the forward and back arrows on the Record Search toolbar to navigate through the hits.If ChemFinder/Office finds no hits, a warning message appears. To refine your search so that ChemFinder has a greater possibility of finding hits, use the Search Options tab.
Searching by multiple propertiesYou can search for a chemical structure, chem-ical formula, molecular weight, or any combi-nation of these properties simultaneously.
To search for other properties or more than one property at a time:
1. Click New Search.2. Take the appropriate action:
NOTE: When you search by chemical structure, formula, and molecular weight, ChemFinder/Office uses all the criteria together. The information about each property adds to the search criteria of the other properties.
3. Click Find Now.a. ChemFinder/Office shows all of the files
with the properties that you specify in the Hit List window below the Struc-tures window.
b. If ChemFinder/Office finds no hits, a warning message appears.
If you want to search for...
then in the Structure window...
a specific molecular weight,
type a molecular weight (g) in the Mol. Wt. text box.
a molecular weight within a range,
type a range of molecular weights (g) with < or > in the Mol. Wt. text box.
a chemical formula, type a chemical formula in the Formula text box.
more than one crite-rion (structure, formula, or molec-ular weight),
enter the appropriate criteria.
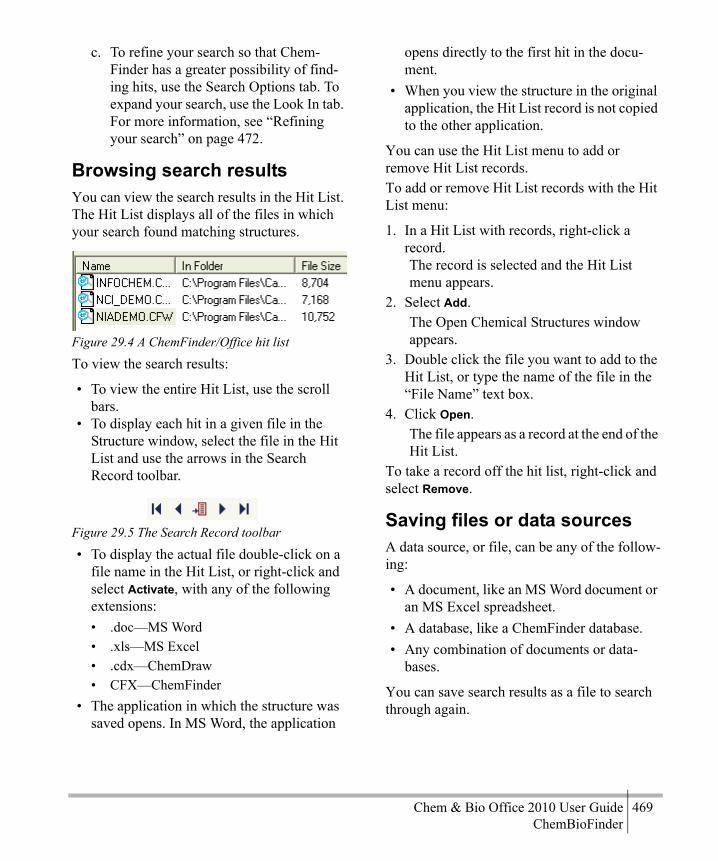
Chem & Bio Office 2010 User Guide 469ChemBioFinder
c. To refine your search so that Chem-Finder has a greater possibility of find-ing hits, use the Search Options tab. To expand your search, use the Look In tab. For more information, see “Refining your search” on page 472.
Browsing search resultsYou can view the search results in the Hit List. The Hit List displays all of the files in which your search found matching structures.
Figure 29.4 A ChemFinder/Office hit list
To view the search results:
• To view the entire Hit List, use the scroll bars.
• To display each hit in a given file in the Structure window, select the file in the Hit List and use the arrows in the Search Record toolbar.
Figure 29.5 The Search Record toolbar
• To display the actual file double-click on a file name in the Hit List, or right-click and select Activate, with any of the following extensions:• .doc—MS Word• .xls—MS Excel• .cdx—ChemDraw• CFX—ChemFinder
• The application in which the structure was saved opens. In MS Word, the application
opens directly to the first hit in the docu-ment.
• When you view the structure in the original application, the Hit List record is not copied to the other application.
You can use the Hit List menu to add or remove Hit List records.To add or remove Hit List records with the Hit List menu:
1. In a Hit List with records, right-click a record.The record is selected and the Hit List menu appears.
2. Select Add.The Open Chemical Structures window appears.
3. Double click the file you want to add to the Hit List, or type the name of the file in the “File Name” text box.
4. Click Open.The file appears as a record at the end of the Hit List.
To take a record off the hit list, right-click and select Remove.
Saving files or data sourcesA data source, or file, can be any of the follow-ing:
• A document, like an MS Word document or an MS Excel spreadsheet.
• A database, like a ChemFinder database.• Any combination of documents or data-
bases.
You can save search results as a file to search through again.

Adm
inistrator
470 ChemFinder/OfficeChapter 29
Saving search results as sdf filesThe SDF file format saves the Hit List records as complete structures in MDL SDFile format. You can import SDF files from Chem-Finder/Office into applications like Chem-Finder.To save search results in the .sdf format after a search:
1. From the File menu, choose Export SDFile.The Save As dialog box appears.
2. In the “File Name” text box, type a name for the file.
3. Click Save.The file is saved with an .sdf extension.
For more information about exporting files to other applications, see “Sending a file to another application” on page 471.
Saving data sources as dsd filesAfter you complete a search, you can save all the records from the Hit List as a Data Source Definition (.dsd) file so that you can search through them again. You can use .dsd files to search for structures, substructures, or structures similar to your pre-vious search through the .dsd file.To save the results of a search as a .dsd file:
1. After completing a search, go to File>Save Source As. The Save As dialog box appears.
2. In the File Name text box, type a name for the group of files.
3. Click Save.The files are saved with a .dsd extension.
Saving lists of directory paths as dsd files
NOTE: Only advanced users familiar with text editors should use this procedure.
You can save lists of directory paths that you search as .dsd files. You can create these lists with a text editor such as Notepad. Saving a list of directory paths as a .dsd file saves the direc-tories in which you search frequently.To save a list of directory paths:
1. Open Notepad or some other ASCII text editor.
2. Type the directory or database paths you want to search.
3. From the File menu in Notepad, choose Save As.The Save As dialog box appears.
4. In the “File Name” text box, type a name for the file and include a .dsd extension. For example, type a File Name like “search1.dsd.”
5. Click Save.6. Close Notepad.
Searching DSD filesTo search for a structure in a DSD file:
1. From the ChemFinder/Office File menu, choose Open.The Open dialog box appears.
2. In the “Files of type:” text box, select Data source definitions (*.dsd) from the drop-down menu.
3. In the “File Name” text box, type the .dsd file name, or select the file from those listed.

Chem & Bio Office 2010 User Guide 471ChemBioFinder
4. Click Open.The first structure associated with the last saved version of the .dsd file appears in the Structure window.
5. Click New Search.ChemFinder/Office clears the Structure window.
6. Click Edit Structure, and draw a structure to search for.
7. Click Find Now.ChemFinder/Office searches through the files specified in the DSD file. Any hits appear in the Hit List.
Sending a file to another applicationYou can send a structure or a file of structures (like SDF files) to another application. You can cut a single structure from an application and paste it into another, or you can send more than one structure directly into another appli-cation.Use the items in the Send To menu to send files to these applications:
• MS Word• MS Excel• CS ChemFinder• CS ChemDraw• ChemACX.Com Search
To send a file to another application:
1. In the Data Source - Find Chemical Struc-tures window, click the Send To menu.The Send To menu appears.
2. From the Send To menu, choose an applica-tion to send a file to.The Send To box dialog box appears.
NOTE: When you send files to Chem.ACX.Com, The Send To dialog box does not appear. The structure associated with the file is sent directly to ChemACX.Com.
3. From the Molecules section, select one of the following:
4. From the Document section, select one of the following, if available:
5. In the Document section select the name of the file from the drop-down list, if neces-sary.If the text box in the Document section is not available, skip this step.
If you want to Then click
send the structure displayed in the Structure window,
Send current mole-cule.
send all the struc-tures listed in the Hit List,
Send all molecules in current hit list.
If you want to... then click...
send structures to a new (untitled) docu-ment in an applica-tion,
Send molecule(s) to a new document.
send structures to a document you already have open in an application,
Send molecule(s) to a currently open document.

Adm
inistrator
472 ChemFinder/OfficeChapter 29
6. Click OK.
If you choose Send To MS Word or MS Excel, the document type opens a new file or the file whose name you entered. The structures you send to the application appear in that applica-tion as follows:
• If you select Send all molecules in current hitlist, ChemFinder/Office will create a table in your document, and the molecules in the current hitlist, along with their molecular formulas, weights, and source file paths, will be entered into the table.
• If you select Send current molecule, Chem-Finder/Office will export only the structure.
NOTE: If you need to interrupt a long Send To Word operation, bring ChemFinder/Office to the front and click Stop.
To send a file to ChemFinder or ChemDraw, you must save the file you want to send:
1. Click the Send To menu.2. Select CS ChemFinder... or CS ChemDraw
Files.3. Select the appropriate radio button in the
Molecules section, and click OK.A Save As dialog box appears.
NOTE: If you have a ChemFinder CFW file open, you have the option of selecting it in the Document section of the Send To dialog box.
4. Type in a name in the “File Name:” text box.
NOTE: If you are sending multiple structures to ChemDraw, choose a base name for the files–for example, if there are three molecules in the current hitlist and you specify the base name
“molecule”, the files will be saved as molecule1.cdx, molecule2.cdx, and molecule3.cdx.
5. Click Save.If you send a file to ChemFinder, ChemFinder opens and the file you save appears as a form.If you send a file to ChemDraw, a warning appears to tell you the path of the file you saved.
Refining your search You can refine your search so that you have a greater chance of finding the structure you want. Use the Search tools and the Search Options tab to change your query to refine your search.To refine your search:
1. From the Search menu, choose Restore Pre-vious Query or click.
2. Change your query with the Search Options.
3. Select the files and data sources you want to search.
4. Click Find Now.ChemFinder/Office shows all of the files with the structure that you specify. These files appear in the Hit List window below the Data Source - Find Chemical Structures window.If ChemFinder/Office finds no hits, your search may be too narrow and you should broaden your search options.
Using the search toolsSome ChemFinder tools used to refine your search can also be used in ChemFinder/Office.To use the search tools:

Chem & Bio Office 2010 User Guide 473ChemBioFinder
• From the Search menu or Search toolbar, take the appropriate action:
For more information about the Search tools, see the “Searching” chapter in the ChemFinder User’s Guide.
Refining your queryYou can refine your ChemFinder/Office search with the Search Options.To use the Search Options:
1. Click the Search Options tab.The Search Options window appears.
Figure 29.6 Search options
2. Take the appropriate action:
If you want to... then click:
begin a new search, Enter Query
search for the current properties (chemical structure, chemical formula, molecular weight),
Find Current Query.
see all the records in the search, including records without a match to your search,
Retrieve All.
search for the struc-ture currently displayed in the structure window, but ignore any other search properties like molecular weight,
Find Current Struc-ture.
restore the previous search, so you can modify the search criteria,
Restore Previous Query.
If you want to... then click:
require that the tetrahe-dral stereochemistry of the target structure match that of the query struc-ture,
Match tetrahedral stereo.
require that the double bond stereochemistry of the target structure match that of the query struc-ture,
Match double bond stereo.
allow fragments in the query to overlap (share one or more atoms) in the target,
Fragments may overlap.
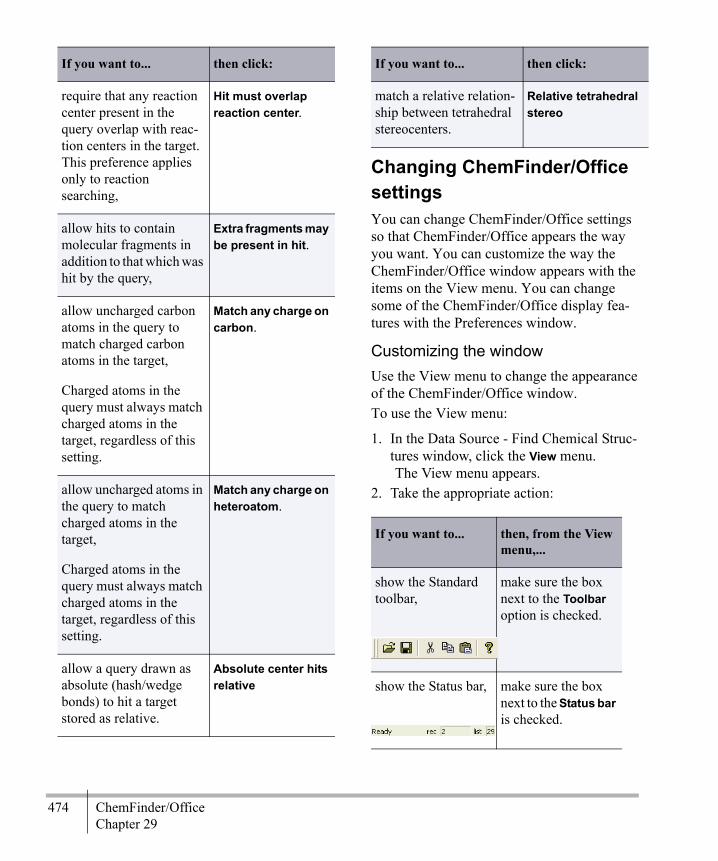
Adm
inistrator
474 ChemFinder/OfficeChapter 29
Changing ChemFinder/Office settingsYou can change ChemFinder/Office settings so that ChemFinder/Office appears the way you want. You can customize the way the ChemFinder/Office window appears with the items on the View menu. You can change some of the ChemFinder/Office display fea-tures with the Preferences window.
Customizing the windowUse the View menu to change the appearance of the ChemFinder/Office window.To use the View menu:
1. In the Data Source - Find Chemical Struc-tures window, click the View menu.The View menu appears.
2. Take the appropriate action:
require that any reaction center present in the query overlap with reac-tion centers in the target. This preference applies only to reaction searching,
Hit must overlap reaction center.
allow hits to contain molecular fragments in addition to that which was hit by the query,
Extra fragments may be present in hit.
allow uncharged carbon atoms in the query to match charged carbon atoms in the target,
Charged atoms in the query must always match charged atoms in the target, regardless of this setting.
Match any charge on carbon.
allow uncharged atoms in the query to match charged atoms in the target,
Charged atoms in the query must always match charged atoms in the target, regardless of this setting.
Match any charge on heteroatom.
allow a query drawn as absolute (hash/wedge bonds) to hit a target stored as relative.
Absolute center hits relative
If you want to... then click:
match a relative relation-ship between tetrahedral stereocenters.
Relative tetrahedral stereo
If you want to... then, from the View menu,...
show the Standard toolbar,
make sure the box next to the Toolbar option is checked.
show the Status bar, make sure the box next to the Status bar is checked.
If you want to... then click:
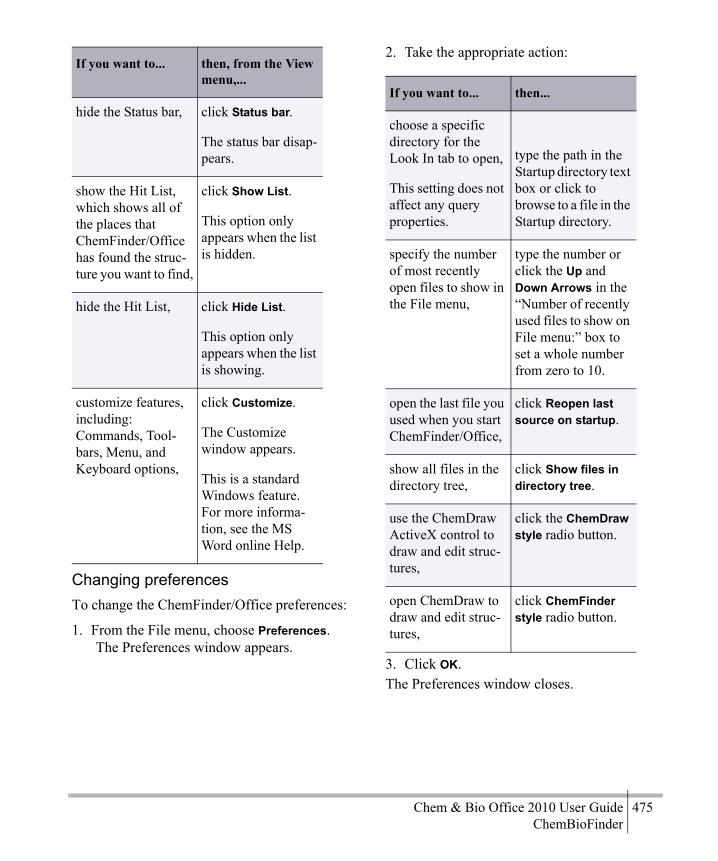
Chem & Bio Office 2010 User Guide 475ChemBioFinder
Changing preferencesTo change the ChemFinder/Office preferences:
1. From the File menu, choose Preferences.The Preferences window appears.
2. Take the appropriate action:
3. Click OK.The Preferences window closes.
hide the Status bar, click Status bar.
The status bar disap-pears.
show the Hit List, which shows all of the places that ChemFinder/Office has found the struc-ture you want to find,
click Show List.
This option only appears when the list is hidden.
hide the Hit List, click Hide List.
This option only appears when the list is showing.
customize features, including:Commands, Tool-bars, Menu, and Keyboard options,
click Customize.
The Customize window appears.
This is a standard Windows feature. For more informa-tion, see the MS Word online Help.
If you want to... then, from the View menu,...
If you want to... then...
choose a specific directory for the Look In tab to open,
This setting does not affect any query properties.
type the path in the Startup directory text box or click to browse to a file in the Startup directory.
specify the number of most recently open files to show in the File menu,
type the number or click the Up and Down Arrows in the “Number of recently used files to show on File menu:” box to set a whole number from zero to 10.
open the last file you used when you start ChemFinder/Office,
click Reopen last source on startup.
show all files in the directory tree,
click Show files in directory tree.
use the ChemDraw ActiveX control to draw and edit struc-tures,
click the ChemDraw style radio button.
open ChemDraw to draw and edit struc-tures,
click ChemFinder style radio button.

Adm
inistrator
476 ChemFinder/OfficeChapter 29
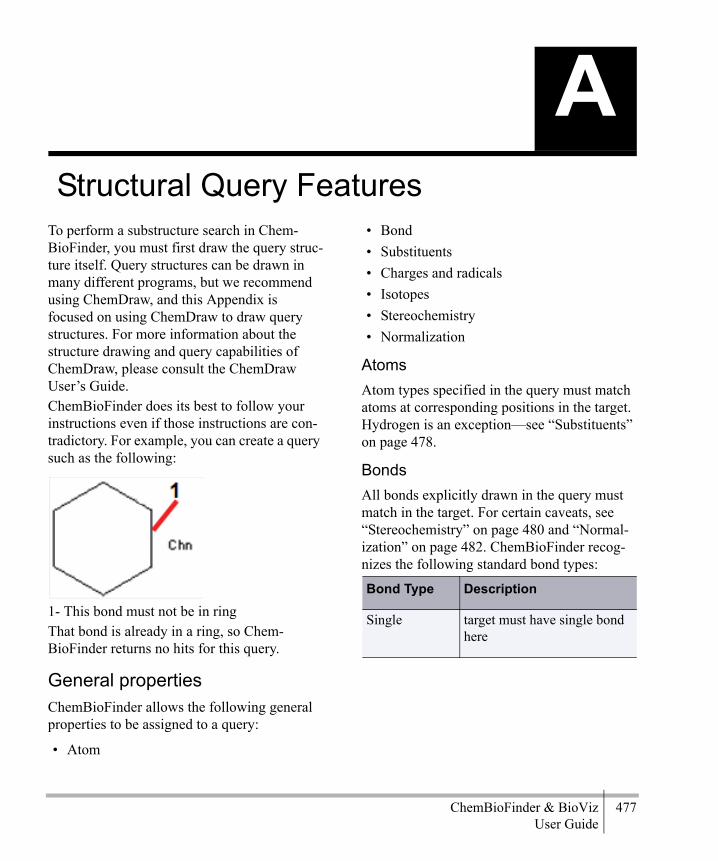
ChemBioFinder & BioViz 477User Guide
Structural Query FeaturesTo perform a substructure search in Chem-BioFinder, you must first draw the query struc-ture itself. Query structures can be drawn in many different programs, but we recommend using ChemDraw, and this Appendix is focused on using ChemDraw to draw query structures. For more information about the structure drawing and query capabilities of ChemDraw, please consult the ChemDraw User’s Guide. ChemBioFinder does its best to follow your instructions even if those instructions are con-tradictory. For example, you can create a query such as the following:
1- This bond must not be in ringThat bond is already in a ring, so Chem-BioFinder returns no hits for this query.
General propertiesChemBioFinder allows the following general properties to be assigned to a query:
• Atom
• Bond• Substituents• Charges and radicals• Isotopes• Stereochemistry• Normalization
AtomsAtom types specified in the query must match atoms at corresponding positions in the target. Hydrogen is an exception—see “Substituents” on page 478.
BondsAll bonds explicitly drawn in the query must match in the target. For certain caveats, see “Stereochemistry” on page 480 and “Normal-ization” on page 482. ChemBioFinder recog-nizes the following standard bond types:
A
Bond Type Description
Single target must have single bond here
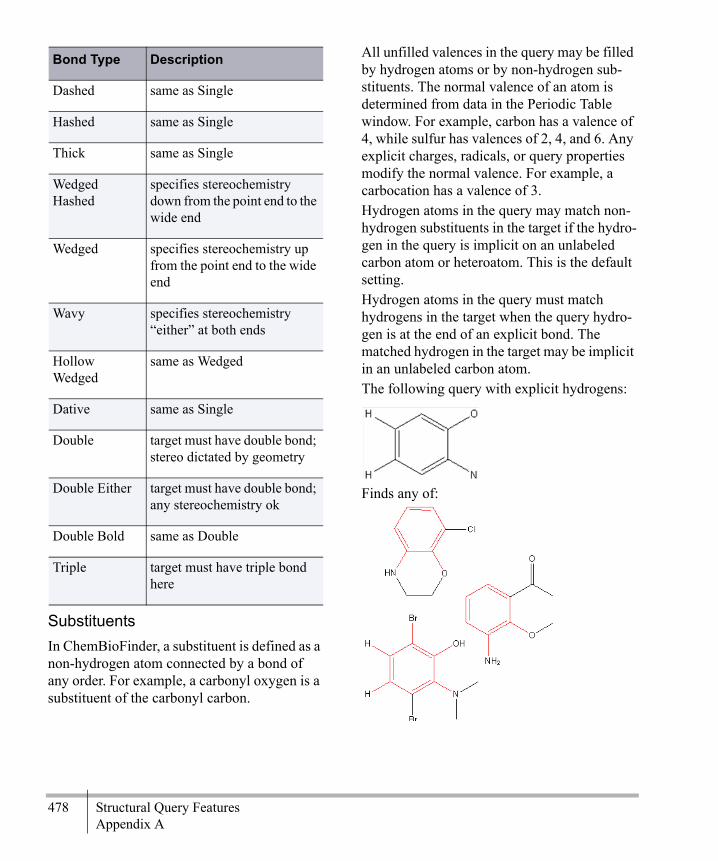
478 Structural Query FeaturesAppendix A
SubstituentsIn ChemBioFinder, a substituent is defined as a non-hydrogen atom connected by a bond of any order. For example, a carbonyl oxygen is a substituent of the carbonyl carbon.
All unfilled valences in the query may be filled by hydrogen atoms or by non-hydrogen sub-stituents. The normal valence of an atom is determined from data in the Periodic Table window. For example, carbon has a valence of 4, while sulfur has valences of 2, 4, and 6. Any explicit charges, radicals, or query properties modify the normal valence. For example, a carbocation has a valence of 3.Hydrogen atoms in the query may match non-hydrogen substituents in the target if the hydro-gen in the query is implicit on an unlabeled carbon atom or heteroatom. This is the default setting.Hydrogen atoms in the query must match hydrogens in the target when the query hydro-gen is at the end of an explicit bond. The matched hydrogen in the target may be implicit in an unlabeled carbon atom.The following query with explicit hydrogens:
Finds any of:
Dashed same as Single
Hashed same as Single
Thick same as Single
Wedged Hashed
specifies stereochemistry down from the point end to the wide end
Wedged specifies stereochemistry up from the point end to the wide end
Wavy specifies stereochemistry “either” at both ends
Hollow Wedged
same as Wedged
Dative same as Single
Double target must have double bond; stereo dictated by geometry
Double Either target must have double bond; any stereochemistry ok
Double Bold same as Double
Triple target must have triple bond here
Bond Type Description

ChemBioFinder & BioViz 479User Guide
Does not find any of:
Charges and radicalsCharges or radicals specified on atoms in the query must match those in the target. Uncharged atoms in the query may or may not match charged atoms in the target, depending on the state of the appropriate check box in the Search tab of the Preferences dialog.The valence of a charged atom is taken to be the valence of the isoelectronic neutral atom.With a substructure search, the query with charge or radical:
Finds any of:
Does not find any of:
IsotopesIsotopic labels specified in the query must match the target. Unlabeled atoms in the query match unlabeled or isotopically labeled atoms in the target. Additionally, D is treated inter-changeably with 2H, and T is treated the same as 3H.With a Substructure Search, the Isotopic query:

480 Structural Query FeaturesAppendix A
Finds any of:
Does not find any of:
StereochemistryStereochemistry specified on the query must match the target if the relevant Match Stereo item is selected in the Search tab of the Prefer-ences. Stereochemistry is specified at a tetrahe-dral site by using stereo bonds (up, down, either). Stereochemistry about a double bond is specified by the geometry of the drawing. ChemBioFinder cannot currently interpret other stereochemistry types (allenic, square planar, octahedral, etc.) and ignores them dur-ing a search.
When evaluating a possible match, the follow-ing rules are applied:
• Unspecified stereochemistry (a plain bond) may match any stereochemistry (either a wedged, hashed, bold, or a plain bond).
• Specific bond types need not match as long as the overall stereochemistry at a given atom does match.
• Implicit hydrogens are taken into consider-ation in both the query and the target if doing so helps to determine the chirality of a stereocenter.
With a full structure search and the Match Tet-rahedral stereo option selected, the query with stereochemistry:
Finds any of:
Does not find any of:

ChemBioFinder & BioViz 481User Guide
Relative tetrahedral stereochemistryRelative Tetrahedral Stereochemistry, or RTS, specifies a given relationship between the cen-ters. That is, a known orientation of the substit-uents with respect to each other, rather than a known absolute configuration. To specify this, centers are drawn, not with the standard hashed and wedged bonds, but with thick (bold) stereo bonds.Relative and absolute configurations may be registered separately in ChemBioFinder, and can be distinguished by various search options.The basic ChemBioFinder search philosophy can be summarized as follows: a more specific query is a more precise request, and should get fewer hits than a more general query. If the query represents a particular absolute configu-ration, it should hit only that; if it represents a mixture, it should hit any of the components.If you choose Same in the stereo search choices, you are requesting that whatever ste-
reochemistry is specified in the query must match that of the target. If the query has rela-tive bonds and RTS is activated, a hit must have the same relationship between centers.You can use the following three flags in searches based on relative stereochemistry:
• Abs: Refers to the Absolute flag. It matches the exact stereoisomer, as drawn.Example:
• Rel: Refers to the Relative flag. It matches the exact stereoisomer, as drawn, or its enantiomer.Example

482 Structural Query FeaturesAppendix A
• Rac: Refers to the Racemic flag. It matches a mixture of the exact stereoisomer, as drawn, and its enantiomer.
Example
MDL file formatsAll bond styles available in ChemDraw are retained in CDX files. The same is not true of major MDL structure files: MolFiles, SDFiles, and RDFiles. In these formats, only three ste-reo bond types are available: hash, wedge, or either (squiggly bond); thick bonds are not rec-ognized. This presents a problem for the ChemBioFinder user wishing to import or export structures having relative stereocenters.ChemBioFinder addresses this problem by using a proprietary tag in the file, recognized only by ChemBioFinder. The tag is BOND_RELS, and is applied to every stereo bond of thick type. For example, here is an excerpt from the bond table of a molfile with relative bonds....4 5 1 0 0 0 02 6 1 1 0 0 0 <- bond 5, marked as UP4 7 1 1 0 0 0 <- bond 6, marked as UP
M CFW 5 BOND_RELS <- overrides type of bond 5 to be UP/THICKM CFW 6 BOND_RELS <- same for bond 6The consequences of having a Chem-BioFinder-only tag are:
• When any of the MDL file formats is saved from within ChemBioFinder, the tag is written. Reading these files back into ChemBioFinder will retain the thick bond types.
• If a structure is drawn in ChemDraw and saved as MDL Molfile, thick bonds are lost, and are converted to normal hash/wedge bonds. (This is not true if the file is saved as CDX).
• If a structure is saved as molfile from ChemBioFinder, reading it into ChemDraw loses the thick bonds.
• Mol- or SDFiles obtained from ISIS or other programs do not know about this tag, and thus cannot convey thick bonds. How-ever, such files may be edited by hand to include the ChemBioFinder tag.
• An MDL file written by ChemBioFinder, containing tags, should in principle be read-able by any program which can import such a file. The unrecognized tags should simply be ignored.
NormalizationClosed rings of alternating single and double bonds are “normalized”. This is required to make their substituents equivalent. (Ortho-dimethylbenzene is remains same whether

ChemBioFinder & BioViz 483User Guide
there is a single or double bond between the two substituted ring atoms.)
Changing the scope of a searchWhen preparing a chemical structure to be used in a query, there are two ways to broaden or narrow the scope of the search:• Specify atom or bond properties• Specify atom or bond Special Types
In general, properties narrow a search and spe-cial types may either narrow or broaden the search.
Atom propertiesChemBioFinder allows special atom properties to be assigned to an atom in a query. These properties are usually only meaningful during a search. They generally serve to broaden or narrow the scope of the search.
Special atom typesChemBioFinder recognizes six special atom types that can match any one of a predefined set of elements:
• A matches any non-hydrogen atom.• Q matches any heteroatom (non-hydrogen,
non-carbon).• R matches any atom, including hydrogen.
Also used to indicate a link node. See “Link nodes and multivalent Rs” on page 386 for details. A link node may be any number of atoms, including zero.
• X matches any halogen (F, Cl, Br, I, At).• M matches any metal atom, shaded in the
periodic table below:
Figure A.1 Metals in the periodic chart
In a substructure, non-tautomeric query, the following query:
will get the following hits:
and will NOT hit the following:
Table 31 Normalized query

484 Structural Query FeaturesAppendix A
Atom listsAs with the predefined special atom types, an atom list is a list of atoms, one of which must match the target atom. For example:[Cl,Ag,N] atom must be Cl or Ag or NAtom lists may contain only elements. Special atom types, nicknames (Ph), and structural fragments (NH2, OCH2CH3) may not be included in an atom list. ChemBioFinder rec-ognizes a maximum of five atoms in an atom list.
Atom not-listsThe opposite of an atom list is a list of atoms, none of which must match the target atom. For example:[NOT O,S,Se] atom must not be O or S or Se (but may be any of the 100 other elements)Atom not-lists have the same restrictions as atom lists.
Substituents: exactlyThis property specifies a precise value for the number of substituents on an atom, including those explicitly drawn. This property is only meaningful in a substructure search.With a substructure search, the query:
1- This atom is marked with the atom property, Substituents Exactly:3.
Finds any of:
Does not find any of:
Substituents: up to This property specifies a maximum value for the number of substituents on an atom, includ-ing those explicitly drawn. This property is only meaningful in a substructure search.

ChemBioFinder & BioViz 485User Guide
With a substructure search, the query with sub-stituent up to property:
1- This atom is marked with the atom property Substituents Up to:2.
Finds any of:
Does not find any of:
Substituents: free sitesThe Substituents: Free Sites property specifies the maximum number of additional substitu-ents that may be present on an atom. This prop-erty is only meaningful in a substructure search.
TIP: Specifying Free Sites: 0 is a quick way to indicate that you want no further substitution at a site. Target structures will match the query structure as drawn, with no additional ligands.
With a substructure search, the query with free sites property:
1- This atom is marked with the atom property Substituents Free Sites:2.
Finds any of:
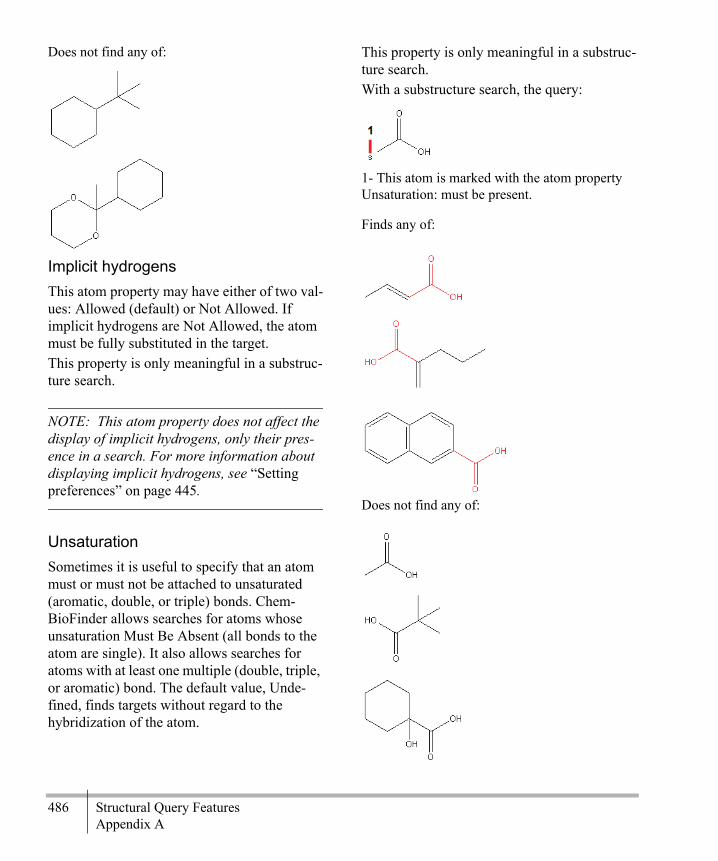
486 Structural Query FeaturesAppendix A
Does not find any of:
Implicit hydrogensThis atom property may have either of two val-ues: Allowed (default) or Not Allowed. If implicit hydrogens are Not Allowed, the atom must be fully substituted in the target.This property is only meaningful in a substruc-ture search.
NOTE: This atom property does not affect the display of implicit hydrogens, only their pres-ence in a search. For more information about displaying implicit hydrogens, see “Setting preferences” on page 445.
UnsaturationSometimes it is useful to specify that an atom must or must not be attached to unsaturated (aromatic, double, or triple) bonds. Chem-BioFinder allows searches for atoms whose unsaturation Must Be Absent (all bonds to the atom are single). It also allows searches for atoms with at least one multiple (double, triple, or aromatic) bond. The default value, Unde-fined, finds targets without regard to the hybridization of the atom.
This property is only meaningful in a substruc-ture search.With a substructure search, the query:
1- This atom is marked with the atom property Unsaturation: must be present.
Finds any of:
Does not find any of:

ChemBioFinder & BioViz 487User Guide
Bond propertiesChemBioFinder allows special properties to be assigned to bonds in a query. These properties usually will only be meaningful during a search. They generally serve to broaden or nar-row the scope of the query.
Special bond typesThe table below describes the special bond types that ChemBioFinder allows.
TopologyIf Ring or Chain is chosen, the target bond must or must not be in a ring, respectively.
Reaction centerThe reaction center refers to those bonds that are directly affected by a reaction. This prop-erty allows you to specify just how a given bond is affected.
Bond Type Description
Aromatic target bond must be aromatic as defined by the Hückel 4n+2 rule
Any target can have any bond type here
S/D target must have a single bond or a double bond here
Tautomeric same as S/D
D/A target must have a double bond or an aromatic bond here
S/A target must have a single bond or an aromatic bond here
Property Description
Unspecified target must have a bond here, but the bond can participate in the reaction in any fashion, or not at all

488 Structural Query FeaturesAppendix A
This property is only meaningful when search-ing a reaction database.
Center target must have a bond here that directly partici-pates in the reaction in some way
Make/Break target must have a bond here that is either made (if in a product) or broken (if in a reactant)
Change target must have a bond here whose bond order changes over the course of the reaction, but is not made or broken
Make&Change target must have a bond here that is either made (if in a product) or broken (if in a reactant) or whose bond order changes over the course of the reaction
Property Description
Not Center target must have a bond here, and that bond must not participate in the reaction
Not Modified target must have a bond here, and regardless of whether it is part of the reaction center or not, its order must not change over the course of the reaction
Property Description

ChemBioFinder & BioViz 489User Guide
Formula Input RulesWhen you type a formula in ChemBioFinder, you are not required to enter symbols in any particular case. This can give rise to ambigu-ities. This appendix describes how Chem-BioFinder interprets formulas and resolves these ambiguities.Consider an example. In entering a formula query, you type “cooh”Most chemists recognize this as a carboxyl group: carbon, two oxygens, hydrogen. How-ever, it might be interpreted as cobalt (Co), oxygen, hydrogen. Similarly, “CLI” might be carbon-lithium or it might be chlorine-iodine. “PHE” might be phosphorus-helium or, since ChemBioFinder allows 3-character amino-acid symbols as special atom types, it might be phe-nylalanine (Phe).One way to avoid ambiguity is to separate let-ters with spaces. For example, the string “c o” cannot possibly be interpreted as cobalt. Another way to avoid ambiguity is to enter for-mulas using the Periodic Table instead of typ-ing them. ChemBioFinder allows free-format input, and attempts to make the most reason-able interpretations of them by using the rules described below.
RulesIf a symbol is properly capitalized (first letter upper case, followed by zero, one, or two
lower-case letters), then the longest valid sym-bol which matches is preferred. Thus “Phe” matches phenylalanine rather than phosphorus; “Co” matches cobalt.Because of this rule, if you properly capitalize all symbols, no ambiguities will arise.If symbols are not properly capitalized (such as all lower-case), then, with the exception noted below, the shortest symbol which matches is preferred. Thus “co” is taken as carbon-oxygen instead of cobalt.The exception is: if two characters represent a valid two-letter symbol and also a valid one-letter symbol followed by an invalid one, then the two-letter symbol is favored. Thus “cl” is not taken as carbon followed by the (invalid symbol) L, but instead is taken as chlorine.
ExamplesThere is an easy way to experiment with for-mula interpretation: use the Periodic Table. Type a formula into the text box at the bottom, then click anywhere outside that box. Chem-BioFinder interprets the formula and redis-plays it with correct capitalization. ChemBioFinder interprets some ambiguous formulas as follows:
B
Formula ChemBioFinder Interpretation
cooh COOH

490 Formula Input RulesAppendix B
Cooh CoOH
cnosi CNOSI
cNoSi CNoSi
bru BrU
b ru BRu
Formula ChemBioFinder Interpretation

Chem & Bio Office 2010 User Guide 491ChemBioFinder
CombiChem The CombiChem engine can be used with ChemFinder/Office to generate libraries of combinatorial experiments. These libraries can be drawn from any type of file that Chem-Finder/Office can read, and stored as MST format databases.
CombiChem overviewCombiChem , the CambridgeSoft engine for generating combinatorial libraries, was previ-ously available only as an add-in extension for Microsoft Excel® for Windows. Starting with ChemOffice 8, the engine was incorporated into E/+Notebook and other products by means of a new Automation interface in MolServer. This new approach means that the engine can be used by developers everywhere. For more information, see http://www.cambridgesoft.com/services/docu-mentation/sdk/chemfinder/Default.asp.
Working with reaction templatesCombiChem is a reaction-based combinatorial product. You first enter a reaction template with R-groups at the variable sites in your starting materials, and then search for reactants based on these structures. CombiChem puts your final product structures together and cre-ates a virtual library.
Reaction template basicsThe example of a reaction template that fol-lows is supported by CombiChem :
Figure C.1 A reaction template
A reaction template must meet the following specifications:
• All sites of variability require unique R-group designations.
• Solvents, catalysts, and other “real-world” elements should not be included in the reac-tion template drawing.
• Multi-step reaction templates are sup-ported.
Entering a templateThere are two ways of entering a CombiChem template in ChemFinder/Office :
C
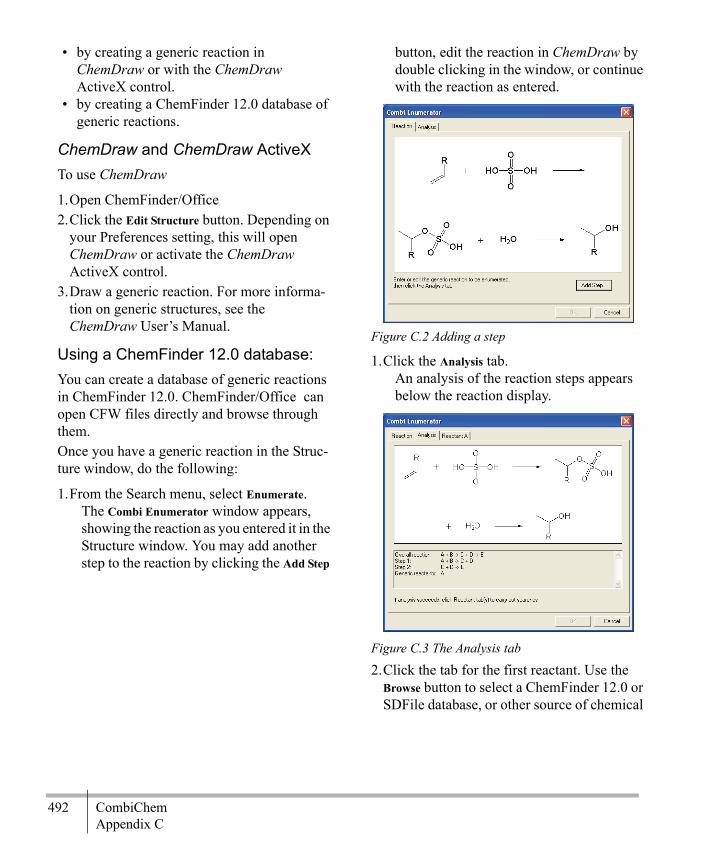
Adm
inistrator
492 CombiChemAppendix C
• by creating a generic reaction in ChemDraw or with the ChemDraw ActiveX control.
• by creating a ChemFinder 12.0 database of generic reactions.
ChemDraw and ChemDraw ActiveXTo use ChemDraw
1.Open ChemFinder/Office 2.Click the Edit Structure button. Depending on
your Preferences setting, this will open ChemDraw or activate the ChemDraw ActiveX control.
3.Draw a generic reaction. For more informa-tion on generic structures, see the ChemDraw User’s Manual.
Using a ChemFinder 12.0 database:You can create a database of generic reactions in ChemFinder 12.0. ChemFinder/Office can open CFW files directly and browse through them. Once you have a generic reaction in the Struc-ture window, do the following:
1.From the Search menu, select Enumerate.The Combi Enumerator window appears, showing the reaction as you entered it in the Structure window. You may add another step to the reaction by clicking the Add Step
button, edit the reaction in ChemDraw by double clicking in the window, or continue with the reaction as entered.
Figure C.2 Adding a step
1.Click the Analysis tab.An analysis of the reaction steps appears below the reaction display.
Figure C.3 The Analysis tab
2.Click the tab for the first reactant. Use the Browse button to select a ChemFinder 12.0 or SDFile database, or other source of chemical

Chem & Bio Office 2010 User Guide 493ChemBioFinder
structures such as a collection of ChemDraw files. Click Search.
Figure C.4 Reactant A
You may edit the hit list before continuing.Click Edit Hitlist.
An instructional dialog box appears.
Figure C.5 Edit list warning
Click OK to open ChemFinder 12.0. Edit the hitlist by selecting Omit from List from the Record menu.3.Click the Enumeration tab. Use the Browse
button to select a database in which to store the results. Click Go.
NOTE: You can create a new database file by typing in a file name.
The results are stored in the database.4.When you are finished, click OK to exit the
Combi Enumerator and return to Chem-Finder/Office .
To view the results:
1.Open ChemFinder 12.02.From the File menu select Import, then click
Structures.3.Select the database from the Open Chemical
Structures dialog box.

Adm
inistrator
494 CombiChemAppendix C
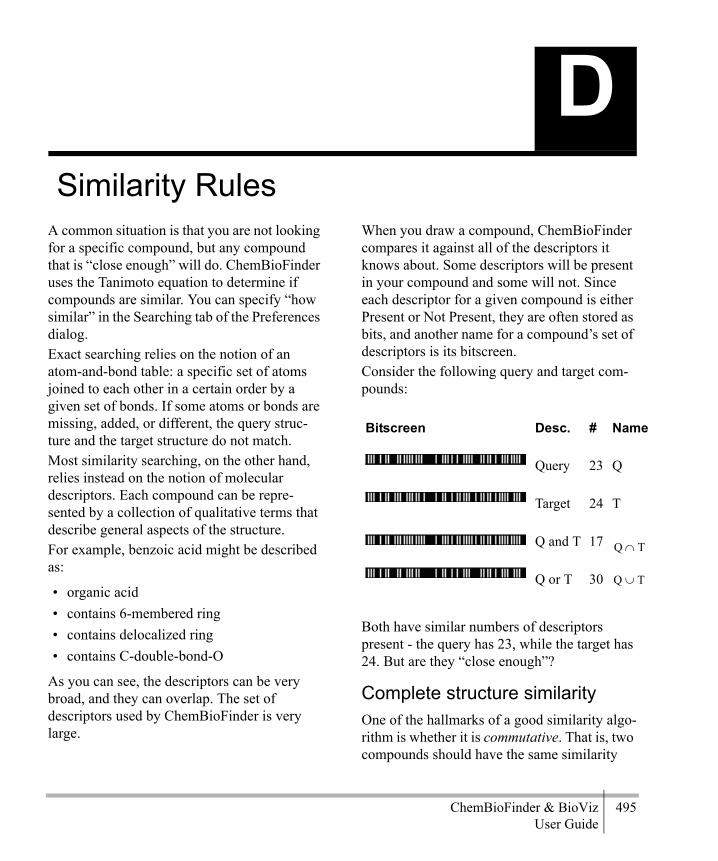
ChemBioFinder & BioViz 495User Guide
Similarity RulesA common situation is that you are not looking for a specific compound, but any compound that is “close enough” will do. ChemBioFinder uses the Tanimoto equation to determine if compounds are similar. You can specify “how similar” in the Searching tab of the Preferences dialog.Exact searching relies on the notion of an atom-and-bond table: a specific set of atoms joined to each other in a certain order by a given set of bonds. If some atoms or bonds are missing, added, or different, the query struc-ture and the target structure do not match.Most similarity searching, on the other hand, relies instead on the notion of molecular descriptors. Each compound can be repre-sented by a collection of qualitative terms that describe general aspects of the structure. For example, benzoic acid might be described as:
• organic acid• contains 6-membered ring• contains delocalized ring• contains C-double-bond-O
As you can see, the descriptors can be very broad, and they can overlap. The set of descriptors used by ChemBioFinder is very large.
When you draw a compound, ChemBioFinder compares it against all of the descriptors it knows about. Some descriptors will be present in your compound and some will not. Since each descriptor for a given compound is either Present or Not Present, they are often stored as bits, and another name for a compound’s set of descriptors is its bitscreen. Consider the following query and target com-pounds:
Both have similar numbers of descriptors present - the query has 23, while the target has 24. But are they “close enough”?
Complete structure similarityOne of the hallmarks of a good similarity algo-rithm is whether it is commutative. That is, two compounds should have the same similarity
D
Bitscreen Desc. # Name
Query 23 Q
Target 24 T
Q and T 17
Q or T 30
Q T∩
Q T∪

496 Similarity RulesAppendix D
value no matter which you compare to which. The full structure Tanimoto similarity test is commutative. It compares the number of descriptors they have in common (in the inter-section of the query and the target) to the num-ber of descriptors they have in total (in the union of the query or the target). The ratio of these two values is known as a Tanimoto coef-ficient, and is always a value between 0% and 100%.
For the two compounds above, the Tanimoto coefficient is 17/30, or about 57%. This is not very similar. Although ChemBioFinder will allow you to specify any Tanimoto value down to 0%, for most cases you will likely be look-
ing for compounds that have Tanimoto coeffi-cients of 90% or higher.
Substructure similarityUnlike full structure similarity, substructure similarity is not commutative: you are compar-ing a portion of one structure against the entire other structure, and so it does matter which you compare to which. In considering substructure similarity, ChemBioFinder finds what percent-age of descriptors in the query are also present in the target.This value will always be at least as large as the complete-structure Tanimoto coefficient for the same two compounds, and usually it will be larger. The two compounds above are 17/23, or about 74% similar by substructure similarity. For a given coefficient value, a sub-structure similarity search will always return all of the hits in a full structure similarity search, and will often return additional ones as well.
Q ∩ TQ ∪ T Tanimoto Coefficient

ChemBioFinder & BioViz 497User Guide
CAL CommandsChemBioFinder Automation Language (CAL) is a set of commands that control many Chem-BioFinder operations. You invoke CAL commands in either of two ways:
• Interactively —Type commands and exe-cute them one at a time on a command line.
• Scripts—Use ASCII files containing a series of CAL commands to be executed automatically in sequence.
Arguments to commands consist of numbers and text strings. You can enter a text string without punctuation unless the argument is not the last one on the command line and contains multiple words or spaces. In this case, you must enclose the argument in quotation marks.
CAL helpInformation about the CAL command and variables is available in the CAL Scripting Help window. To access CAL Help:
1.From the Scripts menu select Command Line.The Enter Cal Command dialog box appears.
2.In the Enter Cal Command dialog box, click the Help.
The CAL Scripting Help window appears:
Figure E.1 The CAL scripting window
Menu commands
CAL commands MENU syntaxMenu commands consist of a two-word com-mand from the main menu and in some cases an optional argument. Following are examples of commands:file newedit pastesearch findrecord next
E

498 CAL CommandsAppendix E
You do not need to spell out menu commands. You can enter just enough letters to uniquely identify the menu option. For example, to exe-cute the Record Next command, type:rec n
Some menu commands open a dialog box and wait for user feedback. To avoid this, a limited number of menu commands can take explicit arguments:FILE OPEN [filename]FILE SAVE [filename]RECORD GO TO RECORD [recno]
The command: menu menuitem [param]executes any menu command as if selected from the menu.
The menu commands have the following argu-ments:
SettingsThe settings for param vary depending on the specific menu command Most menu com-mands use no param and ignore it if present.
The following commands accept a value for param, and suppress the appropriate dialog if it is present.
RemarksMenu commands need not be spelled out in full; you can enter just enough letters to iden-tify the menu option. For example, to execute the Record next command, you can enter “rec n”.For File Open, if the file to be launched is in ChemBioFinder’s standard search path, only the actual file name (CS_DATA) is required. Otherwise, the complete file path (c:\some\long\path\CS_DATA.CFX) is neces-sary.For File Save, if the specified file does not exist, it will be created; otherwise it will be overwritten.
Part Description
menu Stringstring_definition containing the name of the menu in which the command resides.
menuitem Stringstring_definition containing the name of the specific command within the menu.
param Stringstring_definition containing additional infor-mation required by the command.
Command Param
File Open Name of the file to open.
File Save Name of the file to save.
Record Go to Index of the destination record within the current list.current_list_definition
Search Substruc-ture
ON or OFF, corresponding to the checked/unchecked state of the menu.
Search Simi-larity
ON or OFF, corresponding to the checked/unchecked state of the menu.
Search Match Stereo
ON or OFF, corresponding to the checked/unchecked state of the menu
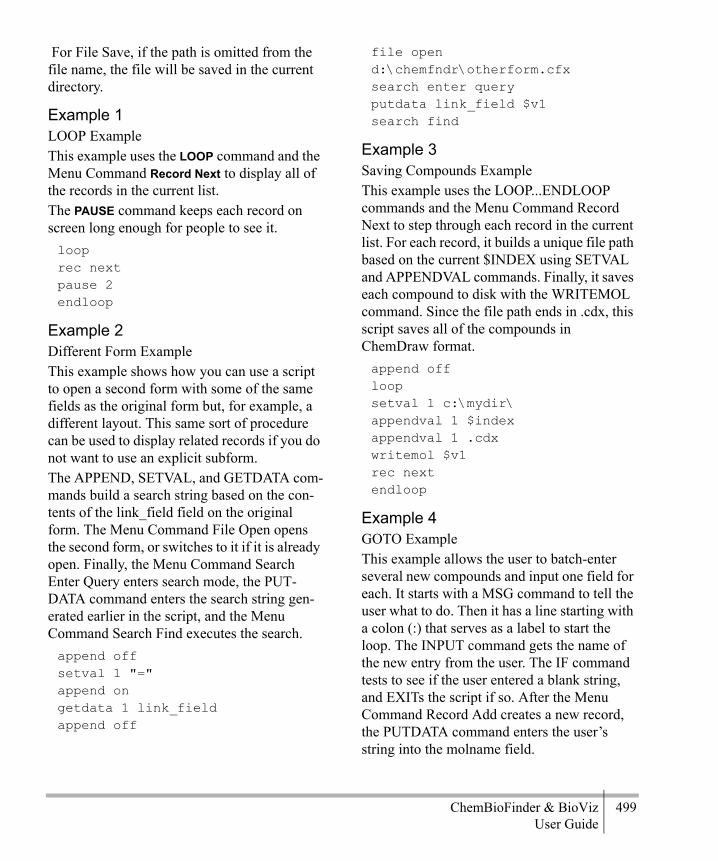
ChemBioFinder & BioViz 499User Guide
For File Save, if the path is omitted from the file name, the file will be saved in the current directory.
Example 1LOOP Example This example uses the LOOP command and the Menu Command Record Next to display all of the records in the current list. The PAUSE command keeps each record on screen long enough for people to see it.looprec nextpause 2endloop
Example 2Different Form Example This example shows how you can use a script to open a second form with some of the same fields as the original form but, for example, a different layout. This same sort of procedure can be used to display related records if you do not want to use an explicit subform.The APPEND, SETVAL, and GETDATA com-mands build a search string based on the con-tents of the link_field field on the original form. The Menu Command File Open opens the second form, or switches to it if it is already open. Finally, the Menu Command Search Enter Query enters search mode, the PUT-DATA command enters the search string gen-erated earlier in the script, and the Menu Command Search Find executes the search. append offsetval 1 "="append ongetdata 1 link_fieldappend off
file open d:\chemfndr\otherform.cfxsearch enter queryputdata link_field $v1search find
Example 3Saving Compounds Example This example uses the LOOP...ENDLOOP commands and the Menu Command Record Next to step through each record in the current list. For each record, it builds a unique file path based on the current $INDEX using SETVAL and APPENDVAL commands. Finally, it saves each compound to disk with the WRITEMOL command. Since the file path ends in .cdx, this script saves all of the compounds in ChemDraw format.append offloopsetval 1 c:\mydir\appendval 1 $indexappendval 1 .cdxwritemol $v1rec nextendloop
Example 4GOTO Example This example allows the user to batch-enter several new compounds and input one field for each. It starts with a MSG command to tell the user what to do. Then it has a line starting with a colon (:) that serves as a label to start the loop. The INPUT command gets the name of the new entry from the user. The IF command tests to see if the user entered a blank string, and EXITs the script if so. After the Menu Command Record Add creates a new record, the PUTDATA command enters the user’s string into the molname field.

500 CAL CommandsAppendix E
Closing the loop, the GOTO command jumps execution back to the start label.msg Enter new compound names. Enter a blank name when complete
:startinput 1if $v1 = "" exitrecord addputdata molname $v1goto start
Box creation commandsDBOX coords [fieldname]FRAME coords [text]TEXT coords [text]PICT coords [filename]BUTTON coords [scriptname]SUBFM coordsARROWBOX coordsFRAMEDBOX coords [fieldname] [text]
To create a new box on the form:
1.Specify the box type with the appropriate keyword.
2.Type four integers giving the rectangular coordinates of the box after the keyword.
3.If desired, type a text string giving further information appropriate to the box type, as shown below
:
If the text string is omitted, you can supply it later using SETFIELD or SETTEXT. For a button, you must use SETTEXT if you want its visible label to be different from the name of its script.Box coordinates are specified in this order: left, top, right, bottom. Units are in pixels; the origin is at the upper left, with coordinates increasing from left to right and top to bottom, so that coordinates will range from left = 0 to right = 640 or 1024 or whatever fits your screen, and from top = 0 to bottom = 480 or 768 or similar.When a new box is created, it adopts the cur-rent font. To specify a particular font for a box, use the FONT command prior to creating the box.When specifying a script name, give one of the following:
• The complete pathname of the script file.• A simple name without extension, if the
script is stored in the standard scripts subdi-rectory with the standard file extension. If
Box Type String
Data box name of database field to be displayed in the box
Frame static label for upper left
Text static text
Picture pathname of a Windows metafile
Button pathname of a script file, or name as it appears on Scripts menu
Subform <nothing>
Arrowbox <nothing>
Framedbox name of database field to be displayed in the box, and static label for upper left
Box Type String

ChemBioFinder & BioViz 501User Guide
the script name appears on the Scripts menu, you can use the name from the menu.
The table below shows examples of Box Cre-ation Commands:
CAL commands DBOX syntax DBOX creates a new data box on the active form.DBOX left top right bottom [fieldname]
The DBOX command has the following argu-ments
:
RemarksWhen a new box is created, it adopts the cur-rent font settings. These settings can be con-trolled with the FONT command.You can assign a fieldname even if there is no data source for the form. If a data source is assigned at a later point and a field within that data source has the same name as assigned to the data box, the data box will automatically display the contents of that field.
COMMAND ACTION
Frame 10 10 300 60 Molec-ular Formula
create frame with label at upper left
DBOX 20 20 290 50 formula
create data box for formula in above frame
TEXT 100 100 300 150 “A Label”
create static text string
PICT 500 300 600 400 C:/LOGO.WMF
put specified picture at lower right
BUTTON 500 10 550 40 DEMO
create button at upper right to run script DEMO.CFS
Part Description
left Integer value representing the distance, in pixels, between the left edge of the box and the left edge of the active form.
top Integer value representing the distance, in pixels, between the top edge of the box and the top edge of the active form.
right Integer value representing the distance, in pixels, between the right edge of the box and the left edge of the active form.
bottom Integer value representing the distance, in pixels, between the bottom edge of the box and the top edge of the active form.
fieldname Database field name defini-tion that will provide the data that is displayed in the data box.

502 CAL CommandsAppendix E
After a box is created, its field name can be changed with the SETFIELD command.
DBOX and FRAME exampleThis example uses the DBOX command to cre-ate a short, wide data box near the top left of the form, and display the Formula field within it.It then uses the FRAME command to label the data box with a slightly-larger frame.DBOX 10 20 210 50 FormulaFRAME 5 5 215 55 Formula
CAL commands FRAME syntaxCreates a new frame on the active form.FRAME left top right bottom [text]
The FRAME command has the following argu-ments:
RemarksWhen a new frame is created, it adopts the cur-rent font settings. These settings can be con-trolled with the FONT command.After a frame is created, its label can be changed with the SETTEXT command.
CAL commands TEXT syntaxCreates a new static text box on the active form.TEXT left top right bottom [text]
The TEXT command has the following argu-ments:
Part Description
left Integer value representing the distance, in pixels, between the left edge of the frame and the left edge of the active form.
top Integer value representing the distance, in pixels, between the top edge of the frame and the top edge of the active form.
right Integer value representing the distance, in pixels, between the right edge of the frame and the left edge of the active form.
bottom Integer value representing the distance, in pixels, between the bottom edge of the frame and the top edge of the active form.
text String displayed as a label on the top left corner of the frame.
Part Description
left Integer value representing the distance, in pixels, between the left edge of the text box and the left edge of the active form.
top Integer value representing the distance, in pixels, between the top edge of the text box and the top edge of the active form.
Part Description

ChemBioFinder & BioViz 503User Guide
RemarksWhen a new static text box is created, it adopts the current font settings. These settings can be controlled with the FONT command.After a static text box is created, its contents can be changed with the SETTEXT command.Text will wrap to fit within the dimensions specified. If all text cannot be displayed within the bounds of the text box, only the first part will be displayed. However, all text is still present and will appear if the box is resized to larger dimensions.
FONT and TEXT exampleThis example uses the FONT command to set the font to be large, bold, and bright (24-point Arial bold, in red), then uses the TEXT com-mand to create a short, wide data box near the top middle of the form.FONT Arial 24 1 255 0 0TEXT 200 40 450 70 My Compound Database
CAL commands PICT syntaxCreates a new picture box on the active form.PICT left top right bottom [filename]
The PICT command has the following argu-ments:
RemarksIf the Windows metafile is in Chem-BioFinder’s standard search path, only the actual file name and extension (BUTTR-
right Integer value representing the distance, in pixels, between the right edge of the text box and the left edge of the active form.
bottom Integer value representing the distance, in pixels, between the bottom edge of the text box and the top edge of the active form.
text String displayed as the static text.
Part Description
Part Description
left Integer value representing the distance, in pixels, between the left edge of the box and the left edge of the active form.
top Integer value representing the distance, in pixels, between the top edge of the box and the top edge of the active form.
right Integer value representing the distance, in pixels, between the right edge of the box and the left edge of the active form.
bottom Integer value representing the distance, in pixels, between the bottom edge of the box and the top edge of the active form.
filename Name of the Windows meta-file to display in the picture box.

504 CAL CommandsAppendix E
FLY.WMF) is required. Otherwise, the com-plete file path (c:\some\long\path\BUTTERFLY.WMF) is necessary.
PICT exampleThis example uses the PICT command to cre-ate a large picture field toward the right of the form, and display in it the BUTTRFLY.WMF picture in the ChemBioFinder System direc-tory.PICT 300 100 500 300 buttrfly.wmf
CAL commands BUTTON syntaxCreates a new button on the active form.BUTTON left top right bottom [filename]
The BUTTON command has the following arguments:
RemarksIf the CAL script file is in ChemBioFinder’s standard search path, only the actual file name (BROWSE) is required. Otherwise, the com-plete file path (c:\some\long\path\BROWSE.CFS) is neces-sary.When a new button is created, it adopts the current font settings. These settings can be controlled with the FONT command.By default, the name of the CAL script file (for example, BROWSE) is shown on the button. This can be changed with the SETTEXT com-mand.
BUTTON exampleThis example uses the BUTTON command to create a button near the bottom of the form, and assign to it the REGISTER.CFS script in the same directory as the form.BUTTON 50 300 200 330 Register
CAL commands SUBFM syntaxCreates a new subform on the active form.SUBFM left top right bottom
The SUBFM command has the following argu-ments
Part Description
left Integer value representing the distance, in pixels, between the left edge of the button and the left edge of the active form.
top Integer value representing the distance, in pixels, between the top edge of the button and the top edge of the active form.
right Integer value representing the distance, in pixels, between the right edge of the button and the left edge of the active form.
bottom Integer value representing the distance, in pixels, between the bottom edge of the button and the top edge of the active form.
filename Name of the CAL script file to display in the button
Part Description

ChemBioFinder & BioViz 505User Guide
:
RemarksIt is not currently possible to set the data source or link fields of a subform using CAL.
SUBFM exampleThis example uses the SUBFM command to create a large subform in the middle of the form.SUBFM 50 50 600 300
Box manipulation commandsFORMEDIT ON|OFFSELECT boxUNSELECT box
DELBOX boxSETFIELD box fieldnameSETTEXT box textACTIVATE subformDEACTIVATESCALESCALE_TO_FIT
To work with a box or subform on the form, you specify a keyword followed by a box iden-tifier. A box is identified in one of two ways:
• By point—Give the coordinates of a point anywhere within the box. When coordi-nates fall in more than one box, the most recently created box is used.
• By text—The text you enter to identify a box may be:• The field name, if the box contains data
from a database.• The text label, if the box contains static
text, such as frames or text labels.• The box name assigned in Box Properties.• For subform boxes, the table name.In all cases, you need not spell out the entire name, just enough to be unique.Often, more than one box matches the text you enter, for example a box displaying field “molweight” within a frame labelled “MolWeight.” In this case, preference is given to the box connected to the database.
FORMEDIT controls the behavior of the SELECT command. With FORMEDIT ON, SELECT affects boxes. With FORMEDIT OFF, SELECT affects the contents of those boxes.SELECT and UNSELECT choose boxes to be modified by editing operations. DELBOX is a shortcut for FORMEDIT ON, followed by SELECT, followed by Edit Clear. SETFIELD connects a database field to an existing box;
Part Description
left Integer value representing the distance, in pixels, between the left edge of the subform databox and the left edge of the active form.
top Integer value representing the distance, in pixels, between the top edge of the subform databox and the top edge of the active form.
right Integer value representing the distance, in pixels, between the right edge of the subform databox and the left edge of the active form.
bottom Integer value representing the distance, in pixels, between the bottom edge of the subform databox and the top edge of the active form.

506 CAL CommandsAppendix E
for a button, it attaches a script name (see above regarding script names). SETTEXT attaches a text string to a box or replaces the one currently attached; see box creation com-mands (above) for a list of what the text strings mean for various box types.ACTIVATE and DEACTIVATE are the same as SELECT and UNSELECT, but work on subforms. Following an ACTIVATE com-mand, all subsequent commands apply to the active subform and any boxes it contains. The DEACTIVATE command is required to once again refer to the main form and its contents.SCALE scales all items in the current form by the percentage factor you specify. Use this to fit your forms to different size screens. See SCALE_TO_FIT below.SCALE_TO_FIT scales all elements in the form such that the string you specify will fit in the form at the currently selected font size. See FONT below.The table below shows examples of Box Manipulation Commands:
CAL commands DELBOX syntaxDeletes a data box, frame, static text box, pic-ture box, button, or subform the active form.DELBOX box
The DELBOX command has the following argument:
RemarksThe DELBOX command is a shortcut for FORMEDIT ON, followed by SELECT, fol-lowed by the Menu Command Edit Clear.The DELBOX command deletes only the box, not its actual contents. For example, deleting a button does not delete the CAL script file from your disk.
CAL commands SETFIELD syntaxConnects a database field to an existing data box or a CAL script name to an existing but-ton, or replaces one already connected.SETFIELD box fieldname
The SETFIELD command has the following arguments:
CAL commands SETTEXT syntaxAttaches a text string to a frame, text box, or button, or replaces one already attached.SETTEXT box text
Command Action
SELECT 11 11
select formula frame created above
SELECT formu
select formula data box created above
SETFIELD 21 21 molweight
change field for formula data box to molweight
Part Description
box Box identifier indicating the box to delete.
Part Description
box Box indicating the target.
fieldname String containing the data-base field name (if the target is a data box) or CAL script name (if the target is a button) to assign to the target.

ChemBioFinder & BioViz 507User Guide
The SETTEXT command has the following arguments:
Depending on the box type, the text is attached to different places:
CAL commands ACTIVATE syntaxMarks a subform on the active form to become the new active form. It is equivalent to clicking on the subform with the pointer tool.ACTIVATE subform
The ACTIVATE command has the following argument
:
NOTE: This command will change the active form.
RemarksThe ACTIVATE command acts only on sub-forms. The similar command SELECT is used for data boxes, frames, text boxes, buttons, and picture boxes.
CAL commands FORMEDIT syntaxDetermines whether the active form is in form edit mode or data edit mode.FORMEDIT value
The FORMEDIT command has the following settings:
RemarksWhen the form is in form edit mode, the SELECT command affects data boxes them-selves. When the form is in data edit mode, the SELECT command affects the data within the data boxes.
Part Description
box Box identifier indicating the target.
text String to attach to the target.
Box type Text location
data box Within the text box, wrapped to fit.
frame On the top border, aligned to the left.
text box Within the text box, wrapped to fit.
button Centered within the button.
Part Description
subform Box identifier indicating the subform to activate.
Setting Description
ON Form is set to form edit mode.
OFF Form is set to data edit mode.
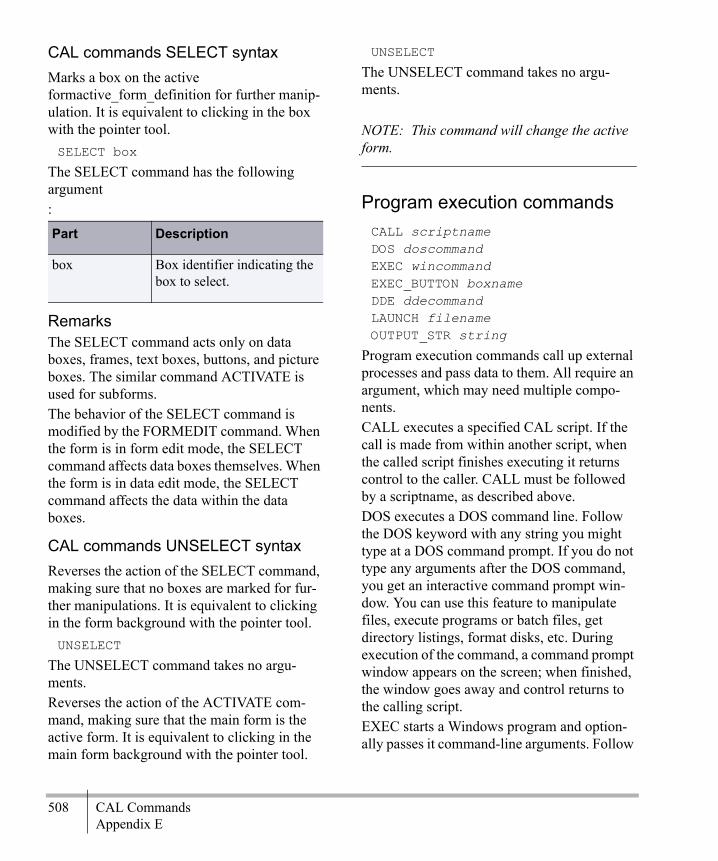
508 CAL CommandsAppendix E
CAL commands SELECT syntaxMarks a box on the active formactive_form_definition for further manip-ulation. It is equivalent to clicking in the box with the pointer tool.SELECT box
The SELECT command has the following argument:
RemarksThe SELECT command acts only on data boxes, frames, text boxes, buttons, and picture boxes. The similar command ACTIVATE is used for subforms.The behavior of the SELECT command is modified by the FORMEDIT command. When the form is in form edit mode, the SELECT command affects data boxes themselves. When the form is in data edit mode, the SELECT command affects the data within the data boxes.
CAL commands UNSELECT syntaxReverses the action of the SELECT command, making sure that no boxes are marked for fur-ther manipulations. It is equivalent to clicking in the form background with the pointer tool.UNSELECT
The UNSELECT command takes no argu-ments.Reverses the action of the ACTIVATE com-mand, making sure that the main form is the active form. It is equivalent to clicking in the main form background with the pointer tool.
UNSELECT
The UNSELECT command takes no argu-ments.
NOTE: This command will change the active form.
Program execution commandsCALL scriptnameDOS doscommandEXEC wincommandEXEC_BUTTON boxnameDDE ddecommandLAUNCH filenameOUTPUT_STR string
Program execution commands call up external processes and pass data to them. All require an argument, which may need multiple compo-nents.CALL executes a specified CAL script. If the call is made from within another script, when the called script finishes executing it returns control to the caller. CALL must be followed by a scriptname, as described above.DOS executes a DOS command line. Follow the DOS keyword with any string you might type at a DOS command prompt. If you do not type any arguments after the DOS command, you get an interactive command prompt win-dow. You can use this feature to manipulate files, execute programs or batch files, get directory listings, format disks, etc. During execution of the command, a command prompt window appears on the screen; when finished, the window goes away and control returns to the calling script.EXEC starts a Windows program and option-ally passes it command-line arguments. Follow
Part Description
box Box identifier indicating the box to select.
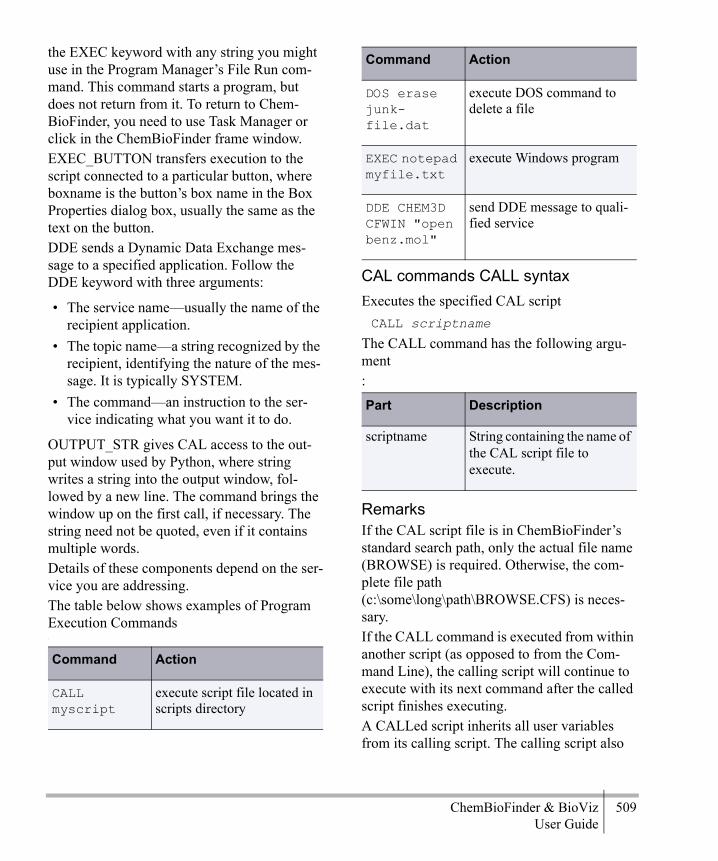
ChemBioFinder & BioViz 509User Guide
the EXEC keyword with any string you might use in the Program Manager’s File Run com-mand. This command starts a program, but does not return from it. To return to Chem-BioFinder, you need to use Task Manager or click in the ChemBioFinder frame window.EXEC_BUTTON transfers execution to the script connected to a particular button, where boxname is the button’s box name in the Box Properties dialog box, usually the same as the text on the button.DDE sends a Dynamic Data Exchange mes-sage to a specified application. Follow the DDE keyword with three arguments:
• The service name—usually the name of the recipient application.
• The topic name—a string recognized by the recipient, identifying the nature of the mes-sage. It is typically SYSTEM.
• The command—an instruction to the ser-vice indicating what you want it to do.
OUTPUT_STR gives CAL access to the out-put window used by Python, where string writes a string into the output window, fol-lowed by a new line. The command brings the window up on the first call, if necessary. The string need not be quoted, even if it contains multiple words.Details of these components depend on the ser-vice you are addressing.The table below shows examples of Program Execution Commands:
CAL commands CALL syntaxExecutes the specified CAL scriptCALL scriptname
The CALL command has the following argu-ment:
RemarksIf the CAL script file is in ChemBioFinder’s standard search path, only the actual file name (BROWSE) is required. Otherwise, the com-plete file path (c:\some\long\path\BROWSE.CFS) is neces-sary.If the CALL command is executed from within another script (as opposed to from the Com-mand Line), the calling script will continue to execute with its next command after the called script finishes executing.A CALLed script inherits all user variables from its calling script. The calling script also
Command Action
CALL myscript
execute script file located in scripts directory
DOS erase junk-file.dat
execute DOS command to delete a file
EXEC notepad myfile.txt
execute Windows program
DDE CHEM3D CFWIN "open benz.mol"
send DDE message to quali-fied service
Part Description
scriptname String containing the name of the CAL script file to execute.
Command Action

510 CAL CommandsAppendix E
inherits the user variables back from the called script when it has completed executing.
CAL commands DOS syntaxExecutes a standard DOS command lineDOS doscommand
The DOS command has the following argu-ment:
RemarksThis command may be used to manipulate files, execute programs or batch files, get directory listings, format disks, etc.During execution, a DOS command prompt window appears on the screen; when finished, the window goes away and control returns to the calling script.
CAL commands EXEC syntaxStarts a Windows program and optionally passes it command-line arguments.EXEC filename [commandargs]
The EXEC command has the following argu-ments:
RemarksIf the file to be launched is in Chem-BioFinder’s standard search path, only the actual file name (CHEMDRAW) is required. Otherwise, the complete file path (c:\some\long\path\CHEMDRAW.EXE) is necessary.The EXEC command starts a program, but does not return from it; in order to return to ChemBioFinder, you need to use the Task Manager or click in the ChemBioFinder frame window.
EXEC exampleThis example uses the EXEC command to start Microsoft Excel.The first line starts with an asterisk (*) and so is not executed. It serves only to make the example more readable for the user.* RUNEXCEL.CFS -- script to start ExcelEXEC "c:\msoffice\excel\excel.exe"
CAL commands DDE syntaxSends a Dynamic Data Exchange message to a specified applicationDDE [timeout] servicename topic command
The DDE command has the following argu-ments
Part Description
doscommand Any string that might be typed at a DOS command prompt.
Part Description
commandargs String containing arguments to be passed to that applica-tion.
filename String containing the file name of any Windows appli-cation
Part Description

ChemBioFinder & BioViz 511User Guide
:
RemarksDDE commands are highly specific to each application. Please consult the documentation for the desired recipient application for infor-mation on service names, topic names, and commands it supports.The DDE command is always sent as an EXE-CUTE instruction.
Communicating with Excel exampleThis example uses the WRITETEXT com-mand to write the current list to a file, then sends two DDE commands to open that file in Microsoft Excel and resize the columns to a nice size. Finally, it uses the DOS command to delete the temporary file.The first line starts with an asterisk (*) and so is not executed. It serves only to make the example more readable for the user.* TOEXCEL.CFS -- script to send data to Excel
WRITETEXT C:\DATA.TMPDDE Excel System [OPEN("C:\DATA.TMP")]DDE Excel System [COLUMN.WIDTH(1,"C1:C4",,3,1)]DOS erase C:\DATA.TMP
General commandsMSG messageSTATMSG messageTIMEDMSG [n] <msg>WFONT fontname [size [style r g b]]SEEPTAB [decisecs]QUIETCLOSEHIDETABLESETCLEAN [cleanup, tidy, redraw, denovo]HELPGET [v] section number, itemnumberSOUND filename.wavSYSMETRIC [v] index
MSG displays a message box with the speci-fied text, and waits for the user to click.STATMSG displays information on the status line.TIMEDMSG displays a message box similar to the MSG command, but the message disap-pears automatically after a specified number of seconds. For example: TIMEDMSG 10 ″This message will disappear automatically after 10 seconds.″FONT changes the current font. Any boxes created subsequently adopt this font. Follow the keyword with a name from your Windows font list, followed optionally by:
• Font size in points (default is 8). • Style from the list below (default is 0, or
plain text).
Part Description
timeout An optional time in seconds to try establishing the connection
servicename String containing the identi-fier of the recipient applica-tion; often but not always the application name.
topic String identifying the nature of the message
command String containing instructions to recipient application indi-cating what you want it to do.

512 CAL CommandsAppendix E
• Color; three values for red, green, and blue, each ranging from 0 to 255 (default is 0,0,0, or black).
Font styles are sums of bold (1), italic (2), and underline (4). Thus a style value of 1 means bold, 3 means bold+italic, 6 means italic+underline, and so on.SEEPTAB briefly displays the periodic table window, then closes it. The window will be displayed for the amount of time specified (1 decisecond = 0.1 second). If the duration is omitted, it will be displayed for four seconds.QUITECLOSE closes the active form. This command is similar to FILE CLOSE, but auto-matically discards any changes instead of prompting the user what to do.HIDETABLE closes the Table View window for the current form. If a subform is active, it returns the subform to form view.SET allows you to modify basic Chem-BioFinder settings, including most of those found in the Preferences dialog and several that cannot be accessed in any other way. See the online help for a complete listing of param-eters that can be SET.CLEAN will attempt to standardize the bond lengths and angles of the current molecule. It is the same as opening the molecule in ChemDraw, and selecting the Clean Up Struc-ture command. The arguments are optional.HELP displays a list of all valid CAL com-mands. The valid parameter types are listed for each command, as is a brief description.GET retrieves a value from the Chem-BioFinder.ini file. Follow the keyword with a variable name and the section and item number of the value you want to retrieve. SOUND plays a .wav file you specify.
SYSMETRIC retrieves the specified system metric into a variable.The table below shows examples of General Commands:
CAL commands MSG syntaxDisplays a message in a dialog box, and waits for the user to dismiss the dialog.MSG message
The MSG command has the following argu-ment:
CAL commands FONT syntaxChanges the current font, size, style, and color used for all subsequent box creation.FONT fontname [size [style [r g b]]]
Command Action
MSG ″Click OK to con-tinue″
display message, wait for click
FONT Times 12 1 255 0 0
change font to red 12-point Times bold
GET V1,4,5 place the value of item num-ber 5 in section 4 into the variable V1
SOUND beep.wav
play the sound in the files beep.wav
Part Description
message String displayed as the message in the dialog box.

ChemBioFinder & BioViz 513User Guide
The FONT command has the following argu-ments:
SettingsThe settings for style are:
CAL commands SEEPTAB syntaxDisplays the Periodic Table window, then closes it.SEEPTAB [decisecs]
The SEEPTAB command has the following argument:
Remarks10 decisec = 1 second.If the decisecs argument is omitted, the Peri-odic Table window will be displayed for 4 sec-onds.
CAL commands QUIETCLOSE syntaxCloses the topmost form immediately, without checking to see if it has been modified.QUIETCLOSE
The QUIETCLOSE command takes no argu-ments.
RemarksThis command is similar to the Menu Com-mand File Close. However, if the user has
Part Description
fontname String containing the name of a font from your Windows font list
size String containing the size of the font, in points.
style String containing the style in which to display the font, as described in Settings.
r String containing the red component of the font color, in the range from 0 to 255.
g String containing the green component of the font color, in the range from 0 to 255.
b String containing the blue component of the font color, in the range from 0 to 255.
Setting Description
0 Plain text.
1 Bold
2 Italic
3 Bold and italic.
4 Underline
5 Bold and underline.
6 Italic and underline.
7 Bold and italic and underline
Part Description
decisecs Amount of time to display the Periodic Table window before closing it.
Setting Description

514 CAL CommandsAppendix E
modified the form in any way, the File Close command will present an alert asking if the user wants to save changes, while the QUIET-CLOSE command will not.
CAL commands HIDETABLE syntaxCloses the Table View window for the active form.active_form_definitionHIDETABLE
The HIDETABLE command takes no argu-ments.
RemarksThe Table View for the active form can be dis-played with the Menu Command View Data Table.If the active form is a subform, the HIDETABLE command will return it to form view.
CAL commands SET syntaxChanges the values of various preferences that control the overall behavior of Chem-BioFinder.SET section preference setting
The SET command has the following argu-ments:
ValuesThe values for section, preference, and value are:
Part Description
section String describing the general category of preference.
preference String naming the preference to change.
setting String describing new value of preference.
Section Preference Description Values
DISPLAY ATOM_LABEL_COLOR The color in which to display atom labels that cannot be interpreted by Chem-BioFinder.
The default is Purple.
color
DISPLAY ATOM_NUMS Whether or not to display atom numbers on each atom.
The default is 0 (do not display)
0 or 1

ChemBioFinder & BioViz 515User Guide
DISPLAY ATOM_SPECIAL_COLOR The color of query atoms and other atom types not listed in the Periodic table.
The default is Purple.
color
DISPLAY BOND_NUMS Whether or not to display bond numbers on each bond.
The default is 0 (do not display)
0 or 1
DISPLAY BOND_SPACING Spacing between double bonds, as a percentage of bond length.
The default is 12 (%).
0 ... 100
DISPLAY FONT_ADJUSTMENT A correction to the font size of atom labels based on a structure's average bond length. More specifically, the font size of atom labels is: (nominal value + (FONT_ADJUSTMENT/100) * average bond length).
The default is 20 (%).
-50 ... 80
DISPLAY FORM_COLOR The background color of the form. This parameter can be set manually in the Color tab of the Preferences dialog.
The default is Grey.
color
Section Preference Description Values
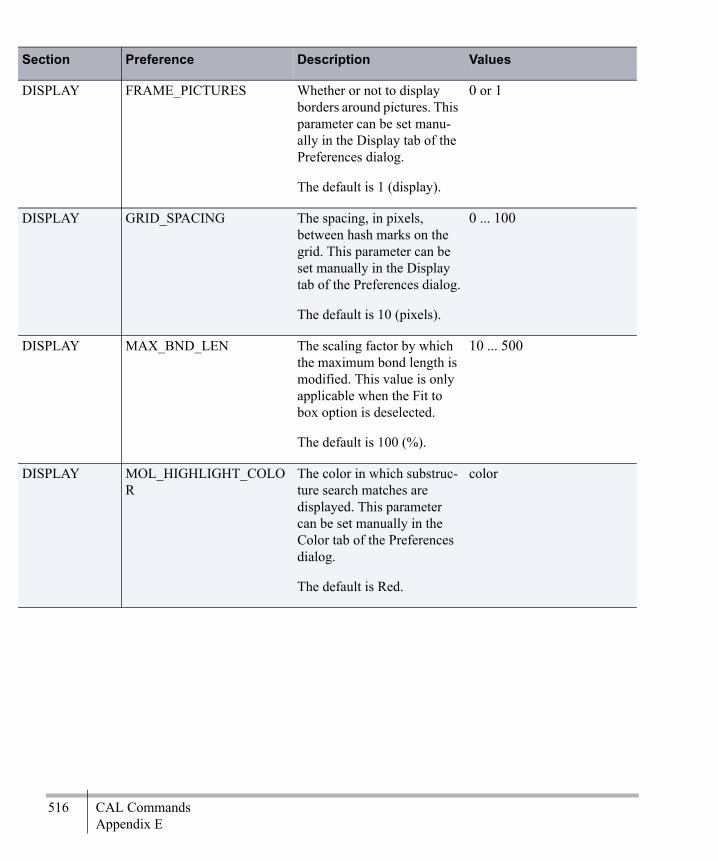
516 CAL CommandsAppendix E
DISPLAY FRAME_PICTURES Whether or not to display borders around pictures. This parameter can be set manu-ally in the Display tab of the Preferences dialog.
The default is 1 (display).
0 or 1
DISPLAY GRID_SPACING The spacing, in pixels, between hash marks on the grid. This parameter can be set manually in the Display tab of the Preferences dialog.
The default is 10 (pixels).
0 ... 100
DISPLAY MAX_BND_LEN The scaling factor by which the maximum bond length is modified. This value is only applicable when the Fit to box option is deselected.
The default is 100 (%).
10 ... 500
DISPLAY MOL_HIGHLIGHT_COLOR
The color in which substruc-ture search matches are displayed. This parameter can be set manually in the Color tab of the Preferences dialog.
The default is Red.
color
Section Preference Description Values

ChemBioFinder & BioViz 517User Guide
DISPLAY NET_OUTSIDE Whether or not to move bracketed text to the outside, where possible, in the display of net reaction changes in molecular formulas and molecular weights.
The default is 1 (move to outside).
0 or 1
DISPLAY NET_RXN_CHANGE Whether or not to display net reaction changes in brackets in molecular formulas and molecular weights.
The default is 1 (display changes).
0 or 1
DISPLAY PICTURE_BACKGROUND The background color of Picture boxes. This param-eter can be set manually in the Color tab of the Prefer-ences dialog.
The default is White.
color
DISPLAY QUERY_BOND_COLOR The color in which bonds with query properties should be displayed. This parameter can be set manually in the Color tab of the Preferences dialog.
The default is Green.
color
Section Preference Description Values

518 CAL CommandsAppendix E
DISPLAY RXN_CTR_COLOR The color in which reaction centers should be high-lighted, if highlighting is turned on. This parameter can be set manually in the Color tab of the Preferences dialog.
The default is 33023 (purplish).
color
DISPLAY SHOW_AAMAP Whether or not to highlight matching mapped atoms in a reaction in color. This param-eter can be set manually in the Display tab of the Prefer-ences dialog.
The default is 0 (do not high-light).
0 or 1
DISPLAY SHOW_H_CHARGED_ATOMS
Whether or not to display implicit hydrogens on all atoms bearing a charge or radical.
The default is 1 (display).
0 or 1
DISPLAY SHOW_H_ON_HET Whether or not to display implicit hydrogens on all heteroatoms. This parameter can be set manually in the Display tab of the Prefer-ences dialog.
The default is 1 (display).
0 or 1
Section Preference Description Values

ChemBioFinder & BioViz 519User Guide
DISPLAY SHOW_H_TERM_C Whether or not to display implicit hydrogens on all terminal carbons. This parameter can be set manu-ally in the Display tab of the Preferences dialog.
The default is 0 (do not display).
0 or 1
DISPLAY SHOW_RXN_CENTER Whether or not to highlight reaction centers. This param-eter can be set manually in the Display tab of the Prefer-ences dialog.
The default is 0 (do not high-light).
0 or 1
OPTIONS CFW_METAFILES Whether to generate pictures using ChemBioFinder or using ChemDraw when copying a structure to the clipboard.
The default is 0 (use ChemDraw to generate).
0 or 1
OPTIONS DDE_TIMEOUT Number of seconds to wait for a response to a DDE transaction.
The default is 30 (seconds).
0 ... 60
Section Preference Description Values

520 CAL CommandsAppendix E
OPTIONS EXPLICIT_METAL_H Whether or not to require that metals have hydrogens drawn implicitly. If this parameter is off, ChemBioFinder will automatically add hydrogens to fill each metal's minimum valence. This parameter can be set manually in the General tab of the Prefer-ences dialog.
The default is 1 (require explicit drawing).
0 or 1
OPTIONS EXPORT_HEADER ASCII value of the delimiter to use when exporting delim-ited text files. This parameter can be set manually in the General tab of the Prefer-ences dialog.
The default is 9 (tab).
0 ... 255
OPTIONS LOAD_LAST_FORM_ON_STARTUP
Whether or not to load the last-active form file the next time ChemBioFinder is launched.
The default is 0 (do not load).
0 or 1
Section Preference Description Values

ChemBioFinder & BioViz 521User Guide
OPTIONS NON_INTERACTIVE Whether or not to suppress non-critical dialogs. Princi-pally useful when Chem-BioFinder is being used unat-tended, such as over the WWW. It is not recom-mended to have this option on when using Chem-BioFinder directly.
The default is 0 (interactive mode).
0 or 1
OPTIONS VALIDATE_VALENCE Whether or not to provide a warning when attempting to enter a substance containing an element in a non-standard valence. This parameter can be set manually in the General tab of the Prefer-ences dialog.
The default is 0 (do not warn).
0 or 1
PRINT_OPTIONS
PRINT_BORDER Whether or not to display a border around forms when printing
The default is 1 (print a border).
0 or 1
Section Preference Description Values

522 CAL CommandsAppendix E
PRINT_OPTIONS
PRINT_FOOTER The contents of the footer to be printed at the bottom of all pages containing forms. Any text is valid, as well as the following special codes:
%D current date
%F name of the CFX file
%P page number
%T current time
The default is “Chem-BioFinder %D %T Record %P”
string
PRINT_OPTIONS
PRINT_HEADER The contents of the header to be printed at the top of all pages containing forms. Any text is valid, as well as the same special codes recog-nized for the footer.
The default is “%F” (file name)
string
SEARCHING EXACT Whether or not to allow a substructure match when searching. This parameter can be set manually in the Search tab of the Preferences dialog.
The default is 0 (substruc-ture).
0 or 1
Section Preference Description Values

ChemBioFinder & BioViz 523User Guide
SEARCHING FIND_CHARGED_CARBON
Whether or not to allow uncharged carbon atoms to match charged ones when searching. This parameter can be set manually in the Search tab of the Preferences dialog.
The default is 1 (allow the match).
0 or 1
SEARCHING FIND_CHARGED_HET Whether or not to allow uncharged heteroatoms to matched charged ones when searching. This parameter can be set manually in the Search tab of the Preferences dialog.
The default is 1 (allow the match).
0 or 1
SEARCHING MATCH_STEREO_DB Whether or not to match cis/trans stereochemistry around double bonds. This parameter can be set manu-ally in the General tab of the Preferences dialog.
The default is 1 (match stereo).
0 or 1
SEARCHING MATCH_STEREO_TET Whether or not to match tetrahedral stereochemistry. This parameter can be set manually in the Search tab of the Preferences dialog.
The default is 1 (match stereo).
0 or 1
Section Preference Description Values

524 CAL CommandsAppendix E
SEARCHING MAX_HITS Maximum number of hits to be returned by a search.
The default is 2500 (hits).
1…
SEARCHING SIMILARITY Whether or not to allow a similarity match when searching. This parameter can be set manually in the Search tab of the Preferences dialog.
The default is 0 (require exact match).
0 or 1
SEARCHING SRCH_TANIMOTO_PCT Cutoff percentage below which two compounds are not considered similar. This parameter can be set manu-ally in the Search tab of the Preferences dialog.
The default is 90 (%).
0 … 100
SEARCHING SRCH_USE_RXN_CTRS Whether or not to require that query substructures have at least one atom or bond in the reaction center of the target. This parameter can be set manually in the Search tab of the Preferences dialog.
The default is 1 (require in center).
0 or 1
Section Preference Description Values
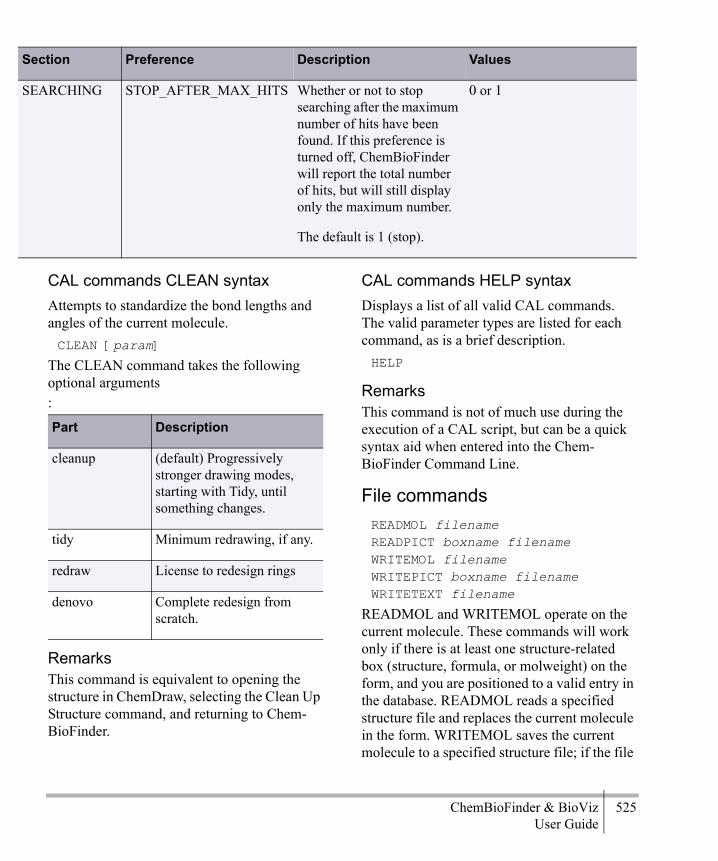
ChemBioFinder & BioViz 525User Guide
CAL commands CLEAN syntaxAttempts to standardize the bond lengths and angles of the current molecule.CLEAN [param]
The CLEAN command takes the following optional arguments:
RemarksThis command is equivalent to opening the structure in ChemDraw, selecting the Clean Up Structure command, and returning to Chem-BioFinder.
CAL commands HELP syntaxDisplays a list of all valid CAL commands. The valid parameter types are listed for each command, as is a brief description.HELP
RemarksThis command is not of much use during the execution of a CAL script, but can be a quick syntax aid when entered into the Chem-BioFinder Command Line.
File commandsREADMOL filenameREADPICT boxname filenameWRITEMOL filenameWRITEPICT boxname filenameWRITETEXT filename
READMOL and WRITEMOL operate on the current molecule. These commands will work only if there is at least one structure-related box (structure, formula, or molweight) on the form, and you are positioned to a valid entry in the database. READMOL reads a specified structure file and replaces the current molecule in the form. WRITEMOL saves the current molecule to a specified structure file; if the file
SEARCHING STOP_AFTER_MAX_HITS Whether or not to stop searching after the maximum number of hits have been found. If this preference is turned off, ChemBioFinder will report the total number of hits, but will still display only the maximum number.
The default is 1 (stop).
0 or 1
Section Preference Description Values
Part Description
cleanup (default) Progressively stronger drawing modes, starting with Tidy, until something changes.
tidy Minimum redrawing, if any.
redraw License to redesign rings
denovo Complete redesign from scratch.
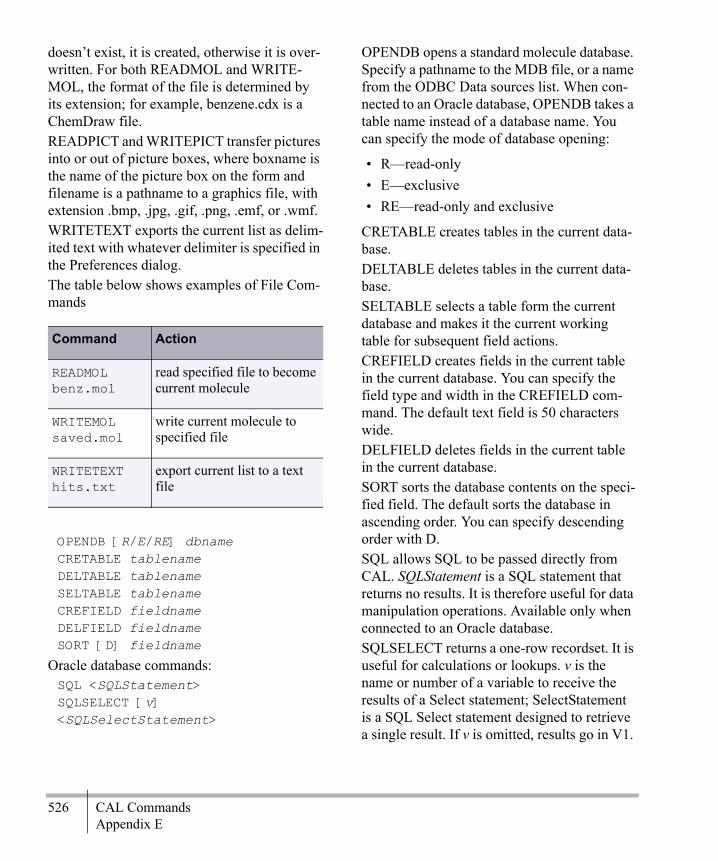
526 CAL CommandsAppendix E
doesn’t exist, it is created, otherwise it is over-written. For both READMOL and WRITE-MOL, the format of the file is determined by its extension; for example, benzene.cdx is a ChemDraw file.READPICT and WRITEPICT transfer pictures into or out of picture boxes, where boxname is the name of the picture box on the form and filename is a pathname to a graphics file, with extension .bmp, .jpg, .gif, .png, .emf, or .wmf. WRITETEXT exports the current list as delim-ited text with whatever delimiter is specified in the Preferences dialog.The table below shows examples of File Com-mands
OPENDB [R/E/RE] dbnameCRETABLE tablenameDELTABLE tablenameSELTABLE tablenameCREFIELD fieldnameDELFIELD fieldnameSORT [D] fieldname
Oracle database commands:SQL <SQLStatement>SQLSELECT [v] <SQLSelectStatement>
OPENDB opens a standard molecule database. Specify a pathname to the MDB file, or a name from the ODBC Data sources list. When con-nected to an Oracle database, OPENDB takes a table name instead of a database name. You can specify the mode of database opening:
• R—read-only• E—exclusive• RE—read-only and exclusive
CRETABLE creates tables in the current data-base.DELTABLE deletes tables in the current data-base.SELTABLE selects a table form the current database and makes it the current working table for subsequent field actions.CREFIELD creates fields in the current table in the current database. You can specify the field type and width in the CREFIELD com-mand. The default text field is 50 characters wide.DELFIELD deletes fields in the current table in the current database.SORT sorts the database contents on the speci-fied field. The default sorts the database in ascending order. You can specify descending order with D.SQL allows SQL to be passed directly from CAL. SQLStatement is a SQL statement that returns no results. It is therefore useful for data manipulation operations. Available only when connected to an Oracle database.SQLSELECT returns a one-row recordset. It is useful for calculations or lookups. v is the name or number of a variable to receive the results of a Select statement; SelectStatement is a SQL Select statement designed to retrieve a single result. If v is omitted, results go in V1.
Command Action
READMOL benz.mol
read specified file to become current molecule
WRITEMOL saved.mol
write current molecule to specified file
WRITETEXT hits.txt
export current list to a text file

ChemBioFinder & BioViz 527User Guide
Available only when connected to an Oracle database.If you omit the password from the connection string, and you will be prompted for it when running the command.The table below shows examples of Database Commands
CAL commands OPENDB syntaxOpens a database and assigns it as the Data Source of the active form.OPENDB dbname
The OPENDB command has the following argument:
RemarksIf the file to be launched is in Chem-BioFinder’s standard search path, only the actual file name (CS_DATA) is required. Oth-erwise, the complete file path (c:\some\long\path\CS_DATA.MDB) is neces-sary.
OPENDB exampleThis example uses the OPENDB command to assign a new data source to the current form.OPENDB c:\data\mydb.mdb
Variable commandsSETVAL [v] textREADVAL [v] filenameWRITEVAL [v] filenameINPUT [v] [prompt]PASSWORD [v] [default]GETDATA [v] boxPUTDATA box textFROM_CANON [str]| CLIPBOARDTO_CANON [v]| CLIPBOARDFROM_SMILES [str] TO_SMILES [v] APPEND ON|OFFAPPENDVAL [v] [text]INCREMENT [v]DECREMENT [v]LET v v op vSUBSTR [v] <str> <from> [<to>]
CAL has nine variables called V1, V2, ..., V9. These are temporary storage locations you can use to move information between form boxes and other data sources.Variable names can be substituted in any CAL command. Any item shown in italics in a com-mand description may be replaced by the name of a variable, prefixed with a dollar sign. For example:MSG message may be either:
MSG "An explicit message"—a message explicitly coded into the script—or
MSG $V2—a message taken from variable 2 at run time
Command Action
CRETABLE MyTable
creates a new table
DELTABLE MyTable
deletes a new table
Part Description
dbname String containing the file name of a database, which could be a *MDB file or a name from the ODBC Data Sources list.

528 CAL CommandsAppendix E
You may concatenate variables, and variables and literals together in CAL commands. You must add both a leading and trailing dollar sign to the variable name.For example:MSG$V2$$V1$
Displays a message box with the value of V2 immediately followed by the value of V1.Most commands for manipulating variables take an optional variable number as the first argument. If the number is omitted, it is assumed to be 1.SETVAL puts the specified text into a variable. READVAL reads the contents of a text file into a variable. WRITEVAL copies the contents of a variable to a file.INPUT displays a text input dialog, accepts data from the user and stores it in a variable. An optional prompt string is displayed in the box when it appears.PASSWORD is the same as INPUT, but dis-plays all characters as asterisks.GETDATA retrieves the contents of a form box (as long as it is not a structure) into a variable; see above for how to identify a box. PUT-DATA copies specified text into a form box. Form names are case-sensitive. Be sure to use the same case as the form box name into which you want to store data.TO_CANON retrieves the contents of the cur-rent structure as a canonical string (or puts the canonical string on the clipboard). FROM_CANON generates a structure from the canonical string.TO_SMILES retrieves the contents of the cur-rent structure as a smiles string. FROM_SMILES generates a structure from a smiles string
APPEND determines whether data in a storage location is kept if other data is being moved there. This setting is also consulted when you do a File Export to SD or delimited text file. APPEND ON causes any subsequent data movements to append new data to old; APPEND OFF causes old data to be overwrit-ten. This applies to all variable commands except PUTDATA. The default at program startup is APPEND OFF.APPENDVAL is a shortcut designed to make it easier to build string values. It is the same as setting APPEND ON, doing a SETVAL, and then restoring APPEND to its original state.
TIP: The difference between APPEND ON and APPENDVAL is that APPENDVAL does not add a carriage return to the string being appended, whereas APPEND ON does. If you want to insert a carriage return at the end of the string, use APPEND ON.
INCREMENT adds 1 to the value of a vari-able. Use INCREMENT in loops. DECREMENT subtracts 1 from the value of a variable. Use DECREMENT in loops.LET allows you to perform mathematical oper-ations on variables that contain integer or real-number values. Only one operator per line is supported. It recognizes the following opera-tors:
• + for addition• - for subtraction• * for multiplication• / for division
SUBSTR extracts a substring from a variable. The extracted substring extends from a speci-

ChemBioFinder & BioViz 529User Guide
fied character to the end of the string, or from one specified character to another.
The table below shows examples of Variable Commands
Command Action
SETVAL "some text"
store text in V1
SETVAL 2 "other text"
store text in V2
READVAL 9 tmpdata.txt
read text from file into V9
APPEND ON turn on append mode
WRITEVAL output.txt
append contents of V1 to file
SETVAL 2 "append me"
append text to contents of V2
APPEND OFF turn off append mode
INPUT 2 "enter new data"
prompt and get user input to V2
GETDATA 3 molname
copy data from molname box to V3
PUTDATA mol-name ″ben-zene″
store given string in molname box
LET 3 $V1 + $V4
sets V3 equal to the value stored in V1 plus the value stored in V4
SUBSTR 2 abcdef 3 5
stores cde in V2
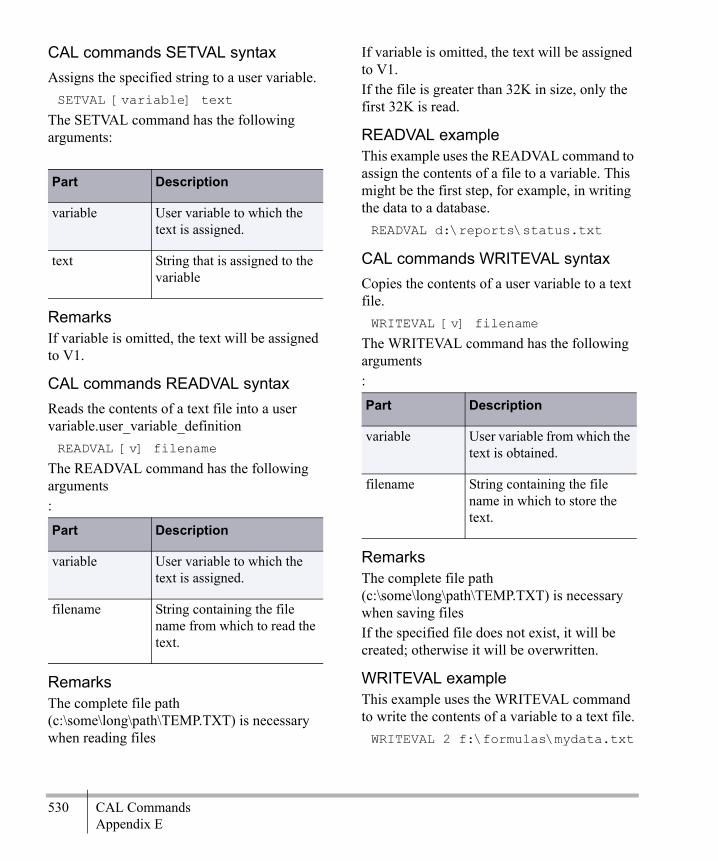
530 CAL CommandsAppendix E
CAL commands SETVAL syntaxAssigns the specified string to a user variable.SETVAL [variable] text
The SETVAL command has the following arguments:
RemarksIf variable is omitted, the text will be assigned to V1.
CAL commands READVAL syntaxReads the contents of a text file into a user variable.user_variable_definitionREADVAL [v] filename
The READVAL command has the following arguments:
RemarksThe complete file path (c:\some\long\path\TEMP.TXT) is necessary when reading files
If variable is omitted, the text will be assigned to V1.If the file is greater than 32K in size, only the first 32K is read.
READVAL exampleThis example uses the READVAL command to assign the contents of a file to a variable. This might be the first step, for example, in writing the data to a database.READVAL d:\reports\status.txt
CAL commands WRITEVAL syntaxCopies the contents of a user variable to a text file.WRITEVAL [v] filename
The WRITEVAL command has the following arguments:
RemarksThe complete file path (c:\some\long\path\TEMP.TXT) is necessary when saving filesIf the specified file does not exist, it will be created; otherwise it will be overwritten.
WRITEVAL exampleThis example uses the WRITEVAL command to write the contents of a variable to a text file.WRITEVAL 2 f:\formulas\mydata.txt
Part Description
variable User variable to which the text is assigned.
text String that is assigned to the variable
Part Description
variable User variable to which the text is assigned.
filename String containing the file name from which to read the text.
Part Description
variable User variable from which the text is obtained.
filename String containing the file name in which to store the text.
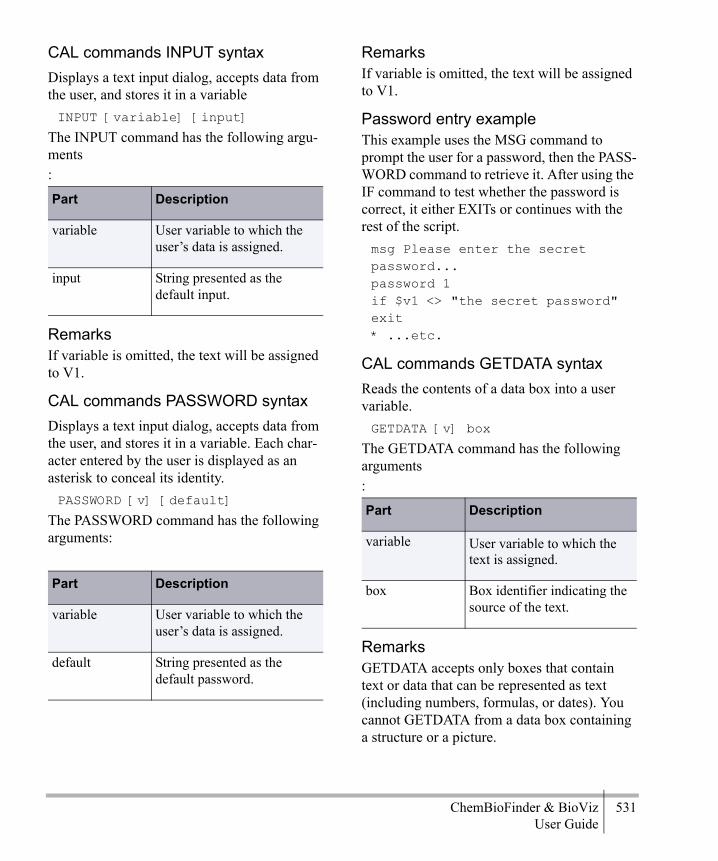
ChemBioFinder & BioViz 531User Guide
CAL commands INPUT syntaxDisplays a text input dialog, accepts data from the user, and stores it in a variableINPUT [variable] [input]
The INPUT command has the following argu-ments:
RemarksIf variable is omitted, the text will be assigned to V1.
CAL commands PASSWORD syntaxDisplays a text input dialog, accepts data from the user, and stores it in a variable. Each char-acter entered by the user is displayed as an asterisk to conceal its identity.PASSWORD [v] [default]
The PASSWORD command has the following arguments:
RemarksIf variable is omitted, the text will be assigned to V1.
Password entry exampleThis example uses the MSG command to prompt the user for a password, then the PASS-WORD command to retrieve it. After using the IF command to test whether the password is correct, it either EXITs or continues with the rest of the script.msg Please enter the secret password...password 1if $v1 <> "the secret password" exit* ...etc.
CAL commands GETDATA syntaxReads the contents of a data box into a user variable.GETDATA [v] box
The GETDATA command has the following arguments:
RemarksGETDATA accepts only boxes that contain text or data that can be represented as text (including numbers, formulas, or dates). You cannot GETDATA from a data box containing a structure or a picture.
Part Description
variable User variable to which the user’s data is assigned.
input String presented as the default input.
Part Description
variable User variable to which the user’s data is assigned.
default String presented as the default password.
Part Description
variable User variable to which the text is assigned.
box Box identifier indicating the source of the text.
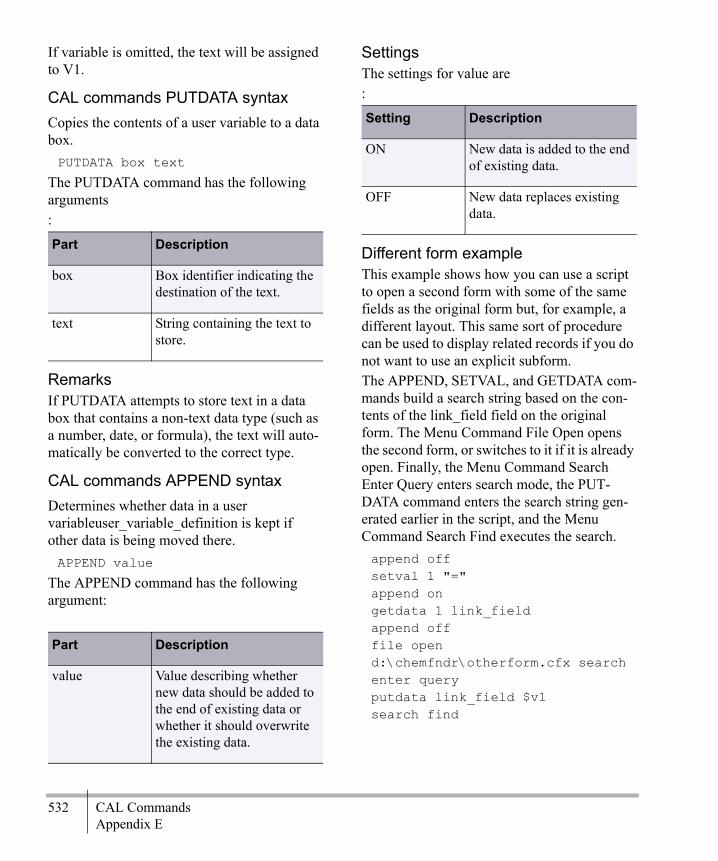
532 CAL CommandsAppendix E
If variable is omitted, the text will be assigned to V1.
CAL commands PUTDATA syntaxCopies the contents of a user variable to a data box.PUTDATA box text
The PUTDATA command has the following arguments:
RemarksIf PUTDATA attempts to store text in a data box that contains a non-text data type (such as a number, date, or formula), the text will auto-matically be converted to the correct type.
CAL commands APPEND syntaxDetermines whether data in a user variableuser_variable_definition is kept if other data is being moved there.APPEND value
The APPEND command has the following argument:
SettingsThe settings for value are:
Different form exampleThis example shows how you can use a script to open a second form with some of the same fields as the original form but, for example, a different layout. This same sort of procedure can be used to display related records if you do not want to use an explicit subform.The APPEND, SETVAL, and GETDATA com-mands build a search string based on the con-tents of the link_field field on the original form. The Menu Command File Open opens the second form, or switches to it if it is already open. Finally, the Menu Command Search Enter Query enters search mode, the PUT-DATA command enters the search string gen-erated earlier in the script, and the Menu Command Search Find executes the search. append offsetval 1 "="append ongetdata 1 link_fieldappend offfile open d:\chemfndr\otherform.cfx search enter queryputdata link_field $v1search find
Part Description
box Box identifier indicating the destination of the text.
text String containing the text to store.
Part Description
value Value describing whether new data should be added to the end of existing data or whether it should overwrite the existing data.
Setting Description
ON New data is added to the end of existing data.
OFF New data replaces existing data.
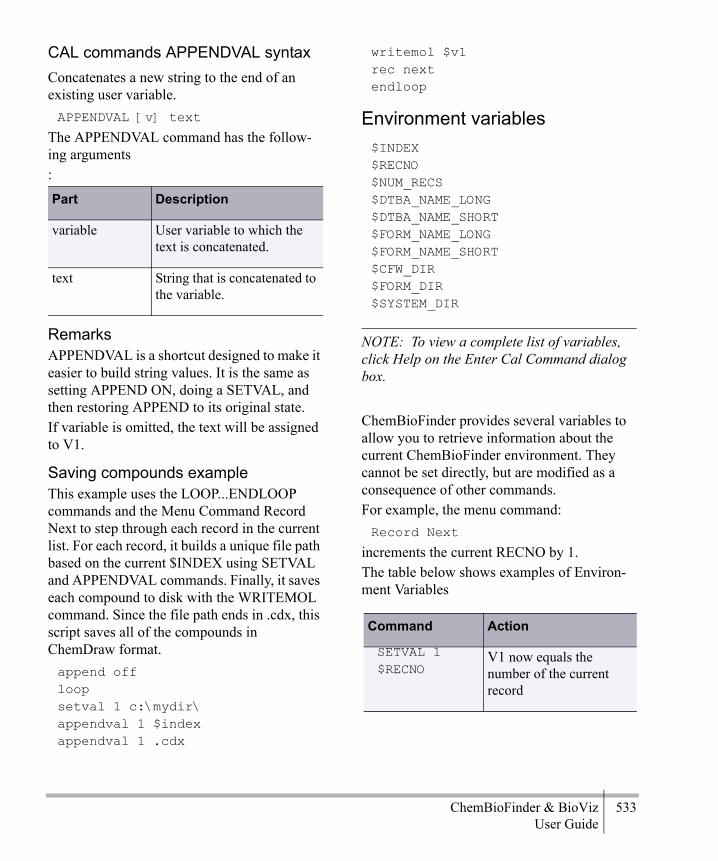
ChemBioFinder & BioViz 533User Guide
CAL commands APPENDVAL syntaxConcatenates a new string to the end of an existing user variable.APPENDVAL [v] text
The APPENDVAL command has the follow-ing arguments:
RemarksAPPENDVAL is a shortcut designed to make it easier to build string values. It is the same as setting APPEND ON, doing a SETVAL, and then restoring APPEND to its original state.If variable is omitted, the text will be assigned to V1.
Saving compounds exampleThis example uses the LOOP...ENDLOOP commands and the Menu Command Record Next to step through each record in the current list. For each record, it builds a unique file path based on the current $INDEX using SETVAL and APPENDVAL commands. Finally, it saves each compound to disk with the WRITEMOL command. Since the file path ends in .cdx, this script saves all of the compounds in ChemDraw format.append offloopsetval 1 c:\mydir\appendval 1 $indexappendval 1 .cdx
writemol $v1rec nextendloop
Environment variables$INDEX$RECNO$NUM_RECS$DTBA_NAME_LONG$DTBA_NAME_SHORT$FORM_NAME_LONG$FORM_NAME_SHORT$CFW_DIR$FORM_DIR$SYSTEM_DIR
NOTE: To view a complete list of variables, click Help on the Enter Cal Command dialog box.
ChemBioFinder provides several variables to allow you to retrieve information about the current ChemBioFinder environment. They cannot be set directly, but are modified as a consequence of other commands. For example, the menu command:Record Next
increments the current RECNO by 1.The table below shows examples of Environ-ment Variables:
Part Description
variable User variable to which the text is concatenated.
text String that is concatenated to the variable.
Command Action
SETVAL 1 $RECNO
V1 now equals the number of the current record

534 CAL CommandsAppendix E
Script-only commands*text:labellabel:GOTO labelIF v1 op v2 stmtIF v1 op v2
<stmt(s)>[ELSE
<stmt(s)>]ENDIFLOOP [count]ENDLOOPPAUSE [dseconds]EXITINTERACTIVE ON/OFFSTEP ON/OFF
Script-only commands are useful only in script files, not interactive CAL.An asterisk (*) is used to mark a line as a com-ment and not a command that should be exe-cuted.
Labels and GOTO give a mechanism for jump-ing backwards or forwards in a script. A label may be any text string starting or ending with a colon. It may appear anywhere in the script. (Prior to ChemOffice 2005, it had to appear prior to any GOTO that referenced it.)IF is a standard conditional statement. It com-pares two values according to an operator, and then executes its final statement if the result is true. In the IF/ELSE format, it executes the ELSE statement when the IF statement is false. Valid operators are:
LOOP begins a section of code that will exe-cute repeatedly, until ENDLOOP is reached. By default, the number of times the code exe-cutes is equal to the number of records in the current list, but you can provide a specific count in the LOOP statement.
TIP: ENDLOOP can be used anywhere within a loop clause to mean “continue to the next iteration”. Example:LOOPRECORD NEXT IF $HAS_MOL = 0ENDLOOPENDIFCLEANENDLOOPIn this example, if a record has no structure, the program goes to the next record and skips the CLEAN.
PAUSE temporarily stops the script from exe-cuting for a specified number of tenths of a
SETVAL V1 $NUM_RECS
V1 now equals total number of records in the current list
SETVAL V1 $DTBA_NAME_LONG
V1 now equals, for example “c:\Chem-BioFinder\mydb.mdb”
SETVAL V1 $FORM_NAME_SHORT
V1 now equals, for example “mydb”
SETVAL V1 $SYSTEM_DIR
V1 now equals, for example, “c:\chem-fndr\system”
Command Action
Table 32:
= < > < >

ChemBioFinder & BioViz 535User Guide
second. If no number is given, the duration of the pause is 2 seconds.EXIT ends the script immediately.INTERACTIVE turns interactive mode on or off.STEP toggles single-step (debugging) mode on and off.The table below shows examples of Script-Only Command.
NOTE: Script commands are subject to change. See the Readme for up-to-date infor-mation.
CAL commands * syntaxMarks a line as a comment, and not a com-mand to be executed.
*[text]
The * command has the following argument
RemarksThe * character must be the first character in a line to mark it as a comment.This command is useful only in a script file, and has no effect when entered on the Com-mand Line.command_line_definition
CAL commands: syntaxLabels a line with the preceding or following text.:label or label:The **command has the following argument:
RemarksThis command is useful only in a script file, and has no effect when entered on the Com-mand Line.
CAL commands GOTO syntaxUnconditionally transfers execution to a speci-fied line in the current script.GOTO label
The GOTO command has the following argu-ment
Command Action
start: a label
IF $V1 = "" MSG Empty value!
provide an error message if the variable V1 is empty
PAUSE 100 pause 10 seconds
GOTO start go to specified label
LOOP 10 begin loop to repeat ten times
PAUSE pause the default time: 2 seconds
ENDLOOP return to LOOP statement until done
Part Description
text String containing the comment.
Part Description
label Text to be used as a label.
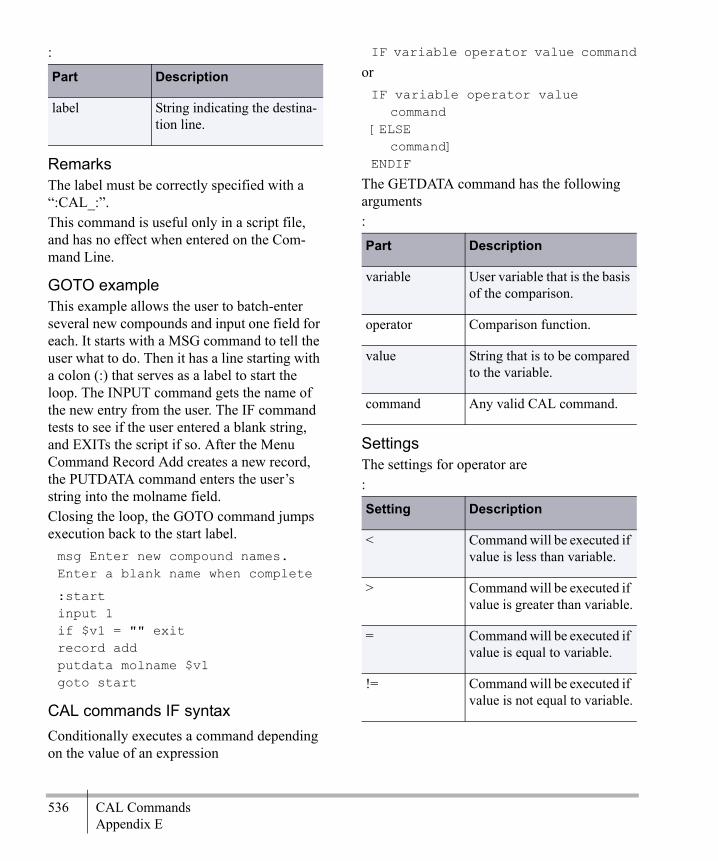
536 CAL CommandsAppendix E
:
RemarksThe label must be correctly specified with a “:CAL_:”. This command is useful only in a script file, and has no effect when entered on the Com-mand Line.
GOTO exampleThis example allows the user to batch-enter several new compounds and input one field for each. It starts with a MSG command to tell the user what to do. Then it has a line starting with a colon (:) that serves as a label to start the loop. The INPUT command gets the name of the new entry from the user. The IF command tests to see if the user entered a blank string, and EXITs the script if so. After the Menu Command Record Add creates a new record, the PUTDATA command enters the user’s string into the molname field. Closing the loop, the GOTO command jumps execution back to the start label.msg Enter new compound names. Enter a blank name when complete
:startinput 1if $v1 = "" exitrecord addputdata molname $v1goto start
CAL commands IF syntaxConditionally executes a command depending on the value of an expression
IF variable operator value command
orIF variable operator value
command[ELSE
command]ENDIF
The GETDATA command has the following arguments:
SettingsThe settings for operator are:
Part Description
label String indicating the destina-tion line.
Part Description
variable User variable that is the basis of the comparison.
operator Comparison function.
value String that is to be compared to the variable.
command Any valid CAL command.
Setting Description
< Command will be executed if value is less than variable.
> Command will be executed if value is greater than variable.
= Command will be executed if value is equal to variable.
!= Command will be executed if value is not equal to variable.

ChemBioFinder & BioViz 537User Guide
RemarksOnly one CAL command may be executed by each IF statement. However, that one com-mand may be a GOTO that skips over many other commands.
CAL commands LOOP...ENDLOOP syntaxExecutes a block of statements repeatedly.LOOP [count][statements]ENDLOOP
The LOOP...ENDLOOP commands have the following arguments:
RemarksIf count is omitted, the statements will be repeated a number of times equal to the num-ber of records in the current list.This command is useful only in a script file, and has no effect when entered on the Com-mand Line.
LOOP exampleThis example uses the LOOP command and the Menu Command Record Next to display all of the records in the current list. The PAUSE command keeps each record on screen long enough for people to see it.looprec nextpause 2endloop
CAL commands PAUSE syntaxTemporarily stops the script from executing.PAUSE [decisecs]
The PAUSE command has the following argu-ment:
Remarks10 decisec = 1 second.If the decisecs argument is omitted, the script will be suspended for 2 seconds.
CAL commands EXIT syntaxImmediately halts execution of a CAL script.EXIT
RemarksThis command is useful only in a script file, and has no effect when entered on the Com-mand Line.
<> Command will be executed if value is not equal to variable.
Part Description
count Number of times the state-ments are to be repeated.
statements Commands that are repeated a number of times.
Setting Description
Part Description
decisecs Amount of time to suspend script execution.

538 CAL CommandsAppendix E

ChemBioFinder & BioViz 539User Guide
CS Oracle CartridgePre-setup proceduresPrerequisites for connecting Chem-BioFinder/Oracle to an Oracle database:
• ChemBioFinder Ultra• Oracle Client• Oracle OLEDB Provider
ChemBioFinder Ultra: We recommend Version 10.1 or newer.Oracle Client: We recommend version 9i or newer. This is available as a free download fromhttp://www.oracle.com/.
1.Download and install the Oracle Client soft-ware (version 9i). This is available free from Oracle. Note that there are different versions for 32 bit, 64 bit, and Itanium systems.
The minimum install alone (called “Runtime”) is not adequate to provide support for ChemBioFinder/Oracle. In addition, you must subsequently choose the “Custom” install, and select “Oracle Windows Interfaces.” If you do not have the requisite components installed, an attempt to open an Oracle database will generate the error: “Provider cannot be found. It may not be properly installed.”
2.Have the Oracle administrator install CS Oracle Cartridge (9 or 10). You can use
ChemBioFinder/Oracle to access any Oracle database, but one without the CS Oracle Cartridge cannot be used to store or search chemical structures.
3.Have the administrator set up a user account for you. ChemBioFinder/Oracle requires that you log in to a tablespace in which you have write privileges. For access to corporate files, the administrator needs to grant you read-only privileges to tables and views of interest outside your tablespace.
4.On your machine, use Oracle Net Configura-tion Assistant to establish a connection to each Oracle database you intend to use.
In principle, ChemBioFinder/Oracle can access any Oracle database and make sense of it. In practice, some preparations are recom-mended:
• You can access data in Oracle databases which do not have the CS Oracle Cartridge installed — for example, biological data-bases — but you cannot search or sort by structure or structure-related properties. ChemBioFinder/Oracle has been developed with CS Oracle Cartridge version 9 or 10, and is not likely to work with earlier ver-sions. (To display the Cartridge version, look in the Database tab of the Properties dialog. The version is listed, or “None” if unavailable.)
F

540 CS Oracle CartridgeAppendix F
• Any table containing structures should have a unique primary key. If you connect to a table without a unique primary key, you get a warning message. You can set up a pri-mary key in ChemBioFinder (see “Index-ing” on page 419.)
• ChemBioFinder/Oracle users must have sufficient privileges to create tables in their own tablespaces.
Fast-move caching schemeNormally, when you open a database or do a search, ChemBioFinder issues a select state-ment. The server then processes the statement, prepares a set of records, and provides a “cur-sor” for navigating through them to retrieve the data. Unfortunately, when the cursor is asked to move to a position N records from the cur-rent one, it requires all N to be downloaded to the client. In the worst case, you open a large table and use Move Last to see the last record, and the entire table is sent down from the server.To get around this problem, an alternative mechanism is available in Chem-BioFinder/Oracle. In this scheme, instead of requesting complete forms-full of data over a list or query, ChemBioFinder/Oracle retrieves only the ID or primary key field, and stores (“caches”) the results in an array in memory. It then need not rely on the normal recordset cur-sor. When a request is made to move to record N, the key for that record is looked up in the array, and a new select statement is issued to retrieve only the corresponding record. Thus, Move Last takes no more time than Move Next.There are tradeoffs between the two schemes:
• The new scheme takes time to retrieve the set of ID's during a database open, or after a search or sort. Normally, this is quite fast
even for a large table, and steps are taken to avoid repeating the operation unless neces-sary. A message on the status bar indicates when this caching process is taking place.
• In the new scheme, moving from one record to the next is somewhat slower, since each move involves a (fast, one-hit) search. This is not very noticeable during list browsing, but slows down multi-retrieve operations such as filling table view.
Because of these drawbacks, the new caching scheme is OFF, by default. To turn it ON for an Oracle-connected form:
1.Click the File>Database menu command, or otherwise bring up the Properties dialog.
2.Go to the Oracle tab of the dialog. 3.Check the Cache ID's for faster moves box. 4.Click OK.
You will get an alert instructing you to: 5.Save the form, close it, and reopen it. This is
currently necessary in order to reinitialize the database connection with the caching scheme.
Configuring via CF_SETTINGS tableWhen you select a table in an Oracle database, ChemBioFinder determines and displays the types of columns in the table. Here’s how it decides whether a particular column contains structures:
• The column must be of type CLOB or BLOB. • If the column has been indexed by the CS
Oracle Cartridge, then it is a structure col-umn.
• If there is no index, then Chem-BioFinder/Oracle looks for a table of con-figuration info called CF_SETTINGS. If the
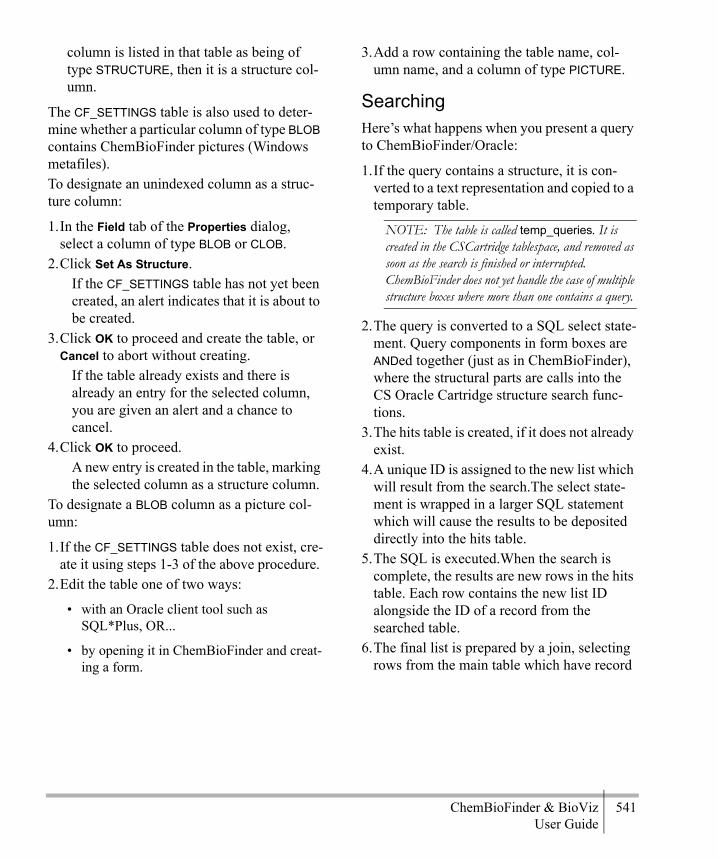
ChemBioFinder & BioViz 541User Guide
column is listed in that table as being of type STRUCTURE, then it is a structure col-umn.
The CF_SETTINGS table is also used to deter-mine whether a particular column of type BLOB contains ChemBioFinder pictures (Windows metafiles).To designate an unindexed column as a struc-ture column:
1.In the Field tab of the Properties dialog, select a column of type BLOB or CLOB.
2.Click Set As Structure. If the CF_SETTINGS table has not yet been created, an alert indicates that it is about to be created.
3.Click OK to proceed and create the table, or Cancel to abort without creating.
If the table already exists and there is already an entry for the selected column, you are given an alert and a chance to cancel.
4.Click OK to proceed. A new entry is created in the table, marking the selected column as a structure column.
To designate a BLOB column as a picture col-umn:
1.If the CF_SETTINGS table does not exist, cre-ate it using steps 1-3 of the above procedure.
2.Edit the table one of two ways:
• with an Oracle client tool such as SQL*Plus, OR...
• by opening it in ChemBioFinder and creat-ing a form.
3.Add a row containing the table name, col-umn name, and a column of type PICTURE.
SearchingHere’s what happens when you present a query to ChemBioFinder/Oracle:
1.If the query contains a structure, it is con-verted to a text representation and copied to a temporary table.
NOTE: The table is called temp_queries. It is created in the CSCartridge tablespace, and removed as soon as the search is finished or interrupted. ChemBioFinder does not yet handle the case of multiple structure boxes where more than one contains a query.
2.The query is converted to a SQL select state-ment. Query components in form boxes are ANDed together (just as in ChemBioFinder), where the structural parts are calls into the CS Oracle Cartridge structure search func-tions.
3.The hits table is created, if it does not already exist.
4.A unique ID is assigned to the new list which will result from the search.The select state-ment is wrapped in a larger SQL statement which will cause the results to be deposited directly into the hits table.
5.The SQL is executed.When the search is complete, the results are new rows in the hits table. Each row contains the new list ID alongside the ID of a record from the searched table.
6.The final list is prepared by a join, selecting rows from the main table which have record

542 CS Oracle CartridgeAppendix F
ID's matching those of the new list in the hits table.
The resulting list is ready to browse, save, export, etc.
NOTE: Text searches in Oracle are case sensi-tive. You will get different hits from the query “benz*” than from “Benz*.”

Chem & Bio Office 2010 User Guide 543
IndexSymbolsparentheses symbol 359query operators
parentheses 359(-CHR-) bending force parameters 227, in query 359.NET 271, 277.Surfaces
partial 37\, in query 369
Numerics1D plot 3042D plot 3062D programs, using with Chem3D 642D Structure Diagram Generation (SDG) and Cleanup 2712D Structure Generation and Cleanup 2742D to 3D conversion 1773D enhancement
depth fading 29hardware 32red-blue 29stereo pairs 32
3D properties 3633D searching 3633D structure display 3203DM file format 2114-Membered Ring Torsionals 217
AA (any), special atom type 483Ab initio methods
speed 237uses 238
About Python 271Access
attaching tables from 342manipulating MDB files 463multi-user 336read-only 336secured 337
Access database, opening 335accessing relational data using subforms 399Activating the select tool 48ActiveX control 475Actual field editing 101Actual field measurements 24ADD indicator 347ADD indicator, description 287ADD indicator, when displayed 289add new record command 347Adding
formal charges 67fragments 74parameters to CS MOPAC 260serial numbers, tutorial example 45to groups 107
addingbuttons 318checkboxes 317data 347data box menu 321fields 343menu to a data box 321pictures 317plain text 316records 289, 297, 347scroll bars 321structures 347tables 354, 403

Adm
inistrator
544 Index
adding multiple structures to forms 345adding structures to non-chemical databas-es 345ALC file format 207, 211Alchemy 180Alchemy file format 179, 211Alchemy, FORTRAN format 181Aligning
parallel to an axis 92parallel to plane 92to center 93
aligningobjects 326
aligning and distributing objects 326Allinger’s force field 256alternate groups
searching with 363alternative groups
attachment point symbol 365defining 364description 363
AM1, applicability and limitations 251anchored substring text queries 357AND operator, hit lists 384AND operator, queries 358, 359, 368Angle bending energy 244Angle bending force constant field 224Angle bending table 217, 224Angle defining atom 94Angle type field 224Angles and measurements 167annotations, showing 446Approximate Hamiltonians in CS MOPAC 250ASCII file, exporting 395Assigning atom types 175assigning fields to data boxes 296Atom 274
labels 30, 67
movement, when setting measurements 76pairs, creating 56pairs, setting 76replacing with a substructure 71size by control 27size% control 27spheres, hiding and showing 27type characteristics 175type field 225, 228type number 228type number field 218, 220
atomlists 385
atom lists 484atom not-lists 484atom properties 483Atom Types 111Atom types
assigning automatically 22creating 176table 220
atom typesA (any) 483and bond types 385link node 386M (metal) 483overview 385Q (heteroatom) 483X (halogen) 483
Atomic Weight field 229Atoms
aligning to plane 92coloring by element 28coloring by group 28coloring individually 30displaying element symbols 30displaying serial numbers 30moving 88moving to an axis 92positioned by three other atoms 94removing 66selecting 83
Chem & Bio Office 2010 User Guide 545
setting formal charges 77size 27
atoms 477atom-to-atom mapping 367attaching
files from a file-based database 342tables from other applications 342
attaching files from a non file-based data-base 342Attachment point rules 167attachment points
defining 365tool 365
automatic labels 316autoscale 307autoscale, see also rescaleAVI file formats 211
BBackground color 29Background effects 131backing-up databases 346Ball & stick display 26Basis sets 250Bending constants 227bin, definition 426Binding sites, highlighting 85BioViz
changing fields 434curve fitting 428description 285details window 424empty points 424filter sliders 432histogram plots 425selecting points 424setting display range 432statistical analysis 428
Bitmap file format 209bitscreen 495
BMP file format 209Bond 274
angles 22angles, setting 75dipole field 223length 22length, setting 75order matrix 261order, changing 73order, pi systems 248stretching energy 244stretching force constant field 223stretching parameters 222stretching table 218, 222tools, building with 65tools, tutorial example 41type field 222, 226, 232
bondlength, uniform 446types, overview 385
bond properties 487in queries 487ring/chain 487
bond typesdouble either 478in queries 477special 487
Bonds 186creating uncoordinated 65moving 88removing 66selecting 83
bonds 477BONDS keyword 261Books 277boolean field, fields
boolean 344boolean operations, in queries 358boolean operations, on hit lists 383Bound-to order 221Bound-to type 222
Adm
inistrator
546 Index
box creation commands, CAL 500box manipulation commands, CAL 505boxes
changing styles 319creating 315deleting 325font 322hiding or showing 322moving 325properties 318resizing 325selecting 324style 319
Break Bond command 73bring to front command 326browsing
databases 338browsing search results 469browsing with the record tool 338Btrieve 342Building
controls see Model building controlsmodes 63toolbar 14with bond tools 65with other 2D programs 64with substructures 69with substructures, examples 69, 71with the ChemDraw panel 64with the text building tool 67
Building models 20, 63from Cartesian or Z-Matrix tables 71order of attachment 68rings 68with bond tools 41with ChemDraw 49with the text building tool 46
buttons, creating 318
CC3DTABLE 219
CALbox creation commands 500box manipulation commands 505environment variables 533execute with button 318file commands 525general commands 511help 454, 497menu commands 497overview 453program execution commands 508script-only commands 534variable commands 527
CAL syntaxACTIVATE 507APPEND 532APPENDVAL 533BUTTON 504CALL 509CLEAN 525DBOX 501DDE 510DELBOX 506DOS 510ENDLOOP 537EXEC 510EXIT 537FONT 512FORMEDIT 507FRAME 502GETDATA 531GOTO 535HELP 525IF 536INPUT 531LOOP 537MENU 497MSG 512OPENDB 527PASSWORD 531PAUSE 537PICT 503PUTDATA 532
Chem & Bio Office 2010 User Guide 547
QUIETCLOSE 513READVAL 530SEEPTAB 513SELECT 508SET 514SETFIELD 506SETTEXT 506SETVAL 530SUBFM 504TEXT 502UNSELECT 508WRITEVAL 530
Calculating the dipole moment of meta-ni-trotoluene 160Calculation toolbar 16Cambridge Crystal Data Bank files 184Canonical Codes 271, 274, 276Canonical codes 271Cart Coords 1 see Cartesian coordinate file formatCart Coords 2 see Cartesian coordinate file formatCartesian coordinate 23, 211
atom movement on import 165displaying 104file format 181, 211FORTRAN file format 183positioning 92
CC1 file format 207, 211CC1 see Cartesian coordinate file formatCC2 file format 207, 211CC2 see Cartesian coordinate file formatCCD see Cambridge Crystal Data Bank file formatCCITT Group 3 and 4 210CDX file format 207Centering a selection 93CF$_SORT table 416CFS file format 462CFX file format 313
chain bonds 487Changing
atom to another element 72bond order 73elements 67stereochemistry 78Z-matrix 94
changingbox style 319database scheme 354layout of an existing subform 401
changing colors 433changing the display 433Charge field 220Charge property 154Charge, adding formal 67Charge-Charge contribution 247Charge-Dipole interaction term 257Charges 153charges and radicals 479Charges, adding 70Charges, from an electrostatic potential 154charges, in queries 479check valences 447checkboxes 317Chem3D
changes to Allinger’s force field 256viewing models 351
ChemDrawediting structures 350transferring models to 129
ChemDraw ActiveX control 475ChemDraw format, viewing in 319ChemDraw panel 64ChemFinder
opening options 447toolbars 288UI 285
ChemFinder/Officecustomizing 474
Adm
inistrator
548 Index
look In tab 465overview 465preferences 475search options tab 473send to menu 471settings 474UI 465
ChemScript API 274, 275ChemScript Help 273ChemScript library
loading 273ChemScript Object Classes 274Choosing a Hamiltonian 250Choosing the best method see Computa-tional methodsCI, microstates used 261CIS 261cleaning structures 350Cleaning up a model 80clearing forms 347, 373Clipboard
exporting with 129Clipboard, importing with 64Close Contacts command 220Closed shell system 263CMYK Contiguous 210Color
applying to individual atoms 30background 29by element 28by group 28by partial charge 28displays 28field 219settings 28
colorpreferences 446
color, setting 323Coloring groups 108Coloring the background window 29
CombiChem 491engine 491
combined searches see searching, com-binedcombined searches, see searching, com-binedCommands
close contacts 220compute properties 125, 151import file 9
commandsadd new record 347bring to front 326commit changes 348, 350, 351current Record 289current record 285data source 333, 342delete record 353enter query 373Find 373find current molecule 375Find List 360find text 344first record 338go to record 338Intersect with current list 384last record 338next record 338previous record 338read structure 392redo 353replace current list 383restore list 383save list 383Save Structure 394search over list 303send to back 326undo changes 349
commit changes command 348, 350, 351committing changes vs. saving 313committing new data 348Common scaffold orientation 271

Chem & Bio Office 2010 User Guide 549
communicating with other applications us-ing DDE 461communicating with other applications us-ing OLE automation 462communicating with other applications us-ing scripts 461commutative principle 495Comparing
cation stabilities in a homologous series of molecules 158
the stability of glycine zwitterion in water and gas phase 161
two stable conformations of cyclohexane 119complete structure similarity, see Tanimoto similaritycompound profiles 405
creating 406customizing 411display preferences 409dist 410editing 408score 406search/sort 410
Compression 210Computational chemistry, definition 235Computational methods
choosing the best method 236defined 235limitations 236model size 237overview 235parameter availability 237potential energy surfaces 236RAM 237uses of 236
Compute PropertiesCS MOPAC 151MM2 125
Compute Properties command 125, 151Computing Canonical Codes 276Computing partial charges 60
Computing properties for a movie 54CON file format 212concurrent access 336Conformations, examining 49Conformations, searching 54Conjugated pi-system bonds table 217Connected 272Connection table file format 212connection table file format 389Connection tables 212Connolly molecular surface 38
displaying 38overview 38
Constraining movement 88Constraints, setting 77Context menus, saving and closing 8controls, embedding 452Copy As ChemDraw Structure command 129Copy command 129Copying to other applications 129COSMO solvation 155counterions 351Counting Atoms 273Covalent radius field 219Create a list of CDXML files 275Create an SD file 275create database button 341create table dialog box 341Creating
atom pairs 56atom types 176CS MOPAC input files 164groups 107parameters 219structures from ARC files 165substructures 167uncoordinated bonds 65
creating
Adm
inistrator
550 Index
and editing tabs 318boxes 315boxes with frames 316button 318data box menu 321data boxes 294, 315databases 335, 341fields 343forms 313forms automatically 311forms with the database tree 313forms, manually 313forms, tutorial 293frames 315multiple tables 354, 403picture boxes 317portal databases 346scripts 454subforms 310, 399, 400tables 341tabs 318text 316
creating a database, tutorial 296creating a plot 304, 425creating and editing forms 311creating and saving forms 295CS GAMESS
general tab 134minimize energy command 133overview 133specifying methods 134
CS MOPAC 195background 259compute properties command 151create input file command 164file formats 214FORTRAN format 197general tab 149graph file format 215Hamiltonians 250history 259Hyperfine Coupling Constants 148
keywords sent automatically 260methods, choosing 250minimizing energy 147minimum RMS gradient 148molecular surface types available 34optimize to transition state 149OUT file 164parameters, editing 260properties 152references 259repeating jobs 165RHF 148running input files 165specifying electronic state 261specifying keywords 149, 260UHF 148
CT file format 207, 212CUB file format 212Cubic and quartic stretch constants 226current list
counter 289description 285size 289
current mol, as query command 375current record command 285, 289curve fitting, see BioVizcustomizing
ChemFinder 445favorites tree 449fonts 322numbers 323text 322toolbars 450
customizing fonts 322Cutoff distances 228Cutoff parameters, electrostatic interac-tions 247Cutoff parameters, for van der Waals inter-actions 246Cylindrical bonds display 26
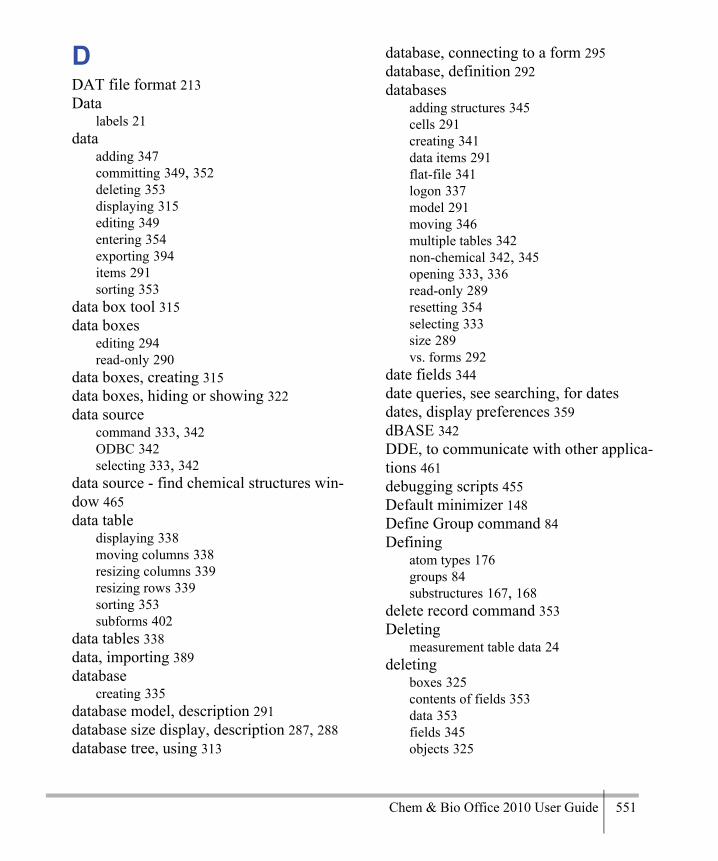
Chem & Bio Office 2010 User Guide 551
DDAT file format 213Data
labels 21data
adding 347committing 349, 352deleting 353displaying 315editing 349entering 354exporting 394items 291sorting 353
data box tool 315data boxes
editing 294read-only 290
data boxes, creating 315data boxes, hiding or showing 322data source
command 333, 342ODBC 342selecting 333, 342
data source - find chemical structures win-dow 465data table
displaying 338moving columns 338resizing columns 339resizing rows 339sorting 353subforms 402
data tables 338data, importing 389database
creating 335database model, description 291database size display, description 287, 288database tree, using 313
database, connecting to a form 295database, definition 292databases
adding structures 345cells 291creating 341data items 291flat-file 341logon 337model 291moving 346multiple tables 342non-chemical 342, 345opening 333, 336read-only 289resetting 354selecting 333size 289vs. forms 292
date fields 344date queries, see searching, for datesdates, display preferences 359dBASE 342DDE, to communicate with other applica-tions 461debugging scripts 455Default minimizer 148Define Group command 84Defining
atom types 176groups 84substructures 167, 168
delete record command 353Deleting
measurement table data 24deleting
boxes 325contents of fields 353data 353fields 345objects 325
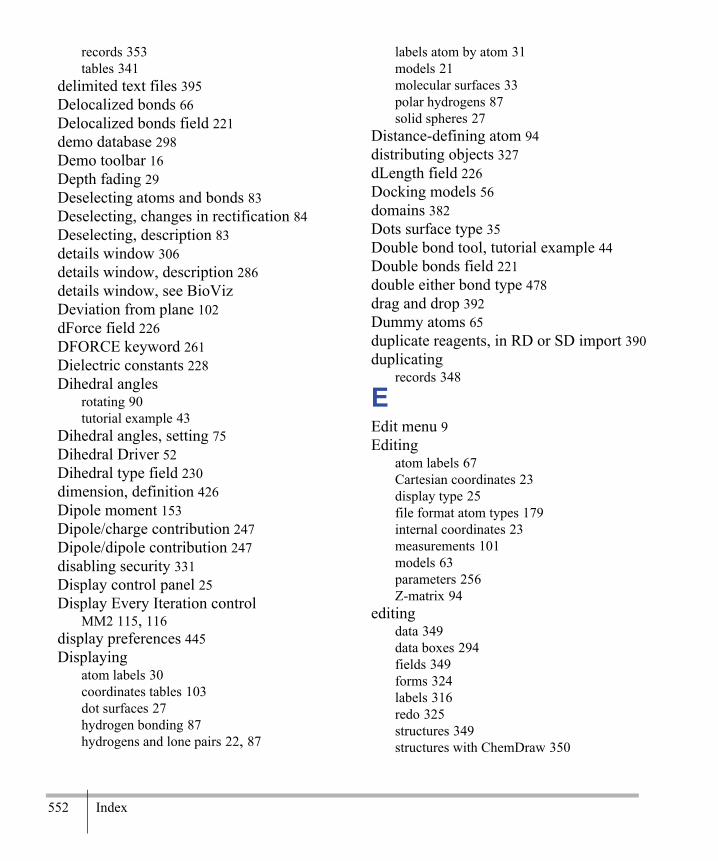
Adm
inistrator
552 Index
records 353tables 341
delimited text files 395Delocalized bonds 66Delocalized bonds field 221demo database 298Demo toolbar 16Depth fading 29Deselecting atoms and bonds 83Deselecting, changes in rectification 84Deselecting, description 83details window 306details window, description 286details window, see BioVizDeviation from plane 102dForce field 226DFORCE keyword 261Dielectric constants 228Dihedral angles
rotating 90tutorial example 43
Dihedral angles, setting 75Dihedral Driver 52Dihedral type field 230dimension, definition 426Dipole moment 153Dipole/charge contribution 247Dipole/dipole contribution 247disabling security 331Display control panel 25Display Every Iteration control
MM2 115, 116display preferences 445Displaying
atom labels 30coordinates tables 103dot surfaces 27hydrogen bonding 87hydrogens and lone pairs 22, 87
labels atom by atom 31models 21molecular surfaces 33polar hydrogens 87solid spheres 27
Distance-defining atom 94distributing objects 327dLength field 226Docking models 56domains 382Dots surface type 35Double bond tool, tutorial example 44Double bonds field 221double either bond type 478drag and drop 392Dummy atoms 65duplicate reagents, in RD or SD import 390duplicating
records 348
EEdit menu 9Editing
atom labels 67Cartesian coordinates 23display type 25file format atom types 179internal coordinates 23measurements 101models 63parameters 256Z-matrix 94
editingdata 349data boxes 294fields 349forms 324labels 316redo 325structures 349structures with ChemDraw 350
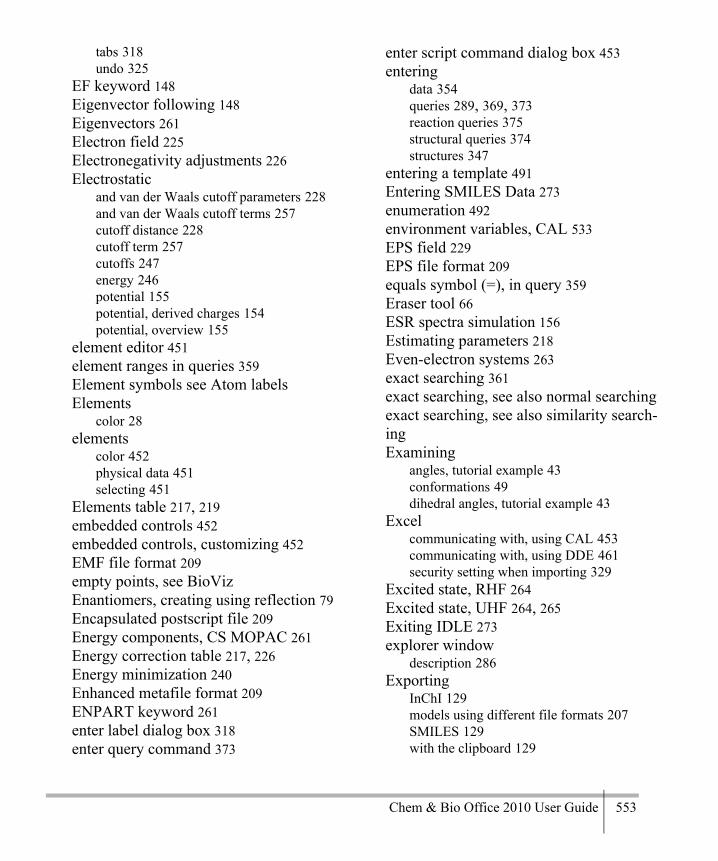
Chem & Bio Office 2010 User Guide 553
tabs 318undo 325
EF keyword 148Eigenvector following 148Eigenvectors 261Electron field 225Electronegativity adjustments 226Electrostatic
and van der Waals cutoff parameters 228and van der Waals cutoff terms 257cutoff distance 228cutoff term 257cutoffs 247energy 246potential 155potential, derived charges 154potential, overview 155
element editor 451element ranges in queries 359Element symbols see Atom labelsElements
color 28elements
color 452physical data 451selecting 451
Elements table 217, 219embedded controls 452embedded controls, customizing 452EMF file format 209empty points, see BioVizEnantiomers, creating using reflection 79Encapsulated postscript file 209Energy components, CS MOPAC 261Energy correction table 217, 226Energy minimization 240Enhanced metafile format 209ENPART keyword 261enter label dialog box 318enter query command 373
enter script command dialog box 453entering
data 354queries 289, 369, 373reaction queries 375structural queries 374structures 347
entering a template 491Entering SMILES Data 273enumeration 492environment variables, CAL 533EPS field 229EPS file format 209equals symbol (=), in query 359Eraser tool 66ESR spectra simulation 156Estimating parameters 218Even-electron systems 263exact searching 361exact searching, see also normal searchingexact searching, see also similarity search-ingExamining
angles, tutorial example 43conformations 49dihedral angles, tutorial example 43
Excelcommunicating with, using CAL 453communicating with, using DDE 461security setting when importing 329
Excited state, RHF 264Excited state, UHF 264, 265Exiting IDLE 273explorer window
description 286Exporting
InChI 129models using different file formats 207SMILES 129with the clipboard 129
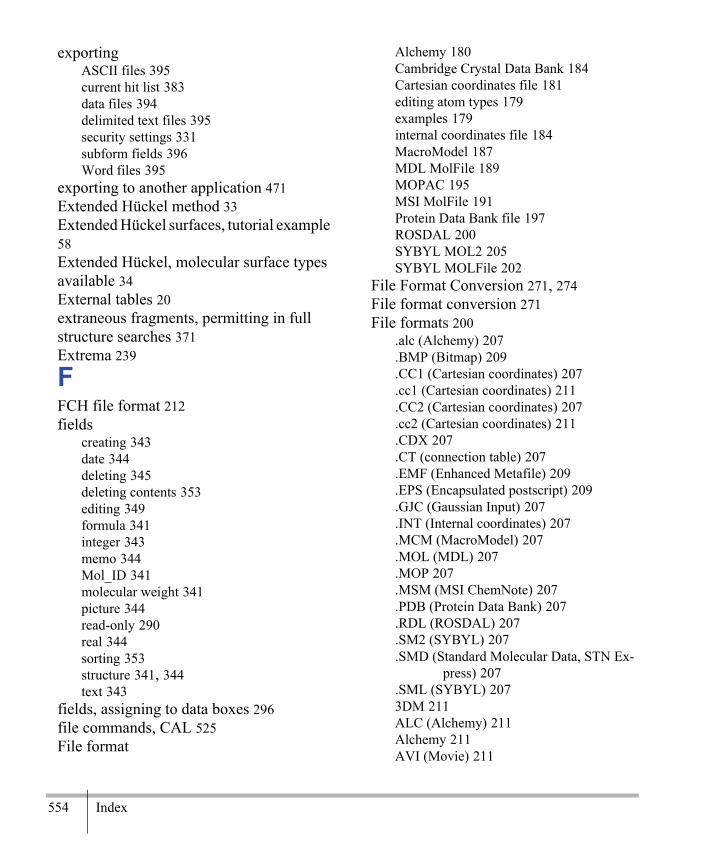
Adm
inistrator
554 Index
exportingASCII files 395current hit list 383data files 394delimited text files 395security settings 331subform fields 396Word files 395
exporting to another application 471Extended Hückel method 33Extended Hückel surfaces, tutorial example 58Extended Hückel, molecular surface types available 34External tables 20extraneous fragments, permitting in full structure searches 371Extrema 239
FFCH file format 212fields
creating 343date 344deleting 345deleting contents 353editing 349formula 341integer 343memo 344Mol_ID 341molecular weight 341picture 344read-only 290real 344sorting 353structure 341, 344text 343
fields, assigning to data boxes 296file commands, CAL 525File format
Alchemy 180Cambridge Crystal Data Bank 184Cartesian coordinates file 181editing atom types 179examples 179internal coordinates file 184MacroModel 187MDL MolFile 189MOPAC 195MSI MolFile 191Protein Data Bank file 197ROSDAL 200SYBYL MOL2 205SYBYL MOLFile 202
File Format Conversion 271, 274File format conversion 271File formats 200
.alc (Alchemy) 207
.BMP (Bitmap) 209
.CC1 (Cartesian coordinates) 207
.cc1 (Cartesian coordinates) 211
.CC2 (Cartesian coordinates) 207
.cc2 (Cartesian coordinates) 211
.CDX 207
.CT (connection table) 207
.EMF (Enhanced Metafile) 209
.EPS (Encapsulated postscript) 209
.GJC (Gaussian Input) 207
.INT (Internal coordinates) 207
.MCM (MacroModel) 207
.MOL (MDL) 207
.MOP 207
.MSM (MSI ChemNote) 207
.PDB (Protein Data Bank) 207
.RDL (ROSDAL) 207
.SM2 (SYBYL) 207
.SMD (Standard Molecular Data, STN Ex-press) 207
.SML (SYBYL) 2073DM 211ALC (Alchemy) 211Alchemy 211AVI (Movie) 211
Chem & Bio Office 2010 User Guide 555
Bitmap 209CON (connection table) 212CT (connection table) 212CUB (Gaussian Cube) 212DAT (MacroModel) 213FCH (Gaussian Checkpoint) 212Gaussian Input 212GIF (Graphics Interchange Format) 210GJC (Gaussian Input) 212GJF (Gaussian Input) 212GPT (CS MOPAC graph) 215INT (Internal coordinates) 212JDF (Job description file) 216JDT (Job Description Stationery) 216MCM (MacroModel) 213MOL (MDL) 213MOP (CS MOPAC) 214MPC (CS MOPAC) 214MSM (MSI ChemNote) 214PDB (Protein Data Bank) 215PNG 210Postscript 209QuickTime 211RDL (ROSDAL) 215SMD (Standard Molecular Data, STN Ex-
press) 215SML (SYBYL) 216TIFF 209ZMT (CS MOPAC) 214
file formatsMDL 482
file formats, supported 389File menu 9file-based databases, attaching tables 342files
DSD 470log 391SDF 470selecting with look in tab 466selecting with open file menu 466
Filter an SD file 275filter window 306
filter window, description 286filtering 430filters 307find command 373find current molecule command 375find list command 360find text command 344first record command 338fit to box 446fixed labels 315, 321flat-file databases 341fonts, customizing 322Force constant field 232Force Fields 111form
tool 314toolbar 315
form toolbar, description 286form, definition 292Formal charge, definition 60Formatting graphic files 208forms
adding multiple structures 345clearing 373creating automatically 311creating manually 313editing 324moving 346saving 313setting security 327vs. databases 292
forms, creating and saving 295formula field 341formula input rules 489formula searching see searchingformula, searching by 468formulas
input rules 489sorting 353
FORTRAN Formats 183, 187, 188, 191, 195,
Adm
inistrator
556 Index
197, 199, 204FoxPro 342Fragments
creating 74rotating 90selecting 85
fragmentsin full structure searches 371searching 362
Fragments, rotating 55Fragments, separating 55Frame interval control 121, 123frame tool 315framed box tool 316framed boxes 316framed boxes, creating 316framed boxes, description 286frames 315frames, creating 315framing pictures 446free sites, in queries 485Freehand rotation 90Fujitsu, Ltd. 259full structure searching 362full structure searching, see also substruc-ture searchingfull strucuture searching 362Functional Programming 272Functions and Algorithms 274
GG groups, see alternative groupsGaussian 137
about 5advanced mode 139checkpoint file format 212cube file format 212DFT methods 140file formats 212input template 139
molecular surface types available 34multi-step jobs 138optimization 138predicting spectra 137Unix, visualizing surfaces 40
Generaltab, CS GAMESS 135tab, GAMESS 135
generalproperties 477
general preferences 447General tab 149Generate properties 271generic groups, see alternative groupsgenerics, hitting in queries 371Geometry field 221Geometry optimization 240Geometry optimization, definition 236Getting Started 272Getting Started Guide 273GIF file format 210GIF, animated see Save As commandGJC file format 207, 212GJF file format 212Global minimum 239go to record command 338GPT file format 215Gradient norm 153Grid
density 36editing 36settings dialog 36
grid 314spacing 446tool 314
Ground state 263Ground state, RHF 264Ground state, UHF 263, 264Groups
colors 28

Chem & Bio Office 2010 User Guide 557
defining 84labeling, in proteins 31table 84
Guessing parameters 116, 218
HHardware stereo graphic enhancement 32headers, delimited text files 395Heat of formation, definition 153Heat of formation, DHF 152Heating/cooling rate control 121, 123help, CAL 454Hiding
atoms or groups 86serial numbers 77
hidingannotations 446data boxes 322
High Level 272Highest Occupied Molecular Orbital, over-view 39Highest Occupied Molecular Orbital, view-ing 58histogram plots 306, 425hit any charge on carbon 371hit any charge on heteroatom 371hit lists
boolean operations 383current 289intersecting 384joining 384merging 383replacing 383restoring 383saving 383saving as text files 383
HOMO see Highest Occupied Molecular OrbitalHooke's law equation 226Hotkeys
select tool 48How ChemScript works 272Human Readable Code 272hydrogens
in queries 478hydrogens, added to structures 351Hyperfine coupling constants 156Hyperfine coupling constants, example 162Hyperpolarizability 155Hyrogen bonding 87
IID queries 360identity searching, see exact searchingimplicit hydrogens 486
in queries 486on metals 447
implicit hydrogens, added to structures 351Import file command 9Importing
Cartesian coordinates files 165ISIS/Draw structures 64
importingdata 389duplicate reagents from RD or SD files 390from a specified location 391hit lists 383log files 391partial RD or SD files 390RDFiles 390SDFiles 390security settings 331structure data and reaction data files 390structures 390structures only, from RD and SD files 390text files 393
importing and exporting data 389–396InChI™ strings, exporting 129inequality symbols (), in query 359Int Coords see Internal coordinates fileINT file format 207, 212

Adm
inistrator
558 Index
INT see Internal coordinates fileinteger fields 343intermediates, in queries 368Internal coordinates 23
changing 94file 184file format 212FORTRAN file format 187
Internal coordinates file 184Internal rotations see Dihedral angles, ro-tatingInternal tables 20Intersect with current list command 384Introducing the ChemScript API 274Inverting a model 78Ionization field 225ISIS/Draw 64ISIS/Graphic files 389ISIS/Sketch files 389Isocharge 39Isopotential 39Isospin 39isotopes 479Iterations, recording 105
JJaguar
advanced mode 145computing properties 145minimizing energy 143optimize to transition state 144overview 143predicting IR spectra 144
JDF file format 216JDF Format 141JDT file format 216JDT Format 141Job description file format 140, 216Job description stationery file format 216Job Type tab
CS GAMESS 134
KKB field 224Kekule bonds 66Keyboard modifiers, table of 171, 172Keywords
BFGS 148BOND 261DFORCE 261EF 148ENPART 261LBFGS 149LET 150, 260LOCALIZE 261NOMM 261PI 261PRECISE 150, 260, 261RECALC 150, 260RMAX 260RMIN 260TS 148VECTORS 261
Keywords, automatic 260Keywords, MOPAC 260KS field 223
LLabels 178
using 67using for substructures 48using to create models 47
labelsediting 316fixed 315, 321fonts 322live 321
labels, formatting 290languages other than English, sorting 354last record command 338layout tool 314

Chem & Bio Office 2010 User Guide 559
Length field 223LET keyword 150, 260Limitations 191link node 386linking subforms to main forms 399live labels 321LN (link node), special atom type 386, 483Local minima 239LOCALIZE keyword 261Localized orbitals 261Locating the eclipsed transition state of ethane 150Locating the global minimum 120locking plots 426, 427log files 391logon, database 337Lone pairs field 229Lowest Unoccupied Molecular Orbital, overview 39Lowest Unoccupied Molecular Orbital, viewing 58LUMO see Lowest Unoccupied Molecular OrbitalMM (metal), special atom type 483MacroModel 187
FORTRAN format 188MacroModel file format 213main form, description 287main toolbar, description 287managing
queries 380mapping atoms in reaction queries 367Markush structures 351matching stereochemistry 372mathematical operators, in CAL commands 528Maximum Ring Size field 221
MCM file format 207, 213MDL file format 482MDL MolFile 189MDL MolFile format 213MDL MolFile, FORTRAN format 191MDL molfiles 389MDL rxnfiles 389Measurements
actual field 24deleting 102displaying graphically 31editing 101non-bonded distances 100, 101optimal field 24setting 75table 24, 49, 100
Measuring coplanarity 102memo fields 344menu bar, description 287menu commands, CAL 497menu, adding to data box 321Menus
edit 9file 9structure 12view 10
Minimizations, queuing 117Minimize Energy 133
CS MOPAC 147Minimize Energy command
CS GAMESS 134GAMESS 133MM2 116
Minimize Energy dialogCS GAMESS 134
Minimizer 148Minimizing, example 117Minimum RMS Gradient
CS MOPAC 148minus symbol (-), in query 359
Adm
inistrator
560 Index
MM2 111, 243applying constraints 24atom types table 217, 228bond orders 248compute properties command 125constants table 217, 226display every iteration control 115, 116editing parameters 255guessing parameters 116parameters 255properties tab 125references 255restrict movement of select atoms 116
MMFF94 112MNDO 251MNDO-d 252Model
data 99display 21display control panel 28display toolbar 10, 15see also Internal coordinates, Cartesian coor-
dinates, Z-Matrixsettings control panels 25settings, changing 25types 25
Model area 8Model building basics 20Model building controls, setting 63Model Explorer 22Model information panel see also Model Explorer, Measurements table, Cartesian Coordinates table, Z-Matrix tableModel window 8Models
building 63docking 56editing 63
modelsviewing with Chem3D 351
modifying data 349
MOL file format 207, 213Mol_ID field 341Molecular Design Limited MolFile (MOL) 213Molecular Dynamics 250
example 124overview 120simulation 249
Molecular electrostatic potential surfacecalculation types required 34definition 39dialog 39
molecular formula queries, see searching, for formulasmolecular formula searches, see searching, for formulasMolecular Mechanics 275Molecular mechanics
applications summary 237brief theory 242force-field 242limitations 236parameters 242speed 237uses 237
Molecular orbitals 39Molecular orbitals, calculation types re-quired 34Molecular orbitals, definition 39Molecular shape 39Molecular surfaces 155
calculation types 34definition 155dots surface type 35grid 36overview 33smoothness 36solid surface type 35translucent surface type 35types available from CS MOPAC 34types available from extended Hückel 34
Chem & Bio Office 2010 User Guide 561
types available from Gaussian 34wire mesh surface type 35
molecular weight field 341molecular weight, searching by 468Molecule (Mol) 274Monochrome 210MOP file format 207, 214MOPAC
AAA file 164troubleshooting 164
Moveto X-Y plane command 92to X-Z plane command 92to Y-Z plane command 92
Movie file format 211Movies
computing properties 54Moving
atoms 88atoms to an axis 54models see Translate
movingboxes 325objects 325
moving forms and databases 346MPC file format 214MS Access see also AccessMS Access, workgroup information 327MSI ChemNote file format 214MSI MolFile 191MSI molfile 389MSM file format 207, 214Mulliken charges 154Multiple models 74multiple structures, adding to forms 345Multi-step jobs, see Gaussianmulti-step reactions 366multi-user access 336
NName and Structure Conversion 274Name field 220name searching 300Name=Struct 64Naming a selection 84new form, creating 313new record indicator, description 287next record command 338NOMM keyword 261non file-based databases, attaching 342Non-bonded distances, constraints 249Non-bonded distances, displaying 100Non-bonded distances, displaying in tables 101Non-bonded energy 245normal searching 360normal searching, see also exact searchingnormal searching, see also similarity searchingnumbers, customizing 323numeric format 323numeric searches 300, 358
OObject Oriented 272objects
aligning 326deleting 325distributing 327spacing 327
ODBC, adding structures to existing sourc-es 345ODBC, selecting data sources 342Odd-electron systems 264OLE automation, communicating with oth-er applications 462OLE automation, overview 462

Adm
inistrator
562 Index
OOP see Out of Plane Bendingopen database button 334open last form on startup 447Open shell 264opening
databases 333, 336existing chemical databases 333hit lists 383secured MS Access databases 335
opening a database, tutorial 295opening options see preferencesOptimal field 24, 101Optimal measurements 101Optimization, partial 138Optimizing to a transition state 149, 240options 425OR operator, hit lists 384OR operator, queries 358Oracle
attaching tables 342case-insensitive query matching 372handling lists in 416indexing 419loading 418opening a database 414searching in 415setting preferences 417setup 413updating and adding data 417using CAL with 420
Oracle Cartridgeconfiguration via CF_SETTINGS table 540fast-move caching scheme 540pre-setup procedures 539
Order of attachment, specifying 68ordering objects 326Origin atoms, Z-matrix 94other applications
attaching tables from 342other applications, communicating with us-
ing DDE 461other applications, communicating with us-ing OLE Automation 462other applications, communicating with us-ing scripts 461Out of plane bending, equations 248Out-of-plane bending 232Output window 458output window, description 287overlay 309overlay, with scatter plots 432Overlays, hiding fragments 55overriding security 331
PPackbits, compression 210Pan see TranslateParadox 342Parameter table fields 218Parameters
creating 219CS MOPAC 260estimating 218guessing 116, 125MM2 125, 255
Partial chargeatom size control 27definition 61pop-up information 100
Partial optimization 138password, for secured forms 337Paste command 129Paste special 9PDB file format 207, 215Performance, optimizing 268periodic table 451, 478Perspective rendering 29Pi atoms table 225Pi bonds and atoms with pi bonds 248
Chem & Bio Office 2010 User Guide 563
Pi bonds table 217, 225PI keyword 261Pi orbital SCF computation 257Pi system SCF equations 248PIATOMS.TBL see Pi atoms tablePIBONDS.TBL see Pi bonds tablepicture box, description 287picture boxes, creating 317picture fields 344picture tool 317pictures 317
framing 446of structures 351preferences 446saving 317saving ChemDraw drawings as 351searching 351updating 317
plain text tool 316Planarity 102plot properties
point limit 305plots
histogram 306single variable 304two variable 306
plotting options 304PM3 252, 253PNG file format 210Polarizability 155Pop-up information 99portal database 346Positioning by bond angles 96Positioning by dihedral angle 96Positioning example 95PostScript files, background color 30potential energy 112Potential energy function, choosing 250Potential energy surfaces (PES) 236, 239
Powerful Syntax 272PRECISE keyword 150, 260, 261precision, in numerical queries 358Pre-defined substructures 48preferences
color 446date display 359display 445general 447grid spacing 446picture display 446recent file list size 448registration 447search details 370search type 369setting 445stereochemistry 372structure display 445tuning 372
preferences in ChemFinder/Office 475previous record command 338Printing
background color 30printing 397products
in queries 368searching for 366
profile box, description 287profiles, see compound profilesprogram execution commands, CAL 508Properties
tab, CS GAMESS 134tab, MM2 125
Property calculation definition 236Pro-R 95Pro-S 95Protein Data Bank File
FORTRAN format 199Protein Data Bank file 197Protein Data Bank file format 215

Adm
inistrator
564 Index
Protein Data Bank Files 197Protein residues, labeling 31Proteins, highlighting binding sites 85Publishing formats 208Python 271, 272, 275, 277, 456
about 271Python interactive mode 458Python, script creation 456
QQ (heteroatom), special atom type 483QRY indicator 289QRY indicator, description 287Quality field 218Quantum mechanical methods applications summary 237Quartic stretching term 257queries
anchored substring 357atom lists 385, 484atom not-lists 484atom properties 477atom properties in 483atom types 385, 477bond properties 487bond types 385, 477booleans 358charges 479context menu 381creating from BioViz plot 309dates 359entering 289, 369, 373exact structure 362finding current structure 375formulas in 358free sites 485full structurehydrogens in 478ID 360identity 361implicit AND between fields 358, 368
implicit hydrogens 486inequalities 359intermediates 368isotopes 479multiple fields 368multiple fragments 362multiple substructures 387no highlighting 375numbers in 358overlapping fragments 371plotting with BioViz 309precision 358products 368progress display 368, 374radicals 479ranges 358, 359reactants 368reactions 366red highlighting 368, 374refining 374similarity 361similarity rules 495special atom types in 483special bond types 487SQL 369stereochemistry 363, 480stopping 374structural similarity 361structures 360subforms 402submitting 373substituents 478, 484tuning 372unsaturation 486using current structure 375
query operators\ 369equals (=) 359greater than (>) 359less than ( 359minus (-) 359
query propertiesconflicting 477
Chem & Bio Office 2010 User Guide 565
overview 477Questel F1D files 389Questel F1Q files 389Queuing minimizations 116QuickTime file format 211
Rr groups, see alternative groupsR* field 228R, special atom type 483radicals, in queries 479ranges, in queries 358RDFiles 331, 390, 394RDL file format 207, 215reactants, in queries 368reactants, searching for 366Reaction (Rxn) 274reaction centers 366, 487
bond type 495bond types 487, 489display preferences 448overview 366
reaction queries 366atom-atom mapping 367creating 375hitting reaction centers 366, 371intermediates 368products 368reactants 368
reaction queries, tutorial 301reaction searches 366reaction template basics 491Reaction Transformation 276reactions
multiple-step 366READ indicator 289READ indicator, description 287read structure command 392reading a structure 392read-only access 336
read-only fields 290real fields 344RECALC keyword 150, 260recent file list size, setting 448record number dialog box 338Record order 223, 225, 226, 231, 232, 233record tool 338record toolbar
browsing with 338description 287illustration 333
Recordingminimization 116
recordsadding 289, 347current 285, 289deleting 353duplicating 348moving between 338
Rectification 22Rectification type field 221Rectification, when deselecting 84Rectifying atoms 80Red-blue anaglyphs 29redo command 325, 353redoing changes 353Reduct field 229redundant reagents, in RD files 390Reference description field 222Reference field 218Reference number field 222References table 218, 222References, CS MOPAC 259References, MM2 255Refining a model 80refining queries 374refining your search
overview 472refining your search, search options 473
Adm
inistrator
566 Index
refining your search, search tools 472Reflecting a model through a plane 79registration preferences 447relational data and subforms 399relational database, definition 292relational databases 342, 399relative tetrahedral stereochemistry 373, 481Removing
bonds and atoms 66renaming
tabs 318Reorienting a model 54Repeating a CS GAMESS Job 136Repeating an MM2 Computation 127Repeating CS MOPAC Jobs 165replace current list command 383Replacing
atoms 46atoms with substructures 71
Report a Chemical Name 273Repulsion field 225Requirements
windows iiirescale 307rescale, see also autoscaleReserializing a model 77Resetting defaults 108resetting the database 354Resizing
models 93resizing
boxes 325objects 325
Resizing models 172restore list command 383restoring a hit list 383restoring changes 325reversing and restoring changes 325RGB indexed color 210
R-group tables 339R-group tables, persistence 340R-group tables, sorting 340RHF spin density 156, 157Ribbons display 26ring bonds 487Ring closure 68RMAX keyword 260RMIN keyword 260ROSDAL 200ROSDAL file format 215Rotating
around a bond 91around a specific axis 91dihedral angles 90, 91fragments 90models 89two dihedrals 53using trackball 90with mouse buttons 171X/Y-axis rotation 90Z-axis rotation 90
Rotating fragments 55Rotation dial 51rules 489Run CS GAMESS Input File command 136Running
CS GAMESS jobs 136CS MOPAC input files 165CS MOPAC jobs 165
SSaddle point 239Salt splitting 271Salt splitting and stripping 271Salt Stripping 274, 276sample databases 293Save All Frames checkbox 214Save As command 208save command 348
Chem & Bio Office 2010 User Guide 567
save command, effect on changes 313save dialog box 313save list command 383save structure command 394Saving
customized job descriptions 135saving
and restoring lists 382data sources 469, 470directory paths to search 470files 469forms 313hit lists 383pictures 317search results 470structures 394subforms 313vs. committing 313
Scaling a model 93scaling structures 446script-only commands, CAL 534scripts
communicating with other applications 461debugging 455executing 455in subforms 403writing 454
scroll bars, adding 321SDFiles
exporting 394, 396SDFiles, importing 331, 390search
examples 384toolbar 369type 360
search details preferences 370search options 473search over list command 303search results 469search toolbar, description 287
Searchingfor conformations 54
searchingby chemical formula 468by chemical structure 467by molecular weight 468by multiple properties 468by reaction type 303by selected files 469case-insensitive 372combined 368directory paths 470DSD files 470enter query 473for datesfor formulas 299for intermediates 368for names 300for numbers 300, 358for products 302, 368for reactants 301, 368for substructures 300formula element ranges 359formula query rules 359full word 372fullerenes 386ISIS style 372loose delocalization 372more than one substructure 387parentheses in formulas 359procedures 369refining 472restore previous query 473save results 470search options 473search tools 472start 473subforms 402tuning 372
searching a database, tutorial 298searching, combined 301searching, for dates 359

Adm
inistrator
568 Index
searching, for formulas 358secured Access 337securing forms 327security
disabling 331MS Access workgroup information 327overriding 331setting options 328
Select Fragment command 85Select tool 83Select tool, HotKey 48Selecting
all children 86atoms 83atoms and bonds 83bonds 83by clicking 83by distance 85by double click 85by radius 85defining a group 84fragments 85moving 88
selectingboxes 324data to display 334databases 333objects on a form 324
selection tool 324Semi-empirical methods
limitations 236speed 237uses 238
send to back command 326sending to another application 471Separating fragments 55Serial number 267Serial numbers, displaying 30Serial numbers, tutorial example 45Set Z-Matrix commands 96Setting
bond angles 75bond lengths 75bond order 73changing structural display 25charges 77constraints 77default atom label display options 30dihedral angles 75measurements 75measurements, atom movement 76model building controls 63molecular surface colors 36molecular surface isovalues 35molecular surface types 35non-bonded distances 76origin atoms 96serial numbers 77solid sphere size 27solvent radius 36surface mapping 36surface resolution 36
settingalerts 447box properties 318color 323data box styles 319fixed and live data 321numeric format 323preferences 445recent file list size 448search details preferences 370search type preferences 369security options 328stereochemistry search preferences 372
Sextic bending constant 228Show Internal Coordinates command 94Show Surface button 34Show Used Parameters command 125, 127, 219Showing
all atoms 86atoms or groups 86

Chem & Bio Office 2010 User Guide 569
serial numbers 77used parameters 127
showingannotations 446data boxes 322opening dialog 447reaction centers 448
similarity rules 495similarity searching 361similarity searching, see also exact search-ingsimilarity searching, see also normal searchingSimple salt stripping 276Simple to Use 272Single point calculations, definition 236Single point calculations, MOPAC 151Single Point energy calculations 240SM2 file format 207SM2 see SYBYL MOL2 FileSMD 200SMD file format 207, 215SMD files 200, 389SMILES notation, exporting 129SML file format 207, 216Solid spheres, size by control 27Solid spheres, size% 27Solid surface type 35Solution effects 155Solvent accessible surface
calculation types required 34definition 37dialog 38solvent radius 37
Sorting 429sorting
by subform aggregate (Oracle) 416data 353data tables 353fields 353
formulas 353from the data table 353in reverse order 353languages other than English 354Oracle databases 416structures 353text 353
Space filling display 26special atom types, list of 483special bond types 487special structure searches 376Specifying
electronic configuration 261general settings 135properties to compute 134
Spectra, predicting 137, 144Spectrum viewer 137Spin density 156SQL searches 369Standard measurement 217Standard measurements, applying 22Standard measurements, bond angle 224Standard measurements, bond length 222Standard Molecular Data file format 215Stationary point 239statistical analysis 307statistical analysis, see BioVizstatus bar 289status bar, description 287Stereo pairs 32Stereochemistry
changing 78inversion 78stereochemical relationships 177
stereochemistry 480allenic 480cis/trans double bonds 480octahedral 480overview 363queries 480

Adm
inistrator
570 Index
relative tetrahedral 373, 481search preferences 372square planar 480tetrahedral 480trigonal bipyrimidal 480
Steric energycomputing 125equations 242parameters 125terms 126
Sticks display 26STN Express 215Stopping
minimization 116stopping
queries 374Stretch-bend cross terms 249Stretch-bend parameters 227Struct>Name(TM) 394structural query features 477Structure
displays, changing 25displays, overview 25
structurecolumns 345display preferences 445queries 360registration options 447searches 360
structure box, description 287structure field 341, 344Structure menu 12structure mode 361Structure Orientation 274Structure Overlay 276structure window 306structure window, description 287structures
adding 347adding to non-chemical database 345
as pictures 351checking chemistry 351chemically-significant text 351cleaning 350copying as text strings 394editing 349, 350entering 350, 447file formats 389importing 390query properties 477red highlighting in queries 368, 374scaling 446sorting 353
structures, importing only 390style, box, changing 319style, definition 426styled text 352subform fields, exporting 396subform, description 287subforms
changes in ChemFinder 9 399creating 400data table 402linking fields 399overview 399searching 402switching between forms and data tables 402tutorial 310using scripts 403
subforms, tutorial 309submitting queries 373substituents 478
exactly 484free sites 485in queries 478, 484up to 484
Substructure Identification and Mapping 274substructure searches 361substructure searching 300substructure searching, see also full struc-
Chem & Bio Office 2010 User Guide 571
ture searchingsubstructure searching, see also similarity searchingsubstructure similarity 496Substructures 167Substructures table 48, 222Substructures, adding to model 71Summary file seeCS MOPAC out filesupported file formats 389Surfaces toolbar 15SYBYL file format 216SYBYL MOL File 202SYBYL MOL2 File 204, 205
FORTRAN format 207SYBYL MOLFile 202
FORTRAN format 204SYBYL2 see SYBYL MOL2 FileSymbol 219, 220synchronization 433System crashes 268System requirements iiiTTable
editor 68Tables
internal and external 20tables
adding 354, 403creating 341deleting 341
tabs, creating and editing 318tabs, renaming 318Tanimoto similarity 495tautomers, searching for 362Template Based Normalization 274Template Based Product Generation 274templates, entering 491temporary database 346
Terminate After control 121, 123tetrahedral stereo center hits 373Text
building tool 67building tool, tutorial example 46tool, specifying order of attachment 68
textas structures 351creating 316customizing 322fields 343format toolbar 322, 352sorting 353styled 352
text box, description 287text boxes, formatting 290text files, importing 393text format toolbar, description 287The ChemScript API online 275themes 290themes, selecting 448Theory tab 134TIF file format 209Toolbars
building 14calculation 16model display 10, 15standard 14surfaces 15
toolbarscustomizing 450form 288main 288record 289search 289text 352text format 289
Toolbars, Demo 16Tools
eraser 66select 83

Adm
inistrator
572 Index
select, hotkey 48tools
alternative group 364attachment point 365data box 315frame 315framed box 316grid 314layout 314picture 317plain text 316record 338
Tools palette see Building toolbartopology 487Torsion energy 245Torsion energy, constraints 249Torsional parameters table 229Torsional parameters table, 4-membered ring 229Torsionals table 218Total charge density surface, calculation types required 34Total charge density surface, definition 39Total spin
calculation types required 34definition 39density surface dialog 39
Trackball tooloverview 90tutorial example 41Z-axis rotation 90
transferring informationto other computers 346
Transition state 239Translate 88, 172Translate tool 88Translucent surface type 35trigger scripts 455Triple bonds field 221Troubleshooting 268
atoms shift on CS MOPAC input 165background color 30MOPAC quits 164
Tutorial 6Creating a BioViz chart 304
Tutorials 275two-variable plot 306Type 2 (-CHR-) bending force parameters for C-C-C angles 227
UUHF spin density 156 37Uncoordinated bonds, creating 65understanding forms and databases 292undo 325undoing changes 352undoing data entry 349uniform bond length 446union with current list 384Unix, Gaussian files 40unsaturation 486unsaturation, in queries 486Use Current Z-Matrix button 213Useful References 277User-imposed constraints 249username, for secured forms 337Using
bond tools, tutorial example 41ChemDraw to create models 49CS MOPAC keywords 260display mode 108double bond tool, tutorial example 44hardware stereo graphic enhancement 32JDF Files 122, 123labels 67labels for substructures 48labels to create models 47measurements table, tutorial example 49Name=Struct 64

Chem & Bio Office 2010 User Guide 573
rotation dial 51, 90stereo pairs 32substructures 68table editor to enter text 68text building tool 67text building tool, tutorial example 46trackball tool, tutorial example 41
usingatom lists 385ChemFinder with databases 291current molecule as a query 375form tools 314grids 314keyboard shortcuts 446log files 391periodic table 451scripts 461scripts in subforms 403Visual Basic 462
Using ChemScript 273UV energies 261
VV1 field 230V2 field 230V3 field 231valence
charged atoms 479checking 447non-standard state 447unfilled 478
van der Waalscutoff distance 228cutoff term 257cutoffs 246energy 246radius field 220surface, definition 38
Van der Waals radiiatom size control 27dot surfaces display 27
variable commands, CAL 527
VDW interactions 232VDW interactions table 217VECTORS keyword 261Vibrational energies 261View focus 74view format for structures, selecting 319View menu 10Viewing
Highest Occupied Molecular Orbitals 58Lowest Unoccupied Molecular Orbitals 58parameters 256
viewingmodels with Chem3D 351results 374structures 319structures in Chem3D format 320
viewing subform data in a table 402Visual Basic 462Visualizing surfaces from other sources 40
WWang-Ford charges 154Web Sites 277Why use ChemScript? 271Widely Adopted 272Windows metafiles 315, 317Wire frame display 25Wire mesh surface type 35WMF and EMF 209WMF file format 317Word files, exporting 395working with
multiple hit lists 384subforms, tutorial 309
working with reaction templates 491working with structures using ChemDraw 350working with subforms 401

Adm
inistrator
574 Index
XX (halogen), special atom type 483X- Y- or Z-axis rotations 89–XH2– field 224–XR2– field 224–XRH– field 224
ZZero point energy 261Z-matrix 23, 94
changing 94ZMT file format 214zoom 433zoom on drag 427Zwitterion, creating a 70

DESKTOP SOFTWARE
ENTERPRISE SOLUTIONS
CHEMICAL & BIOLOGICAL
RESEARCH INFORMATICS
KNOWLEDGE MANAGEMENT
SCIENTIF IC DATABASES
featuringE-Notebook
CambridgeSoftSolutions
LABORATORY, DEVELOPMENT &MANUFACTURING INFORMATICS

C A M B R I D G E S O F T
Vision, PassionVision, PassionResearch, Discovery, Development, Research, Discovery, Development,
CambridgeSoft Software, Solutions and Databases

S O L U T I O N S
& Innovation& InnovationTTrials and Manufacturingrials and Manufacturing
Chemists, biologists, scientists, and engineers need timely, convenient access to critical information,whether structured or unrefined. CambridgeSoft, which began by helping scientists manage desktopchemical and biological information with Chem & Bio Draw, now addresses enterprise-wide scientificinformation problems with Chem & Bio Office Enterprise and Workgroup. These solutions are flexibleand powerful to deal with today’s complex projects which span functional organizations and geographi-cal boundaries. Eliminating data barriers and bringing information to all—in the form they need to interpret it—aligns all of the mem-bers of your teams, focusing their collective knowledge and diverse skills toward the common goals of problem solving and innovation.The results can be dramatic:
· Information transparency and group collaboration improve productivity and reduce costs.
· Faster and smarter research decisions cut time to market and increase productive efforts.
· Empowered employees contribute increased value to the research, discovery, development, trials and manufacturing organization.
When your research, discovery, development, trials and manufacturing organization is able to respond swiftly and effectively to opportunities and market changes, promote innovation andaccelerate product delivery, you are working smarter to outpace your competitors. As the speed of busi-ness continues to accelerate, leading organizations constantly seek faster and better informed decisionmaking as well as new business efficiencies. For the individual chemist, biologist, scientist, and engi-
neer who needs to capture, organize, and communicate chemical and biological data, through the complex and widespread workgroupand enterprise scientific information systems needs, CambridgeSoft Solutions can help.
Motivated by Vision
Created with Passion
Advanced through Innovation
Innovation is an organizational must in pharmaceutical, biotechnology, and chemical industries.Effective new ideas, developed through collaboration and communication, free from organizationalboundaries, will determine your long-term success. In today’s connected world, information flowwithin organization can be overwhelming. Large amounts of data—some structured and someunstructured—can cloud an R&D organization’s ability to focus on what is important. Since 1986,
CambridgeSoft has been solving the problem of electronic storage and communication of chemical structures, models, and informa-tion. Starting with ChemDraw, then broadening to ChemOffice in 1992 and BioOffice in 2004, CambridgeSoft extended its software toinclude enterprise wide solutions with ChemOffice Enterprise in 1998, E-Notebook in 2000 and biology with BioAssay in 2001. Today,CambridgeSoft products are used by hundreds of thousands of chemists, biologists, scientists, and engineers who work in pharmaceutical,biotechnology, and chemical industries, including government and academic research. These systems work within your research, discov-ery, development, trials and manufacturing, and information technology to help you capitalize on your organization’s intellectual assets. Byturning information into explicit knowledge, you accelerate innovation and drive organizations forward.
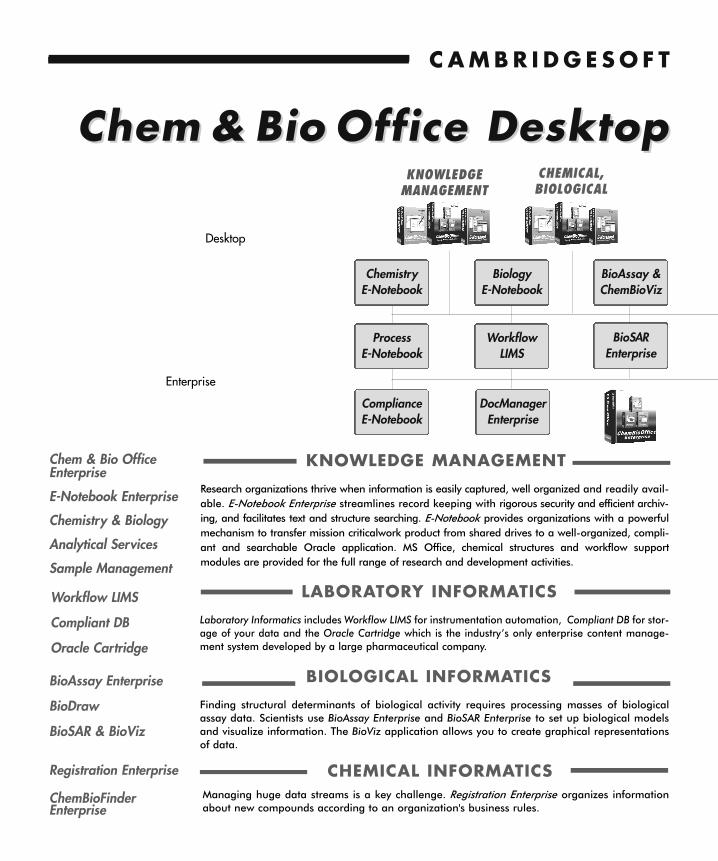
C A M B R I D G E S O F T
ChemChem && BioBio Office Desktop Office Desktop
Process E-Notebook
Chemistry E-Notebook
Enterprise
Biology E-Notebook
WorkflowLIMS
BioAssay &ChemBioViz
KNOWLEDGE MANAGEMENT
CHEMICAL, BIOLOGICAL
Desktop
BioSAREnterprise
KNOWLEDGE MANAGEMENTResearch organizations thrive when information is easily captured, well organized and readily avail-able. E-Notebook Enterprise streamlines record keeping with rigorous security and efficient archiv-ing, and facilitates text and structure searching. E-Notebook provides organizations with a powerfulmechanism to transfer mission criticalwork product from shared drives to a well-organized, compli-ant and searchable Oracle application. MS Office, chemical structures and workflow support modules are provided for the full range of research and development activities.
Chem & Bio Office Enterprise
E-Notebook Enterprise
Chemistry & Biology
Analytical Services
Sample Management
BioAssay Enterprise
BioDraw
BioSAR & BioViz
BIOLOGICAL INFORMATICSFinding structural determinants of biological activity requires processing masses of biologicalassay data. Scientists use BioAssay Enterprise and BioSAR Enterprise to set up biological modelsand visualize information. The BioViz application allows you to create graphical representationsof data.
Workflow LIMS
Compliant DB
Oracle Cartridge
LABORATORY INFORMATICSLaboratory Informatics includes Workflow LIMS for instrumentation automation, Compliant DB for stor-age of your data and the Oracle Cartridge which is the industry’s only enterprise content manage-ment system developed by a large pharmaceutical company.
CHEMICAL INFORMATICSManaging huge data streams is a key challenge. Registration Enterprise organizes informationabout new compounds according to an organization's business rules.
Registration Enterprise
ChemBioFinderEnterprise
ComplianceE-Notebook
DocManagerEnterprise
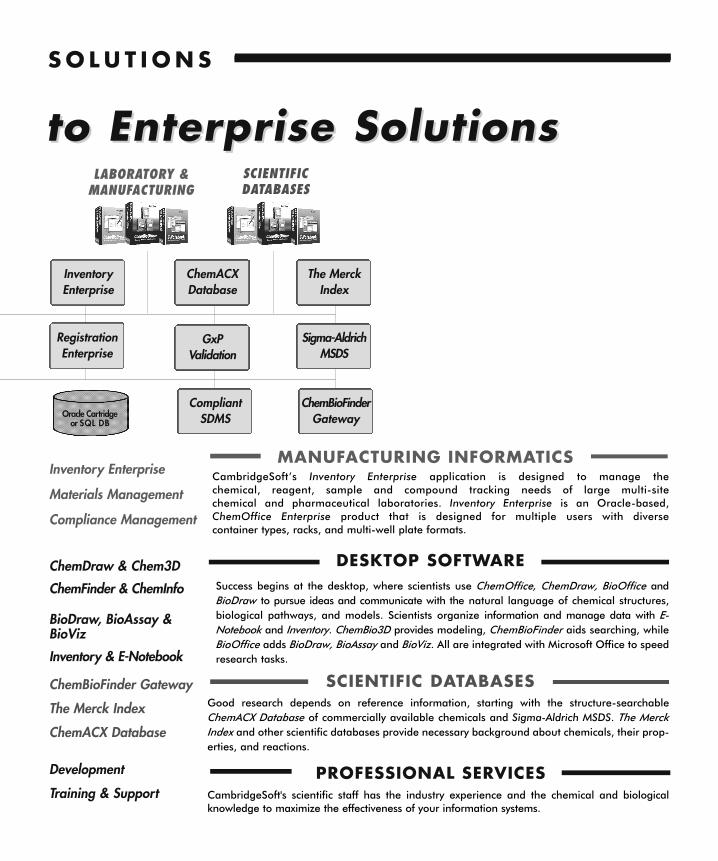
S O L U T I O N S
to Enterprise Solutionsto Enterprise Solutions
InventoryEnterprise
ChemACXDatabase
LABORATORY &MANUFACTURING
SCIENTIFICDATABASES
Oracle Cartridgeor SQL DB
Sigma-AldrichMSDS
The MerckIndex
GxP Validation
RegistrationEnterprise
ChemBioFinder Gateway
The Merck Index
ChemACX Database
SCIENTIFIC DATABASES
PROFESSIONAL SERVICES
Good research depends on reference information, starting with the structure-searchableChemACX Database of commercially available chemicals and Sigma-Aldrich MSDS. The MerckIndex and other scientific databases provide necessary background about chemicals, their prop-erties, and reactions.
Inventory Enterprise
Materials Management
Compliance Management
CambridgeSoft's scientific staff has the industry experience and the chemical and biologicalknowledge to maximize the effectiveness of your information systems.
ChemDraw & Chem3D
ChemFinder & ChemInfo
BioDraw, BioAssay & BioViz
Inventory & E-Notebook
DESKTOP SOFTWARESuccess begins at the desktop, where scientists use ChemOffice, ChemDraw, BioOffice andBioDraw to pursue ideas and communicate with the natural language of chemical structures,biological pathways, and models. Scientists organize information and manage data with E-Notebook and Inventory. ChemBio3D provides modeling, ChemBioFinder aids searching, whileBioOffice adds BioDraw, BioAssay and BioViz. All are integrated with Microsoft Office to speedresearch tasks.
Development
Training & Support
MANUFACTURING INFORMATICSCambridgeSoft’s Inventory Enterprise application is designed to manage the chemical, reagent, sample and compound tracking needs of large multi-site chemical and pharmaceutical laboratories. Inventory Enterprise is an Oracle-based,ChemOffice Enterprise product that is designed for multiple users with diverse container types, racks, and multi-well plate formats.
CompliantSDMS
ChemBioFinderGateway
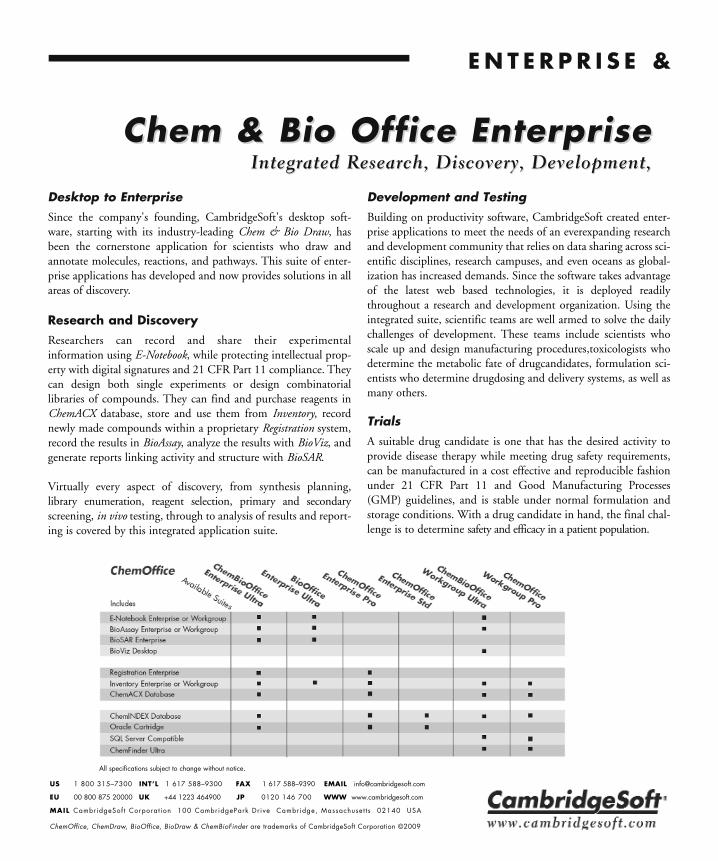
E N T E R P R I S E &
Chem & Bio Office EnterpriseChem & Bio Office EnterpriseIntegrated Research, Discovery, Development,Integrated Research, Discovery, Development,
US 1 800 315–7300 INT’L 1 617 588–9300 FAX 1 617 588–9390 EMAIL [email protected]
EU 00 800 875 20000 UK +44 1223 464900 JP 0120 146 700 WWW www.cambridgesoft.com
MAIL CambridgeSof t Corporat ion 100 CambridgePark Dr ive Cambridge, Massachuset ts 02140 USA
ChemOffice, ChemDraw, BioOffice, BioDraw & ChemBioFinder are trademarks of CambridgeSoft Corporation ©2009
Desktop to EnterpriseSince the company's founding, CambridgeSoft's desktop soft-ware, starting with its industry-leading Chem & Bio Draw, hasbeen the cornerstone application for scientists who draw andannotate molecules, reactions, and pathways. This suite of enter-prise applications has developed and now provides solutions in allareas of discovery.
Research and DiscoveryResearchers can record and share their experimental information using E-Notebook, while protecting intellectual prop-erty with digital signatures and 21 CFR Part 11 compliance. Theycan design both single experiments or design combinatoriallibraries of compounds. They can find and purchase reagents inChemACX database, store and use them from Inventory, recordnewly made compounds within a proprietary Registration system,record the results in BioAssay, analyze the results with BioViz, andgenerate reports linking activity and structure with BioSAR.
Virtually every aspect of discovery, from synthesis planning,library enumeration, reagent selection, primary and secondaryscreening, in vivo testing, through to analysis of results and report-ing is covered by this integrated application suite.
Development and TestingBuilding on productivity software, CambridgeSoft created enter-prise applications to meet the needs of an everexpanding researchand development community that relies on data sharing across sci-entific disciplines, research campuses, and even oceans as global-ization has increased demands. Since the software takes advantageof the latest web based technologies, it is deployed readilythroughout a research and development organization. Using theintegrated suite, scientific teams are well armed to solve the daily challenges of development. These teams include scientists whoscale up and design manufacturing procedures,toxicologists whodetermine the metabolic fate of drugcandidates, formulation sci-entists who determine drugdosing and delivery systems, as well asmany others.
TrialsA suitable drug candidate is one that has the desired activity toprovide disease therapy while meeting drug safety requirements,can be manufactured in a cost effective and reproducible fashionunder 21 CFR Part 11 and Good Manufacturing Processes(GMP) guidelines, and is stable under normal formulation andstorage conditions. With a drug candidate in hand, the final chal-lenge is to determine safety and efficacy in a patient population.
All specifications subject to change without notice.

US 1 800 315–7300 INT’L 1 617 588–9300 FAX 1 617 588–9390 EMAIL [email protected]
EU 00 800 875 20000 UK +44 1223 464900 JP 0120 146 700 WWW www.cambridgesoft.com
MAIL CambridgeSof t Corporat ion 100 CambridgePark Dr ive Cambridge, Massachuset ts 02140 USA
ChemOffice, ChemDraw, BioOffice, BioDraw & ChemBioFinder are trademarks of CambridgeSoft Corporation ©2009
W O R K G R O U P
and Workgroup Solutionsand Workgroup SolutionsTTrials and Manufacturing Wrials and Manufacturing Workfloworkflow
ManufacturingManufacturing requires the transfer of data and batch processrecords from the pilot plant studies using Inventory, E-Notebook,and Registration systems under Good Laboratory andManufacturing Processes (GxP).
The handling of materials, including chain of custody require-ments, material documentation, material workflow, such as avail-ability states and recertification dates, are tracked and handled bythe system.
These systems meet the requirements and provide the basis tomanage materials and records during clinical trials. Clinicians candesign and record results from protocols, and all of these webbased software systems provide the access required by clinicianswho are removed from the sponsoring company.
Chem & Bio Office EnterpriseChem & Bio Office Enterprise is a comprehensive knowledge-
management and informatics solution, covering electronic note-books, biological screening and chemical registration over yourintranet. ChemBioOffice Enterprise Ultra includes E-Notebook forrecord keeping, BioAssay for low and high throughput screeningwith integrated plate inventory, BioSAR for SAR reports,Registration System, Inventory for reagents and biologicals, andChemACX database of available chemicals. Technologies includeChemDraw ActiveX and Oracle Cartridge.
Chem & Bio Office WorkgroupChem & Bio Office Workgroup Ultra is a comprehensive knowl-edge management and informatics solution, covering electronicnotebooks, biological screening and more over your intranet.
Chem & Bio Office Workgroup Ultra includes E-Notebookfor record keeping, BioAssay for low and high-throughput screen-ing, BioViz for visualization, Inventory for reagents and ChemACXdatabase of available chemicals. Technologies also include SQLServer for affordability and ease of administration.
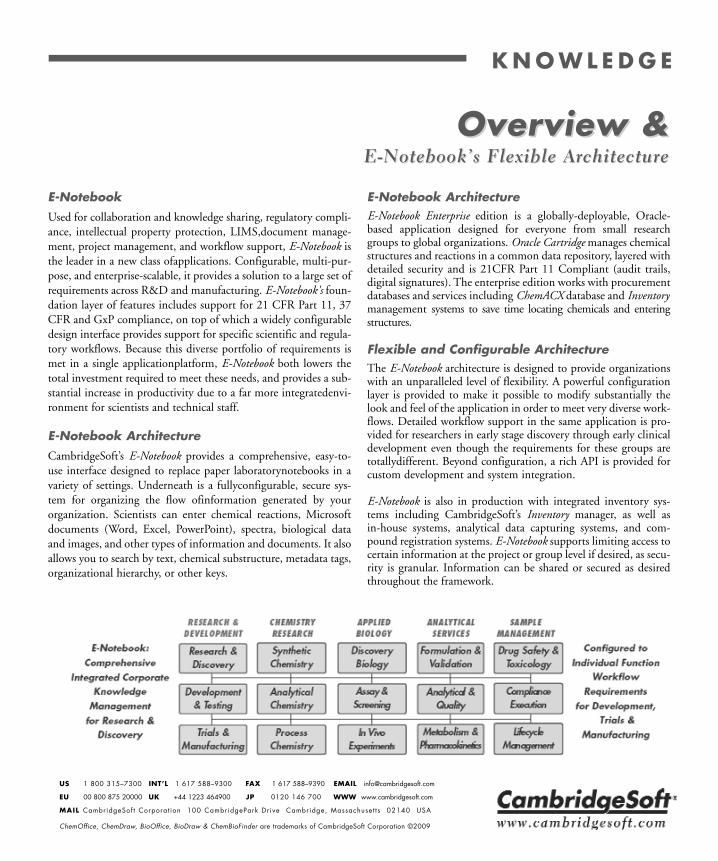
US 1 800 315–7300 INT’L 1 617 588–9300 FAX 1 617 588–9390 EMAIL [email protected]
EU 00 800 875 20000 UK +44 1223 464900 JP 0120 146 700 WWW www.cambridgesoft.com
MAIL CambridgeSof t Corporat ion 100 CambridgePark Dr ive Cambridge, Massachuset ts 02140 USA
ChemOffice, ChemDraw, BioOffice, BioDraw & ChemBioFinder are trademarks of CambridgeSoft Corporation ©2009
K N O W L E D G E
Overview &Overview &E-Notebook’s Flexible ArchitectureE-Notebook’s Flexible Architecture
E-NotebookUsed for collaboration and knowledge sharing, regulatory compli-ance, intellectual property protection, LIMS,document manage-ment, project management, and workflow support, E-Notebook isthe leader in a new class ofapplications. Configurable, multi-pur-pose, and enterprise-scalable, it provides a solution to a large set ofrequirements across R&D and manufacturing. E-Notebook's foun-dation layer of features includes support for 21 CFR Part 11, 37CFR and GxP compliance, on top of which a widely configurabledesign interface provides support for specific scientific and regula-tory workflows. Because this diverse portfolio of requirements ismet in a single applicationplatform, E-Notebook both lowers thetotal investment required to meet these needs, and provides a sub-stantial increase in productivity due to a far more integratedenvi-ronment for scientists and technical staff.
E-Notebook ArchitectureCambridgeSoft’s E-Notebook provides a comprehensive, easy-to-use interface designed to replace paper laboratorynotebooks in avariety of settings. Underneath is a fullyconfigurable, secure sys-tem for organizing the flow ofinformation generated by yourorganization. Scientists can enter chemical reactions, Microsoftdocuments (Word, Excel, PowerPoint), spectra, biological dataand images, and other types of information and documents. It alsoallows you to search by text, chemical substructure, metadata tags, organizational hierarchy, or other keys.
E-Notebook ArchitectureE-Notebook Enterprise edition is a globally-deployable, Oracle-based application designed for everyone from small researchgroups to global organizations. Oracle Cartridge manages chemicalstructures and reactions in a common data repository, layered withdetailed security and is 21CFR Part 11 Compliant (audit trails,digital signatures). The enterprise edition works with procurementdatabases and services including ChemACX database and Inventorymanagement systems to save time locating chemicals and enteringstructures.
Flexible and Configurable ArchitectureThe E-Notebook architecture is designed to provide organizationswith an unparalleled level of flexibility. A powerful configurationlayer is provided to make it possible to modify substantially thelook and feel of the application in order to meet very diverse work-flows. Detailed workflow support in the same application is pro-vided for researchers in early stage discovery through early clinicaldevelopment even though the requirements for these groups aretotallydifferent. Beyond configuration, a rich API is provided forcustom development and system integration.
E-Notebook is also in production with integrated inventory sys-tems including CambridgeSoft’s Inventory manager, as well as in-house systems, analytical data capturing systems, and com-pound registration systems. E-Notebook supports limiting access tocertain information at the project or group level if desired, as secu-rity is granular. Information can be shared or secured as desiredthroughout the framework.

US 1 800 315–7300 INT’L 1 617 588–9300 FAX 1 617 588–9390 EMAIL [email protected]
EU 00 800 875 20000 UK +44 1223 464900 JP 0120 146 700 WWW www.cambridgesoft.com
MAIL CambridgeSof t Corporat ion 100 CambridgePark Dr ive Cambridge, Massachuset ts 02140 USA
ChemOffice, ChemDraw, BioOffice, BioDraw & ChemBioFinder are trademarks of CambridgeSoft Corporation ©2009
M A N A G E M E N T
General R&DGeneral R&DIP Protection and Regulatory ComplianceIP Protection and Regulatory Compliance
General R&DCambridgeSoft’s E-Notebook is a solution that enables pharmaceutical and biotechnology companies to improve theefficiency of the process from diseased target identification to prod-uct launch. Its core Oracle database manages the workflow to becompliant with Good Laboratory Practices (GLP), GoodManufacturing Processes (GMP), and the FDA’s 21 CFR Part11; while the client interface is highly configurable and flexible.Anywhere a shared drive is used, E-Notebook can offer a bettersolution.
Through the R&D process, using CambridgeSoft’s E-Notebook ineach subsequent stage adds increasing scientific and economicvalue by providing workflow automation and knowledge sharing.
Research and DiscoveryE-Notebook Enterprise is capable of providing knowledge manage-ment, chemical- and biological-focused solutions in virtually allareas of discovery. Researchers can record and share their experi-mental information, while protecting intellectual property withdigital signatures and 21CFR Part 11 and 37 CFR compliance.
• Chem & Bio Draw—draw and annotate molecules, reactions, and biological pathways
• ChemACX—find and purchase reagents• Inventory—store and track reagents and samples• Registration—record newly made compounds• BioAssay—model complex protocols and record results
from biological testing• BioSAR—generate reports linking activity with structure• BioViz—analyze biological results
Virtually every aspect of discovery process—from synthesis planning, library enumeration, reagent selection, primary and secondary screening, in vivo testing, through to analysis of resultsand the reporting of data—is covered by the integrated E-Notebook solution.
Development and TestingCambridgeSoft’s Enterprise E-Notebook meets the needs of everexpanding research and development communities that rely ondata sharing across scientific disciplines and campuses as globaliza-tion has increased demands.
E-Notebook allows custom integration of a large array of modules,in-house applications, lab instruments, and back-end data storageto provide a true end-to-end solution for development and testing.Designing workflows and calculations is much faster and requiresfar less programming using the E-Notebook than existing lab infor-mation systems. End users include scientists and process chemistswho scale up and design manufacturing procedures, toxicologistswho determine the metabolic fate of drug candidates, formulation scientists who determine drug dosing and delivery systems, as well as many others.
Trials and ManufacturingA suitable drug candidate has the desired activity to provide dis-ease therapy while still meeting safety requirements, can be man-ufactured in a cost effective fashion under 21 CFR Part 11 andGMP guidelines, and is stable under normal formulation and storage conditions. The handling of materials, including chain of custody requirements, material documentation, material workflow, such as availability states andrecertification dates, are tracked and handled by the E-Notebook application. CambrideSoft’s E-Notebook meets theserequirements under Good Laboratory and ManufacturingProcesses (GxP) and provides the basis to manage materials andrecords during clinical trials.
• Replace Shared Drives with Oracle
• DMPK, Screening Biology, Genetics, and Microscopy
• LIMS, Method Execution, 21 CFR Part 11, GxP

US 1 800 315–7300 INT’L 1 617 588–9300 FAX 1 617 588–9390 EMAIL [email protected]
EU 00 800 875 20000 UK +44 1223 464900 JP 0120 146 700 WWW www.cambridgesoft.com
MAIL CambridgeSof t Corporat ion 100 CambridgePark Dr ive Cambridge, Massachuset ts 02140 USA
ChemOffice, ChemDraw, BioOffice, BioDraw & ChemBioFinder are trademarks of CambridgeSoft Corporation ©2009
K N O W L E D G E
Chemistry &Chemistry &Electronic JElectronic Journal and Record Keeping,ournal and Record Keeping,
Chemistry
Under the R&D value chain, chemistry can be further divided into three separate stages: synthetic chemistry(research/discovery), analytical chemistry (pre-clinical) andprocess chemistry (development). The flexibility and configura-bility of E-Notebook enables a successful data repository, analysis,sharing, reporting, and searching efficiently and paper-free.
Synthetic Chemistry
Synthetic Chemists take advantage of many features tied into asmooth interface within CambridgeSoft’s Enterprise E-Notebook.Reactions are drawn with in-place editing; a stoichiometry griddynamically fills with the formulas, molecular weights, and chem-ical names. Reagents can also be imported from other systems,such as available chemicals from the ChemACX database orRegistration system.
CombiChem is one important aspect of library generation forSynthetic Chemists. For some, E-Notebook serves as the completeCombiChem solution, taking advantage of features such as theenumeration of products from a virtual library on a flexible platelayout, a multiple reaction site checker, and multiple step parallelsynthesis. Others simply import a list of compounds from anexternal source or SDFile so that they can record and calculatedata on a library-wide stoichiometric table.
Analytical Chemistry
E-Notebook serves as a repository for analytical data, and it alsoacts as a communication portal with which scientists and analystscommunicate with each other. Scientists can create and send service requests directly to an analyst with the click of a button.Paper is eliminated: when results are obtained, the analyst cansend the images and chromatograms directly back to the scientist's E-Notebook.
Process ChemistryThe objective of process research is to identify efficient processesfor the synthesis of active pharmaceutical agents at the scalerequired for clinical trials and commercial use. It is necessary toprovide precise descriptions of these processes so that they can beexecuted by different groups in different locations. It is alsorequired that such processes be compliant with Good LaboratoryPractices (GLP), Good Manufacturing Processes (GMP) and theFDA's 21 CFR Part 11 regulation. E-Notebook's process chemistrymodules are designed to support these dual workflow and regulatory compliance needs of process chemists.
• Chemical Synthesis, Scale-up and Analytical
• 37 CFR Electronic Signatures
• Service Requests and Discovery Workflow
Reaction Properties
PowerPoint Integration
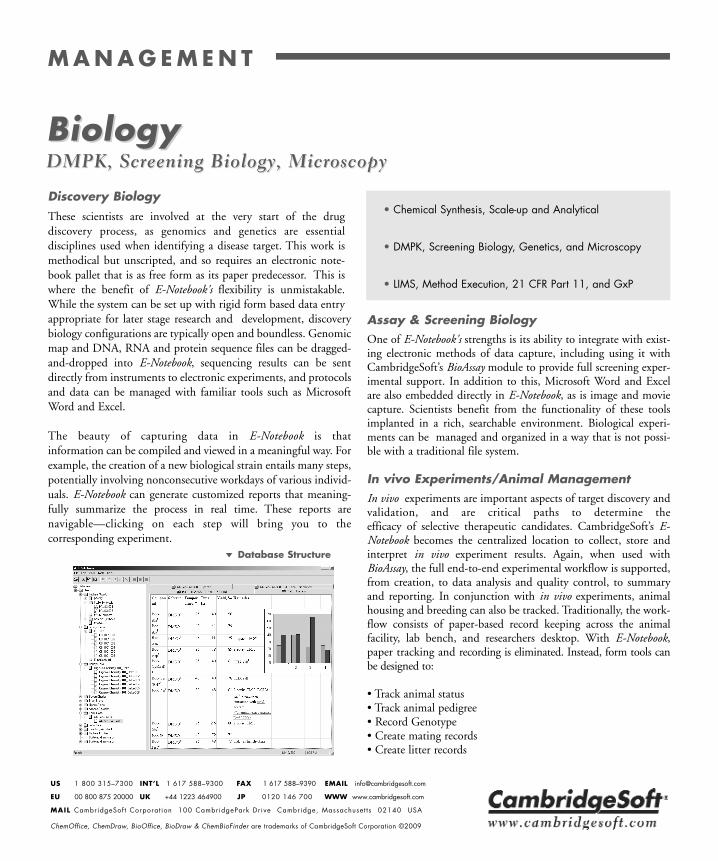
US 1 800 315–7300 INT’L 1 617 588–9300 FAX 1 617 588–9390 EMAIL [email protected]
EU 00 800 875 20000 UK +44 1223 464900 JP 0120 146 700 WWW www.cambridgesoft.com
MAIL CambridgeSof t Corporat ion 100 CambridgePark Dr ive Cambridge, Massachuset ts 02140 USA
ChemOffice, ChemDraw, BioOffice, BioDraw & ChemBioFinder are trademarks of CambridgeSoft Corporation ©2009
M A N A G E M E N T
BiologyBiologyDMPK, Screening Biology, MicroscopyDMPK, Screening Biology, Microscopy
Discovery BiologyThese scientists are involved at the very start of the drug discovery process, as genomics and genetics are essential disciplines used when identifying a disease target. This work ismethodical but unscripted, and so requires an electronic note-book pallet that is as free form as its paper predecessor. This iswhere the benefit of E-Notebook's flexibility is unmistakable.While the system can be set up with rigid form based data entryappropriate for later stage research and development, discoverybiology configurations are typically open and boundless. Genomicmap and DNA, RNA and protein sequence files can be dragged-and-dropped into E-Notebook, sequencing results can be sentdirectly from instruments to electronic experiments, and protocolsand data can be managed with familiar tools such as MicrosoftWord and Excel.
The beauty of capturing data in E-Notebook is that information can be compiled and viewed in a meaningful way. Forexample, the creation of a new biological strain entails many steps,potentially involving nonconsecutive workdays of various individ-uals. E-Notebook can generate customized reports that meaning-fully summarize the process in real time. These reports are navigable—clicking on each step will bring you to the corresponding experiment.
Assay & Screening BiologyOne of E-Notebook's strengths is its ability to integrate with exist-ing electronic methods of data capture, including using it withCambridgeSoft’s BioAssay module to provide full screening exper-imental support. In addition to this, Microsoft Word and Excelare also embedded directly in E-Notebook, as is image and moviecapture. Scientists benefit from the functionality of these toolsimplanted in a rich, searchable environment. Biological experi-ments can be managed and organized in a way that is not possi-ble with a traditional file system.
In vivo Experiments/Animal ManagementIn vivo experiments are important aspects of target discovery andvalidation, and are critical paths to determine the efficacy of selective therapeutic candidates. CambridgeSoft’s E-Notebook becomes the centralized location to collect, store andinterpret in vivo experiment results. Again, when used withBioAssay, the full end-to-end experimental workflow is supported,from creation, to data analysis and quality control, to summaryand reporting. In conjunction with in vivo experiments, animalhousing and breeding can also be tracked. Traditionally, the work-flow consists of paper-based record keeping across the animalfacility, lab bench, and researchers desktop. With E-Notebook,paper tracking and recording is eliminated. Instead, form tools canbe designed to:
• Track animal status• Track animal pedigree• Record Genotype• Create mating records • Create litter records
Database Structure
• Chemical Synthesis, Scale-up and Analytical
• DMPK, Screening Biology, Genetics, and Microscopy
• LIMS, Method Execution, 21 CFR Part 11, and GxP

US 1 800 315–7300 INT’L 1 617 588–9300 FAX 1 617 588–9390 EMAIL [email protected]
EU 00 800 875 20000 UK +44 1223 464900 JP 0120 146 700 WWW www.cambridgesoft.com
MAIL CambridgeSof t Corporat ion 100 CambridgePark Dr ive Cambridge, Massachuset ts 02140 USA
ChemOffice, ChemDraw, BioOffice, BioDraw & ChemBioFinder are trademarks of CambridgeSoft Corporation ©2009
K N O W L E D G E
Analytical Services &Analytical Services &Electronic JElectronic Journal and Record Keepingournal and Record Keeping
Formulation and ValidationE-Notebook's formulation module is designed to support the dualworkflows and regulatory compliance needs of formulation engi-neers. The flexibility allows any number of formulations to becreated, and security allows only designated administrators tocreate a new formulation.
Analytical & Quality ControlAnalytical and Quality Control Laboratories must execute definedprocedures to test material that may be administered during pre-clinical and clinical trials. This work must also be compliant withboth GxP and 21 CFR Part 11. Templates for standard analyticaltests are provided and analytical procedures are implemented asE-Notebook forms, which are easily designed and controlled.Equally important, E-Notebook provides workflow enforcementthat monitors data entry and ensures that the forms are complet-ed in sequence for proper method execution.
For example, rules can be configured such that the 'Day 3' formof a multi-day process will not accept any entries unless allrequired fields on the 'Day 2' form are first completed. The formscan contain automatic calculations to compute totals, averages,differences, and much more. E-Notebook can further streamlinethe procedure by allowing for electronic management of solutions,equipment, and other resources that are needed for experiments.
Drug MetabolismE-Notebook supports the DMPK laboratories in testing the metab-olism and longevity of compounds in various in vitro and in vivomodels. DMPK data capture needs can vary significantly, and theflexibility of the E-Notebook solution addresses this. For example,an in vivo enzyme induction test may create relatively smallamounts of data for which scientists utilize E-Notebook integra-tion with Microsoft Excel. Conversely, large quantities of data,such as those generated by in vitro enzyme inhibition studies, areoften collected and analyzed by applications such as BioAssay.Therefore, integration with BioAssay and Excel are fundamental toDMPK E-Notebook usage.
Pharmacokinetics (DMPK)There is a holistic approach to Drug Metabolism andPharmacokinetics. No single study describes the behavior of acompound; it is the combination of data from disparate experi-ments that represents the pharmacological profile for a com-pound. It is here where E-Notebook reveals one of its most signifi-cant capabilities: the reporting feature. E-Notebook reports areflexible: any field (e.g. compound ID, study type, etc.) can be usedto query the system and any field (e.g. conclusion, dose, etc.) orfield aggregate (e.g. average radioactivity) can be displayed in thereport. Reports are dynamic and navigable: results are displayedwith links that provide quick access to experiments.
Reports are viewed directly in the E-Notebook interface, but theycan also be exported to Microsoft Word or PDF to share withthose who do not have E-Notebook access.
Inventory Enterprise
• Service Request Workflow
• Sample Management
• Method Execution Framework
US 1 800 315–7300 INT’L 1 617 588–9300 FAX 1 617 588–9390 EMAIL [email protected]
EU 00 800 875 20000 UK +44 1223 464900 JP 0120 146 700 WWW www.cambridgesoft.com
MAIL CambridgeSof t Corporat ion 100 CambridgePark Dr ive Cambridge, Massachuset ts 02140 USA
ChemOffice, ChemDraw, BioOffice, BioDraw & ChemBioFinder are trademarks of CambridgeSoft Corporation ©2009
M A N A G E M E N T
Drug Safety / ToxicologyPaper notebooks have traditionally been considered to be therecord source for the entirety of an experiment, but they oftenmiss non-experimental information generated shortly after con-ception. For example, toxicology studies are often initiated notby the scientist who ultimately runs the experiment, but insteadby a manager or coordinator who assigns the study to the scien-tist. Important material related to this first step in the process,such as ideas, emails, and other communications are often left outof traditional paper notebooks. The E-Notebook toxicology work-flow addresses this concern: studies are first created by a manager,and subsequently assigned to the scientist for execution.
Compliance ExecutionE-Notebook is also useful for capturing the Standard OperatingProcedure (SOP) corresponding to the experiment. These docu-ments are often stored separately from the actual data, leading toerror and confusion, thus causing risk to the validity of the data.Storing and displaying procedures and other related documents inconcert with the data eliminates this risk and helps build perspec-tive on the study.
Sample Lifecycle ManagementE-Notebook can manage the entire sample lifecycle through tightintegration with Inventory. Sample lifecycle management is essen-tial for the registration, testing, evaluation, and reporting in vari-ous analytical and manufacturing stages. Manual tracking of sam-ples and test results is labor-intensive and time-consuming; andcompliance with GxP guidelines requires expensive manualaudits.
The controlled flexibility of CambridgeSoft’s E-Notebook is wellsuited for these detail and compliance-oriented environments. E-Notebook’s Sample Lifecycle Management module is compliantwith Good Laboratory Practices (GLP), Good ManufacturingProcesses (GMP) and 21 CFR Part 11.
Sample LoginE-Notebook is able to easily configure sample logins (registration ofsample, assignment of barcode label, and initiation of sampletracking) by incorporating CambridgeSoft’s Inventory application.Through E-Notebook, forms can be created to keep track of newlysynthesized or acquired compounds, tracking their physical prop-erties and tests, and assigning unique identifiers. New compoundsare entered directly via the E-Notebook form, and chemical, alongwith non-chemical, data is kept alongside the sample. When aproprietary compound is registered, if desired, it is compared foruniqueness via a configurable, stereoselective duplicate check andassigned a registry number.
Sample TrackingTracking samples, requesting analysis and establishing chain ofcustody can all be simply managed within the E-Notebook inter-face. E-Notebook serves as a repository for analytical data andexperiments, linking such data directly to the sample ID, and itacts as a communication portal with which scientists and analystscommunicate with each other during the service request lifecycle.Scientists create and send service requests directly to an analystwith the click of a button. Paper is eliminated: when results areobtained, the analyst can send the images and chromatogramsdirectly back to the scientist's E-Notebook (which appear in theperson's E-Notebook inbox, and are then accepted into the experi-ment if desired). To establish chain of custody, each step of sam-ple ownership is tracked, recorded and made compliant withFDA's 21 CFR Part 11.
• Track & Barcode Samples
• Create Any Report from Database
• Full Audit Trail
Sample ManagementSample ManagementCompliance Execution and Sample TCompliance Execution and Sample Trackingracking
US 1 800 315–7300 INT’L 1 617 588–9300 FAX 1 617 588–9390 EMAIL [email protected]
EU 00 800 875 20000 UK +44 1223 464900 JP 0120 146 700 WWW www.cambridgesoft.com
MAIL CambridgeSof t Corporat ion 100 CambridgePark Dr ive Cambridge, Massachuset ts 02140 USA
ChemOffice, ChemDraw, BioOffice, BioDraw & ChemBioFinder are trademarks of CambridgeSoft Corporation ©2009
L A B O R AT O RY
Workflow LIMS Automation
CambridgeSoft’s Workflow LIMS is a scientific data and workflow management tool for lab automation and in silicoexperimentation. Workflow LIMS eliminates the need for customprogramming by providing a visual experiment design and work-flow layout with built-in laboratory automation and analytics.
By using Workflow LIMS, researchers can connect their laboratory processes, instruments, and decision points in a conceptual manner that directly couples to instrumentation— forboth automation and data gathering—and provide real-time results. The Workflow LIMS solution enables ascientific team to design procedures, execute those procedures,
capture the results and integrate lab equipment to automate partor all of the process. Procedures typically revolve around lab activ-ities, but may also draw in decision support tools on a scientist'sdesktop, and queries/updates to databases.
Interactivity and Integrity
1. The modeling environment, Workshop Configuration Editor,in which the scientific team models the capabilities of the lab - forexample, the kind of basic processes which are available in the lab,and their inputs and outputs.2. The design environment, Workbench, in which researcherscreate workflows from these basic processes.3. The runtime Operations Manager, which manages the assign-ment of tasks to agents, tracks the progress of tasks and workflows,and manages the storage of captured data. 4. The agent tier, made up of a number of applications that han-dle specific types of task, either manually (through a user inter-face), or automatically (by driving equipment through a controlinterface or performing automated data processing). 5. The monitoring tier consists of a reporting tool thatprovides historical utilization information, and a live activity viewer that allows scientists to drill into individual workflows and samples.
Applied Technologies and Benefits
Workflow management enables discovery teams to rapidly trialnew procedures, capture best practices and scale successful designsfrom a manual prototype right up to a fully automated high-throughput lab. But discovery and research, by its very nature,demands that processes be flexible and that workflow executionrapidly adapt to new techniques and equipment.
Conventional laboratory information workflow applications can-not meet this requirement because of their heavyweight configu-ration needs, their lack of adaptability and the cost and complex-ity of integrating them with rapidly changing lab technology.Workflow LIMS addresses these problems by providing a visual,easy-to-use environment for describing processes and buildingworkflows out of those processes, enabling scientists to rapidlytrial new procedures, and by offering a rapid development tool kitfor equipment integration which supports gradual automation tominimize up-front costs and ongoing risk.
CambridgeSoft’s Workflow LIMS simplifies even manual lab pro-cedures by managing the breakdown of a procedure into tasks, andby automating the majority of data capture and transfer tasks; butby capturing process as well as data, Pathways reduces the costsand risks of implementing discovery techniques, and enables companies to accelerate the entire discovery process.
Workflow LIMS, Workflow LIMS, VVisual LIMS, Lab Automation,isual LIMS, Lab Automation,
• Service Request Workflow allows scientists to communicate as they work
• Direct Communication from E-Notebook to createtasks and send results
• Method Execution Framework to enable standard operation procedures and compliance

US 1 800 315–7300 INT’L 1 617 588–9300 FAX 1 617 588–9390 EMAIL [email protected]
EU 00 800 875 20000 UK +44 1223 464900 JP 0120 146 700 WWW www.cambridgesoft.com
MAIL CambridgeSof t Corporat ion 100 CambridgePark Dr ive Cambridge, Massachuset ts 02140 USA
ChemOffice, ChemDraw, BioOffice, BioDraw & ChemBioFinder are trademarks of CambridgeSoft Corporation ©2009
I N F O R M AT I C S
Compliant DBCompliant DB & Oracle Cartridge& Oracle CartridgeCompliant Storage and Chemical Data ManagementCompliant Storage and Chemical Data Management
Compliant DBCambridgeSoft’s Compliant DB is the industry's enterprise content management system developed by a large pharmaceuticalcompany. It serves as an electronic library that collects, organizes,warehouses, indexes and safely archives all your structured andunstructured electronic records. From raw data and laboratoryreports to compliance records, Compliant DB also will support anyof CambridgeSoft’s workflow solutions, including E-Notebook,BioAssay, and Inventory. As its name implies, Compliant DB is fully compliant with the requirements of 21 CFR Part 11 for electronic records and electronic signatures.
Compliant DB can be used directly over your company's intranet,extranet, or over the Internet with a simple web browser.Complaint DB gives your organization a secure, 21 CFR Part 11compliant centralized electronic library for all electronic data files.Not only can machine-readable instrument data files be stored,but also images, multimedia files, presentations, human-readableword processing and Adobe PDF documents, spreadsheets andhundreds of other formats. This data can serve as source data(instrument data to BioAssay), and also repository. AlthoughCompliant DB can operate as a stand-alone application, onlyCambridgeSoft provides fully-integrated Knowledge Managementand Enterprise Informatics applications integrated with compliantstorage. Compliant DB makes this possible.
Oracle Cartridge
The CambridgeSoft Oracle Cartridge is used by all ChemOfficeEnterprise applications for storing, searching, and analyzing chem-ical data. It can also be used in the development of your customOracle applications. Chemical structure and reaction data is diffi-cult to manipulate without utilizing special software, and Oracledata cartridges define new, recognized data types. CambridgeSoft’sOracle Cartridge utilizes this technology, making it possible tomanipulate chemical structure and reaction data from withinOracle, improving portability and consistency in applications.Since the Oracle Cartridge is accessed through native Oracle SQL,programmers can interact with chemical structure data directly inthe database.
The CambridgeSoft Oracle Cartridge supports CDX, CDXML,MolFile, MolFile v.3000, RXN and SMILES formats, making itflexible enough to be included with both new and legacy dataapplications, without the need for file conversion. Chemical infor-mation can originate from either ChemDraw or ISIS Draw, E-Notebook, Inventory, or Registration. Oracle Cartridge has extensivesupport for stereochemistry, relative stereochemistry, tautomersand structure normalization. There is also a built-in structure enu-merator (for nonspecific structures), basic property predictors,nomenclature algorithms (name=struct), and dynamic utilities formolecular file format conversions.
Workbench Sample
• Develop Centralized Validated Storage and GxP Compliant Storage
• Store Documents, Machine Files & Chemical Objects
• Oracle Cartridge is compatible with Linux, Solaris, AIX and Windows and includes structure searching, property predictions and nomenclature
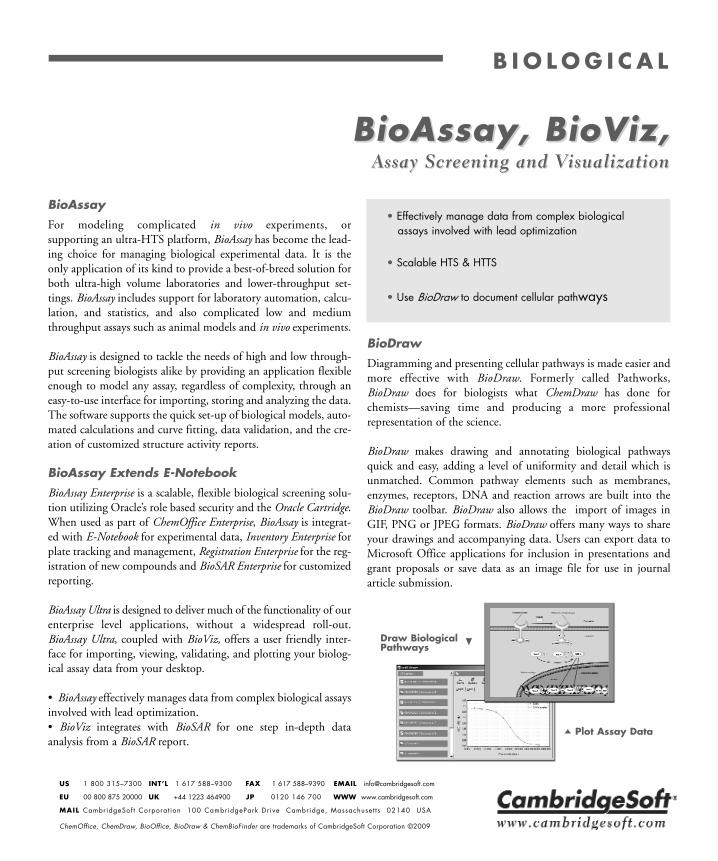
US 1 800 315–7300 INT’L 1 617 588–9300 FAX 1 617 588–9390 EMAIL [email protected]
EU 00 800 875 20000 UK +44 1223 464900 JP 0120 146 700 WWW www.cambridgesoft.com
MAIL CambridgeSof t Corporat ion 100 CambridgePark Dr ive Cambridge, Massachuset ts 02140 USA
ChemOffice, ChemDraw, BioOffice, BioDraw & ChemBioFinder are trademarks of CambridgeSoft Corporation ©2009
BioAssay, BioViz,BioAssay, BioViz,Assay Screening and VAssay Screening and Visualizationisualization
B I O L O G I C A L
BioAssayFor modeling complicated in vivo experiments, or supporting an ultra-HTS platform, BioAssay has become the lead-ing choice for managing biological experimental data. It is theonly application of its kind to provide a best-of-breed solution forboth ultra-high volume laboratories and lower-throughput set-tings. BioAssay includes support for laboratory automation, calcu-lation, and statistics, and also complicated low and mediumthroughput assays such as animal models and in vivo experiments.
BioAssay is designed to tackle the needs of high and low through-put screening biologists alike by providing an application flexibleenough to model any assay, regardless of complexity, through aneasy-to-use interface for importing, storing and analyzing the data.The software supports the quick set-up of biological models, auto-mated calculations and curve fitting, data validation, and the cre-ation of customized structure activity reports.
BioAssay Extends E-NotebookBioAssay Enterprise is a scalable, flexible biological screening solu-tion utilizing Oracle’s role based security and the Oracle Cartridge.When used as part of ChemOffice Enterprise, BioAssay is integrat-ed with E-Notebook for experimental data, Inventory Enterprise forplate tracking and management, Registration Enterprise for the reg-istration of new compounds and BioSAR Enterprise for customizedreporting.
BioAssay Ultra is designed to deliver much of the functionality of ourenterprise level applications, without a widespread roll-out.BioAssay Ultra, coupled with BioViz, offers a user friendly inter-face for importing, viewing, validating, and plotting your biolog-ical assay data from your desktop.
• BioAssay effectively manages data from complex biological assaysinvolved with lead optimization.• BioViz integrates with BioSAR for one step in-depth dataanalysis from a BioSAR report.
BioDrawDiagramming and presenting cellular pathways is made easier andmore effective with BioDraw. Formerly called Pathworks,BioDraw does for biologists what ChemDraw has done forchemists—saving time and producing a more professional representation of the science.
BioDraw makes drawing and annotating biological pathwaysquick and easy, adding a level of uniformity and detail which isunmatched. Common pathway elements such as membranes,enzymes, receptors, DNA and reaction arrows are built into theBioDraw toolbar. BioDraw also allows the import of images inGIF, PNG or JPEG formats. BioDraw offers many ways to shareyour drawings and accompanying data. Users can export data toMicrosoft Office applications for inclusion in presentations andgrant proposals or save data as an image file for use in journal article submission.
Draw BiologicalPathways
Plot Assay Data
• Effectively manage data from complex biological assays involved with lead optimization
• Scalable HTS & HTTS
• Use BioDraw to document cellular pathways

US 1 800 315–7300 INT’L 1 617 588–9300 FAX 1 617 588–9390 EMAIL [email protected]
EU 00 800 875 20000 UK +44 1223 464900 JP 0120 146 700 WWW www.cambridgesoft.com
MAIL CambridgeSof t Corporat ion 100 CambridgePark Dr ive Cambridge, Massachuset ts 02140 USA
ChemOffice, ChemDraw, BioOffice, BioDraw & ChemBioFinder are trademarks of CambridgeSoft Corporation ©2009
BioSAR & BioDrawBioSAR & BioDrawData Mining and PData Mining and Pathway Drawingathway Drawing
I N F O R M AT I C S
BioSARBioSAR Enterprise, a strategic must for any discovery organization interested in serious data mining, is a data dictionarydriven structure-activity analysis program. Users may chooseamong assays registered in the dictionary or search for assaysof interest.
The power of BioSAR lies in the researcher’s freedom fromdependence on IT support for dynamically working with all avail-able scientific data. For example, once an assay is registered intothe data-dictionary, it is automatically included in the powerfulanalysis framework. By reducing the time between question andanswer, BioSAR gives researchers the ability to explore new ideasand avoids this issue by placing SAR report creation in theresearcher’s control.
BioSAR Enterprise allows the researcher to create custom reportsand views of their data. You decide what is displayed, and BioSARtakes care of the rest.
While most SAR tools provide only a table-based interface,BioSAR provides both a form view and table view, and connects toBioViz for high-dimensional analysis. BioSAR merges the sophisti-cation of a powerful data catalog technique with knowledgegained through years of working closely with scientist users. Theresult is a SAR application that is as intuitive as it is powerful.Security within BioSAR Enterprise is highly granular; differentroles exist for administrators, publishers, and browsers.
Administrators may add assays to the data catalog engine, publish-ers may create reports and publish them, and browsers may usedata query and analysis. Most data mining tools provide a mech-anism to store queries, but the interface for creating queries is toocomplex. With BioSAR, each set of assays is a complete reportwith a query form, a view form, and a table view, combining theconvenience of a ChemFinder or ISIS application with the powerand flexibility of a data catalog-driven mining program.
• BioSAR is a catalog driven data-mining and structureactivity analysis program.• BioSAR provides both form and table views within asimple and powerful web interface.• BioDraw makes it easy to draw and annotate biological pathways including common elements such as mem-branes, enzymes, receptors and DNA.
BioVizBioViz with ChemFinder transforms the numbers in your databaseinto graphics on your screen. Retrieve or search for a set of com-pounds, choose the data you want to see, whether it is biologicaltest results in Oracle tables, physical property values calculatedautomatically or prices in a catalog, and BioViz will generate aninteractive window showing a scatterplot, histogram, or other useful data graphic.
The Plot Window, the key to data visualization in BioViz, is ableto show two variables plotted against each other in a scatterplotwith each point representing a structure from the current hit list.If you, for example, modify the list by performing a search, theplot updates to show the new set of points. You can drag a rectan-gle around a set of points to select them or zoom in to see them more closely.
• BioSAR is a catalog driven mining and structure-activity analysis program
• BioSAR provides both form and table views withina simple and powerful web interface
• BioViz provides one-step in-depth analysis of several variables
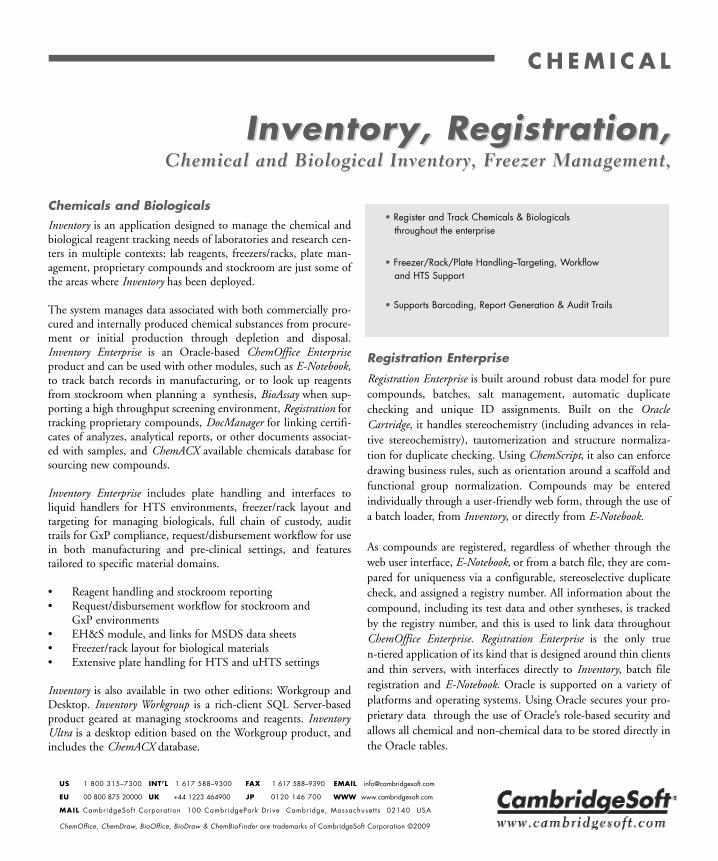
US 1 800 315–7300 INT’L 1 617 588–9300 FAX 1 617 588–9390 EMAIL [email protected]
EU 00 800 875 20000 UK +44 1223 464900 JP 0120 146 700 WWW www.cambridgesoft.com
MAIL CambridgeSof t Corporat ion 100 CambridgePark Dr ive Cambridge, Massachuset ts 02140 USA
ChemOffice, ChemDraw, BioOffice, BioDraw & ChemBioFinder are trademarks of CambridgeSoft Corporation ©2009
C H E M I C A L
Inventory, Inventory, Registration,Registration,Chemical and Biological Inventory, FChemical and Biological Inventory, Freezer Management,reezer Management,
Chemicals and BiologicalsInventory is an application designed to manage the chemical andbiological reagent tracking needs of laboratories and research cen-ters in multiple contexts: lab reagents, freezers/racks, plate man-agement, proprietary compounds and stockroom are just some ofthe areas where Inventory has been deployed.
The system manages data associated with both commercially pro-cured and internally produced chemical substances from procure-ment or initial production through depletion and disposal.Inventory Enterprise is an Oracle-based ChemOffice Enterpriseproduct and can be used with other modules, such as E-Notebook,to track batch records in manufacturing, or to look up reagentsfrom stockroom when planning a synthesis, BioAssay when sup-porting a high throughput screening environment, Registration fortracking proprietary compounds, DocManager for linking certifi-cates of analyzes, analytical reports, or other documents associat-ed with samples, and ChemACX available chemicals database forsourcing new compounds.
Inventory Enterprise includes plate handling and interfaces to liquid handlers for HTS environments, freezer/rack layout andtargeting for managing biologicals, full chain of custody, audittrails for GxP compliance, request/disbursement workflow for usein both manufacturing and pre-clinical settings, and features tailored to specific material domains.
• Reagent handling and stockroom reporting• Request/disbursement workflow for stockroom and
GxP environments• EH&S module, and links for MSDS data sheets• Freezer/rack layout for biological materials• Extensive plate handling for HTS and uHTS settings
Inventory is also available in two other editions: Workgroup andDesktop. Inventory Workgroup is a rich-client SQL Server-basedproduct geared at managing stockrooms and reagents. InventoryUltra is a desktop edition based on the Workgroup product, andincludes the ChemACX database.
Registration Enterprise
Registration Enterprise is built around robust data model for purecompounds, batches, salt management, automatic duplicatechecking and unique ID assignments. Built on the OracleCartridge, it handles stereochemistry (including advances in rela-tive stereochemistry), tautomerization and structure normaliza-tion for duplicate checking. Using ChemScript, it also can enforcedrawing business rules, such as orientation around a scaffold andfunctional group normalization. Compounds may be enteredindividually through a user-friendly web form, through the use ofa batch loader, from Inventory, or directly from E-Notebook.
As compounds are registered, regardless of whether through theweb user interface, E-Notebook, or from a batch file, they are com-pared for uniqueness via a configurable, stereoselective duplicatecheck, and assigned a registry number. All information about thecompound, including its test data and other syntheses, is trackedby the registry number, and this is used to link data throughoutChemOffice Enterprise. Registration Enterprise is the only true n-tiered application of its kind that is designed around thin clientsand thin servers, with interfaces directly to Inventory, batch fileregistration and E-Notebook. Oracle is supported on a variety of platforms and operating systems. Using Oracle secures your pro-prietary data through the use of Oracle’s role-based security andallows all chemical and non-chemical data to be stored directly inthe Oracle tables.
• Register and Track Chemicals & Biologicals throughout the enterprise
• Freezer/Rack/Plate Handling--Targeting, Workflow and HTS Support
• Supports Barcoding, Report Generation & Audit Trails

US 1 800 315–7300 INT’L 1 617 588–9300 FAX 1 617 588–9390 EMAIL [email protected]
EU 00 800 875 20000 UK +44 1223 464900 JP 0120 146 700 WWW www.cambridgesoft.com
MAIL CambridgeSof t Corporat ion 100 CambridgePark Dr ive Cambridge, Massachuset ts 02140 USA
ChemOffice, ChemDraw, BioOffice, BioDraw & ChemBioFinder are trademarks of CambridgeSoft Corporation ©2009
I N F O R M AT I C S
DocManager & ChemFinderDocManager & ChemFinderGxP, Registration and Enterprise InfrastructureGxP, Registration and Enterprise Infrastructure
Formulations & MixturesFormulation scientists face different challenges from those work-ing with individual molecules, yet many of the tools they areforced to use emerge from the drug discovery world, where single-molecule research is the norm. Take an essential task such as com-pound registration and you will find that most systems aredesigned for registration of single molecules, with little thoughtfor the world of formulations and mixtures. CambridgeSoft hasdeveloped a system specifically designed for this registration needcalled Formulations & Mixtures.
ChemFinder EnterpriseChemFinder Enterprise is a multiple-user system designed for siteswith comprehensive chemical and biological data needs.ChemFinder Enterprise contains its own engine for working withlocal and shared databases, and it is also delivered with theCambridgeSoft Oracle Cartridge, the powerful Oracle-hostedstructure engine based on ChemFinder search technology. The faceof ChemFinder Enterprise is the same friendly form-oriented inter-face as the desktop version, but underneath is a fast direct connec-tion to Oracle and the robust, scalable Oracle Cartridge runningon the server.
DocManager Enterprise• DocManager parses Microsoft Word, Excel and PowerPointdocuments, including free text and structures.• DocManager has a web based interface and a file dropfolder for quick submissions.• Oracle Cartridge is compatible with Linux, Solaris, AIX and Windows and includes structure searching, propertypredictions and nomenclature.
Web browser based, DocManager Enterprise extends the capabilityof standard search engines to include full free text searching andchemically intelligent structure searching of electronic documentsincluding Text, Microsoft Word, Excel, PowerPoint, and AdobePDF. The DocManager Enterprise interface allows users to easilysubmit documents through a series of simple-to-navigate webforms. When a new document is submitted, DocManager builds afree text index of the document, and extracts chemical informa-tion into a chemically-aware, substructure searchable database.Chemical information can originate from either ChemDraw orISIS Draw.
DocManager Enterprise includes a batch loading utility for admin-istration level users to load multiple documents at one time. Thesystem can be configured to submit a batch of documents as oneevent, or as a reoccurring submission to be executed daily. Theadministrator specifies a time for the submission to take place andthe location of the files. DocManager Enterprise utilizes the search-ing intelligence of the ChemOffice Enterprise suite.
Manage yourInventory
Index Documents
• DocManager parses Word, Excel and PowerPointdocuments, including free text and structures
• ChemFinder is tightly integrated with BioSAR, BioVizand Oracle
• Support for advanced form layout and design
US 1 800 315–7300 INT’L 1 617 588–9300 FAX 1 617 588–9390 EMAIL [email protected]
EU 00 800 875 20000 UK +44 1223 464900 JP 0120 146 700 WWW www.cambridgesoft.com
MAIL CambridgeSof t Corporat ion 100 CambridgePark Dr ive Cambridge, Massachuset ts 02140 USA
ChemOffice, ChemDraw, BioOffice, BioDraw & ChemBioFinder are trademarks of CambridgeSoft Corporation ©2009
M A N U FA C T U R I N G
Reference Standards,Reference Standards,Regulated Materials Management,Regulated Materials Management,
Inventory EnterpriseCambridgeSoft’s Inventory Enterprise application is designed tomanage the chemical, reagent, sample and compound trackingneeds of large multi-site chemical and pharmaceutical laboratories.Inventory Enterprise is an Oracle-based, ChemOffice Enterpriseproduct that is designed for multiple users with diverse containertypes, racks and multi-well plate formats.
Entities in the Inventory system include locations, containers andsubstances. A location is defined as any physical location where acontainer, plate or another location can be stored. An inventorycontainer represents a container capable of storing chemical sub-stances. An inventory substance represents a chemical compound,mixture, sample, etc. Inventory Enterprise manages an unlimitednumber of diverse locations, containers and substances.
Containers are created to represent the actual storage vessels usedby the organization. Each container is assigned a unique barcodeidentifier which can be printed, using customizable report tem-plates, from the Inventory interface. Updating the inventorybecomes as easy as scanning barcodes into the system and adjust-ing parameters for one or multiple containers. Users are able toorder, check-in/out, move, split and merge containers at will.Typicalcontainers include: ttles, vials, tubes, cylinders, boxes,racks, multi-well plates, etc.
Multi-well PlatesInventory Enterprise manages multi-well plate information. Inaddition to creating, storing, moving and deleting plates, theapplication allows users to create daughter plates, reformat platesand utilize plate maps. Inventory also supports user-interfaces ormachine-interfaces for these operations (including reading filesfrom liquid handler robots). Inventory Enterprise has the capabili-ty to import datafiles from other computer systems such as liquiddispensers/handlers, Microsoft Excel spreadsheets, etc. to accom-modate automated updating of information in the Inventory database.
SearchingEvery field in a record is searchable. The application includes anumber of specially designed inventory search forms. Searchresults are returned in list form and can be exported into a docu-ment (PDF, RTF, HTML) via the report engine.
Workflow SupportSupported user transactions include the ability to request, dispense, modify, duplicate, dispose, etc. entities throughout thesystem. These and other transactions are an integral part ofInventory workflows.
For example: a user logs-on, finds the substance(s) they’d like torequest and makes a request entry in the system; the request is ful-filled directly by changing the location the substance or by takingan aliquot and creating a new container of the substance. The newsubstance/container is also tracked in the system and inherits allof the critical properties of its parent container. If a quality con-trol test is run on the parent, then the results are viewable in the daughter’s properties.
The multi-select capability allows the user to select several con-tainers and perform a transaction on all of the selected containerssimultaneously, including check-in/out, move, retire, delete andupdate. For instance, if a request is made of the system that is fulfilled by another user (such as dispensing), the requester canautomatically receive e-mail notification of the progress. Likewise,users can be alerted to pending requests in the system.
• Request/Dispense/Reference Standard Materialsfrom Central Group to Sites
• Certification/Expiration/Certificate of Analysis of Containers and Aliquots
• Create/Manage Container History and Genealogy

US 1 800 315–7300 INT’L 1 617 588–9300 FAX 1 617 588–9390 EMAIL [email protected]
EU 00 800 875 20000 UK +44 1223 464900 JP 0120 146 700 WWW www.cambridgesoft.com
MAIL CambridgeSof t Corporat ion 100 CambridgePark Dr ive Cambridge, Massachuset ts 02140 USA
ChemOffice, ChemDraw, BioOffice, BioDraw & ChemBioFinder are trademarks of CambridgeSoft Corporation ©2009
I N F O R M AT I C S
Inventory & GxPInventory & GxPDocument Storage, Batch RecordsDocument Storage, Batch Records
Conflict ResolutionThe Conflict Resolution processes flags and corrects duplicates in the system automatically. You may also search forduplicates at any time. If a conflict is found, the screen identifies the conflicting field(s) by highlighting it in red. The userhas the option to select the existing substance and edit the con-flicting substance or create a duplicate substance and resolve theconflict later.
Printed Reports & LabelsThe Inventory interface allows for printing labels and can generateelaborate reports. Inventory Desktop and Workgroup use a reportengine that incorporates wizards that allow for the quick creationof simple report/label templates that can be shared across anorganization. A user has the ability to design a label based on tem-plates for a number of commercially available label sheets (e.g.Avery Dennison). The Inventory manager makes extensive use ofbarcodes and web-based user interfaces to speed use, but substan-tial gains come in the automated reporting and alerting. Examplesinclude notifying all users of samples derived from a single stan-dard of some change in status, such as different analytical resultsor failure to recertify.
Electronic Data FilesIn addition to storing, moving and disposing containers, theapplication allows users to reformat plates and create daughterplates as well as integrate with liquid dispensers/ handlers for platereformatting from pipette log files.
ComplianceHandling FDA regulations in an organization is an area that lendsitself to automation. Thus, systems must be carefully implement-ed in order to meet the letter and spirit of FDA guidelines.Underlying the system are the controls expected by systems in reg-ulated environments: audit tables, security and validated develop-ment methods. All transactions on all containers in the system aretracked and audits are customizable for simple presentation.
Document ManagementTo manage the myriad of documents that get generated in researchand regulated environments, CambridgeSoft stores documentssecurely in Oracle where they are indexed (by chemistry and text)and managed by database security. Storing the associated docu-ments in Oracle preserves system integrity such that you can back-up to a known point, and be assured that the documents and dataare entirely in sync with each other. It also provides tight docu-ment security, reduces IT overhead associated with file shares andattaches directly to Inventory containers.
Inventory Enterprise
• Validated for GxP Environments with Audit Trails, Container History
• Store Datafiles with Samples such as Batch andCertificates of Analysis
• Allows for Flexible Reporting

US 1 800 315–7300 INT’L 1 617 588–9300 FAX 1 617 588–9390 EMAIL [email protected]
EU 00 800 875 20000 UK +44 1223 464900 JP 0120 146 700 WWW www.cambridgesoft.com
MAIL CambridgeSof t Corporat ion 100 CambridgePark Dr ive Cambridge, Massachuset ts 02140 USA
ChemOffice, ChemDraw, BioOffice, BioDraw & ChemBioFinder are trademarks of CambridgeSoft Corporation ©2009
D E S K T O P

US 1 800 315–7300 INT’L 1 617 588–9300 FAX 1 617 588–9390 EMAIL [email protected]
EU 00 800 875 20000 UK +44 1223 464900 JP 0120 146 700 WWW www.cambridgesoft.com
MAIL CambridgeSof t Corporat ion 100 CambridgePark Dr ive Cambridge, Massachuset ts 02140 USA
ChemOffice, ChemDraw, BioOffice, BioDraw & ChemBioFinder are trademarks of CambridgeSoft Corporation ©2009
S O F T WA R E
Chem & Bio OfficeChem & Bio OfficeSoftware Standard for ScientistsSoftware Standard for Scientists
Chem & Bio Office is a powerful suite of software, consisting of ChemDraw, Chem3D, ChemFinder and ChemACXfor chemists, BioDraw, BioAssay and BioViz for biologists and Inventory and E-Notebook for all types of scientists. Chem &Bio Office is available for Microsoft Windows.
Chem & Bio Draw includes Struct=Name, ChemDraw/Excel and ChemNMR, BioDraw, a biological sequence tool,hotlinks to 3D structures, Stoichiometry grid, live linked chemical property calculations, a TLC plate tool and more. TheChemDraw ActiveX/Plugin adds chemical intelligence to your browser for querying databases and displaying information.
ChemBio3D provides state-of-the art visualization and display of protein structures, molecular surfaces, molecularorbitals, electrostatic potentials, charge densities and spin densities. Chem3D provides basic computational tools such as 3DMolecular Overlay and Dihedral Driver and utilizes MOPAC, Jaguar, Gaussian, GAMESS and extended Hückel to com-pute molecular properties. ChemProp computes Connolly surface areas, molecular volumes and properties, including ClogP,molar refractivity, critical temperature and pressure.
ChemFinder is a chemically intelligent database manager and search engine. ChemFinder provides support for a databasesearching, compound profiling, R-Group Analysis, subforms, tight integration with ChemDraw/Excel and Combichem/Excel,statistical analysis and visualization through BioViz all in a friendly form-based environment. ChemFinder/Office searchesdocuments, spreadsheets, and files for chemical structures and references. ChemFinder/Oracle provides enterprise solutionintegration.
BioOffice is the ultimate suite for management, analysis and visualization of biological data using BioDraw for drawingpathways and BioAssay, BioFinder and BioViz for data analysis. Includes Bio3D, Draw/Excel, CombiChem/Excel, Inventory andE-Notebook.
BioDraw provides support for biological pathway drawing and annotation. A wide variety of customizable drawing toolsare available, including membranes, DNA, enzymes, receptors, tRNA, ribosomes, and a plasmid map tool.
BioAssay manages both high and low throughput biological screening data. Designed for complex lead optimizationexperiments, the software supports the quick set-up of biological models.
BioViz offers automated statistical analysis, curve fitting, and customized structure activity reports, including a user-friendlyinterface for importing, viewing, validating and plotting chemical and biological data.
Inventory manages your reagent and biological tracking needs. Using MSDE as the desktop database, you organize, storeand search over your inventory. Inventory integrates with the ChemACX database of available chemicals and ChemMSDXsafety data providing chemical sourcing and purchasing.
E-Notebook is an efficient, accurate way to write notebooks. It stores Microsoft Office documents, ChemDraw structures and reaction drawings, and related data in a notebook searchable by text or chemical structure. Organize pages by project, experiment or in your own style. Use CombiChem/Excel to build libraries.
Databases include ChemINDEX, including the NCI and AIDS databases. The ChemACX database contains nearly 400catalogs from leading suppliers and ChemMSDX Database contains over 20,000 material safety data sheets for commonlyused laboratory chemicals.
The standardachieves the
ultimate
Computationalchemistry made easy
Screening data
The ultimatesoftware suite
for scientists
Handle reagentracking
Efficient notebook keeping
Access info with ease
Draw pathways
Visualize data
Desktop to enterprise searching
Ultimate suite for biologists

US 1 800 315–7300 INT’L 1 617 588–9300 FAX 1 617 588–9390 EMAIL [email protected]
EU 00 800 875 20000 UK +44 1223 464900 JP 0120 146 700 WWW www.cambridgesoft.com
MAIL CambridgeSof t Corporat ion 100 CambridgePark Dr ive Cambridge, Massachuset ts 02140 USA
ChemOffice, ChemDraw, BioOffice, BioDraw & ChemBioFinder are trademarks of CambridgeSoft Corporation ©2009
ChemDraw, Chem3D,ChemDraw, Chem3D,Structure Drawing and Molecular Modeling Structure Drawing and Molecular Modeling
ChemBioDraw Ultra adds BioDraw, ChemFinder, BioVizand E-Notebook to ChemDraw Ultra. Easily draw and annotatepublication quality biological pathway illustrations with theBioDraw tools. The combination of the BioDraw tools withChemDraw and E-Notebook creates an excellent environment forsmooth communication between Chemists and Biologists.
ChemDraw Ultra adds Struct=Name, ChemDraw/ Excel,ChemNMR, Stoichiometry Grid, CLogP, tPSA as well as the addedcapabilities of Chem3D Pro and ChemFinder Std to theChemDraw Pro application. With rich polymer notation, gener-ic structure expansion, fragmentation tools, and a modern userinterface, ChemDraw is more powerful than ever before. Createtables of structures, identify and label stereochemistry, estimateNMR spectra from ChemDraw structures, obtain structures fromchemical names, assign names from structures, and create multi-page documents and posters.
ChemDraw Pro will boost your productivity more than ever.Draw quality publications with structures, reactions, chemicalqueries, polymers, relative stereochemistry, generic structures,TLC plate depictions and a biological sequence tool. Publish onthe web using the ChemDraw Plug-in. Create precise databasequeries by specifying atom and bond properties and stereochem-istry. Display spectra, structures and annotations on the same page
Struct=Name contains the leading comprehensive methods for converting chemical structures into chemical namesand names to structures. It can be used for many types of com-pounds, including charged compounds and salts, highly symmet-ric structures and many other types of inorganic andorganometallics. Struct=Name is available in two forms: a batchapplication, and an interactive version that is also available inChemDraw Ultra.
ChemDraw/Excel allows the user to create chemicallyknowledgeable spreadsheets within the familiar Microsoft Excelenvironment. You can build and manipulate chemical structures,compute chemical properties and perform database searches.
ChemNMR can be used to accurately estimate 13C and 1Hchemical shifts. The structure and the spectrum appear with thechemical shifts displayed on the molecule and the spectrum islinked to the structure so that clicking on a peak in the spectrumhighlights the corresponding fragment on the molecule.
ChemBio3D Ultra includes visualization and molecular mod-eling capabilities for both small molecules and protein structuresdesigned for the bench chemist. Small molecule computationalmethods include Molecular Overlay and Dihedral Driver. It alsoincludes interfaces to the MOPAC, Jaguar, Gaussian andGAMESS semi-empirical and ab initio computational packages.High quality Chem3D graphics can be viewed on the web usingthe Chem3D ActiveX.
Chem3D Pro brings workstation quality molecular visualiza-tion and display to your desktop. Convert ChemDraw andISIS/Draw sketches into 3D models. View molecular surfaces,orbitals, electrostatic potentials, charge densities and spin densi-ties. Use built-in extended Hückel to compute partial atomiccharges. Use MM2 to perform rapid energy minimization andmolecular dynamics simulations. Chem3D can also be used to estimate physical properties such as logP, boiling point, meltingpoint and more. Visualize Connolly surface areas and molecular volumes.
• ChemDraw’s improved Struct=Name feature producesnames for more types of compounds
• Live ChemDraw window embedded in Chem3D applicationallows simultaneous 2D and 3D editing
• Chem3D brings workstation-quality molecular graphics andrigorous computational methods to your desktop
D E S K T O P

US 1 800 315–7300 INT’L 1 617 588–9300 FAX 1 617 588–9390 EMAIL [email protected]
EU 00 800 875 20000 UK +44 1223 464900 JP 0120 146 700 WWW www.cambridgesoft.com
MAIL CambridgeSof t Corporat ion 100 CambridgePark Dr ive Cambridge, Massachuset ts 02140 USA
ChemOffice, ChemDraw, BioOffice, BioDraw & ChemBioFinder are trademarks of CambridgeSoft Corporation ©2009
ChemFinder & ChemInfoChemFinder & ChemInfoStructure Searching and Scientific DatabasesStructure Searching and Scientific Databases
ChemFinder Ultra is a chemically intelligent database man-agement and search system designed for chemical and biologicaldata. ChemFinder Ultra can be used with local (MSDE) or shared(Oracle) databases. Either way, the face of ChemFinder is thesame friendly form-oriented interface. BioViz, included inChemFinder Ultra, provides data visualization features to helpthe user understand relationships between biological data andchemical structures. These features allow you to plot structuraland biological data in a variety of styles, perform statistical analy-sis, filter plots based on your criteria, highlight intersecting sets onplots, generate histograms of data distributions, and more.
BioViz, included in ChemFinder Ultra, provides statistical analysisand visualization tools for structural and biological data. BioViztransforms ChemFinder database information into easy to under-stand graphics, allowing users to discern structure-activity rela-tionships more easily. With BioViz it is easy to retrieve a set ofcompounds using filters or searching capabilities; and generate aninteractive window showing a wide variety of useful graphicalinformation.
ChemFinder Pro is a fast, chemically intelligent, relationaldatabase search engine for the Desktop. The integration withMicrosoft Excel and Word adds chemical searching and databasecapability to spreadsheets and documents. Compatibility withMDL ISIS databases is provided by SDfile and RDfileimport/export.
ChemACX Database includes over 1 million chemicalproducts available for purchase from 472 supplier catalogs, search-able with a single query by structure, substructure, name, syonym,partial name, and other text and numeric criteria.
ChemMSDX Database provides material safety datasheetsand is integrated into ChemACX, and contains over 23,000Material Safety Data Sheets (MSDS) in PDF format.
ChemINDEX Database includes 100,000 chemicals, publicNCI compounds, AIDS data and more.
NCI Database contains over 200,000 compounds with anti-cancer drug dose-response data.
AIDS Database is an NCI compiled database for AIDS anti-viral compounds.
ChemRXN Database is a collection of 30,000 fully atom-mapped reactions selected and refined from chemical literature. Italso includes reactions from InfoChem’s ChemSelect database andISI’s ChemPrep database.
ChemBioFinder.Com is the award-winning web site with-in formation and WWW links for over 100,000 chemicals. Users can search by name or partial name, view struc-ture drawings, or use the ChemDraw ActiveX/Plugin for structureand substructure searches.
Estimate Spectra
Molecular Modeling
• ChemFinder offers improved searching and hit list management,
along with new property generation
• ChemFinder is tightly integrated with CambridgeSoft's
Oracle Cartridge
• Search ChemACX and other CambridgeSoft
S O F T WA R E

US 1 800 315–7300 INT’L 1 617 588–9300 FAX 1 617 588–9390 EMAIL [email protected]
EU 00 800 875 20000 UK +44 1223 464900 JP 0120 146 700 WWW www.cambridgesoft.com
MAIL CambridgeSof t Corporat ion 100 CambridgePark Dr ive Cambridge, Massachuset ts 02140 USA
ChemOffice, ChemDraw, BioOffice, BioDraw & ChemBioFinder are trademarks of CambridgeSoft Corporation ©2009
D E S K T O P
BioAssay, BioViz, BioDraw,BioAssay, BioViz, BioDraw,Biological Assay, VBiological Assay, Visualization and Pisualization and Pathwaysathways
BioAssay UltraBioAssay Ultra, the cornerstone of BioOffice, provides flexiblestorge, retrieval and analysis of biological data. BioAssayeasily manages both high and low throughput biological screeningdata.
Designed for complex lead optimization experiments, the soft-ware supports quick set-up of biological protocols, automatedcalculations and curve fitting, and the creation of customizedstructure activity reports. BioAssay brings all of this functionalityto your desktop. BioAssay Ultra, compatible with the MSDEdatabase, offers a user-friendly interface for importing, viewing,validating and plotting your biological assay data.
BioVizCombining biological data with chemical structures is of theutmost importance in any drug discovery environment. BioVizallows you to visually analyze and perform statistical analysis onstructure-related data combined with biological data inChemFinder.
Users can search over structural and biological data and construct various plots such as scatterplots or histograms. Theplots are interactive; allowing you to select subsets of your data,perform statistical analysis, filter plots based on your criteria,highlight lists and intersecting sets on plots, generate histogramsof data distributions and more.
BioDrawReporting on and presenting findings is a task familiar to everybiologist. Making this process easier and more effective benefitseveryone involved. BioDraw is doing for biologists whatChemDraw has done for chemists for years—saving time, andresulting in a more professional representation of the science.BioDraw makes drawing and annotating biological pathwaysquick and easy, adding a level of uniformity and detail which isunmatched. Typical drawings of biological pathways include
many elements that are difficult to draw with the standard presen-tation and word processing software. Common pathway elementssuch as membranes, enzymes, receptors, DNA, tRNA and plas-mid maps are built into the BioDraw toolbar. BioDraw is builtinto the same backbone as ChemDraw, allowing users to takeadvantage of the wide variety of the publishing capabilities avail-able in ChemDraw such as the ability to import and export imagesin GIF, PNG or JPEG formats. In addition, the integration ofChemDraw and BioDraw in Chem & Bio Draw application pro-vides a great communication mechanism between chemists andbiologists.
Data Visualization
Notebook Pages
• BioAssay offers flexible storage, retrieval and analysis of
biological data
• BioViz provides statistical analysis and graphical representations
of the data loaded into a ChemFinder form
• BioDraw allows for quick and easy drawing and annotation
of biological pathway depictions.

US 1 800 315–7300 INT’L 1 617 588–9300 FAX 1 617 588–9390 EMAIL [email protected]
EU 00 800 875 20000 UK +44 1223 464900 JP 0120 146 700 WWW www.cambridgesoft.com
MAIL CambridgeSof t Corporat ion 100 CambridgePark Dr ive Cambridge, Massachuset ts 02140 USA
ChemOffice, ChemDraw, BioOffice, BioDraw & ChemBioFinder are trademarks of CambridgeSoft Corporation ©2009
S O F T WA R E
Inventory & E-NotebookInventory & E-NotebookMaterials Management and Electronic JMaterials Management and Electronic Journalournal
Inventory UltraInventory Ultra allows users to manage the tracking needs ofchemical and non-chemical inventory data for laboratories andresearch centers. The system manages data associated with bothcommercially procured and internally produced chemical sub-stances from their procurement or initial production throughtheir depletion and disposal. Inventory Ultra is an MSDE basedproduct and includes the ChemACX database with over 450 cat-alogs of chemical reagents.
The three primary entities in an Inventory system are locations, containers and substances. Users or administrators con-figure a network of locations, which represent locations within anorganization. Containers are created to represent actual containersin your facility. Each container is assigned a unique barcode,which can be printed using a customized template from theInventory interface.
Each container stores a substance. Additional text fields are avail-able to track other chemical contents such as the solvent. Customfields may also be defined. To keep track of substances the systemmaintains its own internal chemical structure database containingunique substances that can be associated with inventory contain-ers. Advanced duplicate checking is incorporated in the system.Every field in a record, including the chemical structure, molecu-lar formula and molecular weight are searchable.
The application includes a number of specially designed invento-ry search forms. Search results are returned in list form and can beexported into a document (PDF, RTF, HTML) using the reportengine. The Inventory interface allows for printing labels as well asgenerating reports. Inventory uses a report application that incor-porates wizards that allow for the quick creation of simple reportsand label templates that can be shared across an organization.
Inventory ProInventory Pro contains the same features as CambridgeSoft’sInventory Ultra application, except without CambridgeSoft’sChemACX database.
E-Notebook UltraE-Notebook Ultra is an efficient, accurate way to store lab note-book information. It stores Microsoft Office documents,ChemDraw structures, reaction drawings and related data in anelectronic notebook that is searchable by text or chemical struc-ture. You can organize pages by project, experiment or in yourown style with the MSDE database. CombiChem/Excel buildscombinatorial libraries. E-Notebook is configured exactly like achemist would like his or her own notebook to be. Reactions canbe easily drawn into the reaction template by either selecting fromthe generous list of preloaded reagents or by entering or drawingone’s own chemicals. Commonly used reagents can be stored in a separate folder for easy access. Another fantastic feature is the pro-cedural section. This section contains pre-written procedural sen-tences with the ability to easily drop in the specific names ofreagent chemicals present in the reaction. One can also easily addother data to the notebook page such as spectra and MicrosoftWord or Excel documents.
CombiChem/ExcelCambridgeSoft provides you with the tools to effectively plancombinatorial chemistry experiments in Excel. TheCombiChem/Excel add-in introduces additional functionality forhandling combinatorial chemistry. Users can generate productsfrom a reaction and lists of reagents, you can view all the productsarising from a given reagent or all the reagents of a given product,and you can lay out reagent and reaction plates.
• Inventory manages the chemical and reagent tracking needsof laboratories and research centers
• Inventory maintains its own internal chemical structure databasewith advanced duplicate checking
• E-Notebook stores Microsoft Office documents, ChemDrawstructures, reaction drawings and related data in a convenient,searchable format

US 1 800 315–7300 INT’L 1 617 588–9300 FAX 1 617 588–9390 EMAIL [email protected]
EU 00 800 875 20000 UK +44 1223 464900 JP 0120 146 700 WWW www.cambridgesoft.com
MAIL CambridgeSof t Corporat ion 100 CambridgePark Dr ive Cambridge, Massachuset ts 02140 USA
ChemOffice, ChemDraw, BioOffice, BioDraw & ChemBioFinder are trademarks of CambridgeSoft Corporation ©2009
S C I E N T I F I C
The Merck Index, NCI, AIDS,The Merck Index, NCI, AIDS,Scientific Reference, Chemical Reactions and PScientific Reference, Chemical Reactions and Patentsatents
ChemBioFinder GatewayChemBioFinder Gateway allows searching of the completeCambridgeSoft reference collection of databases with a single query. Search such databases as The Merck Index, R&DInsight for Chemists and Traditional Chinese Medicines with onlyone click of a search button. All results federate back to the spe-cific databases for complete information.
The Merck IndexKnown for its integrity, detail, and longevity, The Merck Indexcontains over 10,000 monographs on drugs, chemicals and otherbiologically active molecules. Each monograph contains informa-tion on the compound and its derivatives; common, trade, andsystematic names; trademarks and associated companies; CASRegistry Numbers, physical and toxicity data, therapeutic andcommercial uses, literature citations, as well as chemical strucures,formulas andmolecular weights. The electronic versions includearchived monographs from previous editions and is updated twice a year.
R&D Insight/ChemistsInformation on current drug products under development isessential for those working in research and development, licensingand marketing at pharmaceutical and healthcare institutions.R&D Insight for Chemists, a collaborative product from WoltersKluwer Health and CambridgeSoft, combines the power of chem-ical structure searching with a wealth of drug development data togive subscribers a competitive edge when making decisions rele-vant to the direction of their research. Updated weekly, users cansearch the collection of over 20,000 compounds by structure, substructure, names, partial names and synonyms.
Patent DatabaseResearchers, chemists and patent analysts are now able to easilysearch full text patents for chemical structures usingCambridgeSoft's powerful search and analysis tools. The newCambridgeSoft Patent Database portal, co-developed byCambridgeSoft and Reel Two, will give users access to all thechemical compounds named in a patent, and enable them tosearch by structure, keyword or chemical name.
Traditional Chinese MedicinesAccess to this wealth of knowledge is now available with theTraditional Chinese Medicines database. The database consists ofmonographs for 10,458 chemicals isolated from 4,625 naturalsources used in traditional Chinese remedies. The monographsfeature bio-activity data for many of the compounds, effects andindications of the medicines, English, Latin, and Chinese namesfor the natural sources, and over 2,000 references.
ChemINDEX, NCI AIDS & CancerScientists have used the award-winning ChemFinder.Com databasesince 1995. Now, the data on ChemFinder.Com is integrated intoChemOffice as ChemINDEX. ChemINDEX contains data fromover 75,000 compounds including structures, names and synonyms, physical properties and Internet links. Additionally,three informative databases have been integrated into one power-ful application with the NCI and AIDS database, a collection ofover 200,000 molecules studied by the National Cancer Institute.
ChemReact and ChemSynth These reaction database collections from InfoChem GmbH com-prising essential information on chemical reactions published inthe literature between 1974 and 2001. The largest isChemReact500, with almost 500,000 reactions selected with aneye toward synthetic utility. ChemSynth is a subset of the reac-tions found in ChemReact500 chosen because they have greaterthan 50% yield and have been sited in leading journals more thanonce. ChemReact68 has 68,000 reactions that have greater than50% yield and have appeared in more than five example reactions.
• The Merck Index offers encyclopedic reference for over 10,000chemicals, drugs and biological agents
• R&D Insight for Chemists has information on more than 20,000drug products in various stages of development world-widefrom over 1,700 sources.
• All databases are updated, contain information unavailable inprint, and are searchable by structure, as well as text and numeric range by structure, as well as text and numeric range

US 1 800 315–7300 INT’L 1 617 588–9300 FAX 1 617 588–9390 EMAIL [email protected]
EU 00 800 875 20000 UK +44 1223 464900 JP 0120 146 700 WWW www.cambridgesoft.com
MAIL CambridgeSof t Corporat ion 100 CambridgePark Dr ive Cambridge, Massachuset ts 02140 USA
ChemOffice, ChemDraw, BioOffice, BioDraw & ChemBioFinder are trademarks of CambridgeSoft Corporation ©2009
D ATA B A S E S
ChemACX & Sigma-Aldrich MSDSChemACX & Sigma-Aldrich MSDSAAvailable Chemicals and Material Safety Data Sheetsvailable Chemicals and Material Safety Data Sheets
ChemACX DatabaseSifting through chemical catalogs is a poor use of time for anyresearcher. ChemACX database solves this problem by offering acomplete tool for research chemical sourcing and purchasing.With an emphasis on up-to-date information of high quality,ChemACX allows you to purchase chemicals fast, efficiently andwithout worry or cumbersome paper catalogs. The database canbe accessed from both desktop and enterprise environments andboasts nearly 500 catalogs from major suppliers, from Alfa Aesarand Aldrich, to TCI and Zeneca, with hundreds in between.
Sigma-Aldrich MSDSEnvironmental, Heath and Safety (EH&S) is an important com-ponent of today’s research institutions. A key document that aidsin the management of EH&S tasks is the Material Safety DataSheet, also commonly referred to as MSDS. In every organization,there are several groups of personnel who require access toMSDSs. Everyone who comes into contact with chemicals needs
to be aware of their proper handling, storage, disposal and emer-gency procedures. Helping to fulfill these diverse needs is theSigma-Aldrich MSDS collection. The database contains over130,000 MSDSs for the products of the Sigma-Aldrich family ofcatalogs (Sigma, Aldrich, Fluka, Supelco, Riedel-de Haën) inHTML format. With a click of a hyperlink, users will be able toview the Sigma-Aldrich MSDS in their preferred browser. Thisinformation is smoothly integrated with the ChemACXdatabase and other enterprise applications.
Drugs: Synonyms and PropertiesDrugs: Synonyms and Properties from Ashgate, provides compre-hensive coverage of the 8,000 drugs currently in common useworldwide. A key component of this reference is the extensive cov-erage given to synonyms. The electronic version adds almost70,000 synonyms and trade names that did not fit into the printversion. This information is also available as an SD file to facilitate in silico research.
Nanogen IndexThe Nanogen Index contains data on over 1,000 pesticides andother environmental contaminants. The database is the up-to-dateand authoritative source for information on all pesticides and agri-cultural chemicals in world wide use, those which are currentlyunder development in R&D pipelines, and compounds whichwere once marketed or reached a development status. Data fieldsinclude chemical structures and SMILES strings, names (CAS,IUPAC, trade), the various registration codes assigned to the com-pounds (RTECS, EINECS/ELINCS, CAS, US EPA, CA DPR,Tarrifs, etc.), Hazard and Safety codes, the developing companyand use.
• ChemACX is fully structure searchable with more than 1 million products from nearly 500 catalogs
• ChemACX and the Sigma-Aldrich MSDS are updated semi-annually to meet the needs of scientists
• Search by name, synonym, partial name, formula, and other criteria

US 1 800 315–7300 INT’L 1 617 588–9300 FAX 1 617 588–9390 EMAIL [email protected]
EU 00 800 875 20000 UK +44 1223 464900 JP 0120 146 700 WWW www.cambridgesoft.com
MAIL CambridgeSof t Corporat ion 100 CambridgePark Dr ive Cambridge, Massachuset ts 02140 USA
ChemOffice, ChemDraw, BioOffice, BioDraw & ChemBioFinder are trademarks of CambridgeSoft Corporation ©2009
P R O F E S S I O N A L
Development, Deployment, Development, Deployment, Custom Development and System DeploymentCustom Development and System Deployment
When processes and technologies are disjointed, organizations loseefficiency and decision making capability. Our ProfessionalServices use technology to bring business processes together,integrate systems and assist with strategic informatics planning.
Informatics Planning Strategic and Operational PlanningA formal review of the discovery and development process andhuman/system interfaces is mapped to form the basis of aroadmap for successful technology utilization. • Analysis of the current laboratory and technology workflows• An analysis of the current state of the science technology environment, including architecture/operational processes• A view of strategic goals and the barriers to achievement• The delivery of a phased technology transition planRequirements Analysis & Proof of ConceptWith years of experience meeting the needs of the scientific com-munity, CambridgeSoft understands the user. The prototypingprocess allows definition and testing of the functional and techni-cal feasibility of potential technology solutions. The process pro-vides a baseline for the future development and deployment of atailored solution. Users gain valuable first-hand knowledge inexperiencing how the system can help achieve individual andworkgroup goals. Legacy System MigrationLegacy systems, with private data structures and architecture, canbe barriers for migrating systems to new technologies. Our con-sultants have significant experience with these systems and cansuccessfully migrate chemical and biologial data, business work-flow, and other aspects of legacy informatics technologies. 21 CFR Part 11 Compliance and GxP ValidationAs an integral part in creating 21 CFR Part 11 and GxP validated applications, CambridgeSoft offers services to:• Audit the software and process• Create conforming systems design specifications• Create IQ/OQ/PQ documentation• Generate test plans and validation matrices• Insure systems compliance with functional guidelines
Product DevelopmentDevelopment ConsultingWith custom development, CambridgeSoft works collaboratively withyour team to create a system that meets your needs, while execut-ing our quality driven software development process. We meetyour needs, on time and within budget, without surprises.Systems IntegrationProcess improvement often requires integrating systems designedfor focused areas of work. CambridgeSoft has integrated variousE-Notebook, registration, inventory, and biological assay systemsin a variety of settings. Whether these are CambridgeSoft, a third-party product or an in-house developed solution. CambridgeSofthas the expertise to unite these systems in order to they improvebusiness processes, laboratory efficiency and decision making.Application ConfigurationYour organization will see the benefit from implementing aCambridgeSoft application, but would like to customize it for aunique environment. Our professional services teams providethose specific features by developing market add-ins, or othermodifications that are supported in the future.
Systems DeploymentInstallation and ConfigurationCambridgeSoft has a tested methodology for system deployment that consists of an IT architectural review, a businessworkflow and process review as relates to specific scientific areas,a process integration review, and maintenance guidelines. By care-fully following this proven methodology, CambridgeSoft installsand configures systems that are easy to maintain and have the flex-ibility to accommodate variations in the science or business work-flow that come from extensive experience in these areas.
With custom development, CambridgeSoft works collaboratively
with your team to create a system that meets your needs while
executing our quality driven software development process. We
deliver what you need, on time and within budget, without surprises.

US 1 800 315–7300 INT’L 1 617 588–9300 FAX 1 617 588–9390 EMAIL [email protected]
EU 00 800 875 20000 UK +44 1223 464900 JP 0120 146 700 WWW www.cambridgesoft.com
MAIL CambridgeSof t Corporat ion 100 CambridgePark Dr ive Cambridge, Massachuset ts 02140 USA
ChemOffice, ChemDraw, BioOffice, BioDraw & ChemBioFinder are trademarks of CambridgeSoft Corporation ©2009
S E R V I C E S
Training & SupportTraining & SupportEducational TEducational Training and Training and Technical Supportechnical Support
Systems OptimizationCambridgeSoft’s systems deployment team will work with you tomake sure that your computing environment has been optimizedfor high performance. Your systems,networks, applications anddatabases are assessed and designed to deliver maximum achieve-ment.Beta and Pre-Release ProgramsCommitted to maximizing your productivity through the use ofour products, as well as exposing you to the newest technologies,our beta and pre-release programs provide you with first-handproduct knowledge and allows CambridgeSoft to improve appli-cations with your feedback.Pilot Software EvaluationsIt makes sense to pilot an application before a major commitmentto an enterprise-wide implementation is made. CambridgeSoftwill work closely with you to plan the evaluation, deploy theapplication, and gather feedback regarding systems design, API’sand technology specifications.TrainingEffective user, administrator and help desk training is often anafterthought in many systems deployments. However, the produc-tivity returns generated by an investment in systems training canbe dramatic. CambridgeSoft offers a complete array of powerful,user-focused training services.
Systems ManagementManaged InformaticsInformatics outsourcing provides the people, processes and tech-nology to develop a unique level of service for your organization.For a monthly fee, CambridgeSoft will deliver the informaticsapplications and the technology staff required to maximize pro-ductivity. This service allows your organization to focus on sci-ence, while CambridgeSoft plans, implements and manages yourtechnology environment.Systems HostingA hosting service that allows customers to use our state-of-the-artenterprise applications over the extranet from any location 24hours a day, seven days a week is available. With this hosting serv-ice, our customers can shift the responsibilities of application devel-opment and IT infrastructure management to CambridgeSoft,allowing more time to focus on core science, research, discoveryand development functions.
Ultra ServicesThe Ultra Services program is CambridgeSoft’s personalized, pre-mium service for supporting our customers. Organizations cantake advantage of both telephone and electronic access toCambridgeSoft’s support scientists who can address:• Usage and installation questions• Product compatibility and interoperability questions• Diagnostic review to help isolate the cause of a problem• Configuration assistance• Planning information for software updates and upgrades• Assistance with problem resolution
Technical Support & Remote DBA ServicesTechnical Support and Remote DBA Services for Oracle and SQLServer are also available.
Managed Informatics allows your organization to focus on science,
while CambridgeSoft plans, implements and manages your
technology environment.
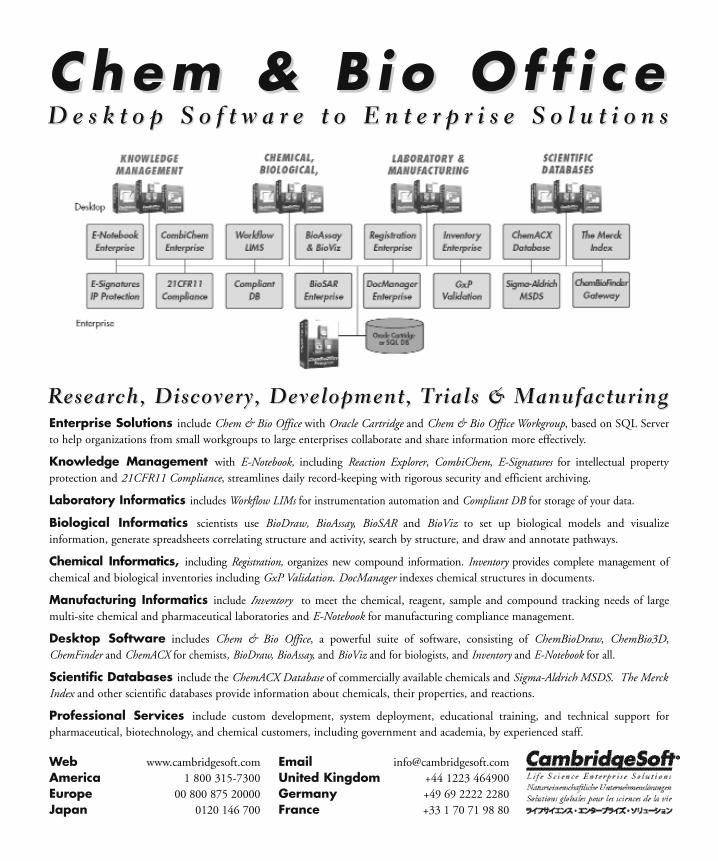
Chem & B io O f f i c eChem & B io O f f i c eD e s k t o p S o f t w a r e t o E n t e r p r i s e S o l u t i o n sD e s k t o p S o f t w a r e t o E n t e r p r i s e S o l u t i o n s
Enterprise Solutions include Chem & Bio Office with Oracle Cartridge and Chem & Bio Office Workgroup, based on SQL Serverto help organizations from small workgroups to large enterprises collaborate and share information more effectively.
Knowledge Management with E-Notebook, including Reaction Explorer, CombiChem, E-Signatures for intellectual property protection and 21CFR11 Compliance, streamlines daily record-keeping with rigorous security and efficient archiving.
Laboratory Informatics includes Workflow LIMs for instrumentation automation and Compliant DB for storage of your data.
Biological Informatics scientists use BioDraw, BioAssay, BioSAR and BioViz to set up biological models and visualize information, generate spreadsheets correlating structure and activity, search by structure, and draw and annotate pathways.
Chemical Informatics, including Registration, organizes new compound information. Inventory provides complete management ofchemical and biological inventories including GxP Validation. DocManager indexes chemical structures in documents.
Manufacturing Informatics include Inventory to meet the chemical, reagent, sample and compound tracking needs of largemulti-site chemical and pharmaceutical laboratories and E-Notebook for manufacturing compliance management.
Desktop Software includes Chem & Bio Office, a powerful suite of software, consisting of ChemBioDraw, ChemBio3D,ChemFinder and ChemACX for chemists, BioDraw, BioAssay, and BioViz and for biologists, and Inventory and E-Notebook for all.
Scientific Databases include the ChemACX Database of commercially available chemicals and Sigma-Aldrich MSDS. The MerckIndex and other scientific databases provide information about chemicals, their properties, and reactions.
Professional Services include custom development, system deployment, educational training, and technical support for pharmaceutical, biotechnology, and chemical customers, including government and academia, by experienced staff.
Research, Discovery, Development, TResearch, Discovery, Development, Trials & Manufacturingrials & Manufacturing
Web www.cambridgesoft.comAmerica 1 800 315-7300Europe 00 800 875 20000Japan 0120 146 700
Email [email protected] Kingdom +44 1223 464900Germany +49 69 2222 2280France +33 1 70 71 98 80

Chem & Bio OfficeD e s k t o p S o f t w a r e t o E n t e r p r i s e S o l u t i o n s
Enterprise Solutions include Chem & Bio Office with Oracle Cartridge and Chem & Bio Office Workgroup, based on SQL Server to help organizations from small workgroups to large enterprises collaborate and share information more effectively.
Knowledge Management with E-Notebook, including Reaction Explorer, CombiChem, E-Signatures for intellectual property protection and 21CFR11 Compliance, streamlines daily record-keeping with rigorous security and efficient archiving.
Laboratory Informatics includes Workflow LIMs for instrumentation automation and Compliant SDMS for storage of your data.
Biological Informatics scientists use BioDraw, BioAssay, BioSAR and BioViz to set up biological models and visualize information, generate spreadsheets correlating structure and activity, search by structure, and draw and annotate pathways.
Chemical Informatics, including Registration, organizes new compound information. Inventory provides complete management of chemical and biological inventories including GxP Validation. DocManager indexes chemical structures in documents.
Manufacturing Informatics include Inventory to meet the chemical, reagent, sample and compound tracking needs of large multi-site chemical and pharmaceutical laboratories and E-Notebook for manufacturing compliance management.
Desktop Software includes Chem & Bio Office, a powerful suite of software, consisting of ChemBioDraw, ChemBio3D, ChemFinder and ChemACX for chemists, BioDraw, BioAssay, and BioViz and for biologists, and Inventory and E-Notebook for all.
Scientific Databases include the ChemACX Database of commercially available chemicals and Sigma-Aldrich MSDS. The Merck Index and other scientific databases provide information about chemicals, their properties, and reactions.
Professional Services include custom development, system deployment, educational training, and technical support for pharmaceutical, biotechnology, and chemical customers, including government and academia, by experienced staff.
Research, Discovery, Development, Trials & Manufacturing
Web www.cambridgesoft.comAmerica 1 800 315-7300Europe 00 800 875 20000Japan 0120 146 700MAE 08436 0902
Email [email protected] Kingdom +44 1223 464900Germany +49 69 2222 2280France +33 1 70 71 98 80
SDMS