Charles River Laboratories Annual Report 2004 Accelerating ...
121
Charles River Laboratories Annual Report 2004 Accelerating the Search for Healthier Lives
-
Upload
khangminh22 -
Category
Documents
-
view
0 -
download
0
Transcript of Charles River Laboratories Annual Report 2004 Accelerating ...

Charles River Laboratories Annual Report 2004
Accelerating the Search for Healthier Livesª

FC4
Charles River Laboratories (NYSE: CRL),
based in Wilmington, Massachusetts,
is a global provider of solutions that
advance the drug discovery and
development process. Our leading-
edge products and services are
designed to enable our clients to
bring drugs to market faster and more
efficiently. Backed by our rigorous,
best-in-class procedures and our
proven data collection, analysis and
reporting capabilities, our products
and services are organized into three
categories spanning every step of the
drug development pipeline: Research
Models and Services, Preclinical
Services, and Clinical Services. Charles
RiverÕs client base includes all of the
major pharmaceutical companies,
biotechnology companies, govern-
ment agencies and many leading
hospitals and academic institutions.
Charles RiverÕs 8,000 employees serve
clients in more than 50 countries.
$555
$614
$767
Õ03Õ02 Õ04
$96$91
$139
Õ03Õ02 Õ04
Revenues(in Millions)
Free Cash FLow*(in Millions)
$50.1
$80.2
$89.8
Õ03Õ02 Õ04
$68.4
$81.1
$106.7
Õ03Õ02 Õ04
Net Income(in Millions)
Non-GAAP Net Income*(in Millions)
$1.06
$1.64$1.68
Õ03Õ02 Õ04
$1.42
$1.66
$1.98
Õ03Õ02 Õ04
Earnings perDiluted Share
Non-GAAP Earnings*per Diluted Share
* In accordance with Regulation G,see reconciliations on page 23.
Cover Photo: Charles RiverÕs expertise in specialtytoxicology, like inhalation, distinguishes us from ourcompetitors.

TO OUR SHAREHOLDERS:
The year 2004 was a momentous one in
the history of Charles River Laboratories.
On October 20, we closed our merger
with Inveresk Research Group, transforming
vider of essential products and services
that advance research in the drug discovery
and development industry. The merger
has enabled us to work with our customers
as no one else can Ð supporting them
from their early discovery needs through
market approval Ð and brings us closer to
our goal of becoming a strategic partner.
The merger has also brought exceptional
expertise and world-class talent to our
team. As a result, we enter 2005 in a
position of stronger leadership in the
global market for drug research and
development products and outsourced
Our transformation comes at an oppor-
tune time. Research and development of
drugs and therapies has reached a critical
point where development timeframes are
lengthening and costs are rising. In order
to address these issues, our customers are
outsourcing more services on a strategic
basis than ever before. Demand for our
unique portfolio is strong, and we believe
it will remain so for the next several years
as pharmaceutical and biotechnology
companies push to develop new drugs,
devices and therapies and bring them
to market.
Our 2004 financial results reflect the
strength of the market, the breadth of
our global portfolio and the success of
our targeted sales initiatives. Including
the nine weeks of sales from Inveresk,
Charles River reported net sales of $767
million, a 25% increase over 2003.
James C. Foster
Chairman, President and Chief Executive Officer
our company into a leading global pro-
services Ð a market that, according to
Wall Street research, continues to grow at
a double-digit annual rate.

Net income was $90 million, but when
excluding amortization and other merger-
related charges and one-time charges for
our European reorganization, closure of
our proteomics joint venture and the
write-off of deferred financing charges,
non-GAAP net income was $107 million.
Earnings per diluted share were $1.68, up
slightly compared to 2003. Excluding the
charges noted above, non-GAAP earnings
per diluted share were $1.98, a 19.3%
increase over 2003.
RESEARCH MODELS AND SERVICES
A closer look at the results reveals that
our Research Models and Services (RMS)
business grew 11.3% in 2004. Sales of
most major categories of models
increased as pharmaceutical and biotech-
nology companies, academic institutions
and government agencies spent more on
discovery and development. While phar-
maceutical companies continue to be the
largest segment of our RMS client base,
biotech clients represent a strong growth
area, as do academic institutions. These
organizations rely on us because we
provide the widest variety of high-quality
research models that are commercially
available, and we provide extensive
value-added services to facilitate our
customersÕ utilization of these models.
In 2004, we continued to see worldwide
growth in our Transgenic and Laboratory
Services businesses, with the strongest
demand in Europe and Japan. In the U.S.,
demand was stronger for laboratory
services, because researchers are focusing
on the in-depth characterization of
existing models, rather than continuing
to create large numbers of new models.
To support the growing demand overseas,
we opened two new facilities in 2004 in
Lyon, France and Osaka, Japan, and a
third new facility in the Tokyo area in the
first quarter of 2005. These three new
facilities have more than doubled our
T

overseas capacity, positioning us extremely
well to meet our clientsÕ expanding needs
for the next few years.
Our Consulting and Staffing Services
(CSS) business, which provides facilities
management and advisory services at our
This was due in large part to new sales
initiatives that have broadened our CSS
customer base to include more academic
and commercial institutions, and expanded
services for many of our government
contracts. We expect continued CSS sales
growth in 2005.
Charles River continues to offer in vitro,
or non-animal, testing methods through
our market-leading Endosafe¨ endotoxin
detection test kits. Our in vitro business
had a very good year in 2004, particularly
in Europe, where the market is expanding
due to increased regulatory testing
requirements. In addition, our Endosafe-
PTS Ð a portable version of our test kit Ð is
presently awaiting FDA approval. Once
we receive approval, which we expect in
the first half of 2006, we believe the
market opportunity for this product will
expand significantly.
Our vaccine support business also had a
strong year. This business provides SPF
primarily for the production of poultry
vaccines. Due to competitor production
issues, demand for our eggs in 2004 was
greater than we expected, and our
management team did an excellent job of
meeting this demand and maximizing the
margin contribution of this business.
PRECLINICAL SERVICES
Sales of Preclinical Services grew strongly
last year Ð up 43.3% to $266 million Ð
including the nine-week contribution
from Inveresk, the robust demand for our
value-added services, and the success of
3
2004
Charles River
Laboratories
T
customersÕ sites, also did well this year.
(specific pathogen free) chicken eggs,

our sales initiatives. We are now one of
the two leading global providers of
general and specialty toxicology and
Ongoing conversations with customers
have confirmed our belief that demand
for outsourced services will continue to
be robust for the foreseeable future. In
order to meet that demand, we have a
number of expansion projects underway:
new capacity opened in Montreal, Canada
in the first quarter of 2005 and will open
in Edinburgh, Scotland in early 2006. We
are planning to expand our Nevada facility
over the next two years and are in the
process of developing a new facility in
Massachusetts where we expect to phase
in occupancy beginning in early 2006.
With the development of the Nevada and
Massachusetts locations, we will be well
on our way to establishing full-service,
premier facilities on both the east and
west coasts, which we believe are neces-
sary to support our customersÕ efforts
and our long-term growth.
One of the key strengths we offer our
customers is our scientific expertise.
We already employ hundreds of highly
trained scientific personnel with M.D.,
D.V.M. and Ph.D. degrees, and expect to
expand their ranks as we increase capacity.
With a broad portfolio of high-quality,
essential services, brand-new capacity and
deep scientific expertise, we believe we
are in an excellent position to capitalize
on market opportunities.
T
pathology services. Specialty toxicology is
an area of particular strength for us, with
expertise in reproductive, large animal,
infusion and inhalation toxicology. With
the increasing number of biotech drugs
being developed, the demand for large
animal and inhalation toxicology services
grows, and we are extremely well posi-
tioned to support that need.

CLINICAL SERVICES
As a result of our merger with Inveresk,
Charles River is now able to offer a full
range of clinical services to existing
and new clients. These capabilities are
particularly attractive to our existing
and potential biotech clients, many of
whom want a development partner
to whom they can outsource studies
from early efficacy and safety testing
to regulatory submission.
In addition to its value to our customers,
our entry into the clinical services market
offers us an excellent growth opportunity
and provides additional balance to our
service portfolio. Our plan is to expand
this business by employing a niche strategy.
Our goal is not to be the largest provider
of clinical services, but to provide services
in specialized therapeutic areas such as
oncology, ophthalmology, cardiovascular,
anti-infective, and respiratory diseases.
By taking this approach, we believe we
can effectively support our customers
and at the same time, enhance our
operating margins.
THE OUTLOOK FOR 2005
Our key strategic priority for 2005 is
the integration of Inveresk into Charles
RiverÕs operations. That process is already
well underway and proceeding on
schedule. As part of our integration,
we have undertaken a new branding
initiative that will, by the end of 2005,
establish all of our businesses under one
brand name: Charles River Laboratories.
We believe this will leverage the brand
equity that Charles River has established
over nearly sixty years. Our goal is to
become the most powerful and visible
brand in the marketplace through a
strategy of Òone company, one brand,
one voice.Ó
5
2004
Charles River
Laboratories
T

We have always believed that strategic
acquisitions are a key driver of our
growth, and will continue to research and
evaluate future acquisition opportunities
that advance our strategy and offer
solid potential for sales and profitability.
However, even without any new
acquisition activity in 2005, we expect
double-digit organic revenue growth
for our business, with earnings growing
faster than sales.
A TRANSFORMED COMPANY WITH
ENDURING VALUES
While much has changed at Charles
River this year, I want to assure you that
we will remain steadfast in adhering to
the values that have characterized our
company since its founding. These
include our passion for scientific expertise
and high-quality service, our dedication
to exceeding our customersÕ expectations,
our insistence on integrity and ethical
conduct in all our business practices, and
our support of our employeesÕ career
At Charles River, ethical conduct includes
the humane care of research animals.
We continue to pursue the goals of our
practices across business units worldwide;
heightening internal awareness of the
importance of humane care; assuring a
culture of caring; enhancing orientation
and training; and fostering animal welfare
worldwide through the efforts of the
Charles River Laboratories Foundation.
T
goals, a commitment which has con-
tributed to employee longevity.
Humane Care Initiative by promoting best

THE NEW CHARLES RIVER
When I look at Charles River today, I see
a global team of 8,000 professionals, rich
in expertise, committed to scientific excel-
lence, dedicated to client service. I thank
all of them for their diligent efforts to
turn our strategy into accomplishments
and our aspirations into proven results.
Together, as the result of the merger of
Charles River and Inveresk, we will take
our business to a new level, exceeding
what either company could have done
on its own.
As always, my thanks go to our Charles
River shareholders. Your continued
support has enabled us to build the
premier global company advancing the
search for drugs, devices and therapies
Sincerely,
James C. Foster
Chairman, President and
Chief Executive Officer
7
2004
Charles River
Laboratories
from discovery through market approval.
We greatly appreciate that support and
we will work to continue earning it as
we go forward.

Our commitment to quality and focus on health status has made Charles River the market leader inresearch model products and services.
9
2004
Charles River
Laboratories
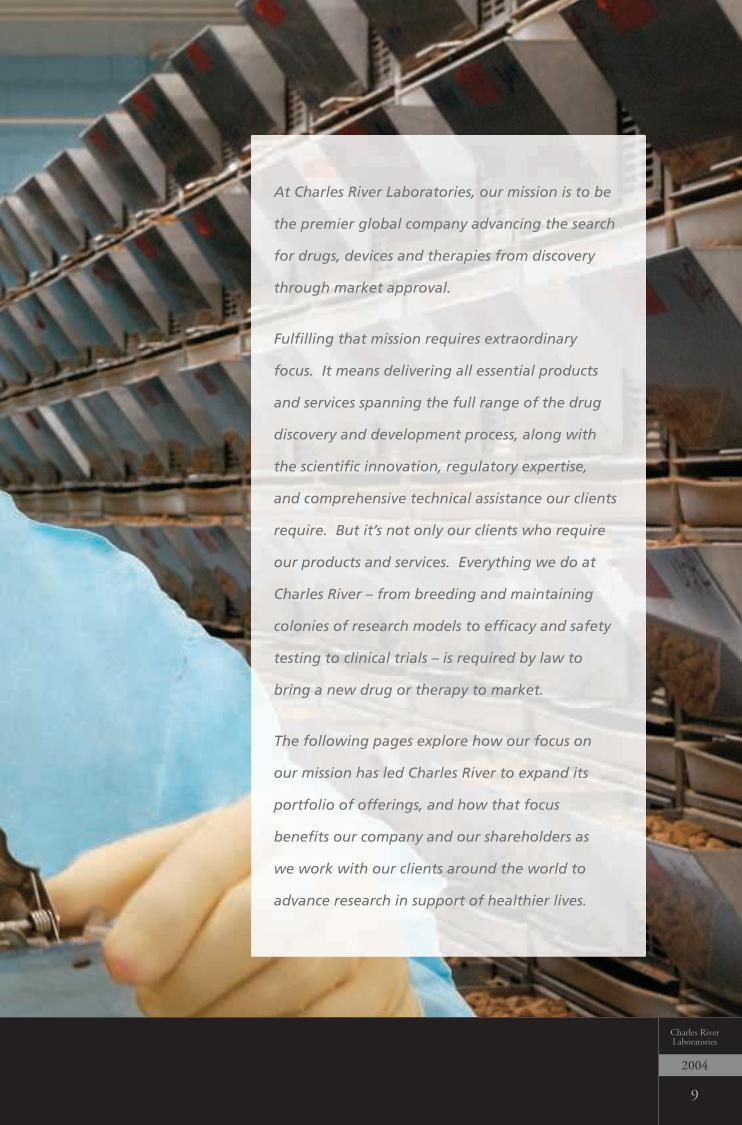
At Charles River Laboratories, our mission is to be
the premier global company advancing the search
for drugs, devices and therapies from discovery
through market approval.
Fulfilling that mission requires extraordinary
focus. It means delivering all essential products
and services spanning the full range of the drug
discovery and development process, along with
the scientific innovation, regulatory expertise,
and comprehensive technical assistance our clients
require. But itÕs not only our clients who require
our products and services. Everything we do at
Charles River Ð from breeding and maintaining
colonies of research models to efficacy and safety
testing to clinical trials Ð is required by law to
bring a new drug or therapy to market.
The following pages explore how our focus on
our mission has led Charles River to expand its
portfolio of offerings, and how that focus
benefits our company and our shareholders as
we work with our clients around the world to
advance research in support of healthier lives.

Research Models and Services
A focus on essential products and services that leads to new growth
Research models Ð bred and maintained to
the highest standards of biosecurity and
humane care Ð have always been essential
to the discovery and development of drugs
and therapies to treat medical conditions of
all kinds. They are necessary Ð indeed,
mandated by the US Food & Drug
Administration (FDA) and other global
regulatory bodies Ð to determine the efficacy
and safety of compounds before they can
be tested on people in clinical trials.
Charles River Laboratories has been a
leading supplier of research models to
pharmaceutical companies, biotechnology
firms, government agencies, and academic
institutions since its founding nearly 60
years ago. Today, one of every two research
models sold in the world is provided by
Charles River.
As scientists and researchers expand their
search for the causes and treatment of

11
2004
Charles River
Laboratories
medical conditions, the demand for healthy
research models continues to grow, as do
new applications. Our CD¨ rats are widely
used for safety testing, and immunodefi-
cient mice from Charles River are essential
for oncology and infectious disease work.
Genetically altered models are created using
our inbred mice.
Charles River also offers a growing number
of specialty or disease models Ð that is,
animals bred to express human disease
states, including metabolic disorders such
as diabetes, obesity, and hypertension, as
well as cardiovascular, oncological, and
renal diseases. Disease models are in
demand among researchers because, by
more accurately modeling human
conditions, these animals are often better
predictors of the potential success of new
drug candidates.
Our number one priority is animal welfare.

The focus on disease models has led
researchers to create large numbers of
genetically altered animals, which in turn,
has led to a need for housing, support
services, and extensive testing of these
models. To meet these outsourced needs,
Charles River has established Transgenic and
Laboratory Services, which provides colony
maintenance and development, genotyping
and phenotyping, quarantine and health
monitoring, and extensive reproductive
technologies. Because Charles River can
provide these services more effectively and
efficiently than our clients can, many of
them outsource these services to us.
For clients who prefer to maintain their own
vivariums, we offer Consulting and Staffing
Services to ensure that they can maintain
the same level of biosecurity (our terminology
for the procedures we follow to maintain
the highest standards of research model
colony health) that we do.
Through our Research Models and Services
business, we deliver several key advantages
accurately determine which compounds
offer the greatest promise for success in
people, while weeding out less promising
candidates and saving development time,
costs, and resources. At the same time, we
free them to focus their internal resources
on what they do best Ð developing new
drugs, devices, and therapies.
For Charles River and its investors, the
advantages are equally clear. Because we
are the global leader in research models and
services Ð and because worldwide demand
continues to increase Ð we can expect
continued opportunities for growth and
profitability in the years ahead.
to our clients. We enable them to more

13
2004
Charles River
Laboratories
We produce research models in 160 barrier rooms worldwide.

As medical science has advanced, researchers
have made major strides in understanding the
pathology of many diseases. In some conditions,
such as high cholesterol, the disease mechanism
is relatively simple, leading to the development
of Ómagic bulletÓ treatments that provide long-
term disease management or a lasting cure.
Many other diseases Ð including diabetes and
many forms of cancer Ð are more complex, both
in their causes and their mechanisms of action.
This complexity makes it more challenging for
researchers, not only to develop effective treat-
ments, but also to test prospective treatments
for safety and efficacy. And more complexity
results in longer development timeframes.
Pharmaceutical and biotechnology companies
have responded to this situation by outsourcing
their preclinical services needs to a dedicated
provider like Charles River. Working with us
gives these firms a strategic partner with the
expertise and resources to handle the most
challenging testing protocols. At the same
time, outsourcing also enables them to devote
more of their internal resources to doing what
they do best: discovering and developing new
drugs and therapies.
Early on, we recognized outsourcing as an
opportunity to better support our clients by
providing preclinical services that capitalized
on our expertise in veterinary medicine. Since
then, we have focused on expanding our
Preclinical Services
A focus on broad and unique expertise in an expanding market

15
2004
Charles River
Laboratories
To assess toxicity, our histology laboratories prepare thousands of tissueslides like this one for pathologists to interpret.

portfolio of offerings to include essential
services needed to bring a new drug or ther-
apy to clinical trials. In pursuit of that goal,
we have developed expertise in a broad
range of disciplines, including metabolism
and pharmacokinetics, bioanalytical chem-
istry, pharmacology, toxicology, interven-
tional and surgical services, pathology, and
biopharmaceutical services.
We achieved our goal of becoming a full-
service provider of preclinical services in 2004
when we merged with Inveresk Research
Group, one of the worldÕs largest contract
research organizations and a company
renowned, like Charles River, for its quality
and customer service. Inveresk has comple-
mented our preclinical business by Òfilling in
the blanksÓ in our service portfolio, giving
Charles River a broader ability to support our
clients with high end, value-added services.
One such specialty service is inhalation toxi-
cology. A growing number of new drugs Ð
In our state-of-the-art HPLC laboratories, we perform analysis of drug compounds and dose formulations in support of preclinical drug development.

17
2004
Charles River
Laboratories
particularly biotech therapies Ð are ineffective
if administered orally; they can only be
absorbed into the bloodstream via inhalation.
As the leading provider of inhalation toxicology,
we are a logical choice for drug developers
who outsource this testing to a third party.
InvereskÕs leadership in specialty toxicology Ð
including inhalation and infusion Ð was one
of the driving forces behind the merger with
Charles River. Our combined company
now has the breadth of services and the
financial strength to support clients of all
sizes from early discovery through market
approval. This is unique in our industry.
Besides enhancing our profitability through
higher-margin specialty services, Inveresk
further strengthens our preclinical business
by bolstering our presence in Europe and
better positioning Charles River to take
advantage of growing global opportunities.

No drug or therapy can reach the commer-
the clinical trial process and receiving
approval from the FDA and other interna-
tional regulatory agencies. While Phase I
clinical trials are, strictly speaking, the first
step in the clinical process, they can also be
viewed as the culmination of the preclinical
process, since these first-in-man studies pro-
vide the pharmacological proof of principle,
dosage, and safety data needed before drug
developers can embark on more large-scale
clinical trials. For this reason, many clients Ð
particularly biotech companies Ð want an
outsourcing partner whose capabilities
extend into the clinical space.
As a result of the merger of Inveresk and
Charles River, we can now support those
needs. We operate one of the worldÕs
premier Phase I facilities in Edinburgh,
Scotland, which includes a dedicated phar-
Clinical Services
A focus on relationships that produce new revenue synergies
cial market without successfully navigating

macy and sample processing laboratory. Our
plan is to add a Phase I clinic in the United
States, allowing us to support our customers
wherever they choose to do their studies.
We also offer a full range of services for
conducting clinical research in Phases II to IV
Ð from protocol design to regulatory submis-
sion Ð even for complex, global programs.
With our focus on select therapeutic areas,
our goal is to be the provider of choice for
customers with drugs and therapies targeted
at those areas.
For many of Charles RiverÕs clients, our ability
to support clinical research is a clear advan-
tage. Now they can rely on their preferred
preclinical partner to help shepherd their
treatments through one of the worldÕs top
Phase I clinics Ð and, if desired, all the way
down the road to regulatory submission
and post-marketing surveillance.
Charles River
Laboratories
19
2004
Charles River
Laboratories
Our Clinical Services division employs highly trained clinical research associates who skillfully
monitor clinical trials around the world.

For Charles River and its shareholders, our
expansion into clinical services provides a
solid, new growth opportunity in a market
segment currently growing at a double-digit
rate. Having a broader portfolio of prod-
ucts and services also help us balance shifts
in research emphasis.
But above all, our support for clinical
research underscores our focus on our
clients Ð both those firms already working
with us and those for whom our clinical
business represents a new relationship-
building opportunity. It represents one
more way weÕre working with our clients
to advance research in support of
healthier lives.

21
2004
Charles River
Laboratories
With our entry into clinical services, we are now able to support our clientsÕ drugdevelopment efforts from discovery through market approval.

2004 FORM 10-K

UNITED STATES SECURITIES AND EXCHANGE COMMISSIONWashington, D.C. 20549
FORM 10-K(Mark One)
� ANNUAL REPORT PURSUANT TO SECTION 13 OR 15(d) OF THESECURITIES EXCHANGE ACT OF 1934
FOR THE FISCAL YEAR ENDED DECEMBER 25, 2004
OR
� TRANSITION REPORT PURSUANT TO SECTION 13 OR 15(d) OF THESECURITIES EXCHANGE ACT OF 1934
FOR THE TRANSITION PERIOD FROM TO Commission File No. 333-92383
CHARLES RIVER LABORATORIES INTERNATIONAL, INC.(Exact Name of Registrant as Specified in Its Charter)
Delaware 06-1397316(State or Other Jurisdiction of (I.R.S. EmployerIncorporation or Organization) Identification No.)
251 Ballardvale Street 01887Wilmington, Massachusetts (Zip Code)
(Address of Principal Executive Offices)
(Registrant’s telephone number, including area code): (978) 658-6000
Securities registered pursuant to Section 12(b) of the Act:Name of each exchange
Title of each class on which registeredCommon Stock, $0.01 par value New York Stock Exchange
Securities registered pursuant to Section 12(g) of the Act: None
Indicate by check mark whether the Registrant (1) has filed all reports required to be filed by Section 13 or15(d) of the Securities Exchange Act of 1934 during the preceding 12 months (or for such shorter period that theRegistrant was required to file such reports), and (2) has been subject to such filing requirements for the past90 days. Yes � No �
Indicate by check mark if disclosure of delinquent filers pursuant to Item 405 of Regulation S-K is notcontained herein, and will not be contained, to the best of the Registrant’s knowledge, in definitive proxy orinformation statements incorporated by reference in Part III of this Form 10-K or any amendment to thisForm 10-K. �
Indicate by check mark whether the Registrant is an accelerated filer (as defined in Exchange ActRule 12b-2). Yes � No �
On June 25, 2004, the aggregate market value of the Registrant’s voting common stock held by non-affiliatesof the Registrant was approximately $2,150,196,678.
As of March 1, 2005, there were outstanding 66,109,790 shares of the Registrant’s common stock, $0.01 parvalue per share.
DOCUMENTS INCORPORATED BY REFERENCE
Portions of the Registrant’s Definitive Proxy Statement for its 2005 Annual Meeting of Stockholders scheduledto be held on May 9, 2005 (the ‘‘2005 Proxy Statement’’), which will be filed with the Securities and ExchangeCommission not later than 120 days after December 25, 2004, are incorporated by reference into Part III of thisAnnual Report on Form 10-K. With the exception of the portions of the 2005 Proxy Statement expresslyincorporated into this Annual Report on Form 10-K by reference, such document shall not be deemed filed as partof this Form 10-K.

CHARLES RIVER LABORATORIES INTERNATIONAL, INC.ANNUAL REPORT ON FORM 10-K
TABLE OF CONTENTS
Item Page
PART I
1 Business . . . . . . . . . . . . . . . . . . . . . . . . . . . . . . . . . . . . . . . . . . . . . . . . . . . . . . . . . . . . 12 Properties . . . . . . . . . . . . . . . . . . . . . . . . . . . . . . . . . . . . . . . . . . . . . . . . . . . . . . . . . . . 183 Legal Proceedings . . . . . . . . . . . . . . . . . . . . . . . . . . . . . . . . . . . . . . . . . . . . . . . . . . . . . 184 Submission of Matters to a Vote of Security Holders . . . . . . . . . . . . . . . . . . . . . . . . . . . . 18
Supplementary Item. Executive Officers of the Registrant pursuant to Instruction 3 toItem 401 (b) of Regulation S-K . . . . . . . . . . . . . . . . . . . . . . . . . . . . . . . . . . . . . . . . . . . 18
PART II
5 Market for Registrant’s Common Equity, Related Stockholder Matters and IssuerPurchases of Equity Securities . . . . . . . . . . . . . . . . . . . . . . . . . . . . . . . . . . . . . . . . . . . . 20
6 Selected Consolidated Financial Data . . . . . . . . . . . . . . . . . . . . . . . . . . . . . . . . . . . . . . . 227 Management’s Discussion and Analysis of Financial Condition and Results of Operations . 23
7A Quantitative and Qualitative Disclosures About Market Risk . . . . . . . . . . . . . . . . . . . . . . 368 Financial Statements and Supplementary Data . . . . . . . . . . . . . . . . . . . . . . . . . . . . . . . . . 379 Changes in and Disagreements with Accountants on Accounting and Financial Disclosure . 87
9A Controls and Procedures . . . . . . . . . . . . . . . . . . . . . . . . . . . . . . . . . . . . . . . . . . . . . . . . 879B Other Information . . . . . . . . . . . . . . . . . . . . . . . . . . . . . . . . . . . . . . . . . . . . . . . . . . . . . 87
PART III
10 Directors and Executive Officers of the Registrant . . . . . . . . . . . . . . . . . . . . . . . . . . . . . . 8711 Executive Compensation . . . . . . . . . . . . . . . . . . . . . . . . . . . . . . . . . . . . . . . . . . . . . . . . . 88
Security Ownership of Certain Beneficial Owners and Management and Related12 Stockholders Matters . . . . . . . . . . . . . . . . . . . . . . . . . . . . . . . . . . . . . . . . . . . . . . . . . . . 8813 Certain Relationships and Related Transactions . . . . . . . . . . . . . . . . . . . . . . . . . . . . . . . . 8814 Principal Accountant Fees and Services . . . . . . . . . . . . . . . . . . . . . . . . . . . . . . . . . . . . . . 88
PART IV
15 Exhibits and Financial Statement Schedules . . . . . . . . . . . . . . . . . . . . . . . . . . . . . . . . . . . 88

PART I
Item 1. Business
General
This Annual Report on Form 10-K (Form 10-K), contains forward-looking statements regardingfuture events and the future results of Charles River Laboratories International, Inc. (Charles River)that are based on current expectations, estimates, forecasts, and projections about the industries inwhich Charles River operates and the beliefs and assumptions of the management of Charles River.Words such as ‘‘expect,’’ ‘‘anticipate,’’ ‘‘target,’’ ‘‘goal,’’ ‘‘project,’’ ‘‘intend,’’ ‘‘plan,’’ ‘‘believe,’’ ‘‘seek,’’‘‘estimate,’’ and other similar expressions are intended to identify such forward-looking statements.These forward-looking statements are predictions of future events or trends and are not statement ofhistorical matters. These statements are based on current expectations and beliefs of Charles River andinvolve a number of risks, uncertainties, and assumptions that are difficult to predict. Therefore, actualresults may differ materially and adversely from those expressed in any forward-looking statements.Readers are cautioned not to place undue reliance on these forward-looking statements, which speakonly as of the date of this document or in the case of statements incorporated by reference, on thedate of the document incorporated by reference. Factors that might cause or contribute to suchdifferences include, but are not limited to, those discussed in this Form 10-K under the section entitled‘‘Risks Related to Our Business and Industry.’’ Except to the extent required by applicable law orregulation, Charles River undertakes no obligation to revise or update publicly any forward-lookingstatements for any reason.
Corporate History
Charles River has been in business since 1947 and has undergone several business structurechanges over the years. Charles River Laboratories International, Inc. was incorporated in 1994. In2000, we completed our initial public offering of Charles River Laboratories International, Inc. Ourstock is traded on the New York Stock Exchange under the symbol ‘‘CRL ‘‘and is included in theStandard & Poor’s S&P MidCap 400 Index. We are headquartered in Wilmington, Massachusetts. Ourheadquarters mailing address is 251 Ballardvale St., Wilmington, MA 01887, and the telephone numberat that location is (978) 658-6000. Our Internet site is www.criver.com. Material contained on ourInternet site is not incorporated by reference into this Form 10-K. Unless the context otherwiserequires, references in this Form 10-K to ‘‘Charles River,’’ ‘‘we,’’ ‘‘us’’ or ‘‘our’’ refer to Charles RiverLaboratories International, Inc. and its subsidiaries.
This Form 10-K, as well as all other reports filed with the Securities and Exchange Commission(SEC), are available free of charge through the investor relations section of our Internet site as soon aspracticable after we electronically file such material with, or furnish it to, the SEC. The public mayread and copy any materials we file with the SEC at the SEC’s Public Reference Room at 450 FifthStreet NW, Washington, DC 20549. The public may obtain information on the operation of the PublicReference Room by calling the SEC at 1-800-SEC-0330. The SEC maintains an Internet site(http://www.sec.gov) that contains reports, proxy and information statements, and other informationregarding issuers that file electronically with the SEC.
Overview
We are a leading global provider of solutions that advance the drug discovery and developmentprocess. We provide the animal research models required in research and development for new drugs,devices and therapies and have been in this business for more than 55 years. For over a decade, wehave built upon our research model technologies to develop a diverse and growing portfolio of productsand services. Our wide array of tools and services enables our customers to reduce costs, increase speedand enhance their productivity and effectiveness in drug and medical device discovery and
1

development. Our customer base includes major pharmaceutical, biotechnology, and medical devicecompanies, as well as many government agencies, leading hospitals and academic institutionsthroughout the world. We currently operate over 100 facilities in 20 countries worldwide. Our productsand services, supported by our global infrastructure and deep scientific expertise, enable our customersto meet many of the challenges of early-stage life sciences research, a large and growing market. In2004, our net sales were $766.9 million and our operating income was $160.3 million which includes thenine weeks in the year during which Inveresk was owned by us.
In October 2004, we acquired Inveresk Research Group, Inc. (Inveresk), which significantlyexpanded our overall size and the breadth of the products and services that we offer, and strengthenedour global footprint in the growing market for pharmaceutical research and development products andservices. The addition of Inveresk brought a number of highly complementary service offerings andexpanded our geographic reach. The expanded global footprint, with added strength in key marketssuch as the United States, Canada, Europe and Japan, better aligns us with our key pharmaceutical andbiotechnology customers, who are increasingly seeking to outsource more of their preclinical andclinical research and development efforts and are seeking full service, global partners.
Prior to the acquisition, Inveresk was a publicly-traded company and a leading provider of drugdevelopment services to companies in the pharmaceutical and biotechnology industries. Through itspreclinical and clinical business segments, it offered a broad range of drug development services,including preclinical safety and pharmacology evaluation services, laboratory sciences services andclinical development services. This acquisition broadened our portfolio of high-end products andservices including general toxicology, specialty infusion and inhalation toxicology and clinical services.
As part of the integration of Inveresk’s business operations, in the fourth quarter of 2004, wechanged our business reporting segments. We now have three reporting segments: Research Modelsand Services (RMS), Preclinical Services (formerly our DST segment), which is a combination ofInveresk’s preclinical business with our legacy preclinical business, and Clinical Services. We havemoved our in vitro business out of our Preclinical Services segment to our RMS segment. We believethat the new business segments better reflect our results of operations and facilitate understanding ofour business. The changes in segment presentation have no effect on our consolidated revenues or netincome. Prior year segment information included in this Form 10-K has been restated to reflect thischange.
Research Models and Services (RMS)
With 20 facilities on three continents, we have continued to maintain our position as the globalleader in the production and sale of research models, principally genetically and virally definedpurpose-bred rats and mice, and have been supplying research models since 1947. We also provide avariety of related services that are designed to assist our customers in screening drug candidates. RMSaccounted for 62.2% of total net sales in 2004.
Research Models. A significant portion of this business is comprised of the commercial productionand sale of animal research models, principally purpose-bred rats, mice and other rodents for use byresearchers. Our research models include genetically defined models and models with compromisedimmune systems, which are increasingly in demand as early-stage research tools. The Food and DrugAdministration (FDA) and foreign regulatory bodies typically require the safety and efficacy of newdrug candidates and many medical devices to be tested on research models like ours prior to testing inhumans. As a result, our research models are an essential part of the drug discovery and developmentprocess. Our research models are bred and maintained in barrier rooms which are designed to ensurethat the animals are free of specific viral and bacterial agents and other contaminants that can disruptresearch operations and distort results. With our barrier room production capabilities we are able to
2

deliver consistently high quality research models worldwide. We also provide larger animal models tothe research community, principally for use in their drug development and testing studies.
Our small research models include:
• outbred animals, which are genetically heterogeneous;
• inbred animals, which are genetically identical;
• other genetically-modified research models;
• hybrid animals, which are the offspring of two different inbred parents;
• spontaneous mutant animals, which contain a naturally-occurring genetic mutation (such asimmune deficiency); and
• new types of models including knock-out models with one or more disabled genes and transgenicanimals, which contain genetic material transferred from a different species.
We offer one of the largest selections of small animal models and provide our customers withhigh-volume and high-quality production. Our rats, mice and other rodent species have been andcontinue to be some of the most extensively used research models in the world, largely as a result ofour continuous commitment to innovation and quality in the breeding process. We provide our smallanimal models to numerous customers around the world, including most pharmaceutical companies,major biotechnology companies, many government agencies, and leading hospital and academicinstitutions. Since 2001, we have been offering new and proprietary, disease-specific rat models used tofind new treatments for diseases such as diabetes, obesity, cardiovascular and kidney disease.
We believe that over the next several years, many new research models will be developed and usedin biomedical research, such as transgenic models with modified genetic material, knock-out modelswith one or more disabled genes, and transgenic models that incorporate or exclude a particular mouse,rat or human gene. These more highly-defined and characterized models will allow researchers tofurther focus their investigations into disease conditions and potential new therapies or interventions.We intend to build upon our position as the leader in this field to expand our presence in this marketfor higher-value research models.
RMS also offers services designed to assist our customers in screening drug candidates faster byproviding a variety of services related to genetically-defined research models for in-house research andby implementing efficacy screening protocols to improve the customer’s drug evaluation process. Theseservices, initiated in 1995, address the growing need among pharmaceutical and biotechnologycompanies to outsource the non-core aspects of their drug discovery activities. These services capitalizeon the technologies and relationships developed through our research model business. We currentlyoffer five major categories of research models products and services: transgenic services, laboratoryservices, consulting and staffing services, vaccine support and in vitro technology services.
Transgenic Services. In this area of our business, we assist our customers in validating,maintaining, improving, breeding and testing research models purchased or created by them forbiomedical research activities. While the creation of a transgenic model can be a critical scientificevent, it is only the first step in the discovery process. Productive utilization of research models requiressignificant additional technical expertise. We provide transgenic breeding expertise, modelcharacterization and colony development, genetic characterization, phenotyping, quarantine, embryocryopreservation, embryo transfer and health and genetic monitoring. We provide these services tonearly 200 laboratories around the world from pharmaceutical and biotechnology companies tohospitals and universities. We maintain more than 1,000 different types of naturally occurring orexperimentally manipulated research models for our customers. We expect that the demand for ourservices will grow as the use of genetically modified research models continues to grow within the
3
research community. In order to meet the growing demand for these services, we are adding capacity inEurope and Japan in 2005.
Laboratory Services. We assist our customers in monitoring and analyzing the health and geneticsof the research models used in their research protocols. We developed this capability internally bybuilding upon the scientific foundation created by the diagnostic laboratory needs of our researchmodel business. Depending upon a customer’s needs, we may serve as its sole-source testing laboratory,or as an alternative source supporting its internal laboratory capabilities. We believe that the continuedgrowth in development and characterization and utilization of specific disease models and geneticallyengineered models, such as transgenic models, will drive our future growth as the reference laboratoryof choice for health and genetic testing of laboratory animals.
Consulting and Staffing Services. Building upon our core capability as a leading provider ofhigh-quality research models, we manage animal care operations on behalf of government andacademic organizations, as well as commercial customers in the biotechnology and related sectors.Demand for our services reflects the growing necessity of these large institutions to outsource internalfunctions or activities that are not critical to the core scientific innovation process. In addition, webelieve that our expertise in animal care and facility operations enhances the productivity and quality ofour customers’ animal care and use programs. This area leads to additional opportunities for us toprovide other products and services to our customers. Site management does not typically require us tomake any incremental investment, thereby generating a favorable return on deployed assets.
Vaccine Support. We are the global leader for the supply of specific pathogen-free, or SPF,chickens and fertile chicken eggs. SPF chicken embryos are used by animal health companies asself-contained ‘‘bioreactors’’ for the manufacture of live and inactivated viruses. These viruses are usedas a raw material primarily in poultry, as well as human vaccine, applications. The production of SPFeggs is done under biosecure conditions, similar in many ways to our research model production. Wehave a worldwide presence that includes several SPF egg production facilities in the United States, aswell as facilities in Germany and Australia, and a joint venture in Mexico. We also operate aspecialized avian laboratory in the United States, which provides in-house testing and support servicesto our customers.
In Vitro Technology. Our in vitro business provides non-animal, or in vitro, methods for testing thesafety of drugs and medical devices. We are committed to being the leader in providing our customerswith in vitro alternatives as these methods become scientifically validated and commercially feasible.Our in vitro technology business produces and distributes test kits, reagents, software, accessories,instruments and associated services to pharmaceutical and biotechnology companies for medical devicesand other products worldwide. We are a market leader in endotoxin testing, which is used for qualitycontrol testing of injectable drugs and medical devices, their components and the processes underwhich they are manufactured, for the presence of endotoxins. Quality control testing for endotoxincontamination by our customers is an FDA requirement for injectable drugs and medical devices.Endotoxin testing uses a processed extract from the blood of the horseshoe crab, known as limulusamebocyte lysate (LAL). The LAL test is the first and only major FDA-validated in vitro alternative toan animal model test for endotoxin detection in pharmaceutical and medical device manufacturing. Theprocess of extracting blood is generally not harmful to the crabs, which are subsequently returned totheir natural ocean environment. Our Endosafe Portable Testing System (Endosafe�-PTS) is a portableendotoxin testing platform which allows endotoxin testing in the field, affording researchers accurateand timely results. We are currently pursuing FDA approval of our PTS system.
Preclinical Services
Discovery represents the earliest stages of research and development in the life sciences, directedto the identification, screening and selection of a lead compound for future drug development.
4

Discovery is followed by development activities, which are directed at demonstrating the safety andefficacy of the selected drug candidates. During the preclinical stage of the development process, thedrug candidate is tested in vitro (in a test tube) and in vivo (in research models) generally over a one tothree-year period. Discovery and development represent most of the preclinical activities in drugdevelopment. The development services portion of our preclinical business segment enables ourcustomers to outsource their non-core drug development activities to us. These activities are typicallyrequired for support of the regulatory filings necessary to obtain FDA approval. The demand for theseservices is driven by the biotechnology and pharmaceutical industries’ trends to outsource certainpreclinical drug discovery and development activities.
We are one of the two largest providers of preclinical services worldwide, with market leadingpositions in general and specialty toxicology, with facilities in the United States, Canada and Europe.The Preclinical Services segment combines our previously called development and safety testingbusiness with Inveresk’s preclinical testing business and represented 34.7% of our total net sales in2004. With the consolidation of Inveresk for a full year, we believe that our Preclinical Servicessegment will represent a larger share of total sales in 2005. We currently offer preclinical services in thefollowing main areas of drug discovery and development:
General and Specialty Toxicology. Our team of scientists, including toxicologists, pathologists, andregulatory specialists, designs and performs general and highly specialized studies to evaluate the safetyand toxicity of new pharmaceutical compounds, industrial chemicals, food additives, agrochemicals andother materials. We are an industry leader in the fields of reproductive and developmental toxicology,photobiology, infusion and inhalation toxicology, and other specialty toxicological assessments. We alsoperform immunotoxicology studies designed to detect, in vitro, the effects of a pharmaceutical on thehuman immune systems.
Pathology Services. In the drug development process, the ability to identify and characterizepathologic changes within tissues and cells is critical in determining the safety of a new compound. Weemploy highly trained pathologists who use state-of-the-art techniques to identify pathology withintissues and cells, as well as at the molecular level. Frequently, decisions regarding continued productdevelopment are dependent on these pathology findings.
Interventional and Surgical Services (ISS). Many sophisticated drugs are designed to beadministered directly to a precise location within the body using surgical, or ‘‘invasive,’’ techniques. Thedevelopment of these and certain other drugs requires the use of surgical techniques to administer adrug, or to observe its effects in various tissues. Our ISS group offers extensive capabilities in this area,and has collaborated with world-renowned experts in the fields of cardiology, inflammation, andpathology at leading academic institutions. Our ISS unit also provides a wide variety of medical devicetesting services from prototype feasibility testing to long-term GLP, or good laboratory practices,studies, primarily in large research models. The FDA requires companies introducing medical devicesto test the biocompatibility of any new materials that have not previously been approved for contactwith human tissue. Our services include cardiovascular surgery, biomaterial reactivity studies,orthopedic studies and related laboratory services. We maintain state-of-the-art surgical suites whereour skilled professional staff implement custom surgery protocols provided by our customers. InJanuary 2004, we expanded our business in this area with the acquisition of River Valley Farms, amedical device contract research business located near Minneapolis, Minnesota.
Biopharmaceutical Services. We provide specialized non-clinical quality control testing that isfrequently outsourced by both pharmaceutical and biotechnology companies. These services allow ourcustomers to determine if the human protein drug candidates, or the process for manufacturing thoseproducts, are essentially free of residual biological materials. The bulk of this testing work is requiredby the FDA for obtaining new drug approval, maintaining an FDA-licensed manufacturing facility orreleasing approved products for use in patients. Our scientific staff consults with customers in the areas
5
of process development, validation, manufacturing scale-up and biological testing. Inveresk addedEuropean capabilities.
Pharmacokinetic and Metabolic Analysis. Our scientists conduct metabolic studies to reveal howdrugs are broken down, absorbed and eliminated from certain organs, tissues and the circulatorysystems in multiple species. In addition, we have extensive capabilities and resources which can bedirected towards assessing, both in vivo and in vitro, the pharmacokinetic compounds in leadoptimization studies. These studies can be performed as part of the drug screening process to helpdiscover and nominate lead compounds, as well as later in the development process to provideinformation regarding safety and efficacy.
Bioanalytical Chemistry. Our bioanalytical chemistry services support all phases of drug discoveryand development from lead optimization through non-clinical studies and clinical trials. For leadoptimization support, our researchers apply proven high throughput methodologies to rapidly screencompounds to evaluate pharmacokinetic properties. In supporting non-clinical and clinical developmentstudies, our researchers develop and validate assays in full regulatory compliance to support theseefforts.
Clinical Services
The clinical market represents a new market and growth opportunity for us. With the acquisitionof Inveresk in October 2004, we acquired a Phase I-IV business, which includes a premier EuropeanPhase I clinic and an established international capability to manage Phase II-IV studies. Inveresk’sclinical development business was established in 1988. It presently employs approximately 1,000 peopleand operates from 13 facilities located across the United States and Europe. The Clinical Servicessegment accounted for approximately 3.2% of our total net sales in 2004. With the consolidation ofInveresk for a full year, we believe that the Clinical Services segment will represent a larger share oftotal sales in 2005.
Phase I Trials in Patients and Special Populations
The 62-bed clinic in Edinburgh, Scotland, conducts a wide range of Phase I clinical trials designedto move lead pharmaceutical candidates rapidly from preclinical development through Phase Itolerability assessment to explore human pharmacology. This facility is in close proximity to one of ourlaboratory sciences facilities, which is responsible for performing the analysis of biological samplesgenerated by our Phase I clinic, guaranteeing fast response times. All of our volunteers go through anintensive screening process to ensure suitability for our studies. Our Phase I clinic can conduct all typesof studies and has experience across a wide range of therapeutic areas. We can undertake specialpopulation studies in groups such as the elderly, post-menopausal women or patients with specificdiagnoses such as asthma or hyper lipidemia disease. Additionally, we conduct Phase I trials in patientsfor specific indications at investigational sites throughout the United States.
Earlier in 2004, the European Union attempted to harmonize clinical trial processes between theUnited States and the European Union. While the process, known as the European Clinical TrialDirective, is likely to ultimately improve the environment for clinical trials in Europe, it led to aslowdown in business from the United States due to an increase in time to initiate Phase I trials byU.S. companies in Europe as U.S. drug companies awaited regulatory clarity prior to initiating newtrials. Ultimately, we expect business to return to pre-Directive levels. In the meantime, we have signedbusiness from clients in Europe and Japan which has replaced the U.S. business.
6

Phase II-IV Clinical Development and Regulatory Support
From our 13 offices worldwide and business operations in more than 20 countries, we manageevery aspect of clinical trials from clinical development plans and protocol design to New DrugApplications (NDAs) and post-marketing surveillance. We provide a comprehensive range of services aseither a full-service package or as individual stand-alone services. In addition to conducting single sitestudies in many parts of the world, we have a proven track record of managing large internationalmulti-center trials culminating in regulatory filings. We have supported studies in over 25 countries.Our clinical trials management services include: strategy development; study design; investigatorrecruitment; project management; quality assurance; patient recruitment; study monitoring; clinical datamanagement; biostatistical analysis; medical research and consulting; post-marketing/Phase IV studies;and services related to switching product classifications from ‘‘prescription only’’ to ‘‘over-the-counter.’’
We also have significant expertise in conducting patient and other outcomes registries, such aspregnancy registries, on behalf of the pharmaceutical industry, as well as regulatory support. Before aproduct can be launched in any country, it must be approved by the regulatory agency in that particularcountry. We offer comprehensive global regulatory product registration services at all stages ofdevelopment for pharmaceutical and biotechnology products and have particular expertise with theregulations in Europe and North America. Through this service, we help our clients determine thefeasibility of developing a particular product or product line.
Our Strategy
Our business is primarily driven by the continued growth of research and development spending bypharmaceutical, biotechnology and medical device companies, the federal government and academicinstitutions and of outsourced services. According to the Pharmaceutical Research and Manufactures ofAmerica (PHRMA) 2003 study, it takes 8 to 14 years and costs approximately $1 billion to bring a newdrug to market. As the pressure to develop new drugs increases for these industries, so does thepressure to contain costs, implement research in multiple countries simultaneously and identify, hireand retain a breadth of experienced experts. In order to facilitate and speed their research, ourpharmaceutical and biotechnology customers have increasingly outsourced services which can beprovided by high-quality service providers like Charles River. Outsourcing allows our customers toconcentrate their resources on the basic drug development which only they can do, while continuing toadvance their most promising products through the development pipeline. These trends, both of whichwe expect to continue to grow, create opportunities for companies such as ours that can help speed thedrug discovery and development process. Our strategy is to capitalize on these opportunities bycontinuing to build our portfolio of high end, value-added products and services through internaldevelopment, joint ventures, partnerships and acquisitions.
We intend to continue to broaden the scope of our products and services. Primarily throughacquisitions and alliances, we have improved our ability to offer new services that complement ourexisting drug discovery and development businesses. Over the past decade, we have completed 24acquisitions and alliances that have contributed to our financial results. Several of our operations beganas platform acquisitions, which we were able to grow by developing and marketing the acquiredproducts or services to our extensive global customer base. We intend to further pursue strategicplatform acquisitions to drive our long-term growth. We believe our approach to acquisitions is adisciplined one that seeks to focus on businesses that are a sound strategic fit and that offer theprospect of enhancing stockholder value. This strategy may include geographic expansion of an existingcore service, strengthening of one of our core services or the addition of a new product or service.
We believe that we are well positioned to exploit both existing and new outsourcing opportunities.We intend to focus our marketing efforts on stimulating demand for further outsourcing to gain
7

additional market share. We also intend to expand our opportunities by continuing to increase ourinternational presence.
Customers
Our customers continue to consist primarily of large pharmaceutical companies, as well asbiotechnology, animal health, medical device and diagnostic companies, hospitals, academic institutions,government agencies and other life sciences companies. We have many long-term, stable relationshipswith our customers. During 2004, no single commercial customer accounted for more than 5% of ourtotal net sales.
For information regarding net sales and long-lived assets attributable to each of our businesssegments for the last three fiscal years, please see Note 16 included in the Notes to ConsolidatedFinancial Statements included elsewhere in this Form 10-K. For information regarding net sales andlong-lived assets attributable to operations in the United States, Europe, Japan and other countries foreach of the last three fiscal years, please review Note 16 included in the Notes to ConsolidatedFinancial Statements included elsewhere in this Form 10-K.
Sales, Marketing and Customer Support
We sell our products and services principally through our direct sales force, the majority of whomwork in the United States, with the balance working in Europe and Japan. The direct sales force issupplemented by a network of international distributors for our products businesses. Our primarypromotional activities include organizing scientific symposia, publishing scientific papers, makingpresentations and participating at scientific conferences and trade shows in North America, Europe andJapan. We supplement these scientifically based marketing activities with trade advertising, direct mail,newsletters and our web site.
Our internal marketing/product management teams support the field sales staff while developingand implementing programs to create close working relationships with customers in the biomedicalresearch industry. We maintain customer service, technical assistance and consulting servicedepartments, which address both our customers’ routine and more specialized needs. We frequentlyassist our customers in solving problems related to animal husbandry, health and genetics, biosecurity,preclinical and clinical study design, regulatory consulting, protocol development and other areas inwhich our expertise is recognized as a valuable customer resource.
Research and Development
We do not maintain a fully dedicated research and development staff and therefore, have not hadany significant research and development costs in any of the past three fiscal years. Our approach todeveloping new products or services is to extend our base technologies into new applications and fields,and in some instances to license or acquire technologies to serve as platforms for the development ofnew businesses that service our existing customer base. Our research and development focus isprincipally on developing projects that improve our productivity or processes.
Industry Support and Animal Welfare
One of our core values is a concern for and commitment to animal welfare. We have been in theforefront of animal welfare improvements in our industry, and continue to demonstrate ourcommitment with special recognition programs for employees who demonstrate an extraordinarycommitment in this critical area of our business. We created our own Human Care Initiative, which isdirected by our Animal Welfare and Training Group. The goal of the initiative is to assure that wecontinue as a worldwide leader in the humane care of laboratory animals. Laboratory animals are animportant resource that further our knowledge of living systems and contribute to the discovery of
8

life-saving drugs and procedures. We work hand-in-hand with the scientific community to understandhow living conditions, handling procedures and stress play an important role in the quality andefficiency of research. As animal caregivers and researchers, we are responsible to our clients and thepublic for the health and well being of the animals in our care.
We support a wide variety of organizations and individuals working to further animal welfare aswell as the interests of the biomedical research community. We fund internships in laboratory animalmedicine, provide financial support to non-profit institutions that educate the public about the benefitsof animal research and provide awards and prizes to outstanding leaders in the laboratory animalmedicine field. One of our businesses dedicates a portion of its net sales, through a royalty, to supportsimilar programs and initiatives.
Employees
As of December 25, 2004, we had approximately 8,000 employees, including more than 500 scienceprofessionals with advanced degrees including D.V.M.s, Ph.D.s and M.D.s. Our employees are notunionized in the United States, although employees are unionized at some of our European facilities,consistent with local customs for our industry. Our annual satisfaction surveys indicate that we have agood relationship with our employees.
Backlog
Our backlog for Preclinical Services and Clinical Services was approximately $425.0 million atDecember 25, 2004. We do not report backlog for the RMS segment because turnaround time fromorder placement to fulfillment, both for products and services, is fairly rapid. Our preclinical andclinical services are performed over varying times, from a short period of time to extended periods oftime, which may be as long as several years. We maintain an order backlog for these segments to trackanticipated revenue from studies and projects that either have not started, but are anticipated to beginin the near future, or are in process and have not been completed. We only recognize a study orproject in backlog after we have received written evidence of a customer’s intention to proceed with astudy or project. Cancelled studies or projects are removed from backlog.
We believe our aggregate backlog as of any date is not necessarily an indicator of our futureresults for a variety of reasons. First, studies vary in duration. For instance, some studies that areincluded in 2004 backlog may be completed in 2005, while others may be completed in later years.Second, the scope of studies may change, which may either increase or decrease their value. Third,studies included in backlog may be subject to bonus or penalty payments. Fourth, studies may beterminated or delayed at any time by the client or regulatory authorities. Terminations or delays canresult from a number of reasons. Delayed contracts remain in our backlog until a determination ofwhether to continue, modify or cancel the study has been made.
Competition
Our strategy is to become a leader in each of the markets in which we participate. We compete inthe marketplace on the basis of quality, reputation and availability, supported by our internationalpresence with strategically located facilities.
The competitive landscape for our three business segments varies. For RMS, our main competitorsinclude three smaller competitors in North America, several smaller competitors in Europe, and twosmaller competitors in Japan. Of our main United States competitors, two are privately-held businessesand the third is a government-funded, not-for-profit institution. We believe that none of ourcompetitors in RMS has our comparable global reach, financial strength, breadth of product andservices offerings and pharmaceutical and biotechnology industry relationships.
9
Both our preclinical and clinical businesses compete primarily with in-house departments ofpharmaceutical companies, other drug development services organizations, universities and teachinghospitals. We believe we are one of the two largest providers of preclinical services in the world, basedon net service revenue. Our commercial competitors for preclinical services are both publicly-held andprivately-owned companies. The clinical development services market is highly fragmented, withparticipants ranging from hundreds of small, limited-service providers to a few full service drugdevelopment services organizations with global operations. We believe that we compete for clinicalservices business with a number of publicly-traded and privately-owned companies.
Regulatory Matters
The Animal Welfare Act (AWA) governs the treatment of particular species intended for use inresearch. The AWA imposes a wide variety of specific regulations on producers and users of thesespecies, most notably cage size, shipping conditions, sanitation and environmental enrichment methods.We comply with licensing and registration requirement standards set by the United States Departmentof Agriculture (USDA) for handling regulated species, including breeding, research use, maintenanceand transportation. However, rats, mice and chickens bred for research are not regulated under theAWA. Congress recently adopted legislation which permanently excludes these species from regulationunder the AWA. As a result, most of our United States small animal research model activities and ourvaccine support services operations are not subject to regulation under the AWA. Our animalproduction facilities in the U.S. are accredited by The Association for Assessment and Accreditation ofLaboratory Animal Care International (AAALAC), a highly regarded member association whichmaintains standards that often exceed those of the USDA. Portions of our preclinical business are alsogenerally regulated by the USDA.
Our foreign animal import facilities are subject to a variety of national, regional, and local lawsand regulations, which establish the standards for the humane treatment, care and handling of animalsby dealers and research facilities. Our animal import facilities maintain the certificates, licenses,detailed standard operating procedures and other documentation necessary to comply with applicableregulations for the humane treatment of the animals in our custody.
Our laboratory services are subject to various regulatory requirements designed to ensure thequality and integrity of the development processes. The industry standards for conducting preclinicallaboratory testing are embodied in the Good Laboratory Practices (GLP) and Good ManufacturingPractice (GMP) regulations. The standards of GLP and GMP are required by the FDA, the U.S.Environmental Protection Agency, the Department of Health in the United Kingdom, the HealthProtection Branch of Health Canada, the Japanese Ministry of Health and Welfare, the EuropeanAgency for the Evaluation of Medicinal Products and similar regulatory authorities in other parts of theworld. GLP and GMP stipulate requirements for facilities, equipment and professional staff. Theregulations require standardized procedures for conducting studies, including procedures for recordingand reporting data and for managing study materials and records. To help satisfy our complianceobligations, we have established quality assurance and quality control systems at our laboratories thatmonitor ongoing compliance with GLP and GMP regulations and the Clinical Laboratory ImprovementAmendments, as applicable, by auditing development data and conducting inspections of developmentprocedures. In addition, we have obtained FDA approval to conduct Stability and Lot Release Testingin compliance with GMP.
Our manufacture of test kits and reagents for endotoxin testing is subject to regulation by theFDA under the authority of the Federal Food, Drug, and Cosmetic Act. We are required to registerwith the FDA as a device manufacturer and are subject to inspection on a routine basis for compliancewith the FDA’s Quality System Regulations and Good Manufacturing Practices. These regulationsrequire that we manufacture our products and maintain our documents in a prescribed manner withrespect to manufacturing, testing and control activities.
10

The industry standards for the conduct of clinical research and development studies are embodiedin the regulations for Good Clinical Practice (GCP). The FDA and other regulatory authorities requirethat results of clinical trials that are submitted to such authorities be based on studies conducted inaccordance with GCP.
As with GLP, noncompliance with GCP can result in the disqualification of data collected andreports issued during the clinical trial. In addition, under certain clinical contracts, we have directlyassumed certain obligations of the study sponsor under FDA regulations.
Our standard operating procedures are written in accordance with regulations and guidelinesappropriate to the region and the nation where they will be used. All clinical research is carried out inaccordance with the International Conference on Harmonization—Good Clinical Practice Guidelinesand the requirements of the applicable country. Although the United States is a signatory to theseguidelines, the FDA has not adopted all of the guidelines as statutory regulations, but has currentlyadopted them only as guidelines. From an international perspective, when applicable, we haveimplemented common standard operating procedures across regions to assure consistency whenever it isfeasible and appropriate to do so.
All of our sites are also subject to licensing and regulation under national, regional and local lawsrelating to the surface and air transportation of laboratory specimens, the handling, storage anddisposal of laboratory specimens, hazardous waste and radioactive materials, and the safety and healthof laboratory employees. Although we believe we are currently in compliance in all material respectswith such national, regional and local laws, failure to comply could subject us to denial of the right toconduct business, fines, criminal penalties and other enforcement actions.
To ensure that we comply with all scientific and medical regulatory matters we are subject to, eachdivision of our business has established an independent quality assurance group that is responsible formonitoring compliance. In compliance with GCP, we conduct our Phase I clinical trials under thesupervision of an Ethics Committee and have undertaken measures to ensure the protection ofpersonal data.
11

Corporate Governance
We are committed to operating our business with integrity and accountability. We complied withall of the New York Stock Exchange (the ‘‘NYSE’’) corporate governance standards prior to theirapproval by the Securities and Exchange Commission (the ‘‘SEC’’). Nine of our ten Board membersare independent and have no significant financial, business or personal ties to the Company ormanagement and all of our Board committees are composed of independent directors. The Boardadopted Corporate Governance Guidelines and a Code of Business Conduct and Ethics which has beencommunicated to employees and posted on our website. We have always been diligent in complyingwith established accounting principles and are committed to providing financial information that istransparent, timely and accurate. We have established a process through which employees, eitherdirectly or anonymously, can notify management (and the Audit Committee of the Board of Directors)of alleged accounting and auditing concerns or violations including fraud. We created an internalDisclosure Committee that meets regularly and adopted disclosure procedures and guidelines to helpensure that our public disclosures are accurate and timely. A copy of our Corporate GovernanceGuidelines and Code of Business Conduct and Ethics are available on our website at www.criver.comunder the ‘‘Investors Relations—Corporate Governance’’ caption.
Risks Related to Our Business and Industry
Set forth below and elsewhere in this Form 10-K and in other documents we file with the SEC arerisks and uncertainties that could cause actual results to differ materially from the results contemplatedby the forward-looking statements contained in this Form 10-K.
Our business is subject to risks relating to operating internationally.
A significant part of our net sales is derived from operations outside the United States. Ourinternational revenues, which include revenues from our non-U.S. subsidiaries, represented 36.3% ofour total net sales in 2004, 30.8% in 2003, and 27.4% in 2002. We expect that international revenueswill continue to account for a significant percentage of our revenues for the foreseeable future. Thereare a number of risks arising from our international business, including:
• foreign currencies we receive for sales outside the United States could be subject to unfavorableexchange rates with the U.S. dollar and reduce the amount of revenue that we recognize;
• general economic and political conditions in the markets in which we operate;
• potential international conflicts, including terrorist acts;
• potential increased costs associated with overlapping tax structures;
• potential trade restrictions and exchange controls;
• difficulties and costs associated with staffing and managing foreign operations;
• unexpected changes in regulatory requirements;
• the difficulties of compliance with a wide variety of foreign laws and regulations;
• longer accounts receivable cycles in certain foreign countries; and
• import and export licensing requirements.
Our operations and financial results could be significantly affected by the above mentioned risks.
12
A reduction in research and development budgets may adversely affect our business.
Our customers include researchers at pharmaceutical and biotechnology companies. Our ability tocontinue to grow and win new business is dependent upon the ability and willingness of thepharmaceutical and biotechnology industries to continue to spend on research and development at ratesclose to or at historical levels and to outsource the products and services we provide. Fluctuations inthe research and development budgets of these researchers and their organizations could have asignificant effect on the demand for our products and services. Research and development budgetsfluctuate due to changes in available resources, mergers of pharmaceutical and biotechnologycompanies, spending priorities and institutional budgetary policies. Our business could be adverselyaffected by any significant decrease in life sciences research and development expenditures bypharmaceutical and biotechnology companies, as well as by academic institutions, governmentlaboratories or private foundations.
A reduction or delay in government funding of research and development may adversely affect our business.
A portion of net sales in our RMS segment is derived from customers at academic institutions andresearch laboratories whose funding is partially dependent on both the level and timing of funding fromgovernment sources, such as the U.S. National Institutes of Health (NIH) and similar domestic andinternational agencies. Although the level of government research funding has increased substantiallyduring the past several years the size of budgetary increases has recently declined. Government fundingof research and development is subject to the political process, which is inherently unpredictable. Oursales may be adversely affected if our customers delay purchases as a result of uncertaintiessurrounding the approval of government budget proposals. Also, government proposals to reduce oreliminate budgetary deficits have sometimes included reduced allocations to the NIH and othergovernment agencies that fund research and development activities. A reduction in government fundingfor the NIH or other government research agencies could adversely affect our business and ourfinancial results.
The outsourcing trend in the preclinical and non-clinical stages of drug discovery and development maydecrease, which could slow our growth.
Some areas of our preclinical business have grown significantly as a result of the increase over thepast several years in pharmaceutical and biotechnology companies outsourcing their preclinical andnon-clinical research support activities. While industry analysts expect the outsourcing trend to continuefor the next several years, a substantial decrease in preclinical and non-clinical outsourcing activitycould result in a diminished growth rate in the sales of one or more of our expected higher-growthareas. Our customer contracts are generally terminable on little or no notice. Termination of a largecontract for services or multiple contracts for services could adversely affect our sales and profitability.
Generally, our agreements with our customers provide that the customer can terminate theagreements or reduce the scope of services under the agreements with little or no notice. Customersmay elect to terminate their agreements with us for various reasons, including: unexpected or undesiredstudy results; production problems resulting in shortages of the drug being tested; the customer’sdecision to forego or terminate a particular study; or the loss of funding for the particular researchstudy. If a customer terminates a contract with us, we are entitled under the terms of the contract toreceive revenue earned to date as well as certain other costs and, in some cases, penalties. Cancellationof a large contract or simultaneous cancellation of multiple contracts could materially adversely affectthe Preclinical or Clinical segments’ business and, therefore, may adversely affect our operating results.
13

If we are not successful in selecting and integrating the businesses and technologies we acquire, our businessmay suffer.
During the past four years, we have expanded our business through several acquisitions. We planto continue to grow our business through acquisitions of businesses and technologies and the formationof alliances. However, businesses and technologies may not be available on terms and conditions wefind acceptable. Even if completed, acquisitions and alliances involve numerous risks which mayinclude:
• difficulties and expenses incurred in assimilating operations, services, products or technologies;
• difficulties in developing and operating new businesses, including diversion of management’sattention from other business concerns;
• the potential loss of key employees of an acquired business and difficulties in attracting newemployees to grow businesses; and
• difficulties in achieving business and financial success.
In the event that an acquired business or technology or an alliance does not meet expectations, ourresults of operations may be adversely affected. We may not be able to successfully integrateacquisitions into our existing business or successfully exploit new business or technologies.
Contaminations in our animal populations can damage our inventory, harm our reputation forcontaminant-free production and result in decreased sales.
Our research models and fertile chicken eggs must be free of contaminants such as viruses andbacteria because the presence of contaminants can distort or compromise the quality of researchresults. Contaminations in our isolated breeding rooms or poultry houses could disrupt ourcontaminant-free research model and fertile egg production, harm our reputation for contaminant-freeproduction and result in decreased sales.
Contaminations typically require cleaning up the contaminated room or poultry house. Thisclean-up results in inventory loss, clean-up and start-up costs, and reduced sales as a result of lostcustomer orders and credits for prior shipments. These contaminations are unanticipated and difficultto predict and could adversely impact our financial results. We have made significant capitalexpenditures designed to strengthen our biosecurity and have significantly improved our operatingprocedures to protect against such contaminations, however, contaminations may still occur.
Negative attention from special interest groups may impair our business.
Our core research model activities with rats, mice and other rodents have not historically been thesubject of animal rights media attention. However, research activities with animals have been thesubject of adverse attention, particularly in the United Kingdom. This has involved on-site protests andother demonstrations at facilities operated by us, certain of our competitors, customers and suppliers.Any negative attention or threats directed against our animal research activities in the future couldimpair our ability to operate our business efficiently and effectively. In addition, if regulatoryauthorities were to mandate a significant reduction in safety testing procedures which utilize laboratoryanimals (as has been advocated by certain groups), our business could be materially adversely effected.
Several of our product and service offerings are dependent on a limited source of supply, which if interruptedcould adversely affect our business.
We depend on a limited international source of supply of our large animal models required in ourproduct and service offerings. Disruptions to their continued supply may arise from colony fertility andhealth problems, export or import restrictions or embargoes, foreign government or economic
14

instability, severe weather conditions or contract disputes or disruptions. Any disruption of supply couldharm our business if we cannot remove the disruption or are unable to secure an alternative orsecondary supply source on comparable commercial terms.
Tax benefits we expect to be available in the future may be subject to challenge.
In connection with our 1999 recapitalization, our then current shareholders, CRL Acquisition LLC(CRL Acquisition) and Bausch & Lomb Incorporated (B&L), made a joint election intended to permitus to increase the depreciable and amortizable tax basis in our assets for federal income tax purposes,thereby providing us with expected future tax benefits. In connection with our initial public offering in2000, CRL Acquisition reorganized, terminated its existence as a corporation for tax purposes anddistributed a substantial portion of its stock to its members. We believe that the reorganization andliquidating distribution should not have any impact on the election for federal income tax purposes.However, it is possible that the Internal Revenue Service (IRS) may contend that this reorganizationand liquidating distribution should be integrated with our original recapitalization. If the IRS were tobe successful with this contention, the expected future tax benefits at the time of the recapitalizationwould not be available and we would be required to write off the related deferred tax asset.
Our debt level could adversely affect our business and growth prospects.
At December 25, 2004, we had approximately $685.8 million of debt. This debt could havesignificant adverse effects on our business, including making it more difficult for us to obtain additionalfinancing on favorable terms; requiring us to dedicate a substantial portion of our cash flows fromoperations to the repayment of debt and the interest on this debt; limiting our ability to capitalize onsignificant business opportunities; and making us more vulnerable to rising interest rates.
We could be adversely affected by tax law changes in the United Kingdom or Canada.
Our operations in the United Kingdom and Canada currently benefit from favorable corporate taxarrangements. We receive substantial tax credits in Canada from both the Canadian federal andQuebec governments and it benefits from tax credits and accelerated tax depreciation allowances in theUnited Kingdom. Any reduction in the availability or amount of these tax credits or allowances wouldbe likely to have a material adverse effect on profits and cash flow from either or both of our Canadianand United Kingdom operations, and on our effective tax rate.
Impairment of goodwill arising from the acquisition of Inveresk may adversely impact future results ofoperations.
Our acquisition of Inveresk was accounted for as a purchase by us under accounting principlesgenerally accepted in the United States. Under the purchase method of accounting, the assets andliabilities of Inveresk, including identifiable intangible assets, have been recorded at their respective fairvalues as of the date the acquisition was completed. The excess of the purchase price over the fairvalue of acquired net assets and liabilities was recorded as goodwill. As a result of the combination, wehave recorded $1.3 billion of additional goodwill and $0.2 billion of other intangible assets, which arematerial to us. The goodwill will not be amortized, but will be reviewed for impairment by us at leastannually. If the future growth and operating results of the acquired businesses are not as strong asanticipated, goodwill may be impaired. To the extent goodwill is impaired, its carrying value will bewritten down to its implied fair value and a charge will be made to our earnings. Such an impairmentcharge could materially and adversely affect our operating results and financial condition.
15

Our exposure to exchange rate fluctuations could adversely affect our results of operations.
With the acquisition of Inveresk, we derive a significant portion of our revenue from operationsoutside of the United States, primarily from our operations in Canada and the United Kingdom, wheresignificant amounts of revenues and expenses are recorded in local (non-U.S.) currency. Our financialstatements are presented in U.S. dollars. Accordingly, changes in currency exchange rates, particularlybetween the pound sterling, the Canadian dollar and the U.S. dollar, will cause fluctuations in ourreported financial results, which could be material. In addition, our contracts with its foreign customersare frequently denominated in currencies other than the currency in which we incur expenses related tothose contracts. This is particularly the case with respect to Inveresk’s Canadian operations, where itscontracts generally provide for invoicing clients in U.S. dollars but its expenses are generally incurred inCanadian dollars. Where expenses are incurred in currencies other than those in which contracts arepriced, fluctuations in the relative value of those currencies could have a material adverse effect on ourresults of operations.
Contract research services create a risk of liability.
In contracting to work on drug development trials, we face a range of potential liabilities, forexample:
• errors or omissions that create harm during a trial to study volunteers or after a trial toconsumers of the drug after regulatory approval of the drug;
• general risks associated with Phase I facilities, including negative consequences from theadministration of drugs to clinical trial participants or the professional malpractice of Phase Imedical care providers;
• errors or omissions from tests conducted for the agrochemical and food industries;
• risks that animals in our breeding facilities may be infected with diseases that may be harmfuland even lethal to themselves and humans despite preventive measures contained in ourcompany policies for the quarantine and handling of imported animals; and
• errors and omissions during a trial that may undermine the usefulness of a trial or data from thetrial.
We also contract with physicians, also referred to as investigators, to conduct the clinical trials totest new drugs on human volunteers. These tests can create a risk of liability for personal injury ordeath to volunteers, resulting from negative reactions to the drugs administered or from professionalmalpractice by third party investigators, particularly to volunteers with life-threatening illnesses. Webelieve that our risks in this area are generally reduced by the contract provisions entitling us to beindemnified or entitling us to a limitation of liability; insurance maintained by our clients, investigators,and by us; and various regulatory requirements we must follow in connection with our business.
Contractual indemnifications generally do not protect us against liability arising from certain of ourown actions, such as negligence or misconduct. We could be materially and adversely affected if wewere required to pay damages or bear the costs of defending any claim which is not covered by acontractual indemnification provision or in the event that a party who must indemnify us does notfulfill its indemnification obligations or which is beyond the level of our insurance coverage. There canbe no assurance that we will be able to maintain such insurance coverage on terms acceptable to us.
If we are unable to attract suitable investigators and volunteers for our clinical trials, our business mightsuffer.
The clinical research studies we run rely upon the ready accessibility and willing participation ofphysician investigators and volunteer subjects. Investigators are typically located at hospitals, clinics or
16

other sites and supervise administration of the study drug to patients during the course of a clinicaltrial. Volunteer subjects generally include people from the communities in which the studies areconducted, including our Phase I clinic in Edinburgh, Scotland, which to date has provided a substantialpool of potential subjects for research studies. Our clinical research development business could beadversely affected if we were unable to attract suitable and willing investigators or volunteers on aconsistent basis.
New technologies may be developed, validated and increasingly used in biomedical research that could reducedemand for some of our products and services.
For many years, groups within the scientific and research communities have attempted to developmodels, methods and systems that would replace or supplement the use of living animals as testsubjects in biomedical research. Companies have developed several techniques that have scientificmerit, especially in the area of cosmetics and household product testing, markets in which we do notmarket our products or services. Only a few alternative test methods in the discovery and developmentof effective and safe treatments for human and animal disease conditions have been validated andsuccessfully deployed. The principal validated non-animal test system is the LAL, or endotoxindetection system, a technology which we acquired and have aggressively marketed as an alternative totesting in animals. It is our strategy to participate in some fashion with any non-animal test method asit becomes validated as a research model alternative or adjunct in our markets. However, thesemethods may not be available to us or we may not be successful in commercializing these methods.Even if we are successful, sales or profits from these methods may not offset reduced sales or profitsfrom research models. Alternative research methods could decrease the need for research models, andwe may not be able to develop new products effectively or in a timely manner to replace any lost sales.
We depend on key personnel and may not be able to retain these employees or recruit additional qualifiedpersonnel, which would harm our business.
Our success depends to a significant extent on the continued services of our senior managementand other members of management. James C. Foster, our Chief Executive Officer since 1992 andChairman since 2000, has held various positions with us for 28 years. We have no employmentagreement with Mr. Foster. If Mr. Foster or other members of management do not continue in theirpresent positions, our business may suffer.
Because of the specialized scientific nature of our business, we are highly dependent uponqualified scientific, technical and managerial personnel. While we have an excellent record of employeeretention, there is still strong competition for qualified personnel in the pharmaceutical andbiotechnology fields. Therefore, we may not be able to attract and retain the qualified personnelnecessary for the development of our business. The loss of the services of existing personnel, as well asthe failure to recruit additional key scientific, technical and managerial personnel in a timely manner,could harm our business.
Our quarterly operating results may vary, which could negatively affect the market price of our common stock.
Our results of operations in any quarter may vary from quarter to quarter and are influenced bysuch factors as the number and scope of ongoing customer engagements, the commencement,postponement, completion or cancellation of customer contracts in the quarter, changes in the mix ofour products and services, the extent of cost overruns, holiday patterns of our customers, budget cyclesof our customers, and exchange rate fluctuations. We believe that operating results for any particularquarter are not necessarily a meaningful indication of future results. Nonetheless, fluctuations in ourquarterly operating results could negatively affect the market price of our common stock.
17

Item 2. Properties
We own and lease our facilities. We own large facilities (over 50,000 square feet) for ourpreclinical services businesses in the United States, Canada, Scotland and Ireland, and lease largefacilities in the United States and Canada. We own large RMS facilities in the United Kingdom,France, Germany, Japan, Mexico, and the United States. We lease large facilities for our ClinicalServices business in Canada and the United States None of our leases are individually material to ourbusiness operations and many have an option to renew. We believe that we will be able to successfullyrenew expiring leases on terms satisfactory to us. We believe that our facilities are adequate for ouroperations and that suitable additional space will be available when needed. For additional informationsee Note 8 to the Consolidated Financial Statements included elsewhere in this Form 10-K.
Item 3. Legal Proceedings
We are not a party to any material legal proceedings, other than ordinary routine litigationincidental to our business that is not material to our business or financial condition.
Item 4. Submission of Matters to a Vote of Security Holders
At a Special Meeting of Shareholders held on October 20, 2004, the following proposals wereadopted by the votes specified below:
(a) A proposal to adopt the Agreement and Plan of Merger dated as of June 30, 2004, asamended, by and among the Company, Inveresk Research Group, Inc., Indigo Merger I Corp. andIndigo Merger II LLC and approve the transaction contemplated by the merger agreement:
FOR: 38,270,498AGAINST: 113,937ABSTAIN: 34,581NO VOTES: 0
(b) A proposal to approve an adjournment of the special meeting, if necessary, to solicitadditional proxies in favor of the adoption of the merger agreement and approval of thetransaction:
FOR: 16,965,422AGAINST: 17,099,830ABSTAIN: 4,352,764NO VOTES: 0
Supplementary Item. Executive Officers of the Registrant pursuant to Instruction 3 to Item 401(b) ofRegulation S-K.
Below are the names, ages and principal occupations for the last five years of each our currentexecutive officers. All such persons have been elected to serve until their successors are elected andqualified or until their earlier resignation or removal.
Joanne P. Acford, age 49, joined us in November 2004 as Corporate Senior Vice President, GeneralCounsel and Corporate Secretary. Prior to joining us, Ms. Acford held a number of positions over20 years at John Hancock Financial Services, Inc., most recently as Senior Vice President and DeputyGeneral Counsel. Previously, Ms. Acford was an associate in the Corporate Department at Hale andDorr.
18

Thomas F. Ackerman, age 50, joined us in 1988 with over eleven years of combined publicaccounting and international finance experience. He was named Controller, North America in 1992 andbecame our Vice President and Chief Financial Officer in 1996. In 1999, he was named a Senior VicePresident. He is currently responsible for overseeing our Accounting and Finance Department andseveral other corporate staff departments. Prior to joining us, Mr. Ackerman was an accountant atArthur Andersen & Co.
Brian Bathgate, age 45, joined us in October 2004 with the acquisition of Inveresk. He is aCorporate Vice President and President, European Preclinical. He served as President of Inveresk’sPreclinical Europe operations since April 2001. Dr. Bathgate served as General Manager of InvereskResearch International Limited from 1996 until April 2001, responsible for all activities relating to theEuropean preclinical business.
James C. Foster, age 54, joined us in 1976 as General Counsel. Over the past 28 years, Mr. Fosterhas held various staff and managerial positions, and was named our President in 1991, Chief ExecutiveOfficer in 1992 and our Chairman in 2000.
Jorg M. Geller, age 50, joined us in 1986 as a production manager in our animal production facilityin Germany and has had various management positions since then. In 1994, Mr. Geller became VicePresident, Charles River Europe, responsible for our activities in Germany and Northern and EasternEurope. In 1997, Mr. Geller assumed responsibility for our avian production unit (SPAFAS) and in2003 was named a Corporate Vice President.
Nancy A. Gillett, age 49, joined us in 1999 with the acquisition of Sierra Biomedical. Dr. Gilletthas 20 years of experience as an ACVP board certified pathologist and scientific manager. In 1999, shebecame Senior Vice President and General Manager of our Sierra Biomedical division withresponsibilities for Sierra’s ongoing business operations. In 2002, Dr. Gillett became interim CorporateVice President of Discovery and Development Services and President and General Manager of SierraBiomedical, overseeing operations for our Argus Laboratories, PAI, Redfield Laboratories, SpringbornLaboratories and Worcester Laboratories divisions. In 2003, Dr. Gillett became Corporate VicePresident and General Manager of Drug Discovery and Development. In 2004, Dr. Gillett becameCorporate Senior Vice President and President, Global Preclinical Services.
David P. Johst, age 43, joined us in 1991 as Corporate Counsel and was named Vice President,Human Resources in 1995. He became Vice President, Human Resources and Administration in 1996,and a Senior Vice President in 1999. He is responsible for overseeing our Human Resourcesdepartment, our consulting and staffing services business unit and several other corporate staffdepartments. Prior to joining the Company, Mr. Johst was an associate in the Corporate Department atHale and Dorr.
Real H. Renaud, age 57, joined us in 1964 and has over 40 years of research models productionand related management experience. In 1986, Mr. Renaud became Vice President of Production, withresponsibility for overseeing the Company’s North American small animal operations, and was namedVice President, Worldwide Production in 1990. Mr. Renaud became Vice President and GeneralManager, European and North American Animal Operations in 1996, following a two-year Europeanassignment during which he provided direct oversight to our European operations. In 1999, he becamea Senior Vice President and in 2003, Mr. Renaud became Executive Vice President and GeneralManager, Global Research Models and Services.
19

PART II
Item 5. Market for Registrant’s Common Equity, Related Stockholder Matters and Issuer PurchasesOf Equity Securities
Our common stock began trading on the New York Stock Exchange (NYSE) on June 23, 2000under the symbol ‘‘CRL.’’ The following table sets forth for the periods indicated below closing pricesfor our common stock, as reported on the NYSE Composite Tape.
2005 High Low
First quarter (through March 1, 2005) . . . . . . . . . . . . . . . . . . . . . . . . . . . . . . . . . . . $51.00 $44.06
2004 High Low
First quarter . . . . . . . . . . . . . . . . . . . . . . . . . . . . . . . . . . . . . . . . . . . . . . . . . . . . . $44.84 $33.77Second quarter . . . . . . . . . . . . . . . . . . . . . . . . . . . . . . . . . . . . . . . . . . . . . . . . . . . . 47.25 42.03Third quarter . . . . . . . . . . . . . . . . . . . . . . . . . . . . . . . . . . . . . . . . . . . . . . . . . . . . . 48.87 41.76Fourth quarter . . . . . . . . . . . . . . . . . . . . . . . . . . . . . . . . . . . . . . . . . . . . . . . . . . . . 48.79 44.31
2003 High Low
First quarter . . . . . . . . . . . . . . . . . . . . . . . . . . . . . . . . . . . . . . . . . . . . . . . . . . . . . $33.48 $25.45Second quarter . . . . . . . . . . . . . . . . . . . . . . . . . . . . . . . . . . . . . . . . . . . . . . . . . . . . 33.99 24.75Third quarter . . . . . . . . . . . . . . . . . . . . . . . . . . . . . . . . . . . . . . . . . . . . . . . . . . . . . 37.16 30.90Fourth quarter . . . . . . . . . . . . . . . . . . . . . . . . . . . . . . . . . . . . . . . . . . . . . . . . . . . . 35.01 30.25
There were no equity securities that were not registered under the Securities Act of 1933, asamended, sold by the Company during the fiscal year ended December 25, 2004.
Shareholders
As of March 1, 2005, there were approximately 174 registered shareholders of the outstandingshares of common stock.
Dividends
We have not declared or paid any cash dividends on shares of our common stock in the past twoyears, except to our former parent companies, and we do not intend to pay cash dividends in theforeseeable future. We currently intend to retain any earnings to finance future operations andexpansion. Some of the restrictive covenants contained in our revolving credit agreement and term loanagreement limit our ability to pay dividends.
20

Securities Authorized for Issuance Under Equity Compensation Plans
The following table summarizes, as of December 25, 2004, the number of options issued under theCompany’s stock option plans and the number of options available for future issuance under theseplans.
Number of securitiesremaining available for
Number of securities to be Weighted-average future issuance underissued upon exercise of exercise price of equity compensation
outstanding options, outstanding options, plans (excluding securitiesPlan Category warrants and rights warrants and rights reflected in column (a))
(a) (b) (c)
Equity compensation plan approvedby security holders:Charles River 2000 Incentive Plan 4,107,401 35.46 1,331,366Charles River 1999 Management
Incentive Plan . . . . . . . . . . . . . 588,584 7.89 12,417Charles River 2000 Directors
Stock Plan . . . . . . . . . . . . . . . . 56,000 26.19 4,000Inveresk 2002 Stock Option Plan . 813,902 22.00 1,595,307Inveresk 2002 Non-Employee
Directors Stock Option Plan . . . 22,000 24.89 339,789Equity compensation plans not
approved by security holders . . . . — — —
Total . . . . . . . . . . . . . . . . . . . . . . . 5,587,887 30.47 3,282,879
21

Item 6. Selected Consolidated Financial Data
The following table presents our selected consolidated financial data and other data as of and forthe fiscal years ended December 25, 2004, December 27, 2003, December 28, 2002, December 29, 2001and December 30, 2000. The Statement of Income Data and Other Data for the fiscal years endedDecember 25, 2004, December 27, 2003 and December 28, 2002, and the Balance Sheet Data atDecember 25, 2004 and December 27, 2003 have been derived from the audited consolidated financialstatements for such years, included elsewhere in this Form 10-K. The Statement of Income Data andOther Data for the fiscal years ended December 29, 2001 and December 30, 2000 and the BalanceSheet Data at December 28, 2002, December 29, 2001 and December 30, 2000 have been derived fromthe audited consolidated financial statements for such years not included in this Form 10-K. You shouldread the selected consolidated financial data contained in this table in conjunction with ‘‘Management’sDiscussion and Analysis of Financial Condition and Results of Operations’’ and our consolidatedfinancial statements and the related notes.
Fiscal Year(1)
2004 2003 2002 2001 2000
(dollars in thousands)
Statement of Income Data:Net sales . . . . . . . . . . . . . . . . . . . . . . . . . . . . $ 766,917 $613,723 $554,629 $465,630 $306,585Cost of products sold and services provided . . 468,351 380,058 345,646 298,379 186,654Selling, general and administrative expenses . . 121,448 89,489 83,303 68,315 51,204Other operating expenses, net . . . . . . . . . . . . — 747 — — —Amortization of goodwill and intangibles . . . . 16,795 4,876 3,414 8,653 3,666Operating income . . . . . . . . . . . . . . . . . . . . . 160,323 138,553 122,266 90,283 65,061Interest income . . . . . . . . . . . . . . . . . . . . . . . 3,285 1,774 2,120 1,493 1,644Interest expense . . . . . . . . . . . . . . . . . . . . . . (11,806) (8,480) (11,205) (22,797) (40,691)Loss on debt retirement . . . . . . . . . . . . . . . . . — — (29,882) (8,066) (44,771)Other, net . . . . . . . . . . . . . . . . . . . . . . . . . . . 723 783 1,222 500 71Income (loss) before income taxes, minority
interests and earnings from equityinvestments . . . . . . . . . . . . . . . . . . . . . . . . 152,525 132,630 84,521 61,413 (18,686)
Provision for (benefit from) income taxes . . . . 61,156 51,063 31,921 24,272 (7,833)Income (loss) before minority interests and
earnings from equity investments . . . . . . . . 91,369 81,567 52,600 37,141 (10,853)Minority interests . . . . . . . . . . . . . . . . . . . . . (1,577) (1,416) (2,784) (2,206) (1,396)Earnings from equity investments . . . . . . . . . . — — 316 472 1,025Net income (loss) . . . . . . . . . . . . . . . . . . . . . $ 89,792 $ 80,151 $ 50,132 $ 35,407 $(11,224)
Earnings (loss) per common share:Basic . . . . . . . . . . . . . . . . . . . . . . . . . . . . . . $ 1.81 $ 1.76 $ 1.12 $ 0.86 $ (0.40)Diluted . . . . . . . . . . . . . . . . . . . . . . . . . . . . . $ 1.68 $ 1.64 $ 1.06 $ 0.80 $ (0.35)
Other Data:Depreciation and amortization . . . . . . . . . . . . $ 46,309 $ 29,564 $ 23,986 $ 27,175 $ 16,766Capital expenditures . . . . . . . . . . . . . . . . . . . 45,336 32,704 37,543 36,406 15,565
Balance Sheet Data (at end of period):Cash and cash equivalents . . . . . . . . . . . . . . . 207,566 $182,331 $122,509 $ 58,271 $ 33,129Working capital . . . . . . . . . . . . . . . . . . . . . . . 161,191 256,537 164,723 111,622 55,417Goodwill, net . . . . . . . . . . . . . . . . . . . . . . . . 1,422,586 105,308 96,532 52,087 26,979Total assets . . . . . . . . . . . . . . . . . . . . . . . . . . 2,626,835 799,554 701,344 571,362 413,545Total debt . . . . . . . . . . . . . . . . . . . . . . . . . . . 686,845 186,002 195,818 156,800 202,912Total shareholders’ equity (deficit) . . . . . . . . . 1,472,505 464,623 357,376 289,510 119,864
(1) Our fiscal year consists of 12 months ending on the last Saturday on, or prior to, December 31.
22

Item 7. Management’s Discussion and Analysis of Financial Condition and Results of Operations
Overview
We are a leading provider of critical research tools and integrated support services that enableinnovative and efficient drug discovery and development. We are the global leader in providing theanimal research models required in research and development for new drugs, devices and therapies andhave been in business for more than 55 years. Our acquisition of Inveresk during the fourth quarter of2004 provides us with the platform to expand our preclinical business, service customers in the clinicalmarket and develop additional closely related business with potential for future growth. Our expandedproducts and services capability resulting from the Inveresk acquisition allows us to provide customerswith broader support for their efforts to bring new drugs, devices and therapies to market. We havecreated a global leader in research models and services, a leader in drug safety testing, a significantprovider of phase I-IV clinical development services and of biosafety testing.
The continued growth for drug discovery and development services, which was aided by customers’increased outsourcing programs, along with our ongoing customer focus continued to strengthen ourglobal business operations. These factors resulted in strong financial performance in 2004 demonstratedby solid revenue growth, strong profitability and cash flow. During the year we experienced favorablemarket conditions as demand remained strong especially for toxicology services. Customers continuedto outsource services to aid them in their efforts to bring new drugs, devices and therapies to market.We continue to see strong customer demand for toxicology services and specialty animals in ourmarkets. To support the growing demand overseas for our RMS business, we opened two new facilitiesin 2004 in Lyon, France and Osaka, Japan and a third new facility in the Tokyo area which opened inFebruary 2005. To meet the growing demand for our preclinical services, we have a number ofexpansion projects underway including new capacity in Montreal, Canada, which is scheduled to openin the first quarter of 2005 and in Edinburgh, Scotland, which is scheduled to open in early 2006.Finally, our growth strategy has long included the acquisition of companies to serve as growthplatforms. We continue to see near and long-term opportunities for adding new platforms throughacquisition that complement our business and increase the rate of our growth.
Our results for 2004 include the nine weeks in the year during which Inveresk was owned by us.Total net sales in 2004 were $766.9 million, an increase of 25.0% over the same period last year.Inveresk contributed 9.9% to the net sales gain and favorable foreign currency translation contributedapproximately 2.9% to the net sales gain. Our gross margin increased to 38.9% of net sales, comparedto 38.1% of net sales for the same period last year. Operating income for the year was $160.3compared to $138.6 for 2003. The operating margin was 20.9% compared to 22.6% for last year. Our2004 operating margin was unfavorably impacted by 2.2% due to amortization of intangibles related tothe acquisition of Inveresk of $12.1 million, stock based compensation related to the acquisition ofInveresk of $2.3 million and the Proteomics write-off of $3.0 million.
Net income was $89.8 million in 2004 compared to $80.2 million in 2003. Diluted earnings pershare for 2004 was $1.68 compared to $1.64 in 2003. The unfavorable impact of the Invereskamortization ($0.14), Inveresk related stock based compensation ($0.03), Proteomics write-off ($0.03)and a deferred tax adjustment related to the European reorganization ($0.14), partially offset by afavorable reversal of the tax valuation allowance ($0.04), reduced diluted earnings per share by $0.30 in2004.
We report three segments, Research Models and Services (RMS), Preclinical Services and ClinicalServices. We changed our segments to reflect our results of operations and facilitate understanding ofthe Company’s business. The changes in segments have no effect on our consolidated revenues or netincome. The RMS segment aligns all the businesses that are based upon research models includingsales of research models, transgenic services, laboratory services and contract staffing. Our PreclinicalServices segment includes all the product and services to take a drug or medical device through the
23

development process including sales of general and specialty toxicology services, pathology services,interventional and surgical services, biopharmaceutical services, pharmacokinetic and metabolic analysisand bioanalytical chemistry. The Clinical Services segment was created with the acquisition of Invereskwith its clinical service business. Our Clinical Services segment conducts Phase I clinical trials andprovides Phase II-IV clinical trials management services which includes testing, medical data sciencesservices and regulatory support.
Our RMS segment represented 62.2% of net sales in 2004. Net sales for this segment increased11.3% over the same period in 2003. Favorable foreign currency translation contributed approximately3.8% of the net sales gain. Operating income increased to 32.0% of net sales in 2004, compared to31.9% of net sales for the same period last year resulting from increased utilization due to the salesgrowth partially offset by the litigation settlement in 2003 which accounted for 0.7%.
Our Preclinical Services segment represented 34.7% of net sales in 2004. Sales for this segmentincreased 43.3% over the same period last year. Favorable foreign currency translation contributed lessthan 1% of the net sales gain During the year we experienced favorable market conditions as demandfor toxicology services remained strong. We see improving levels of customer demand in certain of ourdevelopment services businesses, particularly large animal, reproductive toxicology and inhalation.
Our Clinical Services segment represented 3.2% of net sales in 2004. We acquired the clinicalservice business with the acquisition of Inveresk during the fourth quarter.
The following tables show the net sales and the percentage contribution of each of our reportablesegments for the past three years. They also show cost of products sold and services provided, selling,general and administrative expenses, amortization of goodwill and intangibles and operating income bysegment and as percentages of their respective segment net sales.
Fiscal Year Ended
December 25, December 27, December 28,2004 2003 2002
(dollars in millions)
Net sales:Research models and services . . . . . . . . . . $476.7 $428.2 $372.4Preclinical services . . . . . . . . . . . . . . . . . . 266.0 185.5 182.2Clinical services . . . . . . . . . . . . . . . . . . . . 24.3 — —
Cost of products sold and services provided:Research models and services . . . . . . . . . . $269.9 $245.9 $218.3Preclinical services . . . . . . . . . . . . . . . . . . 179.7 134.2 127.4Clinical services . . . . . . . . . . . . . . . . . . . . 18.7 — —
Selling, general and administrative expenses:Research models and services . . . . . . . . . . $ 54.1 $ 47.9 $ 42.4Preclinical services . . . . . . . . . . . . . . . . . . 38.5 26.1 26.3Clinical services . . . . . . . . . . . . . . . . . . . . 2.3 — —Unallocated corporate overhead . . . . . . . . 26.6 15.5 14.5
Amortization of other intangibles:Research models and services . . . . . . . . . . $ 0.2 $ 0.8 $ 0.9Preclinical services . . . . . . . . . . . . . . . . . . 14.1 4.1 2.5Clinical services . . . . . . . . . . . . . . . . . . . . 2.5 — —
Operating income:Research models and services . . . . . . . . . . $152.6 $136.5 $110.8Preclinical services . . . . . . . . . . . . . . . . . . 33.6 17.5 26.0Clinical services . . . . . . . . . . . . . . . . . . . . 0.7 — —Unallocated corporate overhead . . . . . . . . (26.6) (15.5) (14.5)
24

Fiscal Year Ended
December 25, December 27, December 28,2004 2003 2002
(as a percent of net sales)
Net sales:Research models and services . . . . . . . . . . 62.2% 69.8% 67.1%Preclinical services . . . . . . . . . . . . . . . . . . 34.7% 30.2% 32.9%Clinical services . . . . . . . . . . . . . . . . . . . . 3.2% — —
Cost of products sold and services provided:Research models and services . . . . . . . . . . 56.6% 57.4% 58.6%Preclinical services . . . . . . . . . . . . . . . . . . 67.6% 72.3% 69.9%Clinical services . . . . . . . . . . . . . . . . . . . . 77.2% — —
Selling, general and administrative expenses:Research models and services . . . . . . . . . . 11.3% 11.2% 11.4%Preclinical services . . . . . . . . . . . . . . . . . . 14.5% 14.1% 14.4%Clinical services . . . . . . . . . . . . . . . . . . . . 9.5% — —Unallocated corporate overhead . . . . . . . . 3.5% 2.5% 2.6%
Amortization of other intangibles:Research models and services . . . . . . . . . . 0.0% 0.2% 0.2%Preclinical services . . . . . . . . . . . . . . . . . . 5.3% 2.2% 1.4%Clinical services . . . . . . . . . . . . . . . . . . . . 10.3% — —
Operating income:Research models and services . . . . . . . . . . 32.0% 31.9% 29.8%Preclinical services . . . . . . . . . . . . . . . . . . 12.6% 9.4% 14.3%Clinical services . . . . . . . . . . . . . . . . . . . . 3.0% — —Unallocated corporate overhead . . . . . . . . (3.5)% (2.5)% (2.6)%
In our consolidated statements of income, we provide a breakdown of net sales and cost of salesbetween net products and services. Such information is reported irrespective of the business segmentfrom which the sales were generated.
Results of Operations
The following table summarizes historical results of operations as a percentage of net sales for theperiods shown:
Fiscal Year Ended
December 25, December 27, December 28,2004 2003 2002
Net sales . . . . . . . . . . . . . . . . . . . . . . . . . . . . . . . . . . . . . . . . 100.0% 100.0% 100.0%Cost of products sold and services provided . . . . . . . . . . . . . . 61.1% 61.9% 62.3%Selling, general and administrative expenses . . . . . . . . . . . . . . 15.8% 14.6% 15.0%Amortization of other intangibles . . . . . . . . . . . . . . . . . . . . . . 2.2% 0.8% 0.6%Operating Income . . . . . . . . . . . . . . . . . . . . . . . . . . . . . . . . . 20.9% 22.6% 22.0%Interest income . . . . . . . . . . . . . . . . . . . . . . . . . . . . . . . . . . . 0.4% 0.3% 0.4%Interest expense . . . . . . . . . . . . . . . . . . . . . . . . . . . . . . . . . . 1.5% 1.4% 2.0%Loss on debt retirement . . . . . . . . . . . . . . . . . . . . . . . . . . . . . —% — 5.4%Provision for income taxes . . . . . . . . . . . . . . . . . . . . . . . . . . . 8.0% 8.3% 5.8%Minority interests . . . . . . . . . . . . . . . . . . . . . . . . . . . . . . . . . 0.2% 0.2% 0.5%Earnings from equity investments . . . . . . . . . . . . . . . . . . . . . . — — 0.1%Net income . . . . . . . . . . . . . . . . . . . . . . . . . . . . . . . . . . . . . . 11.7% 13.1% 9.0%
25

Critical Accounting Policies and Estimates
Management’s Discussion and Analysis of Financial Condition and Results of Operations discussesthe consolidated financial statements of Charles River Laboratories International, Inc. which have beenprepared in accordance with accounting principles generally accepted in the United States. Thepreparation of these financial statements requires management to make estimates and use assumptionsthat affect the reported amounts of assets, liabilities, revenues and expenses during the reportingperiod. On an ongoing basis, management evaluates its estimates and assumptions. Some of thoseestimates can be subjective and complex, consequently actual results could differ from those estimates.Management bases its estimates and assumptions on historical experience and on various other factorsthat are believed to be reasonable under the circumstances, the results of which form the basis formaking judgments about the carrying values of assets and liabilities that are not readily apparent fromother sources. For any given estimate or assumption made by management, there may also be otherestimates or assumptions that are reasonable. However, we believe that given the current facts andcircumstances, it is unlikely that applying any such alternative judgments would materially impact theaccompanying financial statements. Management believes the following critical accounting policies aremost effected by significant judgments and estimates used in the preparation of our consolidatedfinancial statements. The following summary should be read in conjunction with our consolidatedfinancial statements and the related notes included elsewhere in this Form 10-K. We believe our mostcritical accounting policies and estimates include the following:
• Goodwill and other intangible assets
• Revenue recognition
• Pension plan accounting
• Income taxes and deferred tax assets
Goodwill and Other Intangible Assets. With the acquisition of Inveresk and other businesses wehave acquired, we have material intangible assets, including goodwill and other identifiable finite andindefinite-lived acquired intangibles. The identification and valuation of these intangible assets and thedetermination of the estimated useful lives at the time of acquisition, as well as the completion ofannual impairment tests, require significant management judgments and estimates. These estimates aremade based on, among others, consultations with an accredited independent valuation consultant,reviews of projected future income cash flows and statutory regulations. The use of alternativeestimates and assumptions could increase or decrease the estimated fair value of our goodwill andother intangible assets, and potentially result in a different impact to our results of operations.Furthermore, changes in business strategy and/or market conditions may significantly impact thesejudgments thereby impacting the fair value of these assets, which could result in an impairment of thegoodwill. We performed annual impairment tests in 2004 and concluded the goodwill and otherindefinite-lived intangible asset balances were not impaired. As of December 25, 2004, we had recordedgoodwill and other intangibles of $1.7 billion in the consolidated balance sheet.
Revenue Recognition. We recognize revenue on product and services sales. Recognition of servicerevenue is primarily based on the completion of agreed-upon service procedures including ratespecified contracts and fixed fee contracts. Revenue of agreed-upon rate contracts is recognized asservices are performed, based on rates specified in the contract. Revenue of fixed fee contracts isrecognized as services are performed in accordance with procedures specified by the customers in theform of study protocols. The recognition of service revenue requires management judgments primarilyrelating to the determination of the level of service procedures performed during the period. In somecases, a portion of the contract fee is paid at the time the study is initiated. These advances aredeferred and recognized as revenue as services are performed. As of December 25, 2004, we hadrecorded unbilled revenue of $50.0 million and deferred revenue of $117.5 million in the consolidated
26

balance sheet based on the difference between the estimated level of services performed and the billingarrangements within our service contracts.
Pension Plan Accounting. We have significant plan assets, liabilities and expenses based oninformation provided by independent actuaries. As of December 25, 2004, we had recorded prepaidpension benefit of $3.8 million and a long term liability of $63.7 million. The actuaries use assumptionsto estimate the total benefits ultimately payable to employees and allocate this cost to the serviceperiods. The actuarial assumptions used to calculate pension costs are determined and reviewedannually by management after consulting with outside investment advisors and actuaries. The assumeddiscount rate, which is intended to be the actual rate at which benefits could effectively be settled, isadjusted based on the change in the long-term bond yield as of the measurement date. As ofDecember 25, 2004 the weighted average discount rate for our pension plans was 5.49%.
The assumed expected return on plan assets is the average return expected on the funds investedor to be invested to provide future benefits to pension plan participants. If the actual return is differentfrom the assumed expected return in plan assets, the difference would be amortized over a period ofapproximately 15 to 20 years. During 2004, we lowered our expected return on plan assets resulting ina weighted average return of 7.63% from 8.36% for our pension plans. This is expected to increase theannual pension expense by approximately $0.8 million in 2005.
Income Taxes and Deferred Tax Assets. As part of the process of preparing our consolidatedfinancial statements, we are required to estimate our income taxes in each of the jurisdictions in whichwe operate. This process involves estimating our current tax exposure and assessing temporary andpermanent differences resulting from differing treatment of items for tax and accounting purposes.These differences result in deferred tax assets and liabilities, which are included in our consolidatedbalance sheet. As part of our 1999 recapitalization transaction, we elected under Internal RevenueCode Section 338(h)(10) to treat the transaction as a purchase resulting in a step-up in the tax basis ofthe underlying assets. The election resulted in the recognition of a deferred tax asset in 1999 in theamount of $99.5 million for the estimated future tax benefits associated with the increased tax basis ofthe assets. The balance of this deferred tax asset as of December 25, 2004 was $59.2 million.
In the first quarter of 2004, we reorganized our European operations. The purpose of thereorganization was to streamline the legal entity structure in order to improve operating efficiency andcash management, facilitate acquisitions and provide tax benefits. The reorganization, which did notinvolve reductions of personnel or facility closures, resulted in a one-time, non-cash charge to earningsin the first quarter of 2004 of approximately $7.9 million due primarily to the write-off of a deferredtax asset. In connection with the restructuring, we recorded a tax benefit of $2.1 million on thereduction of a valuation allowance on its foreign tax credits.
We must assess the likelihood that our deferred tax assets will be recovered from future taxableincome and, to the extent we believe that recovery is not likely, we must establish a valuationallowance. As of December 25, 2004, we had a valuation allowance of approximately $10.3 million. Thevaluation allowance is recorded against deferred tax assets for net operating loss carryforwards injurisdictions where management does not believe it is more likely than not a benefit will be realized.Approximately $8.4 million of the valuation was established against deferred tax assets acquired as partof the Inveresk acquisition and any future recognition of the asset will result in an adjustment togoodwill. We have recognized the balance of the deferred tax asset on the belief that it is more likelythan not it will be realized. This belief is based on all available evidence including historical operatingresults, projections of taxable income, and tax planning strategies.
We have provided $41.0 million for U.S. income taxes on Inveresk’s non-US earnings as ofOctober 20, 2004, the date of the Inveresk acquisition. The amount of the deferred tax liability is basedon tax law as enacted on October 20, 2004. We intend to use the pre-acquisition Inveresk earnings tofund a portion of the debt incurred in the acquisition.
27

As of December 25, 2004, earnings of non-U.S. subsidiaries considered to be indefinitely reinvestedtotaled $75.5 million. No provision for U.S. income taxes has been provided thereon. Upon distributionof those earnings in the form of dividends or otherwise, we would be subject to both U.S. taxes andwithholding taxes payable to the various foreign countries. It is not practicable to estimate the amountof additional tax that might be payable on this undistributed foreign income.
On October 22, 2004, the American Jobs Creation Act of 2004 (the ‘‘Act’’) was signed into law.The Act creates a temporary incentive for U.S. multinationals to repatriate accumulated income earnedoutside the U.S. at an effective tax rate of 5.25%. This provision is applicable to our fiscal year 2005.We are currently in the process of evaluating whether or not, and to what extent, if any, this provisionmay benefit us. If we decide to repatriate all of the pre-acquisition earnings of Inveresk in adistribution that qualifies for the reduced tax rate under the Act, we estimate that we may recognize aone-time tax benefit of $21.5 million in the quarter in which the decision is made.
Significant management judgment is required in determining our provision for income taxes, ourdeferred tax assets and liabilities and our future taxable income for purposes of assessing our ability torealize any future benefit from our deferred tax assets. The use of alternative estimates andassumptions could increase or decrease our deferred tax assets and materially impact our results ofoperations. Furthermore in the event that actual results differ from management’s estimates or weadjust these estimates in future periods, our operating results and financial position could be materiallyaffected.
28

Fiscal 2004 Compared to Fiscal 2003
Net Sales. Net sales in 2004 were $766.9 million, an increase of $153.2 million, or 25.0%, from$613.7 million in 2003.
Research Models and Services. In 2004, net sales from our RMS segment were $476.7 million, anincrease of $48.5 million, or 11.3%, from $428.2 million in 2003. Favorable foreign currency translationcontributed approximately 4% to our net sales gain. RMS global prices increased in a range up to 5%with the weighted average increase approximately 3%. Increased unit volume sales of both models andservices added approximately 4% to the net sales increase. Sales of our research models and servicesincreased due to increased general price increases, increased market demand for our higher pricedspecialty units, increased units and greater demand for services in our foreign locations. The RMS salesincrease was driven by increases in basic research and biotechnology spending which drove greaterdemand for our products and services.
Preclinical Services. In 2004, net sales from our Preclinical Services segment were $266.0 million,an increase of $80.5 million, or 43.3%, compared to $185.5 million in 2003. The increase was primarilydue to the acquisition of Inveresk in October 2004 and the increased customer demand in toxicologyand other preclinical services. Our preclinical services business benefited from the growth of thepreclinical market reflecting increased drug development efforts and customers outsourcing. Foreigncurrency contributed less than 1% to the sales growth.
Clinical Services. In the fourth quarter of 2004, we entered the Clinical Services business with theacquisition of Inveresk. Sales from our Clinical Services segment in 2004 were $24.3 million.
Cost of Products Sold and Services Provided. Cost of products sold and services provided in 2004was $468.4 million, an increase of $88.3 million, or 23.2%, from $380.1 million in 2003. Cost ofproducts sold and services provided in 2004 was 61.1% of net sales, compared to 61.9% in 2003 withthe improvement due to greater capacity utilization in the RMS and Preclinical Services segments. Theacquired Inveresk businesses cost of goods sold and services provided include the appropriatedepreciation, facilities cost and other costs which is a refinement of their pre-acquisition reportingwhere it was reported in selling, general and administrative expenses.
Research Models and Services. Cost of products sold and services provided for RMS in 2004 was$269.9 million, an increase of $24.0 million, or 9.8%, compared to $245.9 million in 2003. Cost ofproducts sold and services provided in 2004 improved to 56.6% of net sales compared to 57.4% of netsales in 2003. The decrease in cost of products sold and services provided as a percentage of net saleswas primarily due to capacity utilization and greater operating efficiencies.
Preclinical Services. Cost of products sold and services provided for the Preclinical Servicessegment in 2004 was $179.7 million, an increase of $45.5 million, or 33.9%, compared to $134.2 millionin 2003. Cost of products sold and services provided as a percentage of net sales was 67.6% in 2004,compared to 72.3% in 2003. The decrease in cost of products sold and services provided as apercentage of net sales was primarily due to improved capacity utilization from the increased sales ofservices.
Clinical Services. Cost of product sold and services provided for the Clinical Services segment in2004 was $18.7 million. Cost of products sold and services provided as a percentage of net sales was77.2%.
Selling, General and Administrative Expenses. Selling, general and administrative expenses in 2004were $121.4 million, an increase of $31.9 million, or 35.7%, from $89.5 million in 2003. Selling, generaland administrative expenses in 2004 were 15.8% of net sales compared to 14.6% of net sales in 2003.The increase was due primarily to the write-off related to the closure of the Proteomics business in the
29

fourth quarter, the Inveresk compensation charge for options and increased professional fees related tocompliance with the internal control certification requirements of Sarbanes-Oxley and Invereskintegration costs.
Research Models and Services. Selling, general and administrative expenses for RMS in 2004 were$54.1 million, an increase of $6.2 million, or 12.8%, compared to $47.9 million in 2003. Selling, generaland administrative expenses increased slightly as a percentage of sales to 11.3% in 2004 from 11.2% in2003.
Preclinical Services. Selling, general and administrative expenses for the Preclinical Servicessegment in 2004 were $38.5 million, an increase of $12.4 million, or 47.6%, compared to $26.1 millionin 2003. Selling, general and administrative expenses in 2004 increased to 14.5% of net sales, comparedto 14.1% of net sales in 2003. The increase in selling, general and administrative expenses as a percentof sales in 2004 was due primarily to the impairment of the proteomics business, the Invereskcompensation charge for stock options and increased professional fees related to the Inveresk merger.
Clinical Services. Selling, general and administrative expenses for the Clinical Services segment in2004 were $2.3 million. Selling, general and administrative expenses for the Clinical Services segmentwere 9.5% of net sales in 2004.
Unallocated Corporate Overhead. Unallocated corporate overhead, which consists of variouscorporate expenses including those associated with pension, executive salaries and departments such ascorporate accounting, legal and investor relations, was $26.6 million in 2004, compared to $15.5 millionin 2003. The substantial increase in unallocated corporate overhead in 2004 was due to professionalfees associated with the European reorganization, increased bonuses and increased professional feesrelated to compliance with internal control certification requirements of Sarbanes-Oxley and theInveresk merger.
Other Operating Expenses (Income). During 2003, we recorded a $3.7 million charge in thePreclinical Services segment associated with the closure of a contract manufacturing facility. Alsoduring 2003, our French subsidiaries settled a breach of contract claim they had asserted against acustomer. After legal and related expenses, the net settlement amounted to a gain of approximately$2.9 million which was recorded in the RMS segment.
Amortization of Other Intangibles. Amortization of other intangibles in 2004 was $16.8 million, anincrease of $11.9 million, from $4.9 million in 2003. The increased amortization is primarily due to theacquisition of Inveresk.
Research Models and Services. In 2004, amortization for our RMS segment was $0.2 million, adecrease of $0.6 million from $0.8 million in 2003.
Preclinical Services. In 2004, amortization of other intangibles for our Preclinical Services segmentwas $14.1 million, an increase of $10.0 million from $4.1 million in 2003. The increase in amortizationof other intangibles was primarily due to the acquisition of Inveresk.
Clinical Services. In 2004, amortization for our Clinical Services segment was $2.5 million due tothe acquisition of Inveresk.
Operating Income. Operating income in 2004 was $160.3 million, an increase of $21.7 million, or15.7%, from $138.6 million in 2003. Operating income in 2004 was 20.9% of net sales, compared to22.6% of net sales in 2003. The decrease as a percent of sales is due primarily to the Inveresk relatedamortization, the Inveresk stock based compensation charge and the write-off associated with theclosure of the Proteomics business.
30

Research Models and Services. In 2004, operating income for our RMS segment was$152.6 million, an increase of $16.1 million, or 11.7%, from $136.5 million in 2003. Operating incomeas a percentage of net sales in 2004 was 32.0%, compared to 31.9% in 2003. The increase was primarilydue to increased sales and a higher gross margin partially offset by the prior-year gain on thesettlement of a breach of contract claim of $2.9 million or 0.7%.
Preclinical Services. In 2004, operating income for our Preclinical Services segment was$33.6 million, an increase of $16.1 million, or 91.9%, from $17.5 million in 2003. Operating income as apercentage of net sales increased to 12.6%, compared to 9.4% of net sales in 2003. The increase inoperating income in 2004 was primarily due to increased customer demand, the acquisition of Invereskand a charge related to the write-down of certain contract manufacturing assets in 2003, partially offsetby the increased amortization expense.
Clinical Services. In 2004, operating income for our Clinical Services segment was $0.7 million.Operating income as a percentage of net sales was 3.0% in 2004.
Interest Expense. Interest expense in 2004 was $11.8 million, compared to $8.5 million in 2003.The $3.3 million increase was primarily due to the increased borrowing as a result of the Invereskacquisition.
Other Income. Other income for 2004 was $0.7 million compared to $0.8 in 2003. The decreasewas primarily due to less favorable foreign currency exchange rates in 2004.
Income Taxes. Income tax expense for 2004 was $61.2 million, an increase of $10.1 millioncompared to $51.1 million in 2003. Our effective tax rate for 2004 was 40.1%. Excluding chargesassociated with the deferred tax write-off and the benefit from the reversal of the valuation allowance,the effective tax rate for 2004 was 36.2%, compared to the effective tax rate of 38.5% for 2003.
Net Income. Net income in 2004 was $89.8 million, an increase of $9.6 million from $80.2 millionin 2003.
Fiscal 2003 Compared to Fiscal 2002
Net Sales. Net sales in 2003 were $613.7 million, an increase of $59.1 million, or 10.7%, from$554.6 million in 2002. The increase in net sales was primarily due to the increase in sales in our RMSsegment during 2003.
Research Models & Services. In 2003, RMS net sales were $428.2 million, an increase of$55.8 million, or 15.0%, compared to $372.4 million in 2002. Favorable foreign currency translationcontributed approximately 5.8% to our net sales gain. RMS prices increased at certain geographicallocations in a range up to 5% with the weighted average increase of approximately 3%. Increased unitvolume sales of both models and services added approximately 5% to the net sales growth. Researchmodel unit sales increased primarily due to increased demand for our higher-priced specialty units.Sales of our research model services increased in 2003 due to increased pricing, the consolidation ofour Mexican joint venture, an increased market demand and an increase in in vitro safety testing sales.The RMS increase was driven by basic research and biotechnology spending, which drove greaterdemand for our services that support research models, primarily transgenics and laboratory services.This growth reflects the increasing number of new disease models being created and the correspondingneed for sophisticated housing and related high-value services.
Preclinical Services. In 2003, Preclinical Services segment net sales were $185.5 million, anincrease of $3.3 million, or 1.8%, from $182.2 million in 2002. Favorable foreign currency translationcontributed approximately 0.5% to our net sales gain. Preclinical Services segment sales increased in2003 primarily due to our 2002 acquisitions, partially offset by the impact of reduced market demand
31

for toxicology services in early 2003, lower sales in our biosafety testing services business, and theclosure of our contract manufacturing facility. The acquisitions of BioLabs and Springborn contributed$17.8 million, or 9.8%, to the net sales growth in 2003. During 2003, Preclinical Services experiencedpricing pressures due to decreased demand earlier in the year resulting in a nominal price decline forthe year. Our Preclinical Services group recovered from the slower demand for toxicology services weexperienced during late 2002 and early 2003. We believe there is still some excess capacity in certainsegments of the market for outsourced development services, causing lingering price sensitivity.
Cost of Products Sold and Services Provided. Cost of products sold and services provided in 2003was $380.1 million, an increase of $34.5 million, or 10.0%, from $345.6 million in 2002. Cost ofproducts sold and services provided in 2003 was 61.9% of net sales, compared to 62.3% in 2002. Theincrease in cost of products sold and services provided was due primarily to adverse foreign currencyexchange of approximately 4%, increased product volume and general inflation. The decrease in cost ofproducts sold and services provided as a percentage of net sales was primarily due to better utilizationof existing capacity and greater operating efficiencies.
Research Models & Services. Cost of products sold and services provided for RMS in 2003 was$245.9 million, an increase of $27.6 million, or 12.6%, compared to $218.3 million in 2002. Cost ofproducts sold and services provided as a percentage of net sales decreased to 57.4% in 2003 from58.6% in 2002. The decrease in cost of product sold and services provided as a percentage of net saleswas primarily due to better utilization of existing capacity and greater operating efficiencies, mainly inNorth American and European research models and research models services.
Preclinical Services. Cost of products sold and services provided for Preclinical Services segment in2003 was $134.2 million, an increase of $6.8 million, or 5.3%, compared to $127.4 million in 2002. Costof products sold and services provided in 2003 increased to 72.3% of net sales compared to 69.9% ofnet sales in 2002. The increase in cost of products sold and services provided as a percentage of netsales was due primarily to decreased sales of certain development services during early 2003, whichcreated excess capacity, partially offset by the cost savings initiatives we implemented in 2003.
Selling, General and Administrative Expenses. Selling, general and administrative expenses in 2003were $89.5 million, an increase of $6.2 million, or 7.4%, from $83.3 million in 2002. Selling, generaland administrative expenses in 2003 were 14.6% of net sales compared to 15.0% of net sales in 2002.The increase in selling, general and administrative expenses in 2003 was due primarily to adverseforeign currency exchange, a full year of expenses related to the 2002 acquisitions and inflation,partially offset by the cost savings initiatives we implemented in 2003. The decrease in selling, generaland administrative expenses as a percentage of net sales was primarily due to our ability to manage ourcost increases at a rate slightly lower than our sales growth.
Research Models & Services. Selling, general and administrative expenses for RMS in 2003 were$47.9 million, an increase of $5.5 million, or 12.9%, compared to $42.4 million in 2002. Selling, generaland administrative expenses in 2003 decreased to 11.2% of net sales, compared to 11.4% of net sales in2002. The decrease in selling, general and administrative expenses in 2003 as a percentage of net saleswas primarily due to our efforts to limit our expense growth.
Preclinical Services. Selling, general and administrative expenses for Preclinical Services segmentin 2003 were $26.1 million, a decrease of $0.2 million, or 0.3%, compared to $26.3 million in 2002.Selling, general and administrative expenses in 2003 were 14.1% of net sales, compared to 14.4% in2002. Selling, general and administrative expenses for 2003 were virtually flat due mainly to the costsavings initiatives we implemented at the beginning of 2003, partially offset by the full year effect of theacquisitions of Springborn and BioLabs.
32

Unallocated Corporate Overhead. Unallocated corporate overhead, which consists of variouscorporate expenses including those associated with executive salaries and departments such ascorporate accounting, legal and investor relations, was $15.5 million in 2003, compared to $14.5 millionin 2002. The increase in unallocated corporate overhead in 2003 was due to an increased pensionexpense of $2.0 million, partially offset by lower bonuses for 2003.
Other Operating Expenses (Income). During 2003, we recorded a $3.7 million charge in PreclinicalServices associated with the closure of a contract manufacturing facility. Also during 2003, our Frenchsubsidiaries settled a breach of contract claim they had asserted against a customer. After legal andrelated expenses, the net settlement amounted to a gain of approximately $2.9 million in RMS.
Amortization of Other Intangibles. Amortization of other intangibles in 2003 was $4.9 million, anincrease of $1.5 million from $3.4 million in 2002. The increase was due to the full year of amortizationof intangible assets that arose from our 2002 acquisitions of BioLabs and Springborn.
Operating Income. Operating income in 2003 was $138.6 million, an increase of $16.3 million, or13.3%, from $122.3 million in 2002. Operating income in 2003 was 22.6% of net sales, compared to22.0% of net sales in 2002.
Research Models & Services. In 2003, operating income from our RMS segment was$136.5 million, an increase of $25.7 million, or 23.2%, from $110.8 million in 2002. Operating incomein 2003 increased to 31.9% of net sales, compared to 29.8% of net sales in 2002. The increase inoperating income in 2003 was primarily due to increased sales and higher gross margins primarily fromimproved capacity utilization, along with stable selling, general and administrative expenses and thesettlement of the French lawsuit.
Preclinical Services. In 2003, operating income from our Preclinical Services segment was$17.5 million, a decrease of $8.5 million, or 32.5%, from $26.0 million in 2002. Operating income fromsales of Preclinical Services in 2003 was 9.4% of net sales, compared to 14.3% in 2002. The decrease inoperating income in 2003 was primarily due to the decline in demand for these services which impactedgross margins, a charge related to the write-down of certain contract manufacturing assets and a fullyear of amortization of intangibles related to the 2002 acquisitions, partially offset by our costcontainment program.
Interest Income. Interest income in 2003 was $1.8 million, compared to $2.1 million in 2002. Thelower interest income was due primarily to lower interest rates.
Interest Expense. Interest expense in 2003 was $8.5 million, compared to $11.2 million in 2002.The $2.7 million decrease was primarily due to the early retirement of debt.
Loss on Debt Retirement. In 2002, we recorded a loss of $29.9 million relating to premiums paidand the write-off of deferred financing costs and issuance discount in connection with the tender offerfor all of our remaining 13.5% senior subordinated notes, other debt repayments and the terminationof our revolving credit facility.
Other Income. Other income for 2003 was $0.8 million compared to $1.2 million for 2002. Thedecrease was primarily due to lower net foreign currency gains then in 2002.
Income Taxes. The effective tax rate for 2003 was 38.5% compared to the 2002 rate of 37.8%,which included a $0.5 million benefit associated with the release of a valuation allowance in 2002.During 2002, we reassessed the valuation allowance on the deferred tax asset associated with state netoperating loss carryforwards due to state tax planning initiatives and the completion of the 2001 stateincome tax returns.
33

Net Income. Net income in 2003 was $80.2 million, an increase of $30.1 million or 59.9%, from$50.1 million in 2002.
Liquidity and Capital Resources
Fiscal 2004 Compared to Fiscal 2003
Cash and cash equivalents totaled $207.6 million at December 25, 2004, compared to$182.3 million at December 27, 2003.
Net cash provided by operating activities in 2004 and 2003 was $184.8 million and $123.8 million,respectively. The increase in cash provided by operations was primarily due to increased net income,the non-cash write-off of the deferred tax asset in the first quarter of 2004 and increased deferredincome. In connection with the acquisition of Inveresk, we have revised our days sales outstanding toinclude deferred revenue as an offset to accounts receivable in the calculation. Our days salesoutstanding decreased to 32 days as of December 25, 2004, from 43 days as of December 27, 2003,primarily due to the acquisition of Inveresk as well as improvements in other businesses.
Net cash used in investing activities in 2004 and 2003 was $600 million and $63.4 million,respectively. In 2004 we used cash of $572 million to acquire Inveresk and RVF. Our capitalexpenditures in 2004 were $45.3 million of which $26.6 million was related to RMS, $18.5 millionrelated to Preclinical Services and $0.3 million was related to Clinical Services. For 2005, we projectcapital expenditures to be approximately $100 million. In 2004, cash of $32.6 million provided byproceeds from sales of marketable security was partially offset by cash used to purchase marketablesecurities of $16.7 million. This compared to 2003 during which we used net cash of $10.8 million toacquire an additional 19% of equity of Charles River Japan and used $32.8 million for capitalexpenditures of which $23.8 million was used in RMS and $8.8 million was used in Preclinical Services,respectively.
Net cash provided by financing activities in 2004 was $436.9 million and cash used by financingactivities in 2003 was $8.8 million. During 2004, to finance a portion of the Inveresk acquisition, weentered into a credit agreement which provided a $400 million term loan facility and a $150 millionrevolving facility. Additionally, we borrowed and repaid $94.0 million as part of our Europeanreorganization. In 2003 we made payments on our long term debt and capital lease obligations in theamount of $17.0 million.
Minimum future payments of our contractual obligations at December 25, 2004 are as follows:
Less than 1 - 3 4 - 5 AfterContractual Obligations Total 1 Year Years Years 5 Years
Debt(1) . . . . . . . . . . . . . . . . . . . . . . . . . . . . . . . . . . . . $685.8 $ 80.5 $160.2 $445.0 $ 0.1Interest payments(1) . . . . . . . . . . . . . . . . . . . . . . . . . . . 69.0 22.2 36.1 10.7 —Capital lease obligations . . . . . . . . . . . . . . . . . . . . . . . . 1.0 0.4 0.3 0.3 —Operating leases . . . . . . . . . . . . . . . . . . . . . . . . . . . . . . 85.6 18.6 28.7 20.0 18.3
Total contractual cash obligations . . . . . . . . . . . . . . . $841.4 $121.7 $225.3 $476.0 $18.4
(1) The contractual obligation for debt assumes the senior convertible debentures will be repurchasedby us in 2008 when holders of the debentures may exercise the right to require such repurchase.
Off-Balance Sheet Arrangements
We had no off-balance sheet arrangements during any of fiscal 2004, 2003 or 2002.
34

Fiscal 2003 Compared to Fiscal 2002
Cash and cash equivalents totaled $182.3 million at December 27, 2003, compared to$122.5 million at December 28, 2002.
Net cash provided by operating activities in 2003 and 2002 was $123.8 million and $133.7 million,respectively. The decrease in cash provided by operations was primarily a result of the increase inaccounts receivable and decrease in accrued compensation partially offset by the utilization of ourdeferred tax asset. Our revised days sales outstanding calculation includes the benefit of our deferredincome. Our days sales outstanding decreased to 43 days as of December 27, 2003, compared to48 days as of December 28, 2002. In addition, in 2002 we had a significant improvement in DSO, whichadded $11.7 million to cash flow.
Net cash used in investing activities in 2003 and 2002 was $63.4 million and $78.9 million,respectively. In 2003 we used $32.7 million for capital expenditures, $21.8 million for the purchase ofmarketable securities and $10.8 million for the acquisition of an additional 19% of the equity ofCharles River Japan. This compared to 2002 during which we used net cash of $42.5 million to acquireBioLabs and Springborn and $37.5 million for capital expenditures. In 2003, we made capitalexpenditures in RMS and Preclinical Services which were $23.8 million and $8.9 million, respectively.We anticipate that the future capital expenditures will be funded by cash provided by operatingactivities. We continue to evaluate acquisitions to serve as growth platforms as evidenced by ouracquisition of River Valley Farms (RVF) in January 2004. We have various options for financing futureacquisitions, including our existing cash and investments, cash flow provided by operations, and ourability to raise capital through debt and equity financing.
Net cash used in financing activities in 2003 was $8.8 million, compared to net cash provided byfinancing activities in 2002 of $5.2 million. During 2003, we received debt proceeds of $6.9 million andrepaid debt of $17.0 million. In 2002, we issued $185.0 million par value of 3.5% senior convertibledebentures and we used $79.7 million of the proceeds to repay all of the 13.5% senior subordinatednotes and $68.6 million to repay our outstanding senior secured credit facilities.
Recent Accounting Pronouncements
On December 16, 2004, the Financial Accounting Standards Board issued SFAS No. 123 (revised2004), ‘‘Shared-Based Payment,’’ which is a revision of SFAS No. 123. SFAS No. 123(R) supersedesAPB Opinion No. 25, ‘‘Accounting for Stock Issued to Employees,’’ and amends SFAS No. 95,‘‘Statement of Cash Flows.’’ Generally, the approach in SFAS No. 123(R) is similar to the approachdescribed in SFAS No. 123. However, SFAS No. 123(R) requires all share-based payments toemployees, including grants of employee stock options, to be recognized in the income statement basedon their fair values. This revised standard will be effective for us beginning with the third quarter in2005.
As permitted by SFAS No. 123, we currently account for share-based payments to employees usingAPB 25 intrinsic value method and, as such, generally recognizes no compensation cost for employeestock options. Accordingly, the adoption of SFAS No. 123(R)’s fair value method will have an impacton our result of operations, although it will have no impact on our overall financial position. Theimpact of the modified prospective adoption of SFAS No. 123(R) cannot be estimated at this timebecause it will depend on levels of share-based payments granted in the future. However, had weadopted SFAS No. 123(R) in prior periods, the impact of that standard would have approximated theimpact of SFAS 123 as described in the disclosure of pro forma net income and earnings per share.
35

Item 7A. Quantitative and Qualitative Disclosure About Market Risk
Certain of our financial instruments are subject to market risks, including interest rate risk andforeign currency exchange rates. We generally do not use financial instruments for trading or otherspeculative purposes.
Interest Rate Risk
The fair value of our marketable securities is subject to interest rate risk and will fall in value ifmarket interest rates increase. If market rates were to increase immediately and uniformly by 100 basispoints from levels at December 25, 2004, the fair value of the portfolio would decline by less than$0.1 million.
On October 15, 2004, we entered into a credit agreement which provides for a $400 million termloan facility and a $150 million revolving facility. Our primary interest rate exposure results fromchanges in LIBOR or the base rates which are used to determine the applicable interest rates underour term loan and revolving credit facility. Our potential loss over one year that would result from ahypothetical, instantaneous and unfavorable change of 100 basis points in the interest rate would beapproximately $5 million on a pre-tax basis.
The fair value of our senior convertible debenture is subject to interest rate risk and is impactedby our stock price. The estimated fair value of our long-term debt at December 25, 2004 was$726.4 million. Fair values were determined from available market prices, using current interest ratesand terms to maturity.
Our senior convertible debentures accrue interest at an initial rate of 3.5%, which will be reset(but not below the initial rate of 3.5% or above 5.25%) on August 1, 2007, August 1, 2012 andAugust 1, 2016. Fluctuations in interest rates will not affect the interest payable on the seniorconvertible debentures, which is fixed through August 1, 2007.
Foreign Currency Exchange Rate Risk
We also have exposure to some foreign currency exchange rate fluctuations for the cash flowsreceived from our foreign affiliates. This risk is mitigated by the fact that their operations areprincipally conducted in their respective local currencies. With the completion of the Invereskacquisition, a portion of our revenue will be denominated in U.S. dollars with the costs accounted forin their local currencies. We expect to hedge against certain foreign currency exchange rate risksbeginning in 2005 consistent with our hedge policy and will be designated as hedge as set forth in SFASNo. 133, ‘‘Accounting for Derivative Instruments and Hedging Activities.’’
36

Item 8. Financial Statements and Supplementary Data
INDEX
Page
Consolidated Financial Statements:Report of Management . . . . . . . . . . . . . . . . . . . . . . . . . . . . . . . . . . . . . . . . . . . . . . . . . . . . 38Report of Independent Registered Public Accounting Firm . . . . . . . . . . . . . . . . . . . . . . . . . . 39Consolidated Statements of Income for the years ended December 25, 2004, December 27,
2003 and December 28, 2002 . . . . . . . . . . . . . . . . . . . . . . . . . . . . . . . . . . . . . . . . . . . . . . . 41Consolidated Balance Sheets as of December 25, 2004 and December 27, 2003 . . . . . . . . . . . . 42Consolidated Statements of Cash Flows for the years ended December 25, 2004, December 27,
2003 and December 28, 2002 . . . . . . . . . . . . . . . . . . . . . . . . . . . . . . . . . . . . . . . . . . . . . . . 43Consolidated Statements of Changes in Shareholders’ Equity for the years ended
December 25, 2004, December 27, 2003 and December 28, 2002 . . . . . . . . . . . . . . . . . . . . . 44Notes to Consolidated Financial Statements . . . . . . . . . . . . . . . . . . . . . . . . . . . . . . . . . . . . . 45
Financial Statement Schedules:Schedule II. Valuation and Qualifying Accounts . . . . . . . . . . . . . . . . . . . . . . . . . . . . . . . . . . . 83
Supplementary Data:Quarterly Information (Unaudited) . . . . . . . . . . . . . . . . . . . . . . . . . . . . . . . . . . . . . . . . . . . . 84
37

Report of Management
Management’s Report on Internal Control Over Financial Reporting
The management of the company is responsible for establishing and maintaining adequate internalcontrol over financial reporting. Internal control over financial reporting is defined in Rules 13a-15(f)or 15(d)-15(f) promulgated under the Securities Exchange Act of 1934 as a process designed by, orunder the supervision of, the company’s principal executive and principal financial officers and effectedby the company’s board of directors, management and other personnel, to provide reasonable assuranceregarding the reliability of financial reporting and the preparation of financial statements for externalpurposes in accordance with United States generally accepted accounting principles and includes thosepolicies and procedures that:
• Pertain to the maintenance of records that in reasonable detail accurately and fairly reflect thetransactions and dispositions of the assets of the company;
• Provide reasonable assurance that transactions are recorded as necessary to permit preparationof financial statements in accordance with generally accepted accounting principles, and thatreceipts and expenditures of the company are being made only in accordance with authorizationsof management and directors of the company; and
• Provide reasonable assurance regarding prevention or timely detection of unauthorizedacquisition, use or disposition of the company’s assets that could have a material effect on thefinancial statements.
Internal control over financial reporting cannot provide absolute assurance of achieving financialreporting objectives because of its inherent limitations. Internal control over financial reporting is aprocess that involves human diligence and compliance and is subject to lapses in judgment andbreakdowns resulting from human failures. Internal control over financial reporting also can becircumvented by collusion or improper management override. Because of such limitations, there is arisk that material misstatements may not be prevented or detected on a timely basis by internal controlover financial reporting. However, these inherent limitations are known features of the financialreporting process. Therefore, it is possible to design into the process safeguards to reduce, though noteliminate, this risk.
Because of its inherent limitations, internal control over financial reporting may not prevent ordetect misstatements. Also, projections of any evaluation of effectiveness to future periods are subjectto the risk that controls may become inadequate because of changes in conditions, or that the degreeof compliance with the policies or procedures may deteriorate.
The Company’s management assessed the effectiveness of the company’s internal control overfinancial reporting as of December 25, 2004. In making this assessment, the company’s managementused the criteria set forth by the Committee of Sponsoring Organizations of the Treadway Commissionin Internal Control—Integrated Framework. Our assessment excludes the legacy Inveresk businesses weacquired in a purchase business combination in October 2004 as allowed under the rules andclarifications provided by the Securities and Exchange Commission and the Public CompanyAccounting Oversight Board (United States). The Inveresk Research Group, LLC is a wholly ownedsubsidiary whose total assets and revenues represent 67% and 7.9%, respectively, of the consolidatedfinancial statement amounts for the year ended December 25, 2004.
Based on this assessment, management concluded that, as of December 25, 2004, the Company’sinternal control over financial reporting was effective based on those criteria.
Our management’s assessment of the effectiveness of the Company’s internal control over financialreporting as of December 25, 2004 has been audited by PricewaterhouseCoopers LLP, an independent,registered public accounting firm, as stated within their report which appears herein.
38

Report of Independent Registered Public Accounting Firm
To the Board of Directors and Shareholders ofCharles River Laboratories International, Inc.:
We have completed an integrated audit of Charles River Laboratories International, Inc. and itssubsidiaries’ 2004 consolidated financial statements and of its internal control over financial reportingas of December 25, 2004 and audits of its December 27, 2003 and December 28, 2002 consolidatedfinancial statements in accordance with the standards of the Public Company Accounting OversightBoard (United States). Our opinions, based on our audits, are presented below.
Consolidated financial statements and financial statement schedule
In our opinion, the consolidated financial statements listed in the accompanying index, presentfairly, in all material respects, the financial position of Charles River Laboratories International, Inc.and its subsidiaries at December 25, 2004 and December 27, 2003, and the results of their operationsand their cash flows for each of the three years in the period ended December 25, 2004 in conformitywith accounting principles generally accepted in the United States of America. In addition, in ouropinion, the financial statement schedule listed in the accompanying index presents fairly, in allmaterial respects, the information set forth therein when read in conjunction with the relatedconsolidated financial statements. These financial statements and financial statement schedule are theresponsibility of the Company’s management. Our responsibility is to express an opinion on thesefinancial statements and financial statement schedule based on our audits. We conducted our audits ofthese statements in accordance with the standards of the Public Company Accounting Oversight Board(United States). Those standards require that we plan and perform the audit to obtain reasonableassurance about whether the financial statements are free of material misstatement. An audit offinancial statements includes examining, on a test basis, evidence supporting the amounts anddisclosures in the financial statements, assessing the accounting principles used and significant estimatesmade by management, and evaluating the overall financial statement presentation. We believe that ouraudits provide a reasonable basis for our opinion.
Internal control over financial reporting
Also, in our opinion, management’s assessment, included in Management Report on InternalControl Over Financial Reporting appearing under Item 8, that the Company maintained effectiveinternal control over financial reporting as of December 25, 2004 based on criteria established inInternal Control—Integrated Framework issued by the Committee of Sponsoring Organizations of theTreadway Commission (COSO), is fairly stated, in all material respects, based on those criteria.Furthermore, in our opinion, the Company maintained, in all material respects, effective internalcontrol over financial reporting as of December 25, 2004, based on criteria established in InternalControl—Integrated Framework issued by the COSO. The Company’s management is responsible formaintaining effective internal control over financial reporting and for its assessment of the effectivenessof internal control over financial reporting. Our responsibility is to express opinions on management’sassessment and on the effectiveness of the Company’s internal control over financial reporting based onour audit. We conducted our audit of internal control over financial reporting in accordance with thestandards of the Public Company Accounting Oversight Board (United States). Those standards requirethat we plan and perform the audit to obtain reasonable assurance about whether effective internalcontrol over financial reporting was maintained in all material respects. An audit of internal controlover financial reporting includes obtaining an understanding of internal control over financial reporting,evaluating management’s assessment, testing and evaluating the design and operating effectiveness ofinternal control, and performing such other procedures as we consider necessary in the circumstances.We believe that our audit provides a reasonable basis for our opinions.
39

A company’s internal control over financial reporting is a process designed to provide reasonableassurance regarding the reliability of financial reporting and the preparation of financial statements forexternal purposes in accordance with generally accepted accounting principles. A company’s internalcontrol over financial reporting includes those policies and procedures that (i) pertain to themaintenance of records that, in reasonable detail, accurately and fairly reflect the transactions anddispositions of the assets of the company; (ii) provide reasonable assurance that transactions arerecorded as necessary to permit preparation of financial statements in accordance with generallyaccepted accounting principles, and that receipts and expenditures of the company are being made onlyin accordance with authorizations of management and directors of the company; and (iii) providereasonable assurance regarding prevention or timely detection of unauthorized acquisition, use, ordisposition of the company’s assets that could have a material effect on the financial statements.
Because of its inherent limitations, internal control over financial reporting may not prevent ordetect misstatements. Also, projections of any evaluation of effectiveness to future periods are subjectto the risk that controls may become inadequate because of changes in conditions, or that the degreeof compliance with the policies or procedures may deteriorate. As described in Management’s Reporton Internal Control Over Financial Reporting, management has excluded the Inveresk ResearchGroup, Inc. from its assessment of internal control over financial reporting as of December 25, 2004because it was acquired by the Company in a purchase business combination during 2004. We have alsoexcluded the Inveresk Research Group, LLC from our audit of internal control over financial reporting.The Inveresk Research Group, Inc. is a wholly owned subsidiary whose total assets and total revenuesrepresent 67% and 7.9%, respectively, of the related consolidated financial statement amounts as ofand for the year ended December 25, 2004.
PricewaterhouseCoopers LLPBoston, MassachusettsMarch 9, 2005
40

CHARLES RIVER LABORATORIES INTERNATIONAL, INC.
CONSOLIDATED STATEMENTS OF INCOME
(dollars in thousands, except per share amounts)
Fiscal Year Ended
December 25, December 27, December 28,2004 2003 2002
Net sales related to products . . . . . . . . . . . . . . . . . . . . . . . . . $ 339,994 $ 308,201 $ 269,534Net sales related to services . . . . . . . . . . . . . . . . . . . . . . . . . . 426,923 305,522 285,095
Net sales . . . . . . . . . . . . . . . . . . . . . . . . . . . . . . . . . . . . . . . . 766,917 613,723 554,629Costs and expenses
Cost of products sold . . . . . . . . . . . . . . . . . . . . . . . . . . . . . 185,428 170,524 149,839Cost of services provided . . . . . . . . . . . . . . . . . . . . . . . . . . 282,923 209,534 195,807Selling, general and administrative . . . . . . . . . . . . . . . . . . . 121,448 89,489 83,303Other operating expenses, net . . . . . . . . . . . . . . . . . . . . . . . — 747 —Amortization of other intangibles . . . . . . . . . . . . . . . . . . . . 16,795 4,876 3,414
Operating income . . . . . . . . . . . . . . . . . . . . . . . . . . . . . . . . . 160,323 138,553 122,266Other income (expense)
Interest income . . . . . . . . . . . . . . . . . . . . . . . . . . . . . . . . . 3,285 1,774 2,120Interest expense . . . . . . . . . . . . . . . . . . . . . . . . . . . . . . . . . (11,806) (8,480) (11,205)Loss on debt retirement . . . . . . . . . . . . . . . . . . . . . . . . . . . — — (29,882)Other, net . . . . . . . . . . . . . . . . . . . . . . . . . . . . . . . . . . . . . 723 783 1,222
Income before income taxes, minority interests and earningsfrom equity investments . . . . . . . . . . . . . . . . . . . . . . . . . . . 152,525 132,630 84,521
Provision for income taxes . . . . . . . . . . . . . . . . . . . . . . . . . . . 61,156 51,063 31,921
Income before minority interests and earnings from equityinvestments . . . . . . . . . . . . . . . . . . . . . . . . . . . . . . . . . . . . 91,369 81,567 52,600
Minority interests . . . . . . . . . . . . . . . . . . . . . . . . . . . . . . . . . (1,577) (1,416) (2,784)Earnings from equity investments . . . . . . . . . . . . . . . . . . . . . . — — 316
Net income . . . . . . . . . . . . . . . . . . . . . . . . . . . . . . . . . . . . . . $ 89,792 $ 80,151 $ 50,132
Earnings per common shareBasic . . . . . . . . . . . . . . . . . . . . . . . . . . . . . . . . . . . . . . . . . $ 1.81 $ 1.76 $ 1.12Diluted . . . . . . . . . . . . . . . . . . . . . . . . . . . . . . . . . . . . . . . $ 1.68 $ 1.64 $ 1.06
See Notes to Consolidated Financial Statements.
41

CHARLES RIVER LABORATORIES INTERNATIONAL, INC.
CONSOLIDATED BALANCE SHEETS
(dollars in thousands, except per share amounts)
December 25, December 27,2004 2003
AssetsCurrent assets
Cash and cash equivalents . . . . . . . . . . . . . . . . . . . . . . . . . . . . . . . . . $ 207,566 $ 182,331Marketable securities . . . . . . . . . . . . . . . . . . . . . . . . . . . . . . . . . . . . . 234 13,156Trade receivables, net . . . . . . . . . . . . . . . . . . . . . . . . . . . . . . . . . . . . . 201,794 111,514Inventories . . . . . . . . . . . . . . . . . . . . . . . . . . . . . . . . . . . . . . . . . . . . 61,914 52,370Other current assets . . . . . . . . . . . . . . . . . . . . . . . . . . . . . . . . . . . . . . 38,798 11,517
Total current assets . . . . . . . . . . . . . . . . . . . . . . . . . . . . . . . . . . . . . 510,306 370,888Property, plant and equipment, net . . . . . . . . . . . . . . . . . . . . . . . . . . . . . 357,149 203,458Goodwill, net . . . . . . . . . . . . . . . . . . . . . . . . . . . . . . . . . . . . . . . . . . . . 1,422,586 105,308Other intangibles, net . . . . . . . . . . . . . . . . . . . . . . . . . . . . . . . . . . . . . . 256,294 30,415Deferred tax asset, net . . . . . . . . . . . . . . . . . . . . . . . . . . . . . . . . . . . . . . 50,412 61,603Other assets . . . . . . . . . . . . . . . . . . . . . . . . . . . . . . . . . . . . . . . . . . . . . 30,088 27,882
Total assets . . . . . . . . . . . . . . . . . . . . . . . . . . . . . . . . . . . . . . . . . . . $ 2,626,835 $ 799,554
Liabilities and Shareholders’ EquityCurrent liabilities
Current portion of long-term debt and capital lease obligations . . . . . . $ 80,865 $ 319Accounts payable . . . . . . . . . . . . . . . . . . . . . . . . . . . . . . . . . . . . . . . . 28,672 19,433Accrued compensation . . . . . . . . . . . . . . . . . . . . . . . . . . . . . . . . . . . . 46,037 27,251Deferred income . . . . . . . . . . . . . . . . . . . . . . . . . . . . . . . . . . . . . . . . 117,490 30,846Accrued liabilities . . . . . . . . . . . . . . . . . . . . . . . . . . . . . . . . . . . . . . . 51,722 28,843Other current liabilities . . . . . . . . . . . . . . . . . . . . . . . . . . . . . . . . . . . 24,329 7,659
Total current liabilities . . . . . . . . . . . . . . . . . . . . . . . . . . . . . . . . . . 349,115 114,351Long-term debt and capital lease obligations . . . . . . . . . . . . . . . . . . . . . . 605,980 185,683Other long-term liabilities . . . . . . . . . . . . . . . . . . . . . . . . . . . . . . . . . . . 189,443 24,721
Total liabilities . . . . . . . . . . . . . . . . . . . . . . . . . . . . . . . . . . . . . . . . 1,144,538 324,755Commitments and contingenciesMinority interests . . . . . . . . . . . . . . . . . . . . . . . . . . . . . . . . . . . . . . . . . 9,792 10,176Shareholders’ equity
Preferred stock, $0.01 par value; 20,000,000 shares authorized; noshares issued and outstanding . . . . . . . . . . . . . . . . . . . . . . . . . . . . . — —
Common stock, $0.01 par value; 120,000,000 shares authorized;65,785,328 and 45,801,211 shares issued and outstanding atDecember 25, 2004 and December 27, 2003, respectively . . . . . . . . . . 658 458
Capital in excess of par value . . . . . . . . . . . . . . . . . . . . . . . . . . . . . . . 1,518,854 609,781Retained earnings (deficit) . . . . . . . . . . . . . . . . . . . . . . . . . . . . . . . . . (63,093) (152,885)Unearned compensation . . . . . . . . . . . . . . . . . . . . . . . . . . . . . . . . . . . (11,607) (1,985)Accumulated other comprehensive income . . . . . . . . . . . . . . . . . . . . . . 27,693 9,254
Total shareholders’ equity . . . . . . . . . . . . . . . . . . . . . . . . . . . . . . . . 1,472,505 464,623Total liabilities and shareholders’ equity . . . . . . . . . . . . . . . . . . . . . . $ 2,626,835 $ 799,554
See Notes to Consolidated Financial Statements.
42

CHARLES RIVER LABORATORIES INTERNATIONAL, INC.
CONSOLIDATED STATEMENTS OF CASH FLOWS
(dollars in thousands)
Fiscal Year Ended
December 25, December 27, December 28,2004 2003 2002
Cash flows relating to operating activitiesNet income . . . . . . . . . . . . . . . . . . . . . . . . . . . . . . . . . . . . . . . . . . . $ 89,792 $ 80,151 $ 50,132
Adjustments to reconcile net income to net cash provided by operating activities:Depreciation and amortization . . . . . . . . . . . . . . . . . . . . . . . . . . . . . . . 46,309 29,564 23,986Amortization of debt issuance costs and discounts . . . . . . . . . . . . . . . . . . . 1,642 1,216 1,741Amortization of premiums on marketable securities . . . . . . . . . . . . . . . . . . 225 341 —Provision for doubtful accounts . . . . . . . . . . . . . . . . . . . . . . . . . . . . . . . 786 1,494 (25)Loss on debt retirement . . . . . . . . . . . . . . . . . . . . . . . . . . . . . . . . . . . — — 29,882Earnings from equity investments . . . . . . . . . . . . . . . . . . . . . . . . . . . . . — — (316)Minority interests . . . . . . . . . . . . . . . . . . . . . . . . . . . . . . . . . . . . . . . 1,577 1,416 2,784Deferred income taxes . . . . . . . . . . . . . . . . . . . . . . . . . . . . . . . . . . . . 9,079 8,890 (391)Tax benefit from exercises of employee stock options . . . . . . . . . . . . . . . . . 13,804 3,197 4,669Loss on disposal of property, plant and equipment . . . . . . . . . . . . . . . . . . . 460 505 3,526Proteomics write-off . . . . . . . . . . . . . . . . . . . . . . . . . . . . . . . . . . . . . . 2,956 — —Deferred financing cost write-off . . . . . . . . . . . . . . . . . . . . . . . . . . . . . . 105 — —Asset impairment charge . . . . . . . . . . . . . . . . . . . . . . . . . . . . . . . . . . . — 3,655 —Litigation settlement . . . . . . . . . . . . . . . . . . . . . . . . . . . . . . . . . . . . . — (2,908) —Non-cash compensation . . . . . . . . . . . . . . . . . . . . . . . . . . . . . . . . . . . 3,815 1,102 1,002
Changes in assets and liabilities:Restricted cash . . . . . . . . . . . . . . . . . . . . . . . . . . . . . . . . . . . . . . . . . — 5,000 (5,000)Trade receivables . . . . . . . . . . . . . . . . . . . . . . . . . . . . . . . . . . . . . . . (7,260) (13,356) 11,739Inventories . . . . . . . . . . . . . . . . . . . . . . . . . . . . . . . . . . . . . . . . . . . (6,363) (5,733) (1,645)Other current assets . . . . . . . . . . . . . . . . . . . . . . . . . . . . . . . . . . . . . (2,248) 2,590 2,450Other assets . . . . . . . . . . . . . . . . . . . . . . . . . . . . . . . . . . . . . . . . . . 482 2,819 772Accounts payable . . . . . . . . . . . . . . . . . . . . . . . . . . . . . . . . . . . . . . . (2,322) 4,486 (3,753)Accrued compensation . . . . . . . . . . . . . . . . . . . . . . . . . . . . . . . . . . . . 4,694 (6,464) 3,792Deferred income . . . . . . . . . . . . . . . . . . . . . . . . . . . . . . . . . . . . . . . . 22,847 6,308 5,170Accrued liabilities . . . . . . . . . . . . . . . . . . . . . . . . . . . . . . . . . . . . . . . (9,216) (740) (6,943)Other current liabilities . . . . . . . . . . . . . . . . . . . . . . . . . . . . . . . . . . . . 11,586 (2,919) 5,999Other long-term liabilities . . . . . . . . . . . . . . . . . . . . . . . . . . . . . . . . . . 2,077 3,152 4,088
Net cash provided by operating activities . . . . . . . . . . . . . . . . . . . . . . . 184,827 123,766 133,659
Cash flows relating to investing activitiesAcquisition of businesses, net of cash acquired . . . . . . . . . . . . . . . . . . . . . (571,992) (10,841) (42,498)Capital expenditures . . . . . . . . . . . . . . . . . . . . . . . . . . . . . . . . . . . . . (45,336) (32,704) (37,543)Purchases of marketable securities . . . . . . . . . . . . . . . . . . . . . . . . . . . . . (16,689) (21,824) —Proceeds from sale of marketable securities . . . . . . . . . . . . . . . . . . . . . . . 32,621 1,108 —Proceeds from sale of property, plant and equipment . . . . . . . . . . . . . . . . . 1,427 872 1,156
Net cash used in investing activities . . . . . . . . . . . . . . . . . . . . . . . . . . . (599,969) (63,389) (78,885)
Cash flows relating to financing activitiesProceeds from long-term debt and revolving credit facility . . . . . . . . . . . . . . 594,000 6,943 188,922Payments on long-term debt, revolving credit facility and capital lease obligations (174,046) (17,026) (157,882)Premium paid on early retirement of debt . . . . . . . . . . . . . . . . . . . . . . . . — — (23,886)Payments of deferred financing cost . . . . . . . . . . . . . . . . . . . . . . . . . . . . (7,449) (783) (6,123)Proceeds from exercises of employee stock options . . . . . . . . . . . . . . . . . . . 26,554 3,069 3,137Proceeds from exercises of warrants . . . . . . . . . . . . . . . . . . . . . . . . . . . . — 907 2,136Dividends paid to minority interests . . . . . . . . . . . . . . . . . . . . . . . . . . . . (2,112) (1,902) (1,470)Payments received from officer loans . . . . . . . . . . . . . . . . . . . . . . . . . . . — — 341
Net cash provided by (used in) financing activities . . . . . . . . . . . . . . . . . . 436,947 (8,792) 5,175
Effect of exchange rate changes on cash and cash equivalents . . . . . . . . . . . . . 3,430 8,237 4,289
Net change in cash and cash equivalents . . . . . . . . . . . . . . . . . . . . . . . . . . 25,235 59,822 64,238Cash and cash equivalents, beginning of period . . . . . . . . . . . . . . . . . . . . . . 182,331 122,509 58,271
Cash and cash equivalents, end of period . . . . . . . . . . . . . . . . . . . . . . . . . . $ 207,566 $ 182,331 $ 122,509
Supplemental cash flow informationCash paid for interest . . . . . . . . . . . . . . . . . . . . . . . . . . . . . . . . . . . . . $ 6,994 $ 6,957 $ 9,569Cash paid for taxes . . . . . . . . . . . . . . . . . . . . . . . . . . . . . . . . . . . . . . $ 36,302 $ 37,736 $ 15,893
Supplemental non-cash investing activities informationIssuance of common stock related to the Inveresk acquisition . . . . . . . . . . . . $ 841,042 $ — $ —
See Notes to Consolidated Financial Statements.
43

CHARLES RIVER LABORATORIES INTERNATIONAL, INC.
CONSOLIDATED STATEMENTS OF CHANGES IN SHAREHOLDERS’ EQUITY
(dollars in thousands)
AccumulatedOther Capital in Loans
Retained Comprehensive Common Excess of to UnearnedTotal Earnings Income Stock Par Officers Compensation
Balance at December 29, 2001 . . . . . . . . . $ 289,510 $(283,168) $(16,016) $442 $ 588,909 $(341) $ (316)Components of comprehensive income,
net of tax:Net income . . . . . . . . . . . . . . . . . . $ 50,132 $ 50,132 $ — $ — $ — $ — $ —Foreign currency translation adjustment 5,892 — 5,892 — — — —Minimum pension liability adjustment . . 557 — 557 — — — —
Total comprehensive income . . . . . . 56,581 — — — — — —Exercise of stock options . . . . . . . . . . . 3,137 — — 4 3,133 — —Tax benefit from exercise of stock options . 4,669 — — — 4,669 — —Exercise of warrants . . . . . . . . . . . . . . 2,136 — — 5 2,131 — —Issuance of restricted stock to employees . — — — 1 2,886 — (2,887)Amortization of unearned compensation . 1,002 — — — — — 1,002Repayment of officer loans . . . . . . . . . . 341 — — — — 341 —
Balance at December 28, 2002 . . . . . . . . . $ 357,376 $(233,036) $ (9,567) $452 $ 601,728 $ — $ (2,201)Components of comprehensive income,
net of tax:Net income . . . . . . . . . . . . . . . . . . $ 80,151 $ 80,151 $ — $ — $ — $ — $ —Foreign currency translation adjustment 19,015 — 19,015 — — — —Minimum pension liability adjustment . . (266) — (266) — — — —Unrealized gain on marketable
securities . . . . . . . . . . . . . . . . . . 72 — 72 — — — —Total comprehensive income . . . . . . 98,972 — — — — — —
Exercise of stock options . . . . . . . . . . . 3,069 — — 4 3,065 — —Tax benefit from exercise of stock options . 3,197 — — — 3,197 — —Exercise of warrants . . . . . . . . . . . . . . 907 — — 2 905 — —Issuance of restricted stock to employees . — — — — 886 — (886)Amortization of unearned compensation . 1,102 — — — — — 1,102
Balance at December 27, 2003 . . . . . . . . . $ 464,623 $(152,885) $ 9,254 $458 $ 609,781 $ — $ (1,985)Components of comprehensive income,
net of tax:Net income . . . . . . . . . . . . . . . . . . $ 89,792 $ 89,792 $ — $ — $ — $ — $ —Foreign currency translation adjustment 17,010 — 17,010 — — — —Minimum pension liability adjustment . . 1,475 — 1,475 — — — —Unrealized gain on marketable
securities . . . . . . . . . . . . . . . . . . (46) — (46) —Total comprehensive income . . . . . . 108,231 — — — — — —
Issuance of common stock related toacquisition . . . . . . . . . . . . . . . . . . . 841,042 — — 185 840,857 — —
Fair value of stock option exchangerelated to acquisition . . . . . . . . . . . . 30,350 — — — 41,694 — (11,344)
Transaction cost related to acquisition . . . (10,122) — — — (10,122) — —Exercise of stock options . . . . . . . . . . . 26,554 — — 15 26,539 — —Tax benefit from exercise of stock options . 8,011 — — — 8,011 — —Issuance of restricted stock to employees . — — — — 1,513 — (1,513)Performance based compensation . . . . . . 581 — — — 581 — —Amortization of unearned compensation . 3,235 — — — — — 3,235
Balance at December 25, 2004 . . . . . . . . . $ 1,472,505 $ (63,093) $ 27,693 $658 $ 1,518,854 $ — $(11,607)
See Notes to Consolidated Financial Statements.
44

CHARLES RIVER LABORATORIES INTERNATIONAL, INC.
NOTES TO CONSOLIDATED FINANCIAL STATEMENTS
(dollars in thousands, except per share amounts)
1. Description of Business and Summary of Significant Accounting Policies
Description of Business
Charles River Laboratories International, Inc. (together with its subsidiaries, the Company) is aleading global provider of solutions that advance the drug discovery and development process. TheCompany’s fiscal year is the twelve-month period ending the last Saturday in December.
Principles of Consolidation
The consolidated financial statements include all majority-owned subsidiaries. Intercompanyaccounts, transactions and profits are eliminated. Results for three majority-owned subsidiaries arerecorded on a one-month lag basis. There were no material transactions or events for these subsidiariesbetween the reporting date and December 25, 2004.
Use of Estimates
The financial statements have been prepared in conformity with generally accepted accountingprinciples and, as such, include amounts based on informed estimates and judgments of managementwith consideration given to materiality. Actual results could differ from those estimates.
Cash and Cash Equivalents
Cash equivalents include time deposits and highly liquid investments with remaining maturities atthe purchase date of three months or less.
Marketable Securities
The Company accounts for its investment in marketable securities in accordance with Statement ofFinancial Accounting Standards (SFAS) No. 115, ‘‘Accounting for Certain Investments in Debt andEquity Securities.’’ Investments in marketable securities (Note 5) consist of corporate debt securitiesand government securities and obligations which are classified as securities available-for-sale.
Realized gains and losses on securities classified as available-for-sale are included in earnings andare determined using the specific identification method. Unrealized holding gains and losses, net ofrelated tax effects, are excluded from earnings and are reported in accumulated other comprehensiveincome, a separate component of shareholders’ equity, until realized. The amortized cost of debtsecurities is adjusted for amortization of premiums and accretion of discounts to maturity. Suchamortization and accretion is included in interest income.
Allowance for Doubtful Accounts
The Company establishes an allowance for doubtful accounts which it believes is adequate to coveranticipated losses on the collection of all outstanding trade receivable balances. The adequacy of thedoubtful account allowance is based on historical information, a review of major customer accounts,receivable balances and management’s assessment of current economic conditions. The Companyreassesses the allowance for doubtful accounts each quarter.
Inventories
Inventories (Note 6) are stated at the lower of cost, determined principally on the average costmethod, or market. The determination of market value involves assessment of numerous factors,including costs to dispose of inventory and estimated selling price. Reserves are recorded to reduce the
45

CHARLES RIVER LABORATORIES INTERNATIONAL, INC.
NOTES TO CONSOLIDATED FINANCIAL STATEMENTS (Continued)
(dollars in thousands, except per share amounts)
1. Description of Business and Summary of Significant Accounting Policies (Continued)
carrying value for inventory determined damaged, obsolete or otherwise unsaleable. Costs for largeanimals are accumulated in inventory until the animals are sold.
Property, Plant and Equipment
Property, plant and equipment (Note 6), including improvements that significantly add toproductive capacity or extend useful life, are recorded at cost, while maintenance and repairs areexpensed as incurred. Depreciation is calculated for financial reporting purposes using the straight-linemethod based on the estimated useful lives of the assets as follows: buildings, 20 to 40 years; machineryand equipment, 2 to 20 years; furniture and fixtures, 5 to 7 years; vehicles, 2 to 4 years; and leaseholdimprovements, the shorter of estimated useful life or the lease periods.
Goodwill and Other Intangible Assets
Effective at the beginning of fiscal 2002, the Company adopted SFAS No. 142, ‘‘Goodwill andOther Intangible Assets,’’ which establishes financial accounting and reporting standards for acquiredgoodwill and other intangible assets (Note 7). In accordance with SFAS No. 142, goodwill andindefinite-lived intangible assets are no longer amortized but are reviewed at least annually forimpairment. Separate intangible assets that have finite useful lives continue to be amortized over theirestimated useful lives.
SFAS No. 142 requires that goodwill be tested at least annually for impairment using a two-stepprocess. The first step is to identify a potential impairment. The second step of the impairment testmeasures the amount of the impairment loss. The Company completed the annual impairment tests in2004 and 2003 and concluded there was no impairment of goodwill. Intangible assets deemed to havean indefinite life are tested for impairment using a one-step process which compares the fair value tothe carrying amount of the asset. The Company completed the annual impairment tests in 2004 and2003 and concluded there was no impairment of identifiable intangible assets with indefinite usefullives.
Other Assets
Other assets consist primarily of deferred financing costs, the cash surrender value of life insurancepolicies, a defined benefit plan pension asset and certain investments in available-for-sale securities thatthe Company does not intend to dispose of within the next twelve months.
Impairment of Long-Lived Assets
The Company adopted the provisions of SFAS No. 144, ‘‘Accounting for the Impairment orDisposal of Long-lived Assets,’’ in 2002. The Company evaluates long-lived assets whenever events orchanges in circumstances indicate that the carrying amount of an asset may not be recoverable. Animpairment loss would be recognized when estimated undiscounted future cash flows expected to resultfrom the use of the asset and its eventual disposal are less than its carrying amount. In such instances,the carrying value of long-lived assets is reduced to the estimated fair value, as determined using anappraisal or discounted cash flows, as appropriate.
46

CHARLES RIVER LABORATORIES INTERNATIONAL, INC.
NOTES TO CONSOLIDATED FINANCIAL STATEMENTS (Continued)
(dollars in thousands, except per share amounts)
1. Description of Business and Summary of Significant Accounting Policies (Continued)
Stock-Based Compensation Plans
As permitted under SFAS No. 123, ‘‘Accounting for Stock-Based Compensation,’’ the Companyaccounts for its stock-based compensation plans (Note 12) using the intrinsic value method prescribedby Accounting Principles Board (APB) Opinion No. 25, ‘‘Accounting for Stock Issued to Employees’’and Financial Accounting Standards Board (FASB) Interpretation No. 44 (FIN 44), ‘‘Accounting forCertain Transactions Involving Stock Compensation—an interpretation of APB Opinion No. 25.’’ Also,the Company accounts for variable restricted stock grants under the provisions of FASB InterpretationNo. 28, ‘‘Accounting for Stock Appreciation Rights and Other Variable Stock Options Award Plans.’’The Company recognizes compensation expenses for fixed and variable restricted stock grants over therestriction period.
SFAS No. 123 requires the presentation of certain pro forma information as if the Company hadaccounted for its employee stock options under the fair value method. For purposes of this disclosure,the fair value of the fixed option grants was estimated using the Black-Scholes option-pricing modelwith the following weighted average assumptions used for option grants:
2004 2003 2002
Risk-free interest rate . . . . . . . . . . . . . . . . . . . . . . . . . . . . . . 3.1% 3.1% 4.1%Volatility factor . . . . . . . . . . . . . . . . . . . . . . . . . . . . . . . . . . . 35.0% 51.3% 51.2%Weighted average expected life (years) . . . . . . . . . . . . . . . . . . 5.0 6.0 6.0
The Black-Scholes option valuation model was developed for use in estimating the fair value oftraded options which have no vesting restrictions and are fully transferable. In addition, optionvaluation models require the input of highly subjective assumptions including the expected stock pricevolatility. Because the Company’s employee stock options have characteristics significantly differentfrom those of traded options, and because changes in the subjective input assumptions can materiallyaffect the fair value estimates, in management’s opinion, the existing models do not necessarily providea reliable single measure of the fair value of its employee stock options. However, for each periodpresented, management believes the Black-Scholes model is the most appropriate option valuationmodel. The weighted average Black-Scholes fair value for the 2004, 2003 and 2002 grants was $15.57,$17.04 and $17.62, respectively.
Had compensation expense for the Company’s option grants been recognized consistent with theprovision of SFAS No. 123 as amended by SFAS No. 148, ‘‘Accounting for Stock-BasedCompensation—Transition and Disclosure, an Amendment of FASB Statement No. 123,’’ the
47

CHARLES RIVER LABORATORIES INTERNATIONAL, INC.
NOTES TO CONSOLIDATED FINANCIAL STATEMENTS (Continued)
(dollars in thousands, except per share amounts)
1. Description of Business and Summary of Significant Accounting Policies (Continued)
Company’s net income and earnings per share for the years ended December 25, 2004, December 27,2003 and December 28, 2002 would have been reduced to the pro forma amounts indicated below:
2004 2003 2002
Reported net income . . . . . . . . . . . . . . . . . . . . . . . $ 89,792 $ 80,151 $ 50,132Add: Stock-based employee compensation included
in reported net income, net of tax . . . . . . . . . . . . 2,431 678 616Less: Total stock-based employee compensation
expense determined under the fair value methodfor all awards, net of tax . . . . . . . . . . . . . . . . . . . (17,341) (10,456) (6,204)
Pro forma net income . . . . . . . . . . . . . . . . . . . . . . $ 74,882 $ 70,373 $ 44,544
Reported basic earnings per share . . . . . . . . . . . . . $ 1.81 $ 1.76 $ 1.12Pro forma basic earnings per share . . . . . . . . . . . . . $ 1.51 $ 1.55 $ 1.00Reported diluted earnings per share . . . . . . . . . . . . $ 1.68 $ 1.64 $ 1.06Pro forma diluted earnings per share . . . . . . . . . . . $ 1.41 $ 1.45 $ 0.95
Revenue Recognition
The Company recognizes revenue related to its products and services in accordance with the SECStaff Accounting Bulletin (SAB) No. 104, ‘‘Revenue Recognition.’’
The Company recognizes revenue related to its products, which include research models, in vitrotechnology and vaccine support products, when persuasive evidence of an arrangement exists, generallyin the form of customer purchase orders, title and risk of loss have transferred, which occurs upondelivery of the products, the sales price is fixed and determinable and collectibility is reasonablyassured. These recognition criteria are met at the time the product is delivered to the customer’s site.Product sales are recorded net of returns upon delivery. For large models in some cases customers payin advance of delivery of the product. These advances are deferred and recognized as revenue upondelivery of the product..
The Company’s service revenue is comprised of toxicology, pathology, laboratory, clinical Phase Itrials, clinical trials management services, transgenic and contract staffing services and is generallyevidenced by customer contracts. Toxicology services provide highly specialized studies to evaluate thesafety and toxicity of new pharmaceutical compounds and materials used in medical devices. Pathologyservices provide the ability to identify and characterize pathologic changes within tissues and cells indetermining the safety of a new compound. Laboratory services monitor and analyze health andgenetics of research models used in research protocols. Clinical Phase I conducts tolerability assessmentto explore human pharmacology. Clinical trials management provides customized program managementto coordinate and manage clinical trial programs. Transgenic services include validating, maintaining,breeding and testing research models for biomedical research activities. Contract staffing servicesprovide management of animal care operations on behalf of government, academic, pharmaceutical andbiotechnology organizations.
The toxicology, pathology and clinical Phase I trials services arrangements typically range from oneto six months but can range up to approximately 24 months in length. These agreements are negotiatedfor a fixed fee. Laboratory service arrangements are generally completed within a one-month periodand are also of a fixed fee nature. Transgenic, contract staffing services and clinical trial management
48

CHARLES RIVER LABORATORIES INTERNATIONAL, INC.
NOTES TO CONSOLIDATED FINANCIAL STATEMENTS (Continued)
(dollars in thousands, except per share amounts)
1. Description of Business and Summary of Significant Accounting Policies (Continued)
are of a longer-term nature, from six months to five years, and are billed at agreed upon rates asspecified in the contract.
The Company’s service revenues are recognized upon the Company’s completion of the agreedupon performance criteria. These performance criteria are generally in the form of either studyprotocols or specified activities or procedures which the Company is engaged to perform. Theseperformance criteria are established by the Company’s customers and do not contain acceptanceprovisions which are based upon the achievement of certain study or laboratory testing results. Revenueof agreed upon rate contracts is recognized as services are performed, based upon rates specified in thecontract. Revenue of fixed fee contracts is recognized as services are performed in accordance withagreed-upon study protocols.
Deferred and unbilled revenue is recognized in the consolidated balance sheets. In some cases, aportion of the contract fee is paid at the time the study is initiated. These advances are deferred andrecognized as revenue as services are performed. Unbilled services are recorded for revenuesrecognized to date and relate to amounts that are currently unbillable to the customer pursuant tocontractual terms. In general, amounts become billable upon the achievement of milestones or inaccordance with predetermined payment schedules.
Guarantees
The Company includes standard indemnification provisions in its customer contracts, which includestandard provisions limiting the Company’s liability under such contracts, including the Company’sindemnification obligations, with certain exceptions.
Derivatives and Hedging Activities
The Company follows the requirements of SFAS 133, ‘‘Accounting for Derivative Instruments andHedging Activities,’’ which establishes accounting and reporting standards for derivative instruments,including certain derivative instruments embedded in other contracts and used for hedging activities.All derivatives, whether designed for hedging relationships or not, are required to be recorded on thebalance sheet at fair value. If the derivative is designated as a fair value hedge, all changes in the fairvalue of the derivative and changes in the fair value of the hedged item attributable to the hedged riskare recognized in earnings. If the derivative is designated as a cash flow hedge, the effective portions ofthe changes in the fair value of the derivative are recorded in other comprehensive income and arerecognized in the statement of operations when the hedged item effects earnings. The ineffectiveportions of both fair value and cash flow hedges are immediately recognized as earnings.
The Company has not designated any of its derivative financial instruments as hedges foraccounting purposes and therefore, the changes in fair value are reflected in income each period. Thismay cause volatility in quarterly earnings in the future.
Fair Value of Financial Instruments
The carrying amounts of the Company’s significant financial instruments, which include cashequivalents, marketable securities, accounts receivable and accounts payable, approximate their fairvalues at December 25, 2004 and December 27, 2003. The fair value of the Company’s financinginstruments (Note 8) was $726,429 based on market rates at December 25, 2004.
49

CHARLES RIVER LABORATORIES INTERNATIONAL, INC.
NOTES TO CONSOLIDATED FINANCIAL STATEMENTS (Continued)
(dollars in thousands, except per share amounts)
1. Description of Business and Summary of Significant Accounting Policies (Continued)
Income Taxes
The Company accounts for income taxes in accordance with SFAS No. 109, ‘‘Accounting forIncome Taxes.’’ The asset and liability approach underlying SFAS No. 109 requires the recognition ofdeferred tax liabilities and assets for the expected future tax consequences of temporary differencesbetween the carrying amounts and tax basis of the Company’s assets and liabilities. A valuationallowance is provided for deferred tax assets if it is more likely than not that these items will expirebefore the Company is able to realize their benefits or that their future deductibility is uncertain.
Foreign Currency Translation
The functional currencies of the Company’s foreign subsidiaries are in local currency. Inaccordance with SFAS No. 52, ‘‘Foreign Currency Translation,’’ the financial statements of thesesubsidiaries are translated into U.S. dollars as follows: assets and liabilities at year-end exchange rates;income, expenses and cash flows at average exchange rates; and shareholders’ equity at historicalexchange rates. The resulting translation adjustment is recorded as a component of accumulated othercomprehensive income in the accompanying balance sheet. Exchange gains and losses on foreigncurrency transactions are recorded as other income or expense. The Company recorded exchange gainsof $418, $702 and $1,222 in 2004, 2003 and 2002, respectively.
Concentrations of Credit Risk
Financial instruments that potentially subject the Company to concentrations of credit risk consistprimarily of trade receivables from customers in the pharmaceutical and biotechnology industries. TheCompany believes its exposure to credit risk to be minimal, as these industries have experiencedsignificant growth and the customers are predominantly well established and viable.
Comprehensive Income
The Company accounts for comprehensive income in accordance with SFAS No. 130, ‘‘ReportingComprehensive Income.’’ As it relates to the Company, comprehensive income is defined as net incomeplus the sum of the changes in unrealized gains (losses) on available-for-sale marketable securities,foreign currency translation adjustments and minimum pension liabilities (collectively, othercomprehensive income) and is presented in the Consolidated Statements of Changes in Shareholders’Equity, net of tax.
Pension Obligations
The Company recognizes obligations associated with its defined benefit pension plans (Note 11) inaccordance with SFAS No. 87, ‘‘Employers Accounting for Pensions.’’ Assets, liabilities and expensesare calculated by accredited independent actuaries. As required by SFAS No. 87, the Company isrequired to make certain assumptions to value the plan assets and liabilities. These assumptions arereviewed annually, or whenever otherwise required by SFAS No. 87, based on reviews of current planinformation and consultations with independent investment advisors and actuaries. The selection ofassumptions requires a high degree of judgment and may materially change from period to period. TheCompany does not offer other defined benefits associated with post-retirement benefit plans other thanpensions. The Company adopted the disclosure requirements under SFAS No. 132R, ‘‘Employers’
50

CHARLES RIVER LABORATORIES INTERNATIONAL, INC.
NOTES TO CONSOLIDATED FINANCIAL STATEMENTS (Continued)
(dollars in thousands, except per share amounts)
1. Description of Business and Summary of Significant Accounting Policies (Continued)
Disclosure about Pensions and Other Postretirement Benefits, an Amendment of FASB StatementsNo. 87, 88 and 106,’’ as of December 25, 2004 for both domestic and foreign defined benefit plans.
Restructuring Costs
The Company recognizes obligations associated with restructuring activities in accordance withSFAS No. 146, ‘‘Accounting for Costs Associated with Exit or Disposal Activities.’’ The Companyadopted the provisions of SFAS No. 146 as of the beginning of fiscal 2003, which generally requires aliability for costs associated with an exit or disposal activity be recognized and measured initially at itsfair value in the period in which the liability is incurred. The overall purpose of the Company’srestructuring actions is to lower overall operating costs and improve profitability by reducing excesscapacities. Restructuring charges (Note 3) are typically recorded in selling, general and administrativeexpenses in the period in which the plan is approved by the Company’s senior management and, wherematerial, the Company’s Board of Directors, and when the liability is incurred.
Earnings Per Share
Basic earnings per share is calculated by dividing net income by the weighted average number ofcommon shares outstanding. Diluted earnings per common share is calculated by adjusting the weightedaverage number of common shares outstanding to include the number of additional common sharesthat would have been outstanding if the dilutive potential common shares had been issued (Note 9).
New Accounting Pronouncements
On December 16, 2004, the Financial Accounting Standards Board issued SFAS No. 123 (revised2004), ‘‘Shared-Based Payment,’’ which is a revision of SFAS No. 123. SFAS No. 123(R) supersedesAPB Opinion No. 25, ‘‘Accounting for Stock Issued to Employees,’’ and amends SFAS No. 95,‘‘Statement of Cash Flows.’’ Generally, the approach in SFAS No. 123(R) is similar to the approachdescribed in SFAS No. 123. However, SFAS No. 123(R) requires all share-based payments toemployees, including grants of employee stock options, to be recognized in the income statement basedon their fair values. This revised standard will be effective for the Company beginning with the thirdquarter in 2005.
As permitted by SFAS No. 123, the Company currently accounts for share-based payments toemployees using APB 25 intrinsic value method and, as such, generally recognizes no compensationcost for employee stock options. Accordingly, the adoption of SFAS No. 123(R)’s fair value method willhave an impact on the Company’s result of operations, although it will have no impact on theCompany’s overall financial position. The impact of the modified prospective adoption of SFASNo. 123(R) cannot be estimated at this time because it will depend on levels of share-based paymentsgranted in the future. However, had the Company adopted SFAS No. 123(R) in prior periods, theimpact of that standard would have approximated the impact of SFAS 123 as described in thedisclosure of pro forma net income and earnings per share.
Reclassifications
Certain amounts in prior year financial statements and related notes have been reclassified toconform with current year presentation. These reclassifications have no impact on previously reportednet income or cash flow.
51

CHARLES RIVER LABORATORIES INTERNATIONAL, INC.
NOTES TO CONSOLIDATED FINANCIAL STATEMENTS (Continued)
(dollars in thousands, except per share amounts)
2. Business Acquisitions
The Company acquired several businesses during the three-year period ended December 25, 2004.The results of operations of the acquired businesses are included in the accompanying consolidatedfinancial statements from the date of acquisition. Significant acquisitions include the following:
On October 20, 2004, the Company’s shareholders approved the merger agreement with InvereskResearch Group (Inveresk). The acquisition strengthened the Company’s position as a leading globalcompany providing essential preclinical and clinical drug development services and products. Thestrategic combination significantly expanded the Company’s service portfolio and strengthens theCompany’s global footprint in the growing market for pharmaceutical research and developmentproducts and services. Under the terms of the merger agreement, Inveresk shareholders received 0.48shares of the Company’s common stock and $15.15 in cash for each share of Inveresk common stockthey owned. The purchase price of $1,458,057 consisted of $841,042 representing the fair value of theCompany’s common stock of 18,451,996 shares issued, $582,391 of cash consideration, the fair value ofthe Company’s stock options exchanged for Inveresk stock options and transaction costs incurred by theCompany. The Company utilized $161,229 of available cash and $500,000 of borrowings under thecredit facility for the cash consideration paid to Inveresk shareholders and to pay off Inveresk’s existingcredit facility of approximately $78,838.
The purchase price associated with the Inveresk acquisition is as follows:
Stock consideration . . . . . . . . . . . . . . . . . . . . . . . . . . . . . . . . . . . . . . $ 841,042Cash consideration . . . . . . . . . . . . . . . . . . . . . . . . . . . . . . . . . . . . . . . 582,391Fair value of stock options exchange . . . . . . . . . . . . . . . . . . . . . . . . . . 30,350Transaction costs . . . . . . . . . . . . . . . . . . . . . . . . . . . . . . . . . . . . . . . . 4,274
Purchase price . . . . . . . . . . . . . . . . . . . . . . . . . . . . . . . . . . . . . . . . . . 1,458,057Cash acquired . . . . . . . . . . . . . . . . . . . . . . . . . . . . . . . . . . . . . . . . . . (41,726)
Purchase price, net of cash acquired . . . . . . . . . . . . . . . . . . . . . . . . . . $ 1,416,331
The Company’s purchase price allocation is preliminary. It has not been finalized as the Companyis awaiting the completion by an outside appraiser of the valuations of the plant and equipment. Theoutside appraisal of the intangible assets acquired has been finalized. The Company does not anticipateany significant differences between current book values and the fair values upon the completion of theasset valuation.
The preliminary purchase price allocation associated with the Inveresk acquisition is as follows:
Current assets . . . . . . . . . . . . . . . . . . . . . . . . . . . . . . . . . . . . . . . . . . $ 98,415Property, plant and equipment . . . . . . . . . . . . . . . . . . . . . . . . . . . . . . 128,082Current liabilities . . . . . . . . . . . . . . . . . . . . . . . . . . . . . . . . . . . . . . . . (201,293)Non-current liabilities . . . . . . . . . . . . . . . . . . . . . . . . . . . . . . . . . . . . (147,505)Goodwill and other intangibles acquired . . . . . . . . . . . . . . . . . . . . . . . 1,538,632
Total purchase price allocation . . . . . . . . . . . . . . . . . . . . . . . . . . . . . . $ 1,416,331
52

CHARLES RIVER LABORATORIES INTERNATIONAL, INC.
NOTES TO CONSOLIDATED FINANCIAL STATEMENTS (Continued)
(dollars in thousands, except per share amounts)
2. Business Acquisitions (Continued)
Weightedaverage
amortizationlife (years)
Customer relationships . . . . . . . . . . . . . . . . . . . . . . . . . . . $ 167,700 21Backlog . . . . . . . . . . . . . . . . . . . . . . . . . . . . . . . . . . . . . . 63,700 3Trademarks and trade names . . . . . . . . . . . . . . . . . . . . . . 700 1Goodwill . . . . . . . . . . . . . . . . . . . . . . . . . . . . . . . . . . . . . 1,306,532 —
Total goodwill and other intangibles . . . . . . . . . . . . . . . . . $1,538,632
On January 8, 2004, the Company acquired River Valley Farms, Inc. (RVF), a privately heldmedical device contract research business. Consideration, including acquisition expenses, was $16,972,net of cash acquired of $347. RVF was acquired to strengthen service offerings of the Company’sPreclinical Services segment. This acquisition was recorded as a purchase business combination inaccordance with Statement of Financial Accounting Standards (SFAS) No. 141, ‘‘BusinessCombinations.’’
The final purchase price allocation associated with the RVF acquisition is as follows:
Current assets . . . . . . . . . . . . . . . . . . . . . . . . . . . . . . . . . . . $ 2,135Property, plant and equipment . . . . . . . . . . . . . . . . . . . . . . . 5,987Current liabilities . . . . . . . . . . . . . . . . . . . . . . . . . . . . . . . . . (2,828)Non-current liabilities . . . . . . . . . . . . . . . . . . . . . . . . . . . . . . (2,315)Goodwill and other intangibles acquired . . . . . . . . . . . . . . . . 13,993
Consideration, net of cash acquired . . . . . . . . . . . . . . . . . . . . $16,972
Weightedaverage
amortizationlife (years)
Customer relationships . . . . . . . . . . . . . . . . . . . . . . . . . . . . . $ 3,800 12Goodwill . . . . . . . . . . . . . . . . . . . . . . . . . . . . . . . . . . . . . . . 10,193 —
Total goodwill and other intangibles . . . . . . . . . . . . . . . . . . . . $13,993
Effective January 2, 2003, the Company acquired an additional 19% of the equity (404,321common shares) of Charles River Japan from Ajinomoto Company, Inc. (Ajinomoto), the minorityinterest partner, which increased the Company’s ownership to 85% of the outstanding shares. Thepurchase price for the equity was 1.3 billion yen, or $10,841, which was paid in cash. The Companyrecorded goodwill of $2,553 based on the preliminary purchase price allocation in the first quarter of2003. The Company reallocated this amount to fixed assets based on an independent valuation of thesefixed assets, which was completed during the second quarter of 2003. Charles River Japan is anextension of the Company’s Research Models and Services segment. During the fourth quarter of 2004,the Company recorded a deferred tax liability of $1,001 related to the purchase price allocation.
53

CHARLES RIVER LABORATORIES INTERNATIONAL, INC.
NOTES TO CONSOLIDATED FINANCIAL STATEMENTS (Continued)
(dollars in thousands, except per share amounts)
2. Business Acquisitions (Continued)
During the first quarter of 2003, the Company recorded a deferred tax liability of $6,000 associatedwith prior-year acquisitions. This resulted in an increase in goodwill of $6,000.
On October 1, 2002, the Company acquired 100% of the voting equity interests of privately-heldSpringborn Laboratories, Inc. (Springborn). Consideration, including acquisition expenses, was $26,452,net of cash acquired of $634. Consideration consisted of $20,452 in cash and $6,000 in the form of athree-year unsecured subordinated note (Note 8). Springborn provides expertise in short to mid-termtoxicology studies. Springborn was acquired to strengthen service offerings of the Company’s PreclinicalServices segment. The acquisition was recorded as a purchase business combination in accordance withSFAS No. 141, ‘‘Business Combinations.’’
On June 7, 2002, the Company acquired 100% of the voting equity interests of privately-heldBiological Laboratories Europe Limited (BioLabs). Consideration, including acquisition expenses, was$22,900, net of cash acquired of $2,998. The consideration consisted of $21,012 in cash and $1,888 infuture payments, which are to be paid to certain former shareholders of BioLabs over a three-yearperiod. During 2004 and 2003, the Company paid $823 and $746, respectively, to certain formershareholders of BioLabs, which represents two-thirds of the required future payments to be made bythe Company based on the agreement. BioLabs, located in western Ireland, provides a broad range ofservices supporting the discovery, development and manufacturing of pharmaceutical, medical devicesand animal and human health products. BioLabs was acquired to strengthen the Company’s PreclinicalServices segment by adding new capabilities to service the large and growing global animal health andmedical device industry. The acquisition was recorded as a purchase business combination inaccordance with SFAS No. 141.
54

CHARLES RIVER LABORATORIES INTERNATIONAL, INC.
NOTES TO CONSOLIDATED FINANCIAL STATEMENTS (Continued)
(dollars in thousands, except per share amounts)
2. Business Acquisitions (Continued)
The final purchase price allocations associated with the 2002 BioLabs and Springborn acquisitionsare as follows:
Springborn BioLabs
Current assets . . . . . . . . . . . . . . . . . . . . . . . . . $ 2,506 $ 1,661Property, plant and equipment . . . . . . . . . . . . . 4,486 7,612Other non-current assets . . . . . . . . . . . . . . . . . . — 70Current liabilities . . . . . . . . . . . . . . . . . . . . . . . (4,323) (1,724)Non-current liabilities . . . . . . . . . . . . . . . . . . . . — (1,372)
Estimated fair value, net assets acquired . . . . . . 2,669 6,247Goodwill and other intangibles acquired . . . . . . 23,783 16,653
Consideration, net of cash acquired . . . . . . . . . . $ 26,452 $ 22,900
Weightedaverage
amortizationlife (years)
Customer relationships . . . . . . . . . . . . . . . . . . . $ 9,500 $ 4,407 10.0Trade names and trademarks . . . . . . . . . . . . . . . — 194 3.0Other identifiable intangibles . . . . . . . . . . . . . . 1,100 1,070 5.7Goodwill . . . . . . . . . . . . . . . . . . . . . . . . . . . . . 13,183 10,982 —
Total goodwill and other intangibles . . . . . . . . $ 23,783 $ 16,653
On October 2, 2002, the Company entered into an agreement with Proteome Systems, Ltd.(Proteome) to establish a joint venture. The Company owned 80% of the established joint venturecompany, Charles River Proteomic Services, Inc. (Charles River Proteomics), which was initiallycapitalized with $6,000, consisting of $5,000 in cash and a $1,000 working capital loan provided by theCompany and Proteome, in proportion to their equity interests. During 2003, Charles River Proteomicsborrowed $500 against the working capital loan. Interest is based on the Federal Short Term rate,1.67% at December 27, 2003, and is payable quarterly beginning March 31, 2004. Principal is due infull by the end of the joint venture agreement. The Company began consolidating the operations ofCharles River Proteomics from the date of the agreement. During the fourth quarter of 2004 theCompany closed this business and recorded a charge of $2,956 associated with its closure. The chargeincludes an asset impairment charge of $1,539, a lease impairment of $989, severance of $41 and otherrelated expenses of $389.
On August 20, 2002, the Company amended the joint venture agreement for Charles RiverMexico, which was accounted for under the equity method. Upon execution of the amendment, theCompany gained control over the operations. The Company’s ownership percentage of 50.1% did notchange as a result of this amendment and no additional contributions were made. The Company beganconsolidating the operations of Charles River Mexico from the date of the amendment. Uponconsolidation, the Company reversed its equity investment of $3,203, and recognized goodwill of $581and minority interest of $2,587. Results of operations in 2002 were not materially impacted by the
55

CHARLES RIVER LABORATORIES INTERNATIONAL, INC.
NOTES TO CONSOLIDATED FINANCIAL STATEMENTS (Continued)
(dollars in thousands, except per share amounts)
2. Business Acquisitions (Continued)
consolidation. Charles River Mexico is an extension of the Company’s vaccine support business, part ofthe Research Models and Services segment.
The following selected unaudited pro forma consolidated results of operations are presented as ifeach of the acquisitions had occurred as of the beginning of the period immediately preceding theperiod of acquisition after giving effect to certain adjustments including the amortization of intangibles.The pro forma data is for informational purposes only and does not necessarily reflect the results ofoperations had the companies operated as one during the periods reported. No effect has been givenfor synergies, if any, that may have been realized through the acquisitions.
Fiscal Year Ended
December 25, December 27, December 28,2004 2003 2002
Net sales . . . . . . . . . . . . . . . . . . . . . . . . . . $1,018,282 $892,598 $576,325Operating income . . . . . . . . . . . . . . . . . . . . 150,138 119,085 125,279Net income . . . . . . . . . . . . . . . . . . . . . . . . 82,847 65,980 52,652Earnings per common share
Basic . . . . . . . . . . . . . . . . . . . . . . . . . . . $ 1.28 $ 1.04 $ 1.17Diluted . . . . . . . . . . . . . . . . . . . . . . . . . . $ 1.22 $ 1.00 $ 1.11
Refer to Note 9 for further discussion of the method of computation of earnings per share.
3. Impairment and Other Charges
During the fourth quarter of 2004 the company recorded a charge of $2,956 associated with theclosure of the Charles River Proteomic Services, which was included in the Preclinical Servicessegment. The charge includes an asset impairment charge of $1,539, a lease impairment of $989,severance of $41 and other related expenses of $389.
During the second and third quarters of 2003, the Company recorded a total charge of $954,included in the Preclinical Services segment, for severance to employees who were terminated as partof a cost savings program. The Company recorded $690 of the charge to cost of services provided and$264 to selling, general and administrative expenses in the consolidated statements of income.Approximately 100 employees, mainly technicians, technical support and administrative staff, wereterminated as part of the cost savings program. As of December 25, 2004 and December 27, 2003, theyear end accrual for the remaining severance was $0 and $104, respectively.
During the first quarter of 2003, the Company re-evaluated the marketability of certain long-livedassets related to a biopharmaceutical production facility in Maryland, which is included in thePreclinical Services segment, due to a significant decline in market interest in purchasing these assets.Since the Company was unable to locate a buyer for these assets, an impairment charge was recognizedbecause future undiscounted cash flows were estimated to be insufficient to recover the related bookvalue. The Company recorded an asset impairment charge of $3,655 for the write-down of those assetsincluding a net write-down of leasehold improvements of $2,195 and machinery and equipment of$1,460. The charge was recorded as other operating expenses in the consolidated statements of income.
56

CHARLES RIVER LABORATORIES INTERNATIONAL, INC.
NOTES TO CONSOLIDATED FINANCIAL STATEMENTS (Continued)
(dollars in thousands, except per share amounts)
4. Litigation Settlement
On March 28, 2003, the Company’s French subsidiaries, which are included in the ResearchModels and Services segment, settled a pending breach of contract claim against a customer. TheCompany’s French subsidiaries had previously been awarded damages of approximately $4,600 by theCommercial Court of Lyon and the damages award was stayed pending appeal by the customer at theFrench Supreme Court. The final settlement of this dispute was for a gross value of approximately$3,750, resulting in the retention by the Company’s French subsidiaries of the amount previouslydeposited by the customer, pursuant to the order of the Commercial Court of Lyon and recorded indeferred income in the consolidated balance sheet. During 2000, the Company recognizedapproximately $350 of the damages award to offset a portion of subcontractor costs incurred based onthe indemnification clause in the original customer agreement. After legal and related expenses, theCompany’s French subsidiaries recorded a net gain for the retained settlement amount of $2,908, whichwas recorded in the first quarter of 2003 as other operating income in the consolidated statements ofincome.
5. Marketable Securities
The amortized cost, gross unrealized gains, gross unrealized losses and fair value for marketablesecurities available for sale by major security type were as follows:
December 25, 2004
Gross GrossAmortized Unrealized Unrealized Fair
Cost Gains Losses Value
Corporate debt securities . . . . . . . . . . . . . . . . . . . . . . . . . $ 2,071 $ 8 $ (5) $ 2,074Government securities and obligations . . . . . . . . . . . . . . . . 2,477 28 — 2,505
$ 4,548 $ 36 $ (5) $ 4,579
57

CHARLES RIVER LABORATORIES INTERNATIONAL, INC.
NOTES TO CONSOLIDATED FINANCIAL STATEMENTS (Continued)
(dollars in thousands, except per share amounts)
5. Marketable Securities (Continued)
December 27, 2003
Gross GrossAmortized Unrealized Unrealized Fair
Cost Gains Losses Value
Corporate debt securities . . . . . . . . . . . . . . . . . . . . . . . . . $11,656 $ 92 $ — $11,748Government securities and obligations . . . . . . . . . . . . . . . . 8,719 28 (10) 8,737
$20,375 $ 120 $ (10) $20,485
Maturities of corporate debt securities and government securities and obligations classified asavailable-for-sale were as follows:
December 25, 2004 December 27, 2003
Amortized Fair Amortized FairCost Value Cost Value
Due less than one year . . . . . . . . . . . . . . . . . . . . . . . . . . . $ 233 $ 234 $ 13,250 $13,156Due after one year through five years . . . . . . . . . . . . . . . . 4,315 4,345 7,125 7,329
$ 4,548 $4,579 $ 20,375 $20,485
Marketable securities due after one year are included in other assets on the consolidated balancesheets.
58

CHARLES RIVER LABORATORIES INTERNATIONAL, INC.
NOTES TO CONSOLIDATED FINANCIAL STATEMENTS (Continued)
(dollars in thousands, except per share amounts)
6. Supplemental Balance Sheet Information
The composition of trade receivables is as follows:
Customer receivables . . . . . . . . . . . . . . . . . . . . . . . . . . . $ 155,549 $ 97,257Unbilled revenue . . . . . . . . . . . . . . . . . . . . . . . . . . . . . . 50,082 15,901
Total . . . . . . . . . . . . . . . . . . . . . . . . . . . . . . . . . . . . . 205,631 113,158Less allowance for doubtful accounts . . . . . . . . . . . . . . . . (3,837) (1,644)
Net trade receivables . . . . . . . . . . . . . . . . . . . . . . . . . . . $ 201,794 $ 111,514
The composition of inventories is as follows:
December 25, December 27,2004 2003
Raw materials and supplies . . . . . . . . . . . . . . . . . . . . . . . $ 9,393 $ 6,872Work in process . . . . . . . . . . . . . . . . . . . . . . . . . . . . . . . 3,431 4,028Finished products . . . . . . . . . . . . . . . . . . . . . . . . . . . . . . 49,090 41,470
Inventories . . . . . . . . . . . . . . . . . . . . . . . . . . . . . . . . . $ 61,914 $ 52,370
The composition of other current assets is as follows:
December 25, December 27,2004 2003
Prepaid assets . . . . . . . . . . . . . . . . . . . . . . . . . . . . . . . . $ 16,045 $ 8,444Deferred tax asset . . . . . . . . . . . . . . . . . . . . . . . . . . . . . 10,675 $ 3,073Prepaid income tax . . . . . . . . . . . . . . . . . . . . . . . . . . . . . 8,551 —Restricted cash . . . . . . . . . . . . . . . . . . . . . . . . . . . . . . . . 3,527 —
Other current assets . . . . . . . . . . . . . . . . . . . . . . . . . . $ 38,798 $ 11,517
The composition of property, plant and equipment is as follows:
December 25, December 27,2004 2003
Land . . . . . . . . . . . . . . . . . . . . . . . . . . . . . . . . . . . . . . . $ 16,196 $ 12,328Buildings . . . . . . . . . . . . . . . . . . . . . . . . . . . . . . . . . . . . 282,733 207,385Machinery and equipment . . . . . . . . . . . . . . . . . . . . . . . . 234,043 166,178Leasehold improvements . . . . . . . . . . . . . . . . . . . . . . . . . 19,926 13,018Furniture and fixtures . . . . . . . . . . . . . . . . . . . . . . . . . . . 6,401 4,080Vehicles . . . . . . . . . . . . . . . . . . . . . . . . . . . . . . . . . . . . . 4,547 3,175Construction in progress . . . . . . . . . . . . . . . . . . . . . . . . . 37,711 15,636
Total . . . . . . . . . . . . . . . . . . . . . . . . . . . . . . . . . . . . . 601,557 421,800Less accumulated depreciation . . . . . . . . . . . . . . . . . . . . (244,408) (218,342)
Net property, plant and equipment . . . . . . . . . . . . . . . . . $ 357,149 $ 203,458
59

CHARLES RIVER LABORATORIES INTERNATIONAL, INC.
NOTES TO CONSOLIDATED FINANCIAL STATEMENTS (Continued)
(dollars in thousands, except per share amounts)
6. Supplemental Balance Sheet Information (Continued)
Depreciation expense for 2004, 2003, and 2002 was $29,514, $24,688 and $20,572, respectively.
The composition of other assets is as follows:
December 25, December 27,2004 2003
Deferred financing costs . . . . . . . . . . . . . . . . . . . . . . . . . $ 10,454 $ 4,752Cash surrender value of life insurance policies . . . . . . . . . 7,391 7,298Long term marketable securities . . . . . . . . . . . . . . . . . . . 4,345 7,329Pension asset . . . . . . . . . . . . . . . . . . . . . . . . . . . . . . . . . 3,801 5,637Other assets . . . . . . . . . . . . . . . . . . . . . . . . . . . . . . . . . . 4,097 2,866
Other assets . . . . . . . . . . . . . . . . . . . . . . . . . . . . . . . . $ 30,088 $ 27,882
The composition of other current liabilities is as follows:
December 25, December 27,2004 2003
Accrued income taxes . . . . . . . . . . . . . . . . . . . . . . . . . . . $ 18,027 $ 4,889Accrued interest . . . . . . . . . . . . . . . . . . . . . . . . . . . . . . . 6,302 2,770
Other current liabilities . . . . . . . . . . . . . . . . . . . . . . . . $ 24,329 $ 7,659
The composition of other long term liabilities is as follows:
December 25, December 27,2004 2003
Deferred tax liability . . . . . . . . . . . . . . . . . . . . . . . . . . . . $ 93,143 $ 3,938Long term pension liability . . . . . . . . . . . . . . . . . . . . . . . 63,783 1,643Accrued Executive Supplemental Life Insurance
Retirement Plan . . . . . . . . . . . . . . . . . . . . . . . . . . . . . 16,326 12,873Other long term liabilities . . . . . . . . . . . . . . . . . . . . . . . . 16,191 6,267
Other long term liabilities . . . . . . . . . . . . . . . . . . . . . . $ 189,443 $ 24,721
60

CHARLES RIVER LABORATORIES INTERNATIONAL, INC.
NOTES TO CONSOLIDATED FINANCIAL STATEMENTS (Continued)
(dollars in thousands, except per share amounts)
7. Goodwill and Other Intangible Assets
The following table displays goodwill and other intangible assets not subject to amortization andother intangible assets that continue to be subject to amortization:
December 25, 2004 December 27, 2003
Gross GrossCarrying Accumulated Carrying AccumulatedAmount Amortization Amount Amortization
Goodwill . . . . . . . . . . . . . . . . . . . . . . . . . . . . . . . . $1,435,414 $(12,828) $118,014 $(12,706)
Other intangible assets not subject to amortization:Research models . . . . . . . . . . . . . . . . . . . . . . . . . 3,438 — 3,438 —
Other intangible assets subject to amortization:Backlog . . . . . . . . . . . . . . . . . . . . . . . . . . . . . . . 65,368 (11,040) — —Customer relationships . . . . . . . . . . . . . . . . . . . . 202,956 (9,823) 26,818 (5,752)Customer contracts . . . . . . . . . . . . . . . . . . . . . . . 1,655 (1,429) 3,585 (3,078)Trademarks and trade names . . . . . . . . . . . . . . . . 3,939 (1,377) 3,224 (913)Standard operating procedures . . . . . . . . . . . . . . . 1,358 (690) 1,353 (637)Other identifiable intangible assets . . . . . . . . . . . . 6,158 (4,219) 5,531 (3,154)
Total other intangible assets . . . . . . . . . . . . . . . . . . . $ 284,872 $(28,578) $ 43,949 $(13,534)
The changes in the gross carrying amount and accumulated amortization of goodwill are asfollows:
Adjustments to Adjustments toBalance at Balance at Balance atGoodwill GoodwillDecember 28, December 27, December 25,2002 Acquisitions Other 2003 Acquisitions Other 2004
Research Models and ServicesGross carrying amount . . . . . . $ 18,024 $1,331 $ 710 $ 20,065 $ — $(144) $ 19,921Accumulated amortization . . . . (4,538) — (240) (4,778) — (122) (4,900)
Preclinical ServicesGross carrying amount . . . . . . 90,974 4,669 2,306 97,949 937,831 819 1,036,599Accumulated amortization . . . . (7,928) — — (7,928) — — (7,928)
Clinical ServicesGross carrying amount . . . . . . — — — — 378,894 — 378,894Accumulated amortization . . . . — — — — — — —
TotalGross carrying amount . . . . . . $ 108,998 $6,000 $ 3,016 $ 118,014 $ 1,316,685 $ 715 $ 1,435,414Accumulated amortization . . . . (12,466) — (240) (12,706) — (122) (12,828)
61
CHARLES RIVER LABORATORIES INTERNATIONAL, INC.
NOTES TO CONSOLIDATED FINANCIAL STATEMENTS (Continued)
(dollars in thousands, except per share amounts)
7. Goodwill and Other Intangible Assets (Continued)
Estimated amortization expense for each of the next five fiscal years is as follows:
2005 . . . . . . . . . . . . . . . . . . . . . . . . . . . . . . . . . . . . . . . . . . . . . . . . . . . . $58,4642006 . . . . . . . . . . . . . . . . . . . . . . . . . . . . . . . . . . . . . . . . . . . . . . . . . . . . 45,1292007 . . . . . . . . . . . . . . . . . . . . . . . . . . . . . . . . . . . . . . . . . . . . . . . . . . . . 31,4242008 . . . . . . . . . . . . . . . . . . . . . . . . . . . . . . . . . . . . . . . . . . . . . . . . . . . . 25,5882009 . . . . . . . . . . . . . . . . . . . . . . . . . . . . . . . . . . . . . . . . . . . . . . . . . . . . 20,779
8. Long-Term Debt and Capital Lease Obligations
Long-Term Debt
On October 15, 2004, the Company entered into a credit agreement which provides for a$400 million term loan facility and a $150 million revolving facility. The term loan facility matures in 20equal, quarterly installments with the first installment payable December 31, 2004 and the lastinstallment due September 30, 2009. The revolver facility matures on October 15, 2009 and requires noscheduled prepayment before that date. The interest rates applicable to term loans and revolving loansunder the credit agreement are, at the Company’s option, equal to either the base rate (which is thehigher of the prime rate or the federal funds rate plus 1⁄2%) or the adjusted LIBOR rate, in each caseplus an interest rate margin based upon the Company’s leverage ratio, 3.5% as of December 25, 2004.Based on the leverage ratio of the Company, the margin range for LIBOR based loans is 1.25% to1.75%. The credit agreement includes certain customary representations and warranties, negative andaffirmative covenants and events of default. The Company was in compliance with its debt covenants asof December 25, 2004. The Company had $4,988 and $5,313 outstanding under letters of credit as ofDecember 25, 2004 and December 27, 2003, respectively.
On March 31, 2003, the Company entered into a revolving credit agreement which was terminatedon October 20, 2004. The agreement permitted the Company to borrow up to $100,000 at an interestrate based on, at the Company’s option, the greatest of the Prime Rate, the Base CD Rate plus 1%and the Federal Funds Effective Rate plus 0.5%, or LIBOR multiplied by the Statutory Reserve Rateplus a spread of 1.25% to 2.50% based on the leverage ratio of the Company and the aggregateborrowing under the revolving credit agreement. Interest was payable, ranging from monthly tosemi-annually, based on the Company’s option of interest rate selected. The credit agreement requiredthe Company to pay a quarterly commitment fee which ranges from 25 through 50 basis points annuallyon the undrawn balance, based on the leverage of the Company. The agreement also required theCompany to remain in compliance with certain financial ratios as well as other restrictive covenants. Noamounts were outstanding under the credit agreement as of December 27, 2003.
In connection with the acquisition of Springborn (Note 2), the Company entered into a $6,000three-year unsecured subordinated note. The note was payable in three equal annual installments ofprincipal, together with interest accrued in arrears commencing on October 1, 2003. Interest waspayable based on the one month LIBOR rate plus 1%. The Company repaid this note in full during2003.
On January 24, 2002, the Company issued $175,000 par value of senior convertible debenturesthrough a private placement offering. On February 11, 2002, the Company issued an additional $10,000
62

CHARLES RIVER LABORATORIES INTERNATIONAL, INC.
NOTES TO CONSOLIDATED FINANCIAL STATEMENTS (Continued)
(dollars in thousands, except per share amounts)
8. Long-Term Debt and Capital Lease Obligations (Continued)
par value of senior convertible debentures through the additional purchase option. The Companyreceived approximately $179,450, net of underwriter discounts. The senior convertible debenturesaccrue interest at an initial annual rate of 3.5%, which will be reset (but not below the initial rate of3.50% or above 5.25%) on August 1, 2007, August 1, 2012 and August 1, 2016. Interest is payablesemi-annually in arrears, beginning August 1, 2002. The senior convertible debentures will mature in2022 and are convertible into shares of the Company’s common stock at a conversion price of $38.87.This conversion price is subject to adjustment under certain circumstances. On or after February 5,2005, the Company may redeem for cash all or part of the debentures that have not been previouslyconverted at the redemption prices set forth in the purchase agreement. Holders may require theCompany to repurchase for cash all or part of their debentures on February 1, 2008, February 1, 2013or February 1, 2017 at a price equal to 100% of the par value of the debentures plus accrued interestup to but not including the date of repurchase. In addition, upon a change in control of the Companyoccurring on or prior to February 1, 2022, each holder may require the Company to repurchase all or aportion of such holder’s debentures for cash. The Company used a portion of the net proceeds fromthe senior convertible debenture offering to retire all of the 13.5% senior subordinated notes throughthe tender offer discussed below.
During fiscal 2002, the Company terminated its then existing revolving credit facility, repaid all ofits outstanding senior secured term loans and completed a tender offer for all of its 13.5% seniorsubordinated notes. The Company recorded a loss of $29,882 due to the payment of premiums relatedto the early extinguishment of debt ($23,886) and the write-off of deferred financing costs ($5,129) andissuance discounts ($867).
Effective at the beginning of fiscal year 2003, the Company adopted SFAS No. 145, ‘‘Recission ofFASB Statements No. 4, 44, and 64, Amendment of FASB Statement No. 13, and TechnicalCorrections.’’ SFAS No. 145 eliminates the requirement that gains and losses from the extinguishmentof debt be aggregated and, if material, classified as an extraordinary item, net of the related income taxeffect. However, an entity would not be prohibited from classifying such gains and losses asextraordinary items so long as they are both unusual in nature and infrequent in occurrence. As thetender offer, repayment of the senior secured term loan facilities and termination of the revolvingcredit facility were not unusual in nature and infrequent in occurrence, the extraordinary loss before taxfor 2002 of $29,882 was reclassified to loss on debt retirement. The related tax benefit for 2002 of$11,651 was reclassified to the provision for income taxes in the consolidated statements of income.
63

CHARLES RIVER LABORATORIES INTERNATIONAL, INC.
NOTES TO CONSOLIDATED FINANCIAL STATEMENTS (Continued)
(dollars in thousands, except per share amounts)
8. Long-Term Debt and Capital Lease Obligations (Continued)
Long-term debt consists of the following:
December 25, December 27,2004 2003
Senior convertible debentures . . . . . . . . . . . . . . . . . . . . . . . . . . . . . . . . . . $185,000 $185,000Term loan facility . . . . . . . . . . . . . . . . . . . . . . . . . . . . . . . . . . . . . . . . . . . 400,000 —Revolving credit facility . . . . . . . . . . . . . . . . . . . . . . . . . . . . . . . . . . . . . . . 100,000 —Other long-term debt, represents secured and unsecured promissory notes,
interest rates between 0% and 4.06% at December 25, 2004, maturingbetween 2005 and 2012 . . . . . . . . . . . . . . . . . . . . . . . . . . . . . . . . . . . . . 844 853
Total debt . . . . . . . . . . . . . . . . . . . . . . . . . . . . . . . . . . . . . . . . . . . . . . . . . 685,844 185,853Less: current portion of long-term debt . . . . . . . . . . . . . . . . . . . . . . . . . . . (80,456) (253)
Long-term debt . . . . . . . . . . . . . . . . . . . . . . . . . . . . . . . . . . . . . . . . . . . . . $605,388 $185,600
Minimum future principal payments of long-term debt at December 25, 2004 are as follows:
Fiscal Year
2005 . . . . . . . . . . . . . . . . . . . . . . . . . . . . . . . . . . . . . . . . . . . . . . . . . . . . . $ 80,4562006 . . . . . . . . . . . . . . . . . . . . . . . . . . . . . . . . . . . . . . . . . . . . . . . . . . . . . 80,2452007 . . . . . . . . . . . . . . . . . . . . . . . . . . . . . . . . . . . . . . . . . . . . . . . . . . . . . 80,0072008 . . . . . . . . . . . . . . . . . . . . . . . . . . . . . . . . . . . . . . . . . . . . . . . . . . . . . 265,0062009 . . . . . . . . . . . . . . . . . . . . . . . . . . . . . . . . . . . . . . . . . . . . . . . . . . . . . 180,007Thereafter . . . . . . . . . . . . . . . . . . . . . . . . . . . . . . . . . . . . . . . . . . . . . . . . 123
Total . . . . . . . . . . . . . . . . . . . . . . . . . . . . . . . . . . . . . . . . . . . . . . . . . . . $685,844
Capital Leases
The Company has one capital lease for a building and numerous capital leases for equipment.These leases are capitalized using interest rates considered appropriate at the inception of each lease.Assets recorded in connection with these capital leases are not material.
Capital lease obligations amounted to $1,001 and $149 at December 25, 2004 and December 27,2003, respectively, with maturities through March 31, 2009 at interest rates ranging from 4.6% to16.5%.
64

CHARLES RIVER LABORATORIES INTERNATIONAL, INC.
NOTES TO CONSOLIDATED FINANCIAL STATEMENTS (Continued)
(dollars in thousands, except per share amounts)
9. Shareholders’ Equity
Earnings Per Share
Basic earnings per share for the years ended December 25, 2004, December 27, 2003 andDecember 28, 2002 was computed by dividing earnings available to common shareholders for theseperiods by the weighted average number of common shares outstanding in the respective periodsadjusted for contingently issuable shares. The weighted average number of common shares outstandingfor the years ended December 25, 2004, December 27, 2003 and December 28, 2002 have beenadjusted to include common stock equivalents for the purpose of calculating diluted earnings per sharefor these periods.
Options to purchase 113,800 shares, 3,234,201 shares and 141,624 shares were outstanding atDecember 25, 2004, December 27, 2003 and December 28, 2002, respectively, but were not included incomputing diluted earnings per share because their inclusion would have been anti-dilutive.
Basic weighted average shares outstanding for 2004, 2003 and 2002 excluded the weighted averageimpact of 20,000 shares of contingently issuable shares. In addition, weighted average sharesoutstanding for 2004, 2003 and 2002 excluded the weighted average impact of 64,241, 72,139 and 61,669shares, respectively, of non-vested fixed restricted stock awards.
The following table illustrates the reconciliation of the numerator and denominator in thecomputations of the basic and diluted earnings per share:
Fiscal Year Ended
December 25, December 27, December 28,2004 2003 2002
Numerator:Net income for purposes of calculating basic earnings per
share . . . . . . . . . . . . . . . . . . . . . . . . . . . . . . . . . . . . . . . $ 89,792 $ 80,151 $ 50,132After-tax equivalent of interest expense on:
3.5% senior convertible debenture . . . . . . . . . . . . . . . . . . 4,125 3,982 3,6982% convertible note . . . . . . . . . . . . . . . . . . . . . . . . . . . . — — 8Income for purposes of calculating diluted earnings per
share . . . . . . . . . . . . . . . . . . . . . . . . . . . . . . . . . . . . . . $ 93,917 $ 84,133 $ 53,838
Denominator:Weighted average shares outstanding — Basic . . . . . . . . . . . 49,601,021 45,448,368 44,681,601Effect of dilutive securities:
3.5% senior convertible debenture . . . . . . . . . . . . . . . . . . 4,759,455 4,759,455 4,419,847Stock options and contingently issued restricted stock . . . . 1,346,665 726,291 1,061,243Warrants . . . . . . . . . . . . . . . . . . . . . . . . . . . . . . . . . . . . . 338,707 380,691 685,2192% convertible note . . . . . . . . . . . . . . . . . . . . . . . . . . . . — — 8,813
Weighted average shares outstanding — Diluted . . . . . . . . . . 56,045,848 51,314,805 50,856,723
Basic earnings per share . . . . . . . . . . . . . . . . . . . . . . . . . . . $ 1.81 $ 1.76 $ 1.12Diluted earnings per share . . . . . . . . . . . . . . . . . . . . . . . . . $ 1.68 $ 1.64 $ 1.06
65

CHARLES RIVER LABORATORIES INTERNATIONAL, INC.
NOTES TO CONSOLIDATED FINANCIAL STATEMENTS (Continued)
(dollars in thousands, except per share amounts)
9. Shareholders’ Equity (Continued)
Retained Earnings
Retained earnings includes approximately $2,000 which is restricted due to statutory requirementsin the local jurisdiction of a foreign subsidiary as of December 25, 2004 and December 27, 2003.
Accumulated Other Comprehensive Income
The composition of accumulated other comprehensive income is as follows:Net
Foreign Minimum Unrealized AccumulatedCurrency Pension Gain on Other
Translation Liability Investment ComprehensiveAdjustment Adjustment Securities Income
Balance at December 28, 2002 . . . . . . . . . . . . . . . . . $ (7,763) $(1,804) $ — $ (9,567)Period change . . . . . . . . . . . . . . . . . . . . . . . . . . . 23,460 (518) 110 23,052Tax benefit . . . . . . . . . . . . . . . . . . . . . . . . . . . . . (4,445) 252 (38) (4,231)
Balance at December 27, 2003 . . . . . . . . . . . . . . . . . 11,252 (2,070) 72 9,254Period change . . . . . . . . . . . . . . . . . . . . . . . . . . . 18,919 2,444 (79) 21,284Tax benefit . . . . . . . . . . . . . . . . . . . . . . . . . . . . . (1,909) (969) 33 (2,845)
Balance at December 25, 2004 . . . . . . . . . . . . . . . . . $ 28,262 $ (595) $ 26 $ 27,693
Warrants
As part of the recapitalization in 1999, the Company issued 150,000 units, each comprised of a$1,000 senior subordinated note and a warrant to purchase 7.6 shares of common stock of theCompany for total proceeds of $150,000. The Company allocated the $150,000 offering proceedsbetween the senior subordinated notes ($147,872) and the warrants ($2,128), based upon the estimatedfair value. The portion of the proceeds allocated to the warrants is reflected as capital in excess of parin the accompanying consolidated financial statements. Each warrant entitles the holder, subject tocertain conditions, to purchase 7.6 shares of common stock of the Company at an exercise price of$5.19 per share of common stock, subject to adjustment under some circumstances. Upon exercise, theholders of warrants would be entitled to purchase 383,990 shares of common stock of the Company asof December 25, 2004 and December 27, 2003. The warrants expire on October 1, 2009.
66

CHARLES RIVER LABORATORIES INTERNATIONAL, INC.
NOTES TO CONSOLIDATED FINANCIAL STATEMENTS (Continued)
(dollars in thousands, except per share amounts)
10. Income Taxes
An analysis of the components of income before income taxes, minority interests and earningsfrom equity investments and the related provision for income taxes is presented below:
Fiscal Year Ended
December 25, December 287 December 28,2004 2003 2002
Income before income taxes, minorityinterests and earnings from equityinvestmentsU.S. . . . . . . . . . . . . . . . . . . . . . . . . . . . . $100,261 $ 94,932 $53,381Non-U.S. . . . . . . . . . . . . . . . . . . . . . . . . 52,264 37,698 31,140
$152,525 $132,630 $84,521
Income tax provisionCurrent:
Federal . . . . . . . . . . . . . . . . . . . . . . . . $ 24,604 $ 21,806 $ 6,774Foreign . . . . . . . . . . . . . . . . . . . . . . . . 22,629 15,048 11,671State and local . . . . . . . . . . . . . . . . . . 4,844 5,319 2,216
Total current . . . . . . . . . . . . . . . . . . 52,077 42,173 20,661Deferred:
Federal . . . . . . . . . . . . . . . . . . . . . . . . 16,050 7,685 9,354Foreign . . . . . . . . . . . . . . . . . . . . . . . . (8,530) — 414State and local . . . . . . . . . . . . . . . . . . 1,559 1,205 1,492
Total deferred . . . . . . . . . . . . . . . . . 9,079 8,890 11,260$ 61,156 $ 51,063 $31,921
Net deferred taxes, detailed below, recognize the impact of temporary differences between theamounts of assets and liabilities recorded for financial statement purposes and such amounts measuredin accordance with tax laws.
December 25, December 27,2004 2003
Compensation related . . . . . . . . . . . . . . . . . . . . . . . . . . . $ 24,841 $ —Accruals . . . . . . . . . . . . . . . . . . . . . . . . . . . . . . . . . . . . . 3,745 3,074Financing related . . . . . . . . . . . . . . . . . . . . . . . . . . . . . . (13,175) —Goodwill and other intangibles . . . . . . . . . . . . . . . . . . . . (23,483) 62,841Net operating loss and credit carryforwards . . . . . . . . . . . 48,663 11,727Depreciation and amortization . . . . . . . . . . . . . . . . . . . . (21,619) 920Non-indefinitely reinvested earning . . . . . . . . . . . . . . . . . (40,985) —Other . . . . . . . . . . . . . . . . . . . . . . . . . . . . . . . . . . . . . . 319 (13,774)
(21,694) 61,714Valuation allowance . . . . . . . . . . . . . . . . . . . . . . . . . . . . (10,362) (4,051)Total deferred taxes . . . . . . . . . . . . . . . . . . . . . . . . . . . . $(32,056) $ 60,737
As of December 25, 2004, the Company had net operating loss carryforwards for state income taxpurposes of approximately $32.1 million expiring at December 31,2005, and foreign net operating loss
67

CHARLES RIVER LABORATORIES INTERNATIONAL, INC.
NOTES TO CONSOLIDATED FINANCIAL STATEMENTS (Continued)
(dollars in thousands, except per share amounts)
10. Income Taxes (Continued)
carryforwards of approximately $28.0 million which may be carried forward indefinitely. Additionally,the Company has foreign tax credit carryforwards of $13.3 million which will begin to expire in 2009.
During 2004, in conjunction with the restructuring of its European operations, the Companyrecorded a tax benefit of $2.1 million on the reduction of a valuation allowance on its foreign taxcredits. During 2002, in conjunction with the state tax planning initiatives and the completion of the2001 state income tax returns during the third quarter of 2002, the Company reassessed the valuationallowance on the deferred tax assets associated with state net operating loss carryforwards. As a resultof the reassessment, $0.4 million of the valuation allowance was released and recorded as a tax benefit.
As of December 25, 2004, the Company had a valuation allowance of approximately $10.3 million.The valuation allowance is recorded against deferred tax assets for net operating loss carryforwards injurisdictions where management does not believe it is more likely than not a benefit will be realized.Approximately $8.4 million of the valuation was established against deferred tax assets acquired as partof the Inveresk acquisition and any future recognition of the asset will result in an adjustment togoodwill. The Company has recognized the balance of deferred tax asset on the belief that it is morelikely than not it will be realized. This belief is based on all available evidence including historicaloperating results, projections of taxable income, and tax planning strategies.
In connection with the 1999 recapitalization transaction, the Company elected under InternalRevenue Code Section 338(h)(10) to treat the transaction as a purchase resulting in a step-up in thetax basis of the underlying assets. The election resulted in the recording of a deferred tax asset in 1999,net of valuation allowance, of approximately $99,506 for the estimated future tax benefits associatedwith the increased tax basis of the assets. For financial reporting purposes the benefit was treated as acontribution to capital in 1999. As of December 25, 2004, the net deferred tax asset pertaining to theelection under section 338(h)(10) of the Internal Revenue Code was $59,207. The Company expects torealize the net benefit of the deferred tax asset over a 15 year period from the date of the 1999recapitalization transaction through annual tax deductions which are expected to reduce future taxpayments. It is possible that the Internal Revenue Service (IRS) may challenge the availability of theSection 338(h)(10) election to the Company as a result of the Company’s reorganization in connectionwith the initial public offering in 2000. If the IRS were successful, the expected future tax benefits fromthe election would not be available and the Company would be required to write off the relateddeferred tax assets by recording a non-recurring expense in the results of operations in an amountequal to such deferred tax assets. The Company believes that the reorganization and liquidatingdistribution should not have any impact upon the election for federal income tax purposes. However,the IRS may reach a different conclusion.
68

CHARLES RIVER LABORATORIES INTERNATIONAL, INC.
NOTES TO CONSOLIDATED FINANCIAL STATEMENTS (Continued)
(dollars in thousands, except per share amounts)
10. Income Taxes (Continued)
Reconciliations of the statutory U.S. federal income tax rate to effective tax rates are as follows:Fiscal Year Ended
December 25, December 27, December 28,2004 2003 2002
Tax at statutory U.S. tax rate . . . . . . . . . . . . 35.0% 35.0% 35.0%Foreign tax rate differences . . . . . . . . . . . . . (1.8)% 1.3% 1.0%
State income taxes, net of federal tax benefit 2.7% 3.2% 3.1%Change in valuation allowance . . . . . . . . . . . (1.4)% — (0.4)%Write off of deferred tax asset . . . . . . . . . . . 5.0% — —Other . . . . . . . . . . . . . . . . . . . . . . . . . . . . . 0.6% (1.0)% (0.9)%
40.1% 38.5% 37.8%
In the first quarter of 2004, the Company reorganized its European operations. The purpose of thereorganization was to streamline the legal entity structure in order to improve operating efficiency andcash management, facilitate acquisitions and provide tax benefits. The reorganization, which did notinvolve reductions of personnel or facility closures, resulted in a one-time, non-cash charge to earningsin the first quarter of 2004 of $7,900 due primarily to the write-off of a deferred tax asset.
The Company has provided $40,985 for U.S. income taxes on Inveresk’s non-US earnings as ofOctober 20, 2004, the date of the Inveresk acquisition. The amount of the deferred tax liability is basedon tax law as enacted on October 20, 2004. The Company intends to use the pre-acquisition Invereskearnings to fund a portion of the debt incurred in the acquisition.
As of December 25, 2004, earnings of non-U.S. subsidiaries considered to be indefinitely reinvestedtotaled $75,479. No provision for U.S. income taxes has been provided thereon. Upon distribution ofthose earnings in the form of dividends or otherwise, the Company would be subject to both U.S. taxesand withholding taxes payable to the various foreign countries. It is not practicable to estimate theamount of additional tax that might be payable on this undistributed foreign income.
On October 22, 2004, the American Jobs Creation Act of 2004 (the ‘‘Act’’) was signed into law.The Act creates a temporary incentive for U.S. multinationals to repatriate accumulated income earnedoutside the U.S. at an effective tax rate of 5.25%. This provision is applicable to our fiscal year 2005.We are currently in the process of evaluating whether or not, and to what extent, if any, this provisionmay benefit the Company. If the Company decides to repatriate all of the pre-acquisition earnings ofInveresk in a distribution that qualifies for the reduced tax rate under the Act, the Company estimatesit will recognize a one-time tax benefit of $21,533 in the quarter in which the decision is made.
69

CHARLES RIVER LABORATORIES INTERNATIONAL, INC.
NOTES TO CONSOLIDATED FINANCIAL STATEMENTS (Continued)
(dollars in thousands, except per share amounts)
11. Employee Benefits
401(k) Employee Savings Plan
The Company’s defined contribution plan, the Charles River Laboratories Employee Savings Plan,qualifies under section 401(k) of the Internal Revenue Code. It covers substantially all U.S. employeesand contains a provision whereby the Company matches a percentage of employee contributions. Thecosts associated with the defined contribution plan totaled $2,986, $2,225 and $2,397, in 2004, 2003, and2002, respectively.
Pension Plans
In connection with the Inveresk acquisition, the Company assumed a defined contribution plan anda defined benefit pension plan covering certain employees. Contributions under the definedcontribution plan are determined as a percentage of gross salary. The Company assumed a combinedbenefit obligation of $119,960 and combined plan assets of $62,908 as of October 20, 2004. The definedcontribution plan was amended subsequent to the acquisition to change the benefit structure for futureservice in the plan by increasing the normal retirement age and limiting increases in pensionable pay.The amendment reduced the benefit obligation by $15,802 as of December 25, 2004.
The Charles River Laboratories, Inc. Pension Plan (Pension Plan), is a qualified, non-contributoryplan that covers certain U.S. employees. Benefits are based on participants’ final average monthlycompensation and years of service. Participants’ rights vest upon completion of five years of service.Effective January 1, 2002, the plan was amended to exclude new participants from joining the plan.Benefit criteria offered to existing participants as of the amendment date did not change.
Under another defined benefit plan, the Company provides some executives with supplementalretirement benefits. This plan, the Executive Supplemental Life Insurance Retirement Plan (ESLIRP),is unfunded and non-qualified under the provisions of the Employee Retirement Income Securities Actof 1974. The Company has, however, obtained several key-person life insurance policies with theintention of using their cash surrender value to fund the ESLIRP. Certain portions of participantbenefits were transferred from the ESLIRP to the Pension Plan in 2002. At December 25, 2004 andDecember 27, 2003, the cash surrender value of these policies was $7,391 and $7,298, respectively.
The Charles River Japan and Charles River Canada defined benefit pension plans arenon-contributory plans that cover substantially all employees of those respective companies. Benefitsare based upon length of service and final salary.
The following table provides reconciliations of the changes in benefit obligations, fair value of planassets and funded status of the defined benefit plans.
70

CHARLES RIVER LABORATORIES INTERNATIONAL, INC.
NOTES TO CONSOLIDATED FINANCIAL STATEMENTS (Continued)
(dollars in thousands, except per share amounts)
11. Employee Benefits (Continued)
Obligations and Funded Status
SupplementalPension Benefits Retirement Benefits
2004 2003 2004 2003
Change in benefit obligationsBenefit obligation at beginning of year . . . . . . . . . . . . . . $ 46,934 $40,367 $ 13,037 $ 11,998Benefit obligation assumed . . . . . . . . . . . . . . . . . . . . . . . 119,960 — — —Service cost . . . . . . . . . . . . . . . . . . . . . . . . . . . . . . . . . . 4,081 2,980 283 425Interest cost . . . . . . . . . . . . . . . . . . . . . . . . . . . . . . . . . 3,726 2,344 832 729Benefit payments . . . . . . . . . . . . . . . . . . . . . . . . . . . . . . (1,333) (975) (521) (521)Plan participants’ contributions . . . . . . . . . . . . . . . . . . . . 198 — — —Actuarial loss (gain) . . . . . . . . . . . . . . . . . . . . . . . . . . . . 14,313 1,161 2,672 406Plan amendments . . . . . . . . . . . . . . . . . . . . . . . . . . . . . (15,802) 699 — —Effect of foreign exchange . . . . . . . . . . . . . . . . . . . . . . . 3,824 358 — —
Benefit obligation at end of year . . . . . . . . . . . . . . . . . . . $175,901 $46,934 $ 16,303 $ 13,037
Change in plan assetsFair value of plan assets at beginning of year . . . . . . . . . . $ 42,040 $35,124 $ — $ —Plan assets assumed . . . . . . . . . . . . . . . . . . . . . . . . . . . . 62,908 — — —Actual return on plan assets . . . . . . . . . . . . . . . . . . . . . . 5,117 7,208 — —Employer contributions . . . . . . . . . . . . . . . . . . . . . . . . . 1,376 683 521 521Plan participants’ contributions . . . . . . . . . . . . . . . . . . . . 198 — — —Benefit payments . . . . . . . . . . . . . . . . . . . . . . . . . . . . . . (1,333) (975) (521) (521)Insured assets . . . . . . . . . . . . . . . . . . . . . . . . . . . . . . . . 1,436 — — —
Fair value of plan assets at end of year . . . . . . . . . . . . . . $111,742 $42,040 $ — $ —
Funded statusFunded status . . . . . . . . . . . . . . . . . . . . . . . . . . . . . . . . $ (64,159) $(4,894) $(16,303) $(13,037)Unrecognized transition obligation . . . . . . . . . . . . . . . . . — 4 — —Unrecognized prior-service cost . . . . . . . . . . . . . . . . . . . (13,606) 3,366 (1,134) (1,296)Unrecognized gain . . . . . . . . . . . . . . . . . . . . . . . . . . . . . 17,904 5,762 7,060 4,970
Net amount recognized . . . . . . . . . . . . . . . . . . . . . . . . . $ (59,861) $ 4,238 $(10,377) $ (9,363)
Amounts recognized in the statement of financial position consist of:
Prepaid benefit cost . . . . . . . . . . . . . . . . . . . . . . . . . . . . $ 3,801 $ 5,637 $ — $ —Accrued benefit cost . . . . . . . . . . . . . . . . . . . . . . . . . . . (63,662) (1,432) (10,377) (12,786)Intangible asset . . . . . . . . . . . . . . . . . . . . . . . . . . . . . . . — — — —Accumulated other comprehensive income . . . . . . . . . . . — 33 — 3,423
Net amount recognized . . . . . . . . . . . . . . . . . . . . . . . . . $ (59,861) $ 4,238 $(10,377) $ (9,363)
The accumulated benefit obligation for all defined benefit plans was $161,273 and $46,377 atDecember 25, 2004 and December 27, 2003, respectively.
71

CHARLES RIVER LABORATORIES INTERNATIONAL, INC.
NOTES TO CONSOLIDATED FINANCIAL STATEMENTS (Continued)
(dollars in thousands, except per share amounts)
11. Employee Benefits (Continued)
Information for defined benefit plans with an accumulated benefit obligation in excess of planassets
SupplementalPension Benefits Retirement Benefits
2004 2003 2004 2003
Projected benefit obligation . . . . . . . . . . . . . $121,916 $6,396 $16,303 $13,037Accumulated benefit obligation . . . . . . . . . . 120,165 5,301 16,240 12,786Fair value of plan assets . . . . . . . . . . . . . . . 68,259 3,510 — —
Components of net periodic benefit cost
SupplementalPension Benefits Retirement Benefits
2004 2003 2002 2004 2003 2002
Service cost . . . . . . . . . . . . . . . . . . . . $4,081 $2,980 $2,213 $ 283 $ 425 $ 368Interest cost . . . . . . . . . . . . . . . . . . . . 3,726 2,344 1,992 832 729 680Expected return on plan assets . . . . . . (4,123) (2,925) (3,477) — — —Amortization of transition obligation . . 4 16 84 — — 72Amortization of prior service cost . . . . 288 288 235 (162) (162) (162)Amortization of net loss (gain) . . . . . . 76 460 50 582 466 358
Net periodic benefit cost (income) . . . . $4,052 $3,163 $1,097 $1,535 $1,458 $1,316
Additional information
SupplementalPension Benefits Retirement Benefits
2004 2003 2004 2003
Increase (decrease) in minimum liabilityincluded in other comprehensive income,net of tax . . . . . . . . . . . . . . . . . . . . . . . . . $(4) $(136) $(1,471) $402
Assumptions
Weighted-average assumptions used to determine benefit obligations
SupplementalPension Benefits Retirement Benefits
2004 2003 2004 2003
Discount rate . . . . . . . . . . . . . . . . . . . . . . . 5.49% 5.72% 5.75% 6.00%Rate of compensation increase . . . . . . . . . . . 4.36% 4.53% 4.75% 4.75%
72

CHARLES RIVER LABORATORIES INTERNATIONAL, INC.
NOTES TO CONSOLIDATED FINANCIAL STATEMENTS (Continued)
(dollars in thousands, except per share amounts)
11. Employee Benefits (Continued)
Weighted-average assumptions used to determine net periodic benefit cost
SupplementalPension Benefits Retirement Benefits
2004 2003 2002 2004 2003 2002
Discount rate . . . . . . . . . . . . . . . . . . . 5.59% 5.73% 6.20% 6.00% 6.00% 6.50%Expected long term return on plan
assets . . . . . . . . . . . . . . . . . . . . . . . 7.63% 8.36% 9.05% — — —Rate of compensation increase . . . . . . . 4.36% 4.58% 4.59% 4.75% 4.75% 4.75%
The expected long term rate of return on plan assets was made considering the pension plan’sasset mix, historical returns and expected yields on plan assets.
Plan Assets
The Company’s pension plan weighted-average asset allocations by asset category are as follows:
TargetAllocation Pension Benefits
2005 2004 2003
Equity securities . . . . . . . . . . . . . . . . . . . . . . . . . . . . . 69% 69% 66%Fixed income . . . . . . . . . . . . . . . . . . . . . . . . . . . . . . . 27% 27% 30%Other . . . . . . . . . . . . . . . . . . . . . . . . . . . . . . . . . . . . . 4% 4% 4%
Total . . . . . . . . . . . . . . . . . . . . . . . . . . . . . . . . . . . . . 100% 100% 100%
The Company’s investment objective is to obtain the highest possible return commensurate withthe level of assumed risk. Fund performances are compared to benchmarks including the S&P 500Index, Russell 1000 Index, Russell 3000 Index and Lehman Brothers Aggregate Bond Index. TheCompany’s Investment Committee meets on a quarterly basis to review plan assets.
The Company’s plan assets did not include any of the Company’s common stock at December 25,2004 and December 27, 2003.
Cash Flows
Contributions
The Company expects to contribute $5,684 to its pension plans in 2005.
73

CHARLES RIVER LABORATORIES INTERNATIONAL, INC.
NOTES TO CONSOLIDATED FINANCIAL STATEMENTS (Continued)
(dollars in thousands, except per share amounts)
11. Employee Benefits (Continued)
Estimated Future Benefit Payments
The following benefit payments, which reflect expected future service, as appropriate, are expectedto be paid:
SupplementalPension RetirementBenefits Benefits
2005 . . . . . . . . . . . . . . . . . . . . . . . . . . . . . . . . . . . . . . . . . . $5,138 $ 5332006 . . . . . . . . . . . . . . . . . . . . . . . . . . . . . . . . . . . . . . . . . . 3,248 5392007 . . . . . . . . . . . . . . . . . . . . . . . . . . . . . . . . . . . . . . . . . . 3,592 5682008 . . . . . . . . . . . . . . . . . . . . . . . . . . . . . . . . . . . . . . . . . . 3,906 5992009 . . . . . . . . . . . . . . . . . . . . . . . . . . . . . . . . . . . . . . . . . . 4,407 7992010 - 2015 . . . . . . . . . . . . . . . . . . . . . . . . . . . . . . . . . . . . . 30,395 5,788
12. Stock Compensation Plans
In connection with the Inveresk acquisition, the Company assumed Inveresk’s stock compensationplans. Stock options of 1,439,882 and 50,000 were assumed from the Inveresk Research Group, Inc.2002 Stock Option Plan (Inveresk Stock Option Plan) and the Inveresk Research Group, Inc. 2002Non-employee Directors Stock Option Plan (Inveresk Director Plan), respectively. Stock options underthe Inveresk Stock Option Plan, which provides options to employees of Inveresk, vest in equalinstallments over the three years following the date of grant. At December 25, 2004, options topurchase 157,391 shares were exercisable under the plan. Stock options under the Inveresk DirectorsPlan, which provides options to non-executive directors of Inveresk, vest three years following the dateof grant. At December 25, 2004, options to purchase 22,000 shares were exercisable under the plan.
The 1999 Management Incentive Plan (1999 Plan) is administered by the Company’sCompensation Committee of the Board of Directors. The 1999 Plan has a total of 1,784,384 sharesauthorized, of which 12,417 shares are available for grant as of December 25, 2004. Awards of 23,000and 30,000 non-qualified stock options were granted under the 1999 Plan in 2003 and 2002,respectively. There were no awards granted under the 1999 plan during 2004. As of December 25, 2004,options to purchase 557,916 shares were exercisable under the 1999 Plan. Options granted pursuant tothe 1999 Plan are subject to a vesting schedule based on three distinct measures. Certain options vestsolely with the passage of time (incrementally typically over five years so long as the optionee continuesto be employed by the Company). The remainder of the options vest over time but contain clausesproviding for the acceleration of vesting upon the achievement of certain performance targets or theoccurrence of certain liquidity events. All options expire on or before November 3, 2013. The exerciseprice of all options granted under the 1999 Plan is the fair market value of the underlying commonstock at the time of the grant.
Effective June 5, 2000, the Board of Directors adopted and the Company’s shareholders approvedthe 2000 Incentive Plan (2000 Plan), which provides for the grant of incentive and nonqualified stockoptions, stock appreciation rights, restricted or unrestricted common stock and other equity awards.The 2000 Plan has a total of 6,289,000 shares authorized, of which 1,331,366 are available for grant asof December 25, 2004. Options granted pursuant to the 2000 Plan vest incrementally typically over
74

CHARLES RIVER LABORATORIES INTERNATIONAL, INC.
NOTES TO CONSOLIDATED FINANCIAL STATEMENTS (Continued)
(dollars in thousands, except per share amounts)
12. Stock Compensation Plans (Continued)
three years so long as the employee continues to be employed by the Company. All options grantedunder the 2000 Plan expire on or before December 1, 2014. The exercise price of all options grantedunder the 2000 Plan is the fair value of the underlying common stock at the time of grant. A total of1,441,300, 1,478,200 and 1,248,125 stock option awards were made under the 2000 Plan in 2004, 2003and 2002, respectively, of which 1,600,736 awards were exercisable as of December 25, 2004.
Under the Company’s 2000 Plan, shares of restricted common stock of the Company may begranted at no cost to officers and key employees. Recipients are entitled to cash dividends and to votetheir respective shares. Restrictions limit the sale or transfer of these shares until they vest, which istypically over a three-year period. Upon issuance of restricted stock awards under the plan, unearnedcompensation equivalent to the market value at the measurement date is charged to shareholders’equity and subsequently amortized as compensation expense over the vesting period. The Companygranted 24,700, 32,300 and 54,100 restricted stock awards at no cost and recorded $1,075, $1,062 and$1,740 as unearned compensation in shareholders’ equity for the years ended December 25, 2004,December 27, 2003 and December 28, 2002, respectively. The Company recorded $1,469, $851 and$416 in compensation expense for these stock awards for the years ended December 25, 2004,December 27, 2003 and December 28, 2002, respectively. Additionally, the Company issued 30,000performance-based restricted stock awards at no cost to the Company’s Chief Executive Officer andPresident during the year ended December 28, 2002. Vesting of these awards is contingent upon theachievement of certain annual earnings per share growth targets over the vesting period. These sharesare accounted for as variable awards and the related unearned compensation and compensationexpense are adjusted based on the closing market price of the Company’s common stock until theshares are vested. The Company recorded $1,147 as unearned compensation in 2002 and recorded $251and $586 in compensation expense in connection with these awards in 2003 and 2002, respectively. As aresult of the merger with Inveresk, the earnings per share target was not obtained, therefore, during2004 the Company reversed $537 of previously recorded compensation expense. The weighted averagefair value of all restricted stock awards issued during 2004, 2003 and 2002 was $43.54, $32.87 and$32.15, respectively. As of December 25, 2004, a total of 84,241 restricted stock awards wereoutstanding.
In the first quarter of 2004, the Company’s Board of Directors initiated a new performance-basedmanagement incentive program (Mid-Term Incentive (MTI) Program), as a carve-out from theshareholder approved 2000 Incentive Plan. For 2004, the MTI Program provides that up to a maximumof 218,000 performance units may be granted to senior executives and certain other key employees ofthe Company based on achieving financial performance targets for 2006. The MTI Program units,which equal the value of one share of Company stock, will be paid out to participating employees inthe form of cash and restricted stock. During the third quarter of 2004, management recommended andthe Compensation Committee of the Board of Directors agreed to exercise its discretion to increase theMTI targets to include Inveresk’s three year projections as set forth in the merger plan presented tothe Board of Directors on June 30, 2004. Therefore, the merger will not trigger any payments underthe MTI Program. For a participant to be eligible to receive payment for 2004 MTI units, the employeemust remain employed with the Company until at least the beginning of 2007. The restricted stock,which requires continued employment beyond 2007, vests over the ensuing two-year period.
75

CHARLES RIVER LABORATORIES INTERNATIONAL, INC.
NOTES TO CONSOLIDATED FINANCIAL STATEMENTS (Continued)
(dollars in thousands, except per share amounts)
12. Stock Compensation Plans (Continued)
The Company will accrue compensation expense for the 2004 MTI Program obligations over theperiod the participating employees are required to be employed by the Company. During 2004, theCompany recorded $1,154 as compensation expense, of which $581 was recorded as capital in excess ofpar value and $573 was recorded as accrued compensation. The accrual for the MTI Program ismarked to market on a quarterly basis. Accordingly, changes in the market value of Company stockcould materially affect this compensation expense. In February 2005, the Compensation Committee ofthe Board of Directors determined that it would not make any future awards under the MTI Program.
In conjunction with the 2000 Plan, the Board of Directors adopted, and the Company’sshareholders approved, the 2000 Directors Stock Plan (Directors Plan), which provides for the grant ofboth automatic and discretionary nonstatutory stock options to non-employee directors. On the day ofeach annual meeting of shareholders, each independent director who served during the prior year willbe awarded an option to purchase shares of our common stock (pro-rated if the director did not servefor the entire preceding year). The Directors Plan has a total of 100,000 shares authorized, of which4,000 shares are available to be granted as of December 25, 2004. Awards of 24,000 stock options weregranted under the Directors Plan in 2002. No stock options were awarded under this plan since 2002.There are currently 56,000 options exercisable under the Directors Plan. Options granted pursuant tothe Directors Plan cliff vest upon the earlier of the first anniversary of the date of grant or the businessday prior to the date of the Company’s next annual meeting. All options granted expire on or beforeMay 3, 2007. The exercise price of the options granted under the Directors Plan is the fair marketvalue of the underlying common stock at the time of grant.
76

CHARLES RIVER LABORATORIES INTERNATIONAL, INC.
NOTES TO CONSOLIDATED FINANCIAL STATEMENTS (Continued)
(dollars in thousands, except per share amounts)
12. Stock Compensation Plans (Continued)
The following table summarizes stock option activities under the 1999 Plan, the 2000 Plan, and theDirectors Plan:
Weighted AverageShares Exercise Price Exercise Price
Options outstanding as of December 29, 2001 . . . . . . . . 2,749,148 $ 5.33 - $35.08 $14.38Options granted . . . . . . . . . . . . . . . . . . . . . . . . . . . . . . 1,302,125 $29.66 - $39.25 $32.81Options exercised . . . . . . . . . . . . . . . . . . . . . . . . . . . . (424,516) $ 5.33 - $35.08 $ 7.39Options canceled . . . . . . . . . . . . . . . . . . . . . . . . . . . . . (92,578) $16.00 - $39.00 $30.81
Options outstanding as of December 28, 2002 . . . . . . . . 3,534,179 $ 5.33 - $39.25 $21.60
Options granted . . . . . . . . . . . . . . . . . . . . . . . . . . . . . . 1,500,875 $26.25 - $36.47 $32.78Options exercised . . . . . . . . . . . . . . . . . . . . . . . . . . . . (375,469) $ 5.33 - $32.15 $ 8.18Options canceled . . . . . . . . . . . . . . . . . . . . . . . . . . . . . (132,593) $16.00 - $39.00 $32.23
Options outstanding as of December 27, 2003 . . . . . . . . 4,526,992 $ 5.33 - $39.25 $26.13
Options assumed . . . . . . . . . . . . . . . . . . . . . . . . . . . . . 1,489,882 $ 0.03 - $45.94 $19.47Options granted . . . . . . . . . . . . . . . . . . . . . . . . . . . . . . 1,417,100 $40.34 - $47.40 $43.30Options exercised . . . . . . . . . . . . . . . . . . . . . . . . . . . . (1,507,421) $ 0.03 - $39.25 $17.62Options canceled . . . . . . . . . . . . . . . . . . . . . . . . . . . . . (338,666) $13.25 - $43.07 $34.97
Options outstanding as of December 25, 2004 . . . . . . . . 5,587,887 $ 0.24 - $47.40 $30.47
Options exercisable as of December 28, 2002 . . . . . . . . . 1,679,412 $ 5.33 - $35.08 $10.83Options exercisable as of December 27, 2003 . . . . . . . . . 2,088,473 $ 5.33 - $39.25 $18.47Options exercisable as of December 25, 2004 . . . . . . . . . 2,394,043 $ 0.24 - $39.25 $24.00
OPTIONS OUTSTANDING OPTIONS EXERCISABLE
Outstanding as of Weighted Average Weighted Exercisable as of WeightedRange of December 25, Remaining Contractual Average December 25, AverageExercise Prices 2004 Life (years) Exercise Price 2004 Exercise Price
$ 0.00 - $10.00 550,607 4.8 $ 5.20 550,607 $ 5.20$10.01 - $20.00 509,611 6.5 $14.34 288,195 $15.11$20.01 - $30.00 479,956 7.7 $27.07 86,464 $25.39$30.01 - $40.00 2,702,613 7.5 $32.85 1,468,777 $32.70$40.01 - $50.00 1,345,100 8.5 $43.35 — $ —
5,587,887 7.5 $30.47 2,394,043 $24.00
77

CHARLES RIVER LABORATORIES INTERNATIONAL, INC.
NOTES TO CONSOLIDATED FINANCIAL STATEMENTS (Continued)
(dollars in thousands, except per share amounts)
13. Joint Ventures
The Company holds investments in several joint ventures including Charles River Mexico andCharles River Japan. These joint ventures are separate legal entities whose purpose is consistent withthe overall operations of the Company and represent geographic and business segment expansions ofexisting markets. The financial results of all joint ventures were consolidated in the Company’s resultsas the Company has the ability to exercise control over these entities. The interests of the outside jointventure partners in these joint ventures have been recorded as minority interests totaling $9,792 and$10,176 at December 25, 2004 and December 27, 2003, respectively.
Since September 30, 2002, the Company did not have any unconsolidated joint ventures. For theyear ended December 28, 2002, Charles River Mexico’s unconsolidated net sales, operating income andnet income was $3,291, $185 and $387, respectively, which includes nine months of activity due to theconsolidation of this majority owned subsidiary as of September 30, 2002.
14. Commitments and Contingencies
Operating Leases
The Company has commitments for various operating leases for machinery and equipment,vehicles, office equipment, land and office space. Rent expense for all operating leases was $10,663,$12,057 and $10,448 in 2004, 2003, and 2002, respectively. Future minimum payments by year and inthe aggregate, under noncancellable operating leases with initial or remaining terms of one year ormore, consist of the following at December 25, 2004:
2005 . . . . . . . . . . . . . . . . . . . . . . . . . . . . . . . . . . . . . . . . . . . . . . . . . . . . $18,6092006 . . . . . . . . . . . . . . . . . . . . . . . . . . . . . . . . . . . . . . . . . . . . . . . . . . . . 15,3552007 . . . . . . . . . . . . . . . . . . . . . . . . . . . . . . . . . . . . . . . . . . . . . . . . . . . . 13,3422008 . . . . . . . . . . . . . . . . . . . . . . . . . . . . . . . . . . . . . . . . . . . . . . . . . . . . 11,0502009 . . . . . . . . . . . . . . . . . . . . . . . . . . . . . . . . . . . . . . . . . . . . . . . . . . . . 8,918Thereafter . . . . . . . . . . . . . . . . . . . . . . . . . . . . . . . . . . . . . . . . . . . . . . . 18,326
$85,600
Insurance
The Company maintains insurance for workers’ compensation, various liability lines and employeemedical with per claim loss limits up to $500. Basket aggregate loss limits for workers compensation,auto liability and general liability is projected at $4,712. Related accruals were $6,156 and $5,522 onDecember 25, 2004 and December 27, 2003, respectively.
Litigation
Various lawsuits, claims and proceedings of a nature considered normal to its business are pendingagainst the Company. In the opinion of management, the outcome of such proceedings and litigationcurrently pending will not materially affect the Company’s consolidated financial statements.
78

CHARLES RIVER LABORATORIES INTERNATIONAL, INC.
NOTES TO CONSOLIDATED FINANCIAL STATEMENTS (Continued)
(dollars in thousands, except per share amounts)
15. Related Party Transactions
Ajinomoto Company, Inc. (Ajinomoto) is a minority shareholder in Charles River Japan. CharlesRiver Japan conducts certain business transactions with Ajinomoto, including the purchase ofinformation technology systems and services, engineering services, product delivery services and thereimbursement of employee compensation. Charles River Japan incurred expenses related to theseservices of $6,053, $4,584 and $6,631 during 2004, 2003 and 2002, respectively. As of December 25,2004 and December 27, 2003, Charles River Japan had amounts due to Ajinomoto totaling $3,766 and$1,251, respectively. In addition, Charles River Japan sold products to Ajinomoto totaling $1,090,$1,011 and $890 during 2004, 2003 and 2002, respectively.
During 2004, the Company closed its joint venture company Charles River Proteomics. ProteomeSystems, Ltd. (Proteome) was a minority shareholder in Charles River Proteomics. During 2002,Charles River Proteomics purchased a hardware platform from Proteome for $1,633, of which $1,520was paid in 2002 and the remaining in 2003. During 2003, Charles River Proteomics paid Proteome$190 for training on the hardware platform, borrowed $100 against a working capital loan fromProteome and purchased laboratory supplies from Proteome. Charles River Proteomics incurredexpenses related to the laboratory supplies of $39 and $17 during 2004 and 2003, respectively. As ofDecember 27, 2003, Charles River Proteomics had amounts due to Proteome totaling $100 and hadamounts due from Proteome totaling $50.
79

CHARLES RIVER LABORATORIES INTERNATIONAL, INC.
NOTES TO CONSOLIDATED FINANCIAL STATEMENTS (Continued)
(dollars in thousands, except per share amounts)
16. Business Segment and Geographic Information
In accordance with SFAS No. 131, ‘‘Disclosures About Segments of an Enterprise and RelatedInformation,’’ the Company discloses financial and descriptive information about its reportableoperating segments. Operating segments are components of an enterprise about which separatefinancial information is available and is regularly evaluated by the chief operating decision maker indeciding how to allocate resources and in assessing performance.
During the fourth quarter of 2004, the Company revised its consolidated financial reportingsegments. The Company will now report three segments, called Research Models and Services (RMS),Preclinical Services and Clinical Services. The research models business, transgenic services, laboratoryservices, contract staffing services and vaccine support products and services will continue to bereported in the RMS segment and in vitro technology will now be reported in the RMS segment. TheCompany will report development services, including general and specialty toxicology, pathologyservices, interventional and surgical services and biosafety testing, as well as Inveresk preclinical servicesin the Preclinical Services segment. The Company will report Inveresk’s Phase I through Phase IVclinical development services in the clinical services segment. The changes in segment presentation haveno effect on consolidated revenues or net income.
RMS includes the Company’s research model business, research model services, vaccine supportservices and in vitro technology services. The research models are principally comprised of geneticallyand virally defined, purpose bred rats and mice used in the drug discovery and development processtypically required by the U.S. Food and Drug Administration (FDA) and foreign regulatory bodies.Research model services assist customers in screening drug candidates faster by providing a variety ofservices related to genetically-defined research models for in-house research and by implementingefficacy screening protocols to improve the customers’ drug evaluation process. Vaccine supportproducts are principally pathogen-free fertilized chicken eggs, a critical ingredient for poultry vaccineand some human vaccine production. In vitro technology services are comprised of non-animal, or invitro, products and services for testing the safety of drugs and devices. Preclinical Services includesdevelopment services which enable customers to accelerate their drug discovery and developmentprocess. These services are FDA compliant services that aid customers in drug safety assessment andbiotech safety testing. Clinical Services includes services consisting of designing, monitoring andmanaging trials of new pharmaceutical, biostatistical, product registration and pharmacovigilanceservices.
The following table presents sales and other financial information by business segment for 2004,2003 and 2002. Net sales represent sales originating in entities primarily engaged in either provision of
80

CHARLES RIVER LABORATORIES INTERNATIONAL, INC.
NOTES TO CONSOLIDATED FINANCIAL STATEMENTS (Continued)
(dollars in thousands, except per share amounts)
16. Business Segment and Geographic Information (Continued)
Research Models and Services, Preclinical Services or Clinical Services. Long lived assets includeproperty, plant and equipment, goodwill, other intangibles and other long lived assets.
2004 2003 2002
Research Models and ServicesNet sales . . . . . . . . . . . . . . . . . . . . . . . . . . . . $ 476,668 $428,176 $372,432Gross margin . . . . . . . . . . . . . . . . . . . . . . . . . 206,797 182,318 154,180Operating income . . . . . . . . . . . . . . . . . . . . . . 152,556 136,518 110,848Total assets . . . . . . . . . . . . . . . . . . . . . . . . . . . 569,765 573,038 479,094Long-lived assets . . . . . . . . . . . . . . . . . . . . . . 211,110 195,082 171,704Depreciation and amortization . . . . . . . . . . . . 17,872 16,974 13,924Capital expenditures . . . . . . . . . . . . . . . . . . . . 26,559 23,776 24,450
Preclinical ServicesNet sales . . . . . . . . . . . . . . . . . . . . . . . . . . . . $ 265,977 $185,547 $182,197Gross margin . . . . . . . . . . . . . . . . . . . . . . . . . 86,230 51,347 54,803Operating income . . . . . . . . . . . . . . . . . . . . . . 33,622 17,521 25,967Total assets . . . . . . . . . . . . . . . . . . . . . . . . . . . 1,566,230 226,516 222,250Long-lived assets . . . . . . . . . . . . . . . . . . . . . . 1,422,151 171,981 170,664Depreciation and amortization . . . . . . . . . . . . 25,443 12,590 10,062Capital expenditures . . . . . . . . . . . . . . . . . . . . 18,493 8,928 13,093
Clinical ServicesNet sales . . . . . . . . . . . . . . . . . . . . . . . . . . . . $ 24,272 $ — $ —Gross margin . . . . . . . . . . . . . . . . . . . . . . . . . 5,539 — —Operating income . . . . . . . . . . . . . . . . . . . . . . 731 — —Total assets . . . . . . . . . . . . . . . . . . . . . . . . . . . 490,840 — —Long-lived assets . . . . . . . . . . . . . . . . . . . . . . 432,856 — —Depreciation and amortization . . . . . . . . . . . . 2,994 — —Capital expenditures . . . . . . . . . . . . . . . . . . . . 284 — —
A reconciliation of segment operating income to consolidated operating income is as follows:
Fiscal Year Ended
December 25, December 27, December 28,2004 2003 2002
Total segment operating income . . . . . . . . . . $186,909 $154,039 $136,815Unallocated corporate overhead . . . . . . . . . (26,586) (15,486) (14,549)
Consolidated operating income . . . . . . . . . . $160,323 $138,553 $122,266
81

CHARLES RIVER LABORATORIES INTERNATIONAL, INC.
NOTES TO CONSOLIDATED FINANCIAL STATEMENTS (Continued)
(dollars in thousands, except per share amounts)
16. Business Segment and Geographic Information (Continued)
A summary of unallocated corporate overhead consists of the following:
December 25, December 27, December 28,2004 2003 2002
Restricted stock and performance basedcompensation expense . . . . . . . . . . . . . . . $ 4,389 $ 1,102 $ 1,002
U.S. pension expense (income) . . . . . . . . . . 3,483 3,591 1,677Audit, tax and related expense . . . . . . . . . . . 4,063 1,327 1,083Bonus expense . . . . . . . . . . . . . . . . . . . . . . 2,883 557 2,679Executive officers’ salary . . . . . . . . . . . . . . . 2,436 2,077 1,970Other general unallocated corporate
expenses . . . . . . . . . . . . . . . . . . . . . . . . . 9,332 6,832 6,138
$26,586 $15,486 $14,549
Other general unallocated corporate expenses consist of various costs including those associatedwith senior executive salaries and departments such as corporate accounting, legal and investorrelations.
The following table presents sales and other financial information by geographic regions for 2004,2003 and 2002. Included in the other non-U.S. category below are the Company’s operations located inAustralia, Canada, China, and Mexico. Sales to unaffiliated customers represent net sales originating inentities physically located in the identified geographic area. Long-lived assets include property, plantand equipment, goodwill, other intangibles, and other long-lived assets.
Other NonU.S. Europe Japan U.S. Consolidated
2004Sales to unaffiliated customers . . . . . . . . . . $488,823 $177,666 $57,126 $43,302 $ 766,917Long-lived assets . . . . . . . . . . . . . . . . . . . . 514,700 700,631 48,215 802,571 2,066,117
2003Sales to unaffiliated customers . . . . . . . . . . $424,578 $117,894 $52,617 $18,634 $ 613,723Long-lived assets . . . . . . . . . . . . . . . . . . . . 246,630 65,452 43,867 11,114 367,063
2002Sales to unaffiliated customers . . . . . . . . . . $402,424 $ 92,387 $48,089 $11,729 $ 554,629Long-lived assets . . . . . . . . . . . . . . . . . . . . 242,397 53,886 37,806 8,279 342,368
82

FINANCIAL STATEMENT SCHEDULESCHARLES RIVER LABORATORIES INTERNATIONAL, INC.
SCHEDULE II — VALUATION AND QUALIFYING ACCOUNTS(dollars in thousands)
Income Tax Valuation Allowance
Balance at December 29, 2001 . . . . . . . . . . . . . . . . . . . . . . . . . . . . . . . . . $ 4,524
Provisions . . . . . . . . . . . . . . . . . . . . . . . . . . . . . . . . . . . . . . . . . . . . . . . . —Releases . . . . . . . . . . . . . . . . . . . . . . . . . . . . . . . . . . . . . . . . . . . . . . . . . (473)
Balance at December 28, 2002 . . . . . . . . . . . . . . . . . . . . . . . . . . . . . . . . . 4,051
Provisions . . . . . . . . . . . . . . . . . . . . . . . . . . . . . . . . . . . . . . . . . . . . . . . . —Releases . . . . . . . . . . . . . . . . . . . . . . . . . . . . . . . . . . . . . . . . . . . . . . . . . —
Balance at December 27, 2003 . . . . . . . . . . . . . . . . . . . . . . . . . . . . . . . . . 4,051
Provisions . . . . . . . . . . . . . . . . . . . . . . . . . . . . . . . . . . . . . . . . . . . . . . . . 8,422Releases . . . . . . . . . . . . . . . . . . . . . . . . . . . . . . . . . . . . . . . . . . . . . . . . . (2,111)
Balance at December 25, 2004 . . . . . . . . . . . . . . . . . . . . . . . . . . . . . . . . . $10,362
Allowance for Doubtful Accounts
Balance at December 29, 2001 . . . . . . . . . . . . . . . . . . . . . . . . . . . . . . . . . . $2,119
Provisions . . . . . . . . . . . . . . . . . . . . . . . . . . . . . . . . . . . . . . . . . . . . . . . . . (25)Recoveries/Write-offs . . . . . . . . . . . . . . . . . . . . . . . . . . . . . . . . . . . . . . . . (554)
Balance at December 28, 2002 . . . . . . . . . . . . . . . . . . . . . . . . . . . . . . . . . . 1,540
Provisions . . . . . . . . . . . . . . . . . . . . . . . . . . . . . . . . . . . . . . . . . . . . . . . . . 1,494Recoveries/Write-offs . . . . . . . . . . . . . . . . . . . . . . . . . . . . . . . . . . . . . . . . (1,390)
Balance at December 27, 2003 . . . . . . . . . . . . . . . . . . . . . . . . . . . . . . . . . . 1,644
Provisions . . . . . . . . . . . . . . . . . . . . . . . . . . . . . . . . . . . . . . . . . . . . . . . . . 786Acquisitions . . . . . . . . . . . . . . . . . . . . . . . . . . . . . . . . . . . . . . . . . . . . . . . 1,943Recoveries/Write-offs . . . . . . . . . . . . . . . . . . . . . . . . . . . . . . . . . . . . . . . . (536)
Balance at December 25, 2004 . . . . . . . . . . . . . . . . . . . . . . . . . . . . . . . . . . $3,837
83

CHARLES RIVER LABORATORIES INTERNATIONAL, INC.
SUPPLEMENTARY DATA
Quarterly Information (Unaudited)
First Second Third FourthQuarter Quarter Quarter Quarter
(dollars in thousands, except per share amounts)
Year ended December 25, 2004Net sales . . . . . . . . . . . . . . . . . . . . . . . . . . . . . . . . . . . . $172,637 $180,193 $176,026 $238,061Gross profit . . . . . . . . . . . . . . . . . . . . . . . . . . . . . . . . . . 68,828 74,621 69,397 85,720Operating income . . . . . . . . . . . . . . . . . . . . . . . . . . . . . . 39,517 44,203 43,374 33,229Net income . . . . . . . . . . . . . . . . . . . . . . . . . . . . . . . . . . 17,594 26,300 25,821 20,077Earnings per common share
Basic . . . . . . . . . . . . . . . . . . . . . . . . . . . . . . . . . . . . . $ 0.38 $ 0.57 $ 0.56 $ 0.33Diluted . . . . . . . . . . . . . . . . . . . . . . . . . . . . . . . . . . . . $ 0.36 $ 0.52 $ 0.51 $ 0.32
Year ended December 27, 2003Net sales . . . . . . . . . . . . . . . . . . . . . . . . . . . . . . . . . . . . $152,125 $154,364 $151,194 $156,040Gross profit . . . . . . . . . . . . . . . . . . . . . . . . . . . . . . . . . . 57,982 59,585 56,492 59,606Operating income . . . . . . . . . . . . . . . . . . . . . . . . . . . . . . 33,848 35,006 34,256 35,443Net income . . . . . . . . . . . . . . . . . . . . . . . . . . . . . . . . . . 19,354 20,561 19,591 20,645Earnings per common share
Basic . . . . . . . . . . . . . . . . . . . . . . . . . . . . . . . . . . . . . $ 0.43 $ 0.45 $ 0.43 $ 0.45Diluted . . . . . . . . . . . . . . . . . . . . . . . . . . . . . . . . . . . . $ 0.40 $ 0.42 $ 0.40 $ 0.42
Year ended December 28, 2002Net sales . . . . . . . . . . . . . . . . . . . . . . . . . . . . . . . . . . . . $133,820 $136,501 $141,364 $142,944Gross profit . . . . . . . . . . . . . . . . . . . . . . . . . . . . . . . . . . 49,959 52,400 53,475 53,149Operating income . . . . . . . . . . . . . . . . . . . . . . . . . . . . . . 28,410 30,382 32,519 30,955Net income (loss) . . . . . . . . . . . . . . . . . . . . . . . . . . . . . . (2,232) 16,328 18,531 17,505Earnings (loss) per common share
Basic . . . . . . . . . . . . . . . . . . . . . . . . . . . . . . . . . . . . . $ (0.05) $ 0.37 $ 0.41 $ 0.39Diluted . . . . . . . . . . . . . . . . . . . . . . . . . . . . . . . . . . . . $ (0.03) $ 0.34 $ 0.38 $ 0.36
84

CHARLES RIVER LABORATORIES INTERNATIONAL, INC.
SUPPLEMENTARY DATA
Quarterly Segment Information (Unaudited)
First Second Third FourthQuarter Quarter Quarter Quarter
(dollars in thousands)
Year ended December 25, 2004Research Models and Services
Sales . . . . . . . . . . . . . . . . . . . . . . . . . . . . . . . . . . . . . $119,447 $120,085 $118,089 $119,017Gross margin . . . . . . . . . . . . . . . . . . . . . . . . . . . . . . . 52,771 54,277 50,897 48,852Operating income . . . . . . . . . . . . . . . . . . . . . . . . . . . . 38,751 41,041 38,043 34,721Depreciation and amortization . . . . . . . . . . . . . . . . . . . 4,309 4,296 4,507 4,760Capital Expenditures . . . . . . . . . . . . . . . . . . . . . . . . . . 3,443 4,952 6,970 11,194
Preclinical ServicesSales . . . . . . . . . . . . . . . . . . . . . . . . . . . . . . . . . . . . . $ 53,160 $ 60,108 $ 57,937 $ 94,772Gross margin . . . . . . . . . . . . . . . . . . . . . . . . . . . . . . . 16,057 20,344 18,500 31,329Operating income . . . . . . . . . . . . . . . . . . . . . . . . . . . . 7,574 11,397 9,836 4,815Depreciation and amortization . . . . . . . . . . . . . . . . . . . 3,528 3,400 3,572 14,943Capital Expenditures . . . . . . . . . . . . . . . . . . . . . . . . . . 1,082 2.390 3,274 11,747
Clinical ServicesSales . . . . . . . . . . . . . . . . . . . . . . . . . . . . . . . . . . . . . $ — $ — $ — $ 24,272Gross margin . . . . . . . . . . . . . . . . . . . . . . . . . . . . . . . — — — 5,539Operating income . . . . . . . . . . . . . . . . . . . . . . . . . . . . — — — 731Depreciation and amortization . . . . . . . . . . . . . . . . . . . — — — 2,994Capital Expenditures . . . . . . . . . . . . . . . . . . . . . . . . . . — — — 284
Unallocated . . . . . . . . . . . . . . . . . . . . . . . . . . . . . . . . . . $ (6,808) $ (8,235) $ (4,505) $ (7,038)
TotalSales . . . . . . . . . . . . . . . . . . . . . . . . . . . . . . . . . . . . . $172,637 $180,193 $176,026 $238,061Gross margin . . . . . . . . . . . . . . . . . . . . . . . . . . . . . . . 68,828 74,621 69,397 85,720Operating income . . . . . . . . . . . . . . . . . . . . . . . . . . . . 39,517 44,203 43,374 33,229Depreciation and amortization . . . . . . . . . . . . . . . . . . . 7,837 7,696 8,079 22,697Capital Expenditures . . . . . . . . . . . . . . . . . . . . . . . . . . 4,525 7,342 10,244 23,225
85

CHARLES RIVER LABORATORIES INTERNATIONAL, INC.
SUPPLEMENTARY DATA
Quarterly Segment Information (Unaudited)
First Second Third FourthQuarter Quarter Quarter Quarter
(dollars in thousands)
Year ended December 27, 2003Research Models and Services
Sales . . . . . . . . . . . . . . . . . . . . . . . . . . . . . . . . . . . . . $108,351 $108,207 $104,609 $107,009Gross margin . . . . . . . . . . . . . . . . . . . . . . . . . . . . . . . 48,218 46,967 43,114 44,019Operating income . . . . . . . . . . . . . . . . . . . . . . . . . . . . 39,318 34,409 31,491 31,300Depreciation and amortization . . . . . . . . . . . . . . . . . . . 3,731 4,078 4,116 5,049Capital Expenditures . . . . . . . . . . . . . . . . . . . . . . . . . . 3,198 7,078 3,703 9,797
Preclinical ServicesSales . . . . . . . . . . . . . . . . . . . . . . . . . . . . . . . . . . . . . $ 43,774 $ 46,157 $ 46,585 $ 49,031Gross margin . . . . . . . . . . . . . . . . . . . . . . . . . . . . . . . 9,764 12,618 13,378 15,587Operating income . . . . . . . . . . . . . . . . . . . . . . . . . . . . (1,149) 4,709 6,042 7,919Depreciation and amortization . . . . . . . . . . . . . . . . . . . 3,194 3,053 3,110 3,233Capital Expenditures . . . . . . . . . . . . . . . . . . . . . . . . . . 2,038 2,140 1,612 3,138
Unallocated . . . . . . . . . . . . . . . . . . . . . . . . . . . . . . . . . . $ (4,321) $ (4,112) $ (3,277) $ (3,776)
TotalSales . . . . . . . . . . . . . . . . . . . . . . . . . . . . . . . . . . . . . $152,125 $154,364 $151,194 $156,040Gross margin . . . . . . . . . . . . . . . . . . . . . . . . . . . . . . . 57,982 59,585 56,492 59,606Operating income . . . . . . . . . . . . . . . . . . . . . . . . . . . . 33,848 35,006 34,256 35,443Depreciation and amortization . . . . . . . . . . . . . . . . . . . 6,925 7,131 7,226 8,282Capital Expenditures . . . . . . . . . . . . . . . . . . . . . . . . . . 5,236 9,218 5,315 12,935
86

Item 9. Changes in and Disagreement with Accountants on Accounting and Financial Disclosure
None.
Item 9A. Controls and Procedures
Based on their evaluation, required by the Securities Exchange Act of 1934 (the ‘‘Exchange Act’’)paragraph (b) of Rules 13a-15 or 15d-15, the Company’s principal executive officer and principalfinancial officer have concluded that the Company’s disclosure controls and procedures (as defined inRules 13a-15(e) or 15d-15(e) under the Exchange Act) are effective as of December 25, 2004 to ensurethat information required to be disclosed by the Company in reports that it files or submits under theExchange Act is recorded, processed, summarized and reported within the time periods specified inSecurities and Exchange Commission rules and forms.
There were no changes in the Company’s internal control over financial reporting identified inconnection with the evaluation required by paragraph (d) of the Exchange Act Rules 13a-15 or 15d-15that occurred during the quarter ended December 25, 2004 that materially affected, or were reasonablylikely to materially affect, the Company’s internal control over financial reporting.
Management’s report on our internal controls over financial reporting can be found in Item 8 ofthis report. The Independent Registered Public Accounting Firm’s attestation report on management’sassessment of the effectiveness of our internal control over financial reporting can also be found inItem 8 of this report.
Item 9B. Other Information
None.
PART III
Item 10. Directors and Executive Officers of the Registrant
A. Directors and Compliance with Section 16(a) of the Exchange Act
The information required by this Item regarding the directors of the Company and compliancewith Section 16(a) of the Exchange Act by the Company’s officers and directors will be included in the2005 Proxy Statement under the section captioned ‘‘Management’’ and is incorporated herein byreference thereto.
B. Executive Officers of the Company
The information required by this Item regarding the executive officers of the Company is reportedin Part I of this Form 10-K under the heading ‘‘Supplementary Item. Executive Officers of theRegistrant pursuant to Instruction 3 to Item 401(b) of Regulation S-K.’’
C. Audit Committee Financial Expert
The information required by this Item regarding the audit committee of the Board of Directorsand financial experts will be included in the 2005 Proxy Statement under the section captioned ‘‘AuditCommittee Financial Expert’’ and is incorporated herein by reference thereto.
D. Code of Ethics
The Company has adopted a Code of Business Conduct and Ethics that applies to all of itsemployees and directors, including the principal executive officer, principal financial officer, principalaccounting officer, controller or persons performing similar functions. The Company’s Code of BusinessConduct and Ethics is posted on its website. The Company will provide to any person, without charge,
87

a copy of its Code of Business Conduct and Ethics by requesting a copy from the Secretary, CharlesRiver Laboratories, Inc., 251 Ballardvale St., Wilmington, MA 01887.
Item 11. Executive Compensation
The information required by this Item will be included in the 2005 Proxy Statement under thesections captioned ‘‘Compensation of Directors,’’ ‘‘Executive Compensation’’ and ‘‘Report ofCompensation Committee’’ and is incorporated herein by reference thereto. See also Item 5. ‘‘Marketfor Registrants Common Equity, Related Stockholder Matters and Issuer Purchases of EquitySecurities—Securities Authorized for Issuance under Equity Compensation Plans’’ for the disclosurerequired by Item 201(d) of Regulation S-K promulgated under the Securities Exchange Act of 1934, asamended.
Item 12. Security Ownership of Certain Beneficial Owners and Management and Related StockholderMatters
The information required by this Item will be included in the 2005 Proxy Statement under thesections captioned ‘‘Security Ownership of Certain Beneficial Owners and Management’’ and ‘‘EquityCompensation Plan Information’’ and is incorporated herein by reference thereto.
Item 13. Certain Relationships and Related Transactions
The information required by this Item will be included in the 2005 Proxy Statement under thesection captioned ‘‘Certain Relationships and Related Transactions’’ and is incorporated herein byreference thereto.
Item 14. Principal Accountant Fees and Services
The information required by this Item will be included in the 2005 Proxy Statement under thesection captioned ‘‘Statement of Fees Paid to Independent Accountants’’ and is incorporated herein byreference thereto.
PART IV
Item 15. Exhibits and Financial Statement Schedules
Item 15(a)(1) and (2) and Item 15(d) Financial Statements and Schedules.
See ‘‘Index to Consolidated Financial Statements and Financial Statements Schedules’’ at Item 8 tothis Form 10-K. Other financial statement schedules have not been included because they are notapplicable or the information is included in the financial statements or notes thereto.
Item 15(a)(3) and Item 15(c) Exhibits.
The exhibits filed as part of this Annual Report on Form 10-K are listed in the Exhibit Indeximmediately preceding the exhibits. The Company has identified in the Exhibit Index each managementcontract and compensation plan filed as an exhibit to this Annual Report on Form 10-K in response toItem 14(c) of Form 10-K.
88

SIGNATURESPursuant to the requirements of Section 13 or 15(d) of the Securities Exchange Act of 1934, the
registrant has duly caused this report to be signed on its behalf by the undersigned, thereunto dulyauthorized.
CHARLES RIVER LABORATORIES INTERNATIONAL, INC.
By: /s/ THOMAS F. ACKERMAN Date: March 9, 2005Thomas F. AckermanSenior Vice President andChief Financial Officer
Pursuant to the requirements of the Securities Exchange Act of 1934, this report has been signedby the following persons on behalf of the registrant and in the capacities indicated below and on thedates indicated.Signatures Title Date
By: /s/ JAMES C. FOSTER President, Chief Executive March 9, 2005Officer and ChairmanJames C. Foster
By: /s/ THOMAS F. ACKERMAN Senior Vice President and Chief March 9, 2005Financial OfficerThomas F. Ackerman
By: /s/ STEPHEN D. CHUBB Director March 9, 2005Stephen D. Chubb
By: /s/ GEORGE E. MASSARO Director March 9, 2005George E. Massaro
By: /s/ LINDA MCGOLDRICK Director March 7, 2005Linda McGoldrick
By: /s/ GEORGE M. MILNE, JR. Director March 9, 2005George M. Milne, Jr.
By: /s/ DOUGLAS E. ROGERS Director March 9, 2005Douglas E. Rogers
By: /s/ SAMUEL O. THIER Director March 9, 2005Samuel O. Thier
By: /s/ WILLIAM H. WALTRIP Director March 9, 2005William H. Waltrip
By: /s/ WALTER S. NIMMO Director March 9, 2005Walter S. Nimmo
By: /s/ JOHN URQUHART Director March 9, 2005John Urquhart
89

EXHIBIT INDEX
ExhibitNo. Description
2.1 Agreement and Plan of Merger, dated as of June 30, 2004, among Charles River LaboratoriesInternational, Inc., Inveresk Research Group, Inc., Indigo Merger I Corp., and Indigo MergerII Corp. (1)
3.1 Amended and Restated Certificate of Incorporation of Charles River LaboratoriesInternational, Inc. (filed as Exhibit 3.1). (2)
3.2 By-laws of Charles River Laboratories International, Inc. (Filed as Exhibit 3.2). (2)4.1 Form of certificate representing shares of common stock, $0.01 per value per share (Filed as
Exhibit 4.1). (2)4.2 Indenture, dated as of January 24, 2002, between Charles River Laboratories International,
Inc. and State Street Bank and Trust Company, as Trustee (Filed as Exhibit 4.8). (9)4.3 Registration Rights Agreement, dated as of January 17, 2002, among Charles River
Laboratories International, Inc., Credit Suisse First Boston Corporation, Lehman Brothers Inc.,J.P. Morgan Securities Inc., SG Cowen Securities Corporation, U.S. Bancorp Piper Jaffray Inc.,Thomas Weisel Partners LLC, Investec PMG Capital Corp. and Jefferies & Company, Inc.(Filed as Exhibit 4.9). (9)
10.1 Joint Venture Agreement between Ajinomoto Co., Inc. and Charles River BreedingLaboratories, Inc., dated June 24, 1981, and ancillary agreements, amendments and addenda(Filed as Exhibit 10.6). (4)
10.2 Amended and Restated Distribution Agreement among Charles River BRF, Inc., Charles RiverLaboratories, Inc., Bioculture Mauritius Ltd. and Marry Ann and Owen Griffiths, datedDecember 23, 1997 (Filed as Exhibit 10.10). (3)
10.3 Supply Agreement between Sierra Biomedical, Inc. and Scientific Resources International,Ltd., dated March 18, 1997 (Filed as Exhibit 10.11). (3)
10.4 Severance Agreement between Charles River Laboratories, Inc. and Real H. Renaud, datedJanuary 20, 1992 (Filed as Exhibit 10.10). (2)+
10.5 1999 Charles River Laboratories Officer Separation Plan (Filed as Exhibit 10.11). (2)+10.6 Charles River Laboratories 1999 Management Stock Incentive Plan (Filed as
Exhibit 10.1). (5)+10.7 Charles River Laboratories 2000 Stock Incentive Plan, as amended May 2003. (11)+10.8 Charles River Laboratories 2000 Directors Stock Plan (Filed as Exhibit 10.15). (2)+10.9 Charles River Laboratories 2000 Incentive Plan Inland Revenue Approved Rules for UK
Employees (Filed as Exhibit 99.1). (8)+10.10 Form of Indemnification Agreement (Filed as Exhibit 10.16). (2)+10.11 Form of Change in Control Agreement. (11)+10.12 Form of Change in Control Agreement. (11)+10.13* Summary of Director Compensation. +10.14 Agreement and Plan of Merger, dated as of June 30, 2004, among Charles River Laboratories
International, Inc., Inveresk Research Group, Inc., Indigo Merger I Corp., and Indigo MergerII Corp. (1)
10.15* Executive Incentive Compensation Plan. +10.16 Form of Award Agreement under 2000 Incentive Plan.+ (12)10.17 Form of Restricted Stock Award Agreement under 2000 Incentive Plan. +(12)10.18 Mid-Term Incentive Plan. +(12)10.19 Mid-Term Incentive Plan Agreement. +(12)10.20 Inveresk Research Group, Inc. 2002 Stock Option and Incentive Compensation Plan, as
amended and restated as of May 4, 2004. +(13)10.21 Inveresk Research Group, Inc. 2002 Non-Employee Directors Stock Option Plan. +(13)
90

ExhibitNo. Description
10.22 Credit Agreement, dated August 18, 2004, entered into by Charles River LaboratoriesInternational, Inc., the lenders party thereto, JPMorgan Chase Bank, as administrative agent,Credit Suisse First Boston, Cayman Islands Branch, as syndicated agent, and Fleet NationalBank, Citizens Bank of Massachusetts, and Wachovia Bank, NA., as co-documentationagents. (14)
10.23* Charles River Laboratories Executive Life Insurance/Supplemental Retirement Income Plan. +10.24* Compensation of Director Emeritus.21.1* Subsidiaries of Charles River Laboratories International, Inc.23.1* Consent of PricewaterhouseCoopers LLP.31.1* Rule 13a-14(a)/15d-14(a) Certification of the Chief Executive Officer.31.2* Rule 13a-14(a)/15d-14(a) Certification of the Chief Financial Officer.32.1* Section 1350 Certification of the Chief Executive Officer and the Chief Financial Officer.
* Filed herewith.
+ Management contract or compensatory plan, contract or arrangement.
(1) Previously filed as an exhibit to the Company’s Current Report on Form 8-K, filed July 1, 2004.
(2) Previously filed as an exhibit to Amendment No. 2 to the Company’s Registration Statement onForm S-1 (File No. 333-35524), as amended, filed June 23, 2000.
(3) Previously filed as an exhibit to the Registration Statement of Charles River LaboratoriesHoldings, Inc., predecessor in interest to the Company, on Form S-1 (File No. 333-92383), asamended, filed December 8, 1999.
(4) Previously filed as an exhibit to the Registration Statement of Charles River LaboratoriesHoldings, Inc., predecessor in interest to the Company, on Form S-1 (File No. 333-35524) filedApril 25, 2000.
(5) Previously filed as an exhibit to the Quarterly Report on Form 10-Q of Charles RiverLaboratories Holdings, Inc., predecessor in interest to the Company, filed May 9, 2000.
(6) Previously filed as an exhibit to the Company’s Quarterly Report on Form 10-Q filed August 10,2001.
(7) Previously filed as an exhibit to the Company’s Quarterly Report on Form 10-Q filed May 15,2001.
(8) Previously filed as an exhibit to the Company’s Quarterly Report on Form 10-Q filed November 5,2001.
(9) Previously filed as an exhibit to the Company’s Annual Report on Form 10-K filed March 27,2001.
(10) Previously filed as an exhibit to the Company’s Quarterly Report on Form 10-Q filed May 9, 2002.
(11) Previously filed as an exhibit to the Company’s Annual Report on Form 10-K filed March 10,2004.
(12) Previously filed as an exhibit to the Company’s Quarterly Report on Form 10-Q filed onNovember 1, 2004.
(13) Previously filed as an exhibit to the Company’s Registration Statement on Form S-8, filed onOctober 20, 2004.
(14) Previously filed as an exhibit to the Company’s Current Report on Form 8-K, filed on October 20,2004.
91

CRL-10K-05
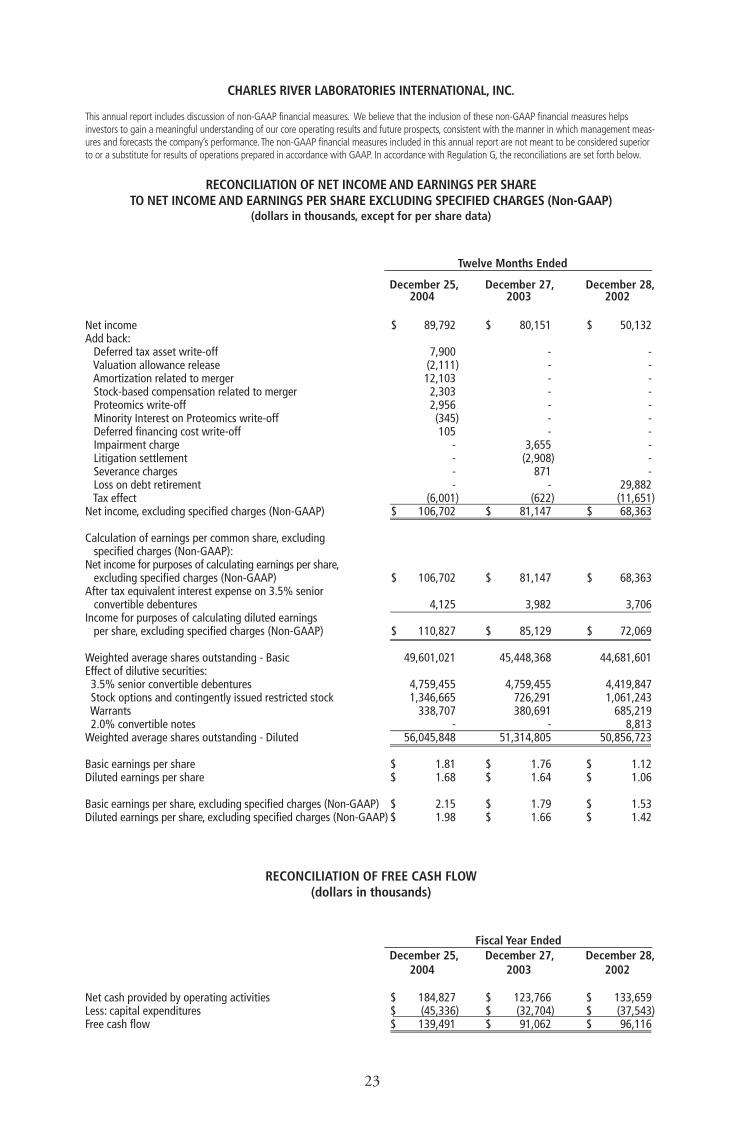
CHARLES RIVER LABORATORIES INTERNATIONAL, INC.
This annual report includes discussion of non-GAAP financial measures. We believe that the inclusion of these non-GAAP financial measures helpsinvestors to gain a meaningful understanding of our core operating results and future prospects, consistent with the manner in which management meas-ures and forecasts the companyÕs performance. The non-GAAP financial measures included in this annual report are not meant to be considered superiorto or a substitute for results of operations prepared in accordance with GAAP. In accordance with Regulation G, the reconciliations are set forth below.
RECONCILIATION OF NET INCOME AND EARNINGS PER SHARETO NET INCOME AND EARNINGS PER SHARE EXCLUDING SPECIFIED CHARGES (Non-GAAP)
(dollars in thousands, except for per share data)
Twelve Months Ended
December 25, December 27, December 28,2004 2003 2002
Net income $ 89,792 $ 80,151 $ 50,132Add back:
Deferred tax asset write-off 7,900 - - Valuation allowance release (2,111) - - Amortization related to merger 12,103 - - Stock-based compensation related to merger 2,303 - - Proteomics write-off 2,956 - - Minority Interest on Proteomics write-off (345) - - Deferred financing cost write-off 105 - - Impairment charge - 3,655 - Litigation settlement - (2,908) - Severance charges - 871 - Loss on debt retirement - - 29,882 Tax effect (6,001) (622) (11,651)
Net income, excluding specified charges (Non-GAAP) $ 106,702 $ 81,147 $ 68,363
Calculation of earnings per common share, excludingspecified charges (Non-GAAP):
Net income for purposes of calculating earnings per share,excluding specified charges (Non-GAAP) $ 106,702 $ 81,147 $ 68,363
After tax equivalent interest expense on 3.5% seniorconvertible debentures 4,125 3,982 3,706
Income for purposes of calculating diluted earningsper share, excluding specified charges (Non-GAAP) $ 110,827 $ 85,129 $ 72,069
Weighted average shares outstanding - Basic 49,601,021 45,448,368 44,681,601 Effect of dilutive securities:3.5% senior convertible debentures 4,759,455 4,759,455 4,419,847 Stock options and contingently issued restricted stock 1,346,665 726,291 1,061,243 Warrants 338,707 380,691 685,219 2.0% convertible notes - - 8,813
Weighted average shares outstanding - Diluted 56,045,848 51,314,805 50,856,723
Basic earnings per share $ 1.81 $ 1.76 $ 1.12 Diluted earnings per share $ 1.68 $ 1.64 $ 1.06
Basic earnings per share, excluding specified charges (Non-GAAP) $ 2.15 $ 1.79 $ 1.53 Diluted earnings per share, excluding specified charges (Non-GAAP) $ 1.98 $ 1.66 $ 1.42
RECONCILIATION OF FREE CASH FLOW(dollars in thousands)
Fiscal Year Ended
December 25, December 27, December 28,2004 2003 2002
$ 184,827 $ 123,766 $ 133,659 $ (45,336) $ (32,704) $ (37,543)$ 139,491 $ 91,062 $ 96,116
Net cash provided by operating activitiesLess: capital expendituresFree cash flow
23

CORPORATE INFORMATION
DIRECTORS
Henry L. Foster, D.V.M.
Director Emeritus
Charles River Laboratories
James C. Foster (1)
Chairman, President and
Chief Executive Officer
Charles River Laboratories
Robert Cawthorn * (1, 3, 4)
Chairman
Actelion Pharmaceuticals Ltd.
Stephen D. Chubb (2, 4)
Chairman, Chief Executive Officer
Matritech, Inc.
George E. Massaro (1, 2)
Director, Chief Operating Officer
Huron Consulting Group, Inc.
S. Louise McCrary * (2)
President, Specialty Products
WellPoint Inc.
Linda McGoldrick (4)
Chairman
Financial Health Associates
International
George M. Milne, Jr., Ph.D. (1, 3, 5)
Retired Executive Vice President of
Global Research and Development
and President of Central Research
Pfizer Inc.
Walter S. Nimmo (5)
Vice Chairman
Charles River Laboratories
Douglas E. Rogers (3)
Partner
Blackstone Healthcare LLC
Samuel O. Thier, M.D. (4, 5)
Professor of Medicine and Professor
of Health Care Policy
Harvard Medical School,
Massachusetts General Hospital
John Urquhart, M.D.
Chief Scientist, AARDEX Ltd.
William H. Waltrip (1, 2, 3, 4)
Lead Independent Director
Charles River Laboratories
Retired Chairman and
Chief Executive Officer
Bausch & Lomb, Inc.
* Resigned effective February 25, 2005
Director Emeritus, effective
February 25, 2005
COMMITTEE MEMBERSHIPS
1. Executive Committee
2. Audit Committee
3. Compensation Committee
4. Corporate Governance and
Nominating Committee
5. Science and Technology
Committee
Seated, from left to right: Mr. Foster, Dr. Foster, Mr. Waltrip, Dr. Urquhart, Ms. McGoldrick.Standing, from left to right: Mr. Massaro, Ms. McCrary, Mr. Chubb, Mr. Cawthorn,Mr. Rogers, Dr. Milne, Dr. Nimmo, Dr. Thier
Charles RiverÕs Board of Directors

CORPORATE OFFICERS
James C. Foster
Chairman, President and
Chief Executive Officer
Real H. Renaud
General Manager, Worldwide
Research Models and Services
Joanne P. Acford
Senior Vice President,
General Counsel and Secretary
Thomas F. Ackerman
Senior Vice President,
Chief Financial Officer
Nancy A. Gillett, D.V.M., Ph.D.
President, Global Preclinical Services
David P. Johst
Senior Vice President,
Human Resources and
Administration
Brian F. Bathgate, Ph.D.
President, European Preclinical
Services
J�rg M. Geller, D.V.M., Ph.D.
Vice President,
Consolidated German, UK & Ireland
Research Models and Services
& Worldwide Avian Operations
William J. White, V.M.D.
Vice President,
Veterinary and
Professional Services
CORPORATE
HEADQUARTERS
Charles River Laboratories, Inc.
251 Ballardvale Street
Wilmington, MA 01887
978.658.6000
STOCK LISTING
The common stock of the
Corporation is traded under
the symbol CRL on the
New York Stock Exchange
INDEPENDENT
ACCOUNTANTS
PricewaterhouseCoopers, LLP
One International Place
Boston, MA 02110
617.439.4390
SHAREHOLDER SERVICES
Equiserve Trust Company, NA
P.O. Box 43010
Providence, RI 02940-3010
781.575.3400
www.equiserve.com
INVESTOR RELATIONS
Charles River Laboratories, Inc.
251 Ballardvale Street
Wilmington, MA 01887
Tel: 978.658.6000
Fax: 978.658.7841
CORPORATE NEWS AND
INFORMATION
Stay abreast of the latest
company news by visiting our
website at www.criver.com
CERTIFICATIONS: The company
has filed the required certifica-
tions under Section 302 of the
Sarbanes-Oxley Act of 2002
regarding the quality of our
public disclosures as Exhibits
31.1 and 31.2 to our Annual
Report on Form 10-K for the
fiscal year ended December 25,
2004. After our 2005 annual
meeting of stockholders, the
company intends to file with
the New York Stock Exchange
the CEO certification regarding
its compliance with the NYSE
corporate governance listing
standards as required by NYSE
Rule 303A.12(a).
sku#
CRL-AR-05
Executive Vice President and
Senior Vice President and
Vice President and