Accelerating CIT's Strategic Plan
19
Accelerating CIT’s Strategic Plan Acquisition of Mutual of Omaha Bank August 13, 2019
-
Upload
khangminh22 -
Category
Documents
-
view
1 -
download
0
Transcript of Accelerating CIT's Strategic Plan

4, 81, 92
0, 168, 178
153, 228, 224
124, 212, 76
4, 81, 92
0, 168, 178
255, 195, 51
255, 125, 29
255, 56, 0
66, 66, 66
129, 168, 173
127, 211, 216
255, 225, 153
4, 81, 92
0, 168, 178
153, 228, 224
124, 212, 76
4, 81, 92
0, 168, 178
255, 195, 51
255, 125, 29
255, 56, 0
66, 66, 66
192, 211, 214
191, 233, 236
255, 240, 204
Accelerating CIT’s Strategic Plan
Acquisition of Mutual of Omaha Bank
August 13, 2019

4, 81, 92
0, 168, 178
153, 228, 224
124, 212, 76
4, 81, 92
0, 168, 178
255, 195, 51
255, 125, 29
255, 56, 0
66, 66, 66
129, 168, 173
127, 211, 216
255, 225, 153
Important Notice
This presentation contains forward-looking statements within the meaning of applicable federal securities laws that are based upon our current expectations and
assumptions concerning future events, which are subject to a number of risks and uncertainties that could cause actual results to differ materially from those
anticipated. The words “expect,” “anticipate,” “estimate,” “forecast,” “initiative,” “objective,” “plan,” “goal,” “project,” “outlook,” “priorities,” “target,” “intend,”
“evaluate,” “pursue,” “commence,” “seek,” “may,” “would,” “could,” “should,” “believe,” “potential,” “continue,” or the negative of any of those words or similar
expressions is intended to identify forward-looking statements. All statements contained in this presentation, other than statements of historical fact, including
without limitation, statements about our plans, strategies, prospects and expectations regarding future events and our financial performance, are forward-looking
statements that involve certain risks and uncertainties. In particular, any projections or expectations regarding the proposed acquisition by CIT of Mutual of
Omaha Bank described herein, our future revenues, expenses, earnings, capital expenditures, deposits or stock price, as well as the assumptions on which such
expectations are based, are such forward-looking statements reflecting only our current judgment and are not guarantees of future performance or results. While
these statements represent our current judgment on what the future may hold, and we believe these judgments are reasonable, these statements are not
guarantees of any events or financial results, and our actual results may differ materially. Important factors that could cause our actual results to be materially
different from our expectations include, among others, the risk that (i) CIT is unsuccessful in implementing its strategy and business plan, including, planned or
potential acquisitions or divestitures, (ii) CIT is unable to react to and address key business and regulatory issues, (iii) CIT is unable to achieve the projected
revenue growth from its new business initiatives or the projected expense reductions from efficiency improvements, (iv) CIT becomes subject to liquidity
constraints and higher funding costs; (v) the parties to the proposed transaction described in this presentation do not obtain regulatory or other approvals or
satisfy closing conditions to the transaction on a timely basis, or at all, or approvals are subject to conditions that are not anticipated; (vi) CIT experiences (A)
difficulties and delays in integrating CIT’s and Mutual of Omaha Bank’s respective businesses or fully realizing cost savings and other benefits, or (B) business
disruptions due to transaction-related uncertainty or other factors making it more difficult to maintain relationships with employees, customers, other business
partners or governmental entities; and (vii) changes in asset quality, credit risk, interest rates, capital markets or other economic conditions. We further describe
these and other risks that could affect our results in Item 1A, “Risk Factors,” of our latest Annual Report on Form 10-K for the year ended December 31, 2018,
which was filed with the Securities and Exchange Commission. Accordingly, you should not place undue reliance on the forward-looking statements contained in
this presentation. These forward-looking statements speak only as of the date on which the statements were made. CIT undertakes no obligation to update
publicly or otherwise revise any forward-looking statements, except where expressly required by law.
Non-GAAP Financial Measures
This presentation contains references to non-GAAP financial measures, which provide additional information and insight regarding operating results and financial
position of the business, including financial information that is presented to rating agencies and other users of financial information. These non-GAAP measures
are not in accordance with, or a substitute for, GAAP and may be different from or inconsistent with non-GAAP financial measures used by other
companies. The definitions of these measures and reconciliations of non-GAAP to GAAP financial information are available in this presentation.
This presentation is to be used solely as part of CIT management’s continuing investor communications program. This presentation shall not constitute an offer or
solicitation in connection with any securities.
Unaudited GAAP financial data of CIT and Mutual of Omaha Bank as well as projected financial data based on unaudited CIT and Mutual of Omaha Bank data
are as of June 30, 2019, unless otherwise stated.

4, 81, 92
0, 168, 178
153, 228, 224
124, 212, 76
4, 81, 92
0, 168, 178
255, 195, 51
255, 125, 29
255, 56, 0
66, 66, 66
129, 168, 173
127, 211, 216
255, 225, 153
Enhances
Deposit and
Commercial
Banking
Capabilities
Immediately enhances core deposit and commercial banking capabilities
$6.8 billion in low-cost deposits, 73 bps weighted average cost in 2Q19
$4.5 billion of Homeowners Association (“HOA”) deposits
$2.3 billion of commercial and retail deposits in 26 financial centers
$3.9 billion(2) in middle-market commercial loans in targeted metro markets
Accelerates
Strategic Plan
Accelerates CIT’s strategy by enhancing deposit franchise, extending commercial banking reach and
deploying capital
Establishes leadership in HOA banking, with leading market share and differentiated technology-enabled solutions
Stable, scalable base of low-cost HOA deposits diversifies funding
Expands commercial banking franchise and geographic reach in attractive metro markets
Adds middle-market commercial banking with experienced lenders and deep customer relationships
Strengthens
Profitability
Transaction strengthens profitability and drives shareholder value creation
Optimizes Funding – Decreases cost of deposits by 20 bps and lowers Loan & Lease to Deposit ratio
Enhances Profitability – Expands 2020E ROTCE(3) by 80 bps increasing to 100+ bps in 2 years
Accelerates Earnings – Double-digit EPS accretion by 2023
Fully phased-in 2020E EPS(4) accretion of 2%
20+% IRR
Attractive
Purchase
Price
Purchase price compares favorably to recent bank transactions
4.0% core deposit premium(5)
11.6x 2020E earnings
1.38x tangible book value(6)
Acquisition Creates Significant Financial and Strategic Value
1
(1) Excludes Synergy One mortgage banking business
(2) Excludes $234 million mortgage warehouse line
(3) Full year impact assuming fully phased-in cost savings, excludes impact of CECL and merger and integration costs
(4) Based on CIT’s consensus estimates using full year impact and fully phased-in cost savings. Excludes impact of CECL and merger and integration costs
(5) Excludes jumbo CDs
(6) $725 million TBV at closing
CIT is acquiring Mutual of Omaha Bank(1) for $1 billion

4, 81, 92
0, 168, 178
153, 228, 224
124, 212, 76
4, 81, 92
0, 168, 178
255, 195, 51
255, 125, 29
255, 56, 0
66, 66, 66
129, 168, 173
127, 211, 216
255, 225, 153 Top 10 National Direct Bank
64 Branches in the Top MSAs in Southern California
More than $30 billion of Consumer Deposits
Top 10 arranger of middle-market sponsored deals(3)
Top 3 arranger of Power & Renewable projects(4)
Top 4 Bank Provider of Equipment Financing
Top 4 Provider of Railcar Leasing
Top Provider of Factoring Services
Focused Commercial Real Estate Lender
CIT Today: A Leading National Commercial Bank
CIT has accomplished a significant transformation over the past three years
Commercial Banking
Financial Highlights ($ billions)
$50.6
Assets
$38.6
Total Loans &
Leases
$35.3
Deposits
Consumer Savings
Transformation Highlights
Source: Company filings
(1) Cumulative share repurchases and common dividends since 2015
(2) $150 million reduction over the last three years
(3) Based on Thomson Reuters League Table rankings as of 1H 2019 for deals of $300 million or less in size
(4) Based on Acuris League Table rankings as of 1H 2019 for deals of $300 million or less in size
Positioned CIT as a leading commercial bank
Divested over $14 billion in non-core assets
Commercial Air, Financial Freedom, NACCO
Optimized funding and capital composition
Deposits comprise 85% of total funding (from 68%)
Returned $6.4 billion of capital to shareholders(1)
Reduced operating expenses by $150 million(2)
Strengthened risk management practices and
reduced risk profile
Improved portfolio mix supported by stronger
collateral
Built an experienced and diverse leadership
team
2
4, 81, 92
0, 168, 178
153, 228, 224
124, 212, 76
4, 81, 92
0, 168, 178
255, 195, 51
255, 125, 29
255, 56, 0
66, 66, 66
129, 168, 173
127, 211, 216
255, 225, 153
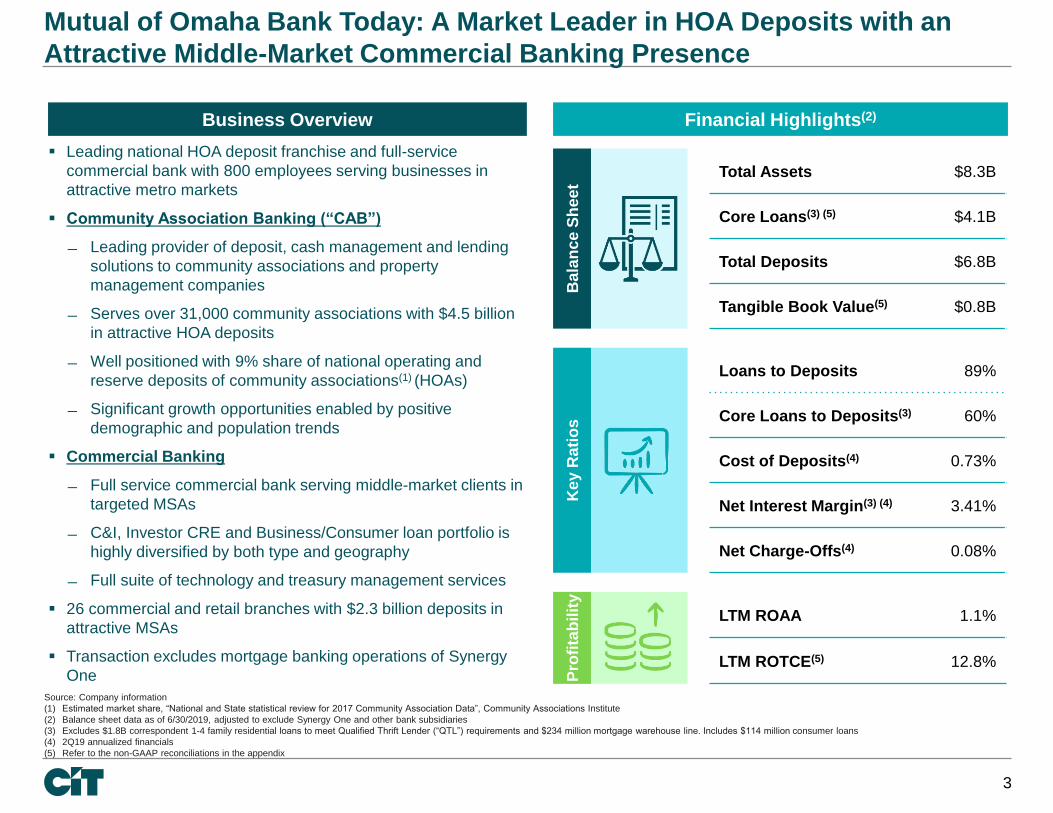
Mutual of Omaha Bank Today: A Market Leader in HOA Deposits with an
Attractive Middle-Market Commercial Banking Presence
Financial Highlights(2)
Source: Company information
(1) Estimated market share, “National and State statistical review for 2017 Community Association Data”, Community Associations Institute
(2) Balance sheet data as of 6/30/2019, adjusted to exclude Synergy One and other bank subsidiaries
(3) Excludes $1.8B correspondent 1-4 family residential loans to meet Qualified Thrift Lender (“QTL”) requirements and $234 million mortgage warehouse line. Includes $114 million consumer loans
(4) 2Q19 annualized financials
(5) Refer to the non-GAAP reconciliations in the appendix
Business Overview
Leading national HOA deposit franchise and full-service
commercial bank with 800 employees serving businesses in
attractive metro markets
Community Association Banking (“CAB”)
Leading provider of deposit, cash management and lending
solutions to community associations and property
management companies
Serves over 31,000 community associations with $4.5 billion
in attractive HOA deposits
Well positioned with 9% share of national operating and
reserve deposits of community associations(1) (HOAs)
Significant growth opportunities enabled by positive
demographic and population trends
Commercial Banking
Full service commercial bank serving middle-market clients in
targeted MSAs
C&I, Investor CRE and Business/Consumer loan portfolio is
highly diversified by both type and geography
Full suite of technology and treasury management services
26 commercial and retail branches with $2.3 billion deposits in
attractive MSAs
Transaction excludes mortgage banking operations of Synergy
One
Ba
lan
ce
Sh
ee
t
Total Assets $8.3B
Core Loans(3) (5) $4.1B
Total Deposits $6.8B
Tangible Book Value(5) $0.8B
Ke
y R
ati
os
Loans to Deposits 89%
Core Loans to Deposits(3) 60%
Cost of Deposits(4) 0.73%
Net Interest Margin(3) (4) 3.41%
Net Charge-Offs(4) 0.08%
P
rofi
tab
ilit
y
LTM ROAA 1.1%
LTM ROTCE(5) 12.8%
3

4, 81, 92
0, 168, 178
153, 228, 224
124, 212, 76
4, 81, 92
0, 168, 178
255, 195, 51
255, 125, 29
255, 56, 0
66, 66, 66
129, 168, 173
127, 211, 216
255, 225, 153
Adds New Core HOA Channel
Increases CIT’s Commercial and Consumer Deposits
Attractive HOA Deposits
Brings Strong CAB Franchise and Established HOA Deposit Leader to CIT
Highly attractive national HOA market, characterized by strong, scalable growth of stable low-
cost deposits
$4.5B Long Duration Stable Deposits
Source: Company information
(1) 2017 data. Estimated market share, “National and State statistical review for 2017 Community Association Data”, Community Associations Institute, Deluxe Payment Advisory Services
4
0.63% Cost
Mutual of Omaha Bank’s Leadership
9%
17%
17%
Community
Association Market(1)
Market
Share(1)
$1.8
$4.5
2010 2019 Q2
Demonstrated Track Record of Growth
Mutual of Omaha Bank’s HOA Deposits ($B)
347,000
HOAs Nationwide
26 million
Households
~7,500 Property
Mgmt Companies
31,000+
~4.5mm
1,281
Online Branch HOA Commercial
9% ~$50B Operating &
Reserve Deposits $4.5B
Mutual of Omaha
Bank CAB
$ $ $ $

4, 81, 92
0, 168, 178
153, 228, 224
124, 212, 76
4, 81, 92
0, 168, 178
255, 195, 51
255, 125, 29
255, 56, 0
66, 66, 66
129, 168, 173
127, 211, 216
255, 225, 153
Favorable
Industry
Dynamics
The industry has approximately 347,000 HOAs nationwide and over $50 billion in deposits
61% of new housing built-for-sale are in a community association
Property management companies (“PMCs”) oversee 80% of deposits; administrative pain points are numerous
Value added services to HOAs and PMCs such as tenant portals, digital services and e-procurement solutions address
pain points, add incremental revenue streams and promote relationship stickiness
Proprietary
Technology
and Superior
Client Service
Proprietary, tech-enabled solutions platform differentiates Mutual of Omaha Bank from competitors
OneSource – Software to integrate HOA and PMC accounting systems, providing a full suite of payment and
reporting capabilities
MutualPay Property Pay – Provides homeowners with robust tools to pay assessments electronically
Mutual VIP – Enables property management firms to pay vendors efficiently and electronically
Mutual View Point – Robust digital portal to seamlessly interact with the bank electronically
High-touch client service and implementation model
Target Rich
Geographies
and Adjacent
Channels
Mutual of Omaha Bank has previously underpenetrated significant HOA markets due to growth constraints placed by
Parent
Opportunities exist to expand in 5 out of the top 9 markets and 8 of the next 12
Current model is scalable with plans to add talent to support growth
Growth opportunity in adjacent deposit channels
Harnessing the CAB Growth Opportunity
5
A multi-prong approach to winning market share by solving HOA and PMC pain points
Detailed business plan to double HOA and adjacent market deposits in 5 – 7 years

4, 81, 92
0, 168, 178
153, 228, 224
124, 212, 76
4, 81, 92
0, 168, 178
255, 195, 51
255, 125, 29
255, 56, 0
66, 66, 66
129, 168, 173
127, 211, 216
255, 225, 153
8.0% 7.7% 7.5% 7.3% 7.2% 7.0% 6.8% 6.5% 6.4%
4.6% 4.5% 3.5% 3.2%
2.1%
0.4%
Houston Dallas /Fort
Worth
LasVegas
Charlotte Denver Phoenix Tampa Atlanta Reno Omaha SanDiego
KansasCity
LosAngeles
New York Chicago
Accelerates CIT’s Traditional Relationship Banking Build-out
6
Mutual of Omaha Bank’s
Commercial Banking Business Coast-to-Coast Commercial Franchise
National
Median:
1.8%
Combined Business Operates in Attractive Markets
2019-2024 Projected Population Growth
(2)
(1)
Dallas, TX
Naples, FL
Marco Island, FL
Tampa, FL
San Diego, CA
Reno, NV
Tucson, AZ
Phoenix, AZ
Las Vegas, NV
Denver, CO Lincoln, NE
Des Moines, IA
Omaha, NE
Kansas City, KS
Honolulu, HI
Houston, TX
Ft Worth, TX
Atlanta, GA
Charlotte, NC
Chicago, IL
Danville, VA
Jacksonville, FL
Portsmouth, NH
NYC / Livingston, NJ
Santa Monica, CA
Los Angeles, CA
Combined Business to Operate in 44% of Top 25 Commercial MSAs
Source: SNL Financial, Company information
(1) Two separate commercial offices; (1) Dallas, (1) Fort Worth
(2) Includes Mutual of Omaha Bank headquarters and a West Omaha commercial office
Loan Production Offices
Financial Services Centers
Commercial Locations
Consumer Locations (64)
CIT Mutual of Omaha Bank
CIT
Mutual of Omaha Bank
Overlapping Markets
33 commercial banking
relationship managers
26 commercial centers and
retail branches
~3,200 commercial banking
clients
Commercial loans: $3.9 billion
Commercial deposits: $1.3 billion
Strong cultural fit

4, 81, 92
0, 168, 178
153, 228, 224
124, 212, 76
4, 81, 92
0, 168, 178
255, 195, 51
255, 125, 29
255, 56, 0
66, 66, 66
129, 168, 173
127, 211, 216
255, 225, 153
Complementary Commercial Offerings to Win and Deepen Client
Relationships
Leverage CIT’s expertise across industry, asset classes, and capital markets to deliver deeper
solutions to Mutual of Omaha Bank’s client base
Leverage Mutual of Omaha Bank’s differentiated treasury management and payment product
solutions to extend CIT’s reach to deposit-rich sectors
CIT Commercial Finance(1) Mutual of Omaha Bank
Client Profile Event-driven or asset-based
Limited deposit opportunities
Privately held mid-sized companies
Full-service banking model
Deposit-rich sectors
Origination
Strategy
Industry or asset-backed
Largely sourced through:
Intermediaries
Sponsors
Direct calling in key industry and
specialized verticals
National focus
Direct calling via local relationship teams
Geographically targeted
Complementary
Products,
Services and
Expertise
Syndications and capital markets
Equipment finance
Vendor programs
ABL & Factor services
Foreign exchange
Deep sector knowledge including Healthcare,
Aerospace & Defense, Government Contracting,
Power & Energy, Transportation, and TMT
Proprietary and tech-enabled solutions for small &
medium enterprises and depository rich channels
including:
PayFAC
Online revolving lines of credit
Partner loans
Alternative investment options
Specialized treasury management services
(1) Commercial Finance is a division of Commercial Banking. Does not include Rail, Business Capital, or Real Estate Finance
7

4, 81, 92
0, 168, 178
153, 228, 224
124, 212, 76
4, 81, 92
0, 168, 178
255, 195, 51
255, 125, 29
255, 56, 0
66, 66, 66
129, 168, 173
127, 211, 216
255, 225, 153
Correspondent 1-4 Family
3%
Business Capital
19%
Rail15%
Commercial Finance
29%
Real Estate Finance
17%
Legacy Consumer
Mortgages6%
Other Consumer
11%
Online54%
Brokered8%
Branch32%
Commercial6%
MMDA & Savings
56%
DDA8%
CDs36%
Meaningfully Enhances CIT’s Pro Forma Business Mix
CIT Mutual of Omaha Bank Pro Forma
By T
yp
e
Cost: 1.97%
L&LDR: 109%
Cost: 0.73%
L&LDR: 89% / 60% (2)
Cost: 1.77%
L&LDR: 101% (2)
Source: SNL Financial as of 2Q19, Company information, Mutual of Omaha Bank
(1) Includes commercial branch from Mutual of Omaha Bank
(2) Excludes $1.8B correspondent 1-4 family residential loans to meet QTL requirements and $234 million mortgage warehouse line
(3) Includes mortgage warehouse line
(4) Includes owner-occupied CRE
(5) Includes CRE from Mutual of Omaha Bank
(6) Includes HOA and C&I from Mutual of Omaha Bank
$35.3B $6.8B $42.1B
Lo
an
s a
nd
Le
as
es
Yield: 5.95% Yield: 4.71% Yield: 5.78%
$38.6B $6.1B $44.6B
8
By C
han
ne
l
MMDA & Savings
47%
DDA38%
CDs15%
MMDA & Savings
54%
DDA13%
CDs33%
$35.3B $6.8B $42.1B
De
po
sit
s
HOA66%
Branch: Retail15%
Branch: Commercial
19%
Online45%
Brokered7%
Branch29%
Commercial8%
HOA11%
Business Capital23%
Rail17%
Commercial Finance
28%
Real Estate Finance
14%
Legacy Consumer Mortgages
7%
Other Consumer
11%
Correspondent 1-4 Family
26%
C&I20%
HOA10%
CRE35%
Other Consumer
9%
(5)
(6)
(1)
(4)
(3)

4, 81, 92
0, 168, 178
153, 228, 224
124, 212, 76
4, 81, 92
0, 168, 178
255, 195, 51
255, 125, 29
255, 56, 0
66, 66, 66
129, 168, 173
127, 211, 216
255, 225, 153
Substantial
Upside
Potential
Financially
Attractive
Strategically
Compelling
Accelerates CIT’s Commercial Banking Strategy
Quality franchise with strong risk culture
National and scalable HOA channel diversifies funding
Improves risk profile of CIT’s consolidated loan and deposit portfolios
Stable, low-cost deposits will immediately enhance deposit and liquidity profile
Entry into attractive major metro markets with appealing demographics and
sizeable commercial banking opportunities
Adds 33 talented commercial bankers skilled in relationship banking and deposit
taking plus differentiated new products and technology
Attractive purchase price
Deposit funding and cost synergies drive meaningful long-term EPS accretion
63 bps of low cost HOA deposits with scalable growth
Cost savings materially enhance profitability
Expands fully phased-in ROTCE(1)
Strong opportunities in HOA business and adjacent deposit channels with path
from $4.5 to $9 billion of deposits over 5 – 7 years
Lower cost deposits and new market / customer reach enables traditional middle-
market relationship banking expansion
Diversifies funding sources and reduces reliance on marginal higher cost
deposits for growth, improving enterprise risk profile
$4.5B HOA Deposits
CoD Reduced by
20 bps
+80 bps 2020E ROTCE
100+ bps (in 2 years)
4% Core Deposit
Premium
Expands Commercial
Banking Target Market
11% HOA Historical
Deposit CAGR
HOA: stable,
low beta deposits
Double-Digit Long-
Term EPS Accretion
Commercial Bank
Valuation Upside
9
(1) Full year impact assuming fully phased-in cost savings, excludes impact of CECL and merger and integration costs

4, 81, 92
0, 168, 178
153, 228, 224
124, 212, 76
4, 81, 92
0, 168, 178
255, 195, 51
255, 125, 29
255, 56, 0
66, 66, 66
129, 168, 173
127, 211, 216
255, 225, 153
Structure CIT Bank, N.A. to acquire Mutual of Omaha Bank
Excludes Mutual of Omaha Bank’s mortgage banking operations (Synergy One)
Transaction Value $1.0 billion
Consideration Up to $150 million in CIT shares to Parent (at the option of CIT)
Transaction Multiples
4.0% core deposit premium
1.38x TBV
11.6x 2020E Earnings
Anticipated Closing Q1 2020, subject to regulatory approval
Earnings and Synergies
Mutual of Omaha Bank full year, standalone earnings: $86 million 2020E
Cost savings: 28% or $54 million(2) pre-tax (phased in 30% in Year 1, 85% in Year 2 and 100% thereafter)
HOA and adjacent deposit verticals planned to double over 5-7 years and be deployed into middle-market
lending
Funding benefits: growing HOA deposits and diversifying into lower risk middle-market commercial banking will
drive lower marginal deposit and funding costs across CIT’s entire franchise
Financial Impact
EPS accretion(3): 2020E: 2%; 2021E: 3%; 2022E: 8%; double-digits thereafter, relative to CIT’s consensus
estimates which include share repurchases
5.5%(4) dilutive to tangible book value per share with 4.9 year crossover earnback
20%+ IRR
Capital
Accelerates deployment of capital to reach 10.5% CET1 target
CET1 at closing of 10%, growing to 10.5% within 12 months
Share repurchases suspended until 10.5% CET1 target reached
Transaction Summary
10
Precedent Transactions(1)
Core Deposit Premium: 19%
P / TBV: 2.2x
P / NTM EPS: 17.2x
Source: SNL Financial, Company information
(1) Recent transactions based on median of $750mm – $2bn bank mergers and acquisitions announced since January 1, 2017
(2) $57 million net of $3 million FDIC dis-synergy
(3) Based on CIT’s consensus estimates using full year impact and fully phased-in cost savings. Excludes impact of CECL and merger and integration costs
(4) Upfront dilution includes all one-time costs

4, 81, 92
0, 168, 178
153, 228, 224
124, 212, 76
4, 81, 92
0, 168, 178
255, 195, 51
255, 125, 29
255, 56, 0
66, 66, 66
129, 168, 173
127, 211, 216
255, 225, 153
Standalone Earnings Per
Share CIT’s 2020 consensus estimate of $5.32 per share
Financing
Common: up to $150 million at CIT’s option
Preferred: $200 million
Subordinated debt: $100 million
Senior unsecured debt: ~$550 million
Estimated Marks on
Mutual of Omaha Bank’s
Balance Sheet
Loan mark: net $30 million negative mark; negative $74 million (1.15% of loans) for credit and a positive $44
million (0.7% of loans) for rate
Securities mark: $23 million positive mark (1.25% of securities); equivalent to 6/30/19 AOCI
Estimated Goodwill
and Intangibles
Goodwill: $56 million
Core deposit intangible: $85 million (1.25% of core deposits), amortized over 7 years using straight line method
Transaction is structured as an asset sale for tax purposes, and therefore all intangibles created are deductible
for tax purposes
Estimated Merger &
Integration Costs
$110 million merger and integration costs (2.0x cost saves)
Under GAAP, merger and integration costs will be incurred over time
Due Diligence
Comprehensive due diligence review with 3rd party advisors on key focus areas: deposits, credit quality,
accounting, compliance, risk, technology, operations, legal and regulatory
Key conclusions: well-managed, conservative franchise
3rd party deposit specialist hired to evaluate HOA deposit franchise
Key conclusions: low beta, long duration, cost efficient, differentiated product and service offering
300 CIT personnel participated in due diligence
Transaction Detail
11

4, 81, 92
0, 168, 178
153, 228, 224
124, 212, 76
4, 81, 92
0, 168, 178
255, 195, 51
255, 125, 29
255, 56, 0
66, 66, 66
129, 168, 173
127, 211, 216
255, 225, 153
Accelerates CIT’s Strategic Plan
Pillars Our Strategy
Mutual of
Omaha
Bank
Transaction Benefits
Grow Core
Businesses
Deepen client relationships
Innovate with value
Acquiring small and middle-market
customers
Leading HOA franchise
Acquiring proprietary payment
technologies and tech-enabled solutions
to serve HOA and other adjacent
channels
Optimize
Balance Sheet
Enhance funding and deposits
Optimize capital structure
Accelerates strategic deployment of
capital
Adds new stable HOA deposit channel
Immediately reduces deposit costs
Enhance Operating
Efficiency
Maintain vigilance on expenses
Improve operating leverage
28% cost savings enhances pro forma
profitability
Improves 2020E ROTCE by 80 bps(1)
increasing to 100+ bps in 2 years
Maintain Strong Risk
Management
Maintain credit discipline on structures
while focusing on strong collateral
Maintain strong liquidity and capital
risk management practices
Traditional middle-market bank profile
Average NCOs of 12 bps p.a. over last
5 years
Enhances liquidity profile and funding
with low cost, stable deposits
12
(1) Full year impact assuming fully phased-in cost savings, excludes impact of CECL and merger and integration costs
4, 81, 92
0, 168, 178
153, 228, 224
124, 212, 76
4, 81, 92
0, 168, 178
255, 195, 51
255, 125, 29
255, 56, 0
66, 66, 66
129, 168, 173
127, 211, 216
255, 225, 153
Appendix

4, 81, 92
0, 168, 178
153, 228, 224
124, 212, 76
4, 81, 92
0, 168, 178
255, 195, 51
255, 125, 29
255, 56, 0
66, 66, 66
129, 168, 173
127, 211, 216
255, 225, 153
Earnings Per Share Accretion Calculation
13
All figures annualized for 2020 full-year impact $mm
Millions of
diluted shares
CIT 2020 earnings consensus median estimate $456 86
Projected Mutual of Omaha Bank’s Q2–Q4 2020 earnings annualized 89
$545
After-tax adjustments
Fully phased-in cost savings(1) $42
Cost of financing (29)
Income attributable to suspension of CIT share repurchases 5
Other merger-related adjustments(2) (4)
Accretion of fair value mark (16)
Accretion of securities mark (5)
Estimated core deposit intangible amortization(3) (9)
Projected 2020 CIT net income $531 98 (4)
CIT 2020 standalone EPS $5.32
Projected combined EPS(5) $5.42
$ EPS accretion to CIT $0.10
% EPS accretion to CIT 1.9%
Note: Certain balances may not sum due to rounding. Projected adjustments assume 26% marginal tax rate. Share repurchases suspended until 10.5% CET1 target reached
(1) $57 million pre-tax fully phased-in reduction in combined company’s total noninterest expense base
(2) Includes FDIC dis-synergy
(3) Assumes $85 million of core deposit intangibles (1.25% of Mutual of Omaha Bank's total deposits, excluding jumbo CDs and brokered deposits) are amortized over seven years utilizing the straight-line method
(4) Projected diluted shares outstanding include CIT shares issued to Mutual of Omaha and reflect the suspension of repurchases
(5) Excludes impact of CECL and merger and integration costs

4, 81, 92
0, 168, 178
153, 228, 224
124, 212, 76
4, 81, 92
0, 168, 178
255, 195, 51
255, 125, 29
255, 56, 0
66, 66, 66
129, 168, 173
127, 211, 216
255, 225, 153
Tangible Book Value Per Share Dilution Calculation
14
Note: Certain balances may not sum due to rounding. Projected adjustments assume 26% marginal tax rate. Share repurchases suspended until 10.5% CET1 target reached
(1) CIT tangible book value equal to common shareholders equity less goodwill and other intangible assets. Refer to the non-GAAP reconciliations in the appendix
(2) Based on when pro forma tangible book value per share crosses over and begins to exceed projected stand alone CIT tangible book value per share
$ millions
Millions of
basic shares
$ per
share
CIT standalone
CIT tangible book value as of December 31, 2018(1) $5,163 101 $51.15
(+) Consensus earnings prior to close 584
(–) Consensus per share common dividends (155)
(–) Share repurchases completed YTD (341)
(–) Additional projected consensus share repurchases through close (395)
(+) Amortization of intangibles 29
(+) Change in AOCI through June 30, 2019 113
Projected standalone CIT tangible book value at close $4,998 88 $56.77
Projected
Projected standalone CIT tangible book value at close $4,998 88
(+) Suspension of projected consensus share repurchases through close 395
(+) Standalone Mutual of Omaha tangible book value at close 725
(–) Elimination of Mutual of Omaha Bank’s marked equity capital and intangibles (859)
(+) Equity consideration issued to Mutual of Omaha 111
(+) Other purchase accounting adjustments 91
(–) Goodwill and other intangibles created (141)
(–) After-tax merger and integration costs expensed at or prior to close (14)
Projected CIT tangible book value at close $5,305 98 $54.31
(–) After-tax merger and integration costs expensed after close (67)
Projected CIT tangible book value, including merger and integration costs expensed after close $5,238 98 $53.63
$ dilution to CIT, including post-close merger and integration costs ($3.14)
% dilution to CIT, including post-close merger and integration costs (5.5%)
Tangible book value per share earnback (2) 4.9 years

4, 81, 92
0, 168, 178
153, 228, 224
124, 212, 76
4, 81, 92
0, 168, 178
255, 195, 51
255, 125, 29
255, 56, 0
66, 66, 66
129, 168, 173
127, 211, 216
255, 225, 153
Non-GAAP Reconciliation
15
CIT Mutual of Omaha Bank
As of the last twelve months ended:
$mm December 31, 2018 June 30, 2019
Total capital $5,622 $952
(–) Goodwill and intangible assets (459) (177)
Tangible common equity (non-GAAP) $5,163 $775
Average tangible common equity (non-GAAP) 5,740 716
Net income 92
ROTCE (non-GAAP) 12.8%
Tangible Book Value
Core Loans
Mutual of Omaha Bank
$bn As of June 30, 2019
Loans $6.1
(–) Correspondent 1–4 family residential loans (1.8)
(–) Mortgage warehouse line (0.2)
Core loans (non-GAAP) $4.1
Note: Certain balances may not sum due to rounding

4, 81, 92
0, 168, 178
153, 228, 224
124, 212, 76
4, 81, 92
0, 168, 178
255, 195, 51
255, 125, 29
255, 56, 0
66, 66, 66
129, 168, 173
127, 211, 216
255, 225, 153
Standalone Balance Sheet
Mutual of Omaha Bank, excluding Synergy One and OMAFIN subsidiaries
($ in millions)
Cash & Equivalents $179
Investments 1,788
Total Loans(1)
6,083
Allowance for Loan Losses (58)
Net Loans 6,025
Goodwill 177
Other Assets 152
Total Assets $8,321
Deposits $6,793
Borrowings 478
Other Liabilities 99
Total Liabilities 7,369
Total Stockholder's Equity 952
Total Stockholder's Equity & Liabilities $8,321
Source: Unaudited company data as of June 30, 2019
Note: Certain balances may not sum due to rounding
(1) Includes $234 million warehouse line to Synergy One, to be excluded from the transaction
16