Characterizing Structure Through Shape Matching and Applications to Self Assembly
19
Characterizing Structure Through Shape Matching and Applications to Self Assembly Aaron S. Keys 1 , Christopher R. Iacovella 1 , and Sharon C. Glotzer 1,2 1 Department of Chemical Engineering and 2 Department of Materials Science and Engineering University of Michigan, Ann Arbor, Michigan 48109-2136 (Dated: December 22, 2010) Structural quantities such as order parameters and correlation functions are often employed to gain insight into the physical behavior and properties of condensed matter systems. While standard quantities for characterizing structure exist, often they are insufficient for treating problems in the emerging field of nano and microscale self-assembly, where the structures encountered may be complex and unusual. The computer science field of “shape matching” offers a robust solution to this problem by defining diverse methods for quantifying the similarity between arbitrarily complex shapes. Most order parameters and correlation functions used in condensed matter apply a specific measure of structural similarity within the context of a broader scheme. By substituting shape matching quantities for traditional quantities, we retain the essence of the broader scheme, but extend its applicability to more complex structures. Here we review some standard shape matching techniques and discuss how they might be used to create highly flexible structural metrics for diverse systems such as self-assembled matter. We provide three proof-of-concept example problems applying shape matching methods to identifying local and global structures, and tracking structural transitions in complex assembled systems. The shape matching methods reviewed here are applicable to a wide range of condensed matter systems, both simulated and experimental, provided particle positions are known or can be accurately imaged. I. INTRODUCTION The preponderance of new nanometer- and micron-sized colloidal particles of nearly arbitrary shape, composition and interaction has made possible the self-assembly of exquisitely complex structures with potential uses in a variety of technologies [1–4]. Because material properties and behavior are determined by both the global and local shapes, or patterns, within the self-assembled structure[1, 5–9], methods and tools are needed to characterize the salient structural features of the assemblies. The field of condensed matter physics has traditionally led the way in developing algorithms for characterizing crystal structures and constructing theories to connect these structures to thermodynamics and to overall system properties[10–12]. These approaches typically involve constructing structural order parameters and/or correlation functions that can discriminate between different building block arrangements and are well developed for systems of point-like, rod-like and spherical particles[13–17]. Examples include nematic and smectic order parameters for systems of rods citenematic, smectic, liquidcrystals and bond order parameters[14, 15, 18, 19] for 2d and 3d systems of spheres. However, these functions fail, in many cases, to fully describe the structural complexity of assemblies of more unusual nanocolloids, including those formed from spherical particles[7, 20], rod-like particles[8, 21], polyhedral particles[22– 29], colloidal molecules[3, 30–34], patchy spheres[35–40], arbitrarily-shaped objects[1, 3], polymer-tethered nanoparti- cles [4, 25, 41–45], and terminal assemblies resembling biological structures[46, 47]. For example, it is easy to envision that order parameters defined for spherical or rod shaped particles may fail when applied to more complex shaped particles, such as “Y” particles or triangular plates[3]. As a result of the increased complexity of nano building blocks, there are few “model problems” in nano and microscale self-assembly for which generally applicable order parameters can be defined. The dearth of structural metrics has lead many recent experimental and computational studies of assembled systems to rely heavily on visual inspection or ad hoc analysis for characterizing structures, rather than well established schemes. This approach is not optimal, since visual inspection can be time consuming and typically less accurate than mathematical analysis, and ad hoc analysis can be idiosyncratic, making it difficult to compare structures across independent studies. The impetus for new structural metrics is also driven by advances in microscopy techniques that allow for the direct imaging of nano and microscale systems, which have greatly extended the range of systems for which detailed structural analysis can potentially be performed. For example, the tracking of micron-sized colloidal particles in 2d and 3d is now routine[48–52], and high-fidelity imaging of nanoparticles[53] and their assemblies[23, 54, 55] is steadily improving. Combined with proper image processing techniques, one can extract much information about structure, such as the particle positions[48, 52] and other key features, providing detailed structural information on par with simulations. Assuming one can construct order parameters sensitive to these unique building blocks and their assemblies, similar routines can be applied to both experimental and simulated systems, allowing for direct comparison[23, 33]. Analysis techniques from the computer science field of “shape matching” offer a potentially powerful solution to the problem of creating general structural metrics for these systems. Shape matching involves defining general structural arXiv:1012.4521v1 [cond-mat.soft] 21 Dec 2010
Transcript of Characterizing Structure Through Shape Matching and Applications to Self Assembly

Characterizing Structure Through Shape Matching and Applications to Self Assembly
Aaron S. Keys1, Christopher R. Iacovella1, and Sharon C. Glotzer1,21Department of Chemical Engineering and 2Department of Materials Science and Engineering
University of Michigan, Ann Arbor, Michigan 48109-2136(Dated: December 22, 2010)
Structural quantities such as order parameters and correlation functions are often employed togain insight into the physical behavior and properties of condensed matter systems. While standardquantities for characterizing structure exist, often they are insufficient for treating problems inthe emerging field of nano and microscale self-assembly, where the structures encountered may becomplex and unusual. The computer science field of “shape matching” offers a robust solution tothis problem by defining diverse methods for quantifying the similarity between arbitrarily complexshapes. Most order parameters and correlation functions used in condensed matter apply a specificmeasure of structural similarity within the context of a broader scheme. By substituting shapematching quantities for traditional quantities, we retain the essence of the broader scheme, butextend its applicability to more complex structures. Here we review some standard shape matchingtechniques and discuss how they might be used to create highly flexible structural metrics fordiverse systems such as self-assembled matter. We provide three proof-of-concept example problemsapplying shape matching methods to identifying local and global structures, and tracking structuraltransitions in complex assembled systems. The shape matching methods reviewed here are applicableto a wide range of condensed matter systems, both simulated and experimental, provided particlepositions are known or can be accurately imaged.
I. INTRODUCTION
The preponderance of new nanometer- and micron-sized colloidal particles of nearly arbitrary shape, compositionand interaction has made possible the self-assembly of exquisitely complex structures with potential uses in a varietyof technologies [1–4]. Because material properties and behavior are determined by both the global and local shapes, orpatterns, within the self-assembled structure[1, 5–9], methods and tools are needed to characterize the salient structuralfeatures of the assemblies. The field of condensed matter physics has traditionally led the way in developing algorithmsfor characterizing crystal structures and constructing theories to connect these structures to thermodynamics and tooverall system properties[10–12]. These approaches typically involve constructing structural order parameters and/orcorrelation functions that can discriminate between different building block arrangements and are well developed forsystems of point-like, rod-like and spherical particles[13–17]. Examples include nematic and smectic order parametersfor systems of rods citenematic, smectic, liquidcrystals and bond order parameters[14, 15, 18, 19] for 2d and 3d systemsof spheres.
However, these functions fail, in many cases, to fully describe the structural complexity of assemblies of more unusualnanocolloids, including those formed from spherical particles[7, 20], rod-like particles[8, 21], polyhedral particles[22–29], colloidal molecules[3, 30–34], patchy spheres[35–40], arbitrarily-shaped objects[1, 3], polymer-tethered nanoparti-cles [4, 25, 41–45], and terminal assemblies resembling biological structures[46, 47]. For example, it is easy to envisionthat order parameters defined for spherical or rod shaped particles may fail when applied to more complex shapedparticles, such as “Y” particles or triangular plates[3]. As a result of the increased complexity of nano buildingblocks, there are few “model problems” in nano and microscale self-assembly for which generally applicable orderparameters can be defined. The dearth of structural metrics has lead many recent experimental and computationalstudies of assembled systems to rely heavily on visual inspection or ad hoc analysis for characterizing structures,rather than well established schemes. This approach is not optimal, since visual inspection can be time consumingand typically less accurate than mathematical analysis, and ad hoc analysis can be idiosyncratic, making it difficult tocompare structures across independent studies. The impetus for new structural metrics is also driven by advances inmicroscopy techniques that allow for the direct imaging of nano and microscale systems, which have greatly extendedthe range of systems for which detailed structural analysis can potentially be performed. For example, the trackingof micron-sized colloidal particles in 2d and 3d is now routine[48–52], and high-fidelity imaging of nanoparticles[53]and their assemblies[23, 54, 55] is steadily improving. Combined with proper image processing techniques, one canextract much information about structure, such as the particle positions[48, 52] and other key features, providingdetailed structural information on par with simulations. Assuming one can construct order parameters sensitive tothese unique building blocks and their assemblies, similar routines can be applied to both experimental and simulatedsystems, allowing for direct comparison[23, 33].
Analysis techniques from the computer science field of “shape matching” offer a potentially powerful solution to theproblem of creating general structural metrics for these systems. Shape matching involves defining general structural
arX
iv:1
012.
4521
v1 [
cond
-mat
.sof
t] 2
1 D
ec 2
010

2
metrics that can be used to measure the degree of similarity between diverse shapes. Such similarity measures canbe applied within the context of traditional condensed matter order parameter and correlation function schemesto obtain analogous quantities for more complex structures. This is possible because, in practice, most standardstructural characterization schemes include an implicit concept of matching or shape similarity; that is, the schemestypically measure the degree to which a structure of interest matches another (often ideal) structure. As a familiarexample, consider the standard nematic order parameter which gives an optimal value of 1 when the rod-like particleswithin the system are perfectly aligned, and 0 if the rods have random orientations. In this case, the order parametermeasures the degree to which the local arrangement of rods in the system, described mathematically by the anglesbetween neighboring rods, matches with an ideal reference system with perfect alignment (see Fig. 1). Other structuralcharacterization schemes and spatial or temporal correlation functions involve similar underlying concepts of matching.As we will discuss, by modifying these schemes to use shape matching methods, we retain their overall physical insight,but gain the ability to apply them to complex structures. Although we focus exclusively on simulated assembledsystems here, these types of methods are general enough that they can be applied to particle systems in general,provided that the particle positions and or orientations can be determined or imaged. Examples of systems, bothexperimental and simulated, to which shape matching methods can potentially be applied include but are not limited tonanoparticle superlattices created from mixtures of spherical and/or non-spherical nanoparticles[54, 55], microphaseseparated systems, such as tethered nanoparticles and block copolymers that form crystalline and quasicrystallinedomains[56, 57], colloidal ionic crystals[58], dense colloids[49] and granular matter[59, 60].
FIG. 1: Example of an implicit shape matching scheme within the context of a standard order parameter. The panel depictsthe process of computing the nematic order parameter P2 for a system of rod-like colloidal ellipsoids that assemble into analigned ordered phase[61]. In the language of a shape matching scheme (see section II), the colloidal system acts as a “querystructure” that we wish to characterize. An ideal system for which the rods are all oriented along the average global directoracts as an implicit “reference structure.” The local values of the angles θ between rods in the query structure and referencestructure act as “shape descriptors.” The Legendre polynomial P2 acts as a “similarity metric.” The global nematic orderparameter P2 is computed by averaging over local values of P2[cos(θ)].
This review is organized as follows. In section II, we review shape matching methods from the literature, restrictingour scope to methods that we believe are most immediately applicable to assembled systems. We describe howrepresentative shapes can be extracted from particle systems, review the shape descriptors that are best suited todescribe these shapes numerically, and show how they can be compared quantitatively. In section III, we apply aprototype shape matching scheme to three representative example problems from simulations of self-assembly. Ourexamples include identifying global structures in a microphase-separating system of polymer-tethered nanospheres[56],detecting local icosahedral clusters in a fluid of hard tetrahedral particles[22], and tracking the twisting of a helicalsheet formed from polymer-tethered nanorods[62]. In section IV, we suggest new applications for shape matchingmethods, including constructing correlation functions, measuring local crystal grains and crystal defects, devisingguided computer algorithms to map parameter spaces and search for target structures, and grouping and classifyingstructures based on particular structural features. To aid in the development and dissemination of new structuralanalysis methods based on shape matching techniques, we provide accompanying software and examples via theweb[63].
II. SHAPE MATCHING
Quantifying how well structures match has been generalized in the context of shape matching[64] (see Fig. 2).Familiar applications include matching fingerprints and signatures[64], facial recognition[65] and medical imaging[66].
3
Shape matching defines the concept of the shape descriptor, a numerical “fingerprint” that describes a pattern orshape. Shape descriptors are associated with query structures and compared with reference structures. The degree ofmatching between query and reference structures is quantified by a similarity metric.
FIG. 2: Data flow diagram for shape matching. (a) A structural pattern is extracted for a given query structure and thenindexed into a shape descriptor, which represents a numerical fingerprint for the structure. (b) The shape descriptor is thencompared with shape descriptors for reference structures to give a measure of similarity between shapes. Depending on howwe choose the query and reference structures, the similarity value obtained may be applied to constructing order parameters,correlation functions, or other applications.
Matching information can be used to create order parameters and correlation functions, identify structures, andperform many other types of structural analysis. Since we can choose virtually any structure as a reference forcomparison, shape matching facilitates the creation of highly specific structural metrics. In the following sections, wereview the process of constructing a customized structural metric which involves choosing interesting structures tocharacterize, computing shape descriptors, and using similarity metrics to compare them.
A. Representative Structural Patterns
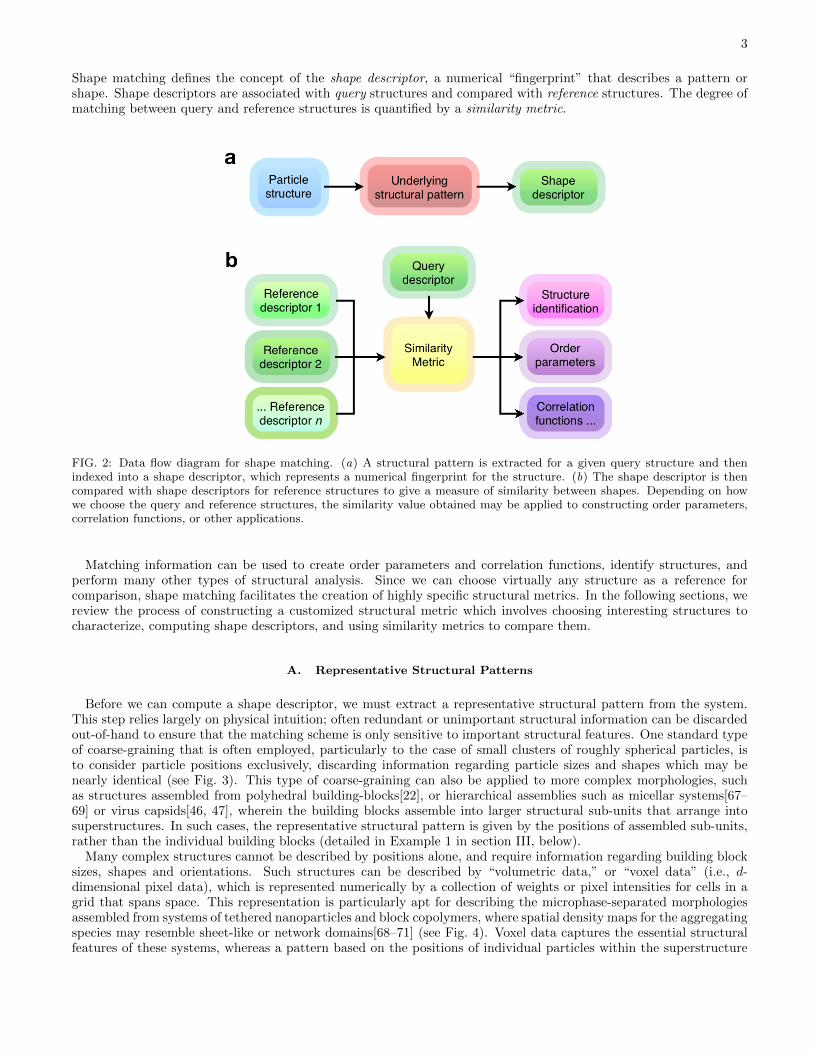
Before we can compute a shape descriptor, we must extract a representative structural pattern from the system.This step relies largely on physical intuition; often redundant or unimportant structural information can be discardedout-of-hand to ensure that the matching scheme is only sensitive to important structural features. One standard typeof coarse-graining that is often employed, particularly to the case of small clusters of roughly spherical particles, isto consider particle positions exclusively, discarding information regarding particle sizes and shapes which may benearly identical (see Fig. 3). This type of coarse-graining can also be applied to more complex morphologies, suchas structures assembled from polyhedral building-blocks[22], or hierarchical assemblies such as micellar systems[67–69] or virus capsids[46, 47], wherein the building blocks assemble into larger structural sub-units that arrange intosuperstructures. In such cases, the representative structural pattern is given by the positions of assembled sub-units,rather than the individual building blocks (detailed in Example 1 in section III, below).
Many complex structures cannot be described by positions alone, and require information regarding building blocksizes, shapes and orientations. Such structures can be described by “volumetric data,” or “voxel data” (i.e., d-dimensional pixel data), which is represented numerically by a collection of weights or pixel intensities for cells in agrid that spans space. This representation is particularly apt for describing the microphase-separated morphologiesassembled from systems of tethered nanoparticles and block copolymers, where spatial density maps for the aggregatingspecies may resemble sheet-like or network domains[68–71] (see Fig. 4). Voxel data captures the essential structuralfeatures of these systems, whereas a pattern based on the positions of individual particles within the superstructure
4
does not. The same rule applies to many other types of structures for which the bulk shape is more important than theunderlying particle positions, including all types of phase-separated structures, many complex biological structuressuch as proteins and macromolecules[72, 73], and large but finite (aka ”terminal”) nanoparticle assemblies. Shapedescriptors are typically sufficiently flexible to use either voxel data or point cloud data as an input.
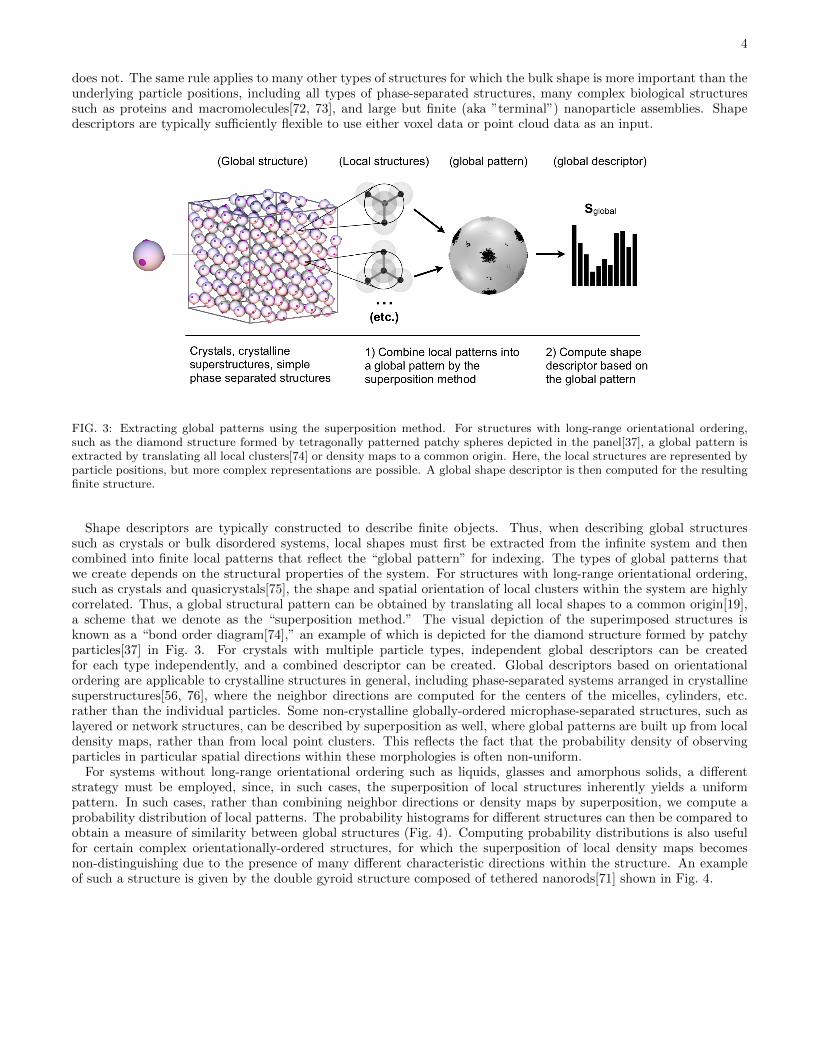
FIG. 3: Extracting global patterns using the superposition method. For structures with long-range orientational ordering,such as the diamond structure formed by tetragonally patterned patchy spheres depicted in the panel[37], a global pattern isextracted by translating all local clusters[74] or density maps to a common origin. Here, the local structures are represented byparticle positions, but more complex representations are possible. A global shape descriptor is then computed for the resultingfinite structure.
Shape descriptors are typically constructed to describe finite objects. Thus, when describing global structuressuch as crystals or bulk disordered systems, local shapes must first be extracted from the infinite system and thencombined into finite local patterns that reflect the “global pattern” for indexing. The types of global patterns thatwe create depends on the structural properties of the system. For structures with long-range orientational ordering,such as crystals and quasicrystals[75], the shape and spatial orientation of local clusters within the system are highlycorrelated. Thus, a global structural pattern can be obtained by translating all local shapes to a common origin[19],a scheme that we denote as the “superposition method.” The visual depiction of the superimposed structures isknown as a “bond order diagram[74],” an example of which is depicted for the diamond structure formed by patchyparticles[37] in Fig. 3. For crystals with multiple particle types, independent global descriptors can be createdfor each type independently, and a combined descriptor can be created. Global descriptors based on orientationalordering are applicable to crystalline structures in general, including phase-separated systems arranged in crystallinesuperstructures[56, 76], where the neighbor directions are computed for the centers of the micelles, cylinders, etc.rather than the individual particles. Some non-crystalline globally-ordered microphase-separated structures, such aslayered or network structures, can be described by superposition as well, where global patterns are built up from localdensity maps, rather than from local point clusters. This reflects the fact that the probability density of observingparticles in particular spatial directions within these morphologies is often non-uniform.
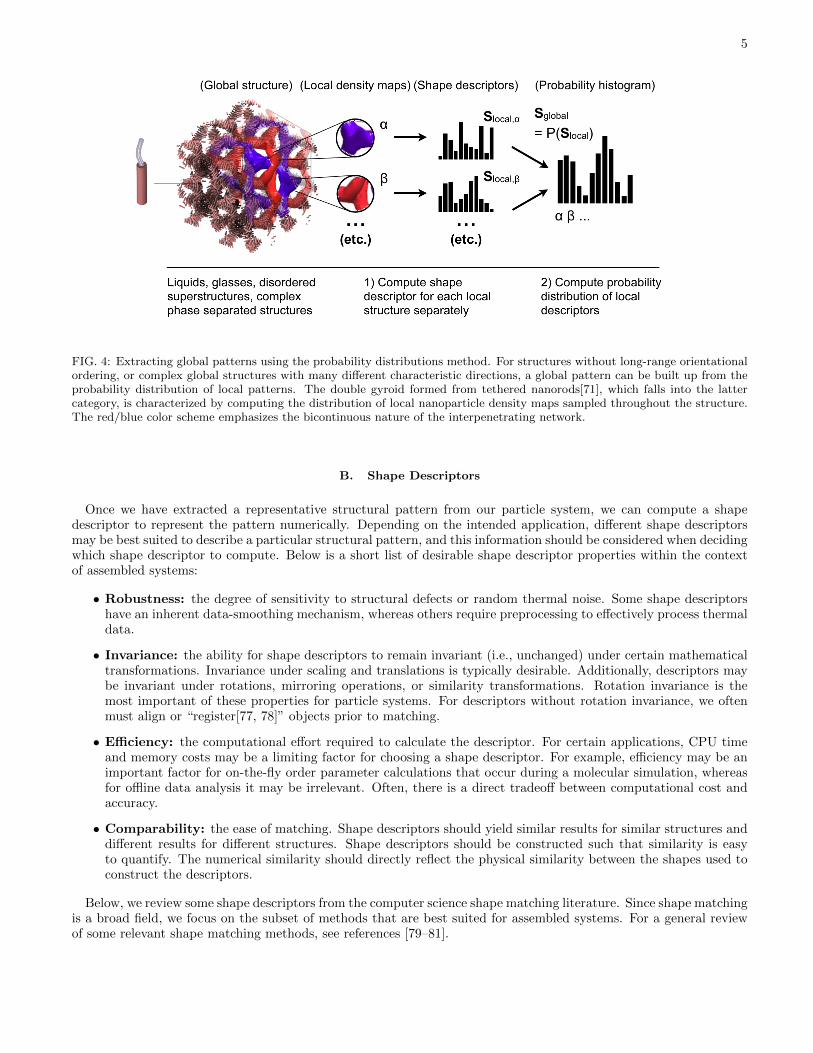
For systems without long-range orientational ordering such as liquids, glasses and amorphous solids, a differentstrategy must be employed, since, in such cases, the superposition of local structures inherently yields a uniformpattern. In such cases, rather than combining neighbor directions or density maps by superposition, we compute aprobability distribution of local patterns. The probability histograms for different structures can then be compared toobtain a measure of similarity between global structures (Fig. 4). Computing probability distributions is also usefulfor certain complex orientationally-ordered structures, for which the superposition of local density maps becomesnon-distinguishing due to the presence of many different characteristic directions within the structure. An exampleof such a structure is given by the double gyroid structure composed of tethered nanorods[71] shown in Fig. 4.
5
FIG. 4: Extracting global patterns using the probability distributions method. For structures without long-range orientationalordering, or complex global structures with many different characteristic directions, a global pattern can be built up from theprobability distribution of local patterns. The double gyroid formed from tethered nanorods[71], which falls into the lattercategory, is characterized by computing the distribution of local nanoparticle density maps sampled throughout the structure.The red/blue color scheme emphasizes the bicontinuous nature of the interpenetrating network.
B. Shape Descriptors
Once we have extracted a representative structural pattern from our particle system, we can compute a shapedescriptor to represent the pattern numerically. Depending on the intended application, different shape descriptorsmay be best suited to describe a particular structural pattern, and this information should be considered when decidingwhich shape descriptor to compute. Below is a short list of desirable shape descriptor properties within the contextof assembled systems:
• Robustness: the degree of sensitivity to structural defects or random thermal noise. Some shape descriptorshave an inherent data-smoothing mechanism, whereas others require preprocessing to effectively process thermaldata.
• Invariance: the ability for shape descriptors to remain invariant (i.e., unchanged) under certain mathematicaltransformations. Invariance under scaling and translations is typically desirable. Additionally, descriptors maybe invariant under rotations, mirroring operations, or similarity transformations. Rotation invariance is themost important of these properties for particle systems. For descriptors without rotation invariance, we oftenmust align or “register[77, 78]” objects prior to matching.
• Efficiency: the computational effort required to calculate the descriptor. For certain applications, CPU timeand memory costs may be a limiting factor for choosing a shape descriptor. For example, efficiency may be animportant factor for on-the-fly order parameter calculations that occur during a molecular simulation, whereasfor offline data analysis it may be irrelevant. Often, there is a direct tradeoff between computational cost andaccuracy.
• Comparability: the ease of matching. Shape descriptors should yield similar results for similar structures anddifferent results for different structures. Shape descriptors should be constructed such that similarity is easyto quantify. The numerical similarity should directly reflect the physical similarity between the shapes used toconstruct the descriptors.
Below, we review some shape descriptors from the computer science shape matching literature. Since shape matchingis a broad field, we focus on the subset of methods that are best suited for assembled systems. For a general reviewof some relevant shape matching methods, see references [79–81].

6
FIG. 5: Depiction of six different shape descriptors applied to self-assembled systems. (a) The point matching descriptor[77, 82].Descriptor components are given trivially by particle positions or density maps. (b) The shape histogram descriptor[83]. Thestructure is indexed into a spatial histogram consisting of shells and sectors. (c) Shape distribution descriptors[84]. Theprobability distribution is computed for various local measurements, such as the distance or angle between surface points. (d)Harmonic descriptors[85–88]. The shape histogram is decomposed into a convenient harmonic representation, which can beused for rotation-invariant matching. (e) The shape contexts descriptor[89]. A coarse histogram is created for each point on thestructure. The descriptor is given by the collection of sub-descriptors for each point. (f ) The lightfield descriptor[90]. Imagesor projections are constructed from several different vantage points and indexed into individual shape descriptors. The overalldescriptor is given by the collection of sub-descriptors for each image.
Point-Matching Descriptor: For relatively simple structures such as small clusters of atoms, molecules, or nanopar-ticle/colloidal building-blocks, we can use the particle positions themselves (or a corresponding density map) as ashape descriptor (Fig. 5a). Matching for this scheme is often based on the root-mean-square (RMS) difference be-tween points, and thus the scheme itself is sometimes referred to as “RMS matching.” Point matching schemes wereapplied to early attempts at shape matching for macromolecules[91], and more complex variations have since beenimplemented for proteins[92]. Point matching schemes have the advantage of being conceptually trivial; however,there are many subtleties associated with these schemes that should be considered. First, the descriptor requires anassignment step to determine the optimal correspondence between points in compared structures, which is used to re-order the coordinates in the shape descriptors accordingly. Also, since the descriptors are sensitive to scale, position,and orientation, structures must first be normalized and registered unless the orientations are known beforehand,or rotation-dependent matching is desired. Depending on the application, shapes may be registered based on rigid
7
alignment, or other constraints. Since both assignment and registration are computationally expensive (i.e. they scalepoorly with the number of points, n) point matching descriptors should be avoided unless (1) the number of atoms,molecules, or building blocks that make up the structure is small, (2) matching is required for only a few structures,or (3) registration is not required.
Shape Histogram: Another conceptually simple shape descriptor that has been applied to molecular databasesearches is known as the “shape histogram”[83] (Fig. 5b). This descriptor is based on a density map of the structureon a polar or spherical grid. Shape histograms are best suited for describing structural patterns that can be brokendown into concentric shells, such as nanoparticle clusters, proteins and macromolecules. Shape histograms are also wellsuited for indexing global patterns created by the superposition method, as outline above, and can index structureswith orientational ordering such as crystals or quasicrystals, and simple microphase separated structures such aslayered phases or network structures. The shape histogram has the advantage over the point matching method thatno assignment step is required, since the ordering of points is lost during binning. Additionally, the grid resolutioncan be adjusted to provide a variable degree of coarse-graining. Like the point matching method, the shape histogramrequires registration to match non-aligned objects, unless only radial bins are used (i.e., the angular grid resolutionis set to zero). However, shape histograms may lose their discerning capabilities without an angular component. Ifn is large, the cost of registration can be significantly reduced by aligning the histograms themselves rather than theunderlying structures.
Shape Distributions: For many applications, registration is too costly and we require rotation-invariant descriptors.A simple, yet powerful method for creating invariants, known as the “shape distributions” scheme[84](Fig. 5c), involvescomputing distribution functions for simple rotationally-invariant local metrics. Such local metrics are defined basedon object surfaces; thus this method is best applied to structures with clearly defined, yet distinguishable, surfaces,such as microphase-separated structures formed by block copolymers[42, 57] or tethered nanoparticles[4, 25, 68, 93](see, for example, Fig. 4). The shape distribution “D2” is defined as the probability distribution of the distancebetween pairs of surface points. Another similar distribution “A3” is defined by the probability distribution of anglesformed by triples of surface points. Similar distributions are defined for higher numbers of points. The distributionsD2 and A3 are similar to the radial distribution function g(r) and angular distribution function a(θ), respectively,although usually only surface particles are considered. Like g(r) and a(θ), shape distributions are too coarse todistinguish between similar shapes, such as small polyhedral clusters.
Harmonic / Invariant Moment Descriptors: A more complex, but more powerful method for computing invariantdescriptors is to compute the harmonic transform of the shape histogram. By disregarding the phase information,we obtain descriptors that are invariant under rotations (Fig. 5d). Like the shape histogram, harmonic descriptorsare versatile and can be applied to a wide range of structures including complex nanoparticle clusters, proteins andmacromolecules, and crystalline or microphase-separated structures. The method by which we compute the harmonictransform of the shape histogram depends on the underlying basis. Invariants can be obtained for shapes on thecircle[85](θ-dependence), sphere[86](θ, φ-dependence), disk[87] (r, θ-dependence) and ball[88](r, θ, φ-dependence). Onthe unit circle or sphere, the harmonic descriptors are called “Fourier descriptors,” whereas on the disk or ball, thedescriptors are known as “Zernike descriptors.” The implementation of these methods for complex assembled systemsis described in detail elsewhere[94]. Harmonic descriptors exhibit an inherent data smoothing mechanism that leavesthem better-suited for describing small polygonal or polyhedral clusters than the shape histogram, which is proneto error without sufficient averaging. This property, combined with the property of rotational-invariance, makesharmonic descriptors ideal for describing orientationally-disordered global structures, such as liquids, glasses andcertain microphase-separated structures, via the probability distributions method. Harmonic descriptors also containadditional frequency-dependent information regarding the symmetries of the structure. These unique properties ofharmonic descriptors have already been successfully applied to constructing orientational order parameters for smallclusters and simple crystals[18, 19].
Shape Contexts: It is fairly common in the context of self-assembly experiments and simulations to encounternearly-ideal assembled structures with localized defects. Thus, it is often desirable to distinguish between localstructural dissimilarities that arise due to defects, and “overall” differences in the structure. A brute-force solution tothis problem is to explicitly include defective structures in the library of reference structures such that they may beidentified directly[67]; however, his requires a priori knowledge of the entire space of potential defective structures.Obtaining such knowledge may be intractable for complex assemblies with many degrees of structural freedom, orunmapped systems whose local motifs have not yet been thoroughly studied. A more general solution is to applya “partial matching” scheme, such as the “shape contexts” method[89, 95], which is capable of matching structuresindependently of local defects, as well as identifying such defects (Fig. 5e). The shape contexts method combines

8
elements of the point matching scheme with the shape histogram descriptor. Here, a separate shape histogram iscomputed for each sample point in the structure, where the coordinate system is centered at that point. The points inthe query structure are then assigned to their corresponding points in the reference structure by optimizing the matchbetween shape histograms. Outlier points that don’t correspond well (i.e., local defects) can be excluded to obtaina partial match, or used to identify the defects. Shape contexts can be applied to any system where local defectsmight arise, such as atomic or molecular clusters, micro or nanoscale assemblies, or biological structures. Since shapecontexts are based on the shape histogram, they have the same limitations when indexing structures with a smallnumber of sample points locally.
Lightfield Descriptor: The shape contexts descriptor is just one example of the more general method for creatingnew powerful descriptors by combining simpler sub-descriptors . A similar method based on combining sub-descriptorsis given by the light-field descriptor[90], which involves projecting 3D structures onto 2D images from 20 vantage pointsat the vertices of a dodecahedron. This process effectively simulates the act of viewing a structure from differentangles by eye, giving the lightfield descriptor its name (Fig. 5f). The lightfield descriptor can thus be applied tomicrophase-separated structures, nano/colloidal scale assemblies, or other structures that can be effectively identifiedby the trained eye. Each of the 20 2d images is indexed by a 2d descriptor, and assignment is performed for pairsof these descriptors for compared structures to optimize correspondence. In practice, many initial rotations of thedodecahedron are attempted to minimize error due to small offsets in the spatial orientation.
Other Possible Descriptors: In addition to the shape descriptors outlined above, the shape matching literaturedefines numerous potentially useful descriptors that we have not mentioned here. Some intriguing possibilities includegraph based descriptors[96–98], descriptors based on reflective symmetries[99], and methods based on the similarityof slices of objects[100]. Several structural metrics from the condensed matter literature might also serve as usefulshape descriptors for some applications. For example, in the realm of global structures, diffraction patterns, radialdistribution functions, or orientation tensors (e.g. the radius of gyration tensor or the nematic order tensor[101])could be indexed into shape descriptors. For local structures, analysis schemes such as the common neighbor analysisscheme of reference[16] could be easily incorporated. Although many of the structural metrics from the literature maynot be independently distinguishing for a wide range of problems, they may still yield useful information as part of amore general scheme through a combination of descriptors.
C. Similarity Metrics
The degree to which two shape descriptors match[102] is quantified by a similarity metric. Computing a similaritymetric involves reducing the complex information contained in shape descriptors into a single scalar value that indicatesthe degree of matching. The similarity metric that best suits a particular application depends on both the shapedescriptor and the intended physical application. Some desirable properties of similarity metrics are listed below:
• Metric Behavior: the ability for a similarity metric to give a value that is proportional to the physicalmatch between the structures. Some similarity metrics satisfy the triangle inequality[102] (i.e., M(SA,SB) +M(SA,SC) ≥M(SB ,SC), where M is a similarity metric, and SA, SB , SC are shape descriptors) and are thustruly metrics, whereas others do not and can be considered pseudo-metrics. It is typically desirable for similaritymetrics to range smoothly with the difference between structures.
• Normalization: the range of possible matching values for a given matching scheme. For many condensed matterphysics applications, we desire similarity metrics that range from 0 to 1 for use as pseudo-order parameters.While many similarity metrics do not vary naturally from 0 to 1, they can often be changed by simply shiftingand scaling the interval that defines an ideal and worst-case match. In practice, there is little difference betweenthis type of pseudo order parameter and a standard order parameter in terms of the underlying physics.
• Specificity: the degree to which a similarity metric highlights specific differences between shape descriptors.For some applications it is desirable to give more weight to specific important differences between the descriptors.
Often, similarity metrics are based on simple geometric functions, such as the Euclidean distance or vector projectionbetween shape descriptors, which are typically represented as long vectors. Whereas similarity metrics based onthe Euclidean distance are particularly common in the shape matching literature[64], schemes based on the vectorprojection are more commonly (implicitly) applied throughout the condensed matter literature[15, 18, 19]. In practice,the mathematical form of the similarity metric is typically of little consequence; virtually any function can be chosen,provided it ranges smoothly as the shapes become physically different. In some specific cases, specialized similarity

9
metrics are designed to be used in conjunction with particular shape descriptors. The shape histogram schemedescribed in section II B above utilizes a specialized quadratic form distance function for matching[83], which accountsfor mismatches arising from near-misses that occur due to the discrete nature of the histogram bins. The P2 Legendrepolynomial shown in Fig 1 is an implicit example of a specialized similarity metric, specifically designed to match theangles of rod-like particles with the ideal angle given by the global director[103].
III. EXAMPLE APPLICATIONS
In this section, we demonstrate the application of shape matching techniques to a few representative problems fromour studies of self-assembly. For simplicity, we use the same shape descriptor and similarity metric for all of theexamples. Since our goal here is to demonstrate the basic usage of shape matching techniques, our examples shouldbe considered proofs-of-concept rather than optimal solutions to the problems. Additional examples of applicationsof other shape descriptors to self-assembly may be found in References[94, 104].
A. Prototype Shape Matching Scheme
For our example problems, we use the 3d Fourier shape descriptor[86], which is the harmonic descriptor definedfor patterns on the sphere, [θ, φ]. We choose this descriptor because it is closely related to the spherical harmonicsbond order parameters introduced by Nelson and coworkers[18, 19], and thus many readers will already be partiallyfamiliar with them. The basic idea behind the 3d Fourier descriptor is to decompose a 3d structure into one ormore patterns on the 2d surface of a sphere, and represent these patterns mathematically by computing the discretespherical hamonics transform (DSHT). This method of representing a pattern as its harmonic transform is analogousto the way that 1d signals along the perimeter of the circle can be described by their discrete Fourier transform(DFT).
How we extract the patterns on the sphere depends on how data is represented. For simplicity, we use a minimaldata representation based solely on particle positions (i.e., point cloud data) for all of our examples; however othertypes of data, such as volumetric data, can also be easily treated by Fourier descriptors. For our examples, we describeparticle structures as patterns on the sphere by (1) translating the structure to the origin, (2) grouping all positionswithin a radial shell rs and (3) converting each position x into its angular direction relative to the origin [θ(x), φ(x)].This is repeated for all ns radial shells required to describe the full 3d structure, giving ns patterns on the sphere foreach structure.
For each pattern on the sphere, the Fourier coefficients of the DSHT are given by:
q` =1
n
n∑i=1
Y m∗` [θ(xi), φ(xi)] m = −`,−`+ 1, ...`. (1)
The term Y m` is a set of spherical harmonics with angular frequency `. The coefficients q` are vectors with 2` + 1
complex components. Although the Fourier coefficients in their complex number form are rotationally-dependent (i.e.,their value depends on the spatial orientation of the underlying pattern), we can convert them to their rotationally-invariant form by computing the magnitude of each coefficient. The invariant circular coefficients are given by:
|q`| =
√√√√ 4π
2`+ 1
∑m=−`
|qm` |2. (2)
The Fourier invariants are positive real numbers. Although the coefficient magnitudes themselves can be used directlyas order parameters[19], incorporating them into a shape descriptor is often more powerful, since we can compareshapes based on a variety of frequencies and lengthscales. To create a descriptor from the Fourier coefficients, wesimply combine the desired q` or |q`| into a long vector. For example, a general rotation-invariant shape descriptorthat is applicable to patterns on the sphere over a range of symmetries is given by:
SF3shelli =< |q`min
|, |q`min+1|, ...|q`max| > . (3)
The range of frequencies can be adjusted to obtain a desired level of resolution. For our examples below, we use`min = 4 and `max = 12. Since each Fourier descriptor describes the pattern for a given shell, we must combine theFourier descriptors for each shell to describe the overall shape:
SF3 =< SF3shell1 ,S
F3shell2 , . . .S
F3shellns
> . (4)
10
For our example applications, we will use a simple similarity metric based on the Euclidean distance |Si − Sj |between harmonic shape descriptors:
M(Si,Sj) = 1− 2 (|Si − Sj |/|Si|+ |Sj |) . (5)
This similarity metric is proportional to the Euclidean distance between shape descriptor vectors, but is normalizedsuch that vectors that match perfectly give a value of 1, while vectors that are perfectly anticorrelated give a value of−1. Vectors with no directional correlation (i.e., that are orthogonal) give a value of 0. This normalization allows usto make a clearer analogy between our matching scheme with a typical order parameter; however, only the relativevalue of the similarity metric is relevant and the normalization is merely a matter of convenience.
B. Example 1: Micellar Crystal Structures
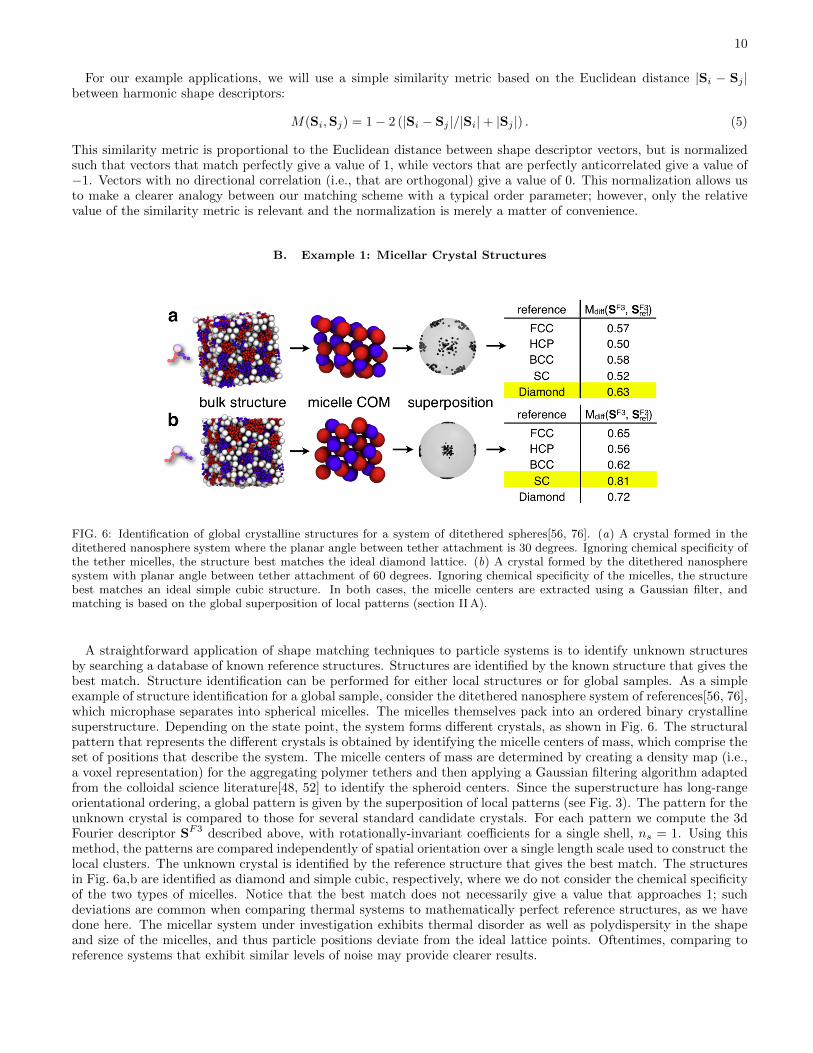
FIG. 6: Identification of global crystalline structures for a system of ditethered spheres[56, 76]. (a) A crystal formed in theditethered nanosphere system where the planar angle between tether attachment is 30 degrees. Ignoring chemical specificity ofthe tether micelles, the structure best matches the ideal diamond lattice. (b) A crystal formed by the ditethered nanospheresystem with planar angle between tether attachment of 60 degrees. Ignoring chemical specificity of the micelles, the structurebest matches an ideal simple cubic structure. In both cases, the micelle centers are extracted using a Gaussian filter, andmatching is based on the global superposition of local patterns (section II A).
A straightforward application of shape matching techniques to particle systems is to identify unknown structuresby searching a database of known reference structures. Structures are identified by the known structure that gives thebest match. Structure identification can be performed for either local structures or for global samples. As a simpleexample of structure identification for a global sample, consider the ditethered nanosphere system of references[56, 76],which microphase separates into spherical micelles. The micelles themselves pack into an ordered binary crystallinesuperstructure. Depending on the state point, the system forms different crystals, as shown in Fig. 6. The structuralpattern that represents the different crystals is obtained by identifying the micelle centers of mass, which comprise theset of positions that describe the system. The micelle centers of mass are determined by creating a density map (i.e.,a voxel representation) for the aggregating polymer tethers and then applying a Gaussian filtering algorithm adaptedfrom the colloidal science literature[48, 52] to identify the spheroid centers. Since the superstructure has long-rangeorientational ordering, a global pattern is given by the superposition of local patterns (see Fig. 3). The pattern for theunknown crystal is compared to those for several standard candidate crystals. For each pattern we compute the 3dFourier descriptor SF3 described above, with rotationally-invariant coefficients for a single shell, ns = 1. Using thismethod, the patterns are compared independently of spatial orientation over a single length scale used to construct thelocal clusters. The unknown crystal is identified by the reference structure that gives the best match. The structuresin Fig. 6a,b are identified as diamond and simple cubic, respectively, where we do not consider the chemical specificityof the two types of micelles. Notice that the best match does not necessarily give a value that approaches 1; suchdeviations are common when comparing thermal systems to mathematically perfect reference structures, as we havedone here. The micellar system under investigation exhibits thermal disorder as well as polydispersity in the shapeand size of the micelles, and thus particle positions deviate from the ideal lattice points. Oftentimes, comparing toreference systems that exhibit similar levels of noise may provide clearer results.
11
This type of database search has already been applied to particle systems in the context of proteins andmacromolecules[72, 73, 91, 92, 105–107]. Although database searches have only been applied in limited cases toassembled systems[67, 71], many standard local structure identification schemes in the condensed matter literaturebear a strong resemblance to shape matching identification schemes. For example, the common neighbor analysis(CNA) scheme of reference [16] involves constructing numerical fingerprints for pairs of atoms based on their localneighbor configurations, and identifying local clusters by matching the distribution of fingerprints with those forideal structures. In the language of shape matching, the collection of CNA fingerprints can be considered a shapedescriptor, and the catalogue of ideal fingerprints can be considered a database of reference structures. A similaridentification scheme is given by the bond order parameters of reference [19]. Here, particular local structures withstrong symmetries, such as small ordered clusters of spherical particles, can be identified by finding structures withbond order parameters that exceed a particular threshold[108]. In this case, the bond order parameters representshape descriptors, and the threshold values act implicitly as similarity metrics, since the ideal structures are knownto have high values of the bond order parameters.
C. Example 2: Icosahedral Clusters of Tetrahedral Particles
As mentioned in the previous example, a common application of structural characterization schemes is to identifylocal motifs within a global system. Examples include finding locally stable clusters in liquids[16, 22], colloids andgels[109] and nanoparticle superstructures[67, 71], and identifying structural defects in, or grain boundaries between,crystalline domains, such as in dense colloids[51]. Often, these local structural characteristics can be directly relatedto the thermodynamic, mechanical, or other properties of the system.
When detecting local structures in systems without long-range orientational order (i.e. “disordered” systems), weoften encounter structures that are not present in our reference library. A structure that does not match with thosein the reference library within a certain threshold is considered “disordered,” or unimportant[67, 71]. The thresholdmust be chosen carefully; in thermal systems, an overly-stringent cutoff value might cause a matching scheme to misshighly-ordered structures perturbed slightly from their ideal configurations, whereas an overly-permissive cutoff canmisidentify highly disordered structures. In most cases, a sufficiently rigorous cutoff can be defined such that its valuedoes not affect the qualitative results.
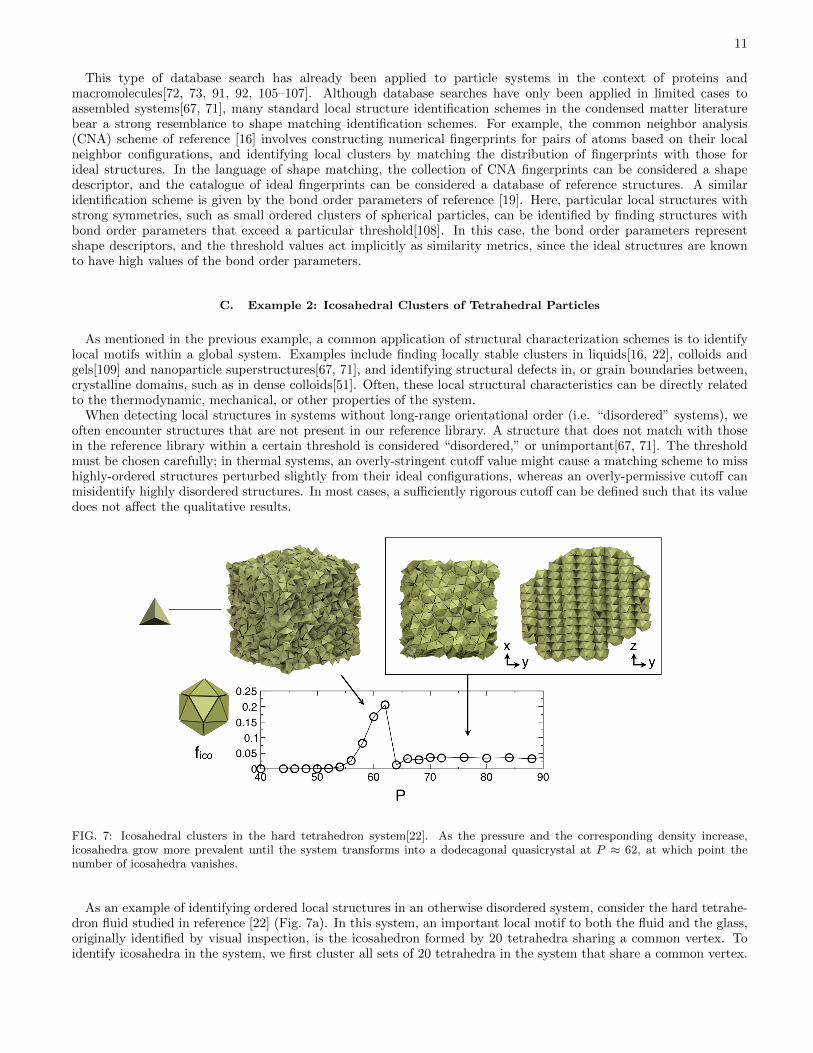
FIG. 7: Icosahedral clusters in the hard tetrahedron system[22]. As the pressure and the corresponding density increase,icosahedra grow more prevalent until the system transforms into a dodecagonal quasicrystal at P ≈ 62, at which point thenumber of icosahedra vanishes.
As an example of identifying ordered local structures in an otherwise disordered system, consider the hard tetrahe-dron fluid studied in reference [22] (Fig. 7a). In this system, an important local motif to both the fluid and the glass,originally identified by visual inspection, is the icosahedron formed by 20 tetrahedra sharing a common vertex. Toidentify icosahedra in the system, we first cluster all sets of 20 tetrahedra in the system that share a common vertex.
12
The structural pattern for each cluster is defined by the directions of vectors drawn from the center of the clusterthrough the face of each of the 20 tetrahedra, which for an ideal icosahedral cluster results in a dodecahedron. Anylocal cluster i that matches the shape of a dodecahedron with a value of Mcut(S
F3i ,SF3
dodecahedron) > 0.9 is consideredto be in an icosahedral motif. Fig. 7 shows the fraction of tetrahedra that participate in at least one icosahedronas a function of pressure. Icosahedra are relatively common in the tetrahedral fluid (below P = 62) and becomemore prevalent with increasing density, persisting into the glass if the fluid is compressed too quickly. As the fluidtransforms into a quasicrystal at P ≈ 62, the fraction of tetrahedra in icosahedra decreases drastically, and vanishesfor the ideal quasicrystal without thermal fluctuations. Although the value of Mcut may affect the absolute numberof icosahedra, the same underlying physical transition is captured for any reasonable value.
D. Example 3: Assembly of a Helical Ribbon
Another standard application of structural metrics is to track structural transitions, either as a function of time ora changing reaction coordinate. This is typically accomplished by monitoring either an order parameter or correlationfunction as the system goes through a transition. Tracking structural transitions is important for a wide variety ofapplications, including elucidating thermodynamic transitions[15, 110–113] and assembly pathways[23, 37, 114, 115].Many of the advanced molecular simulation techniques used to study transitions[116–120] rely on structural metricsin the context of pseudo-reaction coordinates[117], biasing parameters[116], and collective variables[120] to guide thestatistical sampling algorithm. Standard order parameters have been devised for various types of ordering, includingbond orientational ordering[19, 121–123], liquid crystalline ordering[13, 103] such as nematic[124] and smectic[111]phases, chiral ordering[17], and helical ordering[125]. Time correlation functions based on these types of order pa-rameters have been applied to creating structural “memory” functions for glassy liquids[126, 127] and ordered motifsattaching to a growing quasicrystal nucleus[128].
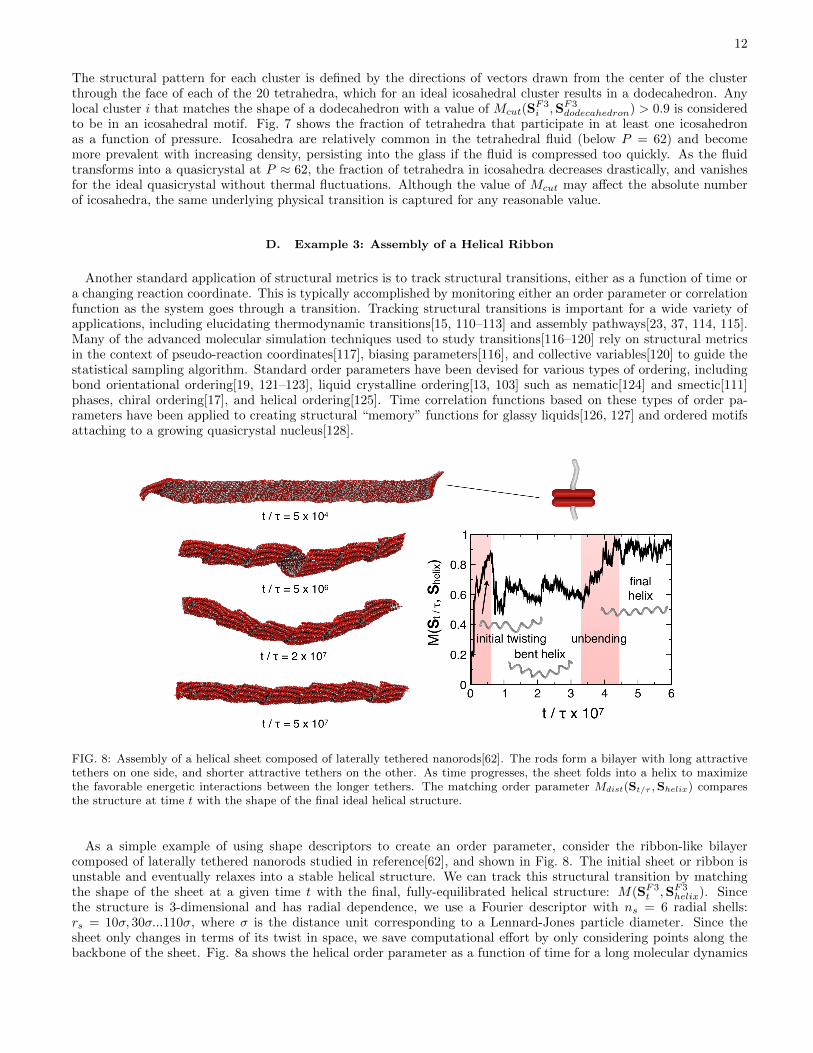
FIG. 8: Assembly of a helical sheet composed of laterally tethered nanorods[62]. The rods form a bilayer with long attractivetethers on one side, and shorter attractive tethers on the other. As time progresses, the sheet folds into a helix to maximizethe favorable energetic interactions between the longer tethers. The matching order parameter Mdist(St/τ ,Shelix) comparesthe structure at time t with the shape of the final ideal helical structure.
As a simple example of using shape descriptors to create an order parameter, consider the ribbon-like bilayercomposed of laterally tethered nanorods studied in reference[62], and shown in Fig. 8. The initial sheet or ribbon isunstable and eventually relaxes into a stable helical structure. We can track this structural transition by matchingthe shape of the sheet at a given time t with the final, fully-equilibrated helical structure: M(SF3
t ,SF3helix). Since
the structure is 3-dimensional and has radial dependence, we use a Fourier descriptor with ns = 6 radial shells:rs = 10σ, 30σ...110σ, where σ is the distance unit corresponding to a Lennard-Jones particle diameter. Since thesheet only changes in terms of its twist in space, we save computational effort by only considering points along thebackbone of the sheet. Fig. 8a shows the helical order parameter as a function of time for a long molecular dynamics
13
run. We observe that the sheet begins to twist from both ends simultaneously, which gives rise to a defect at thecenter of the helix, where a mismatch in the periodicity between the two ends occurs. This results in a tendencyfor the structure to bend to close the defect. The bend persists for many millions of time steps before annealinginto a defect free helix at around t/τ = 4.5 × 10⁷. This behavior is well captured by matching the overall shape ofthe structure, but is not captured by the more standard H4 descriptor, applied in the original reference, which onlymeasures the degree of helical ordering and gives an essentially constant value for all times after the completion oftwisting at t/τ ≈ 7 × 10⁶[62]. Using H4 alone, it would appear that the structure is fully formed at this early time,which does not capture the important defect removal behavior, which can also be observed by visual inspection.
IV. FUTURE OUTLOOK
Beyond identifying local and global structures and tracking structural transitions, there are many more applicationsof shape matching. In this section, we briefly review some areas in which we are currently applying shape matchingfor studying self assembly. Additional details may be found in Ref. [104] and in the individual references cited below.
On-The-Fly Structure Identification: For many assembly applications, such as Bottom-Up-Building-Block-Assembly (BUBBA)[129], we are interested in cataloguing unique structures. When enumerating unique structuresit is not typically necessary (or feasible) to define a library of reference structures a priori, as we did for examples 1and 2 above. Rather, the reference library can be compiled on-the-fly as new structures are encountered (see Fig. 9a).Each new structure is given a unique identifier, and structures that are duplicates are labeled with the same identifier.In addition to cluster enumeration schemes, this type of algorithm can potentially be applied to automatically detectregions of unique ordering in structural phase diagrams.
Space/Time Correlation Functions: In example 3 above, we demonstrated how shape matching could be used totrack a structural transition as a function of time, or a reaction coordinate. Another common application of structuralmetrics is to characterize how structures change in space. In the context of shape matching, this involves choosingstructures from different points in the system, rather than ideal structures, as reference structures. Spatial correlationfunctions are often used to measure structural “correlation lengths.” In the condensed matter literature, structuralcorrelation functions have been defined for crystal-like ordering in 2d[121, 122] and 3d[15, 19], nematic ordering[131],and many other more specialized types of ordering. More specialized types of spatial correlation functions have beenwidely applied as well. One example is the q6 · q6 scheme of references [15, 132], which detects ordered crystal nucleibased on spatial correlations between local bond order parameters. This scheme can be adapted to identify crystalnuclei in general by replacing q6, which is only sensitive to particular crystal structures, with other shape descriptorsthat are applicable to a particular crystal under investigation. Fig. 9b depicts the formation of a diamond-structuredcrystal nucleus (yellow) in a system of patchy particles, identified by replacing q6 with the ` = 3 Fourier coefficient,q3[37].
Structure Grouping and Classification: The field of self-assembly involves a wealth of particle building blocksand the assemblies they form; thus it is sometimes useful to categorize or classify structures based on particularstructural features. For example, reference [3] ranks different building blocks for self-assembly based on their shapeanisotropy. Shape matching methods can provide numerical metrics by which to classify structures. Structures canbe ranked based on the degree to which they exhibit a particular structural feature of interest, or by how well theymatch ideal structures exhibiting a particular feature. For example, structures can be ranked based on their 6-foldsymmetry by computing the value of their ` = 6 Fourier descriptor, which is proportional to the degree of 6-foldsymmetry. Similarly, we can create groups of structures that exhibit a particular structural feature by comparingshape descriptors. One example of a technique used to visually group similar structures is given by plotting a matrixof pairwise similarity values known as a “similarity matrix” or “heat map”[133], as depicted in Fig. 9c for 2d colloidalclusters[134]. Groups of clusters with similar structural features produce bright blocks, indicating that clusters withinthis region of parameter space match well. Grouping objects based on shape similarity has also been applied recentlyto macromolecules and proteins[72, 106].
Abstract Correlation Functions: Thus far, we have either extended the applicability of standard condensed matterorder parameters and correlation functions by incorporating shape matching, or applied standard shape matchingapplications directly in the context of assembled systems. However, in addition to extending existing applications foruse with assembled systems, shape matching allows us to invent new methods that have not yet been explored. Forexample, rather than creating correlation functions in space and time as we typically do for condensed matter systems,we can create abstract correlation functions in parameter space. Fig. 9d depicts a parameter space correlation function

14
FIG. 9: Potential uses for shape matching in assembly applications. (a) Searching parameter spaces for unique structures. Thepanel depicts the Bottom-Up-Building-Block-Assembly (BUBBA) algorithm[129]. (b) Computing spatial correlation functions.The panel depicts detecting a growing diamond crystal nucleus in a system of patchy particles[37]. (c) Structure grouping andclassification. The panel depicts a similarity matrix (i.e., all of the pairwise similarity values) for 2d clusters of different sizes.Groups of similar structures are identified by bright boxes about the line y=x. (d) Abstract correlation functions. The paneldepicts a structural phase diagram for the 2d Lennard-Jones Gauss system (top), created by visual inspection[130], comparedwith a phase diagram for the same system generated automatically using a shape matching algorithm (bottom).
computed for the 2d Lennard-Jones Gauss system[130], which identifies structural phase boundaries (purple) by findingpoints in parameter space that do not match well with their neighboring points. This correlation function is ableto reproduce the structural phase diagram produced in reference [130] by visual inspection of over 5000 independentconfigurations. This scheme is just one example of how shape matching algorithms can replace the human element insearching for target structures, and rapidly mapping parameter spaces. The ability to expedite self-assembly researchby automating the study of unique systems may represent one of the most important uses for shape matching movingforward.
Summary: The example applications and shape descriptors that we have provided here represent only a small subsetof the vast range of possibilities yet to be explored. In the future, the wealth of shape descriptors from the shapematching literature should be tested for different classes of particle systems to expand the scope of order parametersavailable to the fields of experimental and computational assembly. New abstract order parameters and correlationfunctions, such as the phase space correlation function of Fig. 9d, can be constructed to expand the algorithms usedto explore new systems. More immediately, the relatively simple algorithms outlined here can be applied to existing
15
assembled systems to enhance our ability to gain insight into the underlying physics of these complex systems.Acknowledgements: The Department of Education (GAANN Grant No. P200A070538) provided partial support
for ASK. The National Science Foundation supported ASK, CRI and SCG in the development of shape-matchingreference databases (Grant No. DUE-0532831) and shape-matching computational codes (Grant No. CHE-0626305).The Biomolecular Materials and Processes Program of the Department of Energy (Grant No. DE-FG02-02ER46000)supported CRI and SCG in the application of shape-matching to the system of ditethered nanospheres presented here.CRI also acknowledges a University of Michigan Rackham Predoctoral Fellowship. We thank T.D. Nguyen, M. Engel,and G. van Anders for helpful comments on the manuscript. Thanks also to T.D. Nguyen, M. Engel, A. Haji-Akbari,E. Jankowski, C. Phillips, D. Ortiz, A. Santos, C. Singh, A. Mohraz, and M. Solomon for providing example data,not all of which could be used here.
[1] Z. Nie, A. Petukhova, and E. Kumacheva, “Properties and emerging applications of self-assembled structures made frominorganic nanoparticles,” Nature Nanotechnology, vol. 5, no. 1, pp. 15–25, 2010.
[2] L. E. Euliss, J. A. DuPont, S. Gratton, and J. DeSimone, “Imparting size, shape, and composition control of materialsfor nanomedicine,” Chemical Society Reviews, vol. 35, no. 11, pp. 1095–1104, 2006.
[3] S. C. Glotzer and M. J. Solomon, “Anisotropy of building blocks and their assembly into complex structures,” NatureMaterials, vol. 6, pp. 557–562, 2007.
[4] S. C. Glotzer, M. A. Horsch, C. R. Iacovella, Z. L. Zhang, E. R. Chan, and X. Zhang, “Self-assembly of anisotropictethered nanoparticle shape amphiphiles,” Current Opinion in Colloid and Interface Science, vol. 10, pp. 287–295, DEC2005.
[5] M. C. Daniel and D. Astruc, “Gold nanoparticles: Assembly, supramolecular chemistry, quantum-size-related properties,and applications toward biology, catalysis, and nanotechnology,” Chemical Reviews, vol. 104, pp. 293–346, JAN 2004.
[6] C. P. Collier, T. Vossmeyer, and J. R. Heath, “Nanocrystal superlattices,” Annual Review of Physical Chemistry, vol. 49,no. 1, pp. 371–404, 1998.
[7] J. J. Storhoff, A. A. Lazarides, R. C. Mucic, C. A. Mirkin, R. L. Letsinger, and G. C. Schatz, “What controls the opticalproperties of dna-linked gold nanoparticle assemblies?,” Journal of the American Chemical Society, vol. 122, no. 19,pp. 4640–4650, 2000.
[8] K. Kempa, B. Kimball, J. Rybczynski, Z. P. Huang, P. F. Wu, D. Steeves, M. Sennett, M. Giersig, D. V. G. L. N. Rao,D. L. Carnahan, D. Z. Wang, J. Y. Lao, W. Z. Li, and Z. F. Ren, “Photonic crystals based on periodic arrays of alignedcarbon nanotubes,” Nano Letters, vol. 3, no. 1, pp. 13–18, 2002.
[9] B. M. Reinhard, M. Siu, H. Agarwal, A. P. Alivisatos, and J. Liphardt, “Calibration of dynamic molecular rulers basedon plasmon coupling between gold nanoparticles,” Nano Letters, vol. 5, no. 11, pp. 2246–2252, 2005.
[10] P. J. Flory, “Phase equilibria in solutions of rod-like particles,” Proceedings of the Royal Society of London. Series A,Mathematical and Physical Sciences, vol. 234, no. 1196, pp. 73–89, 1956.
[11] L. Onsager, “The effects of shape on the interaction of colloidal particles,” Annals of the New York Academy of Sciences,vol. 51, no. Molecular Interaction, pp. 627–659, 1949.
[12] J. D. Bernal, “A geometrical approach to the structure of liquids,” Nature, vol. 183, pp. 141–147, 1959.[13] R. G. Larson, The structure and rheology of complex fluids. Oxford University Press, USA, 2000.[14] N. D. Mermin, “Crystalline order in two dimensions,” Physical Review, vol. 176, no. 1, pp. 250–254, 1968.[15] P. R. tenWolde, M. J. RuizMontero, and D. Frenkel, “Numerical calculation of the rate of crystal nucleation in a lennard-
jones system at moderate undercooling,” The Journal of Chemical Physics, vol. 104, pp. 9932–9947, Jun 1996.[16] J. D. Honeycutt and H. C. Andersen, “Molecular dynamics study of melting and freezing of small lennard-jones clusters,”
Journal of Physical Chemistry, vol. 91, no. 19, pp. 4950–4963, 1987.[17] A. B. Harris, R. D. Kamien, and T. C. Lubensky, “Molecular chirality and chiral parameters,” Rev. Mod. Phys., vol. 71,
pp. 1745–1757, Oct 1999.[18] B. I. Halperin and D. R. Nelson, “Theory of two-dimensional melting,” Physical Review Letters, vol. 41, no. 2, pp. 121–124,
1978.[19] P. J. Steinhardt, D. R. Nelson, and M. Ronchetti, “Bond-orientational order in liquids and glasses,” Physical Review B,
vol. 28, no. 2, pp. 784–805, 1983.[20] P. Akcora, H. Liu, S. K. Kumar, J. Moll, Y. Li, B. C. Benicewicz, L. S. Schadler, D. Acehan, A. Z. Panagiotopoulos,
V. Pryamitsyn, V. Ganesan, J. Ilavsky, P. Thiyagarajan, R. H. Colby, and J. F. Douglas, “Anisotropic self-assembly ofspherical polymer-grafted nanoparticles,” Nature Materials, vol. 8, no. 4, pp. 354–359, 2009.
[21] Z. H. Nie, D. Fava, E. Kumacheva, S. Zou, G. C. Walker, and M. Rubinstein, “Self-assembly of metal-polymer analoguesof amphiphilic triblock copolymers,” Nature Materials, vol. 6, pp. 609–614, AUG 2007.
[22] A. Haji-Akbari, M. Engel, A. S. Keys, X. Zheng, R. G. Petschek, P. Palffy-Muhoray, and S. C. Glotzer, “Disordered,quasicrystalline and crystalline phases of densely packed tetrahedra,” Nature, vol. 462, no. 7274, pp. 773–777, 2009.
[23] Z. Y. Tang, Z.-L. Zhang, Y. Wang, S. C. Glotzer, and N. A. Kotov, “Self-assembly of cdte nanocrystals into free-floatingsheets,” Science, vol. 314, pp. 274–278, OCT 2006.
[24] Z.-L. Zhang, Z. Y. Tang, N. A. Kotov, and S. C. Glotzer, “Simulations and analysis of self-assembly of cdte nanoparticles
16
into wires and sheets,” Nano Letters, vol. 7, pp. 1670–1675, JUN 2007.[25] Z.-L. Zhang, M. A. Horsch, M. H. Lamm, and S. C. Glotzer, “Tethered nano building blocks: Toward a conceptual
framework for nanoparticle self-assembly,” Nano Letters, vol. 3, pp. 1341–1346, OCT 2003.[26] S. Srivastava, A. Santos, K. Critchley, K.-S. Kim, P. Podsiadlo, K. Sun, J. Lee, C. Xu, G. D. Lilly, S. C. Glotzer, and N. A.
Kotov, “Light-controlled self-assembly of semiconductor nanoparticles into twisted ribbons,” Science, vol. 327, no. 5971,pp. 1355–1359, 2010.
[27] A. Ahniyaz, Y. Sakamoto, and L. Bergstrom, “Magnetic field-induced assembly of oriented superlattices from maghemitenanocubes,” Proceedings of the National Academy of Sciences, vol. 104, no. 45, pp. 17570–17574, 2007.
[28] X. Zhang, Z. Zhang, and S. C. Glotzer, “Simulation study of dipole-induced self-assembly of nanocubes,” The Journal ofPhysical Chemistry C, vol. 111, no. 11, pp. 4132–4137, 2007.
[29] B. S. John and F. A. Escobedo, “Phase behavior of colloidal hard tetragonal parallelepipeds (cuboids): A monte carlosimulation study,” The Journal of Physical Chemistry B, vol. 109, no. 48, pp. 23008–23015, 2005.
[30] V. N. Manoharan, M. T. Elsesser, and D. J. Pine, “Dense packing and symmetry in small clusters of microspheres,”Science, vol. 301, no. 5632, pp. 483–487, 2003.
[31] Y.-S. Cho, G.-R. Yi, J.-M. Lim, S.-H. Kim, V. N. Manoharan, D. J. Pine, and S.-M. Yang, “Self-organization of bidispersecolloids in water droplets,” Journal of the American Chemical Society, vol. 127, no. 45, pp. 15968–15975, 2005.
[32] D. J. Kraft, J. Goenewold, and K. Kegel, Willem, “Colloidal molecules with well-controlled bond angles,” Soft Matter,vol. 5, pp. 3823–3826, 2009.
[33] S. A. Vanapalli, C. R. Iacovella, K. E. Sung, D. Mukhija, J. M. Millunchick, M. A. Burns, S. C. Glotzer, and M. J.Solomon, “Fluidic assembly and packing of microspheres in confined channels,” Langmuir, vol. 24, no. 7, pp. 3661–3670,2008.
[34] K. E. Sung, S. A. Vanapalli, D. Mukhija, H. A. McKay, J. Mirecki Millunchick, M. A. Burns, and M. J. Solomon,“Programmable fluidic production of microparticles with configurable anisotropy,” Journal of the American ChemicalSociety, vol. 130, no. 4, pp. 1335–1340, 2008.
[35] G. Zhang, D. Y. Wang, and H. Mohwald, “Decoration of microspheres with gold nanodots-giving colloidal spheresvalences,” Angewandte Chemie-International Edition, vol. 44, no. 47, pp. 7767–7770, 2005.
[36] Z.-L. Zhang and S. C. Glotzer, “Self-assembly of patchy particles,” Nano Letters, vol. 4, pp. 1407–1413, AUG 2004.[37] Z. Zhang, A. S. Keys, T. Chen, and S. C. Glotzer, “Self-assembly of patchy particles into diamond structures through
molecular mimicry,” Langmuir, vol. 21, no. 25, pp. 11547–11551, 2005.[38] G. A. DeVries, M. Brunnbauer, Y. Hu, A. M. Jackson, B. Long, B. T. Neltner, O. Uzun, B. H. Wunsch, and F. Stellacci,
“Divalent metal nanoparticles,” Science, vol. 315, pp. 358–361, JAN 2007.[39] A. M. Jackson, J. W. Myerson, and F. Stellacci, “Spontaneous assembly of subnanometre-ordered domains in the ligand
shell of monolayer-protected nanoparticles,” Nature Materials, vol. 3, pp. 330–336, MAY 2004.[40] A. B. Pawar and I. Kretzschmar, “Patchy particles by glancing angle deposition,” Langmuir, vol. 24, no. 2, pp. 355–358,
2008.[41] J.-W. Park and E. L. Thomas, “Anisotropic micellar nanoobjects from reactive liquid crystalline rodcoil diblock copoly-
mers,” Macromolecules, vol. 37, no. 10, pp. 3532–3535, 2004.[42] E. Reister and G. H. Fredrickson, “Phase behavior of a blend of polymer-tethered nanoparticles with diblock copolymers,”
The Journal of Chemical Physics, vol. 123, no. 21, p. 214903, 2005.[43] A. Jayaraman and K. S. Schweizer, “Structure and assembly of dense solutions and melts of single tethered nanoparticles,”
The Journal of Chemical Physics, vol. 128, APR 28 2008.[44] A. J. Waddon, L. Zheng, R. J. Farris, and E. B. Coughlin, “Nanostructured polyethylene-poss copolymers: Control of
crystallization and aggregation,” Nano Letters, vol. 2, pp. 1149–1155, OCT 2002.[45] A. K. Boal, F. Ilhan, J. E. DeRouchey, T. Thurn-Albrecht, T. P. Russell, and V. M. Rotello, “Self-assembly of nanoparticles
into structured spherical and network aggregates,” Nature, vol. 404, no. 6779, pp. 746–748, 2000.[46] T. Chen, Z. Zhang, and S. C. Glotzer, “A precise packing sequence for self-assembled convex structures,” Proceedings of
the National Academy of Sciences, vol. 104, no. 3, pp. 717–722, 2007.[47] D. Rapaport, “Self-assembly of polyhedral shells: a molecular dynamics study,” Physical Review E, vol. 70, no. 5, p. 51905,
2004.[48] J. C. Crocker and D. G. Grier, “Methods of digital video microscopy for colloidal studies,” Journal of Colloid and Interface
Science, vol. 179, pp. 298–310, APR 1996.[49] E. R. Weeks, J. C. Crocker, A. C. Levitt, A. Schofield, and D. A. Weitz, “Three-dimensional direct imaging of structural
relaxation near the colloidal glass transition,” Science, vol. 287, no. 5453, p. 627, 2000.[50] L. T. Shereda, R. G. Larson, and M. J. Solomon, “Local stress control of spatiotemporal ordering of colloidal crystals in
complex flows,” Physical Review Letters, vol. 101, no. 3, p. 38301, 2008.[51] T. Solomon and M. J. Solomon, “Stacking fault structure in shear-induced colloidal crystallization,” The Journal of
Chemical Physics, vol. 124, no. 13, p. 134905, 2006.[52] P. Varadan and M. J. Solomon, “Direct visualization of long-range heterogeneous structure in dense colloidal gels,”
Langmuir, vol. 19, no. 3, pp. 509–512, 2003.[53] P. Coura, S. Legoas, A. Moreira, and F. Sato, “On the structural and stability features of linear atomic suspended chains
formed from gold nanowires stretching,” Nano Letters, Jan 2004.[54] D. V. Talapin, E. V. Shevchenko, M. I. Bodnarchuk, X. Ye, J. Chen, and C. B. Murray, “Quasicrystalline order in
self-assembled binary nanoparticle superlattices,” Nature, vol. 461, no. 7266, pp. 964–967, 2009.[55] E. V. Shevchenko, D. V. Talapin, N. A. Kotov, S. O’Brien, and C. B. Murray, “Structural diversity in binary nanoparticle

17
superlattices,” Nature, vol. 439, pp. 55–59, JAN 2006.[56] C. R. Iacovella and S. C. Glotzer, “Complex crystal structures formed by the self-assembly of ditethered nanospheres,”
Nano Letters, vol. 9, no. 3, pp. 1206–1211, 2009.[57] K. Hayashida, T. Dotera, A. Takano, and Y. Matsushita, “Polymeric quasicrystal: Mesoscopic quasicrystalline tiling in
abc star polymers,” Physical Review Letters, vol. 98, MAY 11 2007.[58] M. E. Leunissen, C. G. Christova, A. P. Hynninen, C. P. Royall, A. I. Campbell, A. Imhof, M. Dijkstra, R. van Roij, and
A. van Blaaderen, “Ionic colloidal crystals of oppositely charged particles,” Nature, vol. 7056, pp. 235–240, SEP 2005.[59] A. J. Liu and S. R. Nagel, “Jamming is not just cool any more,” Nature, vol. 396, no. 6706, pp. 21–22, 1998.[60] A. Keys, A. Abate, S. Glotzer, and D. Durian, “Measurement of growing dynamical length scales and prediction of the
jamming transition in a granular material,” Nature physics, vol. 3, no. 4, pp. 260–264, 2007.[61] A. Mohraz and M. Solomon, “Direct visualization of colloidal rod assembly by confocal microscopy,” Langmuir, vol. 21,
no. 12, pp. 5298–5306, 2005.[62] T. D. Nguyen and S. C. Glotzer, “Switchable helical structures formed by the hierarchical self-assembly of laterally
tethered nanorods,” Small, vol. 5, no. 18, pp. 2092–2098, 2009.[63] A. S. Keys and C. R. Iacovella, “Particle shape matching library and examples,” URL http://www. glotzerlab. engin.
umich. edu/shapematching. html, 2010.[64] R. C. Veltkamp and M. Hagedoorn, “State of the art in shape matching,” Principles of visual information retrieval, p. 87,
2001.[65] X. Lu, D. Colbry, and A. K. Jain, “Three-dimensional model based face recognition,” To appear in Proc. of ICPR, 2004.[66] H. D. Tagare, C. C. Jaffe, and J. Duncan, “Medical image databases: A content-based retrieval approach,” Journal of
the American Medical Informatics Association, vol. 4, no. 3, p. 184, 1997.[67] C. R. Iacovella, A. S. Keys, M. A. Horsch, and S. C. Glotzer, “Icosahedral packing of polymer-tethered nanospheres and
stabilization of the gyroid phase,” Physical Review E, vol. 75, p. 040801(R), 2007.[68] T. D. Nguyen, Z. Zhang, and S. C. Glotzer, “Molecular simulation study of self-assembly of tethered v-shaped nanopar-
ticles,” The Journal of Chemical Physics, vol. 129, p. 244903, 2008.[69] M. A. Horsch, Z. L. Zhang, and S. C. Glotzer, “Self-assembly of polymer-tethered nanorods,” Physical Review Letters,
vol. 95, no. 5, p. 056105, 2005. 056105.[70] C. R. Iacovella, M. A. Horsch, Z. Zhang, and S. C. Glotzer, “Phase diagrams of self-assembled mono-tethered nanospheres
from molecular simulation and comparison to surfactants,” Langmuir, vol. 21, no. 21, pp. 9488–9494, 2005.[71] C. R. Iacovella, M. A. Horsch, and S. C. Glotzer, “Local ordering of polymer-tethered nanospheres and nanorods and the
stabilization of the double gyroid phase,” The Journal of Chemical Physics, vol. 129, p. 044902, 2008.[72] L. Mak, S. Grandison, and R. J. Morris, “An extension of spherical harmonics to region-based rotationally invariant
descriptors for molecular shape description and comparison,” Journal of Molecular Graphics and Modelling, vol. 26, no. 7,pp. 1035–1045, 2008.
[73] S. Grandison, C. Roberts, and R. J. Morris, “The application of 3d zernike moments for the description of model-freemolecular structure, functional motion, and structural reliability,” Journal of Computational Biology, vol. 16, no. 3,pp. 487–500, 2009.
[74] J. Roth and A. R. Denton, “Solid-phase structures of the dzugutov pair potential,” Physical Review E, vol. 61, no. 6,pp. 6845–6857, 2000.
[75] D. Shechtman, I. Blech, D. Gratias, and J. W. Cahn, “Metallic phase with long-range orientational order and no trans-lational symmetry,” Physical Review Letters, vol. 53, no. 20, pp. 1951–1953, 1984.
[76] C. R. Iacovella and S. C. Glotzer, “Phase behavior of ditethered nanospheres,” Soft Matter, vol. 5, pp. 4492 – 4498, 2009.[77] P. J. Besl and H. D. McKay, “A method for registration of 3-d shapes,” IEEE Transactions on pattern analysis and
machine intelligence, vol. 14, no. 2, pp. 239–256, 1992.[78] I. Jolliffe, Principal component analysis. Springer verlag, 2002.[79] N. Iyer, S. Jayanti, K. Lou, Y. Kalyanaraman, and K. Ramani, “Three-dimensional shape searching: state-of-the-art
review and future trends,” Computer-Aided Design, vol. 37, no. 5, pp. 509–530, 2005.[80] J. W. H. Tangelder and R. C. Veltkamp, “A survey of content based 3d shape retrieval methods,” Multimedia Tools and
Applications, vol. 39, no. 3, pp. 441–471, 2008.[81] D. Zhang and G. Lu, “Review of shape representation and description techniques,” Pattern recognition, vol. 37, no. 1,
pp. 1–19, 2004.[82] H. Chui and A. Rangarajan, “A new point matching algorithm for non-rigid registration,” Computer Vision and Image
Understanding, vol. 89, no. 2-3, pp. 114–141, 2003.[83] M. Ankerst, G. Kastenmuller, H. P. Kriegel, and T. Seidl, “3d shape histograms for similarity search and classification in
spatial databases,” Lecture Notes in Computer Science, pp. 207–228, 1999.[84] R. Osada, T. Funkhouser, B. Chazelle, and D. Dobkin, “Shape distributions,” ACM Transactions on Graphics (TOG),
vol. 21, no. 4, pp. 807–832, 2002.[85] C. T. Zahn and R. Z. Roskies, “Fourier descriptors for plane closed curves,” IEEE Transactions on computers, vol. 21,
no. 3, pp. 269–281, 1972.[86] M. Kazhdan, T. Funkhouser, and S. Rusinkiewicz, “Rotation invariant spherical harmonic representation of 3d shape
descriptors,” in Proceedings of the 2003 Eurographics/ACM SIGGRAPH symposium on Geometry processing, p. 164,Eurographics Association, 2003.
[87] A. Khotanzad and Y. H. Hong, “Invariant image recognition by zernike moments,” IEEE Transactions on Pattern Analysisand Machine Intelligence, vol. 12, no. 5, pp. 489–497, 1990.
18
[88] M. Novotni and R. Klein, “3d zernike descriptors for content based shape retrieval,” in Proceedings of the eighth ACMsymposium on Solid modeling and applications, pp. 216–225, ACM New York, NY, USA, 2003.
[89] S. Belongie, J. Malik, and J. Puzicha, “Shape matching and object recognition using shape contexts,” IEEE Transactionson Pattern Analysis and Machine Intelligence, pp. 509–522, 2002.
[90] D. Y. Chen, X. P. Tian, Y. T. Shen, and M. Ouhyoung, “On visual similarity based 3d model retrieval,” in Computergraphics forum, vol. 22, pp. 223–232, Amsterdam: North Holland, 1982-, 2003.
[91] A. M. Lesk, “A toolkit for computational molecular biology. ii. on the optimal superposition of two sets of coordinates,”Acta Crystallographica Section A: Foundations of Crystallography, vol. 42, no. 2, pp. 110–113, 1986.
[92] R. Blankenbecler, M. Ohlsson, C. Peterson, and M. Ringner, “Matching protein structures with fuzzy alignments,”Proceedings of the National Academy of Sciences, vol. 100, no. 21, p. 11936, 2003.
[93] C. R. Iacovella, M. A. Horsch, Z. Zhang, and S. C. Glotzer, “Phase diagrams of self-assembled mono-tethered nanospheresfrom molecular simulation and comparison to surfactants,” Langmuir, vol. 21, no. 21, pp. 9488–9494, 2005.
[94] A. S. Keys, C. R. Iacovella, and S. C. Glotzer, “Characterizing structure through shape matching: Applications andalgorithms.” preprint, 2010.
[95] M. Kortgen, G. Park, M. Novotni, and R. Klein, “3D shape matching with 3D shape contexts,” in The 7th CentralEuropean Seminar on Computer Graphics, vol. 3, Citeseer, 2003.
[96] M. Hilaga, Y. Shinagawa, T. Kohmura, and T. Kunii, “Topology matching for fully automatic similarity estimation of3D shapes,” in Proceedings of the 28th annual conference on Computer graphics and interactive techniques, pp. 203–212,ACM, 2001.
[97] H. Sundar, D. Silver, N. Gagvani, and S. Dickinson, “Skeleton based shape matching and retrieval,” in Shape ModelingInternational, vol. 130, p. 139, 2003.
[98] S. Biasotti, S. Marini, M. Mortara, G. Patane, M. Spagnuolo, and B. Falcidieno, “3D shape matching through topologicalstructures,” in Discrete Geometry for Computer Imagery, pp. 194–203, Springer, 2003.
[99] M. Kazhdan, T. Funkhouser, and S. Rusinkiewicz, “Symmetry descriptors and 3D shape matching,” in Proceedings of the2004 Eurographics/ACM SIGGRAPH symposium on Geometry processing, pp. 115–123, ACM, 2004.
[100] P. Jiantao, L. Yi, X. Guyu, Z. Hongbin, L. Weibin, and Y. Uehara, “3D model retrieval based on 2D slice similaritymeasurements,” in 2nd International Symposium on 3D Data Processing, Visualization and Transmission, 2004. 3DPVT2004. Proceedings, pp. 95–101, 2004.
[101] M. Cosentino Lagomarsino, M. Dogterom, and M. Dijkstra, “Isotropic-nematic transition of long, thin, hard spherocylin-ders confined in a quasi-two-dimensional planar geometry,” Journal of Chemical Physics, vol. 119, pp. 3535–3540, August2003.
[102] R. C. Veltkamp, “Shape matching: similarity measures and algorithms,” in Shape Modeling and Applications, SMI 2001International Conference on., pp. 188–197, 2001.
[103] P. G. de Gennes and J. Prost, The physics of liquid crystals. Oxford University Press, USA, 1995.[104] A. S. Keys, C. R. Iacovella, and S. C. Glotzer, “Harmonic shape descriptors applied to characterizing assembled struc-
tures.” preprint, 2010.[105] E. Krissinel and K. Henrick, “Secondary-structure matching (ssm), a new tool for fast protein structure alignment in
three dimensions,” Acta Crystallographica Section D: Biological Crystallography, vol. 60, no. 12, pp. 2256–2268, 2004.[106] J. S. Yeh, D. Y. Chen, B. Y. Chen, and M. Ouhyoung, “A web-based three-dimensional protein retrieval system by
matching visual similarity,” Bioinformatics, vol. 21, no. 13, p. 3056, 2005.[107] V. Venkatraman, L. Sael, and D. Kihara, “Potential for protein surface shape analysis using spherical harmonics and 3d
zernike descriptors,” Cell Biochemistry and Biophysics, vol. 54, no. 1, pp. 23–32, 2009.[108] U. Gasser, A. Schofield, and D. A. Weitz, “Local order in a supercooled colloidal fluid observed by confocal microscopy,”
Journal of Physics: Condensed Matter, vol. 15, p. S375, 2003.[109] A. I. Campbell, V. J. Anderson, J. S. Van Duijneveldt, and P. Bartlett, “Dynamical arrest in attractive colloids: the
effect of long-range repulsion,” Physical Review Letters, vol. 94, no. 20, p. 208301, 2005.[110] B. I. Halperin, T. C. Lubensky, and S. K. Ma, “First-order phase transitions in superconductors and smectic-a liquid
crystals,” Physical Review Letters, vol. 32, no. 6, pp. 292–295, 1974.[111] W. L. McMillan, “Simple molecular model for the smectic a phase of liquid crystals,” Physical Review A, vol. 4, no. 3,
pp. 1238–1246, 1971.[112] R. Radhakrishnan, K. E. Gubbins, and M. Sliwinska-Bartkowiak, “Effect of the fluid-wall interaction on freezing of
confined fluids: Toward the development of a global phase diagram,” The Journal of Chemical Physics, vol. 112, no. 24,pp. 11048–11057, 2000.
[113] P. T. Cummings, H. Docherty, C. R. Iacovella, and J. K. Singh, “Phase transitions in nanoconfined fluids: The evidencefrom simulation and theory,” AIChE Journal, vol. 56, no. 4, pp. 842–848, 2010.
[114] M. Yamaki, J. Higo, and K. Nagayama, “Size-dependent separation of colloidal particles in two-dimensional convectiveself-assembly,” Langmuir, vol. 11, no. 8, pp. 2975–2978, 1995.
[115] P. Bladon and A. C. Griffin, “Self-assembly in living nematics,” Macromolecules, vol. 26, no. 24, pp. 6604–6610, 1993.[116] G. M. Torrie and J. P. Valleau, “Nonphysical sampling distributions in monte carlo free-energy estimation: umbrella
sampling,” Journal of Computational Physics, vol. 23, no. 2, pp. 187–199, 1977.[117] C. Dellago, P. G. Bolhuis, F. S. Csajka, and D. Chandler, “Transition path sampling and the calculation of rate constants,”
The Journal of Chemical Physics, vol. 108, p. 1964, 1998.[118] P. G. Bolhuis, D. Chandler, C. Dellago, and P. L. Geissler, “Transition path sampling: Throwing ropes over rough
mountain passes, in the dark,” Annual Review of Physical Chemistry, vol. 53, pp. 291–318, 2002.

19
[119] R. J. Allen, D. Frenkel, and P. R. Ten Wolde, “Forward flux sampling-type schemes for simulating rare events: Efficiencyanalysis,” The Journal of Chemical Physics, vol. 124, p. 194111, 2006.
[120] A. Laio and M. Parrinello, “Escaping free-energy minima,” Proceedings of the National Academy of Sciences, vol. 99,no. 20, pp. 12562–12566, 2002.
[121] B. I. Halperin and D. R. Nelson, “Theory of two-dimensional melting,” Physical Review Letters, vol. 41, no. 2, pp. 121–124,1978.
[122] D. R. Nelson and B. I. Halperin, “Dislocation-mediated melting in two dimensions,” Physical Review B, vol. 19, no. 5,pp. 2457–2484, 1979.
[123] P. J. Steinhardt, D. R. Nelson, and M. Ronchetti, “Icosahedral bond orientational order in supercooled liquids,” PhysicalReview Letters, vol. 47, no. 18, pp. 1297–1300, 1981.
[124] M. J. Freiser, “Ordered states of a nematic liquid,” Physical Review Letters, vol. 24, no. 19, pp. 1041–1043, 1970.[125] J. P. Kemp and J. Z. Y. Chen, “Helical structures in proteins,” Biomacromolecules, vol. 2, no. 2, pp. 389–401, 2001.[126] T. Kawasaki, T. Araki, and H. Tanaka, “Correlation between dynamic heterogeneity and medium-range order in two-
dimensional glass-forming liquids,” Physical Review Letters, vol. 99, no. 21, p. 215701, 2007.[127] H. Shintani and H. Tanaka, “Frustration on the way to crystallization in glass,” Nature Physics, vol. 2, no. 3, pp. 200–206,
2006.[128] A. S. Keys and S. C. Glotzer, “How do quasicrystals grow?,” Physical Review Letters, vol. 99, no. 23, p. 235503, 2007.[129] E. Jankowski and S. C. Glotzer, “A comparison of new methods for generating energy-minimizing configurations of patchy
particles,” The Journal of Chemical Physics, vol. 131, p. 104104, 2009.[130] M. Engel and H. R. Trebin, “Self-assembly of monatomic complex crystals and quasicrystals with a double-well interaction
potential,” Physical Review Letters, vol. 98, no. 22, p. 225505, 2007.[131] M. P. Allen and M. A. Warren, “Simulation of structure and dynamics near the isotropic-nematic transition,” Physical
Review Letters, vol. 78, no. 7, pp. 1291–1294, 1997.[132] S. Auer and D. Frenkel, “Numerical prediction of absolute crystallization rates in hard-sphere colloids,” J. Chem. Phys.,
vol. 120, pp. 3015–3029, Feb 2004.[133] P. Shilane, P. Min, M. Kazhdan, and T. Funkhouser, “The princeton shape benchmark,” 2004.[134] D. Ortiz, E. P. Jankowski, and S. C. Glotzer, “Assembly propensity in a system of 2d colloidal tetrominoes.” preprint,
2010.