Usable autonomic computing systems: The system administrators' perspective

ORIGINAL RESEARCH ARTICLEpublished: 06 November 2013
doi: 10.3389/fneng.2013.00009
Characterization of affective states by pupillary dynamicsand autonomic correlatesFrancesco Onorati1,2,3,4*, Riccardo Barbieri2,3, Maurizio Mauri4, Vincenzo Russo4 and Luca Mainardi1
1 Dipartimento di Elettronica, Informazione e Bioingegneria, Politecnico di Milano, Milan, Italy2 Massachusetts Institute of Technology, Cambridge, MA, USA3 Massachusetts General Hospital, Boston, MA, USA4 Behavior and Brain Lab, IULM University, Milan, Italy
Edited by:
Antonio Lanatà, University of Pisa,Italy
Reviewed by:
Hun-Kuk Park, Kyung HeeUniversity, South KoreaGiovanni Mirabella, University of LaSapienza, Italy
*Correspondence:
Francesco Onorati, Dipartimento diElettronica, Informazione eBioingegneria, Politecnico di Milano,Via Ponzio 34/5, 20133 Milan, ItalyBehavior and Brain Lab, IULMUniversity, Via Carlo Bo 1,20143 Milan, Italye-mail: [email protected];[email protected]
With the recent advent of new recording devices and an easier access to signalprocessing tools, researchers are increasingly exploring and studying the Pupil Dilation(PD) signal. Recently, numerous studies pointed out the relations between PD dynamicsand psychophysiological states. Although it is well known that PD is controlled bythe Autonomic Nervous System (ANS), and ANS responses are related to emotionalevents/stimuli, the relationship between emotional states and PD is still an open issue.The aim of this study is to define the statistical properties of the PD signal, to understandits relation with ANS correlates such as Heart Rate Variability (HRV) and respiration (RESP),and to explore if PD could provide information for the evaluation of the psychophysiologicalresponse of ANS to affective triggering events. ECG, RESP, and PD data from 13 normalsubjects were recorded during a memory recall paradigm, and processed with spectraland cross-spectral analysis. Our results demonstrate that variability indices extracted fromfast PD oscillations, not observable through standard cardiorespiratory identification in thefrequency domain, would be able to discern psychophysiological responses elicited bybasic emotional stimuli. A strong linear coupling was found between the variables, due tothe influence of RESP on both PD and HRV within the High Frequency (HF) band, from0.15 to 0.45 Hz. Most importantly, our results point at PD features as possible candidatesfor characterizing basic emotional stimuli.
Keywords: pupil dilation (PD), heart rate variability (HRV), autonomic nervous system (ANS), emotions,
reconstruction, spectral analysis, very high frequencies, coherence analysis
1. INTRODUCTIONThe Autonomic Nervous System (ANS) primarily innervates thesmooth musculature of all organs, the heart and the glands,and mediates the neuronal regulation of the internal environ-ment to keep a proper balance, a process in general not underdirect voluntary control (Jänig, 1989). The existence of a rela-tion between psychophysiological states and ANS activity hasbeen widely documented (Ekman et al., 1983; Levenson et al.,1990; Collet et al., 1997; Christie and Friedman, 2004). On theother hand, Cacioppo et al. (2000) performed a meta-analysisof physiological responses to affective states and claimed thatthe scientific literature has presented inconclusive evidence-basedresults supporting the existence of specific patterns of periph-eral activity as effected by emotional stimuli. However, it hasbeen shown that ANS indices show specific activation during par-ticular emotional events, and negative emotions are in generalassociated with more evident bodily responses when comparedwith positive ones. More recently, Rainville et al. (2006) showedthat, under specific experimental conditions, it would be possi-ble to differentiate emotions. Moreover, Stephens et al. (2010)supported the hypothesis that patterns of autonomic correlates,rather than single measurements, would lead to more specificand discernible emotional responses. Although these findings
address a link between ANS and emotional events, it is still adebated question whether the ANS activity is driven by cogni-tive elaboration of the emotional event (James, 1894; Damasio,1994; Levenson, 2003) or vice versa (Cannon, 1927; Arnold,1960; Schachter and Singer, 1962). For a complete review ofthe recent contributions to the debate, see Lowe and Ziemke(2011).
The Sympathetic Nervous System (SNS) and theParasympathetic Nervous System (PNS) both innervate theheart (Berntson et al., 1997). The Electrocardiogram (ECG)is one of the most distinct and accessible signal related tothe heart function, widely used for psychophysiological pur-poses (Cacioppo et al., 2007). From the ECG is possible todefine the RR series, which is the series of the time intervalsof consecutive R-waves (Camm et al., 1996). The elicitedheartbeat variations of the RR series have been defined asHeart Rate Variability (HRV) and extensively studied in the lastdecades (Camm et al., 1996). An important element drivingHRV is Respiratory Sinus Arrhythmia (RSA). RSA is a naturalvariation in heart rate due to respiratory influences, mediatedby vagal cardiac nerve (Katona and Jih, 1975). RSA provides anindirect and non-invasive measure of parasympathetic cardiaccontrol, typically occurring in the High Frequency (HF) band
Frontiers in Neuroengineering www.frontiersin.org November 2013 | Volume 6 | Article 9 | 1
NEUROENGINEERING
Onorati et al. Pupil dynamics in affective states
in the frequency-domain transform of the RR series. SlowHRV oscillations in the Low Frequency (LF) band are influ-enced by both vagal and sympathetic activity (Berntson et al.,1997).
One of the most recent ANS correlate introduced in scientificliterature is Pupil Dilation (PD) (Beatty and Lucero-Wagoner,2000; Lanata et al., 2011). The pupillary response, whose neuralpathways are mediated by the ANS, is determined by the activityof two smooth iris muscles: PNS innervates the sphincter pupil-lae and controls the pupillary constriction, whereas SNS causesthe excitation of the dilator pupillae (Beatty and Lucero-Wagoner,2000). The major role of these muscles is to adjust the amount oflight allowed to enter the eye according to the surrounding illu-mination level, a phenomenon called Pupillary Light Reflex (Ellis,1981), the most widely studied and reported PD function. Onthe other hand, spontaneous pupillary fluctuations (SPF) occurin permanent lighting and eye fixation conditions as well. SPFrepresent a dynamical equilibrium modulated by autonomousand central nervous systems (Nowak et al., 2008), and have beenshown to reflect cognitive and affective processes (Andreassi,2000). Borgdorff (1975), after having performed experimentsin which he showed the existence of respiratory pupil fluctu-ations in cats, proposed a physiological model by which therespiratory and pressure signals influence PD dynamics. Differentpupillary responses were observed with respect to different cog-nitive stimuli (Steinhauer et al., 2004). Calcagnini et al. (2000),after having performed a cross-spectral analysis, reported thatbaroreceptor-sensitive fluctuations are visible in PD dynamicsduring a Head-Up Tilt test. The relation between PD dynamicsand psychophysiological states was pointed out first by Partalaand Surakka (2003) and subsequently by Bradley et al. (2008).Both these studies reported that variations of PD are related toautonomic activation during affective processing. However, PDfluctuations during emotional events have not been adequatelyexplored.
The aim of this study is to apply mathematical methods toprocess PD dynamics during an emotionally characterized pro-tocol in order to define descriptive statistical indices of PD andto explore their relation with ANS correlates such as HRV andrespiration (RESP). In addition, we verify if PD could pro-vide information in the evaluation of ANS responses during apsychophysiological affective protocol.
2. MATERIALS AND METHODS2.1. EXPERIMENTAL PROTOCOLPersonal feelings are proved to produce large responses in mea-surements based on self-reports or physiological features (Bond,1998; Mauri et al., 2010). The presented experimental protocolis inspired by previous works (Rainville et al., 2006; Mauri et al.,2012), in which a memory recall paradigm of emotionally charac-terized autobiographical episodes was successfully used to triggerthe physiological response of the ANS.
The target emotions were chosen within the classical discretecategorical model of emotions, according to which they are rep-resented as discernible but fuzzy bounded entities (Russell, 1980;Lang, 1995; Valenza et al., 2012). We selected promptly under-standable emotions to avoid to mislead the subjects. Moreover,
the arousal and valence1 values of the target emotions should havebeen as high as possible. Therefore, the target emotions consid-ered in this work are “Happiness,” “Sadness,” and “Anger.” Theyare compared with a reference event, i.e., a resting period termed“Baseline.”
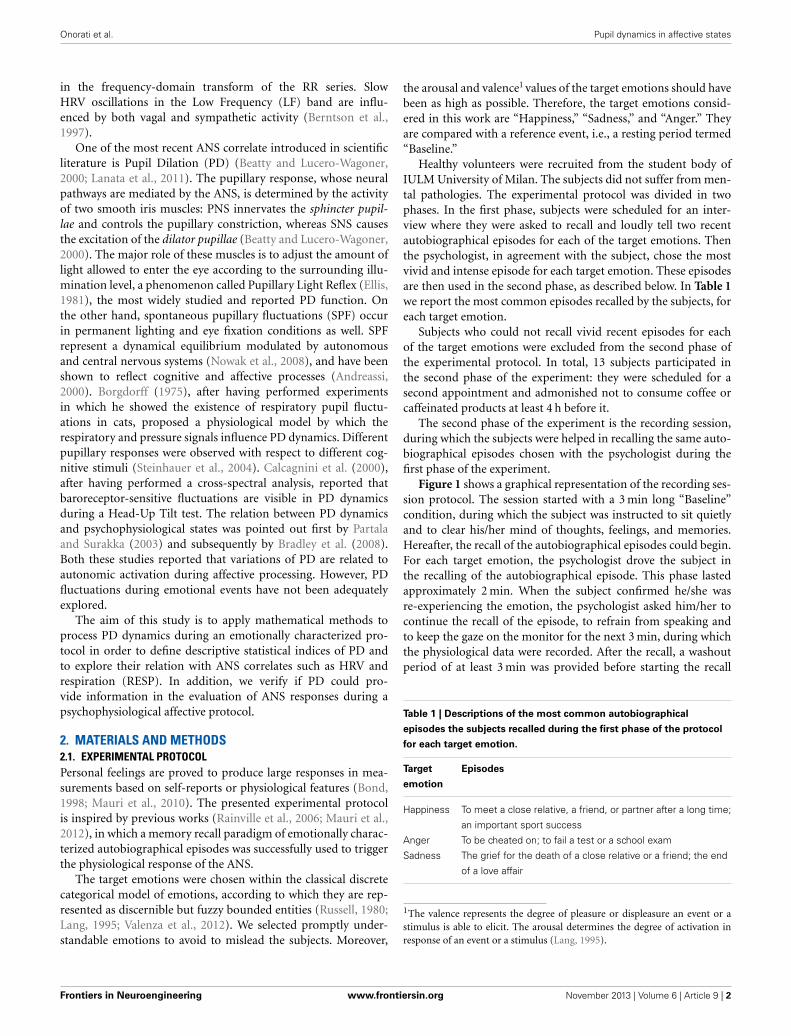
Healthy volunteers were recruited from the student body ofIULM University of Milan. The subjects did not suffer from men-tal pathologies. The experimental protocol was divided in twophases. In the first phase, subjects were scheduled for an inter-view where they were asked to recall and loudly tell two recentautobiographical episodes for each of the target emotions. Thenthe psychologist, in agreement with the subject, chose the mostvivid and intense episode for each target emotion. These episodesare then used in the second phase, as described below. In Table 1we report the most common episodes recalled by the subjects, foreach target emotion.
Subjects who could not recall vivid recent episodes for eachof the target emotions were excluded from the second phase ofthe experimental protocol. In total, 13 subjects participated inthe second phase of the experiment: they were scheduled for asecond appointment and admonished not to consume coffee orcaffeinated products at least 4 h before it.
The second phase of the experiment is the recording session,during which the subjects were helped in recalling the same auto-biographical episodes chosen with the psychologist during thefirst phase of the experiment.
Figure 1 shows a graphical representation of the recording ses-sion protocol. The session started with a 3 min long “Baseline”condition, during which the subject was instructed to sit quietlyand to clear his/her mind of thoughts, feelings, and memories.Hereafter, the recall of the autobiographical episodes could begin.For each target emotion, the psychologist drove the subject inthe recalling of the autobiographical episode. This phase lastedapproximately 2 min. When the subject confirmed he/she wasre-experiencing the emotion, the psychologist asked him/her tocontinue the recall of the episode, to refrain from speaking andto keep the gaze on the monitor for the next 3 min, during whichthe physiological data were recorded. After the recall, a washoutperiod of at least 3 min was provided before starting the recall
Table 1 | Descriptions of the most common autobiographical
episodes the subjects recalled during the first phase of the protocol
for each target emotion.
Target Episodes
emotion
Happiness To meet a close relative, a friend, or partner after a long time;
an important sport success
Anger To be cheated on; to fail a test or a school exam
Sadness The grief for the death of a close relative or a friend; the end
of a love affair
1The valence represents the degree of pleasure or displeasure an event or astimulus is able to elicit. The arousal determines the degree of activation inresponse of an event or a stimulus (Lang, 1995).
Frontiers in Neuroengineering www.frontiersin.org November 2013 | Volume 6 | Article 9 | 2

Onorati et al. Pupil dynamics in affective states
FIGURE 1 | A graphical representation of the protocol. After therecording of the “Baseline,” the recall of the first autobiographicalepisode could start. For about 2 min the subject was helped in recallingthe emotional even. Once he/she re-experienced the target emotion, a3 min long recording of physiological data was performed. Finally a
washout period of at least 3 min was provided before starting the recallof the next emotional episode. The same procedure was repeated foreach target emotion. The recording phases are indicated by redsegments, while the phases during which no recording was performedare indicated by gray dotted segments.
of the next emotional episode. During the washout period thesubject was asked to relax and to clear again his/her mind. Thesequence of the emotional episodes to recall was randomly sortedfor each subject.
2.2. PHYSIOLOGICAL MEASURESThe subjects were asked to sit in front of the SensoMotoricInstruments RED250™ Eye-tracker monitor provided by a colorgray screen at a fixed distance of 70 cm, in a room with con-stant illumination conditions. The PD signals were recorded ata sample frequency of 250 Hz; prior to start the “Baseline” andthe single emotion recalls, calibration of the eye-tracker wasperformed. For computation purposes, the signals were thenlow-passed and resampled at 50 Hz.
ECG and the RESP signals were recorded using a FlexcompInfinity™ encoder (Thought Technology Ltd.; Montreal, Canada)at a sampling rate of 2048 Hz, then resampled at 256 Hz. Relativechanges in thoracic expansion were measured using a band pro-vided with a tension-sensitive latex transducer; the thoracic bandwas placed over the upper part of the chest, individually adjustedto produce the maximal deflection during normal breathing; inthe pre-experimental phase the subject was asked to exhale andinhale in a sealed reservoir bag: this procedure was designedto calibrate the RESP signal and to cancel the effects of thedifferences due to the band positioning and to the different tho-racic expansions among the subjects. ECG was recorded usinga standard 3 leads montage (Einthoven lead 2 configuration)on the right and left forearms. R-waves were detected and cor-rected from ectopic beats with a specific detection and correctionprogram (Citi et al., 2012). Physiological data were not continu-ously recorded during the second phase of the experiment. Therecording epochs are highlighted in Figure 1.
2.3. PUPIL DILATION ANALYSISBefore performing the PD Analysis, a PD Reconstruction phasewas needed to fill the missing data due to eye-blinking events andartifacts, to obtain an evenly sampled signal. Eye-blinking eventswere automatically recognized by the eye-tracker and reviewedoffline to correct misdetection or missed events. A temporal win-dow from 100 ms before to 100 ms after each eye-blinking eventwas clipped from the data (Einhäuser et al., 2008), and a gap ofmissing data in the PD series was created. These missing segments
were then reconstructed before further computation. The recon-structed signal was then analyzed in both time and frequencydomain, to extract the characteristic features.
2.3.1. Pupil dilation reconstructionAn iterative method based on Singular Spectrum Analysis (SSA),called Iterative-SSA, was implemented to fill the gap generated ona PD signal by blink events (Sassi et al., 2009; Onorati et al., 2012).
The SSA is a powerful signal processing technique introducedby Broomhead and King (1986) to decompose the original seriesinto a sum of independent and interpretable components suchas slowly varying trend, oscillatory components and structurelessnoise. In summary, the algorithm embeds a one-dimensional timeseries x(tn) in a M-dimensional vector series.
Once the dimension M for the embedding is chosen, the M-lagcorrelation matrix Cx is computed from the time series x(tn) as
Cx = 1N−|i−j|
N−|i−j|∑n = 1
x(tn)x(tn +|i − j|) with 0 ≤ ∣∣i − j∣∣ < M .
(1)A singular value decomposition (SVD) is carried on Cx andhence the eigenvectors, or Empirical Orthogonal Functions(EOF), are obtained. The time-series x(tn) is projected ontothem, producing M principal components PC of length(N − M + 1).
PC(tn) =M∑
j = 1
x(tn + j)EOFl(j) with 0 ≤ n ≤ N − M , (2)
The original time series is expanded in an optimal way as the sumof its M reconstructed components RC(tn) (Vautard et al., 1992),defined as
RC(tn) = 1
M
M∑k = 1
PC(tn − k)EOF(k). (3)
The choice of M is a key problem. Since dynamics with peri-ods longer than M cannot be solved, the greater M, the longerare the time intervals that can be reconstructed. Moreover, thespectral resolution is limited to 1/M, which suggests the choice
Frontiers in Neuroengineering www.frontiersin.org November 2013 | Volume 6 | Article 9 | 3

Onorati et al. Pupil dynamics in affective states
of a M as large as possible. On the other hand, a M too largewould cause the splitting of a single component in two or morecomponents (Vautard et al., 1992) and increase computationalburden.
For the estimation of missing data of the time series,Schoellhamer (2001) and Sassi et al. (2009) suggested to set Mto the width of the gaps to be filled. Therefore M was set to themaximum width of the gap in the series (including not only eye-blinking events but also artifacts due to misalignment betweenpupil and sensor) which resulted of width Lgap = 3 s (on aver-age across subjects), that is M = fs · Lgap = 150, where fs is thesampling frequency.
Figure 2 shows an example of the reconstruction performedusing the Iterative-SSA algorithm.
2.3.2. Time domain analysisAs previous studies reported a spectral content for the PD signalup to 4–5 Hz (Nakayama and Shimizu, 2004), we low-passed andresampled the reconstructed PD signal at 10 Hz. Temporal aggre-gate statistical indices were computed: the mean value μ of thePD signal, its standard deviation σ and the coefficient of variationcv, i.e., the ratio between the standard deviation σ and mean μ.
2.3.3. Spectral analysisA parametric spectral analysis, via autoregressive (AR) modelcoefficients estimation was performed to compute the spectralcomponents. The order of the model was chosen according tothe Akaike Information Criterion (AIC) (Akaike, 1974) and aspectral decomposition procedure was applied to calculate eachcomponent of the the Power Spectral Density (PSD) of the sig-nal (Zetterberg, 1969). We referred to the standard measurementsof HRV generally used in both psychophysiological and clinicalsettings (Camm et al., 1996). The power of each PD rhythm was
FIGURE 2 | An example of the reconstruction of Pupil Dilation signal
with the Iterative-SSA algorithm for the subject “sbj15,” during
“Sadness”.
summed within the corresponding frequency bands, i.e., LF, from0.04 to 0.15 Hz, and HF, from 0.15 to 0.45 Hz (Camm et al.,1996). To explore the frequency contributions from 0.45 up to5 Hz, which we term as very high frequency (VHF), a high-passfilter was applied with a cutoff frequency at fc = 0.2 Hz, to elim-inate the dominant contributes from lower frequency content.Based on the observation of the PSD high frequency contents, weconsidered the following frequency bands: [0.45–1], [1–2.5], and[2.5–5] Hz, termed, respectively as VHF[0.45–1], VHF[1–2.5], andVHF[2.5–5]. Absolute powers were computed for each band.
2.3.4. Cross-spectral analysisGiven two time series x1(t) and x2(t) of length N, a systemdescribing their mutual interactions can be expressed in the formof a bivariate autoregressive (AR) model
X(t) = −p∑
k = 1
A(k)X(t − k) + w(t), (4)
where X(t) is the vector time series [x1(t) x2(t)], p is the order ofthe model, w(t) is a vector of white noises and A is the matrix ofthe AR coefficients, estimated along with the covariance matrix �
of the input noise
� =[
σ211 σ12
σ21 σ222
]. (5)
To compute w(t), A and � we used the Levinson–Wiggins–Robinson algorithm (Wiggins and Robinson, 1965; Barbieri et al.,2001) to solve the Yule–Walker equations. The order of thebivariate model was chosen according to the Akaike InformationCriterion (AIC) (Akaike, 1974).
Once the AR coefficients and the covariances are obtained, it ispossible to estimate the cross-spectral matrix S(f ) as
S(f ) = H � HH H(f ) = (I − A(f ))−1 . (6)
where the superscript H indicates Hermitian transpose and A(f )is the Fourier Transform of A(k).
Estimated the auto-spectra Sx1(f ) and Sx2(f ) and the cross-spectrum Sx1,x2(f ), it is possible to compute the Coherenceγ2(f ) as
γ2(f ) =∣∣Sx1,x2(f )
∣∣2
Sx1(f ) Sx2(f ), (7)
and the normalized squared Directed (Causal) Coherence(nDCji) from channel i to channel j as
nDC(f )ji =∣∣Hji(f )
∣∣2
Sjj(f ). (8)
Finally, according to a bivariate closed-loop model (Barbieri et al.,2001), the causal gains Gi→j are calculated as
G(f )i→j =∣∣∣∣ A(f )ji
1 − A(f )jj
∣∣∣∣ . (9)
Frontiers in Neuroengineering www.frontiersin.org November 2013 | Volume 6 | Article 9 | 4

Onorati et al. Pupil dynamics in affective states
PD signals were sampled at the occurrences of the R-waves.The Coherence functions γ2 between the signals were computedby Equations (6) and (7).
For assessing the significance zero level of the Coherence(and for nDC) a surrogate data analysis procedure was per-formed (Faes et al., 2004, 2009): N = 200 couples of surrogateseries (Schreiber and Schmitz, 2000) were generated from theoriginal series via an Unwindowed Fourier Transform (UFT)algorithm (Theiler et al., 1992); the aim of the UFT surrogateprocedure is to preserve the spectrum information of each timeseries, but to completely destroy the phase correlation betweenthem; the Coherence and the nDC were then computed betweeneach of the 200 pairs of surrogate series and the relative sam-pling distributions were obtained at each frequency; the zerothresholds γ2
θ and nDCji, θ were set at the 95th percentile at eachfrequency.
The corresponding value of causal gains are evaluated at thefrequency values of the peaks of nDC.
2.3.5. Statistical analysisWe computed all the above indices from segments long atleast 90 s for the available signals (PD, RR, RESP) during the“Baseline” condition and the three emotional events “Happiness,”“Anger” and “Sadness”. For each index and epoch, we performeda Lilliefors test (Lilliefors, 1967), to verify if the hypothesis ofnormality could not be rejected. We chose to perform non-parametric tests because of the low number of the subjects,and the presence of high variance and possible outliers on data,as obtained performing a Grubbs’ test (Grubbs, 1969). For theanalysis of variance we performed a Friedman test (Friedman,1937). As post-hoc analysis, we performed the Wilcoxon signedrank test (Wilcoxon, 1945), to test the differences between the“Baseline” and each emotional event. For the analysis of Gains,we used the Kruskall–Wallis one-way test. To offset the impactof multiple comparisons, a Bonferroni correction was applied tothe level of significance: as we were interested only in differencesbetween “Baseline” and the other psychophysiological conditions,and considering the level of significance for the whole family oftests αfamily = 0.05, the level of significance of each individual testis α = αfamily/n, where n = 3.
2.3.6. Discriminant analysisWe performed a discriminant analysis to test the ability of themost relevant indices to potentially distinguish “Baseline”fromthe emotionally characterized events. We computed true positiverate (TPR) and false positive rate (FPR) varying the discriminantthreshold. Statistical indices such as Sensitivity (Se = TPR) andSpecificity (Sp = 1-FPR) were then obtained.
3. RESULTS3.1. PRELIMINARY STATISTICS OF THE PUPIL DILATION SIGNALTable 2 shows the temporal PD indices obtained on the analyzedpopulation.
We observe a decrease of the overall variability during trigger-ing events. The reduction of σ, although not significant, occursduring emotional events regardless of mean pupil size μ, whichis possibly dependent on other causes, such as accommodation
or brightness level. As a consequence, the cv is higher for everyemotionally characterized events. However, Friedman test did notshow any inter-groups effect.
3.2. PD AND CARDIORESPIRATORY ANS CORRELATES3.2.1. Spectral analysisTable 3 reports the obtained data for cardiorespiratory indexes.
The Friedman test didn’t show any statistical significanceamong the psychophysiological conditions in the cardiorespira-tory features presented in Table 3. The trends of the consideredindices reveal a highest sympathetic activation (vagal withdrawal)for the emotional events: an increase in the LF component wasobserved simultaneously to a decrease in the HF component.Accordingly, an increase in the LF/HF ratio was observed.
PD spectral indices at both low frequencies (LF and HF)and high frequencies (VHF) are shown in Table 4 for all theexperimental conditions.
Notably, according to the Friedman test, there are significantinter-group differences due to the different experimental condi-tions for HFPD [F(3, 36) = 3.943, p-value < 0.05], VHF[0.45–1][F(3, 36) = 3.943, p-value < 0.05] and VHF[2.5–5] [F(3, 36) =3.457, p-value < 0.05] indices. Overall we can observe a decreasein total power, as well as in each frequency band, for all emotionalevents. As it is depicted in Figure 3, at VHF[2.5–5] this trend ismore marked, showing a highly significant difference (p-value <
0.016) between “Baseline” and “Anger”.Similarly, the absolute power in both LF and HF bands shows
a clear decrease. In particular, this decrease is statistically signifi-cant (p-value < 0.016) for “Anger” at HF. It can be noticed that thetrends of the PD power indices in normalized units show similarbehavior to their cardiac counterpart, as shown in Figure 4. Thereis an evident decrease in the HF power in normalized units and an
Table 2 | Mean values and standard deviations (mean ± standard
deviation) of temporal indices of PD.
Baseline Happiness Anger Sadness
μ 3.998 ± 0.397 3.981 ± 0.451 3.916 ± 0.498 3.990 ± 0.460
σ 0.282 ± 0.057 0.240 ± 0.051 0.237 ± 0.073 0.239 ± 0.070
cv 0.071 ± 0.015 0.061 ± 0.013 0.060 ± 0.017 0.060 ± 0.015
Table 3 | Mean values and standard deviations (mean ± standard
deviation) of cardiorespiratory indices.
Baseline Happiness Anger Sadness
RR
μRR 0.826 ± 0.115 0.811 ± 0.111 0.805 ± 0.121 0.797 ± 0.104
LF norm 0.453 ± 0.139 0.532 ± 0.250 0.588 ± 0.246 0.570 ± 0.185
HF norm 0.418 ± 0.203 0.352 ± 0.280 0.271 ± 0.248 0.260 ± 0.243
LF/HF 1.281 ± 0.556 4.550 ± 9.251 8.370 ± 14.070 5.775 ± 6.998
RESP
fRESP 0.271 ± 0.060 0.262 ± 0.093 0.267 ± 0.092 0.241 ± 0.110
σ2 0.012 ± 0.023 0.020 ± 0.038 0.020 ± 0.042 0.028 ± 0.059
HF% 0.765 ± 0.157 0.656 ± 0.281 0.752 ± 0.188 0.536 ± 0.278
Frontiers in Neuroengineering www.frontiersin.org November 2013 | Volume 6 | Article 9 | 5

Onorati et al. Pupil dynamics in affective states
Table 4 | Mean values and standard errors for all the different spectral indices of the PD.
PD Baseline Happiness Anger Sadness
LFPD 0.030 ± 0.023 0.023 ± 0.017 0.026 ± 0.026 0.019 ± 0.013
LFPD norm 0.467 ± 0.189 0.465 ± 0.148 0.490 ± 0.213 0.459 ± 0.161
HFPD 0.016 ± 0.010 0.012 ± 0.007 0.010 ± 0.007* 0.010 ± 0.007†
HFPD norm 0.313 ± 0.223 0.319 ± 0.214 0.216 ± 0.075 0.275 ± 0.160
LF/HFPD 2.268 ± 1.677 2.851 ± 3.336 3.019 ± 3.486 2.400 ± 2.141
VHF[0.45–1](*10−2) 0.464 ± 0.192 0.486 ± 0.378 0.374 ± 0.260 0.425 ± 0.293
VHF[1–2.5](*10−2) 0.204 ± 0.115 0.204 ± 0.204 0.158 ± 0.137 0.208 ± 0.182
VHF[2.5–5](*10−3) 0.484 ± 0.174 0.442 ± 0.190 0.348 ± 0.212† 0.409 ± 0.214
A asterisk (*) indicates a p-value < 0.05, while a dagger (†) indicates a p-value < 0.016. Statistically significant differences were bold typed.
FIGURE 3 | Means and standard errors of VHF[2.5–5].
FIGURE 4 | Mean values and standard errors of the HF power (left)
LF/HF ratio (right) for both PD (plots at the top, in blue) and HRV
(plots at the bottom, in red).
increase of the LF/HF ratio during the emotional events, partic-ularly during “Anger,” although there is no significant differenceamong these PD indices.
3.2.2. Coherence analysisAn example of Coherence analysis between PD, RR intervals andRESP is presented in Figure 5. The analysis between PD and the
RR signal is shown on the left, while the analysis between PD andRESP is on the right.
In Table 5 the Coherence computed at the considered fre-quency bands is reported for each experimental condition, alongwith the number of subjects showing Coherence above threshold.For the Coherence between PD and the RR signal we consideredtwo frequency bands, i.e., LF and HF; for the Coherence betweenPD and RESP, only the HF band was taken into account.
As an overall results, it is possible to see that during “Baseline”the average Coherence shows higher values at HF and lower val-ues at LF. The Coherence analysis between PD and the RR signalshows on average 4 Coherences above threshold in the LF bandout of 13 subjects. In the HF band we reported 10 subjects out of13 showing a Coherence above threshold during “Sadness,” and 9subjects out of 13 during “Happiness” and “Anger”. For “Baseline”we found an above threshold Coherence in the HF band for 4 sub-jects out of 13, even though the average Coherence is higher thanthe other conditions: this result might be due to the method usedto assess the significance zero level, which in some cases seemsto be too conservative. In the analysis between PD and RESP, ahigher Coherence has been reported (10 out of 13 above thresh-old for “Baseline,” “Anger,” and “Sadness,” and 9 out of 13 for“Happiness”).
We computed also the nDC and the Gain of the related transferfunctions. A graphical representation of the performed analysis isin Figure 6 while numerical results are presented in Table 6.
Only GRESP→PD shows significant differences [F(3, 36) = 4.9,
p-value < 0.05] within groups. The post-hoc analysis reveals sig-nificant differences between “Baseline” and “Happiness” (p-value< 0.016). This index is the only bivariate index showing high sig-nificance for the experimental conditions of our protocol, andit’s the only one which distinguishes emotional states with anopposite connotation. The results of the analysis between PD andthe RR signal indicate weak coupling. At LF the rate of subjectsshowing nDC above threshold for both the transfer functions waslow and in some conditions none of the subjects showed abovethreshold nDC (results not shown). At HF no clear directional-ity in the linear coupling can be stated: nDC is above thresholdon average for the same number of subjects for both the trans-fer functions. As expected, in the analysis for PD and RESP, ahigher number of subjects shows nDCRESP→PD above threshold.Moreover, GRESP→PD shows an interesting trend in Figure 7: oncecompared with GRR→RESP, GRESP→PD shows higher values during
Frontiers in Neuroengineering www.frontiersin.org November 2013 | Volume 6 | Article 9 | 6

Onorati et al. Pupil dynamics in affective states
FIGURE 5 | Coherence analysis for PD and RR signal for the
subject “sbj05,” during “Anger” event (left), and coherence
analysis for PD and RESP for the subject “sbj15,” during
“Happiness” event (right). On the first row, the PSD of RR (left)
and RESP (right) are depicted; on the second row, the PSDs of thePD for the two analysis are shown; on the third row, the plots showthe Coherence between RR series and PD (left), and the Coherencebetween RESP signal and PD (right).
Table 5 | Mean values and standard errors of Coherence and number of subjects showing Coherence above statistical threshold.
γ̄2 (s.d.) Nθ/N Baseline Happiness Anger Sadness
RR-PD, LF 0.502 ± 0.157 0.559 ± 0.225 0.547 ± 0.172 0.491 ± 0.213
3/13 4/13 5/13 4/13
RR-PD, HF 0.647 ± 0.136 0.574 ± 0.133 0.625 ± 0.129 0.612 ± 0.124
4/13 9/13 9/13 10/13
RESP-PD 0.688 ± 0.128 0.605 ± 0.146 0.617 ± 0.174 0.636 ± 0.192
10/13 9/13 10/13 10/13
RR-RESP 0.888 ± 0.145 0.858 ± 0.113 0.774 ± 0.217 0.860 ± 0.083
12/12 4/12 5/13 13/13
We indicated with γ̄ 2 the mean value of the Coherences; with s.d. the standard deviation of the Coherences; with Nθ /N the rate of the subjects showing Coherence
above statistical threshold.
“Happiness” with respect to the other conditions, in particular to“Anger” and “Sadness”.
We noticed that HFPD and GRESP→PD cluster and separatethe different experimental conditions (see Figure 8). While HFPD
shows a correlation with general activation, GRESP→PD decreasesat negative events and increases at the positive one: this finding iskey for a prospective classification of different emotional events.A two-dimensional plot of the means and the standard errorsof HFPD and GRESP→PD is shown in Figure 8, representing theexperimental conditions considered in our protocol.
3.3. DISCRIMINANT ANALYSISIn accordance to the results just presented, we chose the indiceswith highest statistical power. In Table 7 Se and Sp of the discrim-inant analysis are reported. The chosen indices were HF power innormalized units and LF/HF ratio for RR signal, and HF absolute
power, VHF[2.5–5] and GRESP→PD for PD. Also a linear com-bination of the PD indices, whose weights were obtained by aPrincipal Component Analysis (PCA), was included in the anal-ysis: this feature obtained overall good performances, mostly interm of Sensitivity. This result suggests that including PD indicesin emotionally characterized or stressful contexts might help todistinguish arousing events from resting conditions.
4. DISCUSSIONThis work focuses on mathematical methods for PD signal pro-cessing aimed at estimating novel markers of autonomic activityand investigates PD dynamic changes during a psychophysiolog-ical study, in particular during emotionally characterized eventscompared with a general relaxation/deactivation condition. Theanalysis was performed through the following multiple steps: (1)we implemented an ad hoc reconstruction of the signal to recover
Frontiers in Neuroengineering www.frontiersin.org November 2013 | Volume 6 | Article 9 | 7

Onorati et al. Pupil dynamics in affective states
FIGURE 6 | nDC analysis between RESP and PD for the subject
“sbj11,” during “Baseline” event. The Coherence between RESPand PD is depicted on the top; in the middle we have thenormalized direct Coherence considered from PD to RESP, i.e.,
nDCPD→RESP (left), and the normalized direct Coherence consideredfrom RESP to PD, i.e., nDCRESP→PD (right); in the bottom the plotsshow the Gains for the respective transfer function, i.e., GPD→RESP
(right) and GRESP→PD (left).
Table 6 | Mean values and standard errors of the nDC and the Gain of the transfer function, and the number of subjects showing nDC above
statistical threshold.
nDCi→j (s.d.) Gi→j Nθ/N Baseline Happiness Anger Sadness
RR → PD, HF 0.797 ± 0.054 0.623 ± 0.065 0.722 ± 0.121 0.646 ± 0.103
1.496 6/13 2.366 7/13 1.498 5/13 1.942 8/13
PD→RR, HF 0.685 ± 0.139 0.614 ± 0,180 0.706 ± 0.090 0.711 ± 0.146
0.171 6/13 0.124 7/13 0.374 6/13 0.193 6/13
RESP→PD 0.756 ± 0.143 0.626 ± 0.167 0.662 ± 0.168 0.657 ± 0.145
0.780 10/13 1.398† 9/13 0.735 9/13 0.612 8/13
RESP→RR 0.927 ± 0.071 0.879 ± 0.101 0.841 ± 0.201 0.904 ± 0.082
0.434 13/13 0.365 13/13 0.305 12/13 0.351 13/13
Statistically significant differences were bold typed.
A dagger (†) indicates a p-value < 0.016.
We indicated with nDCi→j the mean value of the normalized Directed Coherence; with s.d. the standard deviation of nDC; with Gi→j the Gain of the transfer function
from i to j; with Nθ /N the rate of the subjects showing nDC above threshold.
as much information as possible during the blinking events, awell-known limitation in the analysis of PD; (2) we explored PDinformation content through classical statistical indices; (3) weperformed a spectral analysis of the signal, comparing the resultswith respect some classic autonomic indices from RR signal andRespiratory signal; (4) we conducted a preliminary spectral anal-ysis at higher frequencies, from 0.45 to 5 Hz; (5) we performed
a Coherence analysis to explore the mutual influences of PD, RRsignal and RESP during autonomic control.
The first step was to provide an algorithm for the recon-struction of the PD signal during blinking events and move-ment artifacts. The adopted procedure allowed to analyze PDat high frequencies, hence exploring the information carried byfast oscillations, and to improve the analysis of the signal at
Frontiers in Neuroengineering www.frontiersin.org November 2013 | Volume 6 | Article 9 | 8

Onorati et al. Pupil dynamics in affective states
FIGURE 7 | Mean values and standard errors of GResp→PD (at the top, in
blue) and of GRESP→RR (at the bottom, in red).
FIGURE 8 | Means and standard errors of HFPD and GRESP→PD for all
the experimental conditions. We have in gray “Baseline,” in yellow“Happiness,” in red “Anger” and in blue “Sadness”.
Table 7 | Sensitivity (Se = TPR) and Specificity (Sp = 1-FPR) of each
feature when comparing “Baseline” (B) with respectively
“Happiness” (H), “Anger” (A) and “Sadness” (S).
Se, Sp B-H B-A B-S
HFHRV norm 0.538, 0.923 0.615, 0.846 0.769, 0.692
LF/HFHRV 0.308, 0.846 0.385, 0.387 0.077, 1.000
HFPD 0.461, 0.692 0.615, 0.769 0.538, 0.846
VHF[2.5–5] 0.769, 0.461 0.615, 0.769 0.615, 0.615
GRESP→PD 0.461, 0.385 0.615, 0.615 0.692, 0.385
Lin. Comb. PD 0.769, 0.538 0.769, 0.692 0.692, 0.615
low frequencies, providing an estimation of the missing data asclose as possible to the underlying dynamics of the observabledata. From the reconstructed signals we computed time domainaggregate features. We observed an overall decrease in variability
during triggering events. Although it was not sufficient to sig-nificantly distinguish emotional conditions from “Baseline,” thistrend is in agreement with a common behavior of other physio-logical signals during psychophysiological events (Caldirola et al.,2004; Rainville et al., 2006).
As firstly hypothesized by Borgdorff (1975) and then sup-ported in successive studies (Yoshida et al., 1994; Calcagnini et al.,2000), ANS modulation of PD dynamics is reflected in oscillationsclassically referred to the autonomic control of cardiorespira-tory activity. Moreover, these oscillations could be linearly andmutually coupled to cardiorespiratory signals, which in turn arerelated to ANS dynamics. The autonomic control on the pupil-lary system might be driven by similar autonomic pathways thatmodulate heartbeat dynamics, but this does not exclude that thecardiorespiratory activity itself might be reflected on PD andmight influence PD dynamics, either strengthening or inhibitingthe more direct ANS influence on PD.
In this work we therefore explored the spectral components ofPD in frequency ranges classically related to the ANS control ofcardiorespiratory activity, i.e., LF and HF, computing widespreadfeatures. The observed trends of PD and RR series features con-firm similar aggregate behavior for PD and RR signal. Thesepatterns reflects similar autonomic modulation at HRV frequencybands for both pupillary and cardiovascular systems during emo-tional triggering events. The analysis of Coherence clarifies thenature of this behavior.
The results of Coherence analysis support the idea of a cou-pling between PD and cardiorespiratory activity, mostly for therespiratory influence on PD. In particular, results regarding theCoherence in the HF band are consistent with previous find-ings (Calcagnini et al., 2000) both in terms of Coherence valuesand rate of Coherence values above statistical threshold, and con-firm the hypothesis that a rhythmic impulse coming from the res-piratory centers drives fluctuations in a wide range of organs, andamong them the pupillary system (Borgdorff, 1975). This hypoth-esis is further confirmed by high values of nDCRESP→PD and ahigh number of subject showing nDCRESP→PD above threshold.We were not able to establish a specific directionality in the cou-pling between PD and RR in the HF band. On the other hand, forRESP and PD the overall value of Coherence and nDC indicatethat there is a relevant linear coupling, and that a similar auto-nomic modulation is driven by respiratory rhythms on both PDand HRV. These results, along with the results from the spectralanalysis, support the hypothesis that there is a direct influenceof RESP to PD. The nature of this connection might be differ-ent from the coupling between RESP and HRV directly affectingdifferent autonomic pathways.
The low value of Coherence and nDC, as well as the uncleardirectionality between HRV and PD at LF could be explained bydifferent hypotheses. Although a large part of the power contentof PD is at low frequencies, these dynamics might not reflect auto-nomic control on the pupillary system, or at least an autonomicresponse to particular triggering events such as emotionally char-acterized events. Moreover, these dynamics show a weak linearcoupling with HRV LF rhythms, as suggested by Calcagnini et al.(2000). A second hypothesis is that in these particular experimen-tal conditions the sympathetic system is not stressed enough to
Frontiers in Neuroengineering www.frontiersin.org November 2013 | Volume 6 | Article 9 | 9

Onorati et al. Pupil dynamics in affective states
evoke a clear and visible response. A further hypothesis to takeinto account is that the presence of other sources of fluctuations,such as hippus and accommodation (Charman and Heron, 2007),which could overlap in the LF band, may have created distortionphenomena difficult to quantify and eliminate.
As further outcome, we explored PD dynamics at higher fre-quencies (from 0.45 to 5 Hz). These oscillations have trendscomparable to those in PD total variance and HF power. Thehighly significant differences between “Baseline” and “Anger” andthe similar behavior of the signal at higher frequencies supportthe hypothesis of a direct central autonomic control on PD, whichreflects also the response of the ANS to emotional triggeringevents. The HFPD and VHFPD components provides character-izing features, which might lead to propose PD-based markers instressful, emotional or arousing events. For this reason, it wouldbe interesting to explore more deeply the role of the central auto-nomic network as reflecting in PD responses during emotionalevents.
In addition, to deepen the classification prospect of PD fea-tures might improve nowaday classification performances andcandidate PD as a new important signal in recognition and clas-sification of emotional conditions in different research fields. Inparticular, the possibility to evaluate affective states from PDmight lead to interesting developments for communication appli-cations: as a contactless autonomic correlate, PD could cover a
major role in the detection of arousing events elicited by audio-visual contents.
The results of our analysis show that the differences betweenthe experimental conditions were reflected on PD indices andconfirmed by the level of sensitivity and specificity of these indicesin distinguishing a baseline state from the emotional events. Forthis reason, classification performances of these new indices needto be explored in future works. The influence of RESP to PDand the weak or absent linear coupling between HRV and PDin the LF band are other relevant outcomes of this work andconfirm the findings previously reported in the literature. Animportant advance would be to evaluate the effect of known andcontrolled ANS changes on RR intervals, RESP and PD cou-pling. Importantly, GRESP→PD seems to be related to the valenceof the emotion, although further confirmations are required. Inaddition, VHF[2.5–5] results might indicate that the ANS modu-lates PD at higher frequencies, and that these oscillations mightbe a reflection of central autonomic activity directly influenc-ing PD. Exploring and studying in depth higher frequencies ofPD, as well as its very LF oscillations such as hippus, is anotherfuture developments of this work. Some other major future direc-tions include the study of non-linearity and non-stationarity ofPD, possibly estimating time varying monovariate and multi-variate indices through stochastic modeling of the signal (e.g.,multivariate point-process models).
REFERENCESAkaike, H. (1974). A new look
at the statistical model identi-fication. IEEE Trans. Autom.Control 19, 716–723. doi:10.1109/TAC.1974.1100705
Andreassi, J. L. (2000). “PupillaryResponse and Behavior”, inPsychophysiology: human behav-ior & physiological response,4th edn, (Mahwah, NJ:Lawrence Erlbaum Association),218–233.
Arnold, M. B. (1960). Emotionand Personality. New York, NY:Columbia University Press.
Barbieri, R., Parati, G., and Saul, J. P.(2001). Closed-versus open-loopassessment of heart rate baroreflex.Eng. Med. Biol. Mag. IEEE 20, 33–42.doi: 10.1109/51.917722
Beatty, J., and Lucero-Wagoner, B.(2000). “The pupillary system,”in Handbook of Psychophysiology.2nd Edn., eds J. T. Cacioppo,L. J. Tassinary, and G. G. Berntson(Cambridge: Cambridge UniversityPress), 142–162.
Berntson, G. G., Bigger, J. T., Eckberg,D. L., Grossman, P., Kaufmann,P. G., Malik, M., et al. (1997).Heart rate variability: ori-gins, methods, and interpretivecaveats. Psychophysiology 34,623–648. doi: 10.1111/j.1469-8986.1997.tb02140.x
Bond, C. V. A. (1998). Personalrelevance is an importantdimension for visceral reac-tivity in emotional imagery.Cogn. Emotion 12, 231–242. doi:10.1080/026999398379736
Borgdorff, P. (1975). Respiratory fluc-tuations in pupil size. Am. J. Physiol.Legacy Content 228, 1094–1102.
Bradley, M., Miccoli, L., Escrig, M., andLang, P. (2008). The pupil as a mea-sure of emotional arousal and auto-nomic activation. Psychophysiology45, 602–607. doi: 10.1111/j.1469-8986.2008.00654.x
Broomhead, D., and King, G. (1986).Extracting qualitative dynam-ics from experimental data.Physica D 20, 217–236. doi:10.1016/0167-2789(86)90031-X
Cacioppo, J. T., Berntson, G. G., Larsen,J. T., Poehlmann, K. M., and Ito,T. A. (2000). “The psychophysi-ology of emotion,” in Handbookof Psychophysiology. 2nd Edn., edsR. Lewis and J. M. Haviland-Jones(New York, NY: Guilford Press),173–191.
Cacioppo, J. T., Tassinary, L. G., andBerntson, G. G. (2007). Handbookof Psychophysiology. Cambridge:Cambridge University Press. doi:10.1017/CBO9780511546396
Calcagnini, G., Censi, F., Lino,S., and Cerutti, S. (2000).Spontaneous fluctuations of
human pupil reflect central auto-nomic rhythms. Methods Inf. Med.39, 142–145. Available online at:http://www.schattauer.de/t3page/1214.html?manuscript=31
Caldirola, D., Bellodi, L., Caumo,A., Migliarese, G., and Perna, G.(2004). Approximate entropyof respiratory patterns in panicdisorder. Am. J. Psychiatr. 161,79–87. doi: 10.1176/appi.ajp.161.1.79
Camm, A., Malik, M., Bigger, J.,Breithardt, G., Cerutti, S., Cohen,R., et al. (1996). Heart ratevariability: standards of measure-ment, physiological interpretationand clinical use. task force ofthe european society of cardi-ology and the north americansociety of pacing and elec-trophysiology. Circulation 93,1043–1065. doi: 10.1161/01.CIR.93.5.1043
Cannon, W. B. (1927). The james-lange theory of emotions: a criticalexamination and an alternative the-ory. Am. J. Psychol. 39, 106–124. doi:10.2307/1415404
Charman, W. N., and Heron, G. (2007).Fluctuations in accommodation: areview. Ophthal. Physiol. Opt.8, 153–164. doi: 10.1111/j.1475-1313.1988.tb01031.x
Christie, I. C., and Friedman,B. H. (2004). Autonomic
specificity of discrete emotionand dimensions of affectivespace: a multivariate approach.Int. J. Psychophysiol. 51,143–153. doi: 10.1016/j.ijpsycho.2003.08.002
Citi, L., Brown, E. N., and Barbieri,R. (2012). A real-time auto-mated point-process method forthe detection and correction oferroneous and ectopic heartbeats.IEEE Trans. Biomed. Eng. 59,2828–2837. doi: 10.1109/TBME.2012.2211356
Collet, C., Vernet-Maury, E.,Delhomme, G., and Dittmar,A. (1997). Autonomic ner-vous system response patternsspecificity to basic emotions. J.Auton. Nerv. Syst. 62, 45–57. doi:10.1016/S0165-1838(96)00108-7
Damasio, A. (1994). Descartes’Error: Emotion, Reason and theHuman Mind. New York, NY:Grossett/Putnam.
Einhäuser, W., Stout, J., Koch, C., andCarter, O. (2008). Pupil dila-tion reflects perceptual selectionand predicts subsequent stability inperceptual rivalry. Proc. Natl. Acad.Sci. U.S.A. 105, 1704. doi: 10.1073/pnas.0707727105
Ekman, P., Levenson, R. W., andFriesen, W. V. (1983). Autonomicnervous system activity dis-tinguishes among emotions.
Frontiers in Neuroengineering www.frontiersin.org November 2013 | Volume 6 | Article 9 | 10

Onorati et al. Pupil dynamics in affective states
Science 221, 1208–1210. doi:10.1126/science.6612338
Ellis, C. J. (1981). The pupillarylight reflex in normal subjects. Br.J. Ophthalmol. 65, 754–759. doi:10.1136/bjo.65.11.754
Faes, L., Pinna, G. D., Porta, A.,Maestri, R., and Nollo, G. (2004).Surrogate data analysis for assessingthe significance of the coher-ence function. IEEE Trans.Biomed. Eng. 51, 1156–1166. doi:10.1109/TBME.2004.827271
Faes, L., Porta, A., and Nollo, G.(2009). “Surrogate data approachesto assess the significance ofdirected coherence: applicationto EEG activity propagation,”in Engineering in Medicine andBiology Society, 2009. EMBC 2009.Annual International Conferenceof the IEEE (Minneapolis,MN: IEEE), 6280–6283. doi:10.1109/IEMBS.2009.5332477
Friedman, M. (1937). The useof ranks to avoid the assump-tion of normality implicit inthe analysis of variance. J. Am.Stat. Assoc. 32, 675–701. doi:10.1080/01621459.1937.10503522
Grubbs, F. (1969). Procedures fordetecting outlying observationsin samples. Technometrics 11,1–21. doi: 10.1080/00401706.1969.10490657
James, W. (1894). The physical basis ofemotion. Psychol. Rev. 1, 516.
Jänig, W. (1989). “Autonomic nervoussystem,” in Human Physiology, edsR. F. Schmidt and G. Thews (Berlin:Springer), 333–370.
Katona, P. G., and Jih, F. (1975).Respiratory sinus arrhythmia: non-invasive measure of parasympa-thetic cardiac control. J. Appl.Physiol. 39, 801–805.
Lanata, A., Armato, A., Valenza, G.,and Scilingo, E. P. (2011). “Eyetracking and pupil size variationas response to affective stimuli:a preliminary study,” in 20115th International Conference onPervasive Computing Technologiesfor Healthcare (PervasiveHealth)(Dublin: IEEE), 78–84.
Lang, P. J. (1995). The emotionprobe. Am. Psychol. 50, 372–385.doi: 10.1037/0003-066X.50.5.372
Levenson, R. W. (2003). “Autonomicspecificity and emotion,” inHandbook of Affective Sciences, eds
R. J. Davidson, K. R. Scherer, andH. Goldsmith (Oxford: OxfordUniversity Press), 212–224.
Levenson, R. W., Ekman, P., andFriesen, W. V. (1990). Voluntaryfacial action generates emotion-specific autonomic nervous sys-tem activity. Psychophysiology27, 363–384. doi: 10.1111/j.1469-8986.1990.tb02330.x
Lilliefors, H. (1967). On thekolmogorov-smirnov test fornormality with mean andvariance unknown. J. Am.Stat. Assoc. 62, 399–402. doi:10.1080/01621459.1967.10482916
Lowe, R., and Ziemke, T. (2011).The feeling of action ten-dencies: on the emotionalregulation of goal-directed behav-ior. Front. Psychol. 2:346. doi:10.3389/fpsyg.2011.00346
Mauri, M., Magagnin, V., Cipresso,P., Mainardi, L. T., Brown,E. N., Cerutti, S., et al. (2010).“Psychophysiological signalsassociated with affective states,”in Engineering in Medicine andBiology Society (EMBC), 2010Annual International Conferenceof the IEEE (Buenos Aires: IEEE),3563–3566. doi: 10.1109/IEMBS.2010.5627465
Mauri, M., Onorati, F., Russo, V.,Mainardi, L., and Barbieri, R.(2012). Psychophysiologicalassessment of emotions. Int.J. Bioelectromagn. 14, 133–140.Available online at: http://www.ijbem.org/volume14/number3/ijbem_vol14_no3_pp133-140.pdf
Nakayama, M., and Shimizu, Y.(2004). “Frequency analysis oftask evoked pupillary response andeye-movement,” in Proceedings ofthe 2004 Symposium on Eye TrackingResearch & Applications (New York,NY: ACM), 71–76.
Nowak, W., Hachol, A., and Kasprzak,H. (2008). Time-frequencyanalysis of spontaneous fluc-tuation of the pupil size ofthe human eye. Opt. Appl. 38,469–480. Available online at: http://www.if.pwr.wroc.pl/∼optappl/pdf/2008/no2/optappl_3802p469.pdf
Onorati, F., Mauri, M., Russo,V., and Mainardi, L. (2012).“Reconstruction of pupil dila-tion signal during eye blinkingevents,” in Proceeding of the 7th
International Workshop on BiosignalInterpretation, (Como), 117–120.
Partala, T., and Surakka, V. (2003).Pupil size variation as an indi-cation of affective processing.Int. J. Hum. Comput. Stud. 59,185–198. doi: 10.1016/S1071-5819(03)00017-X
Rainville, P., Bechara, A., Naqvi, N.,and Damasio, A. (2006). Basicemotions are associated with dis-tinct patterns of cardiorespiratoryactivity. Int. J. Psychophysiol.61, 5–18. doi: 10.1016/j.ijpsycho.2005.10.024
Russell, J. A. (1980). A circumplexmodel of affect. J. Pers. Soc. Psychol.39, 1161. doi: 10.1037/h0077714
Sassi, R., Corino, V., and Mainardi, L.(2009). Analysis of surface atrial sig-nals: time series with missing data?Ann. Biomed. Eng. 37, 2082–2092.doi: 10.1007/s10439-009-9757-3
Schachter, S., and Singer, J. (1962).Cognitive, social, and physiologi-cal determinants of emotional state.Psychol. Rev. 69, 379. doi:10.1037/h0046234
Schoellhamer, D. (2001). Singularspectrum analysis for time serieswith missing data. Geophys.Res. Lett. 28, 3187–3190. doi:10.1029/2000GL012698
Schreiber, T., and Schmitz, A. (2000).Surrogate time series. Physica D142, 346–382. doi: 10.1016/S0167-2789(00)00043-9
Steinhauer, S., Siegle, G., Condray, R.,and Pless, M. (2004). Sympatheticand parasympathetic innerva-tion of pupillary dilation duringsustained processing. Int. J.Psychophysiol. 52, 77–86. doi:10.1016/j.ijpsycho.2003.12.005
Stephens, C. L., Christie, I. C.,and Friedman, B. H. (2010).Autonomic specificity of basicemotions: evidence from patternclassification and cluster analysis.Biol. Psychol. 84, 463–473. doi:10.1016/j.biopsycho.2010.03.014
Theiler, J., Eubank, S., Longtin, A.,Galdrikian, B., and Farmer, J. D.(1992). Testing for nonlinearity intime series: the method of surro-gate data. Physica D 58, 77–94. doi:10.1016/0167-2789(92)90102-S
Valenza, G., Lanata, A., and Scilingo,E. P. (2012). The role of nonlineardynamics in affective valence andarousal recognition. IEEE Trans.
Affect. Comput. 3, 237–249. doi:10.1109/T-AFFC.2011.30
Vautard, R., Yiou, P., and Ghil, M.(1992). Singular-spectrum analysis:a toolkit for short, noisy chaotic sig-nals. Physica D 58, 95–126. doi:10.1016/0167-2789(92)90103-T
Wiggins, R. A., and Robinson, E. A.(1965). Recursive solution to themultichannel filtering problem. J.Geophys. Res. 70, 1885–1891. doi:10.1029/JZ070i008p01885
Wilcoxon, F. (1945). Individualcomparisons by ranking methods.Biometrics Bull. 1, 80–83. doi:10.2307/3001968
Yoshida, H., Yana, K., Okuyama, F., andTokoro, T. (1994). Time-varyingproperties of respiratory fluctua-tions in pupil diameter of humaneyes. Methods Inf. Med. 33, 46–46.
Zetterberg, L. (1969). Estimation ofparameters for a linear differenceequation with application to eeganalysis. Math. Biosci. 5, 227–275.doi: 10.1016/0025-5564(69)90044-3
Conflict of Interest Statement: Theauthors declare that the researchwas conducted in the absence of anycommercial or financial relationshipsthat could be construed as a potentialconflict of interest.
Received: 09 May 2013; accepted: 07October 2013; published online: 06November 2013.Citation: Onorati F, Barbieri R, MauriM, Russo V and Mainardi L (2013)Characterization of affective states bypupillary dynamics and autonomiccorrelates. Front. Neuroeng. 6:9. doi:10.3389/fneng.2013.00009This article was submitted to the journalFrontiers in Neuroengineering.Copyright © 2013 Onorati, Barbieri,Mauri, Russo and Mainardi. Thisis an open-access article distributedunder the terms of the CreativeCommons Attribution License (CC BY).The use, distribution or reproduc-tion in other forums is permitted,provided the original author(s) orlicensor are credited and that theoriginal publication in this journalis cited, in accordance with acceptedacademic practice. No use, distributionor reproduction is permitted which doesnot comply with these terms.
Frontiers in Neuroengineering www.frontiersin.org November 2013 | Volume 6 | Article 9 | 11
Copyright © 2022 FDOKUMEN