Brain potentials in affective picture processing: covariation with autonomic arousal and affective...
17
Biological Psychology 52 (2000) 95 – 111 Brain potentials in affective picture processing: covariation with autonomic arousal and affective report Bruce N. Cuthbert 1 , Harald T. Schupp 2 , Margaret M. Bradley, Niels Birbaumer 3 , Peter J. Lang * NIMH Center for the Study of Emotion and Attention (CSEA), Uni6ersity of Florida, Box 100165 HSC, Gaines6ille, FL 32610 -0165, USA Received 13 August 1998; received in revised form 19 November 1999; accepted 19 November 1999 Abstract Emotionally arousing picture stimuli evoked scalp-recorded event-related potentials. A late, slow positive voltage change was observed, which was significantly larger for affective than neutral stimuli. This positive shift began 200 – 300 ms after picture onset, reached its maximum amplitude :1 s after picture onset, and was sustained for most of a 6-s picture presentation period. The positive increase was not related to local probability of content type, but was accentuated for pictures that prompted increased autonomic responses and reports of greater affective arousal (e.g. erotic or violent content). These results suggest that the late positive wave indicates a selective processing of emotional stimuli, reflecting the activation of motivational systems in the brain. © 2000 Elsevier Science B.V. All rights reserved. Keywords: Emotion; Attention; Arousal; Event-related potentials; Slow potentials www.elsevier.com/locate/biopsycho Part of this data was presented at the 35th Meeting of the Society for Psychophysiological Research, Toronto, Canada (see Cuthbert et al. (1995), abstract). * Corresponding author. E-mail address: [email protected]fl.edu (P.J. Lang) 1 Present address: National Institute of Mental Health, Rockville, MD, USA. 2 Present address: University of Greifswald, Germany. 3 Present address: University of Tu ¨ bingen, Germany. 0301-0511/00/$ - see front matter © 2000 Elsevier Science B.V. All rights reserved. PII:S0301-0511(99)00044-7
Transcript of Brain potentials in affective picture processing: covariation with autonomic arousal and affective...
Biological Psychology 52 (2000) 95–111
Brain potentials in affective picture processing:covariation with autonomic arousal and
affective report�
Bruce N. Cuthbert 1, Harald T. Schupp 2,Margaret M. Bradley, Niels Birbaumer 3, Peter J. Lang *
NIMH Center for the Study of Emotion and Attention (CSEA), Uni6ersity of Florida,Box 100165 HSC, Gaines6ille, FL 32610-0165, USA
Received 13 August 1998; received in revised form 19 November 1999; accepted 19 November 1999
Abstract
Emotionally arousing picture stimuli evoked scalp-recorded event-related potentials. Alate, slow positive voltage change was observed, which was significantly larger for affectivethan neutral stimuli. This positive shift began 200–300 ms after picture onset, reached itsmaximum amplitude :1 s after picture onset, and was sustained for most of a 6-s picturepresentation period. The positive increase was not related to local probability of contenttype, but was accentuated for pictures that prompted increased autonomic responses andreports of greater affective arousal (e.g. erotic or violent content). These results suggest thatthe late positive wave indicates a selective processing of emotional stimuli, reflecting theactivation of motivational systems in the brain. © 2000 Elsevier Science B.V. All rightsreserved.
Keywords: Emotion; Attention; Arousal; Event-related potentials; Slow potentials
www.elsevier.com/locate/biopsycho
� Part of this data was presented at the 35th Meeting of the Society for Psychophysiological Research,Toronto, Canada (see Cuthbert et al. (1995), abstract).
* Corresponding author.E-mail address: [email protected] (P.J. Lang)1 Present address: National Institute of Mental Health, Rockville, MD, USA.2 Present address: University of Greifswald, Germany.3 Present address: University of Tubingen, Germany.
0301-0511/00/$ - see front matter © 2000 Elsevier Science B.V. All rights reserved.
PII: S0301 -0511 (99 )00044 -7

B.N. Cuthbert et al. / Biological Psychology 52 (2000) 95–11196
1. Introduction
The aim of this experiment is assess the brain’s reactivity to emotional pictures byrecording event-related potentials (ERPs) and assessing their relationship to evalua-tive, somatic, and autonomic measures of affect. The perceptual processing ofpictures, in terms of the degree of attentive engagement, is presumed to bedetermined in considerable part by their motivational significance. FollowingKonorski (1967), most pleasant affects are held to be associated with the brain’sappetitive motivation system; unpleasant affects with defensive motivation. Reportsof increased arousal and greater magnitude of sympathetically mediated responses(e.g. sweat-gland activity) index increased activation of motive systems (appetitive,defensive, or both), and a commensurate greater intensity or vigor of the affectiveresponse (Lang et al., 1990, 1997, 1998; see also Cacioppo and Berntson, 1994;Davidson, 1995).
For a representative sample of photographic stimuli in the International AffectivePicture System (IAPS; SEA, 1999; Lang et al., 1999), participants’ bi-polar ratingsof affective valence (pleasure–displeasure) and arousal (calm–aroused) reflect thismotivational foundation. Thus, judgments of increasing pleasure, and increasingdispleasure, are in general both positively correlated with reports of greater arousal(suggesting that arousal reports index the level of both appetitive and defensivemotive intensity; (Lang et al., 1997). Furthermore, behavioral and physiologicalresponses to pictures support this conception, with individual measures co-varyingeither with system engagement (valence) or with motive intensity (arousal) (forexample, see Greenwald et al., 1989; Bradley et al., 1990; Lang et al., 1993). Thus,facial actions during picture viewing (as measured by electromyographic activity ofcorrugator and zygomatic muscles) are associated with reports of pleasure ordispleasure — more corrugator tension is found during viewing of unpleasantpictures and more zygomatic activity during pleasant pictures. Among autonomicresponses, heart rate co-varies most strongly with affective valence. On the otherhand, skin conductance increases with the judged affective arousal (motivationalintensity) of both pleasant and unpleasant pictures. Memory for specific picturesand viewing time also correlate with arousal (Bradley et al., 1992), suggesting thatthere is greater attention at encoding for any strong emotional stimuli, regardless ofwhich motive system is active.
In the cognitive literature (Kok, 1997), stimulus evaluation, target identification,and other recognition processes are associated with positive ERP components (e.g.P3). Several research groups have also reported enhanced late positive potentials,later in the waveform (400 ms and beyond), that are evoked specifically byemotional pictures (Johnston et al., 1986; Naumann et al., 1992; Diedrich et al.,1997; Palomba et al., 1997). Similar results have been obtained in studies of subjectsviewing affective facial expressions (Orozco and Ehlers, 1998) or faces that vary inattractiveness (Johnston and Oliver-Rodrıguez, 1997). In all of this research, thelate positive waveform generally begins in the region of the P3 — the classic indexof attention, recognition, and stimulus probability (Donchin and Coles, 1988) —suggesting an association between these ERP measures.

B.N. Cuthbert et al. / Biological Psychology 52 (2000) 95–111 97
Theory regarding more sustained slow waves (of 1 s or more) has traditionallybeen more concerned with negative than positive going waveforms (see reviews byBirbaumer et al., 1990; Rosler et al., 1997). However, several recent studies indicatethat positive centro-parietal slow waves are sensitive to manipulations in theperceptual domain (Ritter and Ruchkin, 1992). Thus, Ruchkin et al. (1988)proposed that, while slow negative waves may reflect the brain’s higher-orderconceptual activity, positive slow waves vary with perceptual operations andmemory storage. Consistent with this view, Kok (1997) assumes that positive slowwaves and P3s reflect similar processes. These views and findings suggest thatenhanced slow waves might be expected during picture viewing. Furthermore, theyshould be specifically enhanced for emotional stimuli, reflecting a greater allocationof perceptual processing resources to motivationally relevant input.
An important concern for ERP studies of emotion concerns validation of theinstigating cues to affect. Self-report of feeling, physiological reactivity (autonomicand somatic) and behavioral measures are all relevant to the description of anemotional response (Mandler et al., 1961; Lang, 1989). The validation of affectiveinput requires their assessment. If ERPs are truly affective in origin, i.e. motivation-ally determined, it must be shown that the evoking stimuli have a systematicrelationship with emotion’s multiple output measures.
2. The research problem
The present experiment evaluates late positive potentials and sustained positiveslow waves during affective stimulus exposure, simultaneously recording peripheralphysiological changes and affective reports that have been shown to be associatedwith emotional reactivity (e.g. Lang et al., 1993). Participants view a series ofpictures, selected on the basis of IAPS valence ratings (Lang et al., 1999) into equalnumbers of neutral, pleasant, and unpleasant stimuli, presented randomly. Accord-ing to the oddball hypothesis, P3-like ERPs are enhanced to rare stimuli (i.e. stimuliwith a low subjective probability). Thus, it is important that the local probability isthe same for the three content types. Furthermore, the emotionally arousingpictures collectively (pleasant and unpleasant) are twice as frequent as the neutralpictures, which are all rated low in arousal. If participants conceive the pictures tofall into two groups (i.e. emotionally arousing versus neutral stimuli), the P3-odd-ball hypothesis predicts that the more rare neutral pictures should show the largerERP positivity. Thus, the construction of the picture set (if it can be construed asbiased) works against support of the motivation hypothesis.
The overall aim of the experiment was to determine if the ERP late positivepotential and the sustained positive slow wave that occurs in response to picturestimuli is determined by the participant’s emotional engagement with the stimulus.In analyzing the data, several specific issues were addressed.1. Do neutral, pleasant, and unpleasant pictures differ systematically in affective
ratings, facial muscle change, and autonomic response (heart rate and skinconductance)?

B.N. Cuthbert et al. / Biological Psychology 52 (2000) 95–11198
2. Are late positive potentials in the ERP and the slow wave greater for emotionalthan neutral picture stimuli, and is the slow wave more sustained?
3. Does the overall ERP waveform and the relationship between the ERP responseto emotional and neutral pictures differ according to electrode site?
4. When separately analyzed for pleasant and unpleasant pictures, is ERP latepositivity greater for pictures rated higher in arousal?
5. Based on factor analysis of all response to these picture stimuli, does ERP latepositivity load on the same factor as other measures of emotional arousal?
3. Method
3.1. Subjects
Thirty-seven (14 female) volunteers (approximate age range, 18–24 years) from theUniversity of Florida Introductory Psychology course participated as part of a classrequirement. Due to computer failure, peripheral physiological data were lost for oneparticipant, and electrocortical data for two participants.
3.2. Stimulus materials
Fifty-four pictures were taken from IAPS (SEA, 1999; see Lang et al., 1999),depicting 18 unpleasant events (e.g. spiders, mutilations, etc.), 18 pleasant events (e.g.attractive infants, opposite sex nudes, etc.) and 18 neutral events (e.g. neutral faceshousehold objects, etc.)4. The content groups were selected such that there was almostno overlap in IAPS normative affective valence ratings, i.e. the three stimulus contentswere distinct and representative of affect type: mean valence (nine-point scales,pleasant high) for pleasant pictures, 7.4; neutral pictures, 5.0; unpleasant pictures,2.7. All neutral pictures had lower standard emotional arousal ratings (mean=2.9)than the pleasant (mean=5.8) and unpleasant (mean=6.4) pictures. The distribu-tions of arousal ratings for pleasant and unpleasant pictures were overlapping. Bothcontents were anchored at the high end by similar high arousal exemplars; becauseof the natural picture distribution of the IAPS, the low arousal end of the unpleasantpictures range was somewhat less extended than for pleasant pictures5.
4 The IAPS slide numbers were as follows: pleasant, 1600, 2080, 2250, 4180, 4210, 4250, 4290, 4310,4470, 4500, 4520, 4550, 4490, 4650, 4660, 4680, 7200, 7330, 7350, 8030, 8080, 8200, 8510; neutral, 2190,2200, 5500, 7000, 7010, 7020, 7050, 7080, 7090, 7100, 7130, 7150, 7160, 7170, 7180, 7500, 7550, 7700;negative, 1070, 1090, 1120, 1300, 2120, 3000, 3010, 3100, 3130, 3150, 3530, 6020, 6190, 6200, 6230, 6370,9040, 9490. The IAPS and technical manuals can be obtained from the corresponding author.
5 In the Cartesian space defined by affective valence and arousal measures, pleasant and unpleasantIAPS pictures show different distributions (Bradley and Lang, in press). Thus, for example, unpleasantpictures show a high positive correlation between valence and arousal (0.55) that is particularlypronounced for female subjects (0.71). For pleasant pictures, this correlation is somewhat lower overall(0.46), but palpably higher for males (0.64). The difference in these natural distributions prevents exactbalancing of arousing stimuli for valence, in a way that would still include the strongest stimuli of bothtypes. Of some importance to emotion theory, these differences further imply that the organization ofpleasant and unpleasant emotion is not symmetrical.

B.N. Cuthbert et al. / Biological Psychology 52 (2000) 95–111 99
The pictures were presented as color slides, arranged in three blocks, such thateach block contained six positive, six neutral, and six negative pictures. Threeorders of picture presentation were constructed such that, across participants, eachblock was seen equally often in the first, second, or third position. In addition,picture order within blocks was varied, such that across participants, each picturewas seen equally often in the first, middle or last portion of each block. Each orderwas presented to approximately one-third of the participants.
3.3. Procedure
After arrival at the laboratory, participants read and signed an informed consentform and filled out several questionnaires. Participants were then seated in arecliner in a small, sound-attenuated, dimly lit room, and electrodes were attached.The participant was told that a series of slides would be presented and that he/sheshould attend to each picture the entire time it appeared on the screen. The slideimage was projected for 6 s, :1.9 m from the participant’s eyes (:25° of visualangle). In order to promote a stable mental set, the participant was asked to try tomaintain the image of the slide for a short period after its presentation (terminatedby a soft tone). The participant was then asked to judge their emotional reactionswhile viewing the picture on bi-polar scales measuring affective valence and arousal.A variable interval (12–18 s) occurred between each trial6. A 1 min resting baselinewas initiated at the beginning of the experiment to facilitate laboratory adaptation,and two neutral pictures served as practice trials.
3.4. Psychophysiological recording procedures
Peripheral and electroencephalogram (EEG) signals were recorded from 3 sbefore slide onset until 1 s after the end of the post-picture period (only the data forpicture viewing are reported here). The EEG was recorded from nine sites usingNihon–Kohden amplifiers according to the international 10–20 system. Ag/AgClelectrodes were placed at F3, Fz, F4, C3, Cz, C4, P3, Pz, P4, and both mastoids.EEG signals were digitized on a Macintosh computer with LABVIEW software; allchannels were recorded using Cz as a reference, digitally converted off-line to alinked-mastoid reference. In order to shorten the time lag between EEG channelsduring data sampling, the actual sampling rate was 1250 Hz, decimated off-line toa 125 Hz sampling rate. The time constant was set at 10 s and the high-frequencycut-off was 35 Hz. Vertical and horizontal eye movements were recorded usingminiature Ag/AgCl electrodes and the same frequency range as the EEG.
6 Acoustic probes (50 ms., 95 dB(A)) were presented during or after some trials and blinks wererecorded from electrodes over the left orbicularis oculi muscle. These data were reported in Schupp etal. (1997).

B.N. Cuthbert et al. / Biological Psychology 52 (2000) 95–111100
A IBM-compatible computer and VPM software (Cook, 1997) was used fortiming and stimulus control, as well as acquisition of autonomic and somaticsignals, and affective ratings. Recording of peripheral measures was identical tothat described in detail in Lang et al. (1993). Briefly, the electrocardiogram (EKG)was recorded with a Coulbourn S75-01 bioamplifier, using electrodes on the left andright forearms; a Schmitt trigger was used to interrupt the computer at theoccurrence of each R wave of the EKG, and record inter-beat intervals to thenearest millisecond. Skin conductance was recorded in microsiemens with a Coul-bourn S71-22 bioamplifier, from electrodes affixed to the hypothenar eminence ofthe left palm. Activity over the left corrugator muscle area was recorded with aCoulbourn S75-01 bioamplifer, with a bandpass of 90–1000 Hz, and rectified andintegrated with a contour following integrator (time constant 500 ms).
Valence and arousal ratings were obtained using a graphic, interactive, computer-ized version of the Self-Assessment Manikin (SAM; Lang, 1980; Hodes et al., 1985;Cook, 1997). SAM is scaled from 0 to 20: it was developed as a user-friendlyalternative to the semantic differential, with which it is highly correlated (Bradleyand Lang, 1994). Imagery vividness ratings were also obtained by using a line ratingwith the endpoints labeled ‘not vivid at all’ and ‘as vivid as possible’.
3.5. Data reduction and analysis
All individual EEG trials that were off-scale at any time during the 16 s recordingepoch were excluded from further analysis; on average, 10.2% of the trials werethus excluded. To correct for vertical and horizontal ocular artifacts, an eyemovement artifact correction procedure (Gratton et al., 1983, revised by Miller etal., 1988) was applied to the EEG recordings including 1 s baseline, picture andpost-picture periods, and 1 s post-baseline. Following eye movement correction,ERP grand average waveforms were calculated separately for each valence categoryand electrode site, referenced to a 120 ms baseline preceding picture onset. Visualinspection served to determine areas of interest. As shown in Fig. 1, event-relatedpeaks, especially N2 and P3, were not pronounced, and area measures seemed to bemore appropriate for these waveforms. A window from 200 to 300 ms captured theP2 and N2 peaks, which had mean latencies of 210 and 274 ms, respectively. Anarea from 300 to 400 ms captured the P3 peak, with a mean latency of 373 ms.Following the P3, a negative going wave developed, which was most pronounced atfronto-central leads. This broad peak was analyzed by a window from 400 to 700ms. The window from 700 to 1000 ms assessed the further transition towards asustained positive slow wave. The positive slow wave was scored by mean activityin successive 1 s bins from 1 to 6 s (i.e. the last 5 s of the picture).
Inter-beat intervals of the EKG were converted to heart rate in beats per minute,and peak acceleration during the viewing interval was scored. Skin conductance wasscored for peak response during viewing; corrugator EMG was expressed as theaverage change in voltage over the 6 s viewing interval. All these measures werechange scores deviated from a 1 s pre-picture baseline period (see Lang et al. (1993)for details).

B.N. Cuthbert et al. / Biological Psychology 52 (2000) 95–111 101
All data (ratings, peripheral physiology, and ERP) were analyzed with a re-peated-measures analysis of variance (ANOVA), with a single primary factor ofemotion content (pleasant, neutral, and unpleasant); significant main effects (a=0.05) were followed by contrasts to identify specific differences. In order to providea careful assessment of temporal ERP effects, separate analyses were conducted foreach time epoch during the first second after picture onset; for the remaining 5 s of
Fig. 1. Stimulus synchronized grand average ERP waveforms for Fz, Cz, and Pz electrodes duringviewing of affective pictures, separately for each valence category (pleasant, neutral and unpleasant). Theleft panel illustrates the picture onset potentials on a finer time scale, and the vertical lines at Pz illustratethe time areas subjected to statistical analysis (i.e. 200–300, 300–400, 400–700, 700–1000 ms). The rightpanel shows the subsequent 5 s of slow potential change.

B.N. Cuthbert et al. / Biological Psychology 52 (2000) 95–111102
Table 1Means for valence and arousal ratings, corrugator response, skin conductance response, and heart ratechange for pleasant, neutral, and unpleasant picturesa
Neutral UnpleasantPleasantMeasurespicturespictures pictures
10.8 (1.4)16.1 (1.9) 5.9 (3.1)Valence ratings6.6 (3.1)14.5a (2.8) 14.6a (2.6)Arousal ratings
0.54 (0.93)0.3 (0.66)Corrugator EMG change (mV) −0.16 (0.88)0.01 (0.03)Skin conductance response, 0.05 (0.08)0.08 (0.09)
log(msiemens +1)2.2 (2.7)3.9a (2.7) 3.5a (2.6)Heart rate peak (bpm)
a Valence and arousal ratings were on a 0–20 scale. Values sharing a letter within a row do not differsignificantly in a post-hoc comparison for that response (PB0.05). Standard deviations are presented inparentheses.
the picture, an additional repeated measures factor of time (five 1 s bins) wasincluded. Two separate sets of analyses were conducted: the midline analysis alsoincluded electrode location as a factor (frontal, central, and parietal), while theanalysis of left and right leads involved an additional laterality factor. All ANOVAswith more than two factors were conducted using a multivariate test statistic(Wilks’ lambda) in order to control for deviations from sphericity.
4. Results
4.1. Autonomic, somatic and self-report measures
As in Lang et al. (1993), the evaluative, somatic, and autonomic responsesobtained in the viewing context reliably discriminated emotional from neutralpictures, and confirmed differences between affective contents. As shown in Table1, unpleasant pictures were judged to be significantly less pleasant than neutralpictures, which were in turn rated less positively than pleasant pictures: emotioncontent, F(2,33)=124.3, PB0.0001. Emotional pictures, pleasant and unpleasant,did not differ in arousal reports, but were both judged to be significantly morearousing than neutral pictures: emotion content, F(2,33)=125.1, PB0.0001. Un-pleasant pictures occasioned significantly greater corrugator muscle activity andgreater heart rate deceleration (i.e. a lower peak heart rate) than other picturetypes: emotion content, Fs(2,33)=3.9 and 12.1, PB0.05, respectively. Both emo-tional picture types prompted significantly larger increases in skin conductance thandid neutral pictures, and in this experiment, conductance responses to pleasantpictures were significantly larger than those to unpleasant images: emotion content,F(2,33)=11.2, PB0.0001.
B.N. Cuthbert et al. / Biological Psychology 52 (2000) 95–111 103
4.2. E6ent-related potentials
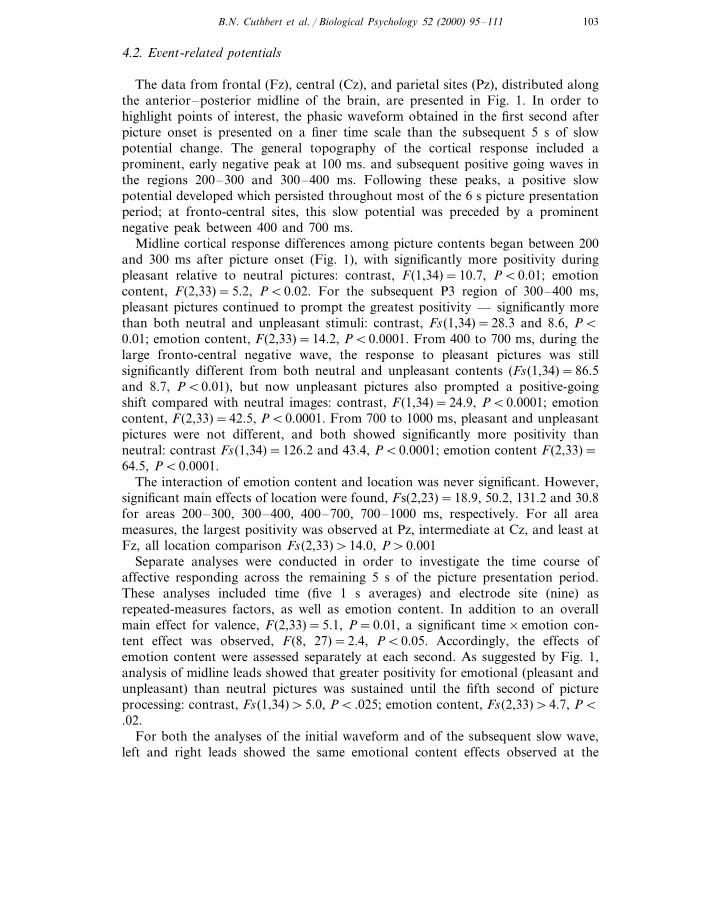
The data from frontal (Fz), central (Cz), and parietal sites (Pz), distributed alongthe anterior–posterior midline of the brain, are presented in Fig. 1. In order tohighlight points of interest, the phasic waveform obtained in the first second afterpicture onset is presented on a finer time scale than the subsequent 5 s of slowpotential change. The general topography of the cortical response included aprominent, early negative peak at 100 ms. and subsequent positive going waves inthe regions 200–300 and 300–400 ms. Following these peaks, a positive slowpotential developed which persisted throughout most of the 6 s picture presentationperiod; at fronto-central sites, this slow potential was preceded by a prominentnegative peak between 400 and 700 ms.
Midline cortical response differences among picture contents began between 200and 300 ms after picture onset (Fig. 1), with significantly more positivity duringpleasant relative to neutral pictures: contrast, F(1,34)=10.7, PB0.01; emotioncontent, F(2,33)=5.2, PB0.02. For the subsequent P3 region of 300–400 ms,pleasant pictures continued to prompt the greatest positivity — significantly morethan both neutral and unpleasant stimuli: contrast, Fs(1,34)=28.3 and 8.6, PB0.01; emotion content, F(2,33)=14.2, PB0.0001. From 400 to 700 ms, during thelarge fronto-central negative wave, the response to pleasant pictures was stillsignificantly different from both neutral and unpleasant contents (Fs(1,34)=86.5and 8.7, PB0.01), but now unpleasant pictures also prompted a positive-goingshift compared with neutral images: contrast, F(1,34)=24.9, PB0.0001; emotioncontent, F(2,33)=42.5, PB0.0001. From 700 to 1000 ms, pleasant and unpleasantpictures were not different, and both showed significantly more positivity thanneutral: contrast Fs(1,34)=126.2 and 43.4, PB0.0001; emotion content F(2,33)=64.5, PB0.0001.
The interaction of emotion content and location was never significant. However,significant main effects of location were found, Fs(2,23)=18.9, 50.2, 131.2 and 30.8for areas 200–300, 300–400, 400–700, 700–1000 ms, respectively. For all areameasures, the largest positivity was observed at Pz, intermediate at Cz, and least atFz, all location comparison Fs(2,33)\14.0, P\0.001
Separate analyses were conducted in order to investigate the time course ofaffective responding across the remaining 5 s of the picture presentation period.These analyses included time (five 1 s averages) and electrode site (nine) asrepeated-measures factors, as well as emotion content. In addition to an overallmain effect for valence, F(2,33)=5.1, P=0.01, a significant time×emotion con-tent effect was observed, F(8, 27)=2.4, PB0.05. Accordingly, the effects ofemotion content were assessed separately at each second. As suggested by Fig. 1,analysis of midline leads showed that greater positivity for emotional (pleasant andunpleasant) than neutral pictures was sustained until the fifth second of pictureprocessing: contrast, Fs(1,34)\5.0, PB .025; emotion content, Fs(2,33)\4.7, PB.02.
For both the analyses of the initial waveform and of the subsequent slow wave,left and right leads showed the same emotional content effects observed at the

B.N. Cuthbert et al. / Biological Psychology 52 (2000) 95–111104
midline. There were neither significant main effects of laterality, nor any interactionof laterality with picture content. As noted earlier, the initial waveform changedsignificantly in topography from frontal to more posterior electrode sites. Despitethis variation, however, the emotional (pleasant and unpleasant) versus neutralpicture difference was consistent for all electrodes.
4.3. Co6ariation of brain potentials with intensity of emotional acti6ation
The predominant impression conveyed by the presented results is that viewingemotional pictures, whether they are pleasant or unpleasant, prompts positivevoltages at the scalp. Assuming this change reflects affective state, a larger positiveslow wave should occur during those pictures, both pleasant and unpleasant, thatthe participants find more emotionally intense. To assess this hypothesis, ERPwaveforms were compared for pictures that participants judged high and low inarousal (median split), within the pleasant and unpleasant valenced contents.Interestingly, these high arousal contents were strong motivational cues, e.g. scenesof violence and erotic images. As can be seen in Table 2, the hypothesis wasconfirmed: within both emotional valence categories, slow potentials were morepositive for the more affectively intense pictures than for lower arousal pictures.
In order to investigate the consistency of this relationship across individuals,correlations were then calculated, for each subject, between the arousal ratings ofsingle picture trials and the mean EEG voltage of the evoked potential in the700–1000 ms time window, where overall affect differences were maximal. Of these35 participants, 33 showed the predicted positive association, and for this smallsample of pictures, fully one-third of the correlations were significant (i.e. Pearson
Table 2Mean difference responses (D score) of ratings, skin conductance, and EEG onset potentials forpictures high versus low in arousal, separately for pleasant and unpleasant picturesa
Measures Pleasant Unpleasantpicturespictures
Arousal ratings (0–20 scale) 3.1*** 2.1***0.9*Valence ratings (0–20 scale) −1.8**
0.0250.09***Skin conductance response (mS)5.9*** 4.0***Averaged ERP amplitude (Fz, Cz, Pz), 400–700 ms (mV)
Averaged ERP amplitude (Fz, Cz, Pz), 700–1000 ms (mV) 6.4*** 4.6***
a The analyses were repeated using a matched subset of the pictures, such that arousal ratingdifferences were maintained between high and low arousal pictures; however, high and low arousalpictures within pleasant and unpleasant categories did not differ in mean valence rating. The statisticalresults obtained with the valence-matched pictures were essentially the same as those shown.
* PB0.05.** PB0.01.*** PB0.001.

B.N. Cuthbert et al. / Biological Psychology 52 (2000) 95–111 105
Fig. 2. Covariation of the judged affective arousal of individual pictures and average midline EEGactivity in the 700–1000 ms time window. Pictures were rank ordered by arousal judgments for eachsubject (rank 1–54); the graph shows mean EEG activity based on each individual’s response to thepicture assigned to that rank.
r\0.27, df=53). Ranking all the pictures (pleasant, unpleasant, neutral) accordingto the SAM arousal judgments of each subject, and averaging across subjects,illustrates the picture by picture relationship between emotional activation andEEG positivity (see Fig. 2).
4.4. Factor analyses of emotion measures
Principal component analyses (using varimax solutions) were used to determinehow the cortical potential fits into the pattern of emotional responses seen inprevious studies of picture perception (for example, Lang et al., 1993). The meanresponses across subjects for each of the 54 pictures were used. Thus, individualpictures, rather than subjects, formed the unit of analysis. Factors were retainedonly if the eigenvalue was larger than 1.

B.N. Cuthbert et al. / Biological Psychology 52 (2000) 95–111106
The approach paralleled that reported by Lang et al. (1993). In the present case,average EEG activity (Fz, Cz, and Pz) in the windows from 400 to 700 and 700 to1000 ms, means of affective ratings, corrugator responses, heart rate, and skinconductance reactions were entered into the analysis. As shown in Table 3, resultsreplicated and extended the findings reported by Lang et al. (1993). A two-factorsolution was obtained, with the factor structure suggesting the names of ‘emotionalarousal’ and ‘emotional valence’, and accounting for 40 and 30.6% of the variance,respectively. Both EEG measures, skin conductance response, and arousal judg-ments loaded on the first factor; corrugator, heart rate, and valence (pleasantness)judgments related to the second factor. A control analysis revealed that enteringsingle electrodes instead of midline-averaged EEG activity resulted in the samefactor structure. Extending the input matrix to include vertical eye movementactivity (in the same time windows) resulted in a separate third factor, withsignificant loadings only on the ocular measures.
5. Discussion
The results show that emotional pictures prompt a pronounced late positivepotential that is greatly reduced or absent for nonaffective stimuli. Furthermore,these positive potentials are specifically enhanced for pictures that are moreemotionally intense (i.e. described by viewers as more arousing, and showing aheightened skin conductance response). In previous research, IAPS pictures withsimilarly high ratings have consistently evoked greater conductance change andhave also been judged more ‘interesting’, been remembered better, and have beenlooked at longer under free-viewing conditions (see Bradley and Lang (in press) fora review). It is suggested that, because of their motivational significance, emotionalstimuli are selected by the brain for sustained attentive processing (Lang et al.,1997). It is hypothesized that the large positive slow wave of the event-relatedpotential indexes this processing.
Table 3Sorted loadings of dependent measures on principal components, indicating cross-validation with datafrom Lang et al. (1993) (shown in italics)a
Measure Arousal factorValence factor
0.06 (−0.00)0.87 (0.86)Valence ratings−0.82 (−0.85)Corrugator EMG change −0.11 (0.19)
0.09 (−0.14)Heart rate peak 0.74 (0.79)Arousal ratings −0.18 (0.15) 0.84 (0.83)Averaged ERP amplitude (400–700 ms) 0.29 (n/a) 0.86 (n/a)
0.90 (n/a)0.19 (n/a)Averaged ERP amplitude (700–1000 ms)Skin conductance response 0.12 (−0.37) 0.70 (0.74)
n/a (0.77)n/a (0.45)Interest ratingsn/a (0.74)n/a (−0.37)Viewing time
a n/a, Not applicable.

B.N. Cuthbert et al. / Biological Psychology 52 (2000) 95–111 107
Another notable feature of the current results was the extended duration of theslow wave for affective stimuli, maintained until the fifth second of picture viewing.The time course of this response is much longer than typically observed for slowpotential onsets to simple tones or lights in single (for example, Simons et al., 1987)or two-stimulus paradigms (for example, see review by Simons (1988)). It seemshighly likely that the sustained positivity seen here reflects continued perceptualprocessing (Kok, 1997). This interpretation is further supported by Schupp et al.(1997). They studied ERPs to brief noise probes, presented between 2.5 and 5 safter picture onset, distributed over a 6-s picture presentation period. The magni-tude of the P3 to these probes was greater during neutral than emotional pictures.This suggests that attentional resources were devoted to emotional pictures overthis extended period. More resources were available for the probe only when thepicture did not evoke affect.
Cacioppo et al. (1993, 1994) reported late cortical positivity to emotional stimuli(recording from the scalp with a short time constant) that increased with a target’sgreater ‘evaluative distance’ from a stimulus context. In their paradigm, theevaluatively distant stimulus was an ‘oddball’. In consideration of classic P3research (Donchin et al., 1986; Donchin and Coles, 1988), the Cacioppo et al.studies raised the possibility that the positivity observed in the present researchmight be related to internal stimulus probabilities rather than to emotion. Thewaveforms seen here, however, appear to be unrelated to the ‘oddball’ effect. Ifsubjects spontaneously categorized the pictures on the basis of valence, all threecategories (pleasant, neutral and unpleasant) were equally probable. Alternatively,assuming subjects saw the pictures as forming only two categories (emotional orneutral), the emotional stimuli showing the signature late positivity were actuallytwice as frequent as the neutral. That is, assuming this unequal, dichotomousclassification, the neutral pictures are expected to show a larger P3-like effect,conferred by their ‘oddball’ status7.
This consideration of local stimulus probability does not, of course, address theproblem of real-world probability. For modern civilization, there is an inevitableconfound: highly arousing emotional stimuli of all types might be considered lessprobable than routine day to day input. Recently, Orozco and Ehlers (1998) arguedthat larger late positive ERPs to erotic pictures by males (than females) supportedthe hypothesis that this response was mediated by emotional arousal. The unequaldistribution by sex in the present sample precluded a successful test of thishypothesis. However, the mean ERP positivity to erotic stimuli shown by males wasindeed larger than the mean for females. We might presume that adolescent andjust post-adolescent males spend more time looking at erotic pictures than do their
7 In collaboration with John Cacioppo’s laboratory (Schupp et al., in press), we recently studiedaffective picture processing, using brief picture exposure (1.5 s) and sequences of six pictures, as in the‘evaluative distance’ studies. However, participants viewed a balanced group of pleasant, neutral, andunpleasant pictures, without oddball targets. Consistent with the present experiment, and supporting theview that motivational relevance is a primary modulator of the ERP, late positivity was againsignificantly greater for emotional than neutral pictures.

B.N. Cuthbert et al. / Biological Psychology 52 (2000) 95–111108
female peers. If we credit this argument, the real-world probability hypothesiswould predict that males would have a diminished rather than a larger late positiveERP. In any event, given the increase in late positive response amplitude from
frontal to parietal sites in studies of emotional stimuli, it seems likely that thisresponse depends on the same neural generator that mediates the classical P3findings. Furthermore, the present data strongly suggest that emotional arousal isconsiderably more potent in determining late positivity than local probability8.
Diedrich et al. (1997) have also reported late positivity to emotional pictures.Furthermore, for subjects instructed to emotionally process the pictures, anterior/posterior waveform differences were noted: frontal sites showed greater positivityfor pleasant than unpleasant pictures, while both emotional contents were similarlymore positive than neutral pictures at parietal sites. In the present research,waveform differences between frontal and parietal electrodes were also observed:The frontal response was generally more voltage negative for most of the firstsecond after picture onset. Furthermore, pleasant pictures showed greater positiv-ity, and could be discriminated from neutral pictures earlier in the development ofthe ERP waveform, than could unpleasant pictures. This effect was not, however,restricted to frontal sites, and later in processing, both types of emotional pictures(pleasant and unpleasant) were significantly more positive than neutral.
This early positive shift for pleasant pictures could reflect a real valence differ-ence at the cortical level of affective processing. Other data from the presentexperiment suggest, however, that it may be secondary to a chance difference in theemotional intensity of the two picture types. That is, while no difference betweenpleasant and unpleasant pictures existed for arousal ratings, pleasant pictures didevoke a significantly greater skin conductance response. Skin conductance change isa direct consequence of general activation of the autonomic nervous system, and itis arguably a better measure of biological arousal than subjective evaluation. Fromthis perspective, while the earlier positive potential for pleasant pictures clearlyindicates augmented affective arousal (as does the emotional–neutral picture differ-ence), it is not strong evidence for an intrinsic valence difference (i.e. it could be theresult of an arousal difference in this particular picture sample). Thus, for example,phobic subjects might show greater earlier positivity for fearful, unpleasant picturesthan for either pleasant or neutral stimuli.
Cacioppo’s laboratory has reported a larger late positive potential over the rightparietal surface, particularly during ‘attitudinal categorization’ of emotional pic-tures (for example, Cacioppo et al., 1996), which they relate to an evaluativeprocess. Diedrich et al. (1997) found larger positive potentials when subjects wereinstructed to process the emotional content of the pictures, compared with adistraction task, but did not report laterality differences specific to pleasant versus
8 Oliver-Rodrıguez et al. (1999) reached a similar conclusion in a study of ERP late positivity andgender differences in response to face stimuli, stating that the ‘‘construct of emotional value’’ was ‘‘moreparsimonious than … task relevance and subjective probability ’’ in accounting for their ERP latepositivity findings (p.183).

B.N. Cuthbert et al. / Biological Psychology 52 (2000) 95–111 109
unpleasant pictures. Bruder (1995), Davidson (1995) and Heller et al. (1997) haveall emphasized electro-cortical differences between the hemispheres in emotionalprocessing and affective style. However, these investigators have focused on assess-ing EEG frequency in the alpha band, rather than ERPs. In the present experiment,no ERP laterality effects survived statistical analysis. It is possible that future workwill uncover reliable hemispheric difference in the evoked potential. Nevertheless,because volume conductance obscures localized effects, the success of this effort willdepend on electrode arrays of much higher density than those used here (forexample, see Tucker et al., 1994), and continuing improvement in source localiza-tion algorithms.
In summary, the present findings show clearly that the brain responds selectivelyto emotionally evocative pictures and that this reaction increases with reports ofgreater affective arousal. We suggest that the positive slow potentials indicateincreased attentive processing, reflecting activation of motivational systems in thebrain, that simultaneously prompt autonomic arousal, emotional facial expression,and reports of affective experience.
Acknowledgements
This work was supported in part by National Institute of Mental Health grantsMH37757, MH43975 and MH52384, to P.J.L.; by the Deutsche Forschungsgemein-schaft (SFB 307, B1); and by a grant from the Deutsche Akademische Auslandsdi-enst to H.T.S.
References
Birbaumer, N., Elbert, T., Canavan, A., Rockstroh, B., 1990. Slow potentials of the cerebral cortex andbehavior. Physiological Reviews 70, 1–41.
Bradley, M.M., Lang, P.J., 1994. Measuring emotion: the self-assessment manikin and the semanticdifferential. Journal of Behavior Therapy and Experimental Psychiatry 25, 49–59.
Bradley, M., Lang, P., in press. Measuring emotion: behavior, feeling and physiology. In: Lane, R.,Nadel, L. (Eds.), Cognitive Neuroscience of Emotion. Oxford University Press, Oxford (in press).
Bradley, M.M., Cuthbert, B.N., Lang, P.J., 1990. Startle reflex modification: emotion or attention?Psychophysiology 27, 513–521.
Bradley, M.M., Greenwald, M.K., Petry, M., Lang, P.J., 1992. Remembering pictures: pleasure andarousal in memory. Journal of Experimental Psychology 18, 379–390.
Bruder, G., 1995. Cerebral laterality and psychophysiology: perceptual and event-related potentialasymmetries in affective and schizophrenic disorders. In: Davidson, R.J., Hugdahl, K. Jr (Eds.),Brain Asymmetry. MIT Press, Cambridge, MA, pp. 661–691.
Cacioppo, J.T., Berntson, G.G., 1994. Relationships between attitudes and evaluative space: a criticalreview with emphasis on the separability of positive and negative substrates. Psychological Bulletin115, 401–423.
Cacioppo, J.T., Crites, S.L. Jr, Berntson, G.G., Coles, M.G.H., 1993. If attitudes affect how stimuli areprocessed, should they not affect the event-related brain potential? Psychological Science 4, 108–112.
Cacioppo, J.T., Crites, S.L. Jr, Gardner, W.L., Berntson, G.G., 1994. Bioelectrical echos from evaluativecategorization: I. A late positive brain potential that varies as a function of trait negativity andextremity. Journal of Personality and Social Psychology 67, 115–125.

B.N. Cuthbert et al. / Biological Psychology 52 (2000) 95–111110
Cacioppo, J.T., Crites, S.L. Jr, Gardner, W.L., 1996. Attitudes to the right: evaluative processing isassociated with lateralized late positive event-related brain potentials. Personality and Social Psychol-ogy Bulletin 6227, 1205–1219.
Center for the Study of Emotion and Attention, 1999. The international affective picture system (IAPS;photographic slides). CSEA-NIMH, University of Florida, Gainesville, FL.
Cook, E.W.I., 1997. VPM Reference Manual. Department of Psychology, University of Alabama,Birmingham, AL.
Cuthbert, B.N., Schupp, H., McManis, M., Hillman, C., Bradley, M.M., Lang, P.J., 1995. Cortical slowwaves: emotional perception and processing. Psychophysiology 32, 526.
Davidson, R.J., 1995. Cerebral asymmetry, emotion, and affective style. In: Davidson, R.J., Hugdahl, K.(Eds.), Brain Asymmetry. MIT Press, Cambridge, MA, pp. 361–387.
Diedrich, O., Naumann, E., Maier, S., Becker, G., 1997. A frontal positive slow wave in the ERPassociated with emotional slides. Journal of Psychophysiology 11, 71–84.
Donchin, E., Coles, M.G., 1988. Is the P300 component a manifestation of context updating? Behavioraland Brain Sciences 11, 357–427.
Donchin, E., Kramer, A.F., Wickens, C., 1986. Applications of brain event-related potentials toproblems in engineering psychology. In: Coles, M.G.H., Donchin, E., Porges, S.W. (Eds.), Psycho-physiology — Systems, Processes, and Applications. The Guilford Press, New York, pp. 702–718.
Gratton, G., Coles, M.G., Donchin, E., 1983. A new method for off-line removal of ocular artifact.Electroencephalography and Clinical Neurophysiology 55, 468–484.
Greenwald, M.K., Cook, E.W., Lang, P.J., 1989. Affective judgment and psychophysiological response:dimensional covariation in the evaluation of pictorial stimuli. Journal of Psychophysiology 3, 51–64.
Heller, W., Nitschke, J., Etienne, M., Miller, G., 1997. Patterns of regional brain activity differentiatedifferent types of anxiety. Journal of Abnormal Psychology 106, 376–385.
Hodes, R.L., Cook, E.W., Lang, P.J., 1985. Individual differences in autonomic response: conditionedassociation or conditioned fear? Psychophysiology 22, 545–560.
Johnston, V.S., Oliver-Rodrıguez, J.C., 1997. Facial beauty and the late positive component ofevent-related potentials. The Journal of Sex Research 34, 188–198.
Johnston, V.S., Miller, D.R., Burleson, M.H., 1986. Multiple P3s to emotional stimuli and theirtheoretical significance. Psychophysiology 23, 684–693.
Kok, A., 1997. Event-related-potential (ERP) reflections of mental resources: a review and synthesis.Biological Psychology 45, 19–56.
Konorski, J., 1967. Integrative activity of the brain: an interdisciplinary approach. University of ChicagoPress, Chicago, IL.
Lang, P.J., 1980. Behavioral treatment and bio-behavioral assessment: computer applications. In:Sidowski, J.B., Johnson, J.H., Williams, T.A. (Eds.), Technology in Mental Health Care DeliverySystems. Ablex Publishing, Norwood, NJ, pp. 119–137.
Lang, P.J., 1989. What are the data of emotion? In: Hamilton, V., Bower, G.H., Frijda, N. (Eds.),Cognitive Perspectives on Emotion and Motivation. Martinus Nijhoff, Boston, MA, pp. 173–191.
Lang, P.J., Bradley, M.M., Cuthbert, B.N., 1990. Emotion, attention, and the startle reflex. Psycholog-ical Review 97, 377–395.
Lang, P.J., Greenwald, M.K., Bradley, M.M., Hamm, A.O., 1993. Looking at pictures: affective, facial,visceral, and behavioral reactions. Psychophysiology 30, 261–273.
Lang, P., Bradley, M.M., Cuthbert, B.N., 1997. Motivated attention: affect, activation, and action. In:Lang, P., Simons, R.F., Balaban, M. (Eds.), Attention and Orienting: Sensory and MotivationalProcesses. Erlbaum Associates, Hillsdale, NJ.
Lang, P.J., Bradley, M.M., Cuthbert, B.N., 1998. Emotion, motivation, and anxiety: brain mechanismsand psychophysiology. Biological Psychiatry 44, 1248–1263.
Lang, P.J., Bradley, M.M., Cuthbert, B.N., 1999. International affective picture system (IAPS):instruction manual and affective ratings. Technical Report A-4, The Center for Research inPsychophysiology, University of Florida.
Mandler, G., Mandler, J.M., Kremen, I., Sholiton, R., 1961. The response to threat: relations amongverbal and physiological indices. Psychological Monographs 75 (22).
Miller, G.A., Gratton, G., Yee, C.M., 1988. Generalized implementation of an eye movement correctionprocedure. Psychophysiology 25, 241–243.

B.N. Cuthbert et al. / Biological Psychology 52 (2000) 95–111 111
Naumann, E., Bartussek, D., Diedrich, O., Laufer, M.E., 1992. Assessing cognitive and affectiveinformation processing functions of the brain by means of the late positive complex of theevent-related potential. Journal of Psychophysiology 6, 285–298.
Oliver-Rodrıguez, J.C., Guan, Z., Johnston, V.S., 1999. Gender differences in late positive componentsevoked by human faces. Psychophysiology 36, 176–185.
Orozco, S., Ehlers, C.L., 1998. Gender differences in electrophysiological responses to facial stimuli.Biological Psychiatry 44, 281–289.
Palomba, D., Angrilli, A., Mini, A., 1997. Visual evoked potentials, heart rate responses and memory toemotional pictorial stimuli. International Journal of Psychophysiology 27, 55–67.
Ritter, W., Ruchkin, D.S., 1992. A review of event-related potential components discovered in thecontext of studying P3. In: Friedman, D., Bruder, G.E. (Eds.), Psychophysiology and ExperimentalPsychopathology: A Tribute to Samuel Sutton. In: Annals of the New York Academy of Sciences,vol. 658. New York Academy of Sciences, New York, pp. 1–32.
Rosler, F., Heil, M., Roeder, B., 1997. Slow negative brain potentials as reflections of specific modularresources of cognition. Biological Psychology 45, 109–141.
Ruchkin, D.S., Johnson, R., Mahaffey, D., Sutton, S., 1988. Toward a functional categorization of slowwaves. Psychophysiology 25, 339–353.
Schupp, H.T., Cuthbert, B.N., Bradley, M.M., Birbaumer, Lang, P.J., 1997. Probe P3 and blinks: twomeasures of affective startle modulation. Psychophysiology 34, 1–6.
Schupp, H.T., Cuthbert, B.N., Bradley, M.M., Cacioppo, J.T., Ito, T., Lang, P.J., (in press). Affectivepicture processing: the late positive potential is modulated by motivational relevance. Psychophysiol-ogy.
Simons, R.F., 1988. Event-related slow brain potentials: a perspective from ANS psychophysiology. In:Ackles, P.K., Jennings, J.R., Coles, M.G.H. (Eds.), Advances in Psychophysiology, vol. 3. JAI Press,Greenwich, CA, pp. 223–267.
Simons, R.F., Rockstroh, B., Elbert, T., Fiorito, E., 1987. Evocation and habituation of autonomic andevent-related potential responses in a nonsignal environment. Journal of Psychophysiology 1, 45–59.
Tucker, D., Lotti, M., Potts, B.F., Russel, G.S., Posner, M.I., 1994. Spatiotemporal analysis of brainelectrical fields. Human Brain Mapping 1, 134–152.
.