Current Therapeutic Approaches in Inflammatory Bowel Disease

ORIGINAL ARTICLE
Characterization of the Novel ST2/IL-33 System in Patientswith Inflammatory Bowel Disease
Caroll J. Beltr�an, BSc,*,† Lucıa E. N�unez, BSc,* David Dıaz-Jim�enez, BSc,* Nancy Farfan, BSc,*Enzo Candia, BSc,* Claudio Heine, MD,‡ Francisco L�opez, MD,‡ Marıa Julieta Gonz�alez, MSc,§
Rodrigo Quera, MD,¶,k and Marcela A. Hermoso, PhD*
Background: ST2 has been proposed to be a regulator of
inflammation and Th1/Th2 balance. ST2L is the IL-33 membrane
receptor and belongs to the IL-1R family. The soluble variant,
ST2s, is identical to the extracellular region of ST2L and com-
petes for IL-33 binding, inhibiting receptor signaling. Although
ST2s has been associated with inflammatory processes in patients
with sepsis, trauma, asthma, and autoimmunity, until now there
are no reported studies showing the role of ST2/IL-33 in inflam-
matory bowel disease (IBD).
Methods: Expression of ST2 and IL-33 was determined in se-
rum and colonic biopsies from IBD patients. ST2 transcript and
protein was determined by reverse-transcription polymerase chain
reaction (RT-PCR) and enzyme-linked immunosorbent assay
(ELISA)/immunoblot, respectively, and IL-33 protein by ELISA.
Intestinal mucosa localization of ST2 and IL-33 was conducted
by immunofluorescence.
Results: ST2s transcript in the colonic mucosa was mainly
expressed in UC patients rather than Crohn’s disease or control;
however, ST2L mRNA remained constant in all samples. Total
ST2 protein was significantly higher in mucosa samples from
patients with active UC, with a predominant induction of ST2s
that strongly correlates with serum ST2 levels. Mucosa IL-33 lev-
els were higher in UC patients and serum levels were barely
detected in all patient groups. ST2 and IL-33 are both abundantly
expressed in the cytoplasm of epithelial cells of control subjects;
however, in ulcerative colitis patients ST2 decreases and IL-33
showed cytoplasm-nuclear redistribution.
Conclusions: The novel association between the ST2/IL-33 sys-
tem and IBD seems to identify that variations in this axis might
regulate the inflammatory process in these diseases.
(Inflamm Bowel Dis 2010;000:000–000)
Key Words: ST2, IL-33, inflammatory bowel disease, Crohn’sdisease, ulcerative colitis
I nflammatory bowel disease (IBD) belongs to the chronic
inflammatory pathologies of the intestine, characterized
by periods of symptomatic crisis and remission that induce
a progressive deterioration of patient’s lifestyle. Crohn’s
disease (CD) and ulcerative colitis (UC) are the 2 main phe-
notypes, each with morphological, histological, and endo-
scopic characteristics. Disease incidence had started to sta-
bilize in North America, northern Europe, and the UK;
however, it is rising in Asia and southern Europe where,
until recently, a low frequency of cases were reported.1 IBD
pathogenesis have been linked to environmental and genetic
factors, along with changes in the immune response related
to disease development and maintenance. As a consequence
of these alterations, there is a loss of tolerance to food and
intestinal flora antigens, inducing the development of
chronic intestinal inflammatory responses, along with a rise
in peripheral and local inflammatory cytokines.2 Biological
therapies to treat the disease have yielded heterogeneous
results in patients, mostly due its multifactorial characteris-
tic. The lack of immunological tools to discriminate and
understand IBD behavior makes the evaluation of patients
difficult who might be submitted to biological treatment.3
We have shown recently differences in the peripheral cyto-
kine profile between IBD patient phenotypes. Specifically,
enhanced intracellular CD4þ/IFN-cþ and CD4þ/IL-17þ T-
cell content was detected in IBD patients in comparison to
healthy controls and, undetectable CD4þ/IL-5þ and IL-13þ
T-cell content, which allow us to conclude that several
immune profiles might be operating in IBD development.3
Received for publication September 21, 2009; Accepted October 21,
2009.
From the *Disciplinary Program of Immunology, Institute of Biomedical
Sciences, Faculty of Medicine, University of Chile, Santiago, Chile,†Clinical Investigation Department, Clinic Hospital University of Chile,
Santiago, Chile, ‡Laboratory of Oncology and Molecular Genetics,
Colorectal Surgery Unit, Las Condes Clinic, Santiago, Chile, §Cell and
Molecular Biology Program, Biomedical Sciences Institute, Faculty of
Medicine, Universidad de Chile, Santiago, Chile, ¶Gastroenterology Unit,
Santiago, Chile, kGastroenterology Unit, Internal Medicine Department,
University of Chile, Clinic Hospital, Santiago, Chile.
Supported by FONDECYT grant 1070954 and OAIC 167/06.
The first 3 authors contributed equally to the article.
The last 2 authors share senior authorship.
Reprints: Marcela A. Hermoso, PhD, Independencia 1027, Programa de
Inmunologıa, Facultad de Medicina, Universidad de Chile 8530499
(e-mail: [email protected])
Copyright VC 2009 Crohn’s & Colitis Foundation of America, Inc.
DOI 10.1002/ibd.21175
Published online inWiley InterScience (www.interscience.
wiley.com).
Inflamm Bowel Dis 1

ST2 is a member of the interleukin (IL)-1 receptor
family,4 recently described as a biomarker protein of
inflammatory processes, such as bronchial asthma,5 idio-
pathic pulmonary fibrosis,6 heart failure,7 dengue virus
infection,8 and septic shock and trauma.9
ST2 is mainly presented as 2 isoforms that are gener-
ated by alternative splicing: the first bound to the mem-
brane (ST2L) and another soluble (ST2s) characterized by
loss of the transmembrane and intracellular domains.10
ST2L, originally described as an orphan receptor, recog-
nizes IL-33, its endogenous ligand. ST2/IL-33 system acti-
vation promotes an inflammatory response that was exten-
sively studied during the last few years, particularly in
mast cells and CD4þ lymphocytes.11 Nuclear localization
of IL-33 has been described in CD, suggesting that it may
have a dual role as an inflammatory modulator by repres-
sing transcriptional activation and as a stimulator by inter-
acting with ST2L.12 ST2/IL-33 overstimulation has been
implicated in autoimmune diseases such as arthritis,13 aller-
gic inflammation, and airway hyperactivity,14,15 demon-
strating an important role of ST2 in development of inflam-
matory pathologies. Moreover, ST2s has been recognized
as a decoy receptor that competitively binds to IL-33. ST2s
may confer protection to Alzheimer’s disease16 and athero-
sclerosis development,17 and have a regulatory role in ex-
perimental arthritis,18 heart surgery,19 allergic airway
inflammation,20 and warm hepatic ischemia/reperfusion
injury.21 High ST2 serum levels detected in chronic inflam-
matory processes suggest that ST2s might be involved in
controlling the progress of the disease. However, ST2s role
in IBD still remains unknown.
In this study we demonstrated that expression of the
ST2/IL-33 protein pattern in the periphery and in intestinal
mucosa, as well as ST2s isoform mRNA in intestinal mu-
cosa, is increased in patients with an active state of UC
rather than CD and healthy controls. We finally show that
ST2/IL-33 is strongly expressed in epithelial cells in
healthy individuals and CD; however, the ST2 protein pat-
tern distribution strongly varies to scattered and diminished
in UC; interestingly, this was accompanied of a cytoplasm-
nuclear IL-33 redistribution.
MATERIALS AND METHODS
Patients and ControlsThe study group consisted of 84 patients with IBD
and 20 healthy individuals as controls. Thirteen were diag-
nosed with CD and 71 with UC. Patients with diagnosed
CD or UC were included in the study based on clinical,
endoscopical, and histological findings according to the
Montreal Classification.22 The control group comprised
healthy individuals who had no history of immune-medi-
ated diseases. Indeterminate colitis or colitis patients were
excluded from the protocol. All individuals were incorpo-
rated prospectively from the Gastroenterology Unit of Las
Condes Clinic and University of Chile Clinic Hospital.
Clinical data for IBD patients were obtained retrospectively
from clinical files.
The following information from IBD patients was
obtained: identification number, age, gender, medical and
surgical history, IBD familial history (familial disease was
considered as 1, first- or second-degree relative to diag-
nosed IBD) diagnosis, age at diagnosis, severity and dis-
ease localization, extraintestinal manifestations, colono-
scopic and pathologic records, treatment, hospitalizations,
and complications.
The control group comprised healthy individuals who
had no history of immune-mediated diseases. All studies
were approved by the responsible Ethics Committee and a
voluntary written informed consent was obtained from all
participants involved in this study.
Preparation of Patient SamplesThe number of obtained biopsies from patient and
control groups ranged from 3–4. Biopsies to determine
mRNA and protein expression of ST2 were immediately
snap-frozen in liquid nitrogen and stored at �80�C until
use. For ST2 protein analysis, biopsies were prepared as
described below. Sera were obtained from heparin-treated
blood by centrifugation at 2000 rpm for 2 minutes and
stored at �80�C until processed.
Quantification of Human ST2 and IL-33 LevelsST2 and IL-33 contained in serum and biopsy
extracts were measured using the DuoSet enzyme-linked
immunosorbent assay (ELISA) kit for human ST2 (R&D
Systems, Minneapolis, MN) and IL-33 (Apotech, Geneva,
Switzerland), respectively, according to the manufacturer’s
instructions. For serum samples, a pretreatment with pro-
tein A/G PLUS-Agarose (Santa Cruz Biotechnology, Santa
Cruz, CA) was developed. All samples were assayed in
duplicate. The ST2 and IL-33 levels in biopsies were nor-
malized to total protein concentration.
ImmunoblottingTotal tissue extracts were obtained by homogenizing
biopsies with ice-cold-lysis buffer (20 mM Tris-HCl pH
7.5, 2 mM EDTA, 150 mM NaCl, 0.5% Triton X-100) sup-
plemented with Complete Mini Protease Inhibitor Cocktail
tablets (Roche Applied Science, Indianapolis, IN) and dis-
rupting by sonication 3 times for 10 seconds at 14W on
ice. The extract was centrifuged at 14,000 rpm for 10
minutes to exclude any cellular contamination. Protein con-
centration was determined by the Bradford assay (BioRad,
Hercules, CA). Fifty and 25 lg of total protein of biopsy
lysate or serum, respectively, were loaded onto 8% or 12%
Inflamm Bowel DisBeltr�an et al
2

sodium dodecyl sulfate-polyacrylamide gel electrophoresis
(SDS-PAGE) under reducing conditions and proteins were
electrotransferred to a nitrocellulose membrane (S&S,
Keene, NH). Detection of ST2 was determined with antihu-
man ST2 conjugated to biotin diluted 1:1000 in 0.05%TBS
2% Tween-20 goat normal serum and incubated for 1 hour
(R&D Systems), and streptavidin-horseradish peroxidase
(HRP) conjugate (Sigma-Aldrich, St. Louis, MO) diluted
1:1000 in 0.05%TBS 2% Tween-20 incubated for 20
minutes and the reaction was developed with ECL Western
Blotting System (Amersham, Little Chalfont, UK).
RNA Isolation and Semiquantitative RT-PCRTotal RNA was isolated from colonoscopic biopsies
using Trizol Reagent (Invitrogen Life Technologies, Carls-
bad, CA) following treatment with TURBO DNase I
(Ambion, Austin, TX) and 5 lg of total RNA were reverse
transcribed using Affinity Script (Stratagene, La Jolla, CA).
Polymerase chain reaction (PCR) was carried out using Paq
5000 DNA polymerase (Stratagene) and 250 nM of
each specific primer for sST2 (fwd: 50-GGCACACCGTAAGACTAAGTAG-30; rev: 50-CAATTTAAGCAGCAGAGAAGCTCC-30), ST2L (fwd: 50-ATGTTCTGGATTGAGGCCAC-30; rev: 50-GACTACATCTTCTCCAGGTAGCAT-30) and GAPDH (fwd: 50-CATGACCACAGTCCATGCCA-30; rev: 50-AGGCCATGCCAGTGAGCTTC-30)in a total volume of 25 lL. Each PCR amplification was
performed in Swift Maxi Thermal Cycler (ESCO Technolo-
gies, Hatboro, CA) using the following conditions: initial
denaturation at 94�C for 7 minutes, 35 cycles at 94�C for
30 seconds, 55�C for 30 seconds, and 72�C for 60 seconds,
and a final elongation step at 72�C for 10 minutes. ST2
PCR products were solved in agarose gels and digitized
images were analyzed by optic densitometry and normal-
ized to GAPDH to compensate for differences in cDNA
content of samples.
Tissue Detection of ST2 and IL-33Biopsy samples from patients and controls were pre-
served in Optimal Cutting Temperature (OCT) Compound
(Tissue-Tek, Torrance, CA), frozen, and stored at �80�Cuntil use. Four lm tissue slides were fixed on 2% p-formal-
dehyde for 10 minutes at room temperature. ST2 and IL-33
expression were determined using the monoclonal antihu-
man ST2 antibody (R&D Systems) and polyclonal antihu-
man IL-33 antibody (Alexis, Geneva, Switzerland) diluted
1:100 and 1:200 in PBS, respectively, and secondary anti-
bodies antimouse IgG1 conjugated with Alexa Fluor-488
and antirabbit conjugated with Alexa Fluor-546, both
diluted 1:250 in phosphate-buffered saline (PBS). The
nuclei were stained using propidium iodide 0.3 lg/mL. The
immunofluorescence was examined with a confocal micro-
scope (LSM-140 Axiovert 10.0, Carl Zeiss, Germany) and
image analyses were performed using LSM software (3.5
v., Carl Zeiss). Negative control experiments to ST2 and
IL-33 immunostaining were performed by incubating sec-
tions with isotype-matched IgG1 and blocking solution,
respectively.
Immune Staining of Cell Surface AntigensSurface ST2 and CD4 expression were studied by
flow cytometry. Briefly, heparinized whole blood (WB)
was diluted 1:1 v/v in culture medium consisting of RPMI
1640 medium supplemented with 2 mM L-glutamine, 100
IU/mL penicillin, and 10 mg/mL streptomycin, and trans-
ferred in 12 � 75-mm polystyrene, round-bottomed wells.
Cells were stained with CD4-FITC conjugated monoclonal
antibody (eBiosciences, San Diego, CA) at 4�C in the dark
for 1 hour. Antibody excess was removed with PBS and
erythrocytes were lysed using ACK lysis buffer and further
the cells were fixed with 1% p-formaldehyde. The cells
were analyzed by flow cytometry using a FACS Calibur
flow cytometer (Becton Dickinson, San Diego, CA) and
gate analyses were set on lymphocytes according to for-
ward and sidescatter properties. At least 10,000 CD4þ cells
were collected and evaluated. Data were analyzed using
CellQuest (v. 3.3) software (Beckton Dickinson) and cor-
rected for autofluorescence as well as for unspecific bind-
ing using isotype-matched controls.
Statistical AnalysisNormalized data were processed to calculate median
or mean values and standard deviations. Differences and
significance among all groups were made by Krus-
kal–Wallis or between 2 groups by Mann–Whitney tests.
Associations between serum ST2 levels and others parame-
ters were analyzed by Spearman’s correlation coefficient
(r). P values <0.05 were considered significant.
RESULTS
IBD Patient CharacteristicsDemographic and clinical characteristics of CD and
UC patients are shown in Tables 1 and 2, respectively. In
the CD group, the mean age at diagnosis was 39.3 years
(range 33–50) and 35% were female. Of these patients,
based on the Montreal Classification, 21% had pancolitis,
7% had polyarthralgias, and 14% needed surgery. In the
UC group, the mean age at diagnosis was 38.9 years (range
13–57), 56% were female. Twenty-eight percent has procti-
tis, 14 left-sided colitis, and 57 pancolitis. Two percent had
extracolonic manifestation and 1 patient (1%) required sur-
gery (Tables 1, 2).
Inflamm Bowel Dis Novel ST2/IL-33 System in IBD
3

Detection of ST2 and IL-33 Protein in Serum fromIBD Patients
Serum ST2 levels were measured by ELISA in IBD
patients. The ST2 concentration in IBD patients were higher
than those of healthy controls (P ¼ 0.0488). Moreover,
when comparing serum ST2 levels, statistically significant
differences were detected among all patient groups (P ¼0.0338) (Fig. 1A). Median values of serum ST2 levels were
43.93, 50.85, and 73.37 pg/mL for controls, CD, and UC,
respectively. In addition, a statistically significant difference
was found only between UC and controls (P ¼ 0.0063).
When the UC group of patients was analyzed according to
the activity of the disease, ST2 levels were significantly
higher in those with an active UC state rather than inactive
(P ¼ 0.0343) (Fig. 1A, right). Median values of serum ST2
levels were 38.50 and 77.66 pg/mL for inactive and active
UC, respectively (Fig. 1A, right). Because the ELISA kit did
not discriminate between ST2 isoforms, the predominant
ST2 variant that is expressed in serum of IBD patients was
evaluated by immunoblotting. According to electrophoretic
migration an immunoreactive band of �50 kDa was detected
in all sera (Fig. 1B); however, the band intensity increased
in UC patients rather than CD and controls. Significant dif-
ferences were found among groups with a P ¼ 0.0114 (Fig.
1B, right) with median values of serum ST2 levels of
0.4900, 0.3850, and 1.280 for controls, CD, and UC, respec-
tively. In addition, statistical analysis showed significant dif-
ferences between UC and control (P ¼ 0.0286), CD and con-
trol (P ¼ 0.0286), and UC and CD (P ¼ 0.0143).
Serum IL-33 levels in IBD patients were also deter-
mined by ELISA. The IL-33 content in IBD patients was
higher than those for controls (P ¼ 0.0286). Comparison of
serum IL-33 levels among groups was statistically signifi-
cant, P ¼ 0.0345 (Fig. 1C). Median values of serum IL-33
levels were 1.341, 3.159, and 2.023 pg/mL for controls,
CD, and UC, respectively. In addition, statistical analysis
showed a significant difference between UC and controls
(P ¼ 0.0419) and between CD and control (P ¼ 0.0083).
However, no significant differences were found in IL-33
levels when the UC patients was analyzed according to the
activity (P ¼ 0.1629) (Fig. 1C, right), whose median val-
ues of serum IL-33 levels were 2.023 and 1.795 pg/mL for
inactive and active UC, respectively.
ST2 was classically associated with Th2 cells,
although ST2 surface expression was evaluated in periph-
eral CD4þ lymphocytes from WB of IBD and healthy indi-
viduals by flow cytometry. Low CD4þ/ST2þ expression
was detected with median values of 0.0545, 0.2250, and
0.6800 in controls, CD, and UC, respectively, and no dif-
ferences were detected in ST2 expression among groups
(P ¼ 0.6048) (data not shown).
Expression of ST2 mRNA and Protein in IntestinalMucosa from IBD Patients
As ST2 has been identified as 2 spliced variants,
expression of ST2s and ST2L isoforms was analyzed by
RT-PCR in colonoscopic biopsies of intestinal mucosa
obtained from IBD patients. An increased ST2s mRNA
expression was observed as a PCR product of 235 bp in
active UC compared to CD and controls (Fig. 2A). Never-
theless, ST2L expression did not vary among all groups of
patients, shown as a 239 bp product (Fig. 2A). Normalized
TABLE 1. Clinical Characteristics of Patients with Crohn’sDisease
Patients n ¼ 13
Male/female 8/5 (1.6:1)
Age (years) 38.7 (23-66)
Age at diagnosis (years) 34.4 (14-63)
Disease localization (%)
Distal ileum 28%
Left colon and rectum 14%
Pancolitis 57%
Perianal disease (%) 7%
Upper gastrointestinal tract (%) 0%
Behavior (%)
Inflammatory 85%
Stricturing 15%
Extraintestinal manifestations (%)
Articular 7%
Skin 0%
Surgery (%) 14%
Familial IBD (%) 0%
TABLE 2. Clinical Characteristics of Patients withUlcerative Colitis
Patients n ¼ 71
Male/female 29/42 (0.6:1)
Age (years) 38.5 (13-67)
Age at diagnosis (years) 28.6 (11-53)
Disease localization (%)
Proctitis 28%
Left-sided colitis 14%
Pancolitis 57%
Extraintestinal manifestations (%)
Articular 5%
Skin 0%
Surgery (%) 6%
Familial IBD (%) 3%
History of allergies (%) 9%
Inflamm Bowel DisBeltr�an et al
4

ST2s expression shows significantly higher ST2s mRNA
levels between controls versus CD (P ¼ 0.0364) for control
versus UC (P ¼ 0.0419) (Fig. 2B). Moreover, when the
UC group of patients was analyzed according to activity,
ST2s mRNA levels were significantly higher in patients
with an active UC state (P ¼ 0.0281) (Fig. 2B, right).
To assess if ST2 protein content in intestinal mucosa
follows an ST2 variant mRNA trend, ST2 levels were
determined in biopsy extracts through ELISA and normal-
ized to total protein content. Intestinal mucosa ST2 concen-
tration in IBD patients was higher than in healthy controls
(P ¼ 0.0021). Comparison of intestinal mucosa ST2 levels
among groups was statistically significant, P ¼ 0.0054
(Fig. 3A). In addition, statistical analysis showed a signifi-
cant difference only between UC and controls (P ¼0.0008); median values of intestinal ST2 concentration
FIGURE 1. ST2 and IL-33 in serum levels according to IBD type and activity. Serum samples were taken from CD and UCpatients. (A) ST2 levels were determined by ELISA. UC patients show higher median serum ST2 levels (*P ¼ 0.0338). Right: me-dian serum ST2 levels were significantly higher in active UC than inactive UC patients, (*P ¼ 0.0343). (B) Immunoblot of ST2 inserum samples: serum samples were solved by immunoblot as detailed in Materials and Methods and a major immunoreac-tive band of 50 kDa was detected in UC patients. Right: Significant differences were found between serum ST2 among groups(*P ¼ 0.0114). Analysis showed statistical significant differences between median values from control and CD (*P ¼ 0.0286),control and UC (WP ¼ 0.0286) and CD and UC (XP ¼ 0.0143). (C) Analysis of serum IL-33 levels show significant differencesamong groups (*P ¼ 0.0345). CD patients show higher median serum IL-33 levels in comparison to control group (*P ¼0.0083). Right: Active UC patients show a tendency of higher serum IL-33 levels compared to inactive patients but median dif-ferences were not significant (P ¼ 0.1629). Statistical analyses were done using Kruskal–Wallis and Mann–Whitney tests.
Inflamm Bowel Dis Novel ST2/IL-33 System in IBD
5

were 4.591, 5.016, and 7.258 pg/mL for controls, CD, and
UC, respectively. To discriminate between soluble and
membrane-bound ST2 protein expression in mucosal intes-
tine, colonoscopic biopsies were homogenized and ana-
lyzed by immunoblot. ST2L isoform (76 kDa) was present
IBD and controls samples; conversely, ST2s variant (57
kDa) was only detected in UC intestinal mucosa (Fig. 3B).
ST2s/ST2L expression was significantly different between
control and UC patients (P ¼ 0.0119). Moreover, when the
UC group of patients was analyzed according to activity,
ST2s/ST2L expression was significantly higher in those
with an active UC state (P ¼ 0.050) (Fig. 3B, right, lower
bar graph). This result could imply that increased total ST2
in intestinal mucosa from UC patients shown by ELISA is
due to an augmented ST2s protein expression. In line with
this, the high intestinal production of ST2s seems to perme-
ate to the vasculature which is, then, reflected in the
peripheral blood.
Expression of IL-33 in Intestinal Mucosa from IBDPatients
The content of IL-33 in biopsies of IBD patient was
measured by ELISA and the data analysis show that they
were higher than controls (P ¼ 0.0062). Figure 3C shows
IL-33 concentration in biopsies and median values were
10.70, 15.88, and 19.94 pg/mL for controls, CD, and UC,
respectively. Comparison of intestinal mucosa IL-33 levels
among groups was statistically significant, showing P ¼0.0037. In addition, there were statistically significant dif-
ferences between UC versus controls (P ¼ 0.0009) and
between CD and UC (P ¼ 0.0454). When the UC group of
patients was analyzed according to activity, IL-33 levels
were significantly higher during active than inactive states
of the disease (P ¼ 0.0090) (Fig. 3C, right). Median values
of IL-33 levels were 16.15 and 19.94 pg/mL for inactive
and active UC, respectively.
All these differences were confirmed in the regression
analysis between serum ST2 and the other parameters.
There was a positive tendency in the correlations between
serum ST2 and local ST2 (r ¼ 0.2374, P ¼ 0.0451), local
IL-33 (r ¼ 0.2450, P ¼ 0.040), and serum IL-33 (r ¼0.2386, P ¼ 0.0443) in patients with active UC (Table 3).
Likewise, patients with inactive UC showed a negative cor-
relation between serum ST2 and serum IL-33 (r ¼�0.5644, P ¼ 0.0059). In contrast, the local ST2 and local
IL-33 for CD patients showed a strong and significant posi-
tive correlation (r ¼ 0.6209, P ¼ 0.0118).
ST2 and IL-33 Distribution in Colonic MucosaTissue from IBD Patients
The diversity of cellular types present in colonic mu-
cosa makes it necessary to develop a local detection of
ST2 and IL-33 and to evaluate the cellular source, which
might formulate an adequate interpretation of the results
previously shown. To achieve this immunofluorescence and
confocal microscopy were used. The ST2 immunostaining
procedure was adjusted using the human mast cell line
MHC-1, showing a surface staining of the protein (data not
shown). For ST2 distribution, Alexa Fluor-488 (green) was
selected and propidium iodide (red) was used to stain
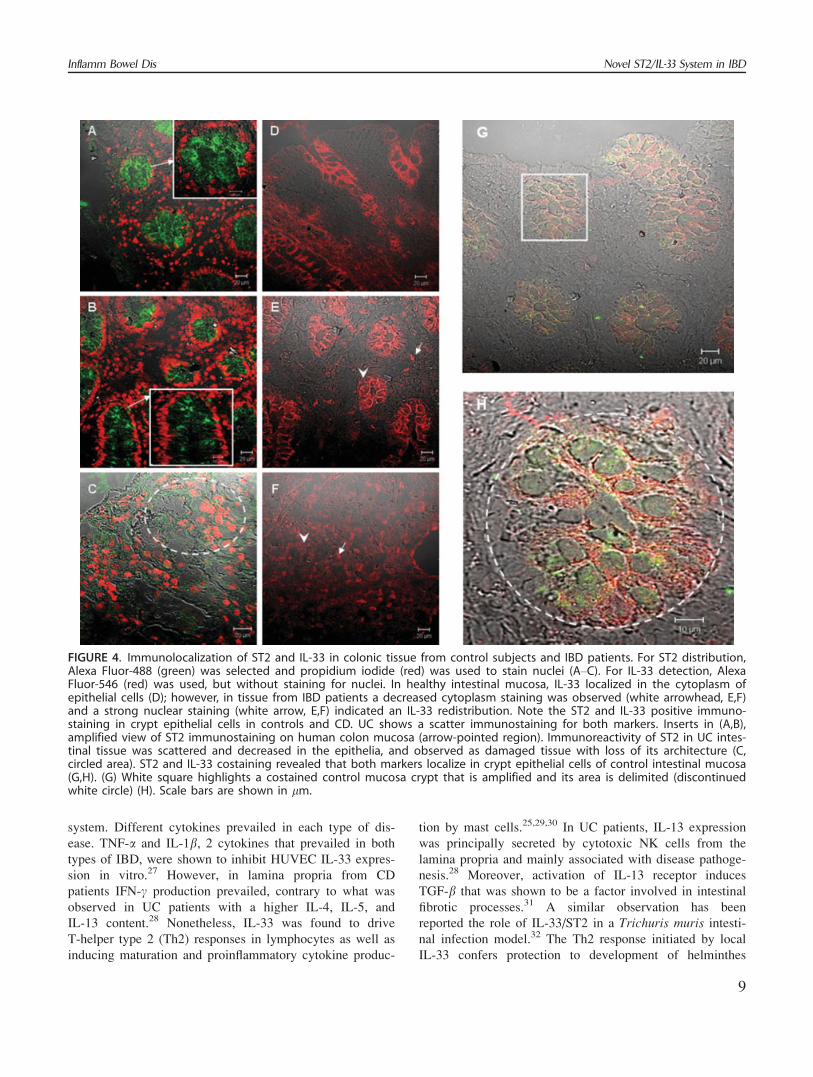
nuclei (Fig. 4A–C). We found control and CD mucosa pos-
itive for ST2 (white arrows, Fig. 4A,B); however, we
observed loss of ST2 staining in the epithelium from UC
patients (Fig. 4C). In control as well as in CD samples a
strong expression pattern was observed in the cytoplasm
and the apical surface of crypt epithelial cells (white
arrows, Fig. 4A,B inserts). ST2 immunoreactivity in UC in-
testinal tissue was scattered at the mucosa level and
decreased in the epithelia, which is damaged and with loss
of its architecture (Fig. 4C, circled area).
For IL-33 detection, Alexa Fluor-546 (red) was used,
but without staining for nuclei with propidium iodide. In
healthy as well as CD intestinal mucosa, IL-33 localized in
the cytoplasm of epithelial cells (Fig. 4D); however, in tis-
sue from UC patients a decreased cytoplasm staining was
observed (white arrowhead Fig. 4E,F). Both IBD patients
showed a strong nuclear staining (white arrow Fig. 4E,F)
indicating that there is an IL-33 redistribution. Moreover,
ST2 and IL-33 costaining revealed that both markers
FIGURE 2. Expression of ST2 mRNA spliced variants in intes-tinal mucosa from IBD patients. (A) ST2s expression variedamong groups of IBD patients rather than ST2L. ST2 tran-script spliced variants expression was analyzed by RT-PCRand normalized to GAPDH. The figure shows representativeagarose gels for ST2s, ST2L, and GAPDH expression showingPCR products of 235, 239, and 176 bp, respectively. (B) Rela-tive expression of ST2s versus ST2L was measured by opticdensitometry and defined as ST2s/ST2L intensity ratio inrelation to GADPH [(ST2s/GADPH)/(ST2L/GAPDH)]. Statisti-cally significant differences were seen between groups (*P¼ 0.0364, for control versus CD and P ¼ 0.0419, for controlversus UC). Right: Active UC patients show higher ST2s/ST2LmRNA ratio compared to inactive UC patients, *P ¼ 0.0281.Statistical analyses were done with Kruskal–Wallis and Man-n–Whitney tests.
Inflamm Bowel DisBeltr�an et al
6

FIGURE 3. Expression of ST2/IL-33 system in intestinal mucosa. (A) Total ST2 level distribution in intestinal biopsies wasdetermined in total protein extracts from biopsies from CD, UC, and control individuals and normalized to total protein con-tent. Significantly differences were found between median values of intestinal mucosa ST2 among groups (P ¼ 0.0054). UCpatients show higher ST2 levels in comparison to controls (**P ¼ 0.0008). Right: Intestinal mucosal ST2 levels did not varybetween active and inactive UC patients (P ¼ 0.3514). All statistical analysis was conducted using Kruskal–Wallis test. (B)Soluble ST2 isoform was detected in biopsies of UC patients. Fifty lg of total protein from control, CD, inactive UC (iUC),and active UC (aUC) patients were analyzed by Western blot. Expression of ST2L was detected in all individuals; however,ST2s was only present in IBD patients. Two bands were identified, a minor mobility band of 76 kDa and a major mobilityband of 57 kDa corresponding to ST2L and ST2s, respectively. Standard molecular weights are shown on the left side of thefigure. Right: Relative ST2s/ST2L expression was normalized to actin immunoreactivity and was significantly differentbetween control and UC patients (*P ¼ 0.0119). Right panel, lower bar graph: relative ST2s/ST2L expression was significantlyhigher in UC patients with an active compared to inactive state (*P ¼ 0.050). (C) IL-33 level distribution in intestinal biopsieswas determined according to different IBD. IL-33 was determined in total protein extracts from biopsies from CD, UC, andcontrol individuals, and was normalized to total protein content. Statistically significant differences in IL-33 levels wereobserved between UC versus controls (**P ¼ 0.0009) and between CD and UC (*P ¼ 0.0454). Right: Active UC patients showhigher IL-33 levels in comparison to inactive (**P ¼ 0.0090). Statistical analyses were done with Kruskal–Wallis andMann–Whitney tests.
Inflamm Bowel Dis Novel ST2/IL-33 System in IBD
7

localize in crypt epithelial cells of control intestinal mucosa
(Fig. 4G,H). An immunoreactivity pattern was absent when
isotype controls were used (data not shown).
DISCUSSIONThis study shows for the first time that ST2 and IL-
33 is highly expressed in patients with IBD. Colonic mu-
cosa ST2 and IL-33 expression is higher in UC than the
CD and controls and subcellular distribution varies among
groups, reflecting these alterations in peripheral blood.
Increased circulating ST2 was previously associated with
acute inflammation as shown for several inflammatory dis-
eases.5,23 ST2 peripheral levels in all IBD and control
groups are related to the soluble isoform of the protein.
However, a significant increase in ST2s mRNA and protein
was only observed in intestinal mucosa of active UC
patients, accounting for the augmented total ST2 content.
The increased ST2s levels detected in active UC patients
could be due to proinflammatory pathways driven by cyto-
kines produced during the inflammatory processes that gov-
ern CD and UC. In line with this, fibroblasts exposed to
proinflammatory stimuli, such as IL-1 and TNF-a, expressST2s rather than ST2L24 as has been demonstrated here for
IBD patients. Why does ST2s increase during the acute
phase of the disease? A regulatory role attributed to ST2s
could be a possible answer. ST2/IL-33 has been described
as a proinflammatory system that increases IL-5, IL-6, IL-
13, TNF-a production as well as other molecules, such as
PGD2 and MCP-111,25 and this effect was shown to be
reversed by ST2s.25 The presence of high serum and colo-
nic ST2s levels is consistent with the active state of UC
and suggests that this protein might be playing a negative
feedback mechanism to control inflammation. Many proin-
flammatory molecules that belong to this receptor family,
such as IL-1R, are classic examples in the generation of
molecules that trap the agonist, functioning as a negative
regulator of the IL-1 system.26 The existence of ST2s
emphasizes the need for a tight control of the IL-33 sys-
tem, which mediates potentially devastating local inflam-
matory reactions, such as epithelial hyperplasia, as well as
eosinophils, neutrophils, and mononuclear cells recruit-
ment.11 IL-33 also induces tissue lesions in the lung,
including medial hypertrophy of arteries and vascular infil-
tration of eosinophils and mononuclear cells, as well as hy-
pertrophy of bronchial epithelia with increased mucus
production.11
Immunological differences between UC and CD may
explain the differential expression pattern of the ST2/IL-33
TABLE 3. Analysis Correlation of Spearman Between Serum ST2 and Selected Covariates in Patients with Active andInactive Ulcerative Colitis, Crohn’s Disease, and Control Variables
Serum ST2 Local ST2 Local IL-33
r P value r P value r P value
Active Ulcerative Colitis
Local ST2 0.2374 0.0451* – – 0.1576 0.1322
Local IL-33 0.2450 0.400* 0.1576 0.1322 – –
Serum ST2 – – 0.2374 0.0451* 0.2450 0.0400*
Serum IL-33 0.2386 0.0443* 0.0972 0.2465 0.0940 0.2583
Inactive Ulcerative Colitis
Local ST2 �0.2185 0.1844 – – 0.1456 0.2760
Local IL-33 �0.1562 0.2615 0.1456 0.2760 – –
Serum ST2 – – �0.2185 0.1844 �0.1562 0.2615
Serum IL-33 �0.5644 0.0059* 0.1014 0.3398 0.2398 0.1614
Crohn’s Disease
Local ST2 �0.1593 0.3015 – – 0.6209 0.0118*
Local IL-33 0.0934 0.3808 0.6209 0.0118* – –
Serum ST2 – – �0.1593 0.3015 0.0934 0.3808
Serum IL-33 �0.3466 0.1230 0.3191 0.1439 0.2503 0.2047
Control
Local ST2 �0.0175 0.4692 – – 0.1835 0.2068
Local IL-33 �0.1925 0.1953 0.1835 0.2068 – –
Serum ST2 – – �0.0175 0.4692 �0.1925 0.1953
Serum IL-33 0.0560 0.4023 �0.3425 0.0594 0.1447 0.2603
Inflamm Bowel DisBeltr�an et al
8
system. Different cytokines prevailed in each type of dis-
ease. TNF-a and IL-1b, 2 cytokines that prevailed in both
types of IBD, were shown to inhibit HUVEC IL-33 expres-
sion in vitro.27 However, in lamina propria from CD
patients IFN-c production prevailed, contrary to what was
observed in UC patients with a higher IL-4, IL-5, and
IL-13 content.28 Nonetheless, IL-33 was found to drive
T-helper type 2 (Th2) responses in lymphocytes as well as
inducing maturation and proinflammatory cytokine produc-
tion by mast cells.25,29,30 In UC patients, IL-13 expression
was principally secreted by cytotoxic NK cells from the
lamina propria and mainly associated with disease pathoge-
nesis.28 Moreover, activation of IL-13 receptor induces
TGF-b that was shown to be a factor involved in intestinal
fibrotic processes.31 A similar observation has been
reported the role of IL-33/ST2 in a Trichuris muris intesti-
nal infection model.32 The Th2 response initiated by local
IL-33 confers protection to development of helminthes
FIGURE 4. Immunolocalization of ST2 and IL-33 in colonic tissue from control subjects and IBD patients. For ST2 distribution,Alexa Fluor-488 (green) was selected and propidium iodide (red) was used to stain nuclei (A–C). For IL-33 detection, AlexaFluor-546 (red) was used, but without staining for nuclei. In healthy intestinal mucosa, IL-33 localized in the cytoplasm ofepithelial cells (D); however, in tissue from IBD patients a decreased cytoplasm staining was observed (white arrowhead, E,F)and a strong nuclear staining (white arrow, E,F) indicated an IL-33 redistribution. Note the ST2 and IL-33 positive immuno-staining in crypt epithelial cells in controls and CD. UC shows a scatter immunostaining for both markers. Inserts in (A,B),amplified view of ST2 immunostaining on human colon mucosa (arrow-pointed region). Immunoreactivity of ST2 in UC intes-tinal tissue was scattered and decreased in the epithelia, and observed as damaged tissue with loss of its architecture (C,circled area). ST2 and IL-33 costaining revealed that both markers localize in crypt epithelial cells of control intestinal mucosa(G,H). (G) White square highlights a costained control mucosa crypt that is amplified and its area is delimited (discontinuedwhite circle) (H). Scale bars are shown in lm.
Inflamm Bowel Dis Novel ST2/IL-33 System in IBD
9

infections, mostly due to mast cell activation and recruit-
ments of other cells that can participate in the rejection of
the parasite invasion.32
Uninflamed tissue distribution of ST2 was mainly
found in the cytoplasm and the apical surface of intestinal
crypt epithelial cells. In UC, ST2 immunoreactivity was
diminished and observed as a scatter pattern without a par-
ticular localization, probably as a consequence of the
strong damage of the tissue architecture. This is in accord
with our finding that ST2s is the prevalent isoform in
active UC mucosa that corresponds to the secreted one.
The preferential ST2 expression pattern at the epithelial
level can be related to its crucial role in IBD. Epithelial
cells not only have an important role as a physical barrier,
but also are involved in the secretion of inflammatory
mediators for recruitment of mast cells, macrophages, and
lymphocytes, involved in local immune responses. An
increased IL-33 expression by intestinal epithelial cells was
detected in control subjects and CD patients; however, the
immunostaining distribution for IL-33 differs completely
between groups. Inflamed tissue from IBD patients shows
nuclear staining for IL-33 compared to the exclusive cyto-
plasm mark in healthy tissue.
The nuclear localization of IL-33 observed in IBD
patients can be related to previous studies showing that IL-
33 may act in a way analogous to alarmins IL-1a or
HMGB1: its overexpression induces a potent transcriptional
repression when localized in the cell nucleus.12 IL-33 may
also have extracellular roles, as its release may occur dur-
ing cell damage to activate an inflammatory response in
a fashion similar to HMGB1.33 Thus, IL-33 may be a dual-
functioning protein, acting as a cytokine in some condi-
tions, and as a transcription factor in others. These
activities may be due to a result of proteolysis of IL-33.
However, there is no consensus about the protease that
processes IL-33: caspase-1, 3, 7, or calpain.33–35 There is
no agreement either in regard to the IL-33 isoform that is
released. Contrary to IL-1b, which is secreted upon inflam-
matory insult exposure, IL-33 remains intracellular.36 In
apoptotic macrophages, IL-33 is inactivated by caspase-
processing, but even so IL-33 fragments were kept associ-
ated with cells. Opposite to this, IL-33 is mainly secreted
by macrophages undergoing necrotic cell death.36 However,
caspases are not activated during endothelial necrosis, sug-
gesting that IL-33 is not cleaved during this process.33 In
relation to IBD, CD seems to be the cause of an intrinsic
defect in the apoptotic pathway of autoreactive T cells,
resulting in excessive T-cell responses and UC due to an
increased rate of apoptosis of epithelial cells.37 We
hypothesized that the functional consequences of IL-33
translocation to the nucleus in inflamed tissue may involve
transrepression of certain genes associated with the control
of inflammatory responses as occurs in IBD depending on
the IL-33-expressing cell, not only epithelial but rather
than lymphocytes and infiltrating cells promoting the
inflammatory milieu in mucosa from CD patients. Accord-
ing to our results, we propose that in active UC patients
ST2 serum levels correlate with mucosa levels reflecting
the local increase in blood periphery that was not shown in
the inactive state of the disease. We suggest that ST2
might be considered an additional biomarker of active UC.
In contrast, as occurs with ST2, the increase in IL-33 in
mucosa is not reflected in sera, either in active or inactive
UC patients, even CD. These results are in accord with the
chemoattractant properties of IL-33 that might be restricted
to inflamed tissue.11 Although the CD group could not be
classified according to activity due to the small number of
patients, given the low incidence of the disease in Chile,38
it was possible to identify a strong positive correlation
between local ST2 and IL-33. Moreover, the soluble form
was not detected in these patients, suggesting an induction
of the ST2L/IL-33 pathway, which could participate in the
development of inflammation.11,25
In conclusion, we postulate that the immune response
triggered by IL-33 can induce an uncontrolled immune
response that can stimulate a chronic inflammatory process
responsible for the local intestinal damage that character-
izes IBD. However, the role of IL-33 cellular distribution
needs to be clarified. Therefore, ST2s may constitute a
mechanism to control inflammation observed in IBD
patients. However, if this regulatory mechanism is unre-
strained other alterations may emerge that could respond to
epithelial damage as typically observed in UC.
ACKNOWLEDGMENTWe thank Professor Cecilia Alliende for constructive
support in the immunofluorescence analysis.
REFERENCES1. Baumgart DC, Carding SR. Inflammatory bowel disease: cause and
immunobiology. Lancet. 2007;369:1627–1640.2. Sepulveda SE, Beltran CJ, Peralta A, et al. [Inflammatory bowel dis-
eases: an immunological approach.] Rev Med Chil. 2008;136:367–375.3. Beltran CJ, Candia E, Erranz B, et al. Peripheral cytokine profile in
Chilean patients with Crohn’s disease and ulcerative colitis. Eur Cyto-kine Netw. 2009;20:33–38.
4. Tominaga S. A putative protein of a growth specific cDNA fromBALB/c-3T3 cells is highly similar to the extracellular portion ofmouse interleukin 1 receptor. FEBS Lett. 1989;258:301–304.
5. Oshikawa K, Kuroiwa K, Tago K, et al. Elevated soluble ST2 proteinlevels in sera of patients with asthma with an acute exacerbation. AmJ Respir Crit Care Med. 2001;164:277–281.
6. Tajima S, Oshikawa K, Tominaga S, et al. The increase in serumsoluble ST2 protein upon acute exacerbation of idiopathic pulmonaryfibrosis. Chest. 2003;124:1206–1214.
7. Rehman SU, Mueller T, Januzzi JL Jr. Characteristics of the novelinterleukin family biomarker ST2 in patients with acute heart failure.J Am Coll Cardiol. 2008;52:1458–1465.
8. Becerra A, Warke RV, de Bosch N, et al. Elevated levels of solubleST2 protein in dengue virus infected patients. Cytokine. 2008;41:114–120.
Inflamm Bowel DisBeltr�an et al
10
9. Brunner M, Krenn C, Roth G, et al. Increased levels of soluble ST2protein and IgG1 production in patients with sepsis and trauma. Inten-sive Care Med. 2004;30:1468–1473.
10. Tominaga S, Kuroiwa K, Tago K, et al. Presence and expression of anovel variant form of ST2 gene product in human leukemic cell lineUT-7/GM. Biochem Biophys Res Commun. 1999;264:14–18.
11. Schmitz J, Owyang A, Oldham E, et al. IL-33, an interleukin-1-likecytokine that signals via the IL-1 receptor-related protein ST2 andinduces T helper type 2-associated cytokines. Immunity. 2005;23:479–490.
12. Carriere V, Roussel L, Ortega N, et al. IL-33, the IL-1-like cytokineligand for ST2 receptor, is a chromatin-associated nuclear factor invivo. Proc Natl Acad Sci USA. 2007;104:282–287.
13. Palmer G, Talabot-Ayer D, Lamacchia C, et al. Inhibition of interleu-kin-33 signaling attenuates the severity of experimental arthritis. Ar-thritis Rheum. 2009;60:738–749.
14. Kearley J, Buckland KF, Mathie SA, et al. Resolution of allergicinflammation and AHR is dependent upon disruption of the T1/ST2-IL-33 pathway. Am J Respir Crit Care Med. 2009;179:772–781.
15. Mangan NE, Dasvarma A, McKenzie AN, et al. T1/ST2 expression onTh2 cells negatively regulates allergic pulmonary inflammation. Eur JImmunol. 2007;37:1302–1312.
16. Chapuis J, Hot D, Hansmannel F, et al. Transcriptomic and geneticstudies identify IL-33 as a candidate gene for Alzheimer’s disease.Mol Psychiatry. 2009;14:1004–1016.
17. Miller AM, Xu D, Asquith DL, et al. IL-33 reduces the developmentof atherosclerosis. J Exp Med. 2008;205:339–346.
18. Leung BP, Xu D, Culshaw S, et al. A novel therapy of murine colla-gen-induced arthritis with soluble T1/ST2. J Immunol. 2004;173:145–150.
19. Szerafin T, Niederpold T, Mangold A, et al. Secretion of solubleST2—possible explanation for systemic immunosuppression afterheart surgery. Thorac Cardiovasc Surg. 2009;57:25–29.
20. Hayakawa H, Hayakawa M, Kume A, et al. Soluble ST2 blocks inter-leukin-33 signaling in allergic airway inflammation. J Biol Chem.2007;282:26369–26380.
21. Yin H, Huang BJ, Yang H, et al. Pretreatment with soluble ST2reduces warm hepatic ischemia/reperfusion injury. Biochem BiophysRes Commun. 2006;351:940–946.
22. Silverberg MS, Satsangi J, Ahmad T, et al. Toward an integrated clini-cal, molecular and serological classification of inflammatory bowel dis-ease: Report of a Working Party of the 2005 Montreal World Congressof Gastroenterology. Can J Gastroenterol. 2005;19(suppl A):5–36.
23. Kuroiwa K, Arai T, Okazaki H, et al. Identification of human ST2protein in the sera of patients with autoimmune diseases. BiochemBiophys Res Commun. 2001;284:1104–1108.
24. Kumar S, Tzimas MN, Griswold DE, et al. Expression of ST2, aninterleukin-1 receptor homologue, is induced by proinflammatory stim-uli. Biochem Biophys Res Commun. 1997;235:474–478.
25. Moulin D, Donze O, Talabot-Ayer D, et al. Interleukin (IL)-33 indu-ces the release of pro-inflammatory mediators by mast cells. Cytokine.2007;40:216–225.
26. Colotta F, Dower SK, Sims JE, et al. The type II ‘decoy’ receptor: anovel regulatory pathway for interleukin 1. Immunol Today. 1994;15:562–566.
27. Kuchler AM, Pollheimer J, Balogh J, et al. Nuclear interleukin-33 isgenerally expressed in resting endothelium but rapidly lost uponangiogenic or proinflammatory activation. Am J Pathol. 2008;173:1229–1242.
28. Fuss IJ, Heller F, Boirivant M, et al. Nonclassical CD1d-restricted NKT cells that produce IL-13 characterize an atypical Th2 response in ul-cerative colitis. J Clin Invest. 2004;113:1490–1497.
29. Ali S, Huber M, Kollewe C, et al. IL-1 receptor accessory protein isessential for IL-33-induced activation of T lymphocytes and mastcells. Proc Natl Acad Sci USA. 2007;104:18660–18665.
30. Iikura M, Suto H, Kajiwara N, et al. IL-33 can promote survival, ad-hesion and cytokine production in human mast cells. Lab Invest.2007;87:971–978.
31. Fichtner-Feigl S, Fuss IJ, Young CA, et al. Induction of IL-13 triggersTGF-beta1-dependent tissue fibrosis in chronic 2,4,6-trinitrobenzenesulfonic acid colitis. J Immunol. 2007;178:5859–5870.
32. Humphreys NE, Xu D, Hepworth MR, et al. IL-33, a potent inducerof adaptive immunity to intestinal nematodes. J Immunol. 2008;180:2443–2449.
33. Cayrol C, Girard JP. The IL-1-like cytokine IL-33 is inactivated aftermaturation by caspase-1. Proc Natl Acad Sci USA. 2009;106:9021–9026.
34. Hayakawa M, Hayakawa H, Matsuyama Y, et al. Mature interleukin-33 is produced by calpain-mediated cleavage in vivo. Biochem Bio-phys Res Commun. 2009;387:218–222.
35. Talabot-Ayer D, Lamacchia C, Gabay C, et al. Interleukin-33 is bio-logically active independently of caspase-1 cleavage. J Biol Chem.2009;284:19420–19426.
36. Luthi AU, Cullen SP, McNeela EA, et al. Suppression of interleukin-33 bioactivity through proteolysis by apoptotic caspases. Immunity.2009;31:84–98.
37. Verstege MI, te Velde AA, Hommes DW. Apoptosis as a therapeuticparadigm in inflammatory bowel diseases. Acta Gastroenterol Belg.2006;69:406–416.
38. Figueroa CC, Quera PR, Valenzuela EJ, et al. Inflammatory boweldisease: experience of two Chilean centers. Rev Med Chile. 2005;133:1295–1304.
Inflamm Bowel Dis Novel ST2/IL-33 System in IBD
11
Copyright © 2022 FDOKUMEN