Electrochemical Modified Electrodes Based on Metal‐Salen Complexes
JOURNAL OF APPLIED ELECTROCHEMISTRY 20 (1990) 811-817
Characterization of the morphological modification induced by long term operations on phosphoric acid fuel cell (PAFC) electrodes V. A L D E R U C C I , V. R E C U P E R O , L. PINO, R. DI L E O N A R D O , D. L. COCKE*, N. G I O R D A N O
CNR Institute of Transformation and Storage of Energy, via S. Lucia sopra Contesse 39, 98126 S. Lucia Mess&a, Italy
F. P A R M I G I A N I
Materials Department CISE Tecnologie Innovative S.p.A., via Reggio Emilia 39 - Segrate - 20121 Milano, Italy
Received 18 September 1989; accepted 20 December 1989
The modification of the morphological and adhesive binding of P A F C electrodes has been studied by electron spectroscopy and electron microscopy with regard to their endurance and preparative treatments. The corrosion of the electrodes has been found to dramatically affect the electrical and adhesive contact between PTFE (polytetrafluoroethylene) and active carbon. This has been detected in X-ray photoelectron spectroscopy (XPS) by the 'charging' shift seen for F 1 s due to the loss in electronic contact between these components. In addition, the adhesive character of the contact between the SiC matrix and the gas diffusion electrodes has been revealed by the XPS spectral characteristics. Here a major difference between the anode and the cathode has been observed with the cathode having a greater deadhesion. Extensive physical characterization by pore volume and size distribution, wetting, and weight loss has been performed. These results have been correlated with the XPS results to give a complete model of the deterioration of this technologically important system. A possible explanation for the observed loss of PTFE from the surface of the cathode based on an electrostatic rejection model of the delaminated PTFE particles is also suggested.
1. Introduction
Gas diffusion electrodes of phosphoric acid fuel cells (PAFC) are of extreme interest since their endurance will ultimately determine the future of this technology [1]. Morphological modifications of PAFC gas diffu- sion electrodes are known to cause severe problems of instability and decay during the operating time of these systems [2-4]. To investigate such phenomena in a reasonable time, accelerated testing at open circuit voltage (OCV) conditions has been developed [5]. Results from such tests have been found to be useful to observe the evolution of the carbon corrosion, catalyst sintering and electrolyte wetting processes as a function of time. From an analysis of these results a good approximation for a long term operational model of the electrode under standard conditions can be extrapolated. In the present paper we extend these concepts to electrodes drawn from a 1000 h monocell run, in which some contraction phenomena of the elec- trode structure appeared. This allowed us to investi- gate more thoroughly the subject of the carbon-PTFE interface, namely their adhesion properties modifi- cation resulting from the operating conditions (elec- trolyte, potential, gas atmosphere).
Literature information on morphological modifi- cations induced by long term operation of PAFC electrodes is generally lacking. In addition, the physical nature of the processes must be known. In the past, few previous investigations have dealt with this subject. Klinedinst et al. [6] examined the effect of varying potential upon the stability of the PTFE-graphite bond and measured the variation in the rate of their separation in the presence of hot phosphoric acid. They concluded that changes in the free energy of the process constituted the driving force of the joint failure. This is probably correct, but it provides no insight into the details of the mechanisms involved. In the present investigation we examine this aspect.
An XPS investigation on PTFE-graphite mixtures of NiO electrodes [7] indicated that the existence of different qualities of contacts, depending upon the previous 'electrochemical history' of the samples, can account for the observed variations of the electric resistance in the electrodes. Thus, XPS provides an opportunity to examine the electrical properties of components of these systems. Adhesion depends on the interfacial properties of materials and it is a crucial question as to the exact location and nature of the
* Visiting Professor from Department of Chemistry, Texas A&M University, College Station, Texas, USA.
002|-891X/90 $03.00 + .12 �9 1990 Chapman and Hall Ltd. 811
812 V. ALDERUCCI ET AL.
fracture surface. XPS provides the means to examine these aspects [8].
To supplement interpretation of the phenomena occurring in a monocell we present here parallel results in terms of weight losses, pore size distribution and wettability of electrode samples subjected to OCV conditions up to 300 h. XPS analyses are presented to clarify the role of separation effects of the adhesive- substrate couple in the observed disintegration phenomena of the electrode structure.
2. Experimental details
The electrodes used in the monocell endurance test, were prepared from carbon paper (Stackpole PC 206) wet proofed with a FEP (polytetrafluoroethylene- propylene) solution, dried at 70~ and sintered at 340~ for 15 min. The catalyst ink was prepared by mixing and stirring at 50-60~ for 15 min, 62 ml of H20, 2.2ml of PTFE (Teflon*) solution (51%w/w) and 3 g of 10% Pt/C catalyst. Following this, 23 g of isopropyl alcohol were added to the catalyst ink and the flocculate was screen printed (Argon Modular 2) on the carbon paper. The electrodes were dried in air in two steps at 120 ~ C for 1 h and at 230 ~ C for 30 min, and then sintered (340~ for the cathode and 350~ for the anode). The final contents of PTFE were 40% for the cathode and 50% for the anode. The matrix to retain phosphoric acid between the two electrodes was prepared by mixing 47.5% of SiC (particle size = 7#m) 47.5% of SiC (particle size = 1 #m) and 5% of PTFE diluted with water. The mixture was then dried at 70 ~ C, washed with ethanol to eliminate the tensio- active agent and sintered at 150~ for 15min. The resulting powder was finally laminated to prepare a layer of 0.3mm thickness. Electrodes and matrices were preimpregnated with 98%w/w H3PO 4 (J.T. Baker) at 130 and 180~ respectively and then run in a typical monocell. The test, which was voluntarily discontinued at 1000 h, was performed at 180~ and 1 atm with an air flow into the cathode and with a humidified hydrogen flow (40% R.H.) into the anode. The gas utilization was 50% for both electrodes. Cell voltage, internal resistance and OCV were con- tinuously recorded.
Corrosion tests on sample electrodes were carried out at atmospheric conditions by keeping them in 980/0 W/W H3PO 4 in a Teflon holder. As sintering tem- perature (T~) probably influences the morphological [9-11] and electronic properties of the Teflon-carbon interface, electrodes were manufactured at different Ts (340-370 ~ C) and their modifications under OCV con- ditions were evaluated as follows. The potential of the electrodes, periodically checked with an Amel model 551 potentiostat, was 1.015 V. The H3PO 4 con- tent in the catalyst layer was measured gravimetrically. The weight losses (AW) were determined following complete elimination of the H3PO 4 by washing with methanol after periods of 1, 5, 24, 120 and 296h,
* Teflon is a registered trademark of the E.I. DuPont Co.
respectively. The pore volume and pore size distri- butions of the electrodes were measured by mercury intrusion porosimetry using a Carlo Erba Model 2000 Porosimeter. Phosphoric acid occupation (PAO), taken as an index of the wettability of the electrodes [12-13], was determined using the following equation:
Vp = V~(a/(a + b)) - Vc,(b/(a + b))
where Vp = pore volume of the electrode, Vs = pore volume of the carbon paper, Vcl = pore volume of the catalytic layer, a = density of the carbon paper, b = density of the catalytic layer.
2.1. Optical and electron microscopy
Optical microscopy was carried out with a stereo- microscope (Carl Zeiss Mod. DR) with 200 x total magnification. Transmission electron microscopy was performed using a STEM apparatus (Jeol CX20) whose ultimate spatial resolution is 0.5 nm.
To allow a uniform distribution of the Pt crystal- lites, the catalytic layer was first dispersed in isopropyl alcohol and then deposited and dried on a TEM support comprising a Cu grid covered with a carbon film of a few tens nanometre thickness.
2.2. X-ray photoelectron spectroscopy XPS spectra were taken using a ESCA Lab. 2000 Spectrometer (Perkin Elmer). A1Kc~ X-radiation was used at a power of 300 W and the analyser parameters were: pass energy 89.5 eV and at constant resolution. The spectra of the anode were taken at 65 ~ to the analyser entrance and those for the cathode were taken at 10 ~ to the analyser.
3. Results and discussion
The results are presented in three parts: endurance testing, physical characterization and surface charac- terization.
3.1. Endurance testing
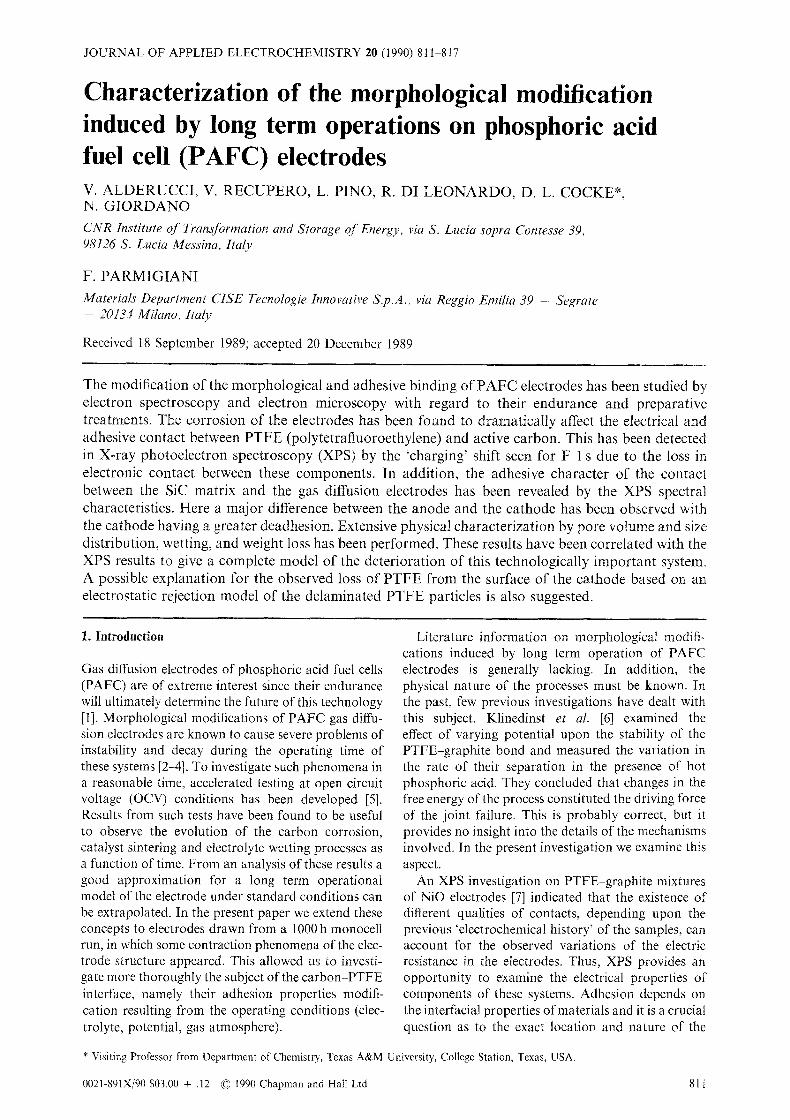
Figure 1, which reports the performance history of the monocell in the 1000 h endurance test, shows a small decrease in the power density (less than 3% of its highest value), while the OCV and the internal resist- ance remain unchanged. At the end of the run, the cell was deliberately exposed to severe conditions (12 h at OCV) which, as well known [14-15], provokes collapse of the structure and losses of Pt. Under these circum- stances, the power decreased dramatically and the run was discontinued.
3.2. Physical characterization
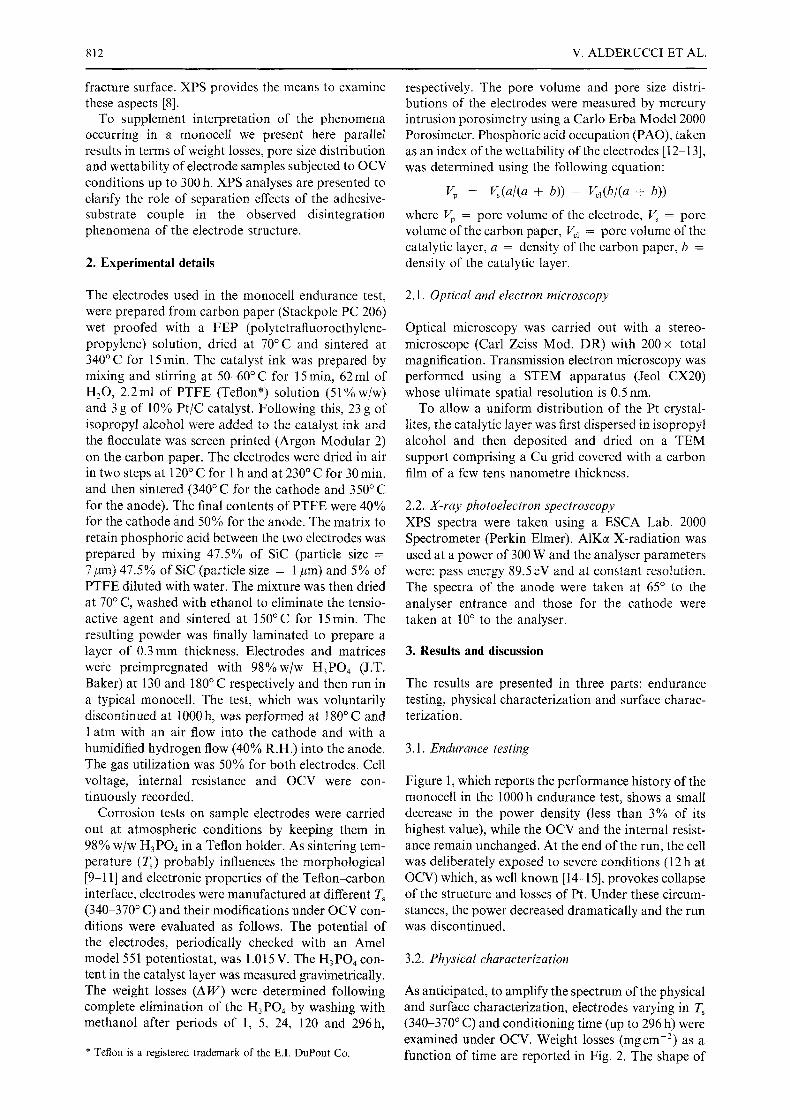
As anticipated, to amplify the spectrum of the physical and surface characterization, electrodes varying in T, (340-370 ~ C) and conditioning time (up to 296 h) were examined under OCV. Weight losses (mgcm -2) as a function of time are reported in Fig. 2. The shape of
LONG TERM OPERATIONS ON PAFC ELECTRODES 813
N
'~90-
E ~80-
7O g ?e
~2 0
#iooo.
900:
8001
700, o 0
~ 1 4
10 C
~ 8 6
0
[a)
I
(b) F
(c)
z60 ~6o 66o Life time (h)
8OO
Fig. 1. Performance history of the phosphoric acid monocell. (a) The power density against time, (b) the OCV value against time, and (c) the internal resistance against time.
~200"
i ~ ] 6 0 I
120. o
8 0 I
L
40 g_
0 0 s'o IbO 15o 2&o 2~o 36o
Time (h)
Fig. 3. PAO values against time. Symbols as in Fig. 2.
(cracks) whose radii (hence volumes) are out o f the measurement range o f the porosimeter (max 7.5 gin). Therefore as the denomina tor in the equation:
Vol. o f H3PO 4 absorbed P A O =
Pore vol. o f catalytic layer
is not well defined, the assignment o f P A O value as above should be taken as an indication rather than an absolute value.
Modifications o f the surface texture o f the materials within the range o f the porosimetric analysis are shown in Fig. 4a-c; a steep decrease o f the pore volume is recorded in the first 24 h (common to either
the plot is c o m m o n to all samples, with losses reaching a max imum value o f 2.1 mg cm 2 for the sample sin- tered at 360 ~ C.
Changes o f the wetting properties o f the electrodes are shown by a gradual increase o f their P A O values which, already high at the onset, undergo, within the 296h test, increases in the range o f 130-210%, with the 350~ sintered sample giving the most significant increase (Fig. 3).
Values o f P A O exceeding 100% should be inter- preted as due to the fact that, as the optical micro- scopy also shows (Fig. 5a-f) , the corrosion process is accompanied by the creation o f extremely large pores
2.0
~-" 1.5 ~E
21.o- 3~ <3
0.5-
0.0 0 50 100 150 200 250
Time (h)
Fig. 2. Weight loss as function of time: (zx) T S - 340~ (@) T~ : 350oc, (A) ~ = 360oc, (o) T, = 370~
~--400: '~. I
~300:
E=2oo. g ~100.
~" 0 (a)
~300
IIbl i ' ' ' 0 (b) . . . . .
~150
O A
i
0 50 100 150 200 250 300 Time (h)
Fig. 4. Pore volume distributions against time: (a) total pore volume, (b) micropores volume, and (c) macropores volume. Symbols as in Fig. 2.
814 V. A L D E R U C C I ET AL.
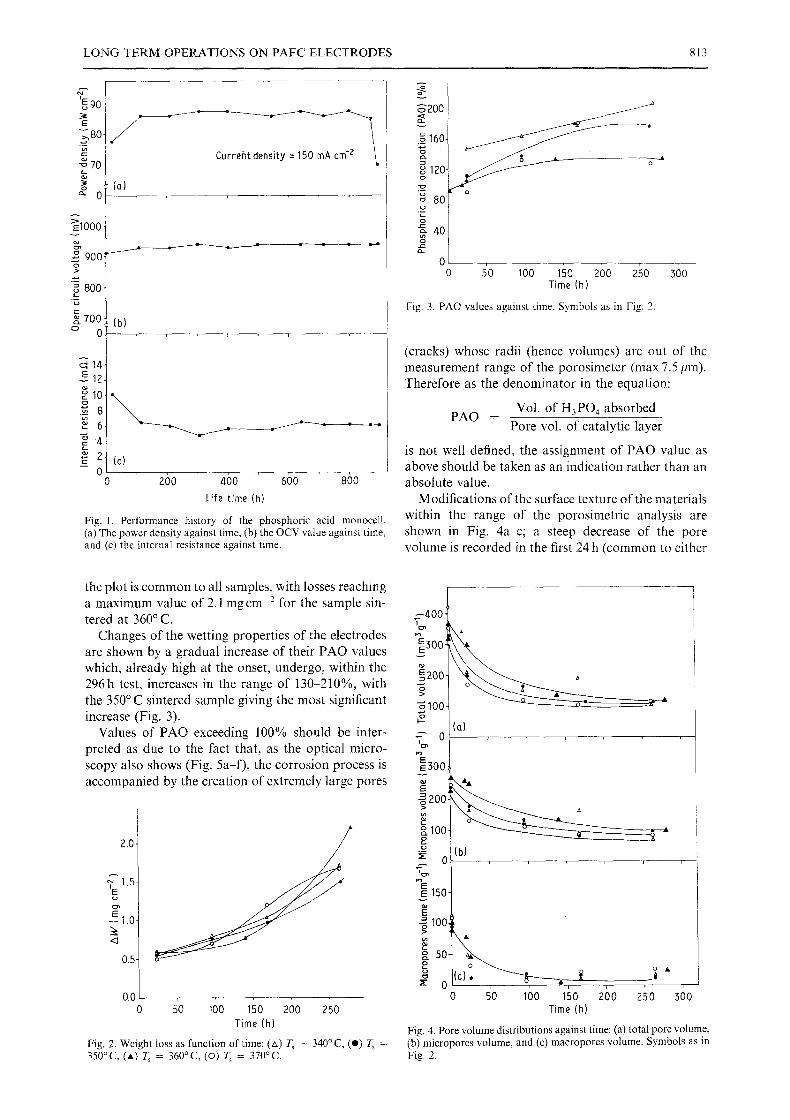
Fig. 5. Optical micrographs: (a) as received, (b) after 5 h, (c) after 24hi (d) after 96h, (e) after 168 h, and (f) after 264h.
micro- and macropore). Steady-state values are reached before the end of the test.
Optical micrographs (80 x) clearly reveal the pro- gressive, but drastic disruption process of the elec- trode surface, as a consequence of the structural
change induced by the operating conditions, as seen in Fig. 5a-f. The initial crack-free surface is seen to be increasingly cracked in a pattern characteristic of a material that is shrinking in volume.
Such a phenomenon appears to be confirmed by the
75. g
50.
25.
2O ~--]19
i' i
L!s
,_10_,'10' 9
10
25
E
11 11 "@ 11o
, . h , , , L ~ . . . . I , Y . , r ~ I, ~ l . . . . . . . . . . . . . . . l 0
10 z 103 104 Pore rQdius (nm)
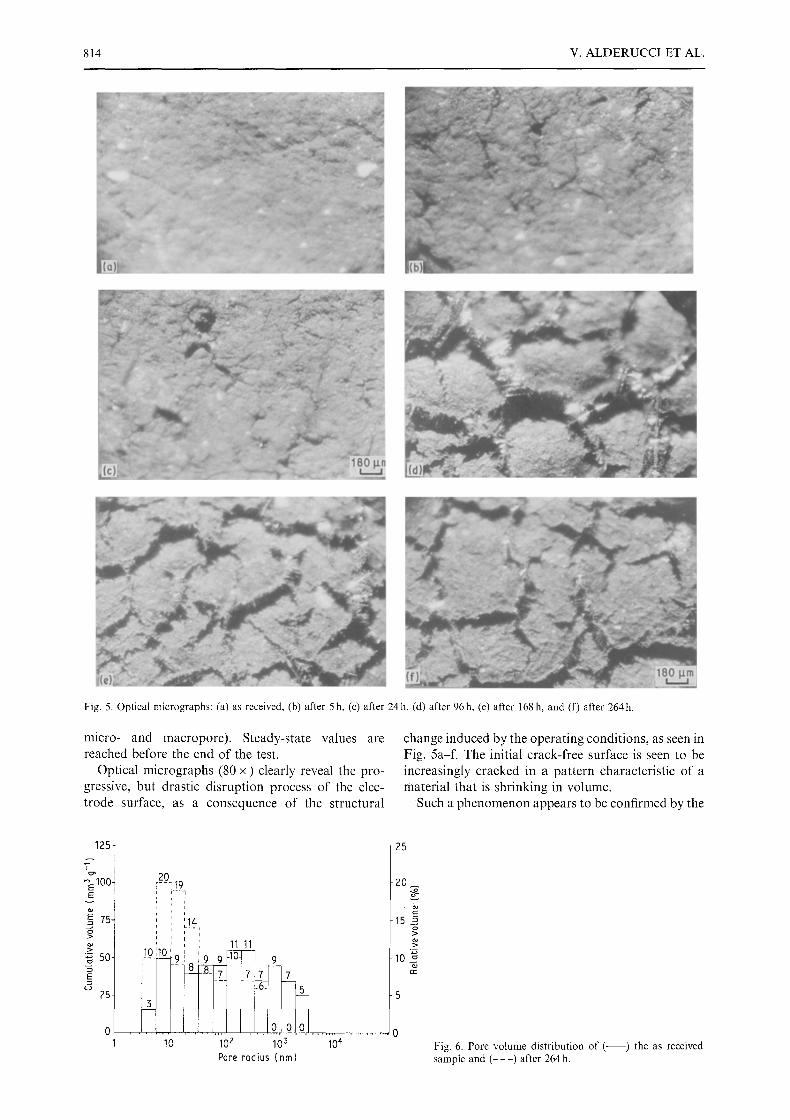
Fig. 6. Pore volume distribution of ( sample and ( - - - ) after 264 h.
) the as received
LONG TERM OPERATIONS ON PAFC ELECTRODES 815
E v)
LLI
1 0
8 -
61
4,
((1) 1 1 0 0 6 6 0 ' 2 2 0
Binding energy (eV)
1 0
u'~ 8 -
u~ 6-
2 -
(b) i
1100 6 6 0 2 2 0
Binding energy (eV}
10
r
LtJ ~.. 6 -
4-
2 -
1100 6 6 0 2 2 0
Binding energy (eV)
10
,.r, 8 -
w 6 .
L~
L~ 4 -
2 -
(d)
1100 6 ; 0 ' 2 2 0
Binding energy (eV)
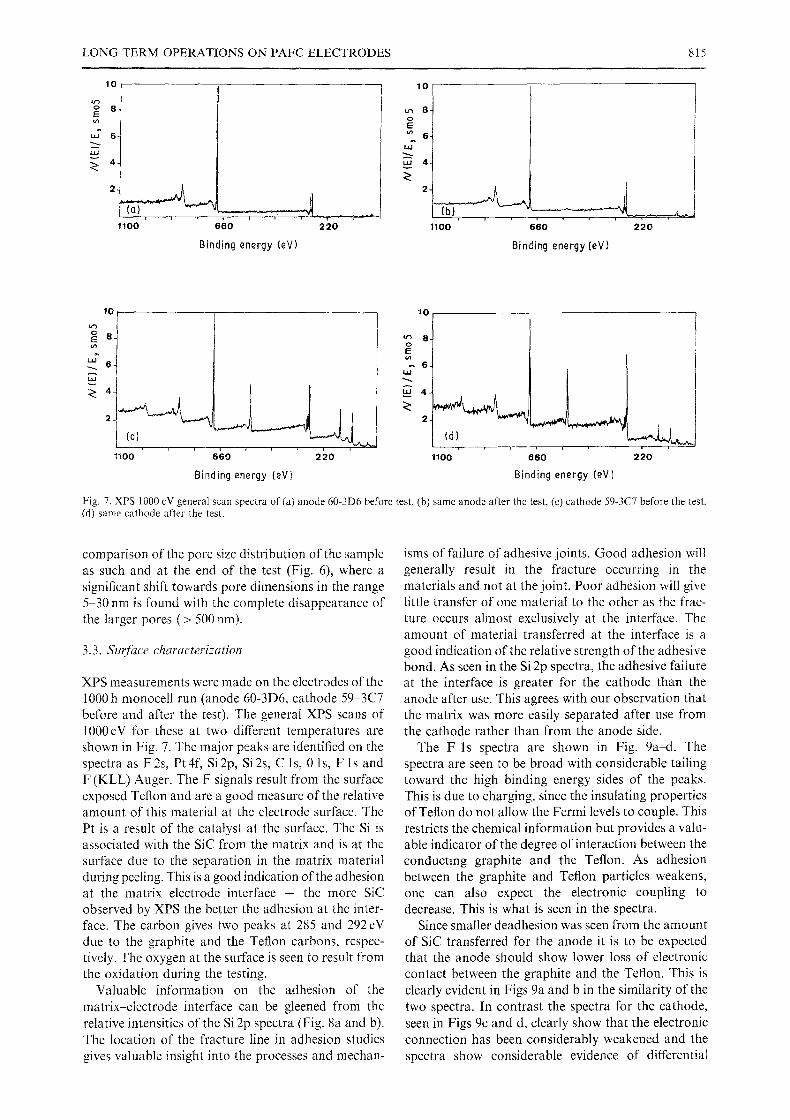
Fig. 7. XPS 1000 cV general scan spectra of (a) anode 60-3D6 before test, (b) same anode after the test, (c) cathode 59-3C7 before the test. (d) same cathode after the test.
comparison of the pore size distribution of the sample as such and at the end of the test (Fig. 6), where a significant shift towards pore dimensions in the range 5-30 nm is found with the complete disappearance of the larger pores (> 500 nm).
3.3. Surface characterization
XPS measurements were made on the electrodes of the I000 h monocell run (anode 60-3D6, cathode 59-3C7 before and after the test). The general XPS scans of 1000eV for these at two different temperatures are shown in Fig. 7. The major peaks are identified on the spectra as F 2s, Pt 4f, Si 2p, Si 2s, C 1 s, 0 1 s, F l s and F (KLL) Auger. The F signals result from the surface exposed Teflon and are a good measure of the relative amount of this material at the electrode surface. The Pt is a result of the catalyst at the surface. The Si is associated with the SiC from the matrix and is at the surface due to the separation in the matrix material during peeling. This is a good indication of the adhesion at the matrix electrode interface - the more SiC observed by XPS the better the adhesion at the inter- face. The carbon gives two peaks at 285 and 292 eV due to the graphite and the Teflon carbons, respec- tively. The oxygen at the surface is seen to result from the oxidation during the testing.
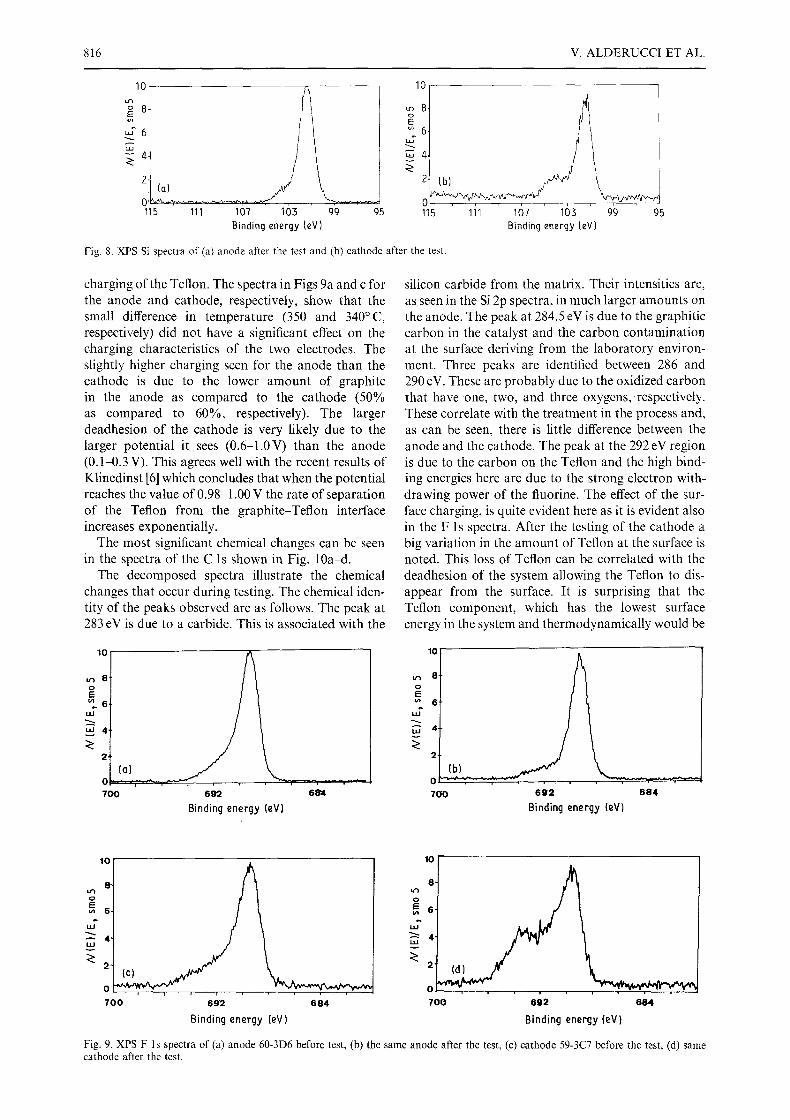
Valuable information on the adhesion of the matrix-electrode interface can be gleened from the relative intensities of the Si 2p spectra (Fig. 8a and b). The location of the fracture line in adhesion studies gives valuable insight into the processes and mechan-
isms of failure of adhesive joints. Good adhesion will generally result in the fracture occurring in the materials and not at the joint. Poor adhesion will give little transfer of one material to the other as the frac- ture occurs almost exclusively at the interface. The amount of material transferred at the interface is a good indication of the relative strength of the adhesive bond. As seen in the Si 2p spectra, the adhesive failure at the interface is greater for the cathode than the anode after use. This agrees with our observation that the matrix was more easily separated after use from the cathode rather than from the anode side.
The F l s spectra are shown in Fig. 9a-d. The spectra are seen to be broad with considerable tailing toward the high binding energy sides of the peaks. This is due to charging, since the insulating properties of Teflon do not allow the Fermi levels to couple. This restricts the chemical information but provides a valu- able indicator of the degree of interaction between the conducting graphite and the Teflon. As adhesion between the graphite and Teflon particles weakens, one can also expect the electronic coupling to decrease. This is what is seen in the spectra.
Since smaller deadhesion was seen from the amount of SiC transferred for the anode it is to be expected that the anode should show lower loss of electronic contact between the graphite and the Teflon. This is clearly evident in Figs 9a and b in the similarity of the two spectra. In contrast the spectra for the cathode, seen in Figs 9c and d, clearly show that the electronic connection has been considerably weakened and the spectra show considerable evidence of differential
10
8.
10
95
8. o
6"
" ' 4"
2
2,
O: 115 Iii 107 103 9'9 95
Binding energy (eV)
Fig. 8. XPS Si spectra of (a) anode after the test and (b) cathode after the test.
charging of the Teflon. The spectra in Figs 9a and c for the anode and cathode, respectively, show that the small difference in temperature (350 and 340~ respectively) did not have a significant effect on the charging characteristics of the two electrodes. The slightly higher charging seen for the anode than the cathode is due to the lower amount of graphite in the anode as compared to the cathode (50% as compared to 60%, respectively). The larger deadhesion of the cathode is very likely due to the larger potential it sees (0.6-1.0V) than the anode (0.1-0.3 V). This agrees well with the recent results of Klinedinst [6] which concludes that when the potential reaches the value of 0.98-1.00 V the rate of separation of the Teflon from the graphite-Teflon interface increases exponentially.
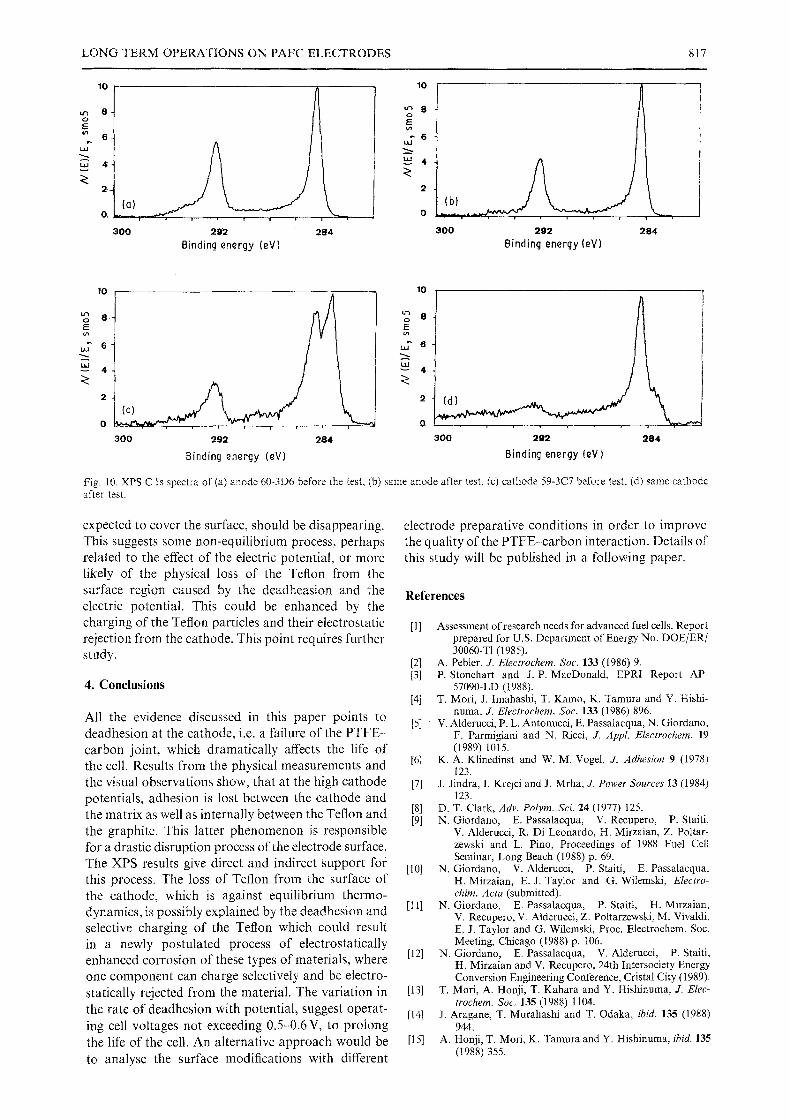
The most significant chemical changes can be seen in the spectra of the C ls shown in Fig. 10a-d.
The decomposed spectra illustrate the chemical changes that occur during testing. The chemical iden- tity of the peaks observed are as follows. The peak at 283 eV is due to a carbide. This is associated with the
10
700
10
6 9 2
Binding energy (eV}
�9 - , , ,
68"4
silicon carbide from the matrix. Their intensities are, as seen in the Si 2p spectra, in much larger amounts on the anode. The peak at 284.5 eV is due to the graphitic carbon in the catalyst and the carbon contamination at the surface deriving from the laboratory environ- ment. Three peaks are identified between 286 and 290 eV. These are probably due to the oxidized carbon that have one, two, and three oxygens, respectively. These correlate with the treatment in the process and, as can be seen, there is little difference between the anode and the cathode. The peak at the 292 eV region is due to the carbon on the Teflon and the high bind- ing energies here are due to the strong electron with- drawing power of the fluorine. The effect of the sur- face charging, is quite evident here as it is evident also in the F ls spectra. After the testing of the cathode a big variation in the amount of Teflon at the surface is noted. This loss of Teflon can be correlated with the deadhesion of the system allowing the Teflon to dis- appear from the surface. It is surprising that the Teflon component, which has the lowest surface energy in the system and thermodynamically would be
70"(
8"
r 6 '
4.
2
0 t �9 , , - ,
692 684
Binding energy (eV)
816 V. ALDERUCCI ET AL.
0 700
8"
o E ~n 6 -
UJ
4- uJ
2"
692 684
lo , A
115 111 107 103 99 Binding energy (eV)
Binding energy (eV)
10
8 .
~ 6 -
~ 4 "
~ 2
0 700 692 684
Binding energy (eV)
Fig. 9. XPS F Is spectra of (a) anode 60-3D6 before test, (b) the same anode after the test, (c) cathode 59-3C7 before the test, (d) same cathode after the test.
10
la~ 8 , �84
E oi
6
u~ 4
10
292
Binding energy (eV) 284
(b)
300 292
Binding energy (eV)
10
8
u~
6 LLJ
uJ 4
2
~o E u~
LLJ
L~J
284
10
300 292 284
Binding energy (eV)
6
4
2--
O.
300
2
(I
8 0 E t/}
~ 6
t.~ 4
300 292 284
Binding energy (eV)
L O N G T E R M O P E R A T I O N S ON P A F C E L E C T R O D E S 817
Fig. 10. XPS C ls spectra of (a) anode 60-3D6 before the test, (b) same anode after test, (c) cathode 59-3C7 before test, (d) same cathode after test.
expected to cover the surface, should be disappearing. This suggests some non-equilibrium process, perhaps related to the effect of the electric potential, or more likely of the physical loss of the Teflon from the surface region caused by the deadheasion and the electric potential. This could be enhanced by the charging of the Teflon particles and their electrostatic rejection from the cathode. This point requires further st~Jdy.
4. Conclusions
All the evidence discussed in this paper points to deadhesion at the cathode, i.e. a failure of the PTFE- carbon joint, which dramatically affects the life of the cell. Results from the physical measurements and the visual observations show, that at the high cathode potentials, adhesion is lost between the cathode and the matrix as well as internally between the Teflon and the graphite. This latter phenomenon is responsible for a drastic disruption process of the electrode surface. The XPS results give direct and indirect support for this process. The loss of Teflon from the surface of the cathode, which is against equilibrium thermo- dynamics, is possibly explained by the deadhesion and selective charging of the Teflon which could result in a newly postulated process of electrostatically enhanced corrosion of these types of materials, where one component can charge selectively and be electro- statically rejected from the material. The variation in the rate of deadhesion with potential, suggest operat- ing cell voltages not exceeding 0.5-0.6 V, to prolong the life of the cell. An alternative approach would be to analyse the surface modifications with different
electrode preparative conditions in order to improve the quality of the PTFE-carbon interaction. Details of this study will be published in a following paper.
References
[1] Assessment of research needs for advanced fuel cells. Report prepared for U.S. Department of Energy No. DOE/ER/ 30060-T1 (1985).
[2] A. Pebler, J. Electrochem. Soc. 133 (1986) 9. [3] P. Stonehart and J. P. MacDonald, EPRI Report AP-
57090-LD (1988). [4] T. Mori, J. Imahashi, T. Kamo, K. Tamura and Y. Hishi-
numa, J. Electrochem. Soc. 133 (1986) 896. [5] V. Alderucci, P. L. Antonucci, E. Passalacqua, N. Giordano,
F. Parmigiani and N. Ricci, J. Appl. Electrochem. 19 (1989) 1015.
[6] K.A. Klinedinst and W. M. Vogel, J. Adhesion 9 (1978) 123.
[7] J, Jindra, I. Krejci and J. Mrha, J. Power Sources 13 (1984) 123.
[8] D.T. Clark, Adv. Polym. Sci. 24 (I977) 125. [9] N. Giordano, E. Passalacqua, V. Recupero, P. Staiti,
V. Alderucci, R. Di Leonardo, H. Mirzaian, Z. Poltar- zewski and L. Pino, Proceedings of 1988 Fuel Cell Seminar, Long Beach (1988) p. 69.
[10] N. Giordano, V. Alderucci, P. Staiti, E. Passalacqua, H. Mirzaian, E. J. Taylor and G. Wilemski, Electro- chim. Acta (submitted).
[11] N. Giordano, E. Passalacqua, P. Staiti, H. Mirzaian, V. Recupero, V. Alderucci, Z. Poltarzewski, M. Vivaldi, E. J. Taylor and G. Wilemski, Proc. Electrochem. Soc. Meeting, Chicago (1988) p. 106.
[12] N. Giordano, E. Passalacqua, V. Alderucci, P. Staiti, H. Mirzaian and V. Recupero, 24th Intersociety Energy Conversion Engineering Conference, Cristal City (1989).
[13] T. Mori, A. Honji, T. Kahara and Y. Hishinuma, J. Elec- trochem. Soc. 135 (1988) 1104.
[14] J. Aragane, T. Murahashi and T, Odaka, ibid. 135 (1988) 944.
[15] A. Honji, T. Mori, K. Tamura and Y. Hishinuma, ibid. 135 (1988) 355.
Copyright © 2022 FDOKUMEN