Characterization of microorganisms by thermogravimetric analysis–mass spectrometry
11
Analytica Chimica Acta 536 (2005) 283–293 Characterization of microorganisms by thermogravimetric analysis–mass spectrometry A. Peter Snyder a,∗ , Ashish Tripathi b , Jacek P. Dworzanski b , Waleed M. Maswadeh a , Charles H. Wick a a Research and Technology Directorate, Edgewood Area Aberdeen Proving Ground, Aberdeen, MD 21010-5424, USA b Geo-Centers, Inc., Edgewood Area, Aberdeen Proving Ground, Aberdeen, MD 21010-5424, USA Received 13 September 2004; received in revised form 14 December 2004; accepted 14 December 2004 Available online 25 January 2005 Abstract A thermogravimetric analysis (TGA) system was interfaced to a mass spectrometry (MS) detector to investigate the thermal evolution of decomposition products from microorganisms. Traditionally, TGA–MS has been used to investigate the thermal parameters and chemical composition of materials such as the coal and lignin energy producing compounds and a wide range of technical organic polymers. The relative weight loss of biochemical species and compounds in bacteria from the TGA system allowed a comparison to the relative amounts of the same substances in bacteria from conventional microbiological extraction and isolation techniques. MS is shown to produce information rich total ion chromatogram profiles of thermal products from biochemical standards and microorganisms. The TGA thermal weight loss chromatogram (TWC) provides a degree of resolution, because the bacterial biochemical substances and components partition in a temporal fashion. Standard biochemical substances such as dipicolinic acid, polyhydroxybutyric acid, and peptidoglycan are produced in the same general temperature region in the TWC profile, and the compounds have similar mass spectra compared to those from microorganisms. Characterization of microorganisms was possible by the relation of their thermal events and extracted mass spectra to those of low and high mass model biochemical compounds. © 2004 Elsevier B.V. All rights reserved. Keywords: Gram-positive bacteria; TGA–MS; Thermogravimetric analysis; Mass spectrometry; Thermal programming; Biomarkers; Bacillus 1. Introduction Thermal analysis is a convenient processing technique for the transformation of relatively large substances into com- pounds suitable for analysis by mass spectrometry (MS) instrumentation. Thermal processing can be performed by linear programming to impose a defined heating gradient in the minutes timeframe. Temperatures in the 300–800 ◦ C range are used for bond breakage and fractionation of a sub- stance into entities for MS detection and potential identifi- cation [1,2]. Rapid heating, or pyrolysis, can provide high temperatures for bond breakage of a sample in the seconds ∗ Corresponding author. Tel.: +1 410 436 2416; fax: +1 410 436 1912. E-mail address: [email protected] (A.P. Snyder). timeframe [3,4]. Therefore, while slow heating provides high resolution of product evolution envelopes, a rapid heating rate produces a relatively poorer resolution of product distribution envelopes. Bacteria have been investigated by Py-MS for individual biochemical constituents [5,6]. These compounds provide various degrees of biological characterization and iden- tification capabilities with respect to the identity of the microorganism. Patterns of masses contain fundamental in- formation such as the carbohydrate and protein components. Individual compounds can also yield distinctive informa- tion that relate to Gram-positive and Gram-negative mi- croorganism status. Pyrolyzate compounds directly related to these two taxonomic microbiological groups and detected by MS include dipicolinic acid (DPA) and picolinic acid [7,8], 0003-2670/$ – see front matter © 2004 Elsevier B.V. All rights reserved. doi:10.1016/j.aca.2004.12.036
-
Upload
independent -
Category
Documents
-
view
8 -
download
0
Transcript of Characterization of microorganisms by thermogravimetric analysis–mass spectrometry

Analytica Chimica Acta 536 (2005) 283–293
Characterization of microorganisms by thermogravimetricanalysis–mass spectrometry
A. Peter Snydera,∗, Ashish Tripathib, Jacek P. Dworzanskib,Waleed M. Maswadeha, Charles H. Wicka
a Research and Technology Directorate, Edgewood Area Aberdeen Proving Ground, Aberdeen, MD 21010-5424, USAb Geo-Centers, Inc., Edgewood Area, Aberdeen Proving Ground, Aberdeen, MD 21010-5424, USA
Received 13 September 2004; received in revised form 14 December 2004; accepted 14 December 2004Available online 25 January 2005
Abstract
A thermogravimetric analysis (TGA) system was interfaced to a mass spectrometry (MS) detector to investigate the thermal evolution ofdecomposition products from microorganisms. Traditionally, TGA–MS has been used to investigate the thermal parameters and chemicalc mers. Ther amounts oft nformationr eight lossc n a temporalf n the sameg organisms.C ow and highm©
K
1
tpilirsct
ighratetion
ualdeden-theal in-ents.a-mi-
latedcted
0d
omposition of materials such as the coal and lignin energy producing compounds and a wide range of technical organic polyelative weight loss of biochemical species and compounds in bacteria from the TGA system allowed a comparison to the relativehe same substances in bacteria from conventional microbiological extraction and isolation techniques. MS is shown to produce iich total ion chromatogram profiles of thermal products from biochemical standards and microorganisms. The TGA thermal whromatogram (TWC) provides a degree of resolution, because the bacterial biochemical substances and components partition iashion. Standard biochemical substances such as dipicolinic acid, polyhydroxybutyric acid, and peptidoglycan are produced ieneral temperature region in the TWC profile, and the compounds have similar mass spectra compared to those from microharacterization of microorganisms was possible by the relation of their thermal events and extracted mass spectra to those of lass model biochemical compounds.2004 Elsevier B.V. All rights reserved.
eywords:Gram-positive bacteria; TGA–MS; Thermogravimetric analysis; Mass spectrometry; Thermal programming; Biomarkers; Bacillus
. Introduction
Thermal analysis is a convenient processing technique forhe transformation of relatively large substances into com-ounds suitable for analysis by mass spectrometry (MS)
nstrumentation. Thermal processing can be performed byinear programming to impose a defined heating gradientn the minutes timeframe. Temperatures in the 300–800◦Cange are used for bond breakage and fractionation of a sub-tance into entities for MS detection and potential identifi-ation [1,2]. Rapid heating, or pyrolysis, can provide highemperatures for bond breakage of a sample in the seconds
∗ Corresponding author. Tel.: +1 410 436 2416; fax: +1 410 436 1912.E-mail address:[email protected] (A.P. Snyder).
timeframe[3,4]. Therefore, while slow heating provides hresolution of product evolution envelopes, a rapid heatingproduces a relatively poorer resolution of product distribuenvelopes.
Bacteria have been investigated by Py-MS for individbiochemical constituents[5,6]. These compounds provivarious degrees of biological characterization and itification capabilities with respect to the identity ofmicroorganism. Patterns of masses contain fundamentformation such as the carbohydrate and protein componIndividual compounds can also yield distinctive informtion that relate to Gram-positive and Gram-negativecroorganism status. Pyrolyzate compounds directly reto these two taxonomic microbiological groups and deteby MS include dipicolinic acid (DPA) and picolinic acid[7,8],
003-2670/$ – see front matter © 2004 Elsevier B.V. All rights reserved.oi:10.1016/j.aca.2004.12.036

284 A.P. Snyder et al. / Analytica Chimica Acta 536 (2005) 283–293
2-pyridinecarboxamide[9], branched fatty acids[10,11], ni-trogenous containing sugar species from Gram-positive or-ganisms[12], and derivative compounds of fatty acids[13]from the lipopolysaccharide material in Gram-negative bac-teria.
Differential scanning calorimetry (DSC) is a thermal tech-nique that is predominately used to monitor the inactivationand thermally induced death of microorganisms[14–20]. Asignificant benefit in DSC is that thermal absorption eventsare observed directly and no transfer modules are necessary.However, only thermal correlations can be performed, be-cause all products must remain in the region of the sample.Thus, DSC does not provide mechanisms for analysis or sep-aration of the thermal products such as MS identification andstructural analysis methodologies.
Thermogravimetric analysis (TGA) interfaced to MS pro-vides attractive figures of merit. This method of solid sam-ple interrogation allows for a relative quantitative analysis ofthermal products from the TGA and qualitative informationfrom the mass spectral dimension of information. Basically,TGA measures a direct weight loss from the thermal fraction-ation of a sample, and this can be obtained at different heatingrates for different final temperatures. TGA information alsoincludes relative weight loss amounts of different products atdifferent times (temperatures) in a heating regime. In addi-t rans-f r linea s pat-t ationo gram( m-i ctrali cana tionam thist ni-c sucha ds ofi nti-fi
nde s andm undsa ittleT isms msi rmedf ner-a tionf mi-c olari
om-p andm db rred
from the masses and pattern of masses (fingerprint). Stan-dard compounds and microorganisms were analyzed fromthis information by TGA–MS. Gram-positive organismbiomarker information from TGA–MS is shown to include2-pyridinecarboxylic acid (picolinic acid). Select organismsare known to contain the polyhydroxybutyric acid (PHBA)energy storage compound[12,22,23]. A direct correlationof PHBA presence was observed with that in the microbio-logical literature and the TGA–MS thermal and mass chro-matograms. Preliminary thermal investigations are presentedto evaluate the feasibility of microorganism characterizationby TGA–MS.
2. Experimental
2.1. Materials
PHBA and DPA biochemical standards were obtainedfrom Sigma–Aldrich (St. Louis, MO, USA). Proteinsin powdered form were purchased from Sigma–Aldrichas follows: myoglobin (MYO) (M 0630, molecularweight (MW) = 17,200), ovalbumin (OVAL) (A 2512,MW = 44,300), bovine serum albumin (BSA) (A 7638,MW = 66,430), bovine milk beta-lactoglobulin B (BLAC) (L8 hy-d icalc an inm -c edf thed
2
cta asd wass ypti-c batedo ana ilt wthw n ster-i rials poru-l cells su poreg copy.V rt orl aller,h ee-fl shed
ion, a substantial amount of thermal products can be terred through a heated, deactivated fused silica transfend into a high performance mass spectrometer for mas
ern, specific masses, and structural information. Correlf the weight loss to the mass spectral total ion chromatoTIC) reveals quantitative information for specific biochecals and class of biochemical with qualitative mass spedentification. The relative weight loss amount from TGAlso be compared to the same substance(s) from convenicrobiological extraction and isolation techniques. With
ype of information available in a TGA–MS analysis, techal organic polymer and energy producing compoundss coal and lignin have been the predominate compoun
nvestigation for thermal fractionation and structural idecation[18,21].
TGA–MS investigations of technical polymers anergy-producing compounds were used as blueprintodels for investigations herein on biochemical compond microorganisms. The literature provides very lGA–MS analyses for biochemical and microorganpecies[18,21]. Of particular importance for microorganiss that a broad array of products and fragments are forom their thermal processing. In general, thermally geted biological compounds imparting particular informa
or the characterization of specific and broad groups ofroorganisms usually contain moieties that are highly pn nature[6–9,11,12].
TGA–MS correlates direct compound or class of cound with weight loss, time, temperature, masses,ass pattern(s)[21]. Specific structural information aniochemical class of compound identification are infe
l
005, MW = 18,276) and bovine erythrocyte carbonic anrase (CAH) (C 3934, MW = 29,024). Standard biochemompounds and proteins were applied onto the sample pilligram quantities in the dry powder form. TheStaphylooccal aureuspeptidoglycan (PTG) biopolymer was obtainrom Sigma–Aldrich (#77140), and milligram amounts ofry powder were used.
.2. Bacteria preparation procedures
Gram-positive spores and vegetative cells ofBacillusereusATCC 6464 (BC) andB. atrophaeus(formerlyB. sub-ilis var globigii) (BG) [24], spores ofB. megaterium(BM),ndB. thuringiensis(BT) vegetative cells were preparedescribed in the following procedures. A Bacillus culturetreaked for isolation onto an agar plate containing trase soy agar (TSA) and 5% sheep’s blood and incuvernight at 37◦C. A single colony was streaked ontogar plate and incubated at 37◦C for about 4–6 h or unt
here was visible growth on the plate. The bacterial groas scraped from the agar plate and was suspended i
le broth or saline. Five hundred microliters of the bacteuspension was pipetted onto the surface of nutrient s
ation media in an agar plate and spread evenly with apreader. These plates were incubated at 37◦C for three dayntil spore production reached a maximum, and the seneration was monitored using phase contrast microsegetative cells appeared as dark oblong cells in sho
ong chains except for BG. BG spores appeared as smighly refractile bodies either within vegetative cells or froating. Growth was scraped from the agar plates and wa
A.P. Snyder et al. / Analytica Chimica Acta 536 (2005) 283–293 285
twice with 200 ml sterile water, resuspended in sterile water,heat-killed, and lyophilized.
Vegetative Bacillus cells were prepared by suspending iso-lated colonies from TSA and sheep’s blood agar plates insterile water to a density corresponding to a 1 McFarlandstandard[25]. This was diluted 1:10, and 2 ml of the 1:10suspension was added to 200 ml of nutrient broth. The nu-trient broth was incubated overnight at ambient temperature,centrifuged, and washed twice with 200 ml sterile water. Thebacterial pellet was re-suspended in sterile water, heat-killed,and lyophilized. All cultures were autoclaved for 20 min tokill both vegetative cells and spores. Organisms were han-dled and processed under minimal Biosafety level BL-1 con-ditions.
2.3. Instrumentation
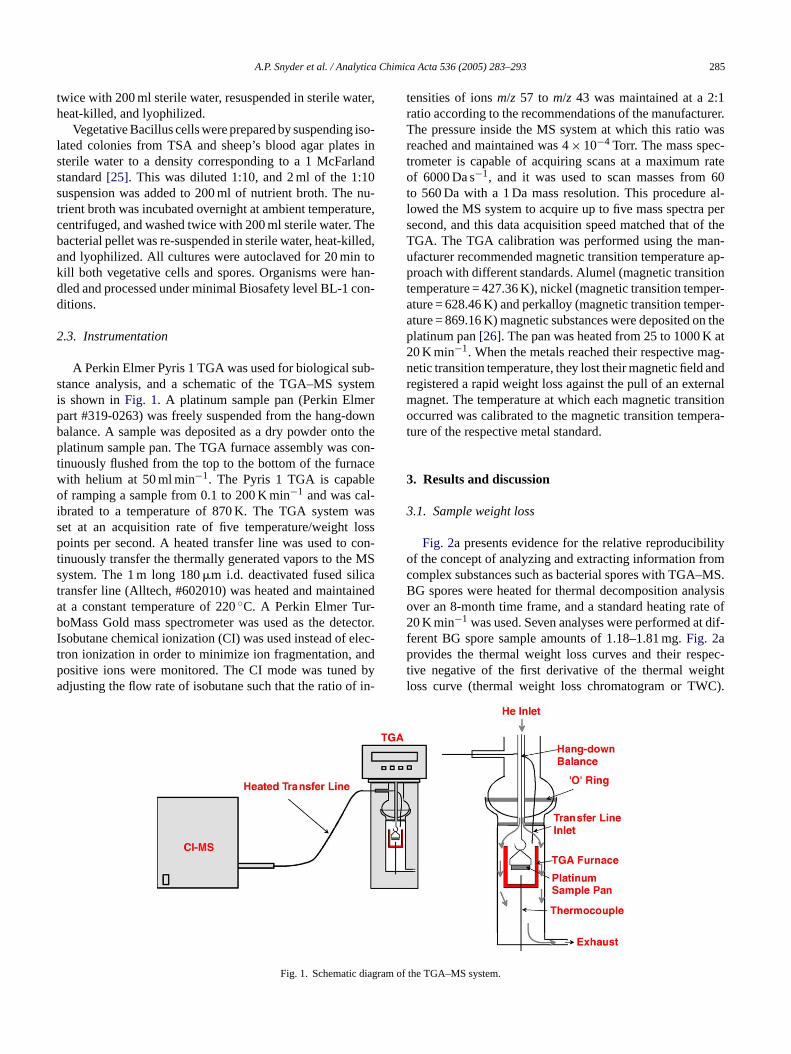
A Perkin Elmer Pyris 1 TGA was used for biological sub-stance analysis, and a schematic of the TGA–MS systemis shown inFig. 1. A platinum sample pan (Perkin Elmerpart #319-0263) was freely suspended from the hang-downbalance. A sample was deposited as a dry powder onto theplatinum sample pan. The TGA furnace assembly was con-tinuously flushed from the top to the bottom of the furnacewith helium at 50 ml min−1. The Pyris 1 TGA is capableo −1 -i wass lossp con-t MSs at ineda -b tectorI elec-t ndp bya f in-
tensities of ionsm/z 57 tom/z 43 was maintained at a 2:1ratio according to the recommendations of the manufacturer.The pressure inside the MS system at which this ratio wasreached and maintained was 4× 10⁻⁴ Torr. The mass spec-trometer is capable of acquiring scans at a maximum rateof 6000 Da s−1, and it was used to scan masses from 60to 560 Da with a 1 Da mass resolution. This procedure al-lowed the MS system to acquire up to five mass spectra persecond, and this data acquisition speed matched that of theTGA. The TGA calibration was performed using the man-ufacturer recommended magnetic transition temperature ap-proach with different standards. Alumel (magnetic transitiontemperature = 427.36 K), nickel (magnetic transition temper-ature = 628.46 K) and perkalloy (magnetic transition temper-ature = 869.16 K) magnetic substances were deposited on theplatinum pan[26]. The pan was heated from 25 to 1000 K at20 K min−1. When the metals reached their respective mag-netic transition temperature, they lost their magnetic field andregistered a rapid weight loss against the pull of an externalmagnet. The temperature at which each magnetic transitionoccurred was calibrated to the magnetic transition tempera-ture of the respective metal standard.
3. Results and discussion
3
ilityo omc –MS.B lysiso te of2 t dif-fp pec-t ghtl C).
gram
f ramping a sample from 0.1 to 200 K minand was calbrated to a temperature of 870 K. The TGA systemet at an acquisition rate of five temperature/weightoints per second. A heated transfer line was used to
inuously transfer the thermally generated vapors to theystem. The 1 m long 180�m i.d. deactivated fused silicransfer line (Alltech, #602010) was heated and maintat a constant temperature of 220◦C. A Perkin Elmer TuroMass Gold mass spectrometer was used as the de
sobutane chemical ionization (CI) was used instead ofron ionization in order to minimize ion fragmentation, aositive ions were monitored. The CI mode was tuneddjusting the flow rate of isobutane such that the ratio o
Fig. 1. Schematic dia
.
.1. Sample weight loss
Fig. 2a presents evidence for the relative reproducibf the concept of analyzing and extracting information fromplex substances such as bacterial spores with TGAG spores were heated for thermal decomposition anaver an 8-month time frame, and a standard heating ra0 K min−1 was used. Seven analyses were performed a
erent BG spore sample amounts of 1.18–1.81 mg.Fig. 2arovides the thermal weight loss curves and their res
ive negative of the first derivative of the thermal weioss curve (thermal weight loss chromatogram or TW
of the TGA–MS system.

286 A.P. Snyder et al. / Analytica Chimica Acta 536 (2005) 283–293
Fig. 2. (a) TGA weight loss profiles ofB. subtilis(BG) spores at a heatingrate of 20 K min−1. Seven replicate weight loss curves and their respectivethermal weight loss chromatograms (TWC) are presented. Experimentalweights of 1.18–1.81 mg of BG spores were used. Replicates were obtainedover an 8-month period. (b) Weight loss curve forB. cereusspores at a heatingrate of 20 K min−1. Shown are the original weight loss gray dotted curve,TGA TWC (solid gray), and the mass spectral total ion chromatogram dashedblack curve. Vertical dotted lines delineate the TWC events 1–3 between linesa, b; b, c; and c, d, respectively.
The weight loss curves and TWC profiles were normal-ized for direct comparison purposes. A high degree of re-producibility is observed for an extended period of timeover a wide experimental range of pyrolysis product evo-lution.
A detailed thermal characterization of a BC spore sam-ple is shown inFig. 2b. The 20 K min−1 heating rate pro-duced thermal weight loss information in a time envelopeof 15 min. The dotted dark gray curve represents the origi-
nal thermal weight loss curve of the bacterial components,and the solid gray curve is the TWC. A minimal amount oftime occurs for the thermally generated products to travelthrough the transfer line to the MS detector (Fig. 1). There-fore the mass spectral TIC (dashed black line inFig. 2b)is shifted to a slightly longer time period compared to theTWC.
The appearance of the mass spectral TIC is very simi-lar in general to that of pyrolysis and linear programmedheating techniques applied to biochemical and bacterial sam-ples [1,27,28]. These techniques include Curie point wire,quartz tube pyrolysis, and filament and ribbon heating meth-ods[4]. The quartz tube walls and the Curie point reactiontube may adsorb or alter the primary products into secondarypyrolysis species and fragments[7,29]. The TWC inFig. 2bprovides a benchmark for the primary thermal products. In-deed a faithful transfer of the thermal products to the MSdetector appears to take place, because the mass spectralTIC sample detection curve closely tracks the TGA TWC.Fig. 2b shows three distinct peaks labeled 1–3. The appear-ance of three peaks is similar to that in previous literaturewith respect to thermal processing of biological samples[27,28].
The TGA TWC reveals the generation of relative amountsof biochemical compounds and classes of substances thatc fectm rama ini am-p tionw nts.M imaly rallyo Thisyp BCs edo ght,r pro-je andb the
Table 1Percent evolution of compounds in thermal weight loss chromatogram (TWC
Organism TWC event
TGA1a T
B. cereusspore 23.5B. cereusvegetative 21.8B. subtilisspored 17.0 (4.2) )B. subtilisvegetative 24.0B. megateriumspore 20.5B. thuringiensisvegetative 31.8
a TGA1 = percent weight loss from thermal event 1.b TGA2 = percent weight loss from thermal event 2.c TGA3 = percent weight loss from thermal event 3.d % standard deviation in parentheses from seven experiments over 8 mon
an be found in the intact BC organism. In order to efeasurable intensities in a weight loss experiment, milligmounts of sample were used. The heating rate of 20 K m−1
s relatively slow, and as such, milligram amounts of sle were satisfactory to provide enough product evoluith reasonable resolution of the individual thermal eveicrogram amounts of bacterial sample produced min
ields of thermal components and were spread tempover the relatively slow heating rate (data not shown).ielded negligible thermal peak intensities.Table 1lists theercent yield of the three major thermal events frompores in the TWC inFig. 2b. Events 1–3 are composf 23.5%, 37.3%, and 4.6% of the original sample weiespectively. These values relate to where the TWC isected onto the primary weight loss curve (Fig. 2b). Forxample, the first two vertical dotted lines labeled ain Fig. 2b delineate the temperature boundaries of
) events from spores and vegetative bacteria
GA2b TGA3c Residual
37.3 4.6 23.537.0 – 28.3
31.6 (2.3) 12.4 (1.8) 28.2 (9.132.3 – 29.838.3 7.1 25.032.3 – 25.5
ths.

A.P. Snyder et al. / Analytica Chimica Acta 536 (2005) 283–293 287
Fig. 3. Mass spectral TIC detection curves from TGA thermal decomposi-tion processes ofB. subtilis(BG),B. cereus(BC),B. megaterium(BM), andB. thuringiensis(BT) at a heating rate of 20 K min−1. MYO, myoglobin;BLAC, beta-lactoglobulin; CAH, carbonic anhydrase; OVAL, ovalbumin;BSA, bovine serum albumin. sp, spore; veg, vegetative. Mass spectral TICpeaks are from: 1, spore; 1v, vegetative; 2, vegetative and spore; 3, sporeonly.
first thermal event. Projection of the two points from theTWC onto the primary weight loss (dotted) curve yields98.9–75.4% = 23.5%. Likewise, events 2 and 3 are delin-eated by dotted lines b, c and c, d, respectively, and rep-resent distinct biological substances and/or class of com-pounds.
3.2. TIC of thermal biochemical products
Fig. 3 documents the thermally generated mass spectralTIC history of bacteria in the vegetative (veg) and spore(sp) forms, protein standards, and select biochemical com-pounds at a heating rate of 20 K min−1. The TGA weightloss curve and TWC for each biological substance are notshown, yet they provided an analogous tracking in a sim-ilar fashion to that of the BG and BC spore examples inFig. 2a and b. The TWCs of the bacteria and biochemicals
(data not shown) also provided a similar tracking to the re-spective mass spectral TIC profiles inFig. 3. The bacterialchromatograms can be divided into three regions of thermallygenerated biochemical products. The BG spore (BGsp) sam-ple shows three peaks in the TIC while the vegetative form(BGveg) shows the first two major peaks (Peaks 1v and 2).The BCsp and BCveg cell preparation results (Fig. 3) areanalogous to that of BG, and the BCsp mass spectral TIC isidentical to that inFig. 2b. In addition, the respective peaksfor BG and BC provide similar temporal patterns includingtwo and three peaks for the vegetative and spore forms, re-spectively.
The BTveg and BMsp mass spectral TIC traces also dis-play two (1v and 2) and three peaks, respectively. All bacteriadisplay a considerable amount of overlap between the peaks,yet each peak can be clearly observed. At temperatures be-yond the third peak for the bacteria inFig. 3, the mass spectralTIC profiles become featureless and approach the baselinelevel. Note that between 23% and 30% of the original sam-ple mass (Table 1) remains in the TGA pan for all bacteriainvestigated (Fig. 3), and this can be thought of as residualnonvolatile and/or char residue.
Fig. 3 also presents the mass spectral TICs of the pro-tein species. The distributions tend to partition into two sep-arate groups where the lower mass proteins have a TIC peakm 2 Kt erm y arec 2 en-v and4 t rel-a ansi-t ismso oteinT tivep peakw
io-c itiveB t oft mper-a o hasa ion asp prod-u otherh samet justp DPAh thant eaterd
em-i s andp ratedb na-t w.
aximum at a higher temperature (622 K) than the 59hermal product maximum for the OVAL and BSA highass proteins. However, both sets of peaks generall
ontained in the same temperature region as the peakelope of the Bacilli. It appears that between 30,0004,000 Da, the thermal protein products are produced atively lower temperatures. Therefore a fundamental tr
ion in thermal breakdown and decomposition mechanf protein species may occur in that mass region. The prICs inFig. 3are relatively broad and have similar qualitaroperties to that of peak 2 from the bacteria such asidth and temperature evolution.The bottom ofFig. 3presents mass spectral TICs of b
hemical compounds known to be present in Gram-posacilli. PTG has a very broad peak similar in width to tha
he protein species, and the peak is found in the same teture evolution region as peak 2 in the bacteria. PTG alslower intensity feature that encompasses the same regeaks 1 and 1v. Therefore, PTG produces biochemicalcts that are partitioned into peaks 1 and 2. DPA, on theand, displays a mass spectral TIC that is found in the
ime region as peak 1v for the vegetative bacteria andrior to the bacterial spore peak 1. Thus, it appears thatas a closer relation to the vegetative bacterial peak 1v
hat of the spores. This observation is investigated in gretail below.
These qualitative observations of bacteria and biochcal species additionally contain mass spectral featureatterns as well as relative amounts of thermally geneiochemicals. They provide further information as to the
ure of the mass spectral TIC patterns as explained belo

288 A.P. Snyder et al. / Analytica Chimica Acta 536 (2005) 283–293
3.3. Mass spectral information in peak 1 frombiochemical standards and bacteria
Fig. 4provides extracted mass spectra of the peak 1 and 1vprofiles for the bacteria and for the biochemical compoundsin Fig. 3. PHBA provides a distinct pattern of masses, andm/z 87 is the protonated 2-butenoic acid monomer repeatunit. m/z 173 represents the protonated dimer species of 2-butenoic acid[12].m/z69 and 155 are the dehydrated speciesof the monomer and dimer, respectively.m/z259 is the proto-nated trimer molecule of the 2-butenoic acid building blockof PHBA [12].
The PTG biochemical component represents a com-plex structure consisting of 6-membered ring amine andnon-amine carbohydrates and peptides consisting of 7–10common and uncommon amino acids[9,30,31]. Prominentmasses observed arem/z 81, 93, 126, 135, 144, 168, and186. The high massm/z 243, 271 and 299 appear to befatty acid species[10,11,32]. m/z 243 can be tentativelyassigned as either the 1-undecyl-3-dehydroxyglycerol ion[C11H23CO2CH2CH(OH)CH2]+ [32,33]or protonated pen-tadecanoic acid[10,11]. The latter is also referred to asC15:0.m/z271 and 299 can represent the protonated forms ofC17:0 and C19:0 fatty acids, respectively, and/orm/z271 and
299 may represent the C13:0 and C15:0 analogues, respec-tively, of the 1-undecyl-3-dehydroglycerol ion. Since thesefatty acids are not normally found in peptidoglycan macro-molecules, they may represent carryover from other parts ofthe cell. It is not clear why these tentatively assigned fattyacid species are observed in the relatively low temperatureevolution region. However, it should be noted that the fattyacid C13:0 and C15:0 dehydroxyglycerol species have beenobserved in the 550 K, or 280◦C, temperature region[32,33]at a heating rate of 40◦C/min.
The mass spectral pattern of pure DPA provides distinctm/z80 and 124 features (Fig. 4), and they are the protonatedforms of pyridine and picolinic acid, respectively[7].m/z80and 124 can be found in the mass spectra of all spores inFig. 4, although the spores of BM display a relatively lowamount of these DPA thermal product features. The vegeta-tive forms do not display the characteristicm/z 80 and 124DPA thermal fragments. This is expected, because the sporeform and not the vegetative species of Bacilli contain DPA,which is found as the calcium dipicolinate salt[34,35]. How-ever, the pure organic salt is not commercially available fora more accurate standard compound analysis. Therefore, thechelate salt of DPA appears to be the reason for the temporalshift of pyridine and picolinic acid to higher temperatures
Fi
ig. 4. Extracted mass spectra from peaks 1 and 1v inFig. 3for bacteria. Extracten Fig. 3. Refer toFig. 3 legend for abbreviations.
d mass spectra from the three biochemicals are taken from their peak maxima

A.P. Snyder et al. / Analytica Chimica Acta 536 (2005) 283–293 289
from that of pure DPA. DPA sublimes at 200◦C (473◦C),and the salt form would be expected to have a higher tem-perature of decomposition. That higher temperature appearsto be in the region of peak 1 from the bacterial spore inFig. 3.
PHBA is a polymeric energy storage compound found incertain bacteria, and it is known to be synthesized in BC, BM,and BT[36–38]and not BG[22]. The spore and vegetativeforms of BG do not display PHBA features in their mass spec-tral signatures ([13] andFig. 4), and this correlates with theabsence of the polymer in the BG microbiological literature.Both spore and vegetative forms of BC, BM spores, and BTvegetative cell preparations, however, produce all the massspectral elements of PHBA in a relatively similar intensitydistribution as that of the pure standard compound (Fig. 4).The relatively lower thermal decomposition temperature ofPHBA (Fig. 3) produces thermal products in the same re-gion as peak 1 for the microorganisms with the exception ofBG.
Peaks 1 and 1v in the TGA–MS analysis yield furtherinformation in their extracted mass spectra, because masselements of peptidoglycan can be observed (Fig. 4). For boththe vegetative and spore forms of the investigated bacteria,m/z91 and 93 are absent, however, the higher mass 126, 144,168 and 186 ions are present. They most likely represent thed minec cana iesi in theb
asss hes
3b
cany d tot paredt ossp WCe dv
e-s r BGs aver-a onthp d.
7%a ris-i andF asD oft fort ges o
Table 2Percent weight of bacterial spore components and biochemical species fromthe microbiological literature and the TGA TWC event 1
DPAa PHBAb PTGc PTG1d M1e TGA1 TGA1/M1
BG 15 0 20 3.0 18 17.0 0.94BC 13.1 12 15 2.3 27.4 23.5 0.86BM 13.8 11.7 20 3.0 28.5 20.5 0.72
a Refs.[35,39–41].b Refs.[22,42–45].c Refs.[46,47].d Peptidoglycan weight percent adjusted for its contribution in thermal
event 1:PTG (0.151) = PTG1.e M1 = DPA + PHBA + PTG1.
the DPA, PHBA, and PTG biochemical substances in bacteriaare listed for BG, BC, and BM spores from microbiologicalliterature sources[22,35,39–47].
The PTG biopolymer cell wall component produces ther-mal products in both peaks 1 and 2 (Fig. 3), while a relativePTG percentage from the microbiological literature necessar-ily yields a single value for a bacterial preparation. Thus, thislatter value needs to be partitioned in the same proportion asthe TGA TWC for PTG (data not shown). The percent weightloss of PTG in TWC events 1 and 2 are 15.1% and 45.9%,respectively (data not shown). Therefore the average valuesof PTG found in the Bacillus species in TWC event 1 can beadjusted in silico to PTG(0.151) = PTG1. The adjusted valuesfor the contribution of PTG in TWC event 1 from the Bacillusspores are listed inTable 2. In silico analysis of the percent-age of PTG in Gram-positive Bacilli from the TGA TWC isnecessary in order to partition the microbiological literaturevalue between the first two thermal events. The summationof the DPA, PHBA, and adjusted PTG (PTG1) percent valuesyields the microbiological literature percentage (M1) of thethree substances in thermal event 1.
The M1 values (Table 2) were compared to the respectiveTGA1 weight loss percent values for event 1 (Table 1). It ap-pears that the TGA1 weight loss information from Bacillusspores accounts for approximately 72–94% of the microbio-l
int io-l rate,s bio-c aterd oundl malp rcenty nt ofb emi-c A1tb illuss orre-l A,a mi-c
ehydrated, protonated cyclic thermal products of the aarbohydrate portion of the macromolecular peptidoglyrchitecture[12]. Them/z243, 271, and 299 fatty acid spec
n the peptidoglycan mass spectrum are not observedacterial mass spectra.
DPA, PHBA, and PTG represent the majority of the mpectral features (Fig. 4) extracted from peaks 1 and 1v in tpore and vegetative bacterial TICs, respectively (Fig. 3).
.4. Weight loss information in TWC event 1 fromiochemical standards and bacteria
The weight loss parameter from the TGA systemield further important insights especially when relatehe compound class identity. These values can be como that found by microbiological determinations. Weight lercentages of biochemical components are listed for Tvents 1–3 inTable 1for BC, BG, BM, and BT spore anegetative cells.
Table 1also provides reproducibility information with rpect to the standard deviation of each thermal event fopores. The standard deviation values derive from ange of seven BG spore analyses performed over an 8-meriod. Reasonably low standard deviations are realize
The Bacilli provide relative weight losses between 1nd 32% for the first TWC event. Compounds comp
ng peak 1 have the lowest temperature of evolution,ig. 4 identifies the bacterial biochemical componentsPA, PHBA, and PTG.Table 2provides a comparison
he microbiological literature with the first TWC eventhe bacterial spores (data not shown). Average percenta
fogical literature (Table 2) values.Thermal processing offers inherently less uniformity
he treatment of individual entities in a highly complex bogical mixture such as bacteria compared to the delibetep-by-step, treatment of microbiological, liquid basedhemical extraction and isolation protocols. A much greegree of control can be exercised with bacterial comp
iquid isolation protocols than in the technique of therrocessing. Therefore, it is understandable that the peield of a particular substance from the thermal treatmeacteria may be less than that of the traditional biochal techniques. It is interesting that the ratios of the TGhermal values to M1 microbiological values inTable 2areetween 72% and 94%. Despite the complexity of Bacpores, the indication is that there is a moderate to high cation of thermal products in TWC event 1 from DPA, PHBnd PTG with respect to the relative yields found in therobiological literature.

290 A.P. Snyder et al. / Analytica Chimica Acta 536 (2005) 283–293
Fig. 5. Extracted mass spectra from peak 2 inFig. 3for bacteria. Extracted mass spectra from the proteins and PTG are taken from their peak maxima inFig. 3.Refer toFig. 3 legend for abbreviations.
3.5. Mass spectral information in peak 2 frombiochemical standards and bacteria
Peak 2 (Figs. 2b and 3) represents the broadest thermalgeneration feature for the bacteria and biochemical standards.The peak maximum spans a temperature range of approxi-mately 575–650 K.Fig. 5 presents extracted mass spectrafrom bacteria and biochemical standards for peak 2 in theTICs in Fig. 3. The extracted mass spectra of three pro-tein standards, peptidoglycan, and the spore and vegetativeforms of bacteria are shown. All 10 mass spectra inFig. 5have sufficient intensity to distinguish the following masses:m/z 70, 72, 84, 86, 95, 98, 100, 113, 115, 139, 141, 153,155, 167, 181, 195, and 209.m/z 127 and 129 are foundin all of the mass spectra except for BCsp. These massesare characteristic for the protein component as detailed inthe BLAC, CAH, and BSA mass spectra (Fig. 5). Pepti-doglycan is also composed of peptide substances that linklong chains of carbohydrate residues, and hence, a char-acteristic thermal decomposition profile is observed for itspeptide component that is similar to the protein species.Masses belowm/z 110 are mostly characterized as pep-tide side chain R group moieties[48–52] and their thermalderivatives, while masses abovem/z 110 can be character-ized as the cyclic dipeptide species known as diketopiper-a e theb n Rg
3.6. Weight loss information in TWC event 2 frombiochemical standards and bacteria
The weight loss information for thermal products con-tained in TWC event 2 (graphs not shown) and comparisonto microbiological literature values is presented inTable 3.Protein constitutes approximately 50% of the dry weight ofbacteria[35,39,47]. Thermal processing of the five proteinstandards produced overall thermal product yields between61.2% and 73.2% in weight loss analyses similar to that inFig. 2b. The average percent of protein thermal products com-pared to the initial sample in the pan was 63.3%. This must beused as an adjustment to the 50% average amount of proteinfound in bacteria from microbiological liquid based tech-niques, and this yields 31.7% (Table 3).
Table 3Percent weight of bacterial spore components from the microbiological lit-erature and the TGA TWC event 2
Proteina P2b PTGc PTG2d M2e TGA2 TGA2/M2
BG 50 31.7 20 9.2 40.9 31.6 0.77BC 50 31.7 15 6.9 38.6 37.3 0.97BM 50 31.7 20 9.2 40.9 38.3 0.77
a Refs.[35,39,47].b P2 = adjusted protein yield = 50 (0.633) = 31.7%.c Refs.[46,47].
rmale
zines (DKP). These higher masses can also includasic DKP ring along with derivatives of the side chairoups.
d Peptidoglycan weight percent adjusted for its contribution in thevent 2: PTG (0.459) = PTG2.e M2 = P2 + PTG2.

A.P. Snyder et al. / Analytica Chimica Acta 536 (2005) 283–293 291
Table 4Summation of average microbiological literature percent values of bacterialspore components and biochemical speciesa
DPA PHBA PTG Protein Summation
BG 15 0 20 50 85BC 13.1 12 15 50 90.1BM 13.8 11.7 20 50 95.5
a Refs.[22,35,39,40–47].
The percentage of PTG in Bacilli is 15–20%[46,47], andan adjustment is required for the contribution of thermal prod-ucts of PTG in TWC event 2. This is PTG(0.459) = PTG2.The adjusted protein and PTG microbiological literature per-cent summation values (M2) for the three bacterial spores arelisted in Table 3. The TGA2 weight loss percent values forevent 2 in the TWCs (graphs not shown) from BG, BC, andBM are 31.6%, 37.3%, and 38.3%, respectively. Therefore,the TGA2/M2 ratio for BG, BC, and BM are 0.77, 0.97, and0.77, respectively. The remaining char and tar amount fromthe thermal treatment of the protein standards is a consider-able 29.9%. It is well known that the thermal processing ofprotein yields considerable char and tar residues[53]. There-fore it is not surprising to observe less than unitary recov-ery values. There is a 77–97% correlation of the substancesfound in TWC event 2 with that of the microbiological liter-ature.
Table 4provides a summary of the DPA, PHBA, PTG,and protein bacterial spore percentage values found in themicrobiological literature[22,35,39,40–47]. The summationvalue shows that these four biochemical species and compo-nents constitute the predominant portion of a typical Bacillusspore.
3.7. Information in peak 3 from biochemical standardsa
eled3 ves.T ermae teins peak3 m ofF eak3 n) fora ,8 204.m sitionp ndm theiri epre-s nentst reac-t sss
no-t ce
a peak 3, and the weight loss percentage of BC, BG, andBM is 4.6%, 12.4%, and 7.1%, respectively. These valuesare relatively low compared to peaks 1, 1v and 2.
3.8. Biochemical and microbiological analysis withTGA–MS
The TGA–MS system provides qualitative informationsuch as thermal envelopes, mass features, and mass patternsof biological substances that are similar to those of previ-ous literature studies with fundamentally different types ofthermal generation apparatus and techniques[1,2,27,28]. TheTWC from TGA thermal processing and MS TIC appearto track each other closely (Fig. 2b). Together, the originalweight loss curve and TWC yield further information, be-cause they provide a quantitative weight loss of thermallygenerated substances from the bacteria over time. The TGAweight loss quantitative determination can be compared tothat from classical microbiological liquid based extractionand isolation techniques.
In general, a majority of information-containing, ther-mally generated biological products are polar in nature. Massspectrometry responds to these thermal fragmentation prod-ucts from the major components contained in bacterial sporesand vegetative. Many of the masses were assigned to specifics struc-t
lowm cleica The( hasa1 glu-c yl-2-f sig-n
ores e( teriak arlyp ectralp
4
tioni lowm cies.A at ix-t pro-c thato ent,a assp h as
nd bacteria
Fig. 3 shows a distinct high temperature feature labat approximately 665 K in the bacterial spore TIC curhis is the highest temperature event that generated a thvolution of biological substances from bacteria. The propecies do not produce a high temperature feature as, and the TICs of the biological standards at the bottoig. 3 do not show a discernible peak in the region of p. The extracted mass spectra of peak 3 (data not showll of the bacteria inFig. 3 are composed ofm/z 68, 72, 826, 94, 109, 121, 125, 129/130, 147, 157, 191, 193, and/z129/130 and 157 may represent low mass decomporoducts of higher mass lipid species[54]. These masses aass subsets do not provide obvious possibilities as to
dentities. However, the extracted mass spectra may rent residual species or higher mass biological compohat have undergone secondary thermal decompositionions to yield biologically non-specific, relatively low mapecies.
The vegetative forms of the Bacilli do not produce aiceable peak 3 (Fig. 3). However, the spore forms produ
l
ubstances and components, and they all contain polarures and moieties.
Protein and carbohydrate species are observed inass thermal signatures; however, the important nucid nitrogenous bases probably were not detected.M+ H)+ = 136 for adenine is not observed. Thyminen (M+ H)+ = 127, and this mass is observed. However,m/z27 is most likely the protonated, dehydrated cyclic levoosenone compound and/or protonated 5-hydroxymethuraldehyde[6]. These are common and quantitativelyificant thermal products of carbohydrate species.
The protonated form of the Gram-positive bacterial sppecific picolinic acid (m/z 124) and non-specific pyridinm/z80) thermally generated products are observed. Bacnown to contain the PHBA energy storage compound cleroduce the characteristic thermally generated mass spattern when compared to the standard compound.
. Conclusions
The TGA–MS system provides thermal decomposinformation from biological substances consisting of
ass biochemicals to very high mass microorganism spen important strength of TGA is the ability to produce
ime–temperature thermal fractionation curve from a mure of species or a microorganism. The TGA thermalesses generally produce similar types of products withf other heating methods such as quartz tube, foil/filamnd Curie point wire pyrolysis. Distinctive qualitative matterns identified the class of biological compound suc

292 A.P. Snyder et al. / Analytica Chimica Acta 536 (2005) 283–293
protein and carbohydrate, as well as the specific type of bio-chemical such as PHBA and DPA.
The thermal processes of TGA also produced specificcompounds found in bacteria and were detected by the massspectrometer. For example, PHBA is synthesized in BM, BTand BC but not in BG. The distinct thermal decompositionmass pattern is indeed observed in BM, BT and BC but not inBG. DPA is found in Gram-positive bacterial spores and notin Gram-positive vegetative cells, and this was mirrored inthe mass spectral patterns of the Bacilli studied. Another im-portant aspect of TGA weight loss information is its ability toprovide quantitative information that can be compared to themicrobiological percentages of biochemical species and highmass polymer compounds in bacteria. This information maybe more difficult to examine and resolve if the sample con-sists of more than one microorganism. Nevertheless, evidencehas been shown that TGA–MS can be applied to the analy-sis and general characterization of biological molecules andmicroorganisms. To the best of the authors’ knowledge, thisstudy represents the first initial work in a comparison of inher-ent biochemical components in bacteria between TGA–MSand that of traditional microbiological investigations.
References
ll, J.
ll, J.
s inars-
etry:pp.
tion,mer
nal.
), An-ker,
ass
m-
.H.
[ nal.
[ oc.
[ ass
[ .H.
[ cro-
[ . An-
[ 86.
[17] J. Lee, G. Kaletunc, J. Appl. Microbiol. 93 (2002) 178–189.[18] S. Vyazovkin, Anal. Chem. 76 (2004) 3299–3312.[19] G.W. Gould, Heat-induced injury and inactivation, in: G.W. Gould
(Ed.), Mechanisms of Action of Food Preservation Procedures, El-sevier Applied Science, London, 1989, pp. 11–41 (Chapter 2).
[20] B.M. Mackey, C.A. Miles, S.E. Parsons, D.A. Seymour, J. Gen.Microbiol. 137 (1991) 2361–2374.
[21] S. Materazzi, R. Curini, Appl. Spectrosc. Rev. 36 (2001) 169–180.[22] R.A. Reusch, H.L. Sadoff, J. Bacteriol. 156 (1983) 778–788.[23] B.E. Watt, S.L. Morgan, A. Fox, J. Anal. Appl. Pyrolysis 19 (1991)
237–249.[24] L.K. Nakamura, Intl. J. Syst. Bacteriol. 39 (1989) 295–300.[25] E.H. Lennette, A. Balows, W.J. Hausler Jr., J.P. Truant (Eds.), Man-
ual of Clinical Microbiology, 3rd ed., American Society for Micro-biology, Washington, DC, 1980 (Chapter 98).
[26] P.K. Gallagher, R. Blaine, E.L. Charsley, N. Koga, R. Ozao, H. Sato,S. Sauerbrunn, D. Schultze, H. Yoshida, J. Therm. Anal. Calorimetry72 (2003) 1109–1116.
[27] W. Windig, E. Jakab, J.M. Richards, H.L.C. Meuzelaar, Anal. Chem.59 (1987) 317–323.
[28] W. Windig, S.A. Liebman, M.B. Wasserman, A.P. Snyder, Anal.Chem. 60 (1988) 1503–1510.
[29] A.P. Snyder, J.H. Kremer, H.L.C. Meuzelaar, W. Windig, K.Taghizadeh, Anal. Chem. 59 (1987) 1945–1951.
[30] K.H. Schleifer, O. Kandler, Bacteriol. Rev. 36 (1972) 407–477.[31] K.H. Schleifer, Meth. Microbiol. 18 (1985) 123–156 (Chapter 3).[32] A.P. Snyder, W.H. McClennen, J.P. Dworzanski, H.L.C. Meuzelaar,
Anal. Chem. 62 (1990) 2565–2573.[33] A.P. Snyder, W.H. McClennen, H.L.C. Meuzelaar, Rapid character-
ization of microorganisms by Curie-point pyrolysis in combinationmassds.),pec-r 13).
[ nualins
[ ures,mic
[ 81)
[ 87
[[ 3)
[ 1)
[[ 8)
[[ 59.[ . 11
[ ose,mic
[ gy ofInc.,
[ ns. II
[ 37.[ ass
[1] J.A. Adkins, T.H. Risby, J.J. Scocca, R.E. Yasbin, J.W. EzzeAnal. Appl. Pyrolysis 7 (1984) 15–33.
[2] J.A. Adkins, T.H. Risby, J.J. Scocca, R.E. Yasbin, J.W. EzzeAnal. Appl. Pyrolysis 7 (1984) 35–51.
[3] G. Wieten, H.L.C. Meuzelaar, J. Haverkamp, Analytical pyrolysiclinical and pharmaceutical microbiology, in: G. Odham, L. Lson, P.A. Mardh (Eds.), Gas Chromatography Mass SpectromApplications in Microbiology, Plenum Press, New York, 1984,335–380.
[4] D.J. Freed, S.A. Liebman, Basic analytical pyrolysis instrumentain: S.A. Liebman, E.J. Levy (Eds.), Pyrolysis and GC in PolyAnalysis, Marcel Dekker, Inc., New York, 1985.
[5] P. Miketova, C. Abbas-Hawks, K.J. Voorhees, T.L. Hadfield, J. AAppl. Pyrolysis 67 (2003) 109–122.
[6] Chromatographic Science Series, in: J. Cazes, W.J. Irwin (Eds.alytical Pyrolysis: A Comprehensive Guide, vol. 22, Marcel DekInc., New York, 1982, pp. 381–431 (Chapter 8).
[7] A. Tripathi, M.M. Maswadeh, A.P. Snyder, Rapid Commun. MSpectrom. 15 (2001) 1672–1680.
[8] M.B. Beverly, F. Basile, K.J. Voorhees, T.L. Hadfield, Rapid Comun. Mass Spectrom. 10 (1996) 455–458.
[9] J.P. Dworzanski, A. Tripathi, A.P. Snyder, M.M. Maswadeh, CWick, J. Anal. Appl. Pyrolysis (2005) in press.
10] S. DeLuca, E.W. Sarver, P. de B. Harrington, K.J. Voorhees, AChem. 62 (1990) 1465–1472.
11] M.B. Beverly, F. Basile, K.J. Voorhees, T.L. Hadfield, J. Am. SMass Spectrom. 10 (1999) 747–758.
12] M.B. Beverly, K.J. Voorhees, T.L. Hadfield, Rapid Commun. MSpectrom. 13 (1999) 2320–2326.
13] A.P. Snyder, J.P. Dworzanski, A. Tripathi, W.M. Maswadeh, CWick, Anal. Chem. 76 (2004) 6492–6499.
14] P. Teizeira, H. Castro, C. Mohacsi-Farkas, R. Kirby, J. Appl. Mibiol. 83 (1997) 219–226.
15] Cs. Mohacsi-Farkas, J. Farkas, L. Meszaros, O. Reichart, Edrassy, J. Therm. Anal. Calorimetry 57 (1999) 409–414.
16] J. Lee, G. Kaletunc, Appl. Environ. Microbiol. 68 (2002) 5379–53
with short-column capillary gas chromatography and ion trapspectrometry, in: A. Fox, S.L. Morgan, L. Larsson, G. Odham (EAnalytical Microbiology Methods: Chromatography and Mass Strometry, Plenum Press, New York, 1990, pp. 201–217 (Chapte
34] R.S. Breed, E.G.D. Murray, N.R. Smith (Eds.), Bergey’s Maof Determinative Bacteriology, 7th ed., The Williams and WilkCompany, Baltimore, 1957, pp. 295–305.
35] W.G. Murrell, Chemical composition of spores and spore structin: G.W. Gould, A. Hurst (Eds.), The Bacterial Spore, AcadePress, New York, NY, 1969, pp. 215–273 (Chapter 7).
36] H. Morikawa, R.H. Marchessault, Can. J. Chem. 59 (192306–2313.
37] C.S.K. Reddy, R. Ghai, V.C.K. Rashmi, Bioresour. Technol.(2003) 137–146.
38] J. He, S. Chen, Z. Yu, J. Chromatogr. A 973 (2002) 197–202.39] A.D. Warth, D.F. Ohye, W.G. Murrell, J. Cell Biol. 16 (196
579–592.40] T.A. Slieman, W.L. Nicholson, Appl. Environ. Microbiol. 67 (200
1274–1279.41] E.D. Lester, A. Ponce, IEEE Eng. Med. Biol. (2002) 59–61.42] D.H. Williamson, J.F. Wilkinson, J. Gen. Microbiol. 19 (195
198–209.43] R.A. Slepecky, J.H. Law, J. Bacteriol. 82 (1961) 37–42.44] L.A. Kominek, H.O. Halvorson, J. Bacteriol. 90 (1965) 1251–1245] G.W. Haywood, A.J. Anderson, E.A. Dawes, Biotechnol. Lett
(1989) 471–476.46] A.D. Warth, Molecular structure of the bacterial spore, in: A.H. R
J.G. Morris (Eds.), Advances in Microbial Physiology, AcadePress, London, 1978, pp. 1–45 (Chapter 1).
47] F.C. Neidhardt, J.L. Ingraham, M. Schaechter (Eds.), Physiolothe Bacterial Cell: A Molecular Approach, Sinauer Associates,Sunderland, MA, 1990, pp. 1–29 (Chapter 1).
48] G.G. Smith, G.S. Reddy, J.J. Boon, J. Chem. Soc., Perkin Tra(1988) 203–211.
49] G. Chiavari, G. Galletti, J. Anal. Appl. Pyrolysis 24 (1992) 123–150] A.S. Noguerola, B. Murugaverl, K.J. Voorhees, J. Am. Soc. M
Spectrom. 3 (1992) 750–756.

A.P. Snyder et al. / Analytica Chimica Acta 536 (2005) 283–293 293
[51] A.D. Hendricker, K.J. Voorhees, J. Anal. Appl. Pyrolysis 36 (1996)51–70.
[52] A.D. Hendricker, K.J. Voorhees, J. Anal. Appl. Pyrolysis 48 (1998)17–33.
[53] M. Meetani, F. Basile, K.J. Voorhees, J. Anal. Appl. Pyrolysis 68(2003) 101–113.
[54] F. Basile, M.B. Beverly, K.J. Voorhees, T.L. Hadfield, Trends Anal.Chem. 17 (1998) 95–109.