Three-dimensional Retinal Imaging with High-Speed Ultrahigh-Resolution Optical Coherence Tomography
Upload
independentCategory
view
0download
0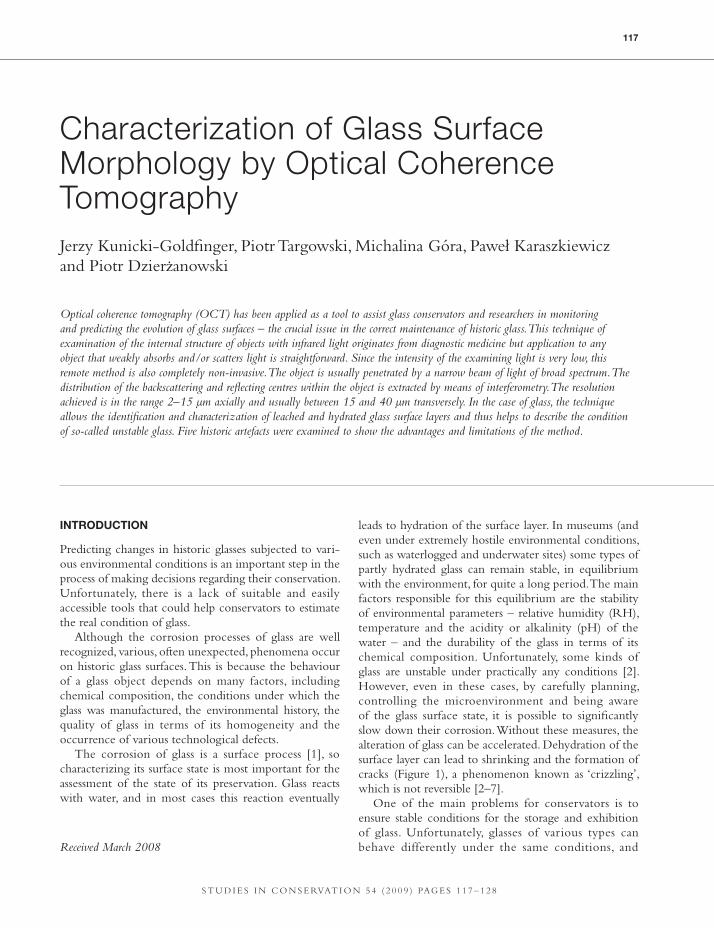
S T U D I E S I N C O N S E RVAT I O N 5 4 ( 2 0 0 9 ) PAG E S 1 1 7 – 1 2 8
Received March 2008
Characterization of Glass Surface Morphology by Optical Coherence TomographyJerzy Kunicki-Goldfinger, Piotr Targowski, Michalina Góra, Paweł Karaszkiewicz and Piotr Dzierżanowski
INTRODUCTION
Predicting changes in historic glasses subjected to vari-ous environmental conditions is an important step in the process of making decisions regarding their conservation. Unfortunately, there is a lack of suitable and easily accessible tools that could help conservators to estimate the real condition of glass.
Although the corrosion processes of glass are well recognized, various, often unexpected, phenomena occur on historic glass surfaces. This is because the behaviour of a glass object depends on many factors, including chemical composition, the conditions under which the glass was manufactured, the environmental history, the quality of glass in terms of its homogeneity and the occurrence of various technological defects.
The corrosion of glass is a surface process [1], so characterizing its surface state is most important for the assessment of the state of its preservation. Glass reacts with water, and in most cases this reaction eventually
Optical coherence tomography (OCT) has been applied as a tool to assist glass conservators and researchers in monitoring and predicting the evolution of glass surfaces – the crucial issue in the correct maintenance of historic glass. This technique of examination of the internal structure of objects with infrared light originates from diagnostic medicine but application to any object that weakly absorbs and/or scatters light is straightforward. Since the intensity of the examining light is very low, this remote method is also completely non-invasive. The object is usually penetrated by a narrow beam of light of broad spectrum. The distribution of the backscattering and reflecting centres within the object is extracted by means of interferometry. The resolution achieved is in the range 2–15 µm axially and usually between 15 and 40 µm transversely. In the case of glass, the technique allows the identification and characterization of leached and hydrated glass surface layers and thus helps to describe the condition of so-called unstable glass. Five historic artefacts were examined to show the advantages and limitations of the method.
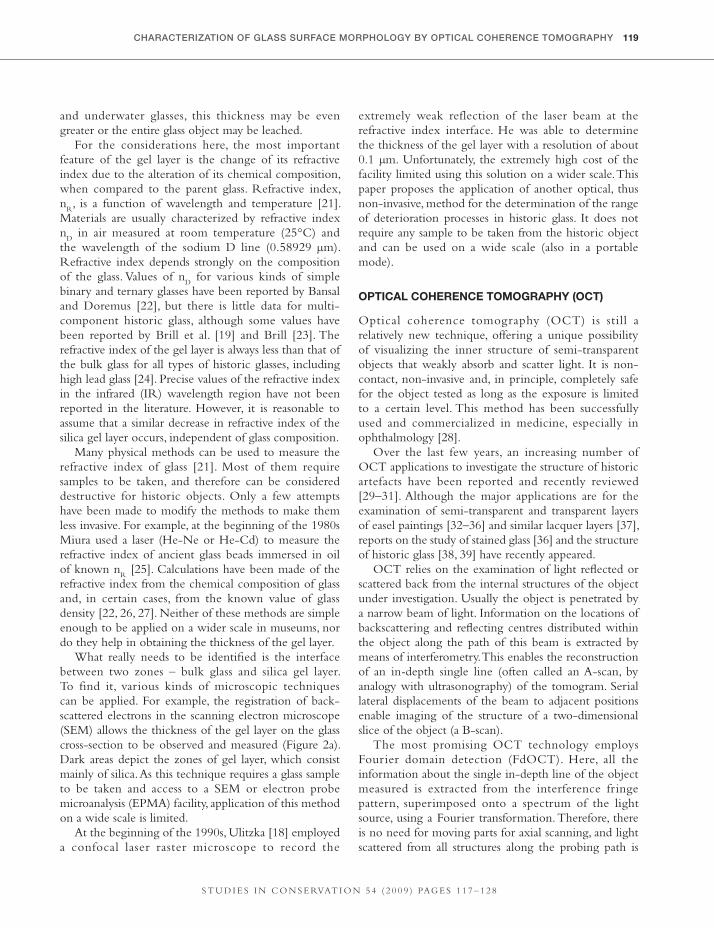
leads to hydration of the surface layer. In museums (and even under extremely hostile environmental conditions, such as waterlogged and underwater sites) some types of partly hydrated glass can remain stable, in equilibrium with the environment, for quite a long period. The main factors responsible for this equilibrium are the stability of environmental parameters – relative humidity (RH), temperature and the acidity or alkalinity (pH) of the water – and the durability of the glass in terms of its chemical composition. Unfortunately, some kinds of glass are unstable under practically any conditions [2]. However, even in these cases, by carefully planning, controlling the microenvironment and being aware of the glass surface state, it is possible to significantly slow down their corrosion. Without these measures, the alteration of glass can be accelerated. Dehydration of the surface layer can lead to shrinking and the formation of cracks (Figure 1), a phenomenon known as ‘crizzling’, which is not reversible [2–7].
One of the main problems for conservators is to ensure stable conditions for the storage and exhibition of glass. Unfortunately, glasses of various types can behave differently under the same conditions, and
117
118 J. KUNICKI-GOLDFINGER, P. TARGOWSKI, M. GÓRA, P. KARASZKIEWICZ AND P. DZIERZ. ANOWSKI
S T U D I E S I N C O N S E RVAT I O N 5 4 ( 2 0 0 9 ) PAG E S 1 1 7 – 1 2 8
consequently require different storage conditions [2, 8]. This means that the optimal environment to maintain some objects can be harmful for others. The main parameters that determine the onset of crizzling are the morphology, the thickness of the hydrated surface layer and the amount of water retained within it. The more water and the thicker the layer, the greater is the risk of crizzling. Without using sophisticated equipment and taking samples for examination, it is almost impossible to detect the hydrated surface layer and assess its thickness. It is usually necessary to examine a cross-section of the object. Inspecting all the glass artefacts in a museum in this way would be impracticable, as it is invasive, time consuming and costly, so there is a need to develop non-destructive methods to examine the glass surface layer. It is not always necessary to carry out chemical analysis; examination of certain physical properties of glass is often sufficient – for example, a change in refractive index, which corresponds to a change in the chemical composition of the glass. A simple and convenient procedure to observe and measure this phenomenon would make it possible to categorize various glasses according to their surface condition. This paper describes such a method. The main goal is to draw attention to a new tool for the non-invasive examination of the glass surface layer. The preliminary results are reported below.
HISTORIC GLASS SURFACE
Although glass corrosion processes are well recognized, this knowledge is mostly based on experiments with simple binary and ternary glasses. These simplified models are given in the literature [1, 9]. The technology and chemistry of historic glass is different: it consists of many components and its environmental history is more complicated and often unknown. Thus, it is difficult to simulate under laboratory conditions.
Chemical corrosion of glass is based on the interaction between the glass surface and water in all forms. Gen-erally, there are two main reaction stages. The first stage is ion exchange, also known as the leaching process, which dominates in reacting solutions of pH <9. The alkali and alkaline earth ions are removed and replaced by hydrogen (H+) or hydronium (H
3O+) ions. The
other mechanism considered at this stage has been described as a diffusion of molecular water into glass and its chemisorption at the non-bridging oxygen atoms. There is strong evidence that adsorption and diffusion of molecular water into the glass surface is a necessary preliminary step of the leaching process [10]. In the second stage, breakdown of the silica structure and total
glass dissolution occurs – hydroxide ions from the solution break Si–O bonds. This stage is predominant in reactive solutions of pH >10.
In normal museum conditions, the leaching process will precede the dissolution step. In practice, however, both processes can occur simultaneously over a wide pH range, and the glass surface characteristics depend on the relative rates of the two processes during the entire environmental history of the glass [11].
Considering both the chemical composition of glass and environmental factors, six characteristic types of glass surface were distinguished [11–13]. Two of them can be associated with the majority of historic glasses. Hench’s type II characterizes glasses possessing a silica-rich protective layer, which is quite durable in solutions of pH <9. This layer is formed as a consequence of the leaching of alkali and alkaline earth ions when a sufficient concentration of network formers is present in glass. Hench’s type IV is also of interest here and is characteristic of glasses with an insufficient concentration of network formers or when glass is exposed to more alkaline solutions. In this case, a silica-rich layer is also created, but is unstable and does not protect the glass from further leaching. This Hench’s type IV seems to be characteristic for so-called ‘unstable glass’.
Hench’s schematic typology does not include all possible types of surfaces; in particular, in historic glass the characteristics of the silica-rich layer are in some cases intermediate between those he describes. This layer can play various roles in the evolution of historic glass [14, 15]. In fact, the silica-rich layer consists of two sub-layers: a leached hydrogen glass layer directly adjoined to the bulk glass, which has constant thickness determined by the glass composition and leaching conditions, as well as the outer silica gel layer, whose thickness may increase with time [10].
In most archaeometric and conservation laboratories, researchers use backscattered electron (BSE) imaging for identification of the silica-rich layer, which appears as a darker zone. This method does not allow the two sub-layers to be distinguished. Therefore, in further discussion, both sub-layers will be considered together and called a silica gel layer (or gel layer).
The concentration of silica in the gel layer sometimes reaches over 70–80% of its total mass. The chemical composition of the pristine glass, the stabilizers present and many other factors strongly affect the amount of water that can exist in this layer [2, 16]. For durable historic glass the thickness of this gel layer is usually below 10 µm [17]. For less durable glasses, it can reach a few hundred microns [4, 18–20]. For certain waterlogged
CHARACTERIZATION OF GLASS SURFACE MORPHOLOGY BY OPTICAL COHERENCE TOMOGRAPHY 119
S T U D I E S I N C O N S E RVAT I O N 5 4 ( 2 0 0 9 ) PAG E S 1 1 7 – 1 2 8
and underwater glasses, this thickness may be even greater or the entire glass object may be leached.
For the considerations here, the most important feature of the gel layer is the change of its refractive index due to the alteration of its chemical composition, when compared to the parent glass. Refractive index, n
R, is a function of wavelength and temperature [21].
Materials are usually characterized by refractive index n
D in air measured at room temperature (25°C) and
the wavelength of the sodium D line (0.58929 µm). Refractive index depends strongly on the composition of the glass. Values of n
D for various kinds of simple
binary and ternary glasses have been reported by Bansal and Doremus [22], but there is little data for multi-component historic glass, although some values have been reported by Brill et al. [19] and Brill [23]. The refractive index of the gel layer is always less than that of the bulk glass for all types of historic glasses, including high lead glass [24]. Precise values of the refractive index in the infrared (IR) wavelength region have not been reported in the literature. However, it is reasonable to assume that a similar decrease in refractive index of the silica gel layer occurs, independent of glass composition.
Many physical methods can be used to measure the refractive index of glass [21]. Most of them require samples to be taken, and therefore can be considered destructive for historic objects. Only a few attempts have been made to modify the methods to make them less invasive. For example, at the beginning of the 1980s Miura used a laser (He-Ne or He-Cd) to measure the refractive index of ancient glass beads immersed in oil of known n
R [25]. Calculations have been made of the
refractive index from the chemical composition of glass and, in certain cases, from the known value of glass density [22, 26, 27]. Neither of these methods are simple enough to be applied on a wider scale in museums, nor do they help in obtaining the thickness of the gel layer.
What really needs to be identified is the interface between two zones – bulk glass and silica gel layer. To find it, various kinds of microscopic techniques can be applied. For example, the registration of back-scattered electrons in the scanning electron microscope (SEM) allows the thickness of the gel layer on the glass cross-section to be observed and measured (Figure 2a). Dark areas depict the zones of gel layer, which consist mainly of silica. As this technique requires a glass sample to be taken and access to a SEM or electron probe microanalysis (EPMA) facility, application of this method on a wide scale is limited.
At the beginning of the 1990s, Ulitzka [18] employed a confocal laser raster microscope to record the
extremely weak reflection of the laser beam at the refractive index interface. He was able to determine the thickness of the gel layer with a resolution of about 0.1 µm. Unfortunately, the extremely high cost of the facility limited using this solution on a wider scale. This paper proposes the application of another optical, thus non-invasive, method for the determination of the range of deterioration processes in historic glass. It does not require any sample to be taken from the historic object and can be used on a wide scale (also in a portable mode).
OPTICAL COHERENCE TOMOGRAPHY (OCT)
Optical coherence tomography (OCT) is still a relatively new technique, offering a unique possibility of visualizing the inner structure of semi-transparent objects that weakly absorb and scatter light. It is non-contact, non-invasive and, in principle, completely safe for the object tested as long as the exposure is limited to a certain level. This method has been successfully used and commercialized in medicine, especially in ophthalmology [28].
Over the last few years, an increasing number of OCT applications to investigate the structure of historic artefacts have been reported and recently reviewed [29–31]. Although the major applications are for the examination of semi-transparent and transparent layers of easel paintings [32–36] and similar lacquer layers [37], reports on the study of stained glass [36] and the structure of historic glass [38, 39] have recently appeared.
OCT relies on the examination of light reflected or scattered back from the internal structures of the object under investigation. Usually the object is penetrated by a narrow beam of light. Information on the locations of backscattering and reflecting centres distributed within the object along the path of this beam is extracted by means of interferometry. This enables the reconstruction of an in-depth single line (often called an A-scan, by analogy with ultrasonography) of the tomogram. Serial lateral displacements of the beam to adjacent positions enable imaging of the structure of a two-dimensional slice of the object (a B-scan).
The most promising OCT technology employs Fourier domain detection (FdOCT). Here, all the information about the single in-depth line of the object measured is extracted from the interference fringe pattern, superimposed onto a spectrum of the light source, using a Fourier transformation. Therefore, there is no need for moving parts for axial scanning, and light scattered from all structures along the probing path is
120 J. KUNICKI-GOLDFINGER, P. TARGOWSKI, M. GÓRA, P. KARASZKIEWICZ AND P. DZIERZ. ANOWSKI
S T U D I E S I N C O N S E RVAT I O N 5 4 ( 2 0 0 9 ) PAG E S 1 1 7 – 1 2 8
collected at once. This results in improved acquisition speed, stability and, due to the multiplex advantage, higher sensitivity of the system. The most popular version of a FdOCT instrument is equipped with a spectrometer as the spectral detector and is referred to as a Spectral domain OCT, or SOCT system. The state-of-the-art instrument of this kind is capable of registering 25000 in-depth lines of the tomogram per second with very high sensitivity. The lowest detectable signal capable of image reconstruction is usually smaller than a 10−10 fraction of the incident light intensity. The SOCT methodology has already been described in detail elsewhere [40].
EXPERIMENTAL
The OCT tomograms presented in this study were obtained with a prototype Spectral OCT instrument [36] developed and constructed at the Nicolaus Copernicus University in Torun, Poland, and recently improved in terms of sensitivity and stability [41]. The version employed in this study utilizes a broadband (∆λ = 50 nm, central wavelength 830 nm) infrared superluminescent diode as a light source. This enables axial resolution of 14 µm in air and 9 µm in media with a refractive index of 1.5 (due to the extended optical path in such a medium). The instrument comprises a Michelson interferometer with a single-mode fibre optic 3 dB coupler. Together with the scanning head it is mounted on an adjustable stand to ensure easy access to different locations on an object. The spectrometer, connected to the interferometer with a single-mode optical fibre, comprises a high-speed line-scan camera and highly efficient volume holographic grating with 1200 lines per millimetre. The acquisition process is controlled by a custom-designed compact electronic drive unit.
The axial range of imaging is 2 mm, which depends on the resolving power of the spectrometer and the depth of focus of the scanning head optics. The surface area to be analysed in a single data collection is limited to a square of about 20 × 20 mm in size (a significant decrease in backscattered signal was observed beyond these perimeters because of the limited aperture of the focusing optics). The optical power of the beam incident at the glass surface was adjustable from 500 to 1500 µW. The overall sensitivity of the improved system is 106 dB (the lowest detectable level of backscattered light is 2.5 × 10⁻¹¹ of the incident light) with the camera exposure time of 32 µs per single in-depth line of the tomogram.
In all OCT tomograms shown in this paper, the intensity of light scattered and/or reflected from the internal structures within the sample is shown in false colour: yellow and green indicate regions showing a high level of backscattering of the penetrating light, while blue indicates areas of low scattering. In almost all of the tomograms presented, light is incident from above, and the interface between air and the sample is thus always the uppermost line. The only exception is the lower tomogram (marked as 1i) presented in Figure 2b, where light is incident from the bottom. It is worth noting that all axial (vertical in presented tomograms) distances obtained with the OCT technique are originally the optical ones. This means that distances inside the material are artificially elongated by a factor equal to the refractive index of the material. The OCT images shown in Figures 2–4 are numerically corrected for this effect, with n
R = 1.5 used as an approximation
to the refractive index of both leached and parent glass. In the case of Figure 5, the image was intentionally left uncorrected; the scale bar indicates the distance in air.
Objects examined
Five artefacts were selected for the study (see Table 1). All of them represent historic objects that faced extreme environmental conditions over a long period of time. They have a range of glass compositions and have different levels of durability. The simplified chemical compositions of the glasses are shown in Table 2.
The first object (No. 1) is a piece of dark amber nineteenth-century stained glass made of low-calcium, high-alkali glass of low chemical durability. Both sides are severely crizzled. It is almost opaque due to the advanced corrosion of its surfaces. Figure 1 shows the pattern of cracks on its inner, painted surface.
The glass plate was exposed in a church window; the different influence of the outer and inner environment on the process of glass corrosion is clearly seen. The outer surface (1o, see Table 1 for reference) is severely cracked in all directions and many chips have flaked off its surface leaving holes of 40–60 µm depth. Due to the very dense crizzling pattern and the presence of many small irregular holes, the surface is very matt. The inner surface (1i) is glossy.
The next three objects, Nos. 2–4, are fragments of façon-de-Venise vessels, excavated from cesspits. They remained in an almost stable environment for 300–500 years. Significant differences in their present state are due to differences in chemical composition rather than to environmental influence, since the latter was similar
CHARACTERIZATION OF GLASS SURFACE MORPHOLOGY BY OPTICAL COHERENCE TOMOGRAPHY 121
S T U D I E S I N C O N S E RVAT I O N 5 4 ( 2 0 0 9 ) PAG E S 1 1 7 – 1 2 8
in each case. Vessel No. 2 is a low-calcium, high-alkali glass. Its surface (2o) has been severely crizzled due to its unstable composition and to the change of environment during its excavation from the cesspit. The glass of the other two goblets (Nos. 3 and 4) is preserved in quite good condition compared to glass No. 2. They are both potassium glasses with the concentration of calcium oxide well above 10%. This explains their higher durability and better condition. Their surfaces are not crizzled, but slightly rough and dull, as well as partly covered with deposits. They are denoted as 3o and 4o respectively.
Object No. 5 was excavated from a marine site; it is a piece of green bottle dated to the late eighteenth century. Notwithstanding the unfavourable seawater environment [43], the glass has survived in quite good condition showing only some matt and rough areas on its outer surface (5o). The inner surface of the bottle (5i) is shiny and appears almost perfect. The glass is high-calcium, low-alkali with high aluminium and iron contents, which accounts for its exceptional durability.
RESULTS AND DISCUSSION
For each sample many OCT tomograms were recorded at various locations, but for conciseness only a selection of representative images are shown here.
A cross-section of a sample from glass No 1 was prepared and analysed with SEM using BSE (see Figure 2a). The darker areas in the image represent zones of the gel layer, denoted as G (chemical composition: 79.3% SiO
2, 0.6% Al
2O
3, 0.7% Na
2O, 3.8% K
2O, 6.0% CaO,
0.1% MgO, with the total of these components about 90%), whereas lighter areas correspond to the bulk glass, denoted as B (see Table 2 for chemical composition). The thickness of the outer surface layer (1o) can be estimated to be about 250 µm, whereas the layer on the inner
Table 1 General description of the objects examined
No. Owner/Inv. no. Object Description of fragment Remarks Surface description
1 Private collection 19th-century stained glass from a church window, Powidz, Poland
Plate, one side painted with black opaque fired paint (contour). Dark amber glass
Very fragile glass, cracked through its entire thickness
1o Outer, undecorated, surface of the glass. Crizzled and flaking
1i Indoor surface of stained glass. Flaking and extremely crizzled. The surface of glass below paint layer has been intact
2 EM/XXXI/1900 Post-medieval fdV goblet excavated from a cesspit in Old Town, Elblag, Poland
Hollow knob of stem with some remnants of stem’s flattened discs and bottom part of the bowl. Colourless glass
The ribbed knob, blown in a mould, was originally partly filled with a liquid
2o Outer surface of the knob. Crizzled and flaking
3 EM/XXII/6071 Post-medieval fdV goblet excavated from a cesspit in Old Town, Elblag, Poland
Fragment of a bowl with a rim. Colourless glass
– 3o Outer surface of the bowl
4 EM/XXII/10839 Post-medieval fdV goblet excavated from a cesspit in Old Town, Elblag, Poland
Hollow knob of a stem. Colourless glass (greenish tint)
Knob decorated with four flowers, rounded, blown in a mould
4o Outer surface of the knob
5 CMM/B.98.2 Late 18th-century bottle/flask. Underwater glass from shipwreck no. B.98.2, Baltic Sea (about 35 km north-east of Łeba, Poland)
Fragment of a bowl. Green glass
Glass fragment taken from wreck of British sailing ship at a depth of 38 m
5o Convex (outer) surface
5i Concave (inner) surface
EM: Archaeological-Historical Museum in Elblag, Poland; CMM: Polish Maritime Museum in Gda nsk, Poland; fdV: vessel made in a façon-de-Venise style.
Table 2 Simplified chemical composition of the examined glasses, in percentage weight
No. Na2O K2O CaO MgO SiO2 Al2O3 MnO Fe2O3
1 8.2 19.5 4.9 0.1 66.5 0.6 0.1 0.1
2 4.7 18.5 3.1 1.1 69.0 0.8 0.9 0.33 0.1 16.7 16.0 2.7 56.3 1.6 1.3 0.44 2.4 9.7 17.1 2.6 63.9 2.1 0.9 0.35 2.1 1.0 25.2 2.8 59.1 4.8 0.1 2.3
Glasses Nos. 1–2 were analysed by electron probe microanalysis (EPMA) (see Appendix for experimental details). Glasses Nos. 3–5 were analysed by prompt gamma activation analysis (PGAA) [42].
122 J. KUNICKI-GOLDFINGER, P. TARGOWSKI, M. GÓRA, P. KARASZKIEWICZ AND P. DZIERZ. ANOWSKI
S T U D I E S I N C O N S E RVAT I O N 5 4 ( 2 0 0 9 ) PAG E S 1 1 7 – 1 2 8
surface (1i) is one third of this thickness. The chemical compositions of the gel layers on the inner and outer sides of the sample, and their degree of hydration are almost the same, but the thicknesses of the layers differ.
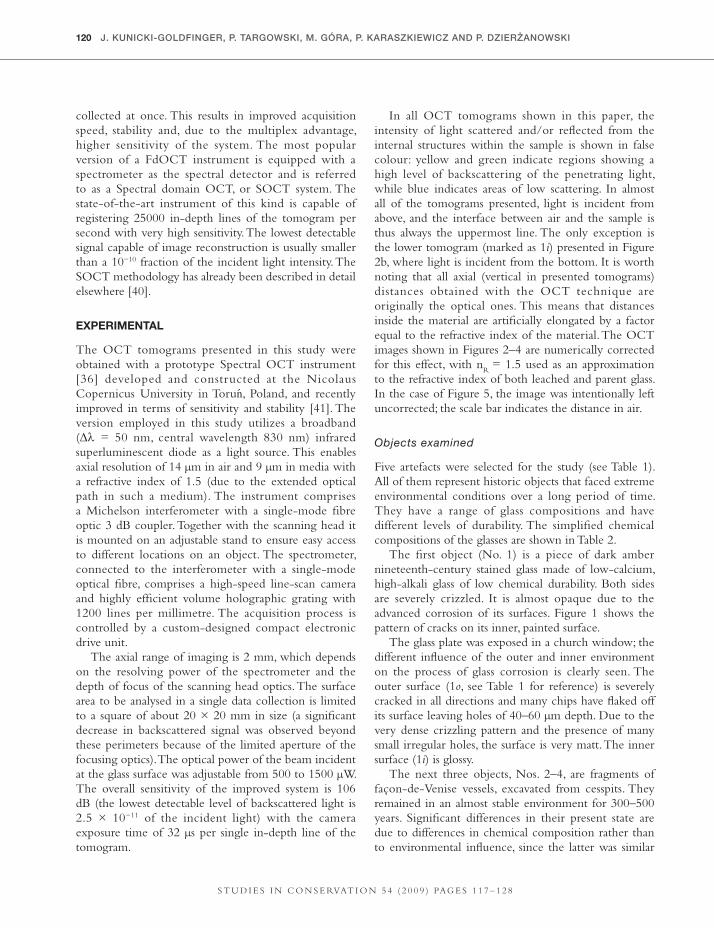
A cross-section of the same glass (No. 1), obtained non-invasively at a different location, is presented as an OCT tomogram in Figure 2b. Because these images are shown at the same scale, they may be compared directly with the BSE image (Figure 2a). The upper image reveals the structure of the outer surface layer (1o). The surface of the glass, which strongly reflects light, can be easily distinguished as the uppermost line. It can also be seen in the BSE image that, apart from regions with many holes due to glass delamination, the surface is smooth. The depth of holes determined by OCT (30–50 µm) fits the data obtained from the BSE image. The most significant feature of the OCT tomograms shown in Figure 2b is the presence of uneven scattering layers below both glass surfaces. These layers are composed of regions of high scattering (marked as 1 in Figure 2b) and small cracks parallel to the surface (marked as 2) which indicate gradual and localized delamination of glass. Many flakes have already cracked off and separated, but those which remain are also visible (marked as 3). Comparison with the BSE image permits the identification of this layer as a highly scattering silica gel. It is expected that the thicknesses of the gel layer determined from Figures 2a and 2b should be consistent. To aid clarity, a dotted line 250 µm away from the outer surface line is drawn in Figure 2b. The consistency between the different techniques is evident, even though there is not a sharp
Figure 1 Severely crizzled surface of nineteenth-century stained glass (see Table 1, No. 1i). The crack pattern has been enhanced by the use of a fluorescent penetrant excited by ultraviolet light (photograph: J. Kunicki-Goldfinger).
Figure 2 Cross-section of the sample of stained glass (Figure 1): (a) SEM BSE image showing bulk glass (B) and gel layer (G) as lighter and darker areas, respectively, and paint layer (P) at inner surface ( i ) (from Kunicki-Goldfinger [2]); and (b) OCT tomograms of the same glass shown to the same scale. Strong yellow lines indicate air–glass interfaces. Probing light approaches the outer surface (o) from the top and the inner surface (i) from the bottom. For better comparison with image (a), a dotted magenta line has been drawn parallel to and 250 µm from the outer surface line (o). Within a leached layer, high-scattering silica gel regions (1), internal cracks (2), and flakes (3) are visible under surface (o). Under inner surface ( i ) deep crizzling cracks (4) are also present. Although the OCT data were collected from a different area of the sample, the close correspondence of images (a) and (b) is evident.
CHARACTERIZATION OF GLASS SURFACE MORPHOLOGY BY OPTICAL COHERENCE TOMOGRAPHY 123
S T U D I E S I N C O N S E RVAT I O N 5 4 ( 2 0 0 9 ) PAG E S 1 1 7 – 1 2 8
and continuous border between bulk glass and its gel layer in the tomogram. Such an interface, originating from the expected change in the refractive index, should, in principle, be detectable with OCT. Surprisingly, in all of the stained glass samples analysed by the authors so far, the interface is not visible.
Similarly, the tomogram (Figure 2b, lower image) of the inner side (1i) of the same glass – characterized by a less dense crizzling pattern (Figure 1) and more glossy surface with a smaller number of holes – gives information about the thickness of the gel layer (50–70 µm) and depth of holes. Moreover, additional information concerning the presence of deeper cracks (marked as 4) and their propagation, which was also observed on the glass cross-section, is evident.
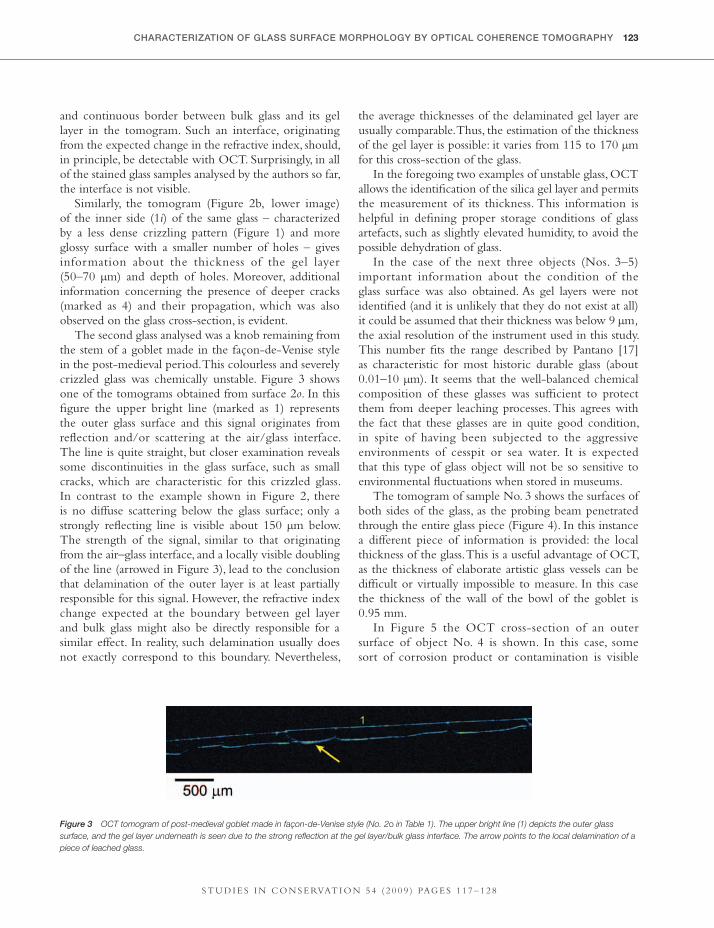
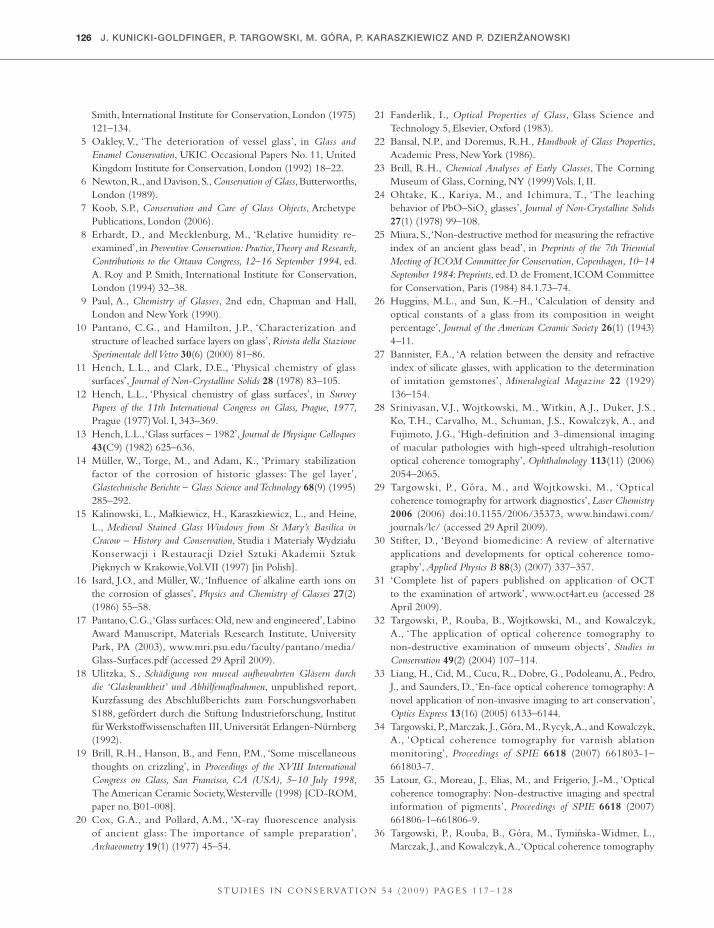
The second glass analysed was a knob remaining from the stem of a goblet made in the façon-de-Venise style in the post-medieval period. This colourless and severely crizzled glass was chemically unstable. Figure 3 shows one of the tomograms obtained from surface 2o. In this figure the upper bright line (marked as 1) represents the outer glass surface and this signal originates from reflection and/or scattering at the air/glass interface. The line is quite straight, but closer examination reveals some discontinuities in the glass surface, such as small cracks, which are characteristic for this crizzled glass. In contrast to the example shown in Figure 2, there is no diffuse scattering below the glass surface; only a strongly reflecting line is visible about 150 µm below. The strength of the signal, similar to that originating from the air–glass interface, and a locally visible doubling of the line (arrowed in Figure 3), lead to the conclusion that delamination of the outer layer is at least partially responsible for this signal. However, the refractive index change expected at the boundary between gel layer and bulk glass might also be directly responsible for a similar effect. In reality, such delamination usually does not exactly correspond to this boundary. Nevertheless,
the average thicknesses of the delaminated gel layer are usually comparable. Thus, the estimation of the thickness of the gel layer is possible: it varies from 115 to 170 µm for this cross-section of the glass.
In the foregoing two examples of unstable glass, OCT allows the identification of the silica gel layer and permits the measurement of its thickness. This information is helpful in defining proper storage conditions of glass artefacts, such as slightly elevated humidity, to avoid the possible dehydration of glass.
In the case of the next three objects (Nos. 3–5) important information about the condition of the glass surface was also obtained. As gel layers were not identified (and it is unlikely that they do not exist at all) it could be assumed that their thickness was below 9 µm, the axial resolution of the instrument used in this study. This number fits the range described by Pantano [17] as characteristic for most historic durable glass (about 0.01–10 µm). It seems that the well-balanced chemical composition of these glasses was sufficient to protect them from deeper leaching processes. This agrees with the fact that these glasses are in quite good condition, in spite of having been subjected to the aggressive environments of cesspit or sea water. It is expected that this type of glass object will not be so sensitive to environmental fluctuations when stored in museums.
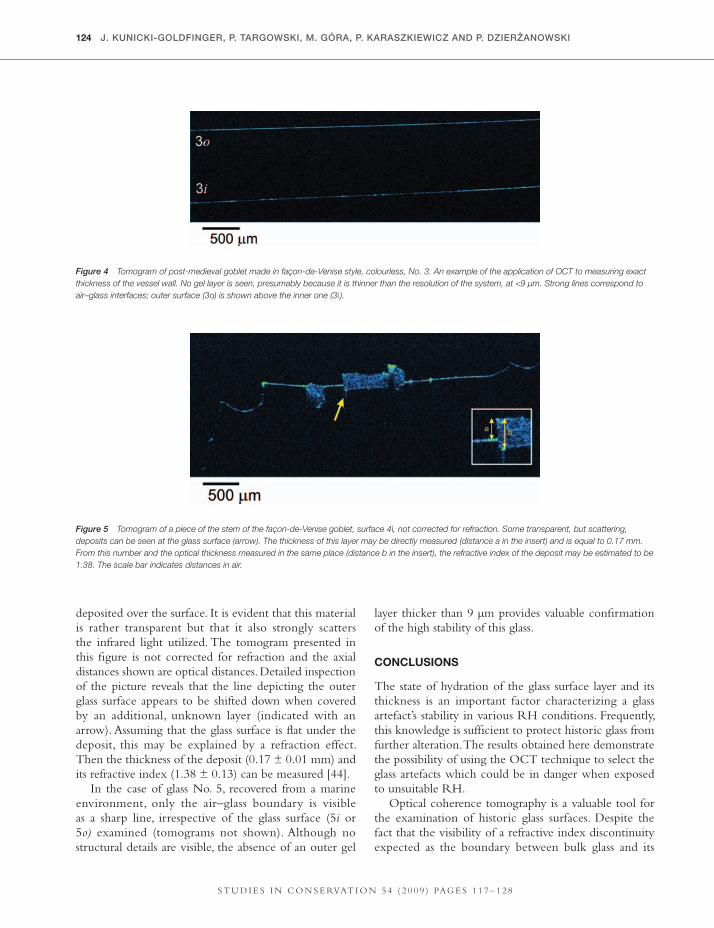
The tomogram of sample No. 3 shows the surfaces of both sides of the glass, as the probing beam penetrated through the entire glass piece (Figure 4). In this instance a different piece of information is provided: the local thickness of the glass. This is a useful advantage of OCT, as the thickness of elaborate artistic glass vessels can be difficult or virtually impossible to measure. In this case the thickness of the wall of the bowl of the goblet is 0.95 mm.
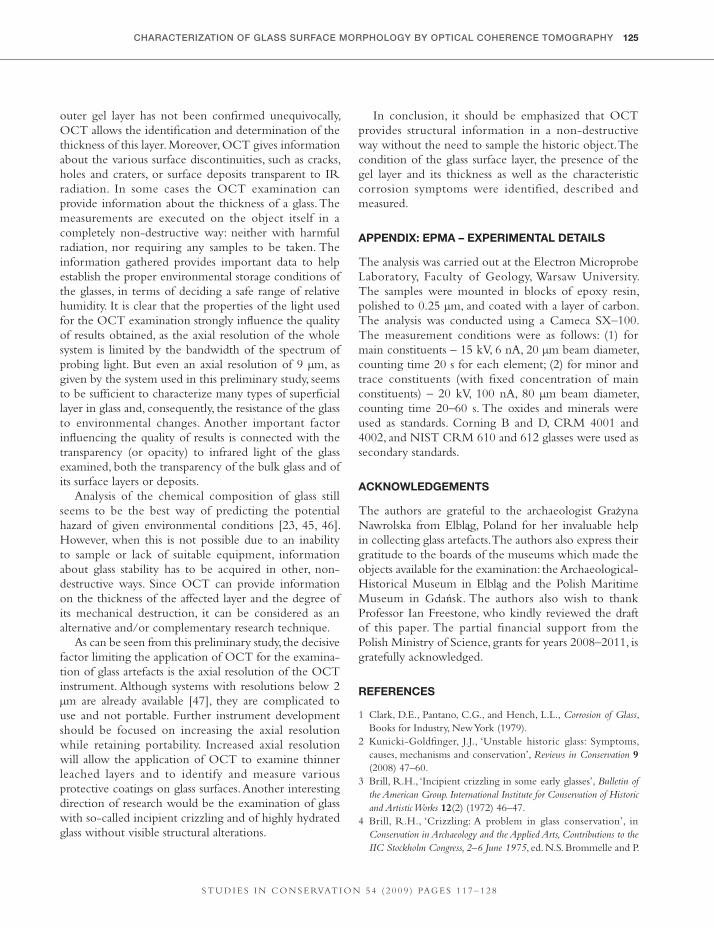
In Figure 5 the OCT cross-section of an outer surface of object No. 4 is shown. In this case, some sort of corrosion product or contamination is visible
Figure 3 OCT tomogram of post-medieval goblet made in façon-de-Venise style (No. 2o in Table 1). The upper bright line (1) depicts the outer glass surface, and the gel layer underneath is seen due to the strong reflection at the gel layer/bulk glass interface. The arrow points to the local delamination of a piece of leached glass.
124 J. KUNICKI-GOLDFINGER, P. TARGOWSKI, M. GÓRA, P. KARASZKIEWICZ AND P. DZIERZ. ANOWSKI
S T U D I E S I N C O N S E RVAT I O N 5 4 ( 2 0 0 9 ) PAG E S 1 1 7 – 1 2 8
deposited over the surface. It is evident that this material is rather transparent but that it also strongly scatters the infrared light utilized. The tomogram presented in this figure is not corrected for refraction and the axial distances shown are optical distances. Detailed inspection of the picture reveals that the line depicting the outer glass surface appears to be shifted down when covered by an additional, unknown layer (indicated with an arrow). Assuming that the glass surface is flat under the deposit, this may be explained by a refraction effect. Then the thickness of the deposit (0.17 ± 0.01 mm) and its refractive index (1.38 ± 0.13) can be measured [44].
In the case of glass No. 5, recovered from a marine environment, only the air–glass boundary is visible as a sharp line, irrespective of the glass surface (5i or 5o) examined (tomograms not shown). Although no structural details are visible, the absence of an outer gel
layer thicker than 9 µm provides valuable confirmation of the high stability of this glass.
CONCLUSIONS
The state of hydration of the glass surface layer and its thickness is an important factor characterizing a glass artefact’s stability in various RH conditions. Frequently, this knowledge is sufficient to protect historic glass from further alteration. The results obtained here demonstrate the possibility of using the OCT technique to select the glass artefacts which could be in danger when exposed to unsuitable RH.
Optical coherence tomography is a valuable tool for the examination of historic glass surfaces. Despite the fact that the visibility of a refractive index discontinuity expected as the boundary between bulk glass and its
Figure 4 Tomogram of post-medieval goblet made in façon-de-Venise style, colourless, No. 3. An example of the application of OCT to measuring exact thickness of the vessel wall. No gel layer is seen, presumably because it is thinner than the resolution of the system, at <9 µm. Strong lines correspond to air–glass interfaces; outer surface (3o) is shown above the inner one (3i ).
Figure 5 Tomogram of a piece of the stem of the façon-de-Venise goblet, surface 4i, not corrected for refraction. Some transparent, but scattering, deposits can be seen at the glass surface (arrow). The thickness of this layer may be directly measured (distance a in the insert) and is equal to 0.17 mm. From this number and the optical thickness measured in the same place (distance b in the insert), the refractive index of the deposit may be estimated to be 1.38. The scale bar indicates distances in air.
CHARACTERIZATION OF GLASS SURFACE MORPHOLOGY BY OPTICAL COHERENCE TOMOGRAPHY 125
S T U D I E S I N C O N S E RVAT I O N 5 4 ( 2 0 0 9 ) PAG E S 1 1 7 – 1 2 8
outer gel layer has not been confirmed unequivocally, OCT allows the identification and determination of the thickness of this layer. Moreover, OCT gives information about the various surface discontinuities, such as cracks, holes and craters, or surface deposits transparent to IR radiation. In some cases the OCT examination can provide information about the thickness of a glass. The measurements are executed on the object itself in a completely non-destructive way: neither with harmful radiation, nor requiring any samples to be taken. The information gathered provides important data to help establish the proper environmental storage conditions of the glasses, in terms of deciding a safe range of relative humidity. It is clear that the properties of the light used for the OCT examination strongly influence the quality of results obtained, as the axial resolution of the whole system is limited by the bandwidth of the spectrum of probing light. But even an axial resolution of 9 µm, as given by the system used in this preliminary study, seems to be sufficient to characterize many types of superficial layer in glass and, consequently, the resistance of the glass to environmental changes. Another important factor influencing the quality of results is connected with the transparency (or opacity) to infrared light of the glass examined, both the transparency of the bulk glass and of its surface layers or deposits.
Analysis of the chemical composition of glass still seems to be the best way of predicting the potential hazard of given environmental conditions [23, 45, 46]. However, when this is not possible due to an inability to sample or lack of suitable equipment, information about glass stability has to be acquired in other, non-destructive ways. Since OCT can provide information on the thickness of the affected layer and the degree of its mechanical destruction, it can be considered as an alternative and/or complementary research technique.
As can be seen from this preliminary study, the decisive factor limiting the application of OCT for the examina-tion of glass artefacts is the axial resolution of the OCT instrument. Although systems with resolutions below 2 µm are already available [47], they are complicated to use and not portable. Further instrument development should be focused on increasing the axial resolution while retaining portability. Increased axial resolution will allow the application of OCT to examine thinner leached layers and to identify and measure various protective coatings on glass surfaces. Another interesting direction of research would be the examination of glass with so-called incipient crizzling and of highly hydrated glass without visible structural alterations.
In conclusion, it should be emphasized that OCT provides structural information in a non-destructive way without the need to sample the historic object. The condition of the glass surface layer, the presence of the gel layer and its thickness as well as the characteristic corrosion symptoms were identified, described and measured.
APPENDIX: EPMA – EXPERIMENTAL DETAILS
The analysis was carried out at the Electron Microprobe Laboratory, Faculty of Geology, Warsaw University. The samples were mounted in blocks of epoxy resin, polished to 0.25 µm, and coated with a layer of carbon. The analysis was conducted using a Cameca SX–100. The measurement conditions were as follows: (1) for main constituents – 15 kV, 6 nA, 20 µm beam diameter, counting time 20 s for each element; (2) for minor and trace constituents (with fixed concentration of main constituents) – 20 kV, 100 nA, 80 µm beam diameter, counting time 20–60 s. The oxides and minerals were used as standards. Corning B and D, CRM 4001 and 4002, and NIST CRM 610 and 612 glasses were used as secondary standards.
ACKNOWLEDGEMENTS
The authors are grateful to the archaeologist Grażyna Nawrolska from Elbląg, Poland for her invaluable help in collecting glass artefacts. The authors also express their gratitude to the boards of the museums which made the objects available for the examination: the Archaeological-Historical Museum in Elbląg and the Polish Maritime Museum in Gdańsk. The authors also wish to thank Professor Ian Freestone, who kindly reviewed the draft of this paper. The partial financial support from the Polish Ministry of Science, grants for years 2008–2011, is gratefully acknowledged.
REFERENCES
1 Clark, D.E., Pantano, C.G., and Hench, L.L., Corrosion of Glass, Books for Industry, New York (1979).
2 Kunicki-Goldfinger, J.J., ‘Unstable historic glass: Symptoms, causes, mechanisms and conservation’, Reviews in Conservation 9 (2008) 47–60.
3 Brill, R.H., ‘Incipient crizzling in some early glasses’, Bulletin of the American Group. International Institute for Conservation of Historic and Artistic Works 12(2) (1972) 46–47.
4 Brill, R.H., ‘Crizzling: A problem in glass conservation’, in Conservation in Archaeology and the Applied Arts, Contributions to the IIC Stockholm Congress, 2–6 June 1975, ed. N.S. Brommelle and P.
126 J. KUNICKI-GOLDFINGER, P. TARGOWSKI, M. GÓRA, P. KARASZKIEWICZ AND P. DZIERZ. ANOWSKI
S T U D I E S I N C O N S E RVAT I O N 5 4 ( 2 0 0 9 ) PAG E S 1 1 7 – 1 2 8
Smith, International Institute for Conservation, London (1975) 121–134.
5 Oakley, V., ‘The deterioration of vessel glass’, in Glass and Enamel Conservation, UKIC Occasional Papers No. 11, United Kingdom Institute for Conservation, London (1992) 18–22.
6 Newton, R., and Davison, S., Conservation of Glass, Butterworths, London (1989).
7 Koob, S.P., Conservation and Care of Glass Objects, Archetype Publications, London (2006).
8 Erhardt, D., and Mecklenburg, M., ‘Relative humidity re-examined’, in Preventive Conservation: Practice, Theory and Research, Contributions to the Ottawa Congress, 12–16 September 1994, ed. A. Roy and P. Smith, International Institute for Conservation, London (1994) 32–38.
9 Paul, A., Chemistry of Glasses, 2nd edn, Chapman and Hall, London and New York (1990).
10 Pantano, C.G., and Hamilton, J.P., ‘Characterization and structure of leached surface layers on glass’, Rivista della Stazione Sperimentale dell Vetro 30(6) (2000) 81–86.
11 Hench, L.L., and Clark, D.E., ‘Physical chemistry of glass surfaces’, Journal of Non-Crystalline Solids 28 (1978) 83–105.
12 Hench, L.L., ‘Physical chemistry of glass surfaces’, in Survey Papers of the 11th International Congress on Glass, Prague, 1977, Prague (1977) Vol. I, 343–369.
13 Hench, L.L., ‘Glass surfaces – 1982’, Journal de Physique Colloques 43(C9) (1982) 625–636.
14 Müller, W., Torge, M., and Adam, K., ‘Primary stabilization factor of the corrosion of historic glasses: The gel layer’, Glastechnische Berichte – Glass Science and Technology 68(9) (1995) 285–292.
15 Kalinowski, L., Małkiewicz, H., Karaszkiewicz, L., and Heine, L., Medieval Stained Glass Windows from St Mary’s Basilica in Cracow – History and Conservation, Studia i Materiały Wydziału Konserwacji i Restauracji Dzieł Sztuki Akademii Sztuk Pięknych w Krakowie, Vol. VII (1997) [in Polish].
16 Isard, J.O., and Müller, W., ‘Influence of alkaline earth ions on the corrosion of glasses’, Physics and Chemistry of Glasses 27(2) (1986) 55–58.
17 Pantano, C.G., ‘Glass surfaces: Old, new and engineered’, Labino Award Manuscript, Materials Research Institute, University Park, PA (2003), www.mri.psu.edu/faculty/pantano/media/Glass-Surfaces.pdf (accessed 29 April 2009).
18 Ulitzka, S., Schädigung von museal aufbewahrten Gläsern durch die ‘Glaskrankheit’ und Abhilfemaßnahmen, unpublished report, Kurzfassung des Abschlußberichts zum Forschungsvorhaben S188, gefördert durch die Stiftung Industrieforschung, Institut für Werkstoffwissenschaften III, Universität Erlangen-Nürnberg (1992).
19 Brill, R.H., Hanson, B., and Fenn, P.M., ‘Some miscellaneous thoughts on crizzling’, in Proceedings of the XVIII International Congress on Glass, San Francisco, CA (USA), 5–10 July 1998, The American Ceramic Society, Westerville (1998) [CD-ROM, paper no. B01-008].
20 Cox, G.A., and Pollard, A.M., ‘X-ray fluorescence analysis of ancient glass: The importance of sample preparation’, Archaeometry 19(1) (1977) 45–54.
21 Fanderlik, I., Optical Properties of Glass, Glass Science and Technology 5, Elsevier, Oxford (1983).
22 Bansal, N.P., and Doremus, R.H., Handbook of Glass Properties, Academic Press, New York (1986).
23 Brill, R.H., Chemical Analyses of Early Glasses, The Corning Museum of Glass, Corning, NY (1999) Vols. I, II.
24 Ohtake, K., Kariya, M., and Ichimura, T., ‘The leaching behavior of PbO–SiO
2 glasses’, Journal of Non-Crystalline Solids
27(1) (1978) 99–108.25 Miura, S., ‘Non-destructive method for measuring the refractive
index of an ancient glass bead’, in Preprints of the 7th Triennial Meeting of ICOM Committee for Conservation, Copenhagen, 10–14 September 1984: Preprints, ed. D. de Froment, ICOM Committee for Conservation, Paris (1984) 84.1.73–74.
26 Huggins, M.L., and Sun, K.–H., ‘Calculation of density and optical constants of a glass from its composition in weight percentage’, Journal of the American Ceramic Society 26(1) (1943) 4–11.
27 Bannister, F.A., ‘A relation between the density and refractive index of silicate glasses, with application to the determination of imitation gemstones’, Mineralogical Magazine 22 (1929) 136–154.
28 Srinivasan, V.J., Wojtkowski, M., Witkin, A.J., Duker, J.S., Ko, T.H., Carvalho, M., Schuman, J.S., Kowalczyk, A., and Fujimoto, J.G., ‘High-definition and 3-dimensional imaging of macular pathologies with high-speed ultrahigh-resolution optical coherence tomography’, Ophthalmology 113(11) (2006) 2054–2065.
29 Targowski, P., Góra, M., and Wojtkowski, M., ‘Optical coherence tomography for artwork diagnostics’, Laser Chemistry 2006 (2006) doi:10.1155/2006/35373, www.hindawi.com/journals/lc/ (accessed 29 April 2009).
30 Stifter, D., ‘Beyond biomedicine: A review of alternative applications and developments for optical coherence tomo-graphy’, Applied Physics B 88(3) (2007) 337–357.
31 ‘Complete list of papers published on application of OCT to the examination of artwork’, www.oct4art.eu (accessed 28 April 2009).
32 Targowski, P., Rouba, B., Wojtkowski, M., and Kowalczyk, A., ‘The application of optical coherence tomography to non-destructive examination of museum objects’, Studies in Conservation 49(2) (2004) 107–114.
33 Liang, H., Cid, M., Cucu, R., Dobre, G., Podoleanu, A., Pedro, J., and Saunders, D., ‘En-face optical coherence tomography: A novel application of non-invasive imaging to art conservation’, Optics Express 13(16) (2005) 6133–6144.
34 Targowski, P., Marczak, J., Góra, M., Rycyk, A., and Kowalczyk, A., ‘Optical coherence tomography for varnish ablation monitoring’, Proceedings of SPIE 6618 (2007) 661803-1–661803-7.
35 Latour, G., Moreau, J., Elias, M., and Frigerio, J.-M., ‘Optical coherence tomography: Non-destructive imaging and spectral information of pigments’, Proceedings of SPIE 6618 (2007) 661806-1–661806-9.
36 Targowski, P., Rouba, B., Góra, M., Tyminska-Widmer, L., Marczak, J., and Kowalczyk, A., ‘Optical coherence tomography
CHARACTERIZATION OF GLASS SURFACE MORPHOLOGY BY OPTICAL COHERENCE TOMOGRAPHY 127
S T U D I E S I N C O N S E RVAT I O N 5 4 ( 2 0 0 9 ) PAG E S 1 1 7 – 1 2 8
in art diagnostics and restoration’, Applied Physics A A92 (2008) 1–9.
37 Adler, D.C., Stenger, J., Gorczynska, I., Lie, H., Hensick, T., Spronk, R., Wolohojian, S., Khandekar, N., Jiang, J.Y., and Barry, S., ‘Comparison of three-dimensional optical coherence tomography and high resolution photography for art conservation studies’, Optics Express 15(24) (2007) 15972–15986.
38 Liang, H., Peric, B., Hughes, M., Podoleanu, A., Spring, M., and Saunders, D., ‘Optical coherence tomography for art conservation and archaeology’, Proceedings of SPIE 6618 (2007) 661805-1–661805-12.
39 Liang, H., Peric, B., Hughes, M., Podoleanu, A., Spring, M., and Roehrs, S. ‘Optical coherence tomography in archaeological and conservation science: A new emerging field’, Proceedings of SPIE 7139 (2008) 713915-1–713915-9.
40 Tomlins, P.H., and Wang, R.K., ‘Theory, developments and applications of optical coherence tomography’, Journal of Physics D: Applied Physics 38 (2005) 2519–2535.
41 Targowski, P., Góra, M., Bajraszewski, T., Szkulmowski, M., Wojtkowski, M., Kowalczyk, A., Rouba, B., Tymińska-Widmer, L., and Iwanicka, M., ‘Optical coherence tomography for structural imaging of artworks’, in Proceedings of the International Conference LACONA VII: Lasers in the Conservation of Artworks, Madrid, Spain, 17–21 September 2007, ed. M. Castillejo, P. Moreno, M. Oujja, R. Radvan and J. Ruiz, CRC Press, Taylor & Francis Group, London (2008) 61–65.
42 Kasztovszky, Z., and Kunicki-Goldfinger, J., ‘Applicability of prompt gamma activation analysis to glass archaeometry’, in Proceedings of the 37th International Symposium on Archaeometry, Siena, 12–16 May 2008 (in press).
43 Weier, L.E., ‘The deterioration of inorganic materials under the sea’, Bulletin of the Institute of Archaeology (London) 11 (1974) 131–163.
44 Liang, H., Peric, B., Spring, M., Saunders, D., Hughes, M., and Podoleanu, A., ‘Non-invasive imaging of subsurface paint layers with optical coherence tomography’, in Conservation Science 2007, Milan, 10–11 May 2007, ed. J. Townsend, Archetype Publishing, London (2008) 171–176
45 Kunicki-Goldfinger, J., Kierzek, J., Małożewska-Bućko, B., and Kasprzak, A., ‘Some observations on crizzled glass (preliminary results of a survey of 18th century central European tableware)’, Glass Technology 43C (2002) 364–368.
46 Kunicki-Goldfinger, J.J., ‘Preventive conservation strategy for glass collections: Identification of glasses susceptible to crizzling’, in Proceedings of the 5th EC Conference ‘Cultural Heritage Research: A Pan-European Challenge’, 16–18 May 2002, Kraków, ed. R. Kozłowski, Institute of Catalysis and Surface Chemistry, Polish Academy of Sciences, Kraków and European Communities (2003) 310–304.
47 Povazay, B., Bizheva, K., Unterhuber, A., Hermann, B., Sattmann, H., Fercher, A.F., Drexler, W., Apolonski, A., Wadsworth, W.J., Knight, J.C., Russell, P.S.J., Vetterlein, M., and Scherzer, E., ‘Submicrometer axial resolution optical coherence tomography’, Optics Letters 27(20) (2002) 1800–1802.
AUTHORS
JERZY J. KUNICKI-GOLDFINGER graduated in conservation of art from the Nicolaus Copernicus University in Torun, Poland, taught conservation and received his PhD in conservation at the same university. From 1999 to 2007 he was head of research on historic glass at the Institute of Nuclear Chemistry and Technology in Warsaw, Poland. In 2003/2004, he was the Fulbright Senior Scholar in the Corning Museum of Glass, Corning, NY, USA. Since 2008, he has been a researcher on historic glass at Cardiff School of History and Archaeology, Cardiff University, UK. His current research interests are the provenance and technological studies of vessel and stained glass, glass corrosion processes and conservation of glass. Address: School of History and Archaeology, Cardiff University, Humanities Building, Colum Drive, Cardiff CF10 3EU, Wales, UK. Email: [email protected]
PIOTR TARGOWSKI received his PhD and Habilitation degrees from Nicholaus Copernicus University in Torun, Poland, where he is an associate professor of optics and informatics. His main research field is the application of optical coherence tomography to structural imaging of works of art for both documentation and restoration purposes. Address: Institute of Physics, Nicolaus Copernicus University, ul. Grudziądzka 5, 87–100 Toruń, Poland. Email: [email protected]
MICHALINA GÓRA graduated in physics from the Nicolaus Copernicus University (NCU). At present she is a PhD student in the Institute of Physics, NCU. Her main research fields are sweep source OCT and the application of optical coherence tomography to structural imaging of works of art. Address: as Targowski. Email: [email protected]
PAWEŁ KARASZKIEWICZ is a conservation scientist (chemist) and received his PhD from the Institute of Environmental Engineering in Gliwice, Poland. He is a senior lecturer at the Faculty of Art Conservation at the Academy of Fine Arts in Cracow, Poland and head of the Conservation Chemistry Laboratory there. His main research fields are preventive conservation and conservation of historic glass and stained glass. Address: Faculty of Art Conservation and Restoration, Academy of Fine Arts, Lea 27/29, 30–052 Kraków, Poland. Email: [email protected]
PIOTR DZIERŻANOWSKI graduated in mineralogy at the University of Warsaw, Poland, received his PhD in earth
128 J. KUNICKI-GOLDFINGER, P. TARGOWSKI, M. GÓRA, P. KARASZKIEWICZ AND P. DZIERZ. ANOWSKI
S T U D I E S I N C O N S E RVAT I O N 5 4 ( 2 0 0 9 ) PAG E S 1 1 7 – 1 2 8
sciences (geochemistry) from the same university and is head of the Joint Institute Analytical Complex for Minerals and Synthetic Substances at the Faculty of
Geology of the University of Warsaw. Address: University of Warsaw, Faculty of Geology, al. Zwirki i Wigury 93; 02–089 Warszawa, Poland. Email: [email protected]
Résumé — La tomographie de cohérence optique (TCO) est un outil qui a été utilisée pour aider les restaurateurs et les chercheurs spécialisé dans la conservation du verre à suivre et à prédire l’évolution des surfaces de verre – une question cruciale dans le domaine de la conservation des verres anciens. Cette technique d’examen des structures internes des objets au moyen de rayonnement infrarouge a été mise au point pour le diagnostic médical, mais son application à tout objet qui absorbe ou diffuse faiblement l’infrarouge est simple. Comme l’intensité du rayonnement d’examen est très faible, cette méthode à distance est également totalement non invasive. L’objet est normalement pénétré par un faisceau étroit de rayonnement à large spectre. La distribution des centres de rétrodiffusion et de réflexion dans les objets est déterminée par interférométrie. La résolution obtenue se situe dans la fourchette 2-15 µm dans la direction axiale et généralement entre 15 et 40 µm dans la direction transversale. Dans le cas du verre, la technique permet l’identification et la caractérisation des couches superficielles de verres lessivées et hydratées, ce qui aide à décrire l’état de ce qu’on appelle communément le verre instable. Cinq objets historiques ont ainsi été examinés afin de montrer les avantages et les limites de la méthode.
Zusammenfassung — Optische Koherenz Tomographie (OKT) wurde als Werkzeug zur Beobachtung von Glasoberflächen und zur Vorhersage deren zukünftiger Veränderungen angewendet, womit eine entscheidende Frage in der Erhaltung von Glas angegangen werden kann. Diese Technik, bei der die innere Struktur von Objekte mit infrarotem Licht untersucht wird, stammt aus der diagnostischen Medizin, kann aber auch bei jedem anderen Objekt mit schwacher Lichtabsorbtion und/oder –streuung genutzt werden. Da die Lichtintensität bei der Untersuchung sehr gering ist, kann man die Methode als komplett zerstörungsfrei betrachten. Das Objekt wird dabei mit einem engen Strahl mit einem breiten Spektrum durchstrahlt. Die Verteilung der rückstreuenden und der reflektierenden Zentren wird durch Interferrometrie analysiert. Die Auflösung beträgt 2–15 µm in axialer sowie zwischen 15 und 40 µm in transversaler Richtung. Bei Glas erlaubt die Methode die Identifizierung und Charakterisierung der ausgelaugten und hydratisierten Oberflächenschichten und hilft daher, diese sogenannten instabilen Bereiche zu charakterisieren. Die Untersuchung von fünf historische Objekten zeigt Möglichkeiten und Grenzen der Methode auf.
Resumen — Tomografía de coherencia óptica (OCT) ha sido aplicada como una herramienta de ayuda a los conservadores e investigadores del vidrio para predecir y monitorizar la evolución de las superficies vítreas – una cuestión decisiva en el mantenimiento correcto del vidrio histórico. Esta técnica de examen de la estructura interna de los objetos con iluminación infrarroja se origina a partir del diagnostico médico, pero su aplicación a cualquier objeto que débilmente absorba y/o difunda la luz es bastante sencilla. Teniendo en consideración que la intensidad de la luz de examen es muy baja, este método remoto es completamente no-invasivo. El objeto es normalmente penetrado por un estrecho haz de luz de amplio espectro. La distribución de la retrodispersión y de los centros de reflexión en el mismo objeto es extraído por medio de interferometría. La resolución conseguida está en el rango de 2-15 µm axialmente, y generalmente entre 15 y 40 µm transversalmente. En el caso del vidrio, la técnica nos permite la identificación y caracterización de superficies de vidrio que han sufrido extracción de alguno de sus componentes o que han sido hidratadas, y nos ayuda a describir el estado de los vidrios denominados “inestables”. Se examinaron cinco artefactos históricos para exponer las ventajas y limitaciones del método.
Copyright © 2022 FDOKUMEN