Endovascular stent graft repair for aneurysms on the descending thoracic aorta
Vol. 25, No. 9, September 2013 429
Original Contribution
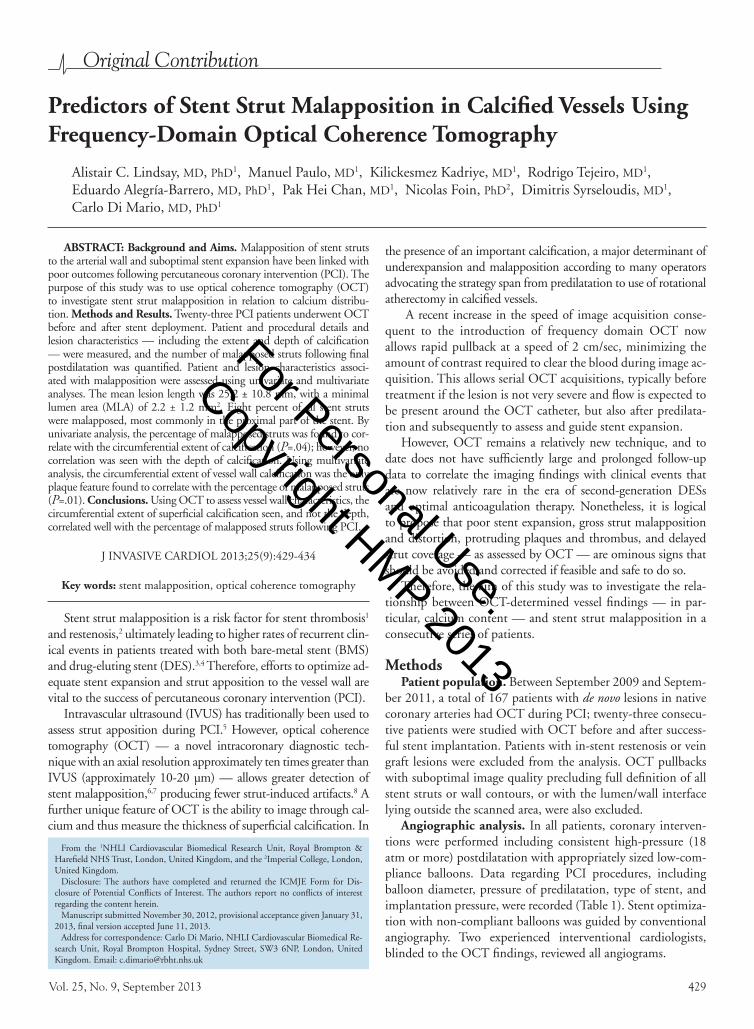
Predictors of Stent Strut Malapposition in Calcified Vessels Using Frequency-Domain Optical Coherence Tomography
Alistair C. Lindsay, MD, PhD1, Manuel Paulo, MD1, Kilickesmez Kadriye, MD1, Rodrigo Tejeiro, MD1, Eduardo Alegría-Barrero, MD, PhD1, Pak Hei Chan, MD1, Nicolas Foin, PhD2, Dimitris Syrseloudis, MD1, Carlo Di Mario, MD, PhD1
AbSTrACT: background and Aims. Malapposition of stent struts to the arterial wall and suboptimal stent expansion have been linked with poor outcomes following percutaneous coronary intervention (PCI). The purpose of this study was to use optical coherence tomography (OCT) to investigate stent strut malapposition in relation to calcium distribu-tion. Methods and results. Twenty-three PCI patients underwent OCT before and after stent deployment. Patient and procedural details and lesion characteristics — including the extent and depth of calcification — were measured, and the number of malapposed struts following final postdilatation was quantified. Patient and lesion characteristics associ-ated with malapposition were assessed using univariate and multivariate analyses. The mean lesion length was 25.2 ± 10.8 mm, with a minimal lumen area (MLA) of 2.2 ± 1.2 mm2. Eight percent of all stent struts were malapposed, most commonly in the proximal part of the stent. By univariate analysis, the percentage of malapposed struts was found to cor-relate with the circumferential extent of calcification (P=.04); however, no correlation was seen with the depth of calcification. Using multivariate analysis, the circumferential extent of vessel wall calcification was the only plaque feature found to correlate with the percentage of malapposed struts (P=.01). Conclusions. Using OCT to assess vessel wall characteristics, the circumferential extent of superficial calcification seen, and not the depth, correlated well with the percentage of malapposed struts following PCI.
J INVASIVE CARDIOL 2013;25(9):429-434
Key words: stent malapposition, optical coherence tomography
Stent strut malapposition is a risk factor for stent thrombosis1 and restenosis,2 ultimately leading to higher rates of recurrent clin-ical events in patients treated with both bare-metal stent (BMS) and drug-eluting stent (DES).3,4 Therefore, efforts to optimize ad-equate stent expansion and strut apposition to the vessel wall are vital to the success of percutaneous coronary intervention (PCI).
Intravascular ultrasound (IVUS) has traditionally been used to assess strut apposition during PCI.5 However, optical coherence tomography (OCT) — a novel intracoronary diagnostic tech-nique with an axial resolution approximately ten times greater than IVUS (approximately 10-20 µm) — allows greater detection of stent malapposition,6,7 producing fewer strut-induced artifacts.8 A further unique feature of OCT is the ability to image through cal-cium and thus measure the thickness of superficial calcification. In
the presence of an important calcification, a major determinant of underexpansion and malapposition according to many operators advocating the strategy span from predilatation to use of rotational atherectomy in calcified vessels.
A recent increase in the speed of image acquisition conse-quent to the introduction of frequency domain OCT now allows rapid pullback at a speed of 2 cm/sec, minimizing the amount of contrast required to clear the blood during image ac-quisition. This allows serial OCT acquisitions, typically before treatment if the lesion is not very severe and flow is expected to be present around the OCT catheter, but also after predilata-tion and subsequently to assess and guide stent expansion.
However, OCT remains a relatively new technique, and to date does not have sufficiently large and prolonged follow-up data to correlate the imaging findings with clinical events that are now relatively rare in the era of second-generation DESs and optimal anticoagulation therapy. Nonetheless, it is logical to propose that poor stent expansion, gross strut malapposition and distortion, protruding plaques and thrombus, and delayed strut coverage — as assessed by OCT — are ominous signs that should be avoided and corrected if feasible and safe to do so.
Therefore, the aim of this study was to investigate the rela-tionship between OCT-determined vessel findings — in par-ticular, calcium content — and stent strut malapposition in a consecutive series of patients.
MethodsPatient population. Between September 2009 and Septem-
ber 2011, a total of 167 patients with de novo lesions in native coronary arteries had OCT during PCI; twenty-three consecu-tive patients were studied with OCT before and after success-ful stent implantation. Patients with in-stent restenosis or vein graft lesions were excluded from the analysis. OCT pullbacks with suboptimal image quality precluding full definition of all stent struts or wall contours, or with the lumen/wall interface lying outside the scanned area, were also excluded.
Angiographic analysis. In all patients, coronary interven-tions were performed including consistent high-pressure (18 atm or more) postdilatation with appropriately sized low-com-pliance balloons. Data regarding PCI procedures, including balloon diameter, pressure of predilatation, type of stent, and implantation pressure, were recorded (Table 1). Stent optimiza-tion with non-compliant balloons was guided by conventional angiography. Two experienced interventional cardiologists, blinded to the OCT findings, reviewed all angiograms.
From the 1NHLI Cardiovascular Biomedical Research Unit, Royal Brompton & Harefield NHS Trust, London, United Kingdom, and the 2Imperial College, London, United Kingdom.
Disclosure: The authors have completed and returned the ICMJE Form for Dis-closure of Potential Conflicts of Interest. The authors report no conflicts of interest regarding the content herein.
Manuscript submitted November 30, 2012, provisional acceptance given January 31, 2013, final version accepted June 11, 2013.
Address for correspondence: Carlo Di Mario, NHLI Cardiovascular Biomedical Re-search Unit, Royal Brompton Hospital, Sydney Street, SW3 6NP, London, United Kingdom. Email: [email protected]
For Personal Use.
Copyright HMP 2013

430 The Journal of Invasive Cardiology®
LINDSAY, et al.
OCT imaging. A non-occlusive technique was used in all cases. A 2.7 Fr C7 Dragonfly Imaging Catheter (St Jude Medi-cal, LightLab), flushed with undiluted contrast and calibrated before the acquisition, was inserted over the guidewire distal to the lesion of interest. Acquisition was performed during continuous flushing of 2-5 mL/s of iodixanol (Visipaque 320 mg I/mL; GE Healthcare) using a Medrad power injector. Pull-back speed was set at 20 mm/s, with a length of vessel segment analyzed between 30 and 54 mm (maximal pullback length allowed by the system). Pullback was manually started when sufficient blood clearance was obtained, allowing readjustment of the speed of contrast injection if blood was still partially ob-scuring the image.
Cross-sections of the vessel before and after PCI were ana-lyzed every 1 mm by an experienced observer blinded to the angiographic findings. Quantitative off-line OCT measure-ments were performed using proprietary computer software (LightLab Imaging), including intimal thickness, lumen area, and plaque composition. In particular, the circumferential ex-tent of calcification was quantified by measuring the arc of cal-cium seen in the vessel wall expressed in degrees; the maximum depth of calcification was also measured (Figure 1). Following stent implantation and postdilatation, luminal area and stent area were assessed. These features were carefully reviewed over the entire longitudinal extension of the acquired images. In or-der to assess the impact of lumen eccentricity on stent strut expansion, we defined a lumen eccentricity index (LEI) as fol-lows: (maximum lumen diameter – minimum lumen diameter/maximum lumen diameter) (Figure 2).
In order to analyze the OCT images and quantify malappo-sition, manual postprocessing is normally required. However, more recently an automatic algorithm to assess malapposition
Table 1. Baseline patient characteristics, clinical presentation and procedural characteristics.
Patient Characteristics
Age (years) 59.5 ± 13.3
Sex (male) 18 (78%)
Hypertension 11 (48%)
Diabetes mellitus 5 (22%)
Hypercholesterolemia 16 (70%)
Smoker 4 (17%)
Peripheral vascular disease 12 (52%)
Clinical presentation 8 (35%)
Acute coronary syndrome 4 (17%)
Stable angina 19 (83%)
Procedural characteristics
Balloon predilatation 16 (70%)
Drug-eluting stent 22 (97%)
Bare-metal stent 1 (3%)
Maximal balloon diameter (mm) 3.61 ± 0.5
Maximal balloon inflation pressure (atm) 21.2 ± 8
Data presented as mean ± standard deviation or number (percentage).
Figure 2. Derivation of the lumen eccentricity index (LEI). The mini-mal lumen diameter was extracted from the maximum diameter before being divided by the maximal diameter. This allows quantification of the circularity of the lumen which can be used for subsequent analysis.
Max Diam – Min Diam
Max DiamLEI =
LEI = 0.17
Lumen Area = 4.6704 mm2
Diamet: Max 2.6692 mm = Min 2.1995 mm = 2.4343 mm
Figure 1. Left: measuring the circumferential extent of calcium by cal-culating the angle of an arc drawn from the edges of the calcified segment to the center of the lumen. Right: accurate measurement of fibrous cap thickness (A) and the depth of calcification (C) can be made.
Calcium Arch 69˚
For Personal Use.
Copyright HMP 2013

Vol. 25, No. 9, September 2013 431
Strut Malapposition in Calcified Vessels With F-D OCT
has been developed and validated with high reproducibly and correlation compared with manual measurements.9 The ob-tained OCT runs were therefore transferred to a separate con-sole in order to perform quantitative, automated, and off-line malapposition measurements using this software (Odierna ver-sion 2.2; Catholic University Leuven) for automatic processing of the OCT images. Once the stent strut coordinates have been detected and the vessel wall has been delineated, it is possible to estimate individual stent strut apposition and coverage. The mea-surements are performed in Cartesian (scan-converted) images with a resolution of 1024 x 1024 pixels. Distances are analyzed as follows: the central point of every strut is identified10 and from that point, the distance perpendicular to the lumen is computed. If more than one direction is perpendicular to the vessel bound-ary (in case of high curvature), the minimal distance is taken into account. This approach permits estimation of the stent strut to vessel distance correctly even in the case of sunflower artifacts.11 When analyzing images for “coverage,” distances represent the thickness of tissue covering the strut; in the case of apposition as-sessment, distances measure how far the stent strut is located from the vessel wall. This information, combined with a threshold value based on the real physical strut thickness, polymer thickness, and blurring artifact,11,12 allows discrimination between apposed and malapposed struts: apposition threshold (AT) ¼ strut thickness +
polymer thickness (in case of DES) + blurring artifact; if the com-puted distance is inferior to AT, it implies the strut is touching the vessel wall (apposed). If the distance is larger than the AT, the strut is not in touch with the vessel wall and is consequently labelled as malapposed (Figure 3). Automated measurements of each strut’s apposition in the arterial wall and the total area of malapposition and stent area were generated and manually corrected, if needed. The use of novel imaging software here allowed rapid and accu-rate quantification of malapposition. Measurements of stent ap-position were classified into three grades of apposition: embedded (struts buried in the intima for more than half of their thickness); protruding (struts apposed to the intima but not embedded); and malapposed (struts not in contact with the intima).13
Statistical analysis. Statistical analysis was performed using SPSS software, version 16.0 (SPSS Inc). Data are expressed as mean ± standard deviation or median and interquartile range (IQR) for continuous variables and as a percentage for categori-cal variables. Comparisons between groups were done using the two-sample Wilcoxon test for continuous variables and t-test or Chi-square/Fischer’s exact test for categorical data. The Kol-mogorov-Smirnov test was used to assess normality of continu-ous variables. As the observations of struts in the same stent are not independent of each other, standard regression analysis — which assumes independence of observations — cannot be used.
Figure 3. Semi-automated quantification of strut malapposition using a novel software package (Odierna version 2.2, Catholic University Leuven, Belgium). By drawing an automated contour around the lumen (A), the software is then able to give precise measurements on the malapposition distance between the vessel wall and each individual stent strut (B).
A B
0.18713 mm
0.23471 mm
0.020146 mm
0.15428 mm
0.19518 mm
0.21643 mm
0.26714 mm
0.21243 mm0.018439 mm
0.11711 mm
0.091806 mm
0.043457 mm
0.063601 mm0.22417 mm
For Personal Use.
Copyright HMP 2013

432 The Journal of Invasive Cardiology®
LINDSAY, et al.
Given the hierarchical nature of the data (stent struts nested within patients), multilevel logistic regression with malapposi-tion as the outcome variable was applied to address random and fixed effects at the strut, lesion, and patient levels.14 At the patient level, age, sex, cardiovascular risk factors, and clinical presenta-tion were considered. At the lesion level, presence of calcification, arc of calcium, stent length, lesion length, eccentricity index, pre-dilatation, and minimal lumen area were used for multivariate analysis. A two-tailed P-value of <.05 was used as the cutoff for statistical significance for all analyses.
resultsPatient characteristics. Between May 2009 and September
2011, a total of 167 patients with de novo lesions in native coro-nary arteries had OCT during PCI; twenty-three consecutive patients were studied with OCT before and after successful stent implantation, comprising 13 left anterior descending lesions, 5 right coronary lesions, 3 circumflex lesions, 1 saphenous vein graft lesion, and 1 left main stem lesion. Patients with in-stent restenosis or vein graft lesions were excluded from the analysis. OCT pullbacks with suboptimal image quality precluding full definition of all stent struts or wall contours, or with the lumen/wall interface lying outside the scanned area, were also excluded.
Patients were excluded when there were either no prestent-ing or poststenting OCT acquisitions, or because they were studied only as a planned follow-up for the evaluation of late strut apposition and coverage within predefined research studies (LEADERS, RESOLUTE).15,16 The final distribution consisted of 2 Taxus stents (Boston Scientific Corporation; strut thickness, 127 µm), 9 Xience stents (Abbott Vascular; 88 µm), 5 Resolute stents (Medtronic, Inc; 95 µm), 4 Promus stents (Boston Scien-tific Corporation; 86 µm), 2 Bio Matrix stents (Biosensors Inter-national; 122 µm), and 1 bare-metal stent (Driver; 91 µm).
The demographic characteristics of the 23 patients who were suitable for analysis are shown in Table 1.
Optical coherence tomography measurements before stenting. OCT was performed before stenting to decide wheth-er an intervention was needed in the presence of a stenosis of intermediate severity, to assess the characteristics of the plaque, and to estimate the required size of stent. Following acquisition
Table 2. Optical coherence tomography measurements before stenting.
Calcific plaque 22 (96%)
Lesion length (mm) 25.2 ± 10.8
Distal reference area (mm2) 5.7 ± 2.9
Distal reference diameter (mm) 2.6 ± 0.7
Proximal reference area (mm2) 9.7 ± 2.5
Proximal reference diameter (mm) 3.5 ± 0.5
Minimal lumen diameter (mm) 1.6 ± 0.5
Minimal lumen area (mm2) 2.2 ± 1.2
Fibrous cap thickness (µm) 292.3 ± 222.1
Calcium depth (µm) 641.4 ± 257.9
Calcium depth from lumen (µm) 943.6 ± 260.1
Calcium arc (degrees) 186.8 ± 93.7
Drug-eluting stent 22 (97%)
Bare-metal stent 1 (3%)
Maximal balloon diameter (mm) 3.61 ± 0.5
Maximal balloon inflation pressure (atm) 21.2 ± 8
Data presented as mean ± standard deviation or number (percentage).
Table 3. Optical coherence tomography measurements after stenting.
Stent length (mm) 27.0 ± 7.5
Minimal lumen area (mm2) 6.2 ± 2.1
Minimal lumen mean diameter (mm) 2.8 ± 0.5
Maximal area inside stent (mm2) 9.9 ± 1.9
Maximal lumen mean diameter inside stent (mm) 3.9 ± 1.5
Maximum eccentricity luminal index* 0.18 ± 0.92
Minimum eccentricity luminal index* 0.19 ± 0.85
Total number of frames analyzed 632
Total number of struts analyzed 5710
Apposed struts 5246 (91.9%)
Malapposition per patients 22 (96%)
Malapposed struts 464 (8.1%)
Malapposition in aneurysmal segment 2 (8.7%)
Side-branch related malapposition 4 (17%)
Location of malapposition (%)
Distal 3.1 ± 3.4
Mid 6.4 ± 5.8
Proximal 10.7 ± 10.8
Data presented as mean ± standard deviation or number (percentage).*Lumen eccentricity = (maximal lumen diameter – minimal lumen diameter) / maximal lumen diameter.
Figure 4. Location of the malapposed struts. Numerically more malap-posed struts were seen proximally, representing a significant difference between the mid and distal portions of the stent.
40
30
20
10
0
Num
ber
LocationDistal Mid Prox
P=.002**
P=.007**
P=.026*
14
39
oo
o
For Personal Use.
Copyright HMP 2013

Vol. 25, No. 9, September 2013 433
Strut Malapposition in Calcified Vessels With F-D OCT
of OCT pullbacks, conventional predilatation was performed in 16 patients (70%) (Table 2).
The mean lesion length was 25.2 ± 10.8 mm, with a mean minimal lumen area (MLA) of 2.2 ± 1.2 mm2 and a mean mini-mal lumen diameter of 1.6 ± 0.5 mm. Mean fibrous cap thick-ness was 292.3 ± 222.1 µm (Table 2). The presence of calcium was visualized in 22 lesions (96%) (Figure 1). Mean calcium thickness was 641.4 ± 257.9 µm, with a mean circumferential arch of 186.8 ± 93.7° (Table 2).
Poststenting analysis. The vast majority of patients (96%) had DESs implanted. One patient received a BMS. Balloon postdilatation was performed in 22 patients (96%), with a mean maximal balloon diameter of 3.61 ± 0.50 mm and a mean maximal balloon inflation pressure of 21.2 ± 8.0 atm.
Once the largest balloon and highest pressure felt feasible and safe for postdilatation was used, a final pullback was per-formed to analyze the apposition of the stent struts. The mean maximum lumen cross-sectional area (MLCSA) within the stent after optimization was 9.9 ± 1.9 mm2; the average lumi-nal area gain was 7.7 ± 1.6 mm2 (increase compared with the prestenting OCT lumen area). Mean maximum lumen diam-eter after stenting was 3.9 ± 1.5 mm (diameter gain of 2.3 ± 1.1 mm) (Table 3).
Malapposition. A total number of 632 frames were ana-lyzed in 22 patients, including 5710 struts. The number of ap-posed struts was 5246 (91.9%) and malapposed struts was 464 (8.1%). Twenty-two patients (96%) had malapposed struts; therefore, almost all cases showed some degree of malapposi-tion. Analysis revealed that the majority of malapposed struts could be found in the proximal segment of the stent (Figure 4).
By univariate analysis, the percentage of malapposed struts was found to correlate with the circumferential extent of calci-fication (P=.04), but no correlation was seen with other vari-ables. In particular, no association was found between lesion or stent length and malapposition, nor the depth of calcium present or the use of predilatation (all P>.05).
Using multivariate analysis, the extent of vessel wall calci-fication (calcium arc) was the only variable found to correlate with the percentage of malapposed struts (P=.01). Figure 5 shows covered, uncovered, and malapposed struts.
Safety and feasibility of optimal coherence tomography. Due to the high pullback speed, the average amount of contrast required during OCT pullbacks was 17.1 ± 4.2 mL. No ma-jor complications, such as ventricular tachyarrhythmia, heart
block, profound bradycardia (<40 beats/minute), coronary dissection, or air embolism were observed. The mean time added to the procedure by the serial OCT examinations was 15.2 ± 8.1 minutes, including OCT catheter preparation, connection to the power injec-tor, initialization of OCT sys-tem, and insertion/withdrawal of the OCT catheter. The aver-age total amount of additional
contrast per patient required for the serial OCT examinations was 75.8 ± 19.3 mL.
DiscussionIn this study, we used high-resolution imaging with OCT
to assess the parameters that influence stent strut malapposi-tion following PCI. Even with aggressive postdilatation, our analysis still found that approximately 8% of struts remained malapposed in calcified lesions, and that malapposition was mostly to be found in the proximal segment of the stent. Due to substantial differences in lumen size between the distal and proximal part of the coronary segment to be stented,17 over-sized postdilatation of the proximal part of the stent is gener-ally needed to avoid stent malapposition, which could promote DES thrombosis and restenosis.18,19
Performing a final proximal postdilatation to the stent with larger/shorter non-compliant balloon can restore a circular stent geometry and ensure complete stent deployment in the proximal part of the stent.20,21 The coverage of incomplete stent apposition (ISA) struts is delayed compared to well-apposed struts,22,23 and the association of incomplete endothelial coverage with late/very late stent thrombosis has been revealed in pathologic studies.24,25 The percentage of uncovered DES struts may differ according to the presence and extent of malapposed struts. This finding suggests that the detachment of struts from the vessel wall poses higher risk of delayed coverage than correct apposition in DESs. This explanation may argue for optimizing apposition.
Although IVUS is now well established in PCI, it can only reliably detect the most extreme cases of incomplete strut ap-position. In contrast, stent strut malapposition can be clearly assessed by OCT. Several studies have now demonstrated the unique features it offers in the treatment and assessment of cor-onary artery disease, mainly its ability to assess thrombus, in-timal rupture, plaque constituents, the thickness of the fibrous cap, strut apposition, and late coverage.26 The sharp contrast of the wall/lumen interface, with only small artifacts seen behind stent struts, allows accurate and immediate automatic measure-ments in the majority of pullbacks. This represents a clear ad-vantage over IVUS, but comes at a price: the low tissue depth penetration of OCT has not substantially improved even with newer frequency-domain OCT. This makes the assessment of the total vessel diameter (media-to-media) impractical and limited to a minority of distal reference segments with small amount of fibrotic or fibrocalcified plaque.
Figure 5. Example of stent strut coverage and apposition assessment. (A) Covered malapposed strut. (B) Well-covered strut. (C) Example of uncovered strut.
For Personal Use.
Copyright HMP 2013

434 The Journal of Invasive Cardiology®
LINDSAY, et al.
Using OCT, apposition is indirectly assessed by measur-ing the distance between the luminal surface of the stent strut and the vessel wall. Incomplete apposition is defined as a distance between the strut and the vessel wall greater than the strut thickness (metal and polymer) plus the addition of a correction factor (generally the 10-15 µm resolution of the imaging technique).
In the current study, using multivariate analysis, we found that the circumferential extent of calcification was the only OCT-definable characteristic that predicted the likelihood of stent strut malapposition. This approach to vessel wall calcifi-cation has been described by previous authors using IVUS.27,28 Using this measure, we found a clear association between the amount of vessel wall calcification seen and the percentage of malapposed struts. Although previously suggested by IVUS,20 the high-resolution images here are the first confirmation of this phenomenon using OCT. Similar to previous studies,20 our analysis found that although the amount of calcium correlated with overall stent strut apposition, this did not mean that the areas of stent strut malapposition were necessarily located di-rectly over the area of calcified vessel.
Study limitations. Our study has a number of limitations. First, it represents a small cohort of patients who underwent PCI in a large tertiary center. Second, inclusion in this study required OCT to be performed both before and after stent deployment, which may have been more likely in eccentric, complicated lesions where complete strut apposition is often difficult. Third, various different stent types and lengths were used here, and although postdilatation was frequently per-formed it was not standardized. As such, this could also influ-ence the amount of malapposition detected. Fourth, bias may have arisen based upon the requirement for pre- and post-PCI OCT runs as well as numerous other study exclusions resulting in fewer than 14% of eligible patients being included.
OCT pullbacks also provide other anatomical details that may facilitate optimal stent implantation. In particular, in this study, we used OCT to identify an inadequate vessel response to balloon inflation and to fine-tune stent selection, both in terms of length and diameter. In doing so, we noted that malapposi-tion was more common in the proximal area of the stent; this would seem logical given that the vessel area proximally tends to be larger, and that operators are often keen not to oversize the stent for the distal vessel. OCT measurements after stent-ing can also assist with postdilatation strategy, when it is clear that proximal stent optimization with a larger balloon or post-dilatation at higher pressures of a more resistant segment are required. The operator may initially proceed with optimization based on angiography and the information collected during the initial prestent examination, before taking a final OCT acquisi-tion to confirm optimal stent expansion and lesion coverage.
ConclusionsIn this study using OCT, the circumferential extent of cal-
cium in the arterial wall was associated with an increased number of malapposed stents struts, which were most commonly seen in the most proximal segment of the stent, despite adequate post-dilatation. OCT can be used to assess vessel wall calcification
prior to stent implantation, in addition to assessing strut ap-position after implantation.
references1. Nakazawa G. Stent thrombosis of drug eluting stent: pathological perspective. J Cardiol.
2011;58(2):84-91. 2. Santos MC, Lin T, Barlis P. In-stent restenosis associated with stent malapposition: seven year
optical coherence tomography findings. Int J Cardiol. 2011;147(1):149-151. 3. Hoffmann R, Morice M-C, Moses JW, et al. Impact of late incomplete stent apposition
after sirolimus-eluting stent implantation on 4-year clinical events: intravascular ultrasound analysis from the multicentre, randomised, RAVEL, E-SIRIUS and SIRIUS trials. Heart. 2008;94(3):322-328.
4. Cook S, Eshtehardi P, Kalesan B, et al. Impact of incomplete stent apposition on long-term clinical outcome after drug-eluting stent implantation. Eur Heart J. 2012;33(11):1334-1343.
5. Rogacka R, Latib A, Colombo A. IVUS-guided stent implantation to improve outcome: a promise waiting to be fulfilled. Curr Cardiol Rev. 2009;5(2):78-86.
6. Viceconte N, Chan PH, Barrero EA, et al. Frequency domain optical coherence tomography for guidance of coronary stenting. Int J Cardiol. 2013;166(3):722-728. 2011 Dec 30 (Epub ahead of print).
7. Lindsay AC, Viceconte N, Di Mario C. Optical coherence tomography: has its time come? Heart. 2011;97(17):1361-1362.
8. Kume T, Okura H, Miyamoto Y, et al. Natural history of stent edge dissection, tissue protru-sion and incomplete stent apposition detectable only on optical coherence tomography after stent implantation. Circ J. 2012;76(3):698-703.
9. Ughi GJ, Adriaenssens T, Onsea K, et al. Automatic segmentation of in-vivo intra-coronary optical coherence tomography images to assess stent strut apposition and coverage. Int J Car-diovasc Imaging. 2012;28(2):229-241.
10. Sawada T, Shite J, Negi N, et al. Factors that influence measurements and accurate evaluation of stent apposition by optical coherence tomography. Assessment using a phantom model. Circ J. 2009;73(10):1841-1847.
11. Bezerra HG, Costa MA, Guagliumi G, et al. Intracoronary optical coherence tomogra-phy: a comprehensive review clinical and research applications. JACC Cardiovasc Interv. 2009;2(11):1035-1046.
12. Terashima M, Rathore S, Suzuki Y, et al. Accuracy and reproducibility of stent-strut thickness determined by optical coherence tomography. J Invasive Cardiol. 2009;21(11):602-605.
13. Tanigawa J, Barlis P, Di Mario C. Intravascular optical coherence tomography: optimisation of image acquisition and quantitative assessment of stent strut apposition. EuroIntervention. 2007;3(1):128-136.
14. Tanigawa J, Barlis P, Dimopoulos K, et al. The influence of strut thickness and cell design on immediate apposition of drug-eluting stents assessed by optical coherence tomography. Int J Cardiol. 2009;134(2):180-188.
15. Barlis P, Regar E, Serruys PW, et al. An optical coherence tomography study of a biodegrad-able vs. durable polymer-coated limus-eluting stent: a LEADERS trial sub-study. Eur Heart J. 2010;31(2):165-176.
16. Serruys PW, Silber S, Garg S, et al. Comparison of zotarolimus-eluting and everolimus-eluting coronary stents. N Engl J Med. 2010;363(2):136-146.
17. Ge J, Erbel R, Gerber T, et al. Intravascular ultrasound imaging of angiographically normal coronary arteries: a prospective study in vivo. Br Heart J. 1994;71(6):572-578.
18. Fujii K, Carlier SG, Mintz GS, et al. Stent underexpansion and residual reference segment stenosis are related to stent thrombosis after sirolimus-eluting stent implantation: an intravas-cular ultrasound study. J Am Coll Cardiol. 2005;45(7):995-998.
19. Alfonso F, Suarez A, Perez-Vizcayno MJ, et al. Intravascular ultrasound findings during epi-sodes of drug-eluting stent thrombosis. J Am Coll Cardiol. 2007;50(21):2095-2097.
20. Foin N, Secco GG, Ghilencea L, Krams R, Di Mario C. Final proximal post-dilatation is necessary after kissing balloon in bifurcation stenting. EuroIntervention. 2011;7(5):597-604.
21. Basalus MW, van Houwelingen KG, Ankone MJ, Feijen J, von Birgelen C. Micro-computed tomographic assessment following extremely oversized partial postdilatation of drug-eluting stents. EuroIntervention. 2010;6(1):141-148.
22. Ozaki Y, Okumura M, Ismail TF, et al. The fate of incomplete stent apposition with drug-eluting stents: an optical coherence tomography-based natural history study. Eur Heart J. 2010;31(12):1470-1476.
23. Gutierrez-Chico JL, Regar E, Nuesch E, et al. Delayed coverage in malapposed and side-branch struts with respect to wellapposed struts in drug-eluting stents: in vivo assessment with optical coherence tomography. Circulation. 2011;124(5):612-623.
24. Finn AV, Joner M, Nakazawa G, et al. Pathological correlates of late drug-eluting stent throm-bosis: strut coverage as a marker of endothelialization. Circulation. 2007;115(18):2435-2441.
25. Virmani R, Guagliumi G, Farb A, et al. Localized hypersensitivity and late coronary thrombosis secondary to a sirolimus-eluting stent: should we be cautious? Circulation. 2004;109:701e5.
26. Gutiérrez-Chico JL, Alegría-Barrero E, Teijeiro-Mestre R, et al. Optical coherence tomogra-phy: from research to practice. Eur Heart J Cardiovasc Imaging. 2012;13(5):370-384.
27. Cheneau E, Leborgne L, Mintz GS, et al. Predictors of subacute stent thrombosis: results of a systematic intravascular ultrasound study. Circulation. 2003;108(1):43-47.
28. Cook S, Wenaweser P, Togni M, et al. Incomplete stent apposition and very late stent throm-bosis after drug-eluting stent implantation. Circulation. 2007;115(18):2426-2434.
For Personal Use.
Copyright HMP 2013
Copyright © 2022 FDOKUMEN