CHARACTERIZATION OF GALVANIZED/GALVANNEALED ...
96
CHARACTERIZATION OF GALVANIZED/GALVANNEALED SHEET STEEL DEFECTS TOWARDS ENABLING DEFECT FREE ZINC COATINGS by Ryan Plessinger
-
Upload
khangminh22 -
Category
Documents
-
view
3 -
download
0
Transcript of CHARACTERIZATION OF GALVANIZED/GALVANNEALED ...

CHARACTERIZATION OF GALVANIZED/GALVANNEALED SHEET STEEL DEFECTS
TOWARDS ENABLING DEFECT FREE ZINC COATINGS
by
Ryan Plessinger

ii
A thesis submitted to the Faculty and the Board of Trustees of the Colorado School of
Mines in partial fulfillment of the requirements for the degree of Master of Science
(Metallurgical and Materials Engineering).
Golden, Colorado
Date ______________________________
Signed: _____________________________
Ryan Plessinger
Signed: _____________________________
Dr. Emmanuel De Moor
Thesis Advisor
Signed: _____________________________
Dr. Sridhar Seetharaman
Thesis Advisor
Golden, Colorado
Date ______________________________
Signed: _____________________________
Dr. Angus Rockett
Professor and Head
George S. Ansell Department of
Metallurgical and Materials Engineering

iii
ABSTRACT
As more emphasis is being placed on reducing the weight of vehicles while increasing
safety ratings through advanced high strength steels allowing use of thinner metal gauge
corrosion properties become more important. To protect these steels against corrosion, a hot-dip
galvanizing process is used. An additional annealing step may follow to produce galvannealed
(GA) steels. The present thesis characterized microstructure and chemistry of defects in four
industrially produced steels, 3 GA steels and one galvanized (GI) steel.
Material A was shown to have a streaking type defect in a GA coating. Light optical
microscopy (LOM) showed macroscopic periodicity of 1.5-2 mm between streaks. Time of flight
secondary ion mass spectrometry (TOF-SIMS) analysis showed the presence of Mn rich oxides
at the steel-coating interface. Two mechanisms were attributed to defect formation, the Zn pot
sink roll micro-grooved surface and Mn rich oxides were shown to affect coating thickness.
Material B was received as having acne type defects in a GI coating. Scanning electron
microscopy (SEM) showed a uniform coating, and the steel-coating interface was planar. TOF-
SIMS showed that the areas associated with the defects were Zn rich, and no evidence of
chemical contribution to coating formation. The defect formation mechanism was unclear,
however it appeared to be a Zn splash and a function of processing parameters e.g.. air knife
operating conditions.
Two ends of an identical coil were received for Material C: one showing a flame pattern
defect, and one end exhibiting a defect free coating. SEM showed the coating surface exhibited a
temper roll surface finish, and that the coating thickness for the end without defects was thinner
than the end with defects. Defect formation may relate to the difference in temper roll response
from the coil and/or Zn solidification growth due to difference in substrate microstructure.
Material D was received as having a striped defect, denoted “tiger stripes”. The stripes
could be observed in the hot rolled, as-pickled, cold rolled, and GA condition. SEM analysis
showed that the coating in areas associated with the stripe was approximately half as thick as
areas without stripes. Chemical analysis showed that high levels of Cr, Mn and Si were found
within area associated with the stripe in the cold rolled condition. Defect formation may relate to
insufficient oxide removal by pickling.

iv
TABLE OF CONTENTS
ABSTRACT……………………………………………………………………………………...iii
LIST OF FIGURES……………………………………………………………………….…...….v
LIST OF TABLES…………………………………………………………...………………..…xii
ACKNOWLEDGEMENTS……………………………………………………………………..xiii
CHAPER 1: INTRODUCTION…………………………………………………….…………….1
CHAPTER 2: LITERATURE REVIEW………………………………………………………….2
2.1 Galvannealing Process…………………………………………………………….2
2.2 High Temperature Selective Oxidation………………………………………...…8
2.3 Mn, Cr and Si Alloying Effects on Galvanizing/Galvannealing………..…….....16
CHAPTER 3: EXPERIMENTAL PROCEDURE AND MATERIALS………………………...24
3.1 Materials…………………………………………………………………………24
3.2 Oxidation Mechanism Predictions and Thermo-Calc® Analysis………………..25
3.3 Microstructural Characterization………………………………………………...25
3.4 Time of Flight Secondary Ion Mass Spectrometry………………………………26
3.4.1 Surface Analysis using the TOF-SIMS…………………………………..27
3.4.2 3D Imaging using Secondary Ion Beams………………………………...28
3.4.3 Data Processing…………………………………………………………..29
CHAPTER 4: RESULTS AND DISCUSSION………………………………………………….30
4.1 Thermodynamic Analysis……..…………………………………………………30
4.2 Microstructural and Chemical Analysis………………………………………….38
4.2.1 Material A………………………………………………………………..38
4.2.2 Material B………………………………………………………………..48
4.2.3 Material C………………………………………………………………..55
4.2.4 Material D………………………………………………………………..64
CHAPTER 5: CONCLUSIONS…………………………………………………………………78
CHAPTER 6: FUTURE WORK………………………………………………………………...81
REFERENCES…………………………………………………………………………………..82

v
LIST OF FIGURES
Figure 2.1 The HDG process for galvanized and galvannealed steel
with galvanneal furnace showing coil entry into the cleaning
section (fluxing), then the annealing furnace, and the cooling
section that prepares the strip for the Zn pot. The galvannealing
furnace is shown on the schematic. During galvanizing for GI
products the furnace will not operate, and the strip will be cooled
the length of the tower. [9]………………………………………………………...4
Figure 2.2 The Fe-Zn phase diagram at high Zn content showing Fe-Zn
intermetallic
phases that can form during galvanizing and galvannealing
in the red box [9]……………………………………………………………..……4
Figure 2.3 SEM micrographs of a cross section of (a) a galvannealed IF-20
steel showing layers of Γ and Γ1 near the Fe surface, and δ developed on top of the Γ phases[16]. (b) a cross section of galvanized IF
steel with 1 showing Γ, 2 showing δ and 3 showing ζ [9]………………………...5
Figure 2.4 EDS element map of a cross section of low carbon galvanized sheet
steel galvanized with a zinc bath containing 0.4 wt pct Al with (a) the BSE
micrograph, (b) the Zn map (c) the Al map and (d) the Fe map.
(a)-(d) all have the same scale as (a). Adapted from [20]…………………………7
Figure 2.5 Schematic of how oxides form on three different CMnX steels
after annealing [1]……………………………………………………...………….9
Figure 2.6 Strategies around selective oxidation within AHSS for increased
galvanizability [4]………………………………………………………………..10
Figure 2.7 SEM images of (a) -30 ºC dew point anneal for a Cr-Mo DP steel
surface and (b) 10 ºC dew point anneal for a Cr-Mo DP
steel [3]……………………………………………………………………..…….11
Figure 2.8 Dew point effect on wettability of zinc on medium manganese steels [4]………12
Figure 2.9 Dew point effect during high temperature oxidation shown for
(a) Mn and (b) Si at -40 °C and 15 °C [21]………………………………………15
Figure 2.10 Oxide formation and diffusion paths for a DP steel with varied
Mn and Si content. The matrix is Fe [21]……………….……………………….15

vi
Figure 2.11 Schematics showing (a) solute segregation to grain boundaries,
(b) quick transport of solute to the surface to create surface
oxide ridges and (c) SEM micrograph of in-situ high temperature
oxidation at 670 °C for a 1.8 wt pct Mn-1.5 wt pct Al TRIP steel
showing oxide ridges [6]…………………………………………………………17
Figure 2.12 Illustrations showing solute diffusion for (a) diffusion length significantly
longer than grain size and (b) diffusion length shorter than grain size,
resulting in ridge formation. Adapted from [27]………………………………...18
Figure 2.13 Thermodynamic stability of Mn, Fe, and Cr when oxidized by H2O(g) [28]…….19
Figure 2.14 Morphologies of Mn and Mn-Cr oxides formed on (a) a
Cr free dual-phase steel containing 1.7 wt pct Mn and
(b) a 0.6 wt pct Cr, 1.7 wt pct Mn containing dual-phase steel both
containing 0.02 wt pct C [28]……………………………………………………20
Figure 2.15 SEM micrographs showing surface oxidation after annealing with
two different magnifications for (a) Cr free dual-phase steel containing
1.7 wt pct Mn and (b) 0.6 wt pct Cr, 1.7 wt pct Mn containing
dual-phase steel both containing 0.02 wt pct C [28]……….…………………….20
Figure 2.16 Sessile drop testing of annealed Mn-Cr dual phase steel using Al free
Zn droplets and 0.14 wt pct Al containing Zn droplets [28]..……………………21
Figure 2.17 Illustration showing the hypothesized retardation of the GA reactions
due to a Si rich layer formed at the steel-Zn interface. Adapted from [22].……..22
Figure 3.1 Components of the TOF-SIMS, adapted from ION-TOF GmbH® [30]………...27
Figure 3.2 Images of the IonTof TOF.SIMS 5 currently employed at the
Colorado School of Mines. (a) shows the IonTof Gmbh TOF-SIMS
overview, and (b) shows the TOF-SIMS analysis chamber……………...……...28
Figure 3.3 Representative scales for the (a) thermal scale for static TOF-SIMS
and depth profiling and (b) rainbow scales used for depth profiling
during data processing of TOF-SIMS data. Low and high
signals are indicated……………………………………………………………...29

vii
Figure 4.1 Fe-O phase diagram for a 0.07 C-1.9 Mn-0.2 Si-0.3 Cr-0.026 Al
(wt pct – Material A) from Thermo-Calc®. Phases are described
in Table 4.1. Enclosed area represents a dew point
range from -30 to 10 °C………………………………………………………….31
Figure 4.2 Fe-O phase diagram for a 0.07 C-1.6 Mn-0.2 Si-0.3 Cr-0.5 Mo
(wt pct-Material B) from Thermo-Calc®. Phases are described
in Table 4.1. Enclosed area represents a dew point range
from -30 to 10 °C………………………………………………………………...32
Figure 4.3 Fe-O phase diagram for a 0.07 C-1.6 Mn-0.2 Si-0.5 Cr-0.3 Mo
(wt pct-Material B) from Thermo-Calc®. Phases are described
in Table 4.1. Enclosed area represents a dew point
range from -30 to 10 °C………………………………………………………….32
Figure 4.4 Fe-O phase diagram for a 0.07 C-1.6 Mn-0.2 Si-0.7 Cr-0.1 Mo
(wt pct-Material B) from Thermo-Calc®. Phases are described
in Table 4.1. Enclosed area represents a dew point
range from -30 to 10 °C………………………………………………………….33
Figure 4.5 Fe-O phase diagram for a 0.07 C-1.23Mn-0.2 Si-0.029 Cr-0.047 Al
(wt pct-Material C) from Thermo-Calc®. Phases are described in
Table 4.1. Enclosed area represents a dew point
range from -30 to 10 °C………………………………………………………….34
Figure 4.6 Fe-O phase diagram for a 0.1 C-1.6 Mn-0.6 Si-0.35 Cr
(wt pct - Material D) from Thermo-Calc®. Phases are described
in Table 4.1………………………………………………………………………35
Figure 4.7 Oxidation stability analysis plots for (a) ferrite at 750 °C (b)
ferrite at 800 °C (c) austenite at 850 °C and (d) austenite at 900 °C…………….36
Figure 4.8 A stereomicroscope image showing the galvannealed surface
of Material A containing defects (a) with streaks indicated by
the arrows, (b) an SEM micrograph of an area showing the
streaks, (c) a grey scale intensity profile showing the raised area
of a surface defect. Adapted from [8]……………………………………………39
Figure 4.9 SEM micrograph showing areas with a temper rolled surface
finish, with intermediate areas that exhibit cubic delta and rod-like
zeta Zn-Fe intermetallic crystals…………………………………………………40

viii
Figure 4.10 SEM micrographs of (a)-(b) the longitudinal cross-section
of Material A showing a dual-phase microstructure of intercritical
ferrite and martensite with some bainite and (c) a transverse
cross-section showing the same dual-phase microstructure and
bainite. The orientation of the micrograph is
shown…………………………………………………………………………….41
Figure 4.11 SEM micrograph for a longitudinal cross-section of the GA
coating on Material A GA. (b) shows large variability in coating
thickness and area where EDS was performed. The normal, rolling
and transverse direction of the sheet are shown………………………………….42
Figure 4.12 EDS mapping of the GA coating on Material A with (a) the SEI
image of the map (b) Zn map (c) Fe map and (d) δ phase map. The substrate is on the bottom of the micrographs. This area was
taken from Figure 4.12 (b)……………………………………………………….42
Figure 4.13 Static TOF-SIMS chemical analysis using the thermal scale (f)
including (a) LOM image of analyzed area (b) Zn map (c) Mn map
(d) Fe map and (e) Si map for a smaller streak on the surface
of Material A-GA………………………………………………………………...43
Figure 4.14 TOF-SIMS chemical analysis using a two color spectrum scale
on Material A-GA in an area with a defect (a) Fe map showing
Fe diffusion into the coating (b) Zn map showing the absence of
bare spots (c) Mn showing high levels at the steel-coating interface
in half spherical arrangement and (d) Si map showing high levels at
the steel-coating interface in half spherical
arrangement………………………........................................................................44
Figure 4.15 TOF-SIMS surface spectra for (a) Mn and (b) Si on the cold rolled
bare Material A. Elements are shown to be uniformly distributed [8]…………..46
Figure 4.16 (a) a zinc pot schematic showing the location of the sink roll and
(b) the micro-grooved surface of a zinc pot sink roll.
Adapted from [9],[31].…………………………………………………………47
Figure 4.17 LOM image of (a) a surface defect on Material B and (b) an
SEM micrograph of one of the surface defects at a higher magnification…….…48
Figure 4.18 SEM micrographs shown for the (a) longitudinal and (b)
transverse cross-section of Material B. The normal, transverse
and rolling directions of the sheet are shown…………………………………….49

ix
Figure 4.19 SEM micrographs showing the coating thickness for the (a)
and (b) GI coating on Material B. The coating was found
to be 8 ± 0.5 μm………………………………………………………………….49
Figure 4.20 EDS mapping of the GI coating on Material B with zeta in red,
Al inhibition layer in blue, and the substrate in orange………………………….51
Figure 4.21 TOF-SIMS chemical analysis including (a) LOM image of analyzed
area (b) Zn map (c) Cr map and (d) Fe map for Material B-GI.
Yellow is high intensity, with black being low intensity………………………...52
Figure 4.22 TOF-SIMS chemical analysis including (a) LOM image of
analyzed area (b) Fe map (c) Mn map and (d) Cr map for bare
(uncoated) Material B. Yellow is high intensity and
black is low intensity…………………………………………………………….53
Figure 4.23 (A) TOF-SIMS depth profiling analysis including (a) Fe map
(b) Zn map (c) Mn map (d) Si map and (e) Cr map and (f) Al map
for Material B-GI. (B) Scales for each color map are included in (e)
where the thermal scale is the top scale, and the rainbow scale
is the bottom scale……………………………………………………………54-55
Figure 4.24 Photographs of as-received Material C showing (a) End
(scratches and marks are from shipping) and (b) End B.
The box is an example of the flame pattern defect………………………………56
Figure 4.25 Stereomicroscope images of (a) coated Material C showing a defect
free coating (b) bare Material C of the end of the coil producing defect
free coatings (c) coated Material C exhibiting defects as outlined (d)
bare Material C on the end of the coil producing surface defects…...……….56-57
Figure 4.26 LOM and SEM micrographs of (a) and (b) showing
coated Material C showing a defect free coating and (c) and
(d) coated Material C exhibiting defects…………………………………………57
Figure 4.27 SEM micrographs of (a) and (b) Material C End A microstructure
showing ferrite and pearlite and (c) and (d) Material C-End B
microstructure showing ferrite and pearlite. All micrographs are
for coated material……………………………………………………………….59

x
Figure 4.28 SEM micrograph of End B-Material C showing large grains
and less pearlite near the substrate interface, possibly due to
decarburization. Etched with 1% nital…………………………………………...60
Figure 4.29 SEM micrographs showing the coating thickness for the
(a) End A of Material C and (b) End B of Material C…………………………...60
Figure 4.30 EDS mapping of both ends of Material C showing predominant
delta phase in each coating with (a) EDS for End A where blue is
delta phase and red is Fe and (b) EDS for End B where green is
delta phase and black is the Fe substrate………………………………………...61
Figure 4.31 Static-SIMS of Material C with (a)-(b) Fe and Zn maps respectively
for End A, and (c)-(d) Fe and Zn maps respectively for End B.
Yellow is high intensity, with black being low intensity………………………...62
Figure 4.32 TOF-SIMS depth profiling analysis including (a) Fe map
(b) Zn map (c) Mn map (d) Si map for Material C-End A.
Yellow is high intensity, black is low intensity. The thermal scale
is included as (e), white is no signal…………………………………………..…63
Figure 4.33 TOF-SIMS depth profiling analysis including (a) Fe map
(b) Zn map (c) Mn map (d) Si map for Material C-End B.
Yellow is high intensity, black is low intensity. The thermal scale
is included as (e), white is no signal……………………………………………..64
Figure 4.34 Photographs of as received Material D showing (a) hot rolled state
showcasing red scale (b) pickled state showing how the scale looks
post-pickle (c) cold-rolled and GA state of Material D………………………….65
Figure 4.35 Surface SEM micrographs of an area without a tiger stripe (a)-(b),
and an area associated with a stripe (c)-(d)………………………………………66
Figure 4.36 Cross-sectional SEM micrographs of (a) an area without a tiger stripe
and (b) an area associated with a stripe. Orientation of both samples
are the same………………………………………………………………………68
Figure 4.37 EDS mapping of Material D with Zn signals for (a) an area
within the stripe and (b) an area outside of the stripe oriented
with the transverse direction. These are the same areas as Figure 4.37.
Delta and gamma intermetallic phases were characterized to be present
for both coatings…………………………………………………………………68

xi
Figure 4.38 Cross-sectional SEM micrographs of Material D showing
a microstructure of ferrite, martensite and some bainite.
Etched with 1% nitol……………………………………………………………..70
Figure 4.39 Static SIMS analysis for the Material D hot rolled condition
within an area with no red scale (a, c, e) and an area with red scale
(b, d, f) for Si (a-b), Mn (c-d) and Cr (e-f). Yellow is high intensity,
black is low intensity. Rolling direction is horizontal to the micrographs…...70-71
Figure 4.40 (A) Static SIMS comparative analysis for the Material D
hot rolled condition comparing the red scale to areas with no
red scale with comparisons for (a) Si (b) Mn (c) Cr. (B) Static SIMS
comparative analysis for the Material Dhot rolled condition
comparing the red scale to areas with no
red scale with comparisons for (a) SiO2 and
(b) FeO. The blue line is the red scale area, and the black line is
the non-red scale area………………………………………………………..71-73
Figure 4.41 (A) Static SIMS comparative analysis for the Material D
cold rolled condition comparing the striped areas with area
associated with no stripe with comparisons for (a) Si (b) Mn
(c) Cr (B) Static SIMS comparative analysis for the Material D
cold rolled condition comparing the striped areas with area
associated with no stripe with comparisons for (a) SiO2 and (b) FeO.
The blue line is the area associated with the stripe, and the
black line is the non-striped area……………………………………………..73-75
Figure 4.42 TOF-SIMS depth profiling analysis including (a) Fe map
(b) Zn map (c) Mn map (d) Si map for Material D-GA in an
area without a tiger stripe. Yellow is high intensity, black is low
intensity. White is no signal………………………………………………….75-76
Figure 4.43 TOF-SIMS depth profiling analysis including (a) Fe map
(b) Zn map (c) Mn map (d) Si map for Material D-GA in an area
inside of a tiger stripe. Yellow is high intensity, black is low intensity.
White is no signal…………………………………………………...………..76-77

xii
LIST OF TABLES
Table 2.1 Fe-Zn Intermetallic Phases Formed during HDG processes [17]…………………6
Table 2.2 Chemical Composition of Three DP steels:
Mn-Si, Cr, and Cr-Mo [3]……………………...………………………………...11
Table 2.3 Parameters used in the Wagner Oxide Stability
Calculation for Ferrite [8], [26]………………………………………………….13
Table 2.4 Parameters used in the Wagner Oxide Stability
Calculation for Austenite [8], [26]……………………………………………….13
Table 3.1 Chemical Composition and State of Provided Materials (wt pct)………...……..25
Table 4.1 Stoichiometry of Phases from Thermo-Calc®…………………………………..30
Table 4.2 Parameters used in the Wagner Oxide Stability
Calculation for Ferrite [8], [26]………………………………………………….36
Table 4.3 Parameters used in the Wagner Oxide Stability
Calculation for Austenite [8], [26]……………………………………………….36

xiii
ACKNOWLEDGEMENTS
I would like to thank the International Zinc Association and its members for their
financial and technical support throughout the project. I would like to personally acknowledge
Frank Goodwin of the IZA for his immense technical support during this project. I would also
like to acknowledge the sponsors of the Advanced Steel Processing and Products Research
Center for their technical support. I would also like to thank the members of my committee for
their guidance for this project.
A special thanks goes to my advisor Emmanuel. Thank you for the all the hard work and
dedication you spent on making this possible.
Additional thanks go to Bob Field and Gary Zito of the EM lab for their training on the
EM equipment as well as Gary’s discussions on the Denver Broncos. I would like to
acknowledge Michael Walker for his efforts with all TOF-SIMS data acquisition, and discussion.
More thanks go to the faculty of the MME department for their devoted attention to provide high
quality classes and discussion.
I would like to personally acknowledge and thank Dr. Gerald Bourne for whom I would
not be here without.
Thank you to all my colleagues that helped keep me sane during the times where this
project felt impossible. I would like to thank my office mates for putting up with my
shenanigans, and for being there to let me in when I inevitably did not have my keys.
Lastly, I would like to thank my wife Kayleigh, for being the person who has supported
me the most, especially during the hard times, and for being the most incredible mother a
husband could ask for.

1
CHAPTER 1
INTRODUCTION
The automotive industry has created a large demand for new advanced high strength
steels (AHSS) to meet the need for lighter, more fuel-efficient cars with better safety ratings.
Dual-phase (DP) and transformation-induced plasticity (TRIP) aided steels are examples of
commercially available AHSS grades. These steels exhibit high strength and tensile
elongation [1]. As the use of these higher strength grades enables application of thinner parts,
overall body in white (BIW) weight reduces, but corrosion properties become an important
consideration. To protect these steels from corrosion, a hot-dip galvanizing (HDG),
galvannealing, or electro-plating (EG) process is needed [2]. However, steels alloyed with Mn
and Si can exhibit poor galvanizability due to complex Si-Mn oxide formation on the surface
when they are coated using an HDG process [1]–[8]. When Si levels reach 1 wt pct,
galvanizability and Zn wettability may be affected due to complex oxide formation [1]. Along
with Si-Mn oxides, Fe-Si oxides can also impair the galvanizability of steel. Due to the nature of
these complex oxides, they may affect pickling response of the steel, resulting in areas
containing oxides after pickling. There are many surface defects possible on industrially
produced galvannealed (GA) and galvanized (GI) products including: bare spots, streaking,
flame, splashing, and dross (Fe-Zn-Al particles) defects [9]–[11]. An enhanced understanding of
the formation of complex oxides, as well as texture on the surface is needed to help identify the
root cause for these various defects. The conditions for selective oxidation, as well as different
defects observed in industrial dual-phase steels are not well documented in literature, increasing
the demand for detailed chemical and microstructural characterization. The motivation behind
this project is to complete advanced characterization of industrially provided GA and GI steel
exhibiting surface defects. This characterization will then be used to elucidate the origin of these
defects in steel production. The techniques used for characterization include thermodynamic
modeling paired with field emission scanning electron microscopy (FESEM) and time of flight
secondary ion mass spectrometry (TOF-SIMS) for chemical analysis.

2
CHAPTER 2
LITERATURE REVIEW
This section will cover a literature review on the galvanizing and galvannealing process,
as well as different variables that affect high temperature oxidation in e.g. slab reheating in the
hot mill, or in the annealing furnace prior to finishing in the cold mill. The last part of this
section will cover different alloying effects on coatability of common elements found in TRIP-
aided and DP steels, specifically Cr, Mn and Si.
2.1 Galvanizing/Galvannealing and Zn-Fe Intermetallic Formation
When steel is galvanized or galvannealed, the coating will act as a barrier for
corrosion in two ways. It will act as a physical barrier between the steel and the atmosphere and
will corrode away first. The coating will also provide galvanic protection for the steel if the steel
is exposed to a corrosive environment [9]. This is by means of cathodic protection as the Zn
coating will corrode preferentially when in contact with steel. Both processes (GA and GI) start
with a hot dip galvanizing (HDG) step where the strip contacts molten Zn. Figure 2.1 shows the
galvannealing process. The galvanizing line will not have the galvanneal furnaces (operating)
and the steel will instead be cooled the entire length of the tower. The continuous galvanizing
line (CGL) starts with cleaning the steel surface by degreasing, pickling and fluxing [12]. This
will remove rolling oils, iron fines, removable oxides, and other contamination on the steel
surface following cold rolling. The flux helps protect the surface from further oxidation. The
steel is annealed in a furnace under protected atmosphere and immersed in the molten zinc bath.
Annealing is usually performed in an N2/H2 atmosphere to reduce iron oxides on the surface. The
molten zinc bath is maintained at a temperature between 440-460 ºC with dipping times between
4-8 seconds [1-2]. Longer immersion times will result in different phases formed as well as a
thicker coating. For galvannealing, the coated steel is then annealed at approximately 500-550 ºC
for 5-25 seconds to promote the diffusion of Fe and Zn for further creation of Fe-Zn intermetallic
phases [9]. Depending on the desired intermetallic, the annealing temperature may vary. Fe-Zn
intermetallic phases can observed in the Fe-Zn phase diagram in Figure 2.2. Possible Fe-Zn
intermetallic phases that can form during galvanizing and galvannealing are included. These

3
phases are as follows from high Fe to high Zn content: Γ1, Γ, δ, ζ, and possibly η(Zn).
Galvannealed steel exhibits better paintability and weldability but may result in more formability
issues due to the presence of harder and more brittle intermetallic phases [13]. Figure 2.3 shows
a cross section of (a) GA and (b) GI steel. Seen in Figure 2.3 (a) is a GA coating with the
presence of the Γ phases as well as δ phase which are higher Fe content phases. Seen in Figure
2.3 (b) is a GI coating with exaggerated dip time to reveal the phases that are formed. It can be
seen at exaggerated times there is the sufficient time for Γ and δ phase to form, however for
industrially produced GI coatings, ζ and η(Zn) are the predominant phases as dip time is
shorter [9]. The presence of oxides can influence the wettability and growth of the Fe-Zn
intermetallic layers and can cause defects in the coating [1], [2], [8], [11]. Oxides can form
during reheating, hot rolling and annealing processes. Certain oxides, specifically silicates, are
difficult to remove from the surface of the steel by pickling [11]. Furthermore, if the oxides form
during annealing, there is no removal process for these oxides prior to Zn coating, making them
especially critical to address. During the solidification of zinc in the galvanizing process,
different intermetallic phases form. The phases depend on the bath composition, bath
temperature, immersion time etc. The nucleation of zinc is thought to begin heterogeneously at
the steel/zinc interface at the beginning of solidification [9], [14]. However, there is some debate
about where zinc nucleation begins [15]. Fasoyinu suggests that due to the small amount of
undercooling in the molten zinc layer, solidification will occur in the bulk as (0001)
platelets [15]. The nucleated platelets will dendritically grow parallel to the iron-zinc surface due
to latent heat removal [14], [15]. Depending on the alloying additions to the zinc bath, nucleation
can be suppressed, and the surface tension at the dendrite tip can be lowered. This will lead to a
small amount of nucleation sites, fast dendritic growth, and formation of a spangled (large
grained) surface. Elements that will form a spangled surface are: Pb, Sb, Al, and Sn. These
elements also increase bath fluidity, resulting in better zinc wettability [14].

4
Figure 2.1 The HDG process for galvanized and galvannealed steel with galvanneal furnace
showing coil entry into the cleaning section (fluxing), then the annealing furnace,
and the cooling section that prepares the strip for the Zn pot. The galvannealing
furnace is shown on the schematic. During galvanizing for GI products the
furnace will not operate and the strip will be cooled the length of the tower. [9].
Figure 2.2 The Fe-Zn phase diagram at high Zn content showing Fe-Zn intermetallic phases
that can form during galvanizing and galvannealing in the red box [9].

5
(a) (b)
Figure 2.3 SEM micrographs of a cross section of (a) a galvannealed IF-20 steel showing
layers of Γ and Γ1 near the Fe surface, and δ developed on top of the Γ phases
[16]. (b) a cross section of galvanized IF steel with 1 showing Γ, 2 showing δ and 3 showing ζ [9].
During hot-dip galvanizing (HDG), zeta phase will nucleate and grow first depending on
the Al content. This is followed by the formation of delta (low amount for GI), and after a longer
immersion time or a galvannealing process, gamma will form [9]. Characteristics of Zn-Fe
intermetallics are shown in Table 2.1 [17]. There are different reported values for Γ, Γ1 and δ
making a range of compositions possible [17]. The nucleation of zeta (ζ) is inherently important
as it is the first phase to nucleate (for low Al containing baths), which could be a function of
substrate texture [18]. Epitaxial growth of zeta occurs on certain α-Fe planes such as (113),
(313), and (111) [18]. On a (113)α plane, only one orientation variant of zeta phase exists,
leading to thin, compact layers of zeta growth with no other Zn-Fe intermetallic forming. On
(001)α and (101)α facets, zeta nucleates at random orientations with respect to the substrate,
leading to rapid growth of δ and Γ phase. This suggests that the formations of δ and Γ are not
diffusion controlled, but nucleation controlled [18].

6
Table 2.1 –Fe-Zn Intermetallic Phases Formed during HDG processes [17].
Phase Crystal
Structure Stoichiometry
Iron
Content
(wt pct)
Atoms/Unit
Cell
Lattice Parameters
(nm)
ηZn HCP Zn(Fe) 0.03 6 a=0.266, c=0.484
ζ Monoclinic FeZn13 5-6 28 a=1.3483, b=0.7663,
c=0.5134, β=127°
δ Hexagonal FeZn10 7-11.5 555 a=1.28, c=5.76
Γ1 FCC Fe5Zn21 17-19.5 408 a=1.7963
Γ BCC Fe3Zn10 23.5-31.0 52 a=0.9018
αFe BCC Fe(Zn) - 2 a=0.286
To understand formability problems, the intermetallic growth of the Fe-Zn system must
be analyzed. The more brittle Fe-Zn intermetallic phases (δ, Γ) cannot sustain a large amount of
deformation due to cracking, powdering and galling [13], [19]. To make the zinc coating less
brittle for GI coatings, additions to the bath can be made which lead to the inhibition of Fe-Zn
intermetallic formation. Small amounts of Al (> 0.15 wt pct Al) will lead to an Fe2Al5 inhibition
layer that acts to stop Fe diffusion into the zinc layer. Figure 2.4 shows an EDS element map of a
GI coating from a 0.4 wt pct aluminum containing zinc bath [20]. In Figure 2.4 (a), a secondary
electron image shows coating appearance and thickness of about 15 μm. Figure 2.4 (b) shows the
distribution of Zn, which is only present in the coating. Figure 2.3 (c) shows Al segregation
within the coating. Al segregates to the steel-zinc interface, reacting with iron to form an Fe2Al5
inhibition layer. Al will also segregate to the zinc free surface and oxidizes into Al2O3 [20]. Iron
does not diffuse into the zinc coating due to the Fe2Al5 inhibition layer, eliminating Fe-Zn
intermetallics. This can be seen in Figure 2.4 (d). The amount of iron within the zinc coating is
directly related to the formability of the layer. If there is more iron content in the coating, the
coating may experience more formability issues [13]. With a lower amount of iron in the
coating, formability, as determined by measuring powdering during a bend test, will be greater
due to a more ductile coating. Powdering is the exfoliation of the galvannealed or galvanized
coating, resulting in loss of material [13]. Galvannealed steel offers superior weldability, and
paintability, but can lead to more powdering and cracking [13]. This can be harmful to not only
the coating, but also the dies used in the forming process. The lost coating can adhere to the
surface of the die and increase the amount of wear the tool experiences.

7
When galvannealing steel, the Al content of the Zn pot is targeted to be equal to or lower
than 0.14 wt pct due to the creation of the Fe-Al inhibition layer [18]. Marder et al. suggests that
Al content between 0.10-0.14 wt pct will result in δ phase being in equilibrium with molten Zn.
This Al range can promote δ formation during solidification, leading to a microstructure of
predominantly δ after galvannealing. However, any Al content has shown to promote Fe2Al5
layer formation, which leads to the inhibition of Fe-Zn intermetallics.
Oxidation of the steel surface has been shown to affect wettability and growth of the
coating, leading to defects. The next section will cover high temperature oxidation of steel
containing Mn and Si.
(a) (b)
(c) (d)
Figure 2.4 EDS element map of a cross section of low carbon galvanized sheet steel
galvanized with a zinc bath containing 0.4 wt pct Al with (a) the BSE micrograph,
(b) the Zn map (c) the Al map and (d) the Fe map. (a)-(d) all have the same scale
as (a). Adapted from [20].

8
2.2 High Temperature Selective Oxidation
The selective oxidation of metals has been described by Wagner’s theory of oxidation
and will be discussed in this section. Different models and modifications will then be presented
and discussed on the relevance and accuracy of Wagner’s theory of oxidation pertaining to DP
steels.
The galvanizability of steel depends on many variables, but one of the most important
variables is the surface state of the steel. Prior to the galvanization step, the steel undergoes an
annealing process that is meant to set the desired microstructure of the steel, as well as prevent
Fe oxidation from atmospheric control. In the case of TRIP-aided and DP steel, selective
oxidation of Si, Cr and Mn will result in formation of complex oxides due to the reactivity of
these alloying elements which may impact Zn wettability of the strip. To understand atmosphere
effects on oxidation of DP and TRIP-aided steels, the dew point of the annealing atmosphere
must be defined. Dew point is a measure of the water content of a gas. From dew point, a
specific partial pressure of gaseous H2O can be calculated shown in Equation 2.1 and 2.2, where
DPC is the dew point in question [21]. Dew point can affect the oxide formed, mechanisms and
extent of oxidation of the surface of the steel.
log10pSat H2O = 9.80DPC273.8+DPC − 2.22 if DPC ≤ 0°C (2.1)
log10pSat H2O = 758DPC240+DPC − 2.22 if DPC ≥ 0°C (2.2)
Mahieu et al. have conducted studies on a number of TRIP-aided steels to determine the oxide
build up after annealing [2]. They created a schematic showing possible oxide formations on
three TRIP-aided steels. Figure 2.5 shows the type of oxide formation that may occur for three
TRIP-aided steels (0.25C-1.69Mn-1.28Si, 0.18C-1.56Mn-1.73Al, 0.19C-1.49Mn-0.14P) at a dew
point of -30 ºC. These alloying elements were chosen for this model as each alloying element
(Si, Al and P) has been shown to suppress cementite (Fe3C) formation, while C and Mn stabilize
austenite [1], [2], [22]. This allows for the retainment of austenite, allowing for the TRIP effect
to occur. Al has been shown to have similar effects to Si, making it a viable alloying element for
creating the TRIP effect [1]. MnO will build up as globular particles along grain boundaries on
the surface of CMnAl and CMnP substrates, which has been supported by Gong et al. [8].

9
Thorning has also shown experimentally that Mn will travel to the surface along grain
boundaries [5]. Oxidation of a CMnSi steel will form the complex Mn2SiO4 oxide, which is a
common oxide that causes wettability issues for galvanized AHSS [11]. A spinel (MnAl2O4) is
suggested to form on the Al containing TRIP steel, which has the possibility to negatively affect
coat-ability within these steels.
Figure 2.5 Schematic of how oxides form on three different CMnX steels after annealing [1].
To mediate the galvanizability issues from oxide formation, De Cooman et al. reviewed
possible strategies to improve zinc coatings, as shown in Figure 2.6 [3]. The Mn/Si ratio can
control the oxide that forms during annealing of CMnSi TRIP-aided steels. Changing the oxide
from Mn2SiO4 to MnO and SiO2 can help reduce surface defects as MnO is easier to remove [3].
A layer of FeO and MeO oxide on the surface of the steel can be reduced by H2 within the
furnace to produce Fe. This will lead to a sufficient surface for zinc to wet and adhere to. Flash
coating the steel with Fe/Ni will help keep surface selective oxidation to a minimum allowing
zinc to wet and adhere to the surface. The effect of dew point within the annealing furnace has a
large effect on the nature of the oxide formation of the steel. Most furnaces have a N2/H2
reducing atmosphere to reduce iron oxides, but they also have trace amounts of water vapor
within them, shown in Equation 2.1 and 2.2 [8], [21]. Water vapor is assumed to be in
equilibrium with hydrogen, and the effective partial pressure of O2 can be calculated from the
dew point using work by Huin et al., and Swisher and Turkdogan [21], [23]. By changing the
dew point, it is possible to change the oxidation of the steel from external to internal oxidation.
Internal oxidation is when selective oxidation occurs i.e. certain alloying elements will oxidize
rather than Fe atoms, but the diffusivity of the oxidizing element (Mn, Si) is not large enough to

10
externally oxidize these elements. Using the work of Wagner, Rapp produced equations that can
be used to predict the depth of internal oxidation [24]. Birks et al. then modified Rapp’s work
and the Wagner theory of oxidation to predict when internal oxidation will transition to external
oxidation [25].
Figure 2.6 Strategies around selective oxidation within AHSS for increased
galvanizability [3].
Liu et al. investigated the amount of surface oxidation while varying the dew point for three
different DP steels: Mn-Si, Cr, and Cr-Mo containing DP steels [4]. Table 2.2 shows the
chemical compositions of the three DP steels. Figure 2.7 shows the effect of dew point on
surface oxidation of a Cr-Mo steel by SEM imaging. Figure 2.7 (a) is at a dew point of -30 ºC
which corresponds to an O2 partial pressure of 2.28×10⁻²³ atm at 800 ºC. Figure 2.7 (b) is at a
dew point of 10 ºC which corresponds to an oxygen partial pressure of 2.38 ×10⁻²⁰ atm at 800 ºC.
At a -30 ºC dew point, the surface is almost fully covered by oxide formations of MnO, Mn3O4,
Cr2O3, SiO2, with small amounts of iron oxides [4]. At a 10 ºC dew point, the surface appears
much cleaner, with more of the iron surface exposed and available for the zinc coating. The
oxides formed at 10 ºC dew point were Mn2SiO4, MnSiO3, MnO, and Mn2O3 as well as some
iron oxides [4].

11
Table 2.2 – Chemical Composition of Three DP steels: Mn-Si, Cr, and Cr-Mo [4].
wt pct C Mn Si P Cr Mo Al
Mn-Si 0.11 1.75 0.38 0.011 - - 0.055
Cr 0.12 1.62 0.30 0.012 0.39 - 0.045
Cr-Mo 0.11 1.47 0.32 0.012 0.21 0.15 0.064
(a) (b)
Figure 2.7 SEM images of (a) -30 ºC dew point anneal for a Cr-Mo DP steel surface and (b)
10 ºC dew point anneal for a Cr-Mo DP steel [4].
Though complex oxides formed at higher dew points, fewer oxides formed on the
surface. The oxidation mechanism may therefore be transitioning to internal oxidation, allowing
for reduced oxide formation on the surface. Reducing the amount of external oxides can increase
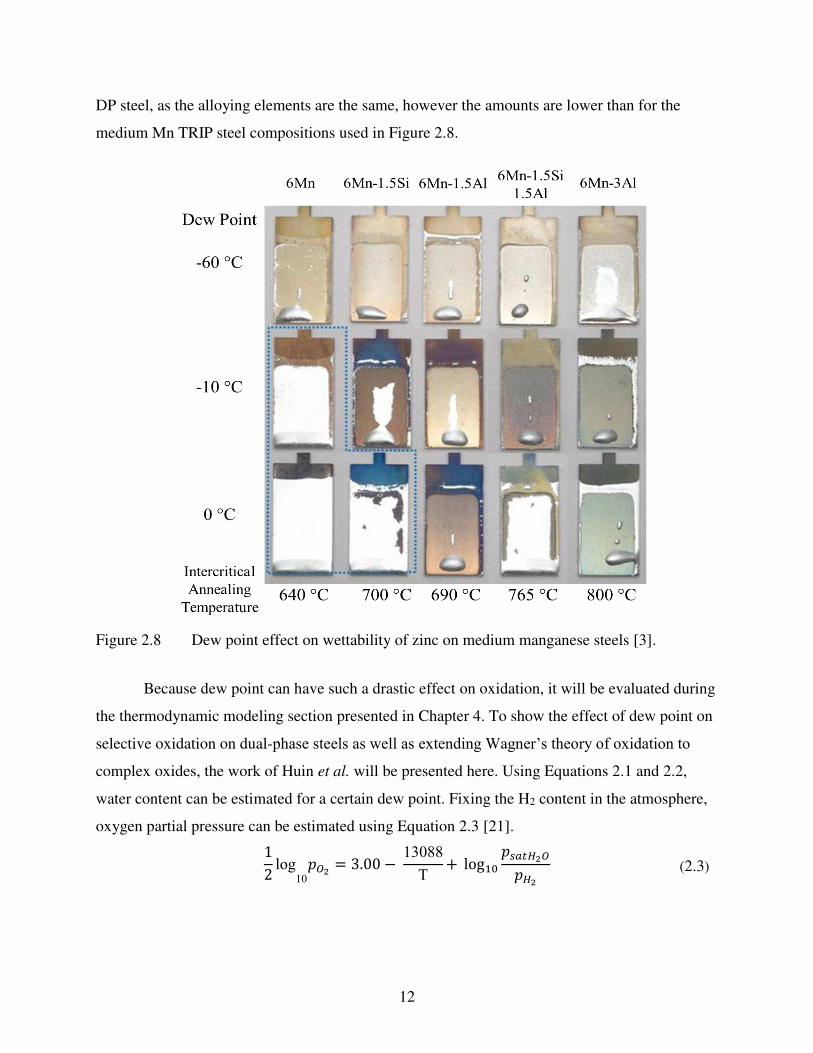
wettability and zinc adherence to steel. De Cooman et al. have shown wettability of zinc by
changing alloying additions and dew point for medium manganese steels [3]. By changing the
alloying additions, the intercritical annealing temperature changes as well. In general, as the
intercritical annealing temperature increases, the degree of zinc wettability decreases, as shown
in Figure 2.7 [3]. As dew point increases, the degree of wettability also increases. Selective
surface oxidation is difficult at lower temperatures due to slower diffusion of substitutional
atoms, allowing for a higher amount of internal oxidation to occur. In general, as the intercritical
annealing temperature increases, the degree of zinc wettability decreases, as shown in
Figure 2.8 [3]. As dew point increases, the degree of wettability also increases. Selective surface
oxidation is difficult at lower temperatures due to slower diffusion of substitutional atoms,
allowing for a higher amount of internal oxidation to occur. This effect would be the same for
12
DP steel, as the alloying elements are the same, however the amounts are lower than for the
medium Mn TRIP steel compositions used in Figure 2.8.
Figure 2.8 Dew point effect on wettability of zinc on medium manganese steels [3].
Because dew point can have such a drastic effect on oxidation, it will be evaluated during
the thermodynamic modeling section presented in Chapter 4. To show the effect of dew point on
selective oxidation on dual-phase steels as well as extending Wagner’s theory of oxidation to
complex oxides, the work of Huin et al. will be presented here. Using Equations 2.1 and 2.2,
water content can be estimated for a certain dew point. Fixing the H2 content in the atmosphere,
oxygen partial pressure can be estimated using Equation 2.3 [21].
12 log
10𝑝𝑂2 = 3.00 − 13088
T + log10 𝑝𝑠𝑎𝑡𝐻2𝑂𝑝𝐻2 (2.3)

13
Oxide stability analysis can be completed using the work of Wagner, modified by Birks
et al., Liu et al., Huin et al., and Swisher et al., as well as Thermo-Calc® analysis [21], [23],
[25], [26]. Calculations using modifications of Wagner’s theory of oxidation from Birks et al.
estimate when oxidation will transition from external to internal, shown in Equation 2.4 [25].
Values used in Equation 2.4 were taken from Liu et al., Huin et al., and Swisher et al [21], [23],
[26].
NB(o) > [πg*
2ν NOS DOVm
DBVox]1/2
(2.4)
NB(o) is the concentration of solute metal B within the matrix. In this case B will be Mn,
Cr, or Si, and the matrix will be iron. NOS is the surface concentration of oxygen on the metal in
question. Using dew point, the amount of water vapor can be estimated. A range of dew points
can be selected to be any range of interest. With water vapor estimates and an assumed hydrogen
value (5 vol pct) within the furnace atmosphere, the equilibrium partial pressure of oxygen can
be calculated, and used to estimate the surface concentration of oxygen on iron [9]-[10]. DO is
the diffusivity of oxygen within the iron matrix, considering to be both ferrite and austenite [21].
DB is the diffusivity of the metal being oxidized within the matrix. Diffusivities for substitutional
elements have been taken from Liu et al. for both ferrite and austenite, and are included in
Table 2.3 and 2.4, and will be further discussed in section 4.1 [26].
Table 2.3 – Parameters used in the Wagner Oxide Stability Calculation for Ferrite [6], [26].
Temperature
(ºC)
DO
(cm2/sec)
DMn
(cm2/sec)
DCr
(cm2/sec)
DSi
(cm2/sec) g* g*(Mn)
750 3.84 × 10⁻⁷ 2.61 × 10⁻¹² 1.50 × 10⁻¹² 2.40 × 10⁻¹² 0.3 0.2
800 6.57 × 10⁻⁷ 8.93 × 10⁻¹² 5.54 × 10⁻¹² 8.00 × 10⁻¹²
Table 2.4 – Parameters used in the Wagner Oxide Stability Calculation for Austenite [6], [26].
Temperature
(ºC)
DO
(cm2/sec)
DMn
(cm2/sec)
DCr
(cm2/sec)
DSi
(cm2/sec) g* g*(Mn)
850 8.07 × 10⁻⁸ 9.38 × 10⁻¹⁴ 9.00 × 10⁻¹⁴ 1.02 × 10⁻¹² 0.3 0.2
900 1.74 × 10⁻⁷ 3.13 × 10⁻¹³ 3.00 × 10⁻¹³ 3.09 × 10⁻¹²
Vm is the molar volume of the metal that is being oxidized, and Vox is the molar volume
of the oxide being formed. The critical volume fraction of oxide to cause a change from internal
to external oxidation is g* which has been suggested to be 0.2 for Mn and 0.3 for the other
elements [25], [26]. The valency of the metal that is in oxide form is ν (i.e. Mn2+ for MnO).

14
When NB(o) is greater than the estimated concentration on the right, the oxidation mechanism will
be external and correspondingly lower NB(O) values result in internal oxidation. An important
consideration to account for is the error associated with using Wagner’s theory of oxidation.
When conditions are close to the transition from internal to external oxidation, a mixture of both
should be considered possible. Another consideration is that the analysis is for binary oxide
systems, and there is a possibility for complex oxides (Fe, Mn, Si) to form.
Huin et al. have created models that extend Wagner’s theory of oxidation [21]. These
models can apply to complex oxide formation seen during high temperature oxidation of TRIP
and DP steels. The models have been employed to predict oxidation in a 1.235 wt pct Mn, and
0.132 wt pct Si steel. Other alloying elements were not included. The annealing treatment
reached a maximum temperature of 800 °C with a dew point of -40 °C. Figure 2.8 shows
annealing at dew points of -40 °C and 15 °C resulting in oxidation of Mn and Si at high
temperature. The increase in dew point shows a decrease in surface presence of Mn and Si and
an increase of these elements internally [21]. As dew point increases, the amount of surface
oxygen increases, which increases to the amount of oxygen that can diffuse into the steel and tie
up alloying elements. This is seen in Figure 2.10: Mn and Si are being tied up between 0.1 and
0.4 μm from the surface when the dew point is increased from -40 °C to 15 °C. This relationship
has been seen throughout literature [2], [3], [8], [26]. Using this model, diffusion paths have been
created on a predominance diagram shown in Figure 2.9. This diagram shows which oxides will
form with a specified amount of Mn and Si at 800 °C in an N2-5 pct H2 atmosphere and a -40 °C
dew point. This diagram predicts the diffusion path of Mn and Si during annealing based on
initial concentration and yields the composition of the resulting oxide. The dotted lines are the
diffusion paths, and the composition of the resulting oxide can be determined at the end of these
lines. This diagram can be used to predict the evolution of the oxides formed on DP and CMnSi
TRIP steels. This model will be used when making predictions on oxidation of the received DP
steels. Another variable that could possibly affect oxidation mechanism is grain size/grain
boundary diffusion. Due to differences in solute diffusion through the lattice versus along grain
boundaries, unexpected external oxidation can occur even when full internal oxidation is
predicted according to the Wagner analysis.

15
(a) (b)
Figure 2.9 Dew point effect during high temperature oxidation shown for (a) Mn and (b) Si
at -40 °C and 15 °C [21].
Figure 2.10 Oxide formation and diffusion paths for a DP steel with varied Mn and Si content.
The matrix is iron [21].
Along with unexpected external scale, different oxide morphologies may occur due to
grain boundary effects. It has been shown that certain alloying elements, including Mn, Al, and
Cr will segregate to grain boundaries [5]. With a high concentration of these elements already on
grain boundaries, recent research has shown that these elements, specifically Mn, can diffuse to
the surface and form oxide ridges. An illustration of this phenomenon is shown in Figure 2.11.
This figure includes an illustration of grain size effect on diffusion, as well as an oxidized dual
phase steel showing grain boundary ridges. The steel in Figure 2.11 is a 1.8 wt pct Mn/1.5 wt pct

16
Al TRIP steel annealed at 670 °C in an atmosphere containing 10-4.8 atm of O2. The holding time
was reported to be exaggerated compared to industrial processing of TRIP-aided steels. The
observed ridges are globular nodules of Mn oxides [5]. Depending on grain size, this effect can
be important when trying to prevent surface oxidation. Smaller grain size can decrease the effect
of grain boundary diffusion as the diffusion length in the grains is significantly longer than the
grain size. This will limit the segregation to grain boundaries and will give a more uniform
diffusion in the bulk. If the diffusion length is smaller than the grain size, the phenomenon
shown in Figure 2.11 can occur [27]. The amount of solute segregation to grain boundaries will
increase, increasing the effect of grain boundary diffusion. The grain size effect is illustrated in
Figure 2.12 [27]. The ridges formed on the grain boundaries can cause a variety of defects to
form on an applied zinc coating as adherence can be an issue. Nucleation and growth kinetics of
the zinc coating could be inhibited as well.
2.3 Mn, Cr and Si Alloying Effects on Galvanizing/Galvannealing
As the provided samples contain Mn, Cr and Si additions, alloying effects on
galvanizability for these elements will be reviewed.
In dry H2 containing annealing furnaces, Fe oxidation is not thermodynamically
favorable, however oxidation of Mn and Cr are thermodynamically favorable under these
conditions, as shown in Figure 2.13. This figure shows thermodynamic stability of Mn, Fe and
Cr oxidizing from water vapor present in the annealing furnace. For conditions of PH2O/PH2
above the respective curve for each element, oxidation of the element is predicted. Conditions
used in industrial furnaces are below stability of FeO formation but are above Mn and Cr
oxidation. Oxidation reactions of Mn and Cr are shown below in Equations 2.5-2.7.
Mn + H2O → MnO + H2 (2.5)
2Cr + 3H2O → Cr2O3 + H2 (2.6)
2Cr + MnO + 3H2O → MnCr2O4 + 3H2 (2.7)

17
(a) (b)
(c)
Figure 2.11 Schematics showing (a) solute segregation to grain boundaries, (b) quick transport
of solute to the surface to create surface oxide ridges and (c) SEM micrograph of
in-situ high temperature oxidation at 670 °C for a 1.8 wt pct Mn-1.5 wt pct Al
TRIP steel showing oxide ridges [5].
These reactions will move forward for typical annealing furnace conditions (5 vol pct H2
and -30 °C D.P.), resulting in oxidation of Mn, and Cr, as shown in Figure 2.14. This is assuming
that H2O acts as an oxidizing gas as seen in Equation 2.2-2.4. The reaction for MnCr2O4 is
assumed to be possible in the range of temperatures between the stability of MnO and
Cr2O3 [28].

18
(a) (b)
Figure 2.12 Illustrations showing solute diffusion for (a) diffusion length significantly longer
than grain size and (b) diffusion length shorter than grain size, resulting in ridge
formation. Adapted from [27].
Fushiwaki et al. carried out experiments on selective oxidation and wettability of dual phase
steels containing 0.0-0.6 wt pct Cr and 1.7 wt pct Mn [28]. Annealing was performed using an
N2-5 vol pct H2 atmosphere at 800 °C for 20 seconds with a dew point of -35 °C. The
composition of Zn used was an alloy of 0.14 wt pct Al and Al free Zn. Wettability was measured
by means of sessile drop tests using an Ar purged graphite syringe heated with an electric heating
coil. It was found that the Cr free steel exhibited MnO produced on the surface, and the 0.6 wt
pct Cr steel surface contained MnO with MnCr2O4. Mn surface oxidation was found to not
change greatly with an increase in Cr content. The morphologies of the oxides formed on a Cr
free and 0.6 wt pct Cr steel are shown in Figure 2.14. SEM images are included in Figure 2.15 to
show where Figure 2.14 was derived. Less granular MnO will form as planar MnCr2O4 is created
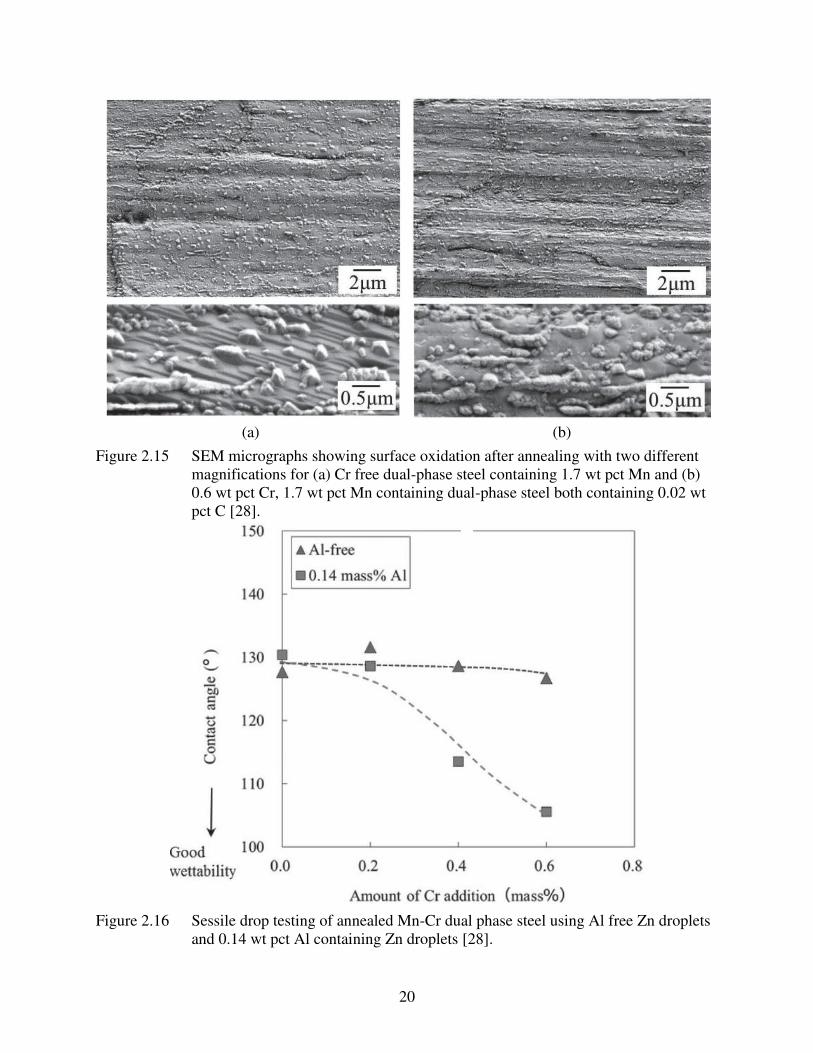
[28]. During wettability experiments in an atmosphere of Ar-5 vol pct H2, it was found that the
wettability angle decreased with increasing Cr content and increasing Al content in the droplet
[29]. This decrease was from 130° to 105° wetting angle and can be observed in Figure 2.16.
This was due to the formation of MnCr2O4 spinel; the reactivity of this spinel with Al is high
enough that it allows Zn to contact the Fe substrate. The associated reaction forms
Mn(Cr,Al)2O4, which is taken into the Zn bath allowing for Fe-Zn-Al reactions to take place.
MnO does not react with Al in this way as MnO is a rock salt structure; AlO is a corundum
structure, which would not allow it to form a rock salt structure [28], [29]. Al stimulates
formation of spinel or corundum type crystal structures, making the formation of Mn(Cr,Al)2O4
feasible. If there is no Al in the droplet, this reaction will not occur, and the wetting angle will
not decrease [28]. Kawano et al. found that the Al added to the Zn bath prefers to react with the

19
Mn-Cr spinel instead of Fe, leading to reduced Fe-Al inhibition layer formation. Without the Fe-
Al inhibition layer, Fe-Zn intermetallic reactions will take place [29].
Figure 2.13 Thermodynamic stability of Mn, Fe, and Cr when oxidized by H2O(g) [28].
(a) (b)
Figure 2.14 Morphologies of Mn and Mn-Cr oxides formed on (a) a Cr free dual-phase steel
containing 1.7 wt pct Mn and (b) a 0.6 wt pct Cr, 1.7 wt pct Mn containing dual-
phase steel both containing 0.02 wt pct C [28].
20
(a) (b)
Figure 2.15 SEM micrographs showing surface oxidation after annealing with two different
magnifications for (a) Cr free dual-phase steel containing 1.7 wt pct Mn and (b)
0.6 wt pct Cr, 1.7 wt pct Mn containing dual-phase steel both containing 0.02 wt
pct C [28].
Figure 2.16 Sessile drop testing of annealed Mn-Cr dual phase steel using Al free Zn droplets
and 0.14 wt pct Al containing Zn droplets [28].

21
Higher Si levels within steel have shown to increase the amount of Si based oxides
created on the steel surface during annealing. This could lead to a decrease in galvanizability due
to reduced wettabilty [2]. However, Si additions can also influence Fe diffusion into the Zn
coating. A Si rich layer has been suggested to form just above the steel surface within the Zn
coating during HDG processes. The Si content is believed to result from the aluminothermic
reduction (Equation 2.8) of Si oxides as well as dissolution from the steel substrate due to the
high solubility of Si in liquid Zn [22].
4[Al] + 3SiO2 → 2Al2O3 + 3[Si] (2.8)
Lower Si contents within DP steels (<0.12 wt pct) were found to not cause considerable
changes to intermetallic formation during GA processes. For a DP steel containing 0.44 wt pct
Si, it was found that a Si rich layer formed on the interface of the steel and molten Zn. This
disrupts ζ phase nucleation, as well as suppresses Fe diffusion into the coating. After 25 s of
galvannealing, it was found that the coating contained approximately 2 wt pct Fe, which is below
the typical amount of 10-12 wt pct for a predominantly delta phase microstructure [9], [22]. The
Si content in the coating before galvannealing was found to be 5.28 atomic pct and was found to
have increased to 6.77 atomic pct after galvannealing. This shows that Si will diffuse, or silicates
will reduce into the coating as galvanizing/galvannealing occurs. These two situations can be
observed in Figure 2.17. The HDG-GI process forms a Zn layer in which η or ζ will form. It is
shown that for GI, the increase in Si content outlined previously will increase the amount of Si
oxides present on the steel-coating interface, however it will not affect the wettability of the Zn.
The effect of Si is shown when a GA process takes place. A Si rich layer is postulated to form,
which suppresses the degree of Fe-Zn alloying that occurs. This results in the formation of ζ
phase but not δ phase. Longer GA processes will result in a thicker Si rich layer, with a small
amount of δ formation. The usual microstructure of a GA coating is predominantly δ phase with
some Γ phase. Lower Si levels will result in increased amounts of δ phase formation as annealing
time increases. At longer GA times, Fe-rich Γ forms with the low Si condition. If Si were to
segregate through oxide reduction and from dissolution from the steel, it could affect the
nucleation and growth of Zn-Fe intermetallic phases.

22
Figure 2.17 Illustration showing the hypothesized retardation of the GA reactions due to a Si
rich layer formed at the steel-Zn interface. Adapted from [22].
However, it should be noted that this Si rich layer has not been seen experimentally in
other literature [2], [3]. It is, however, a plausible representation of how Si can affect the coating
thickness in ways other than wettability. The authors report Si oxide dissolution during the
coating process, however it can be seen in other literature that these oxides are present after
coating, and drastically affect the coating [3].
23
CHAPTER 3
EXPERIMENTAL PROCEDURES AND MATERIALS
3.1 Materials
Four materials, with chemical compositions shown in Table 3.1, were received from the
International Zinc Association (IZA). Also listed in Table 3.1 are the conditions in which the
materials were received.
Two sheet steel samples of Material A were provided as a galvannealed (GA) sheet with
a thickness of 1.46 mm and as a bare sheet with a thickness of 2.01 mm. The defects associated
with this material were observed to be streaking in nature.
Two sheet steel samples of Material B were provided as galvanized (GI) and bare DP580.
The thickness of the GI material is 2.05 mm and 1.51 mm for the bare material. It should be
noted that these samples are not of the same coil or gauge but are of the same composition and
heat. Cr and Mo were provided as a combined alloying addition, individual amounts are
unknown. The defects associated with this material were described to be an acne type defect. The
material was supplied with the knowledge that prior and later processed sheets do not exhibit this
defect. No defects were observed macroscopically in the un-coated, cold rolled state.
Four sheet samples of Material C were received. Samples of a coil which were defect free
and defect containing GA sheets were received, as well as their counterparts as cold-rolled and
non-coated. The thickness of both GA sheets is 0.71 mm. Material C was suggested to be within
DP490 standards. The defects for this material were described to be a flame pattern defect. It was
supplied with two ends of a coil: one end exhibiting the flame pattern defect, and one end with
sufficient and uniform coating. No defects were apparent in the un-coated, cold rolled state.
The conditions that Material D were received in are: hot band, as pickled, cold rolled,
and galvannealed. These conditions are not of the same coil; however, they are the same alloy
exhibiting similar defects. The stripes are visible in each condition received and were referred to
as tiger stripe defects. These stripes are visible throughout all processing steps, from hot band to
GA. The hot band shows red scale stripes, as pickled shows stripes possibly due to ineffective
pickling response. The stripes are difficult to observe on the cold rolled surface albeit still
present. The GA state shows presence of tiger stripes, meaning there are stripes of dark grey

24
spread among the strip. An important consideration for this material is the higher Si levels as
compared to the other materials. C content was not provided for this material, it was assumed for
Thermo-Calc® analysis that the C content was 0.1 wt pct.
Table 3.1 – Chemical Composition and State of Provided Materials (wt pct)
wt pct C Mn Si Cr Cr+Mo Al P S Bare GI GA
Material A 0.07 1.9 0.2 0.3 - 0.026 < 0.02 < 0.01 X X
Material B 0.07 1.6 0.2 - 0.8 - - - X X
Material C 0.069 1.23 0.2 0.029 - 0.047 0.014 0.005 X X
Material D NA 1.6 0.6 0.35 - - - - X X
3.2 Oxidation Mechanism Predictions and Thermo-Calc® Analysis
Oxidation mechanism predictions were conducted using a modification of Wagner’s
theory of oxidation outlined in the literature review section. Thermo-Calc® analysis was used to
create Fe-O phase diagrams for the provided materials showing the equilibrium phases for the Fe
rich area of the Fe-O phase diagram with the respective alloying additions for each material. This
analysis gives the oxides that are thermodynamically favorable during annealing as industrially
relevant dew points were evaluated during the analysis. Thermo-Calc® was completed using the
TCEF9 database. On the Fe-O phase diagrams, industrially relevant dew points (-30 to 10 °C)
are enclosed on the figures.
3.3 Microstructural Characterization
Samples were sectioned and mounted in Epomet™ hot mounting epoxy and were
polished up to 0.02 μm using a neutral alumina slurry. Epomet™ hot mounting epoxy was used
to increase edge retention. Polishing was performed using an auto-polisher, and a vibromet for
the 0.02 μm step. Between each polishing and grinding step, the samples were wiped with a
cotton ball soaked in ethanol, then immersed in ethanol and sonicated to clean after each step. To
better image the steel/coating interface, samples were coated in gold to increase conductivity of
the surface. Samples used for microstructural characterization of the steel substrate were etched
with 1 pct nital for 15-20 seconds.
Light optical microscopy (LOM) was used to image the defects on the provided material.
Low magnification images were taken with an Olympus® SZX12 stereomicroscope and an
Olympus® PMG3 light optical microscope to characterize the surface of each material. For

25
higher magnification images, a JEOL® JSM-7000 field emission scanning electron
microscope (FESEM) was used to characterize the oxide and coating layers, as well as the
surface. Accelerating voltages used for FESEM analysis ranged from 5-20 kV, with probe
currents used within the small and medium ranges (JEOL specific).
Energy dispersive spectroscopy (EDS) was used for phase characterization of the Fe-Zn
intermetallic phases present in each material’s coating. This was completed with EDS mapping
paired with SEI micrographs. EDS was completed using the EDAX® Genesis and TEAM
software, which can characterize phases based off composition. This was used for Fe-Zn phase
analysis as each intermetallic phase has a specific range of Fe and Zn content. For further
chemical characterization, time of flight secondary ion mass spectrometry (TOF-SIMS) was used
as EDS is not as sensitive to Mn and Si signals.
3.4 Time of Flight Secondary Ion Mass Spectrometry
An IonToF Gmbh TOF.SIMS 5 for performing time of flight secondary ion mass
spectrometry was utilized. This machine has the capability of performing static SIMS and 3D
profiling of metals, ceramics and organics. Static SIMS for metals and ceramics is done using a
30 keV, three-lens BiMn cluster ion gun, which is the primary beam of this instrument. A gas
cluster source (20 kV Ar gas) is used for cleansing of metallic or ceramic materials from
atmospheric contamination, as well as the primary source for static SIMS on organic or
polymeric materials. Secondary ion beams include a thermal ionization cesium source and an
oxygen electron impact gas ion source, which are used for 3D profiling. The IonTof Gmbh
TOF.SIMS 5 also has a focused ion beam (FIB) for cross-sectional analysis. The attached
analyzer for this machine is an extended dynamic range analyzer, which can be used with a
delayed extraction, making nano-SIMS possible. The components of the TOF-SIMS are included
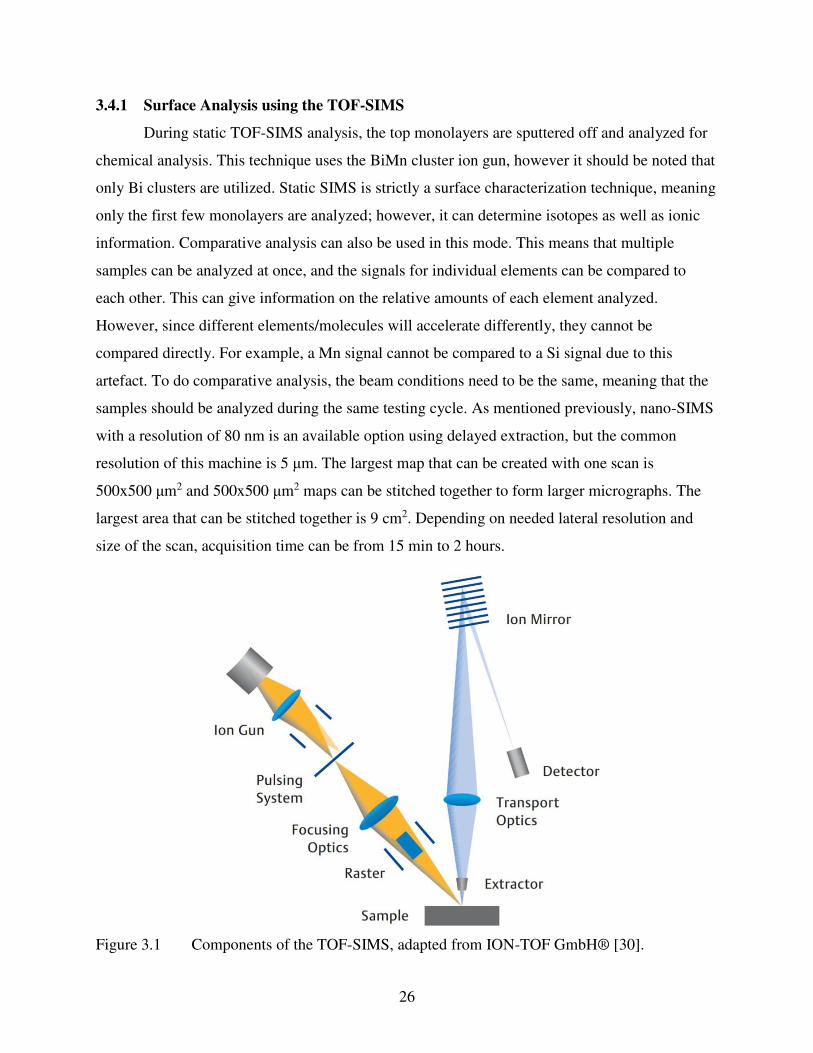
in Figure 3.1. The ion gun fires Bi clusters at the specimen, detaching elements, ion clusters and
molecules (depending on the specimen). It is then passed through the extractor to ensure
accuracy, and accelerated into the detector, where mass to charge ratio is detected and elemental
information is determined. Images of the IonTof TOF.SIMS 5 are included in Figure 3.2. A low
magnitude LOM is included on the TOF-SIMS. This is how the operator can identify areas for
analysis. Before analysis, the TOF-SIMS will take an LOM image of the area in question, and
will take a subsequent image after analysis.
26
3.4.1 Surface Analysis using the TOF-SIMS
During static TOF-SIMS analysis, the top monolayers are sputtered off and analyzed for
chemical analysis. This technique uses the BiMn cluster ion gun, however it should be noted that
only Bi clusters are utilized. Static SIMS is strictly a surface characterization technique, meaning
only the first few monolayers are analyzed; however, it can determine isotopes as well as ionic
information. Comparative analysis can also be used in this mode. This means that multiple
samples can be analyzed at once, and the signals for individual elements can be compared to
each other. This can give information on the relative amounts of each element analyzed.
However, since different elements/molecules will accelerate differently, they cannot be
compared directly. For example, a Mn signal cannot be compared to a Si signal due to this
artefact. To do comparative analysis, the beam conditions need to be the same, meaning that the
samples should be analyzed during the same testing cycle. As mentioned previously, nano-SIMS
with a resolution of 80 nm is an available option using delayed extraction, but the common
resolution of this machine is 5 μm. The largest map that can be created with one scan is
500x500 μm2 and 500x500 μm2 maps can be stitched together to form larger micrographs. The
largest area that can be stitched together is 9 cm2. Depending on needed lateral resolution and
size of the scan, acquisition time can be from 15 min to 2 hours.
Figure 3.1 Components of the TOF-SIMS, adapted from ION-TOF GmbH® [30].

27
(a) (b)
Figure 3.2 Images of the IonTof TOF.SIMS 5 currently employed at the Colorado School of
Mines. (a) shows the IonTof Gmbh TOF-SIMS overview, and (b) shows the TOF-
SIMS analysis chamber.
3.4.2 3D Imaging using Secondary Ion Beams
For this technique, high energy secondary ion beams are used to sputter into the material
to reconstruct 3D micrographs of the test area. The available secondary ion beams include: a gas
cluster (argon) source, thermal ionization cesium source, and an oxygen electron impact gas
source. The cesium and oxygen electron impact gas source are used for 3D profiling within the
material. The advantage of a multi-beam system is that optimization of sputter and analysis beam
can be used. For example, the two secondary beams (Cs and O) can be paired with the primary
ion beam (BiMn) for high resolution micrographs and deep sputtering depths. The cesium source
allows for analysis of oxygen within the material. The secondary beam will sputter into the
material, allowing the primary beam to be used on the fresh surface. For rough surfaces, or
materials with a large number of voids, TOF-SIMS analysis proves near impossible using the
conventional sources included with the machine. These samples can be analyzed by use of a fully
integrated dual beam FIB. The FIB can mill an area much like the secondary ion sources
mentioned previously. The milled area is then analyzed using the primary Bi source. A shortfall
of using this analysis is that the software will automatically reconstruct the profile into a cube,
meaning that if a 100x100 μm2 area is analyzed, the data will scale the subsequent depth profile
to look like a 100x100x100 μm3 cube. The sputter depths used in this work were through the
28
coating and slightly into the substrate, and therefore the deepest sputter depth was approximately
20-22 μm. This make features found in the profile look larger than they are in the sputter
direction.
3.4.3 Data Processing
Because this machine is extremely sensitive to surface roughness, data can show
elemental analysis that may not reflect the compositional makeup of the analyzed area. To
determine if surface roughness is influencing the data, one must compare individual elemental
maps to the total count map. If each micrograph contains the same areas that display loss of
signal (black), then surface roughness can be assumed to be affecting the data. While it may be
difficult to use this data for elemental analysis, it can give some idea of the roughness of the
material.
Another way the data can be affected is by beam interaction. This is a phenomenon that
occurs during depth profiling. Rod-like features may appear in the data when a 3-D rendering is
created from depth profiling data. This effect is suggested to be caused from surface roughness
leading to different sputtering depths. This will lead to non-planar sputtering, and rod-like areas.
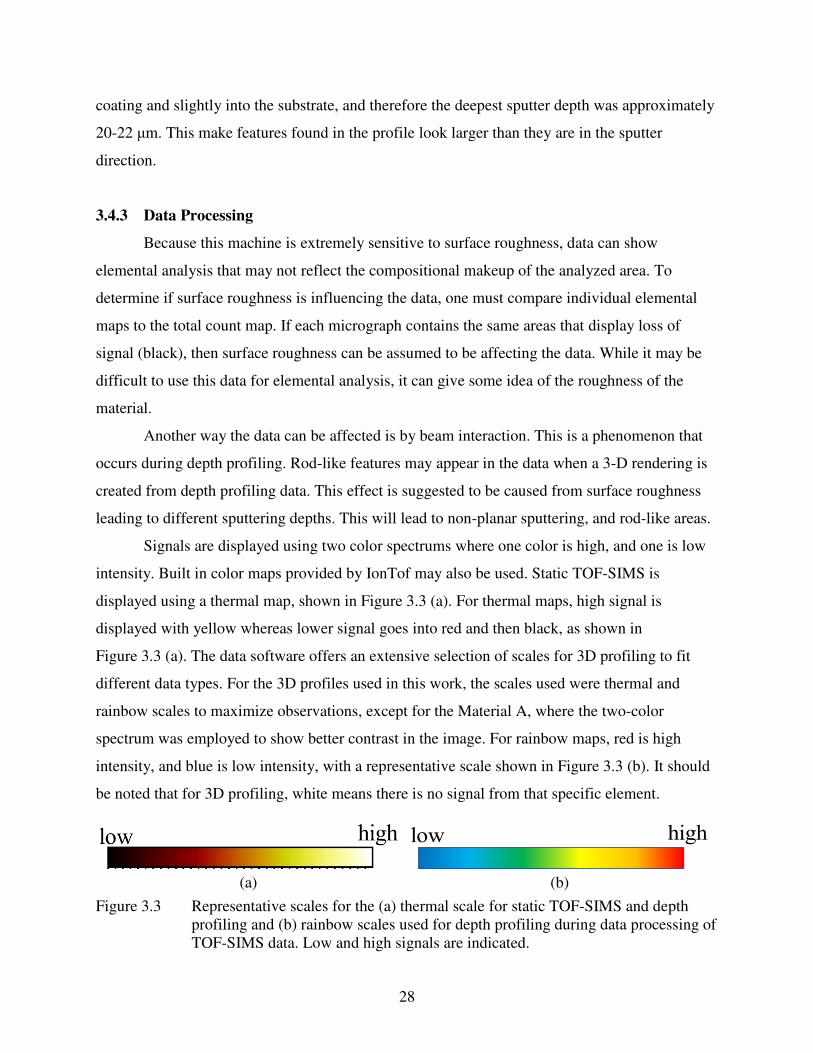
Signals are displayed using two color spectrums where one color is high, and one is low
intensity. Built in color maps provided by IonTof may also be used. Static TOF-SIMS is
displayed using a thermal map, shown in Figure 3.3 (a). For thermal maps, high signal is
displayed with yellow whereas lower signal goes into red and then black, as shown in
Figure 3.3 (a). The data software offers an extensive selection of scales for 3D profiling to fit
different data types. For the 3D profiles used in this work, the scales used were thermal and
rainbow scales to maximize observations, except for the Material A, where the two-color
spectrum was employed to show better contrast in the image. For rainbow maps, red is high
intensity, and blue is low intensity, with a representative scale shown in Figure 3.3 (b). It should
be noted that for 3D profiling, white means there is no signal from that specific element.
(a) (b)
Figure 3.3 Representative scales for the (a) thermal scale for static TOF-SIMS and depth
profiling and (b) rainbow scales used for depth profiling during data processing of
TOF-SIMS data. Low and high signals are indicated.

29
CHAPTER 4:
RESULTS AND DISCUSSION
4.1 Thermodynamic Analysis
Thermo-Calc® analysis was performed for all provided materials to generate Fe-O phase
diagrams. The composition of the phases described in the Fe-O diagrams are included in Table
4.1. Thermo-Calc® labels phase fields with the phases included in Table 4.1. The four oxides
are: spinel, corundum, fayalite and rhodonite. Spinel is an oxide with composition Me3O4,
however it can be a complex oxide as seen in Table 4.1. Corundum is an oxide with composition
Me2O3, and can also be complex depending on availability of solute. Fayalite and rhodonite are
strictly silicate oxides, where fayalite may have some Mn content, however rhodonite will only
have Mn. Only fayalite and rhodonite are silicate containing oxides. Sigma is an intermetallic,
and M6C is a carbide. It should be noted that Fe oxides (Fe3O4, Fe2O3) are not stable due to
typical annealing conditions that are used in industrial processes. However, all other alloying
elements may be subjected to oxidation. Low oxygen regimes are targeted to simulate the N2-H2
reducing atmosphere commonly used during industrial annealing of these steels and temperatures
up to 1000 °C were used to simulate annealing line temperatures. Ac1 and Ac3 temperatures were
taken from Thermo-Calc®. Because Material D was not provided with a carbon content, 0.1 wt
pct was assumed and used in this analysis.
Table 4.1 – Stoichiometry of Phases from Thermo-Calc®
Phase Stoichiometry
M6C (Fe)2(Mo)2(Fe,Si,Cr,Mo)2C
Sigma (Fe,Mn,Cr,Al)10(Cr,Mo)4(Fe,Si,Mn,Cr,Al,Mo)16
Spinel (Fe3+, Fe2+, Mn3+, Mn2+, Cr3+, Cr2+, Al3+)3(Fe2+, Mn2+, Cr2+)O42-
Corundum (Fe3+, Fe2+, Mn3+, Mn2+, Cr3+, Cr2+, Al3+)2(Fe3+, Cr3+)O32-
Fayalite Fe(Mn)SiO4
Rhodonite MnSiO4
An Fe-O phase diagram in the low mass percent O region is displayed in Figure 4.1 for
Material A using the composition listed in Table 3.1. Industrially relevant dew points ranging
from -30 to 10 °C are outlined in the hatched region. It is observed that corundum (Me2O3) is the
only thermodynamically favorable oxide within industrially relevant dew point conditions. As

30
oxidizing potential increases, spinel and fayalite become favorable below 815 °C; above this
temperature, rhodonite is the favorable oxide. Due to the low Si level within this steel, silicates
are not expected to form during annealing in low dew point conditions. The Ac1 is approximately
675 °C for this material, and the Ac3 is approximately 815 °C as observed from Thermo-Calc®.
Figure 4.1 Fe-O phase diagram for a 0.07 C-1.9 Mn-0.2 Si-0.3 Cr-0.026 Al (wt pct –
Material A) from Thermo-Calc®. Phases are described in Table 4.1. Enclosed
area represents a dew point range from -30 to 10 °C.
An Fe-O phase diagram in the low mass percent O region is shown in Figure 4.2 for
Material B. It is observed that the only thermodynamically favorable oxide within industrially
relevant dew points is corundum. This phase was predicted to be present at all analysis
temperatures. Higher oxidation potentials show that spinel and fayalite/rhodonite will be
favorable. Since this material was received as having an alloying content of 0.8 Cr/Mo
combined, it is important to consider changing the amounts of each of these elements. Three
different Fe-O diagrams with varied Cr-Mo levels are shown in Figure 4.2-4.4, with Cr content
increasing from 0.3 to 0.5 to 0.7 wt pct and balance Mo to a combined 0.8 wt pct Cr/Mo alloying
level.
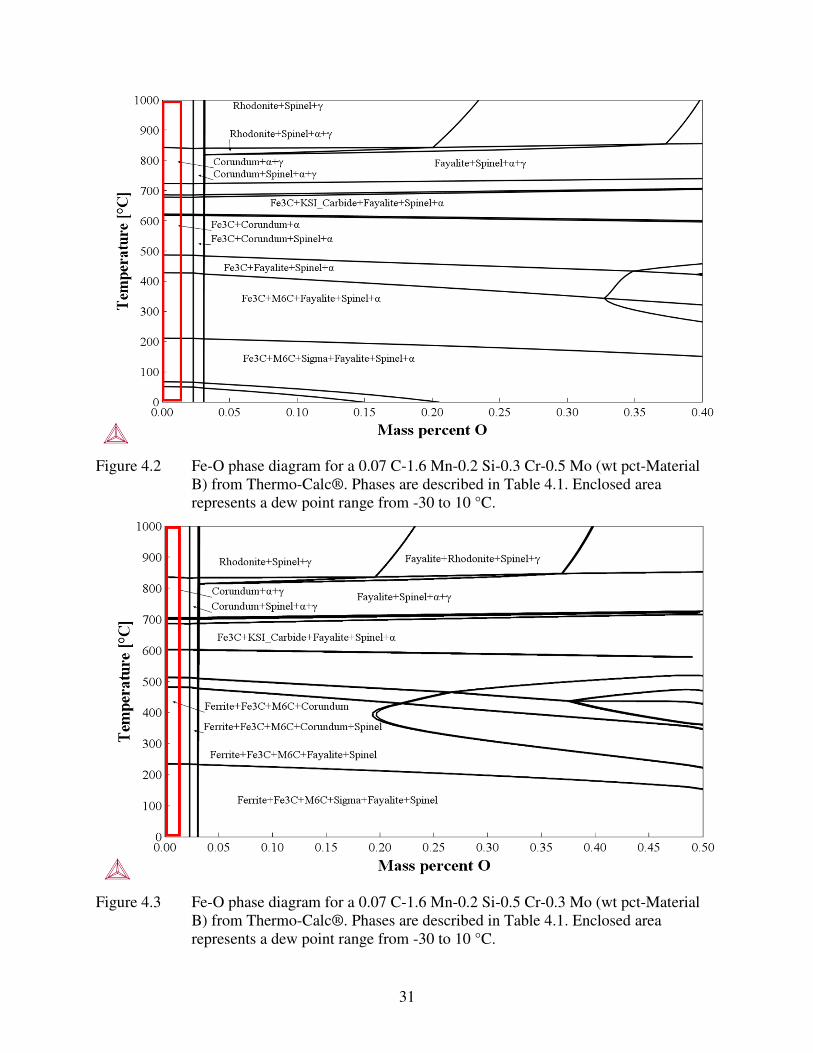
31
Figure 4.2 Fe-O phase diagram for a 0.07 C-1.6 Mn-0.2 Si-0.3 Cr-0.5 Mo (wt pct-Material
B) from Thermo-Calc®. Phases are described in Table 4.1. Enclosed area
represents a dew point range from -30 to 10 °C.
Figure 4.3 Fe-O phase diagram for a 0.07 C-1.6 Mn-0.2 Si-0.5 Cr-0.3 Mo (wt pct-Material
B) from Thermo-Calc®. Phases are described in Table 4.1. Enclosed area
represents a dew point range from -30 to 10 °C.

32
Figure 4.4 Fe-O phase diagram for a 0.07 C-1.6 Mn-0.2 Si-0.7 Cr-0.1 Mo (wt pct-Material
B) from Thermo-Calc®. Phases are described in Table 4.1. Enclosed area
represents a dew point range from -30 to 10 °C.
It is suggested from these figures that the Cr-Mo levels do not affect the favorable oxide type
present, however it can influence the oxide composition due to the presence of Cr in corundum.
The Ac1 for this material is approximately 685 °C and the Ac3 is approximately 830 °C for a
composition containing 0.5 Cr and 0.3 Mo, and does not change between other Cr-Mo contents.
Due to similar material compositions between Material A-C, the favorable oxide for all
industrially relevant dew points for Material C is also corundum, as shown in Figure 4.5. Spinel
and fayalite are favorable as the oxidizing potential increases. Increasing temperature above the
Ac1 (695 °C) leads to rhodonite becoming a thermodynamically favorable oxide over fayalite at
higher oxidizing potentials. The Ac3 for this material is approximately 855 °C. This material has
the lowest alloying of any received material, making it the least likely to selectively oxidize
during annealing. If this material was to experience higher oxidizing potentials in e.g. the slab
reheating furnace of the hot mill, the risk for fayalite and rhodonite formation is still prevalent.

33
An Fe-O phase diagram for Material D in the low oxygen mass percent region is shown
in Figure 4.6. This phase diagram shows that fayalite is the stable phase within industrially
relevant dew points below the Ac1 temperature (690 °C). Above the Ac1, the stable oxide phase
is rhodonite. These oxides are known to be deleterious for coating processes, due to their
negative effects on zinc wettability [6, 12]. Because fayalite and rhodonite are
thermodynamically favorable industrially, it is important to analyze the oxidation mechanism as
a function of annealing conditions. Information about annealing conditions leading towards
internal oxidation would be important to know as literature has shown that internal oxidation
may help reduce or eliminate coating defects related to zinc wettability [11].
Figure 4.5 Fe-O phase diagram for a 0.07 C-1.23Mn-0.2 Si-0.029 Cr-0.047 Al
(wt pct-Material C) from Thermo-Calc®. Phases are described in Table 4.1.
Enclosed area represents a dew point range from -30 to 10 °C.

34
Figure 4.6 Fe-O phase diagram for a 0.1 C-1.6 Mn-0.6 Si-0.35 Cr (wt pct - Material D) from
Thermo-Calc®. Phases are described in Table 4.1.
Calculations were performed using the Wagner analysis outlined in the literature review
section (section 2.2). The values used for oxide stability analysis on ferrite and austenite are
shown in Table 4.2 and Table 4.3 respectively [4], [23]. All calculations were performed
assuming an N2-5 vol pct H2 atmosphere; two temperatures, 700 and 750 °C for α, 850 and
900 °C for γ, were chosen for both phases. Diffusion of Cr and Mn are significantly higher in
ferrite than austenite; however, Si diffusion is faster in austenite as shown by the diffusivity
values in Table 4.2 and 4.3. Due to the faster diffusion of Si in austenite, there is a higher
probability of fayalite (Fe2SiO4) formation at higher inter-critical annealing temperatures. To
better visualize when the transition from external to internal oxidation may occur, Figure 4.8 was
created, which plots dew point (°C) against atomic percent of alloying element derived from the
Wagner analysis. To use these plots, follow the atomic percent of the alloying element of interest
(Mn, Si or Cr) and when the prediction line specific to that element is reached, the corresponding
dew point is the dew point at which oxidation will change from external to internal as the dew
point is farther increased.
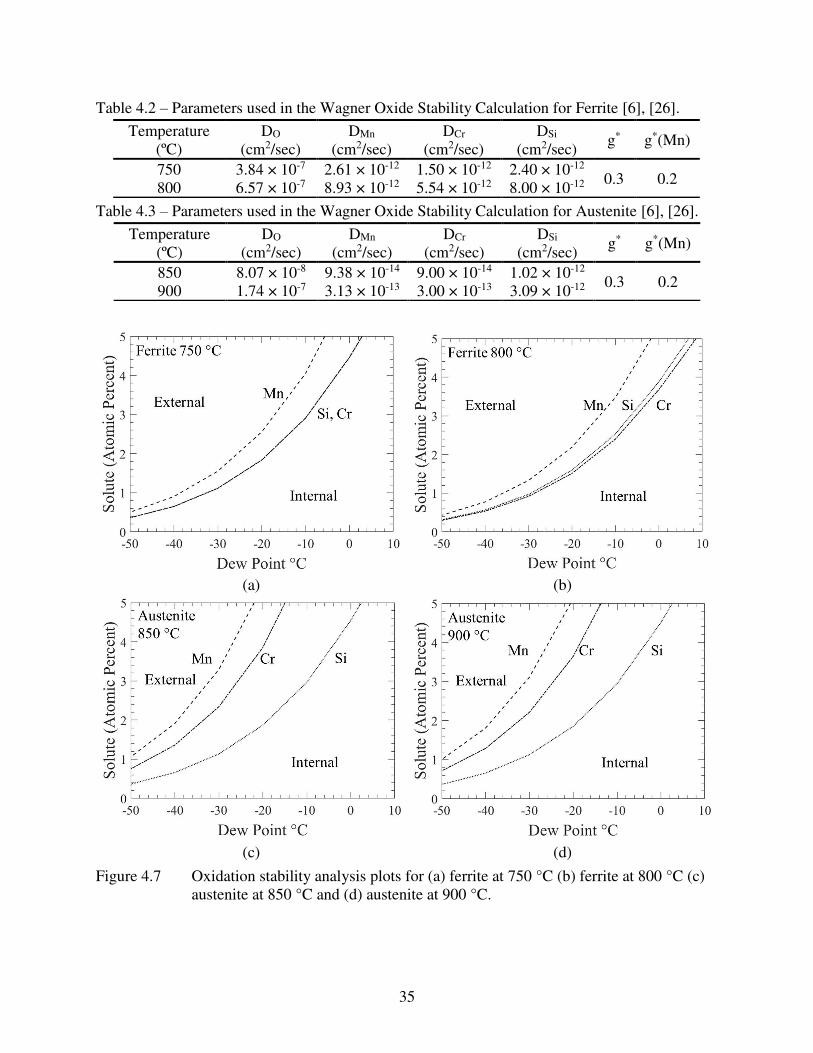
35
Table 4.2 – Parameters used in the Wagner Oxide Stability Calculation for Ferrite [6], [26].
Temperature
(ºC)
DO
(cm2/sec)
DMn
(cm2/sec)
DCr
(cm2/sec)
DSi
(cm2/sec) g* g*(Mn)
750 3.84 × 10⁻⁷ 2.61 × 10⁻¹² 1.50 × 10⁻¹² 2.40 × 10⁻¹² 0.3 0.2
800 6.57 × 10⁻⁷ 8.93 × 10⁻¹² 5.54 × 10⁻¹² 8.00 × 10⁻¹²
Table 4.3 – Parameters used in the Wagner Oxide Stability Calculation for Austenite [6], [26].
Temperature
(ºC)
DO
(cm2/sec)
DMn
(cm2/sec)
DCr
(cm2/sec)
DSi
(cm2/sec) g* g*(Mn)
850 8.07 × 10⁻⁸ 9.38 × 10⁻¹⁴ 9.00 × 10⁻¹⁴ 1.02 × 10⁻¹² 0.3 0.2
900 1.74 × 10⁻⁷ 3.13 × 10⁻¹³ 3.00 × 10⁻¹³ 3.09 × 10⁻¹²
(a) (b)
(c) (d)
Figure 4.7 Oxidation stability analysis plots for (a) ferrite at 750 °C (b) ferrite at 800 °C (c)
austenite at 850 °C and (d) austenite at 900 °C.

36
External oxidation is predicted with high alloying elemental levels and low dew points.
Higher dew points and less alloying will promote internal oxidation. Cr and Si are faster than Mn
and could pose a higher probability for external oxidation. Faster Si diffusion in austenite does
increase the chance of fayalite forming at higher annealing temperatures. For all materials,
austenite offers a greater probability of internal oxidation, and shows minimal change with
respect to temperature. This is because diffusivities of Mn and Cr are lower in austenite than
ferrite, however, Si diffusivity is quite comparable in both phases. This suggests that if external
oxidation is to be avoided, the austenite regime should be targeted.
From Figure 4.7, it is seen that the type of phase of the steel has a large effect on the
transition from external to internal oxidation. During intercritical annealing, both phases will be
present, making analysis of each phase important. Ferrite exhibits greater diffusivities of Mn and
Cr solutes, leading to higher probability of external oxidation over a wider range of dew points.
Austenite exhibits smaller diffusivities of Mn and Cr solutes, but Si diffusivity is slightly greater.
With Si and Cr having greater diffusivities, higher contents of these elements may pose a greater
probability of external oxidation [6]. However, the relative additions of Mn are larger than Si and
Cr in the provided materials, suggesting that Mn may pose a higher probability of external
oxidation. Cr is shown to have the greatest diffusivity in ferrite, leading to a greater probability
of external oxidation; however, Cr has been shown to mix with Mn oxides to form a Mn-Cr
spinel when H2O acts as the main oxidizing gas [28]. This spinel has been shown to increase
wettability of Zn due to its reactivity to Al in the Zn bath [28]. The Cr additions for the received
materials are below that amount seen in literature associated with Mn-Cr spinel formation for
intercritical annealing temperatures. The only material that could exhibit this behavior is
Material B, as the Cr levels could be higher than 0.6 wt pct depending on alloying. Zinc bath Al
contents are higher in GI coating processes as well as the Fe-Al inhibition layer is promoted to
form to inhibit Fe-Zn interdiffusion. This mechanism however would be deleterious for GI
coatings as the Al would react with the spinel as opposed to Fe, leading to increased Fe-Zn
interdiffusion.
Corundum (Me2O3) was the only stable oxide for Materials A-C, suggesting that the Si
levels are low enough that silicates should be avoided entirely in those materials during
annealing. This same phenomenon can be observed in oxide stability calculations as Si levels are
low enough for Materials A-C that internal oxidation is predicted throughout the considered dew
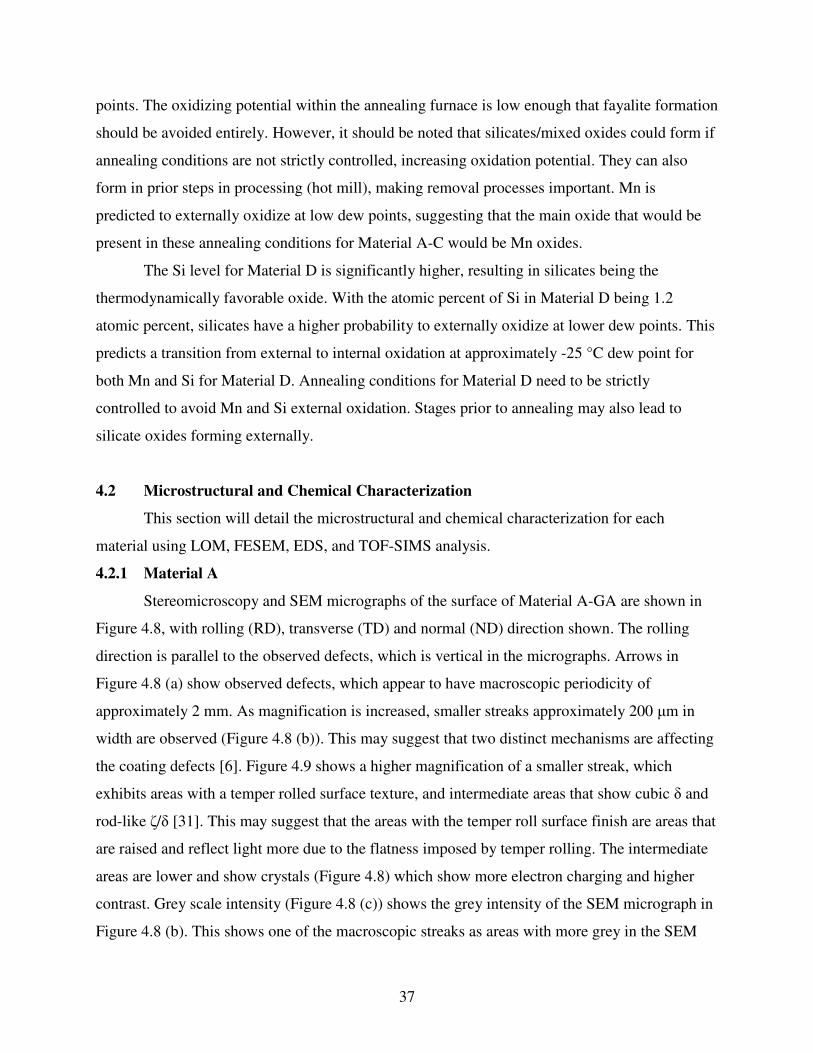
37
points. The oxidizing potential within the annealing furnace is low enough that fayalite formation
should be avoided entirely. However, it should be noted that silicates/mixed oxides could form if
annealing conditions are not strictly controlled, increasing oxidation potential. They can also
form in prior steps in processing (hot mill), making removal processes important. Mn is
predicted to externally oxidize at low dew points, suggesting that the main oxide that would be
present in these annealing conditions for Material A-C would be Mn oxides.
The Si level for Material D is significantly higher, resulting in silicates being the
thermodynamically favorable oxide. With the atomic percent of Si in Material D being 1.2
atomic percent, silicates have a higher probability to externally oxidize at lower dew points. This
predicts a transition from external to internal oxidation at approximately -25 °C dew point for
both Mn and Si for Material D. Annealing conditions for Material D need to be strictly
controlled to avoid Mn and Si external oxidation. Stages prior to annealing may also lead to
silicate oxides forming externally.
4.2 Microstructural and Chemical Characterization
This section will detail the microstructural and chemical characterization for each
material using LOM, FESEM, EDS, and TOF-SIMS analysis.
4.2.1 Material A
Stereomicroscopy and SEM micrographs of the surface of Material A-GA are shown in
Figure 4.8, with rolling (RD), transverse (TD) and normal (ND) direction shown. The rolling
direction is parallel to the observed defects, which is vertical in the micrographs. Arrows in
Figure 4.8 (a) show observed defects, which appear to have macroscopic periodicity of
approximately 2 mm. As magnification is increased, smaller streaks approximately 200 μm in
width are observed (Figure 4.8 (b)). This may suggest that two distinct mechanisms are affecting
the coating defects [6]. Figure 4.9 shows a higher magnification of a smaller streak, which
exhibits areas with a temper rolled surface texture, and intermediate areas that show cubic δ and
rod-like ζ/δ [31]. This may suggest that the areas with the temper roll surface finish are areas that
are raised and reflect light more due to the flatness imposed by temper rolling. The intermediate
areas are lower and show crystals (Figure 4.8) which show more electron charging and higher
contrast. Grey scale intensity (Figure 4.8 (c)) shows the grey intensity of the SEM micrograph in
Figure 4.8 (b). This shows one of the macroscopic streaks as areas with more grey in the SEM

38
micrograph corresponding to the raised areas associated with the streak. This analysis shows the
streak to be approximately 1.5 mm in width.
The microstructures of the substrate of Material A for the longitudinal and transverse
cross-sections are shown in Figure 4.10. A dual-phase microstructure of intercritical ferrite and
martensite can be seen. Bainite is also seen Figure 4.10 (c). Longitudinal SEM micrographs of
the GA coating on Material A are shown in Figure 4.11. A GA coating thickness of 15 ± 2 μm
was measured based on Figure 4.11(a), with the black concentric circles being an SEM artefact.
It is observed that there is a large variation (Figure 4.11 (b)) in coating thickness ranging from
30 μm to 15 μm seen in Figure 4.11 (a). It should also be noted that the coating-steel interface is
wavy. Transverse orientations proved difficult to polish, and employment of the FIB would be of
use for future work.
(a)
(b) (c)
Figure 4.8 A stereomicroscope image showing the galvannealed surface of Material A
containing defects (a) with streaks indicated by the arrows, (b) an SEM
micrograph of an area showing the streaks, (c) a grey scale intensity profile
showing the raised area of a surface defect. Adapted from [6].

39
Figure 4.9 SEM micrograph showing areas with a temper rolled surface finish, with
intermediate areas that exhibit cubic delta and rod-like zeta Zn-Fe intermetallic
crystals.
EDS was performed on the area enclosed area on Figure 4.11 (b) to characterize the Fe-
Zn intermetallic phases within the galvannealed coating. The phases expected to be present are δ
and Γ phase; depending on the annealing conditions, ζ phase may also be present. This is due to
the annealing step that allows Fe and Zn interdiffusion. EDS maps for Material A are shown in
Figure 4.12 (b) for Zn, (c) for Fe. Figure 4.12 (d) shows where the software identified the delta
phase, with delta phase being green, and black being no presence of delta phase. The Genesis
software characterized δ phase being the predominant microstructural phase in the coating, with
approximately 10 wt pct Fe. Though EDS mapping did not characterize the Γ phase, it is still
expected to be present at the steel-coating interface, and some Zn depletion is seen near the
substrate/coating interface. Zn mapping was uniform throughout the coating. There appears to be
areas in the coating with a different phase, shown in the Zn and delta phase signal, however these
areas line up well with cracks in the coating. This feature may relate to the loss of signal due to
the crack in the coating.
TOF-SIMS surface spectra of Material A were collected on the smaller streaks on the
order of approximately 200 μm within the larger streaking defects. This was done to determine if
the nature of the streaks is the same. Static SIMS micrographs are shown in Figure 4.13. It

40
should be noted that the scale for each element is different due to abundance of the element as
well as how the element accelerates in the TOF-SIMS. The means that the numbers in the scales
cannot be compared to other elements and are only a relative local intensity for that element. For
static SIMS analysis, surface roughness can negatively affect signal, and needs to be considered
when processing the data. To determine if surface roughness is influencing the data, surface
spectra of different elements are compared. If zero signal is analyzed in the same area for each
element, surface roughness is having an effect as signal cannot be collected in this area. This is
not present in this data, suggesting that surface roughness has limited influence.
(a) (b)
(c)
Figure 4.10 SEM micrographs of (a)-(b) the cross-section of Material A showing a dual-phase
microstructure of intercritical ferrite and martensite with some bainite and (c) a
transverse cross-section bainite. The orientation of the micrograph is shown.

41
(a) (b)
Figure 4.11 SEM micrograph for a longitudinal cross-section of the GA coating on Material A
GA. (b) shows large variability in coating thickness and the area where EDS was
performed. The normal, rolling and transverse direction of the sheet are shown.
(a) (b)
(c) (d)
Figure 4.12 EDS mapping of the GA coating on Material A with (a) an SEI image of the
analyzed area (b) Zn map (c) Fe map and (d) δ phase map. The substrate is on the
bottom of the micrographs. This area was taken from Figure 4.12 (b).
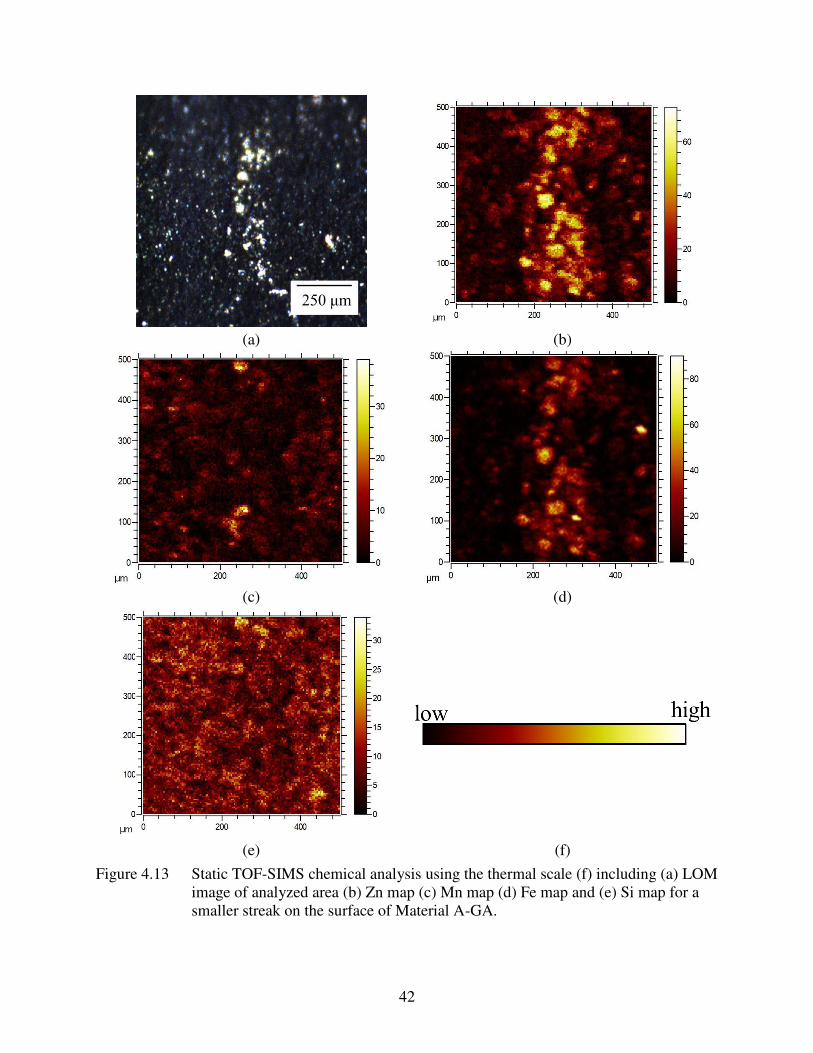
42
(a) (b)
(c) (d)
(e) (f)
Figure 4.13 Static TOF-SIMS chemical analysis using the thermal scale (f) including (a) LOM
image of analyzed area (b) Zn map (c) Mn map (d) Fe map and (e) Si map for a
smaller streak on the surface of Material A-GA.

43
It is seen in Figure 4.13 that the Fe and Zn spectra match up well, suggesting that the
streaks are a Fe-Zn intermetallic. Mn and Si signals are shown to be in the areas that are lower in
Zn and Fe. To analyze the chemical influence on the coating and inter-diffusional layer, 3D-
profiling using TOF-SIMS was employed to profile through a defect in the material to analyze
the chemical signal below. This was performed on the same streak seen in Figure 4.13 with the
cross-sectional analysis using 3D profiling shown in Figure 4.14.
(a) (b)
(c) (d)
Figure 4.14 TOF-SIMS chemical analysis using a two color spectrum scale on Material A-GA
in an area with a defect (a) Fe map showing Fe diffusion into the coating (b) Zn
map showing the absence of bare spots (c) Mn showing high levels at the steel-
coating interface in half spherical arrangement and (d) Si map showing high
levels at the steel-coating interface in half spherical arrangement.

44
The two-color spectrum scale is employed for this figure. For Fe, light blue is higher
signal, where black is lower signal. For Zn, light green is high signal, black is lower signal, and
white is no signal. For Mn, blue is higher signal, black is lower signal, and white is no signal. For
Si, red is higher signal, black is lower signal, and white is no signal. The scale bars included in
Figure 4.14 are only valid in the horizontal direction as discussed in section 3.4.2. From Figure
4.14 (a)-(b), it is observed that Fe and Zn concentrate in the same areas, as well as are deficient
in the same areas. This suggests that the same phase is present in most of the coating. The lower
signal of Fe and Zn might be due to the presence of Mn and Si in the coating. Because Si is
soluble in delta up to 1 wt pct and exhibits no solubility in zeta, it is suggested that the areas with
low Si might be zeta phase, however Fe and Zn signals do not corroborate this [31]. This is
because zeta phase is a high Zn phase, and areas without Si show higher signals of Fe. It is then
suggested that the coating is delta due to the range of solubility of Si. High levels of Mn and Si
signals are observed at the coating-steel interface. The Mn-Si rich areas appear to be globular in
nature suggesting that there are Mn rich Si containing oxides present on the surface of the steel.
Though TOF-SIMS does not quantify the relative elemental amounts, it can be suggested that the
oxides would be Mn rich due to the large alloying additions of Mn (1.9 wt pct) and the low Si
content (0.2 wt pct) of the steel. It is seen that there is no signal for Si and Mn in some areas of
the coating as well, observed as white areas. It is possible that the Si and Mn content in the
coating is due to the aluminothermic reduction of Mn-rich Si containing oxides [26]. It is also
possible to have differences in Mn and Si interdiffusion into the coating from the substrate, when
for example an oxide is encountered, and solute diffusion is halted. It should be noted that no
bare spots were observed, suggesting that the Mn rich oxides were wettable. Mahieu et al. have
shown that globular Mn rich oxides are more readily wettable and can be incorporated into the
Zn coating [32].The absence of bare spots indicates that the defects are “cosmetic” in nature and
likely not related to limited wettability. However, it is suggested that these oxides affect the
formation and growth of intermetallic layers (Fe-Zn-Al) formed during GA processes. These
oxides can inhibit Fe-Zn interdiffusion, leading to areas with increased thickness due to more
opportunity for Fe-Zn interdiffusion. Referring to Wagner’s theory of oxidation presented in the
previous chapter, Mn oxidation is possible at low dew point annealing conditions, however Si
oxidation was predicted to be internal [6]. This discrepancy may be due to the nature of the

45
oxide, in which it is a complex oxide and Wagner’s theory of oxidation only accounts for binary
oxide systems.
In order to determine where in the process the oxides observed in Figure 4.14 are
forming, chemical analysis of the bare material was performed. Static SIMS spectra for bare
Material A is shown in Figure 4.15. Elemental analysis of Mn and Si shows uniformity,
suggesting that the oxides/defects formed on Material A are formed after pickling and cold
rolling. This would suggest that these oxides/defects are formed during the annealing/coating
process.
(a) (b)
Figure 4.15 TOF-SIMS surface spectra for (a) Mn and (b) Si on the cold rolled bare Material
A. Elements are shown to be uniformly distributed [6].
Due to the periodicity of the defects shown in Figure 4.8 (a) along with the Mn rich Si
containing oxides found on the steel-coating interface, it can be suggested that two mechanisms
are affecting the GA coating defects that form on Material A [6]. The first mechanism has been
shown to be Mn rich Si containing oxides affecting Fe-Zn interdiffusion and intermetallic
formation and the resulting coating thickness [6]. This is due to the effect the oxides have on Fe-
Zn interdiffusion. These oxides, however, do not appear to affect wettability as Zn coverage is
observed above the oxides and bare spots appear absent. The coating thickness variation and
wavy steel/coating interface may relate to the presence of these oxides. As indicated by
Figure 4.11, the streaks may develop resulting from coating thickness variations and response to
temper rolling. Coating thickness variation can also be affected by the availability of Zn to the
substrate during the hot-dip operation. A schematic of an HDG zinc pot is shown in Figure 4.16.
46
The zinc pot sink roll guides the steel strip through the zinc pot and has a micro-grooved surface
to provide sufficient friction to inhibit slipping. The zinc pot sink roll micro-grooved surface
shown in Figure 4.16 (b) has a pitch of approximately 2 mm [31]. Details of the sink roll and
HDG configuration were not provided by the supplier of Material A, but it is interesting to note
that the periodicity and distance between the streaks on Material A appear of the same magnitude
as the sink roll micro-grooves [31]. It has been suggested that the grooves of the sink roll can
degrade the formed intermetallic layers during galvanizing, leading to areas of the strip that will
experience increased Fe-Zn interdiffusion, which results in areas with greater coating
thicknesses [31]. This is due to the sink roll degrading areas of formed intermetallics, as well as
affecting Zn availability to areas of the sheet in contact with the roll. Therefore, it is suggested
that Material A’s surface exhibits areas that are raised and have a temper roll surface finish,
along with intermediate areas that are lower, and have cubic delta and rod-like zeta crystals [6].
The areas associated with the temper roll surface finish may be in areas that were not affected by
the micro-grooved surface of the zinc pot sink roll.
(a) (b)
Figure 4.16 (a) a zinc pot schematic showing the location of the sink roll and (b) the micro-
grooved surface of a zinc pot sink roll. Adapted from [9],[31] .

47
4.2.2 Material B
Stereomicroscopy and SEM micrographs of the GI surface of Material B are shown in
Figure 4.17. The defect on the surface of Material B is observed to be an acne type defect where
half spherical and other shaped particles are present on the top of the coated surface. Smaller
particles on the surface of the large particle are also observed in Figure 4.17. The rolling
direction is vertical in the two micrographs. Microstructural characterization of the substrate of
Material B is included in Figure 4.18. A longitudinal cross-section is shown in Figure 4.18 (a)
and the transverse cross-section is seen in Figure 4.18 (b). A dual-phase microstructure of
intercritical ferrite and martensite is shown. More ferrite in Material B than in Material A is
likely indicative of a lower intercritical annealing temperature or annealing time and/or alloying
effects. There is little to no bainite within the microstructure of Material B. The GI coating can
be observed in Figure 4.19, with a measured thickness of 8.0 ± 0.5 μm.
(a) (b)
Figure 4.17 LOM image of (a) a surface defect on Material B and (b) an SEM micrograph of
one of the surface defects at a higher magnification.
EDS on Material B was performed to determine Zn and Zn-Fe intermetallics formations within
the coating and results are included in Figure 4.20. The expected intermetallic phases are zeta
and possibly eta phase, as this material was galvanized, as well as an Al containing inhibition
layer [9]. The coating is predominantly zeta phase (red), with Al segregation to the steel-coating
interface (orange). This shows the presence of the Al inhibition layer as Al is segregated to the
steel/coating interface. During EDS mapping, some sample drift occurred, resulting in a much

48
thicker inhibition layer imaged than present. Khondker et al. performed glow discharge optical
emission spectrometry on samples of DP steel with Fe-Al-Zn inhibition layers and showed its
thickness to be between 0.3 and 0.5 μm [33]. Due to sample drift it is difficult to determine the
thickness of the observed inhibition layer in Figure 4.20, however an estimation can be made; the
estimated thickness for the inhibition layer is less than 1 μm.
(a) (b)
Figure 4.18 SEM micrographs shown for the (a) longitudinal and (b) transverse cross-section
of Material B. The normal, transverse and rolling directions of the sheet are
shown.
(a) (b)
Figure 4.19 SEM micrographs showing the coating thickness for the (a) and (b) GI coating on
Material B. The coating was found to be 8 ± 0.5 μm.
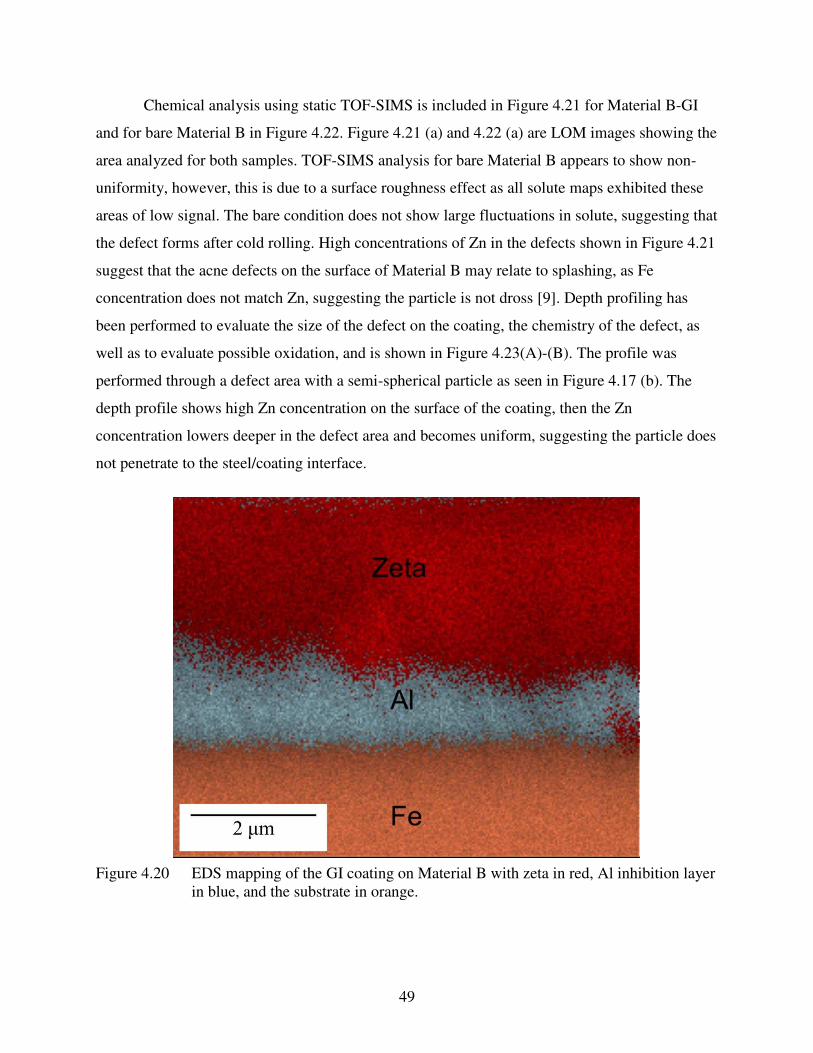
49
Chemical analysis using static TOF-SIMS is included in Figure 4.21 for Material B-GI
and for bare Material B in Figure 4.22. Figure 4.21 (a) and 4.22 (a) are LOM images showing the
area analyzed for both samples. TOF-SIMS analysis for bare Material B appears to show non-
uniformity, however, this is due to a surface roughness effect as all solute maps exhibited these
areas of low signal. The bare condition does not show large fluctuations in solute, suggesting that
the defect forms after cold rolling. High concentrations of Zn in the defects shown in Figure 4.21
suggest that the acne defects on the surface of Material B may relate to splashing, as Fe
concentration does not match Zn, suggesting the particle is not dross [9]. Depth profiling has
been performed to evaluate the size of the defect on the coating, the chemistry of the defect, as
well as to evaluate possible oxidation, and is shown in Figure 4.23(A)-(B). The profile was
performed through a defect area with a semi-spherical particle as seen in Figure 4.17 (b). The
depth profile shows high Zn concentration on the surface of the coating, then the Zn
concentration lowers deeper in the defect area and becomes uniform, suggesting the particle does
not penetrate to the steel/coating interface.
Figure 4.20 EDS mapping of the GI coating on Material B with zeta in red, Al inhibition layer
in blue, and the substrate in orange.

50
There is no Fe or Cr signal in the defect as observed by Figure 4.21 (a), suggesting that
the defect is due to splashing, as wettability and growth of the coating are not affected. Splashing
is a mechanism in which the air knife conditions affect the coating surface finish. No Fe signal
was detected from the coating, which is expected for a GI coating. There appears to be no
external oxidation of the steel. However, it appears that Mn, Cr, and Si are segregated near the
surface of the steel, suggesting the presence of an internal oxide is possible. Internal oxidation
frequently presents itself as grain boundary decoration, however the resolution of the scan would
not show grain boundary decoration and would instead show a uniform layer. Another
observation from Figure 4.23(A) is the formed inhibition layer. This is observed from the Fe and
Zn signal, as Fe shows a uniform layer just above the substrate, and the Zn signal shows a higher
concentration in the same area. As suggested by Mahieu et al., the inhibition layer can have a
certain concentration of Zn, leading to a stoichiometry of Fe2Al5-xZnx instead of the traditional
Fe2Al5 composition [32]. This is the suggested mechanism for why the Zn signal increases near
the substrate. Al is added to the bath to increase bath fluidity and to change the chemistry of
dross (Fe-Zn) particles to include Al, making them less dense than molten Zn, allowing for
flotation and subsequent skimming of the Al containing dross [32]. Dross floating on the top of
the Zn pot is so-called “top dross” where dross that sinks to the bottom of the pot is referred to as
“bottom dross”. From Thermo-Calc® and Wagner calculations presented in the previous chapter,
it is shown that this alloy could experience external oxidation of Mn at low dew points (-30 °C
dew point) with the oxide being corundum. Si and Cr were predicted to internally oxidize. Due to
chemical and microstructural information, the defect formation is not fully concluded, however it
appears that it is a function of processing conditions, like the air knife and line speeds. It was
mentioned by the supplier that the preceding and following coil did not exhibit coating defect. It
is unclear if the coils preceding and following this material were the same as the material in this
work.
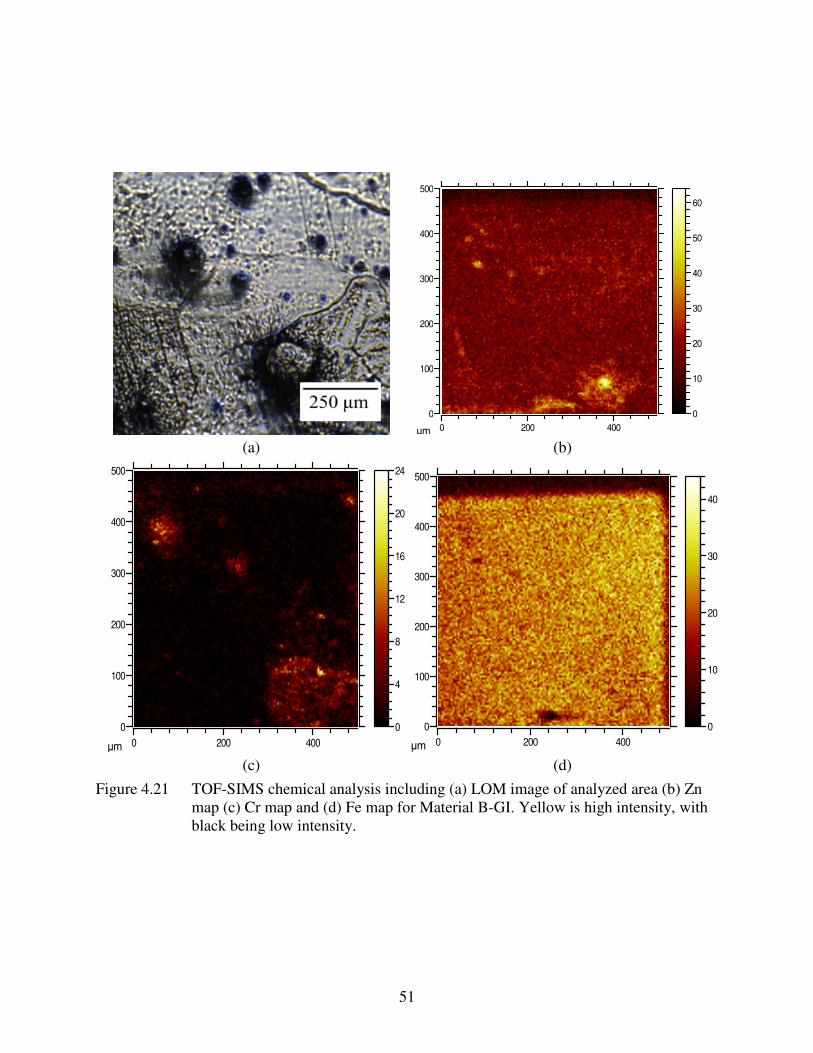
51
(a) (b)
(c) (d)
Figure 4.21 TOF-SIMS chemical analysis including (a) LOM image of analyzed area (b) Zn
map (c) Cr map and (d) Fe map for Material B-GI. Yellow is high intensity, with
black being low intensity.
μmμm
μm
500
400
300
200
100
0
4002000μm
60
50
40
30
20
10
0
μmμm
∙10
μm
μm
μm μm μm
∙10
μm
∙10
μmμm
μm
μm
μmμm
∙10 500
400
300
200
100
0
4002000μm
24
20
16
12
8
4
0
μm
μm μm μm
∙10
μm
∙10
μmμm
μm
μm
μmμm
∙10
μm
500
400
300
200
100
0
4002000μmFe+
40
30
20
10
0
μm μm μm
∙10
μm
∙10

52
(a) (b)
(c) (d)
Figure 4.22 TOF-SIMS chemical analysis including (a) LOM image of analyzed area (b) Fe
map (c) Mn map and (d) Cr map for bare (uncoated) Material B. Yellow is high
intensity and black is low intensity.
500
400
300
200
100
0
4002000μmFe+
2∙10
1.6
1.2
0.8
0.4
0.0

53
(a) (b)
(c) (d)
(e) (f)
Figure 4.23(A) TOF-SIMS depth profiling analysis including (a) Fe map (b) Zn map (c) Mn
map (d) Si map and (e) Cr map and (f) Al map for Material B-GI.

54
(e)
Figure 4.23(B) Scales for each color map are included in (e) where the thermal scale is the top
scale, and the rainbow scale is the bottom scale.
4.2.3 Material C
Material C was provided from a single coil, with one end exhibiting defects, and one end
exhibiting no visible defects in the coating. The as received ends of the coil are shown in
Figure 4.24. The defect on this material was described as flame pattern on one end of the coil.
The end of the coil with sufficient coating will be referred to as End A, the end of the coil
exhibiting defects will be denoted End B. Stereomicrographs are shown in Figure 4.25 with a
box showing an example of the flame defects. From these, some of the defects can be seen,
however it is difficult to distinguish them in the images. To characterize the defects on the
surface of Material C further, SEM analysis was performed. LOM and SEM micrographs of End
A are shown in Figure 4.26 (a)-(b) respectively, micrographs of End B are included in Figure
4.26 (c)-(d). From Figure 4.26, it can be observed that on both ends, there are areas that exhibit a
flat, temper rolled surface finish, with intermediate areas exhibiting depressed areas that contain
Zn-Fe intermetallic crystals. However, it can also be observed that End B contains a greater
amount of depressed areas that have Fe-Zn intermetallic crystals. This suggests that there may be
a factor affecting coating growth in some areas. It should be noted further that no bare areas are
apparent, and the defects are therefore again “cosmetic” in nature.
Another factor that could be influencing the defects is the degree of cold reduction
response to temper rolling post-coating. If the degree of cold reduction is different, it might
suggest that the temper rolling process is not able to lessen the extent of coating defects for one
end of the coil. To verify if there is a difference in temper rolling response, hardness values were
measured using Vickers hardness testing on cross-section of each end polished to 1 μm and
100 g load with 6 measurements per end of coil. It was found that the hardness for End A was

55
197 ± 0.5 HV and End B was 189 ± 0.4 HV. This difference is small but appears statistically
meaningful. The HV difference may show that the temper rolling process is not able to uniformly
roll the coil, leading to defects on one end, and a defect free appearance on the other end. The
thickness of the two coils may also give insight into the temper roll response of the strip. Each
condition for both ends of the coil was measured using a micrometer. It was found that the two
ends of the coils were the same thickness after coating and temper rolling, with thickness being
0.710 ± 0.005 mm. The thickness of bare End A was found to be 0.729 ± 0.004 mm, and the
thickness of bare End B was found to be 0.725 ± 0.004 mm.
(a) (b)
Figure 4.24 Photographs of as-received Material C showing (a) End (scratches and marks are
from shipping) and (b) End B. The box is an example of the flame pattern defect.
The steel substrate microstructures of each end were imaged using SEM analysis. End A
microstructure is shown in Figure 4.27 (a)-(b), End B microstructure is shown in
Figure 4.27 (c)-(d). It is observed from Figure 4.28 that the structure of both ends is ferrite with
pearlite colonies. The grain size of each end in the bulk is comparable. The only difference in
grain size is near the coating. It is observed that larger grains with less pearlite colonies are
apparent near the surface of the coating of End B as shown in Figure 4.28. This could be due to
decarburization of the sample and could affect nucleation and growth of the coating due to
texture effects [18]. The coating of End A and End B were imaged using SEM analysis and are
shown in Figure 4.29. Both ends of the coil have a wavy surface, and the coating for End B was
prepared with a slight etch using nital, resulting in the pits in the coating. It was observed that
the coating for End A is 7.5 ± 1.2 μm and the thickness for the coating on End B is

56
12.0 ± 0.7 μm. This may suggest that the temper rolling process is non-uniform, leading to End
A having a thinner coating, and End B having a thicker coating. Because of the difference in
coating thickness, it is speculated that the degree of temper rolling for End B is lower and is not
enough to smear the differences in coating growth, as seen in End A. EDS showed that delta
phase was the predominant phase present in the coatings, for both ends as shown in Figure 4.30.
Gamma phase was also characterized to be present.
(a) (b)
(c) (d)
Figure 4.25 Stereomicroscope images of (a) coated Material C showing a defect free coating
(b) bare Material C of the end of the coil producing defect free coatings (c) coated
Material C exhibiting defects as outlined (d) bare Material C on the end of the coil
producing surface defects.

57
(a) (b)
(c) (d)
Figure 4.26 LOM and SEM micrographs of (a) and (b) showing coated Material C showing a
defect free coating and (c) and (d) coated Material C exhibiting defects.
Thermo-Calc® analysis suggests that during annealing, only the corundum phase is
stable, meaning deleterious Si oxides were not suggested to form. From Wagner calculations, it
is shown that during annealing, this steel should exhibit internal oxidation of Mn, Si and Cr
above a dew point of -40 °C. Only Mn is predicted to externally oxidize within dew points that
can be achieved during testing/industrial processing, which correlates with Thermo-Calc®
analysis as the corundum phase contains Mn. During chemical characterization, it will be
determined if oxidation matches with Wagner and Thermo-Calc®, as well as if it affects the
coating defect formation.

58
(a) (b)
(c) (d)
Figure 4.27 SEM micrographs of (a) and (b) Material C End A microstructure showing ferrite
and pearlite and (c) and (d) Material C-End B microstructure showing ferrite and
pearlite. All micrographs are for coated material. Etch with 1% nital.

59
Figure 4.28 SEM micrograph of End B-Material C showing large grains and less pearlite near
the substrate interface, possibly due to decarburization. Etched with 1% nital.
(a) (b)
Figure 4.29 SEM micrographs showing the coating thickness for the (a) End A of Material C
and (b) End B of Material C. Etched with 1% nital for (b)
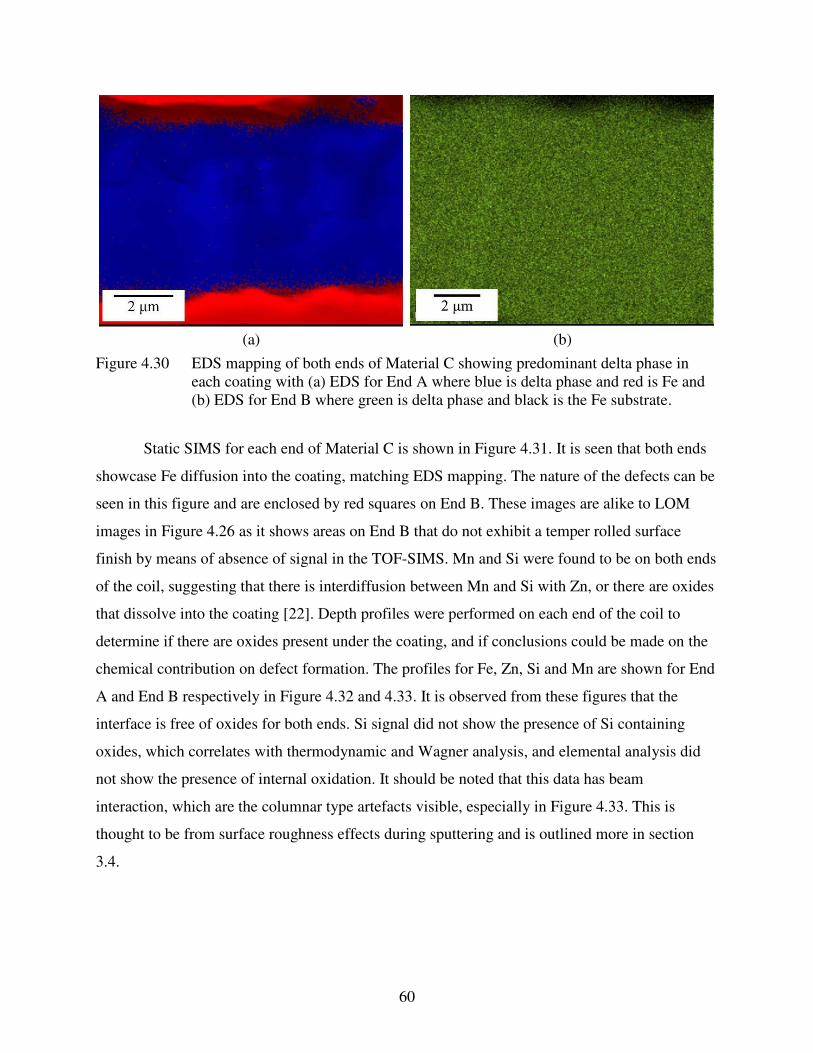
60
(a) (b)
Figure 4.30 EDS mapping of both ends of Material C showing predominant delta phase in
each coating with (a) EDS for End A where blue is delta phase and red is Fe and
(b) EDS for End B where green is delta phase and black is the Fe substrate.
Static SIMS for each end of Material C is shown in Figure 4.31. It is seen that both ends
showcase Fe diffusion into the coating, matching EDS mapping. The nature of the defects can be
seen in this figure and are enclosed by red squares on End B. These images are alike to LOM
images in Figure 4.26 as it shows areas on End B that do not exhibit a temper rolled surface
finish by means of absence of signal in the TOF-SIMS. Mn and Si were found to be on both ends
of the coil, suggesting that there is interdiffusion between Mn and Si with Zn, or there are oxides
that dissolve into the coating [22]. Depth profiles were performed on each end of the coil to
determine if there are oxides present under the coating, and if conclusions could be made on the
chemical contribution on defect formation. The profiles for Fe, Zn, Si and Mn are shown for End
A and End B respectively in Figure 4.32 and 4.33. It is observed from these figures that the
interface is free of oxides for both ends. Si signal did not show the presence of Si containing
oxides, which correlates with thermodynamic and Wagner analysis, and elemental analysis did
not show the presence of internal oxidation. It should be noted that this data has beam
interaction, which are the columnar type artefacts visible, especially in Figure 4.33. This is
thought to be from surface roughness effects during sputtering and is outlined more in section
3.4.

61
(a) (b)
(c) (d)
Figure 4.31 Static-SIMS of Material C with (a)-(b) Fe and Zn maps respectively for End A,
and (c)-(d) Fe and Zn maps respectively for End B. Yellow is high intensity, black
is intensity.
It was observed that there appears to be no chemical influence on coating defect
formation, leading towards the conclusion that there is a mechanical influence. With differences
in coating thickness and hardness between the two ends of the coil, it is suggested that there is
non-uniformity in the temper rolling processes. This leads to one end of the coil experiencing a
greater degree of temper rolling, which can smear the difference in coating thickness variations.
Furthermore, large grains and lower pearlite contents were observed near the substrate/coating
interface of End B, which may relate to a potential texture effect on the coating that would
require further study..

62
(a) (b)
(c) (d)
(e)
Figure 4.32 TOF-SIMS depth profiling analysis including (a) Fe map (b) Zn map (c) Mn map
(d) Si map for Material C-End A. Yellow is high intensity, black is low intensity.
The thermal scale is included as (e), white is no signal.

63
(a) (b)
(c) (d)
(e)
Figure 4.33 TOF-SIMS depth profiling analysis including (a) Fe map (b) Zn map (c) Mn map
(d) Si map for Material C-End B. Yellow is high intensity, black is low intensity.
The thermal scale is included as (e), white is no signal.
4.2.4 Material D
This section will cover microstructural and chemical characterization of Material D. As
received photographs are included in Figure 4.34 to show each condition. Material D was
received as having a “tiger stripe” defect, with areas of slim stripes, thick stripes, and “fingered
stripes” as seen in photographs taken at CSM of as received material in Figure 4.35. The hot
band condition was described as having red scale. Each condition has area associated with a

64
stripe type defect. It was suggested from the IZA that these areas are silicate oxides, and are
carried through each process, leading to coating defects.
(a) (b)
(c)
Figure 4.34 Photographs of as received Material D showing (a) hot rolled state showcasing
red scale (b) pickled state showing how the scale looks post-pickle (c) cold-rolled
and GA state of Material D.
Surface micrographs were taken from an area with and without a tiger stripe on the GA
material to compare. SEM micrographs of each area are included in Figure 4.35, with (a)-(b)
being without a stripe, and (c)-(d) being an area within a stripe. It can be observed that the area
outside of the stripe shows more flat areas, as opposed to the intermediate areas with Fe-Zn
intermetallic crystals. It should be noted that the flat area did not show clear evidence of a temper
roll process. Like previous materials, this suggests a variation in the coating thickness within the
stripe, leading to areas that are flat, and areas that have Fe-Zn intermetallic crystals. Another
observation is that there was not clear evidence of bare spots throughout the whole strip.

65
Cross sectional analysis was performed to show coating thickness differences between the non-
stripe and striped areas, as well as microstructure of the steel.
(a) (b)
(c) (d)
Figure 4.35 Surface SEM micrographs of an area without a tiger stripe (a)-(b), and an area
associated with a stripe (c)-(d).
A comparison of each area is shown in Figure 4.36, with (a) being an area without a streak, and
(b) being an area with a streak. It is seen that the coating thickness inside of the stripe is
5.5 ± 0.89 μm while the coating for the area outside of the stripe is 9.4 ± 0.6 μm. It should be
noted that there are contrast differences in the coating, which may be related to a polishing
response due to insufficient edge retention, and or difference in coating phase. Because of the
large difference in coating thickness, chemical contribution is an important consideration. In

66
order to identify coating phases present, EDS was performed and is shown in Figure 4.37, where
Figure 4.37 (a) and (b) are the same areas imaged in Figure 4.36. The delta and gamma phases
were characterized to be present in both coatings. Areas with Zn signal loss correspond to areas
that exhibit coating loss from polishing and not phase difference in the coating. The
microstructure of the steel was observed to be inter-critical ferrite, martensite and some bainite
as observed in Figure 4.38. From thermodynamic and Wagner analysis, silicate oxides are shown
to be stable, as well as having a high probability to form externally. This makes characterizing
these oxides important as these oxides would cause affect wettability and coating appearance.
Static SIMS on the hot-rolled condition within the red scale area is shown in Figure 4.39. It can
be seen from this analysis that the scale is high in Cr and Mn content, with some areas with high
Si content. To see which elements were higher in the red scale area when compared to outside of
the red scale area, comparative analysis within the TOF-SIMS was employed. This analysis is
outlined in section 3.4.3 and involves analyzing the samples simultaneously and comparing the
total counts of elements in question (Mn, Cr etc.) to see which condition contains a higher
concentration. Comparisons between Si, Cr, Mn, SiO and FeO are shown in Figure 4.40. These
graphs plot mass/charge ratio (specific to the element/cluster) against intensity of the detected
mass/charge ratio. The data is normalized to total counts, making comparative analysis possible.
It is seen that Si, Mn, Cr and SiO contents are higher in the red scale than in areas without;
however, FeO had the same content for both. This suggests that Mn, Cr, Si oxides are the
predominant elements in the red scale. It should be noted that the FeO signal in this analysis is
not exclusively wustite as ion clusters can be detected, meaning the FeO signal may be a cluster
from Fe2O3 or Fe3O4. Distinction between Fe2O3 and Fe3O4 could not be made as there was no
signal detected from these oxides. This same analysis was done on SiO as SiO2 was not detected.
FeO analysis was completed to see if Fe is oxidizing more readily in the areas associated with
the stripe.
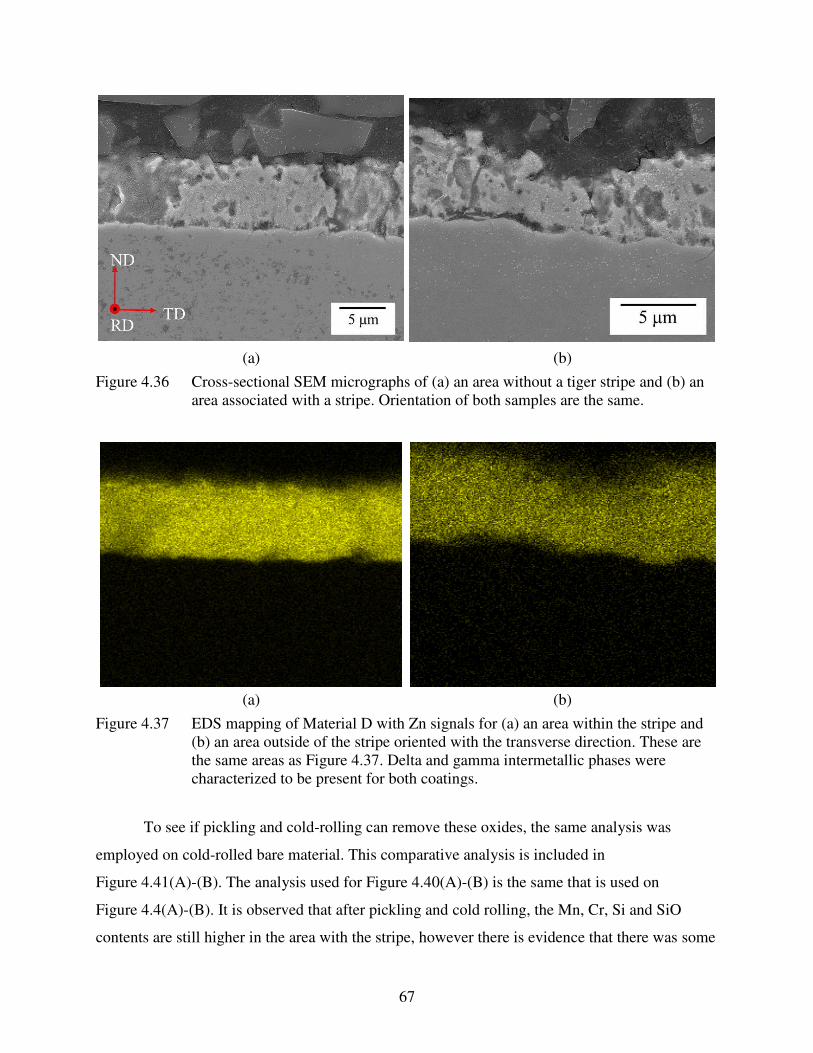
67
(a) (b)
Figure 4.36 Cross-sectional SEM micrographs of (a) an area without a tiger stripe and (b) an
area associated with a stripe. Orientation of both samples are the same.
(a) (b)
Figure 4.37 EDS mapping of Material D with Zn signals for (a) an area within the stripe and
(b) an area outside of the stripe oriented with the transverse direction. These are
the same areas as Figure 4.37. Delta and gamma intermetallic phases were
characterized to be present for both coatings.
To see if pickling and cold-rolling can remove these oxides, the same analysis was
employed on cold-rolled bare material. This comparative analysis is included in
Figure 4.41(A)-(B). The analysis used for Figure 4.40(A)-(B) is the same that is used on
Figure 4.4(A)-(B). It is observed that after pickling and cold rolling, the Mn, Cr, Si and SiO
contents are still higher in the area with the stripe, however there is evidence that there was some
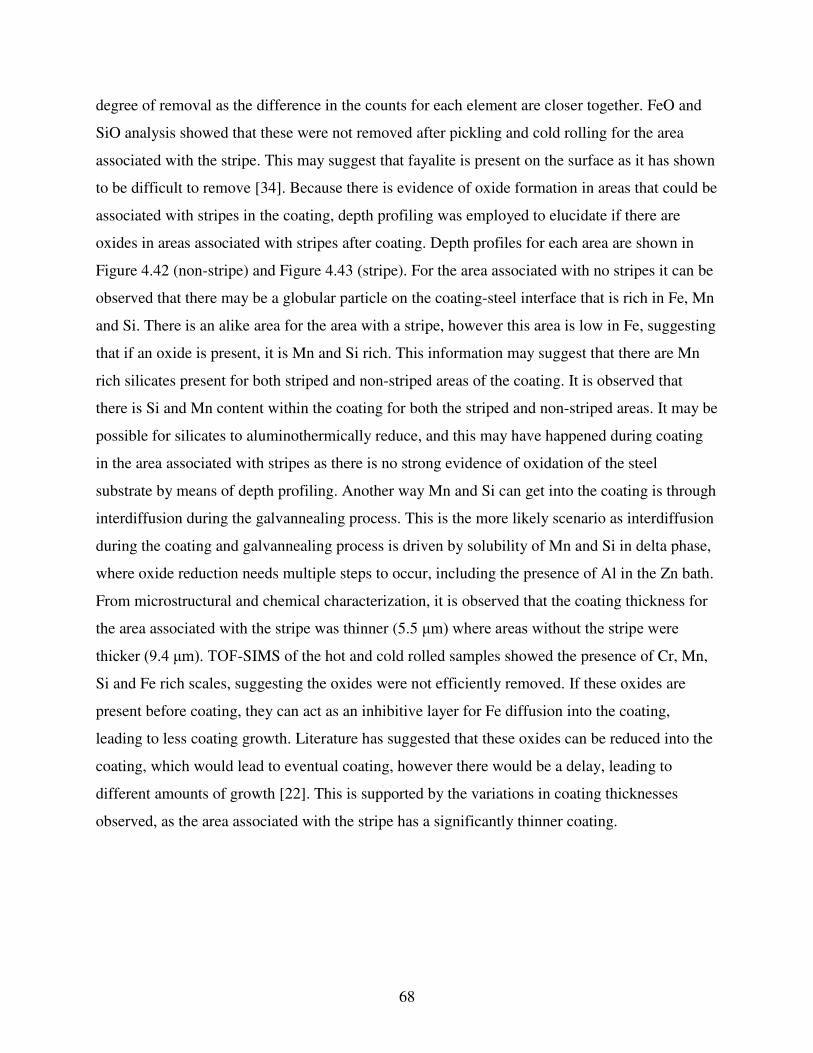
68
degree of removal as the difference in the counts for each element are closer together. FeO and
SiO analysis showed that these were not removed after pickling and cold rolling for the area
associated with the stripe. This may suggest that fayalite is present on the surface as it has shown
to be difficult to remove [34]. Because there is evidence of oxide formation in areas that could be
associated with stripes in the coating, depth profiling was employed to elucidate if there are
oxides in areas associated with stripes after coating. Depth profiles for each area are shown in
Figure 4.42 (non-stripe) and Figure 4.43 (stripe). For the area associated with no stripes it can be
observed that there may be a globular particle on the coating-steel interface that is rich in Fe, Mn
and Si. There is an alike area for the area with a stripe, however this area is low in Fe, suggesting
that if an oxide is present, it is Mn and Si rich. This information may suggest that there are Mn
rich silicates present for both striped and non-striped areas of the coating. It is observed that
there is Si and Mn content within the coating for both the striped and non-striped areas. It may be
possible for silicates to aluminothermically reduce, and this may have happened during coating
in the area associated with stripes as there is no strong evidence of oxidation of the steel
substrate by means of depth profiling. Another way Mn and Si can get into the coating is through
interdiffusion during the galvannealing process. This is the more likely scenario as interdiffusion
during the coating and galvannealing process is driven by solubility of Mn and Si in delta phase,
where oxide reduction needs multiple steps to occur, including the presence of Al in the Zn bath.
From microstructural and chemical characterization, it is observed that the coating thickness for
the area associated with the stripe was thinner (5.5 μm) where areas without the stripe were
thicker (9.4 μm). TOF-SIMS of the hot and cold rolled samples showed the presence of Cr, Mn,
Si and Fe rich scales, suggesting the oxides were not efficiently removed. If these oxides are
present before coating, they can act as an inhibitive layer for Fe diffusion into the coating,
leading to less coating growth. Literature has suggested that these oxides can be reduced into the
coating, which would lead to eventual coating, however there would be a delay, leading to
different amounts of growth [22]. This is supported by the variations in coating thicknesses
observed, as the area associated with the stripe has a significantly thinner coating.

69
(a) (b)
(c)
Figure 4.38 Cross-sectional SEM micrographs of Material D showing a microstructure of
ferrite, martensite and some bainite. Etched with 1% nitol.

70
(a) (b)
(c) (d)
(e) (f)
Figure 4.39 Static SIMS analysis for the Material D hot rolled condition within an area with
no red scale (a, c, e) and an area with red scale (b, d, f) for Si (a-b), Mn (c-d) and
Cr (e-f). Yellow is high intensity, black is low intensity. Rolling direction is
horizontal to the micrographs.
500
400
300
200
100
0
4002000μmSi+
15
13
10
8
5
3
0
500
400
300
200
100
0
4002000μmSi+
20
16
12
8
4
0
500
400
300
200
100
0
4002000μmMn+
28
24
20
16
12
8
4
0
500
400
300
200
100
0
4002000μm
35
30
25
20
15
10
500
400
300
200
100
0
4002000μmCr+
12
10
8
6
4
2
0
500
400
300
200
100
0
4002000μmCr+
60
50
40
30
20
10
0

71
(a)
(b)
(c)
Figure 4.40(A) Static SIMS comparative analysis for the Material D hot rolled condition
comparing the red scale to areas with no red scale with comparisons for (a) Si
(b) Mn (c) Cr The blue line is the red scale area associated with the stripe, and
the black line is the non-red scale area.

72
(a)
(b)
Figure 4.40(B) Static SIMS comparative analysis for the Material D hot rolled condition
comparing the red scale to areas with no red scale with comparisons for (a) SiO2
and (b) FeO. The blue line is the red scale area associated with the stripe, and
the black line is the non-red scale area.

73
(a)
(b)
(c)
Figure 4.41(A) Static SIMS comparative analysis for the Material D cold rolled condition
comparing the striped areas with area associated with no stripe with
comparisons for (a) Si (b) Mn (c) Cr. The blue line is the area associated with
the stripe, and the black line is the non-striped area.

74
(d)
(e)
Figure 4.41(b) Static SIMS comparative analysis for the Material D cold rolled condition
comparing the striped areas with area associated with no stripe with
comparisons for (a) Si (b) Mn (c) Cr (d) SiO2 and (e) FeO. The blue line is the
area associated with the stripe, and the black line is the non-striped area.
75
(a) (b)
(c) (d)
Figure 4.42 TOF-SIMS depth profiling analysis including (a) Fe map (b) Zn map (c) Mn map
(d) Si map for Material D-GA in an area without a tiger stripe. Yellow is high
intensity, black is low intensity. White is no signal.

76
(a) (b)
(c) (d)
Figure 4.43 TOF-SIMS depth profiling analysis including (a) Fe map (b) Zn map (c) Mn map
(d) Si map for Material D-GA in an area inside of a tiger stripe. Yellow is high
intensity, black is low intensity. White is no signal.

77
CHAPTER 5:
CONCLUSIONS
This section will cover conclusions for each material relating to thermodynamic
modeling as well as experimental characterization. Future work will be presented in the next
chapter.
Thermodynamic modeling was performed to predict oxide stability as well as oxidation
mechanism during annealing in a reducing atmosphere typical of industrial furnaces. It was
shown that for Material A, B and C, the corundum phase (Me2O3) was the only oxide formation
that was predicted to be stable for industrially relevant annealing conditions (-30 to 10 °C).
Material D showed that silicates (fayalite and rhodonite) are stable for these conditions, making
where during processing these oxides form important as they have been shown to be deleterious
to the coating process. To predict oxidation mechanism, a modification of Wagner’s theory of
oxidation was employed. Though Mn is the slower diffusing solute in each phase, it is predicted
to externally oxidize for each material under a dew point of approximately -25 °C except for
Material C. Analysis for Material C showed that Mn will externally oxidize at dew points less
than -40 °C in ferrite, and -50 °C for austenite, suggesting this material should not experience
external oxidation when annealing above these conditions. Analysis for the austenite phase
showed that dew point would have to be below -35 °C to result in external oxidation, making this
phase less susceptible to external oxidation at higher dew point atmospheres. The composition of
Material D shows the possibility of external oxidation of Si at dew points lower than -25 °C
making dew point control important when annealing this steel. Si was predicted to internally
oxidize for all other materials for each steel substrate phase and temperature when annealing at
industrially relevant dew points.
Material A was received as having a streaking defect along the rolling direction. LOM
and SEM of the surface of the GA state showed macroscopic periodicity of the streaking defects
(≈ 1.5-2 mm). At higher magnification, there appeared to be smaller defects present suggesting
two mechanisms affecting the coating. No bare spots were observed from SEM analysis.
Substrate microstructure was ferritic/martensitic, with some bainite. TOF-SIMS analysis showed
that there are globular Mn rich oxides containing Si on the steel-coating interface. This was

78
predicted from both Thermo-Calc® and Wagner’s analysis, however the presence of Si was not
predicted from either analysis. Based on the observed macroscopic periodicity, the defect
formation in Material A was attributed to the Zn pot sink roll affecting Zn solidification and
potentially affecting formed intermetallic layers. Another mechanism that may have some effect
is Mn rich Si containing oxides inhibiting Fe-Zn interdiffusion. Bare material was analyzed using
TOF-SIMS, and it was observed that Mn and Si maps were uniform, suggesting the oxides are
formed during annealing.
Material B was received as having an acne type defect, and was the only material
supplied in the GI state. External oxidation of Mn and Cr were predicted to be possible at low
dew points (< -25 °C for ferrite), and the corundum phase was the only stable oxide predicted.
The microstructure of the substrate was ferritic/martensitic. SEM showed that the coating was
uniform, and approximately 8 μm. TOF-SIMS analysis showed that the defects were Zn rich, and
depth profiling showed that defects are situated only on the surface of the coating. It also showed
that the inhibition layer formed has Zn content and may be of Fe2Al5-XZnX rather than Fe2Al5.
Depth profiling showed the possibility of internal oxidation of Mn, Si and Cr. Oxidation
predictions matched experimental analysis as there was some evidence showing internal
oxidation of Mn, Cr and Si, with no evidence of external oxidation. This suggests that the defect
may have resulted from zinc splashing. As there was no Fe content in the particle, it was
determined that the defects do not appear related to dross pickup, suggesting that defect
formation is a function of other processing parameters e.g. air knife settings.
Material C was received with two ends of the same coil, one exhibiting a sufficient
coating, the other exhibiting “flame” type defects in the coating. The substrate microstructure
was ferritic/pearlitic. Surface SEM shows that the end with sufficient coating exhibits more areas
with a temper rolled surface finish, whereas the end with defects has more areas with Fe-Zn
intermetallic crystal formations. It was observed that there were large grains and less colonies of
pearlite present near the substrate/coating interface on the end of the coil exhibiting defects. This
may suggest that there may be a substrate grain size or texture effect on coating nucleation and
growth. The coating thickness of the end with sufficient coating was shown to be 5 μm thinner
than the end with defects, which may suggest that the temper rolling process is affecting these
defects differently at different ends of the coil. Chemical analysis showed that there were little to
no oxides present on the steel-coating interface, suggesting that chemistry does not have a strong
79
effect on the coating. The predictions for oxidation showed to match experimental analysis, as no
oxides were shown to be present on the steel-coating interface. Defect formation may relate to
the difference in temper roll response from each end of the coil and/or Zn solidification and
coating growth due to differences in the substrate microstructure.
Material D was received with samples in the hot-rolled, as-pickled, cold-rolled, and
coated conditions, all exhibiting stripes referred to as “tiger stripes”. The defects were suggested
to form during the hot-rolling process as a red scale; and this oxide would survive the subsequent
processing and then affect the coating process. If oxides were present before annealing due to
survival of the removal process, they may have affected the nucleation and growth of the
coating. The coating thickness of the area with the stripe was shown to be about 4 μm thinner
than the area outside of the stripe, suggesting a difference in growth of the coating. Chemical
analysis showed that the hot and cold rolled samples showed increased amounts of oxides,
specifically Cr, and Mn and Si, in the areas associated with tiger stripes. This may suggest that
Cr and Mn oxides are not being removed during pickling. However, depth profiling showed little
evidence of oxides present on the steel-coating interface for the GA condition. Depth profiling
did show increased signal of Mn and Si in the coating, which suggests that oxides present before
coating may have taken into the coating through aluminothermic reduction or removal. However,
Mn and Si can also enter the coating through interdiffusion, which is the more likely scenario.
Since the coating thickness is thinner in areas with the tiger stripe, and chemical analysis showed
the presence of oxides prior to coating, defect formation may result from oxidation of the strip
prior to coating. No bare spots were observed in this study, suggesting that Zn wettability was
not greatly influenced. The defect formation mechanism is not clearly understood but appears to
relate to pickling response of the strip.

80
CHAPTER 7:
FUTURE WORK
One aspect that would be of particular interest is the texture effect on Zn solidification,
coating growth, and oxidation as well as defect formation. The employment of focused ion beam
(FIB) as well as 3D-electron backscattered diffraction (EBSD) could show grain orientation
below the observed coating defect leading towards conclusions on grain size or texture effects on
defect formation. This can be paired with TOF-SIMS chemical analysis to make conclusions on
how texture affects oxide chemistry and formation, as well as defect formation in the coating.
Continued work on the TOF-SIMS will need to be done as there are some current short
comings with data processing. One of these limitations is how the 3D renderings are
automatically scaled to fit the lateral scale of the map. This means that if a 100 x 100 μm2 area is
profiled, the sputtering axis will be scaled to form a cube. Since the sputtering depth will not be
100 μm, this makes the 3D maps off scale in the z direction. Another shortcoming is that the 3D
maps do not include an intensity scale bar. This means that the relative signals cannot be
determined for different areas of the depth profile. This makes it difficult to determine the extent
of segregation of the element in question. Continued work with IonTof will help to alleviate
current data processing limitations.
The creation/acquisition of an annealing furnace with the possibility of strictly
controlling furnace conditions would be useful when trying to control surface oxidation
experiments and potentially control defect formation. This furnace could also be used when
trying to determine if Wagner’s theory of oxidation can be modified to conform to dual-phase
steel concentration levels. If a simple model like Wagner’s theory of oxidation can be used, it
would help in eliminating surface oxidation in industrially annealing steels as it gives
information on furnace conditions needed.
81
REFERENCES
[1] J. Mahieu, J. Maki, B. C. De Cooman, and S. Claessens, “Phase transformation and mechanical properties of Si-free CMnAl TRIP-aided steel,” Metallurgical & Materials
Transactions A, vol. 33, pp. 2573–2580, 2002.
[2] J. Mahieu, S. Claessens, B. C. De Cooman, and F. Goodwin, “Surface and Sub-surface
Characterization of Si-, Al- and P-alloyed TRIP-aided Steel,” in Galvatech ’2004: 6th International Conference on Zinc and Zinc Alloy Coated Steel Sheet, 2004, pp. 529–538.
[3] B. C. De Cooman, J. Oh, L. Cho, and C. Lee, “Surface Selective Oxidation, Hot-Dip
Galvanizing and Coating-Related Properties of Advanced High-Strength and Ultrahigh-
Strength Automotive Steel Grades,” Iron and Steel Technology, vol. 14, no. 2, pp. 76–79,
2017.
[4] H. Liu et al., “Challenges in hot-dip galvanizing of high strength dual phase steel: Surface
selective oxidation and mechanical property degradation,” Surface and Coatings
Technology, vol. 206, no. 16, pp. 3428–3436, 2012.
[5] C. Thorning and S. Sridhar, “Grain Boundary Ridge Formation During Initial High
Temperature Oxidation of Mn/Al TRIP Steel,” Philosophical Magazine, vol. 87, no. 23,
pp. 3479–3499, 2007.
[6] R. Plessinger, S. Seetharaman, and E. De Moor, “Oxide Stability Analysis and Characterization in a Galvannealed Dual-Phase Steel Exhibiting Coating Defects,” in AISTech 2019, Warrendale, PA, pp. 1819–1828, 2019.
[7] S. Il-Ryoung, K. Jong-Sang, and S. Seetharaman, “Effect of Dew Point and Gas Flow Rate on the Surface Oxidation of Advanced High Strength Steels,” ISIJ International, vol.
55, no. 9, pp. 2008–2017, 2017.
[8] Y. F. Gong, S. Birosca, H. S. Kim, and B. C. De Cooman, “Oxide Formation and Alloying Elements Enrichment on TRIP Steel Surface during Inter-Critical Annealing,” Journal of
Microscopy, vol. 230, no. 3, pp. 424–434, 2008.
[9] A. R. Marder, “The metallurgy of zinc-coated steel,” Progress in Materials Science, vol.
45, pp. 191–271, 2000.
[10] T. S. Cho, Y. D. Kwon, and S. B. Kwon, “A Study of the Influence of Air-Knife Tilting
on Coating Thickness in Hot-Dip Galvanizing,” Journal of Thermal Science, vol. 18, no.
3, pp. 262–267, 2009.
[11] J. Mahieu, B. C. De Cooman, and S. Claessens, “Galvanizability of high-strength steels
for automotive applications,” Metallurgical and Materials Transactions A: Physical
Metallurgy and Materials Science, vol. 32, no. 11, pp. 2905–2908, 2001.

82
[12] S. M. A. Shibli, B. N. Meena, and R. Remya, “A review on recent approaches in the field of hot dip zinc galvanizing process,” Surface and Coatings Technology, vol. 262, pp. 210–215, 2015.
[13] C. E. Jordan and A. R. Marder, “Fe–Zn phase formation in interstitial-free steels hot-dip
galvanized at 450 °C Part I 0.00 wt % Al–Zn baths,” Journal of Mate Rials Science, vol.
32, pp. 5593–5602, 1997.
[14] J. Strutzenberger and J. Faderl, “Solidification and spangle formation of hot-dip-
galvanized zinc coatings,” Metallurgical and Materials Transactions A, vol. 29, pp. 631–646, 1998.
[15] F. A. Fasoyinu, “The Solidification of Hot Dipped Galvanized Coatings on Steels,” University of British Columbia, 1989.
[16] C. S. Lin, M. Meshii, and C. C. Cheng, “Phase Evolution in Galvanneal Coatings on Steel
Sheets,” ISIJ International, vol. 35, no. 5, pp. 503–511, 1995.
[17] Z. Ghanbari, “FE-ZN PHASE EVOLUTION AND CRACKING BEHAVIOR IN ZN-
COATED PRESS-HARDENED STEEL,” Colorado School of Mines, 2017.
[18] M. Guttmann, “Diffusive Phase Transformations in Hot Dip Galvanizing,” Materials
Science Forum, vol. 155–156, pp. 527–548, 1994.
[19] “Standard Specification for Steel Sheet, Zinc-Coated (Galvanized) or Zinc-Iron Alloy
Coated (Galvannealed) by the Hot-Dip Process,” 2014.
[20] A. Rodnyansky, Y. J. Warburton, and L. D. Hanke, “Segregation in hot‐dipped galvanized steel,” Surface and Interface Analysis, vol. 29, pp. 215–220, 2000.
[21] D. Huin, P. Flauder, and J. B. Leblond, “Numerical Simulation of Internal Oxidation of Steels during Annealing Treatments,” Oxidation of Metals, vol. 64, pp. 131–167, 2005.
[22] K. Lin and C. Lin, “Effect of Silicon in Dual Phase Steel on the Alloy Reaction in Continuous Hot-dip Galvanizing and Galvannealing,” ISIJ International, vol. 54, no. 10,
pp. 2380–2384, 2014.
[23] J. H. Swisher and E. T. Turkdogan, “Solubility, Permeability, and Diffusivity of Oxygen in Solid Iron,” Transactions of the Metallurgical Society of AIME, vol. 239, no. 4, pp.
426–431, 1967.
[24] R. A. Rapp, “Kinetics, Microstructures and Mecahnism of Internal Oxidation Its Effect
and Prevention in High Temperture Alloy Oxidation,” in National Association of
Corrosion Engineers, 1965, pp. 382–401.
[25] N. Birks, G. H. Meier, and F. S. Pettit, Introduction to the High-Temperature Oxidation of
83
Metals, 2nd ed. New York: Cambridge University Press, 2006.
[26] H. Liu, Y. He, and L. Li, “Application of Thermodynamics and Wagner Model on Two Problems in Continuous Hot-Dip Galvanizing,” Applied Surface Science, vol. 256, no. 5,
pp. 1399–1403, 2009.
[27] R. W. Ballufi, S. M. Allen, and W. C. Carter, Kinetics of Materials, 1st ed. Hoboken: John
Wiley & Sons, Inc., 2005.
[28] Y. Fushiwaki, T. Kawano, and Y. Nagataki, “Influence of Cr Addition on Selective Oxidation Behavior of Mn-Added High-Strength Steel Sheet,” ISIJ International, vol. 58,
no. 9, pp. 1623–1628, 2018.
[29] T. Kawano, Y. Fushiwaki, Y. Nagataki, and M. Nagoshi, “Influence of Cr addition on hot ‐ dip galvanizing reaction of Mn containing sheet steel,” Surface and Interface Analysis,
vol. 50, pp. 1058–1064, 2018.
[30] IonTof GmbH, “IonTof TOF.SIMS 5,” 2019. [Online]. Available: https://www.iontof.com/tof-sims-5-product-version-100mm-200mm-300mm.html.
[31] H. H. Fukubayashi and M. S. Brennan, “Present Furnace and Pot roll Coatings and Future
Development,” in Galvatech ’2004, 2004, pp. 585–593.
[32] J. Mahieu, “Contribution to the Physical Metallurgy of Crash-resistant Galvanized Trip-
assisted Steel for Automotive Structures,” Universiteit Gent, 2004.
[33] R. Khondker, A. Mertens, and J. R. McDermid, “Effect of Annealing Atmosphere on the Galvanizing Behavior of a Dual-Phase Steel,” Materials Science and Engineering A, vol.
463, no. 1–2, pp. 157–165, 2007.
[34] R. Y. CHEN and W. Y. D. YUEN, “Examination of Oxide Scales of Hot Rolled Steel
Products,” ISIJ International, vol. 45, no. 1, pp. 52–59, 2005.