Characterization of expiration air jets and droplet size distributions immediately at the mouth...
38
QUT Digital Repository: http://eprints.qut.edu.au/ Chao, Christopher and Wan, Man Pun and Morawska, Lidia and Johnson, Graham R. and Ristovski, Zoran and Hargreaves, Megan and Mengersen, Kerrie L. and Steve, Corbett and Li, Yuguo and Xie, Xiaojian and Katoshevski, David (2009) Characterization of expiration air jets and droplet size distributions immediately at the mouth opening. Journal of Aerosol Science, 40(2). pp. 122-133. © Copyright 2009 Pergamon-Elsevier Science
Transcript of Characterization of expiration air jets and droplet size distributions immediately at the mouth...

QUT Digital Repository: http://eprints.qut.edu.au/
Chao, Christopher and Wan, Man Pun and Morawska, Lidia and Johnson, Graham R. and Ristovski, Zoran and Hargreaves, Megan and Mengersen, Kerrie L. and Steve, Corbett and Li, Yuguo and Xie, Xiaojian and Katoshevski, David (2009) Characterization of expiration air jets and droplet size distributions immediately at the mouth opening. Journal of Aerosol Science, 40(2). pp. 122-133.
© Copyright 2009 Pergamon-Elsevier Science
Characterization of expiration air jets and droplet size distributions immediately at the
mouth opening
C. Y. H. Chao1*, M. P. Wan2, L. Morawska3, G. R. Johnson3, Z.D. Ristovski3, M. Hargreaves3,
K. Mengersen3, S. Corbett4, Y. Li5, X. Xie5, D. Katoshevski6
1Department of Mechanical Engineering, The Hong Kong University of Science and
Technology, Clear Water Bay, Hong Kong
2School of Mechanical Engineering, Kyungpook National University, Daegu, Korea
3School of Physical and Chemical Sciences, Queensland University of Technology, Brisbane,
QLD, Australia
4Centre for Public Health, Western Sydney Area Health Service, Sydney, NSW, Australia
5Department of Mechanical Engineering, The University of Hong Kong, Pokfulam Road, Hong
Kong
6Department of Biotechnology and Environmental Engineering, Ben-Gurion University of
Negev, Beer-Sheva, Israel
* Corresponding author
Tel: +852 2358 7210 Fax: +852 2358 1543 Email: [email protected],
Short title: Measurement of expiration air jets and droplets

Abstract
Size distributions of expiratory droplets expelled during coughing and speaking and the
velocities of the expiration air jets of healthy volunteers were measured. Droplet size was
measured using the Interferometric Mie imaging (IMI) technique while the Particle Image
Velocimetry (PIV) technique was used for measuring air velocity. These techniques allowed
measurements in close proximity to the mouth and avoided air sampling losses. The average
expiration air velocity was 11.7 m/s for coughing and 3.9 m/s for speaking. Under the
experimental setting, evaporation and condensation effects had negligible impact on the
measured droplet size. The geometric mean diameter of droplets from coughing was 13.5μm and
it was 16.0μm for speaking (counting 1 to 100). The estimated total number of droplets expelled
ranged from 947 – 2085 per cough and 112 – 6720 for speaking. The estimated droplet
concentrations for coughing ranged from 2.4 - 5.2cm-3 per cough and 0.004 – 0.223 cm-3 for
speaking.
KEYWORDS: Expiratory droplets, Coughing, Speaking, Interferometric Mie imaging, Particle
image velocimetry

1. Introduction
Expiratory droplets are potential carriers of pathogens that cause airborne diseases. Expiratory
droplets are polydispersed and the size of the droplets has high impact on the disease
transmission process. Smaller droplets evaporate quickly and become ‘droplet nuclei’. Droplet
nuclei can remain airborne for long periods of time and can be dispersed widely by following the
airflow pattern. Airborne mode transmission refers to infection via inhalation of these airborne
pathogenic particles. Larger droplets settle out of the air more quickly but, due to the larger size,
a vast majority of expelled pathogens are carried in the large droplets. Infection via direct spray
of large pathogen-laden droplets onto mucous membranes or conjunctiva is known as droplet
mode transmission. Droplet size also affects the infectivity of pathogen-laden droplets. Although
larger droplets have higher pathogen-carrying capacities, their ability to penetrate deep into the
respiratory tract is lower than that of smaller droplets. Smaller pathogen-laden droplets have
higher infectivity (Nicas et al., 2005) compared to the larger ones for diseases that have the
lower respiratory tract as the target infection site (e.g., Tuberculosis). Droplet size is a key factor
for the disease to be transmitted and for the size of the spreading zone. Tuberculosis, for
example, can be transmitted via the airborne route and, thus, can have a wide spreading zone
depending on the airflow conditions. Diseases such as influenza and severe acute respiratory
syndrome (SARS) are primarily transmitted via the droplet mode. Persons in close contact with
the source patient are considered at high risk (Hawkey et al., 2003).
Given the importance of droplet size in disease transmission, size profile information of droplets
expelled during expiratory actions is of primary interest. Over the past few decades, different
methods were employed to measure the size profiles of expiratory droplets and different findings
were reported. Most early studies (e.g., Duguid, 1946 and Loudon & Roberts, 1967) used

collection media (e.g., glass slides and filters) with subsequent microscopic analysis of the
expiratory droplets collected on the media. Droplets measured by these methods were mainly in
the supermicron size range. Sampling-based optical particle counters were employed in some
more recent studies (e.g., Fairchild & Stamper, 1987 and Papineni & Rosenthal, 1997). Most of
the droplets measured were in the submicron size-range in their studies. Another recent study by
Yang et al. (2007), which also employed sampling-based optical particle counters, reported
droplet size spectra spanning from about 0.6 – 16 μm, with the average mode at 8.35 μm during
coughing. Though different methods were employed, a common problem of these previous
studies was that the expiratory droplets were not measured immediately at the mouth/nose exit.
Instead, the expiratory droplets went through evaporation, dilution, sampling losses and other
influences from the environment before being measured or collected, posing error and limitations
in estimating the droplets size profile immediately at the mouth/nose exit (or the ‘original’ size
distribution).
Remote sensing techniques may be possible solutions since they do not require air sampling and
the sensing volume can be placed very close to the mouth/nose without disturbing the expiratory
flow. Jennison (1942) conducted such measurements using high-speed photography. However,
this technique requires high magnification to resolve small droplets, restricting the ability to
detect small droplets and the size of the field of detection (only droplets of larger than 10μm
were detected in the study by Jennision (1942)). The more recently developed Interferometric
imaging technique overcomes these shortcomings to a great extent (Glover et al., 1995).
Interferometric imaging uses de-focused images of the droplets instead of focused images to
lower down the magnification requirement. Scattering properties of droplets under the

illumination of coherent optical radiation are analyzed using the Mie scattering theory to
determine droplet size. This method is sometimes called the IMI method.
This study aimed at measuring the expiration air jet velocities and the size profiles of expiratory
droplets during speaking and coughing in close proximity to the mouths with the help of the PIV
and the IMI method. Total droplet counts and number concentrations of the droplets would also
be estimated.
2. Experimental method
2.1 The expiratory droplet measurement setup
The experiments were conducted in an expiratory droplet measurement setup at the International
Laboratory for Air Quality and Health (ILAQH), Queensland University of Technology (QUT).
The setup was modified from the Expiratory Droplet Investigation System (EDIS) developed by
QUT to fit the installation of the IMI and PIV instruments. Figure 1 shows the schematic of the
setup related to the IMI and PIV experiments. The setup consisted of a 500 mm diameter (490
mm internal diameter) × 800 mm long acrylic glass tube supported on a rack mount and a chair
for the volunteers. Both ends of the tube were open and there was no mechanically induced
background airflow in the tube. A 70 mm wide laser safety shield with a 30 mm × 30 mm
opening was installed at one end of the tube. The center of the 30 mm2 opening was 145 mm
above the bottom interior of the tube. The safety shield also helped the volunteers to position
their head correctly by leaning their head against the shield and placing their mouths on the
opening. The safety shield was made from a 1-mm thick galvanized steel base plate covered with
light-absorbing black-out material (Edmunds Optics, Flock Paper #40). The bottom of the tube
was also covered with the black-out material to stop the laser sheet and to avoid laser light ray

reflection. During the measurements, volunteers were asked to lean their heads on the safety
shield and to place their mouths on the 30 mm2 opening. The chair was mounted on a motorized
seat lift to allow the volunteers to adjust the height to the correct position. All volunteers were
asked to wear laser safety goggles (OD 10 at 532 nm, Yamamoto) throughout the measurements.
The setup was placed inside an air-conditioned room so that the air temperature and relative
humidity (RH) inside the tube remained fairly stable. The air temperature and RH inside the tube
were monitored in real-time by a digital thermo-hygrometer. The air temperature and RH
averaged from all experiments were 24.9oC and 73.9%, respectively. All the side walls and
windows of the room were covered with black cardboard paper with rough surface finishing to
avoid refracted light rays. The door of the room was interlocked with the power supply of the
laser source. The laser power supply could be switched on only if the door was fully closed.
2.2 Optical settings for the IMI and PIV measurements
Detailed descriptions and derivations of the IMI technique and sizing calculation are provided by
Glover et al. (1995) and Glantschnig & Chen (1981). Briefly, when there is a laser light ray
illuminating a transparent droplet in a flow field, due to refraction and reflection, the incident
laser light ray is split into several rays. The reflected and refracted light from the droplet is
dominant in the wide-angle forward-scatter region, around 30o to 80o. At an observation angle in
the off-axis alignment, the two components of the scattered light appear to emanate from small
spots. The two spots are observed as glare points on the focal plane. On the non-focal plane, the
two rays interfere with each other and the regular fringes are easily observed, and their origin
can be understood in terms of a simplified geometric theory (Glantschnig & Chen, 1981). The
fringe spacing can be related to the droplet diameter by the following equation

1
2
2cos21
2sin
2cos2
−
⎥⎥⎥⎥⎥
⎦
⎤
⎢⎢⎢⎢⎢
⎣
⎡
⎟⎠⎞
⎜⎝⎛−+
⎟⎠⎞
⎜⎝⎛
+⎟⎠⎞
⎜⎝⎛
Δ=
ϕ
ϕϕ
φλ
nn
nd p (1)
When a set of fringes can be observed for individual droplets, they provide a potentially accurate
measurement of the droplet diameter.
For the IMI measurement, the laser light source and the sheet optics with a polarizer were
mounted above the tube that produced a laser light sheet to cut downward through the tube
diameter, perpendicular to the direction of the expiration jets (cut through the cross section of the
expiration jet). The laser light source was a double-pulsed Nd:YAG laser at 532 nm wavelength
(New Wave Research, Solo II), operated at 30 mJ with a pulse width of 3-5 ns. The sheet optics
produced a laser sheet with an aperture angle of 7.1o. The thickness of the laser sheet was about
1 mm. A CCD camera (LaVision, ImagerIntense) was placed inside the tube at the downstream
of the laser sheet. The camera was aligned at an observation angle of 80o to the laser sheet. The
observation angle of the camera was monitored by a direct reading dial inclinometer (Empire)
attached on the camera. The progressive-scan, dual-frame CCD camera had a resolution of 1376
× 1040 pixels and a maximum frame rate of 10/s. The exposure time of each image was 100 μs.
A macro lens (Zeiss Makro-Planar T*2.8/100) was mounted on the CCD camera to provide a
magnification ratio of 1:1. A circular aperture of 20 mm diameter was mounted in front of the
lens to produce de-focused droplet images of about 80 pixels in diameter. The laser source and
the camera were synchronized by a PC-based control system (LaVision, Davis 7). The lower size
detection limit of the IMI system was about 2 μm. The front end of the lens was about 100 mm
away from the laser sheet. The measurement plane was 8.9 mm × 6.7 mm (W × H). The center of

the measurement plane was aligned with the center of the mouth opening on the laser safety
shield. IMI measurements were made at two distances, 10 mm and 60 mm, from the mouth. The
IMI system could only measure transparent droplets. The disturbance by background aerosol to
the measurement was essentially screened out. A measurement of background aerosol by
aerodynamic particle sizer (APS) showed that the majority of them were smaller than 0.523 μm
in size with an average concentration of 1.6/cm3. They were smaller than the lower size detection
limit of the IMI system.
The same laser source and CCD camera were used for the measurements of the velocity of
expiration air jet by PIV. For the PIV measurements, the laser sheet was twisted by 90o to align
along the direction of the expiration air jet. The laser sheet aperture angle was adjusted to 14.2o
to produce a wider laser sheet. The camera was placed at the side of the tube and aligned at a 90o
observation angle to the laser sheet. An objective lens (Nikkor 50 mm/f1.8 D) with a 532 nm
optical filter was mounted on the camera. The measurement area was 45 mm × 60 mm (W × H),
located immediately in front of the mouth opening. The PIV images were taken in dual-frame
pairs for cross-correlation post-processing. The images were taken at a frequency of 5 pairs/s. At
the camera’s viewing position, an opening was made on the tube wall and a 51 mm × 70 mm
planer acrylic glass window was fitted on the opening to avoid image distortion by the curved
surface of the tube. Flow seeding was provided by an aerosol generator (LaVision, Aerosol
Generator) using saline solution.
2.3 Experiment protocol
The experiments with volunteers and the use of the laser setup were approved by the Human
Research Ethics Committee and the Safety Office of Queensland University of Technology.

Eleven healthy volunteers (3 men and 8 women) were recruited via a broadcast email invitation
with a small financial reward. The volunteers were university students and postgraduate research
students (under 30 years old). Smokers, asthma sufferers, people who were experiencing illness,
who had recently experienced expiratory problems or were likely to experience discomfort in
confined spaces were excluded.
Every volunteer was asked to cough and to speak following a standard protocol. When the
volunteer was seated comfortably in the correct position with his/her mouth placed at the
opening of the safety shield, they were asked to speak by counting 1 to 100 ten times loudly and
slowly with a pause after speaking each number. The volunteers produced expiration air jets in
the horizontal forward direction with the help of the safety shield. The volunteers were allowed
to take a brief rest after finishing every round of speaking 1 to 100. After ten rounds of counting
1 to 100 were finished, the volunteers were given a five-minute break and they were allowed to
drink water. After the break, the volunteers were asked to cough 50 times during the cough test.
They were instructed to close their lips before each cough. Therefore, the volunteers were well-
prepared before each cough and started each cough with same mouth shape. The volunteers were
allowed to take a brief rest and drink water whenever they needed to during the cough test. Every
volunteer was asked to conduct two rounds of tests following this protocol. The first round was
for measurement at 10 mm from the mouth opening and the second round was for measurement
at 60 mm. A 20-minute break was given to the volunteers after finishing the first round to allow
time for the experimenters to move the IMI system from the 10 mm to the 60 mm distance and to
realign the optical setup. PIV measurements were made on two volunteers (one man and one
woman). The coughing and speaking protocol was the same as in the IMI measurements except
that the volunteers were asked to do one round of coughing and one round of speaking only.
3. Results
3.1 Expiration air jet velocity
The maximum expiration air velocity during coughing by the male volunteer was 13.2 m/s and
that by the female volunteer was 10.2 m/s. The average expiration air velocity during coughing
was 11.7 m/s. During speaking, the maximum expiration air velocity was 4.6m/s for the male
and 3.6 m/s for the female volunteer, with an average velocity of 3.9 m/s. Figure 2 shows an
example of the measured air velocity field during coughing and speaking. During coughing, a
high velocity core of about 15 mm in diameter was formed at the mouth exit. A significant
gradient of air velocity can be seen from the center of the jet towards the outer of the jet
envelope. Entrainment of the surrounding air by the cough jet could be found along the jet
making the jet envelope expand. The high momentum of air expulsion during coughing produced
an air jet having a throw even longer than the viewable area of the camera. Comparatively, the
initial air jet velocity was much lower during speaking so that the throw of the air jet was about
40 mm in the example shown in Figure 2. Air entrainment was also observed in the speaking
case.
3.2 Measured droplet size distributions
Table 1 shows the average count of droplets per person during coughing and speaking at the two
distances from the mouth opening. The coughing droplet count was aggregated across 50 coughs
while the speaking droplet count was aggregated across 10 times of counting 1 to 100. The
standard deviation of the 11-volunteer data pool is also shown. The droplets were classified into
16 size classes as adopted from Duguid (1946). Narrower size classes were used for smaller sizes
of droplets since most of the droplets measured were in the lower size end. During coughing, the
size class that has the highest number count was 6μm at the two measurement distances. At the
10mm distance an average total of 110 droplets were counted in 50 coughs but this average
reduced to 42 droplets at the 60 mm distance. The size class that had the highest droplet count
for speaking was also 6 μm. However, the number of droplets was much smaller with speaking,
compared to coughing. An average total of 61 droplets were counted at the 10 mm distance after
counting 1 to 100 ten times. The average total number of droplets per person was reduced to 40
at the 60 mm distance. The observation of having the same size class that had the highest droplet
count for coughing and speaking was similar to that reported in Duguid (1946). However, in
Duguid (1946), this size was in the 8-16 μm size class. Another study (Papineni & Rosenthal,
1997) reported that highest counts were found in the size class of less than 0.6μm for both
talking and coughing
The measured droplet size profiles are presented in terms of dfn / dlndp and are fitted by the log-
normal distribution as shown in Figures 3a and b. The geometric mean (GM) diameters are also
shown for comparison. Although the droplet size peaked at 6 μm for both speaking and
coughing, the GM diameter was larger for speaking compared to that of coughing (16.0 μm vs
13.5 μm at the 10 mm distance). This suggests that the expulsion of air at higher velocity during
coughing might promote the production of smaller droplets compared to the lower expiration
velocity experienced during speaking. The results reported by Duguid (1946) and Loudon &
Roberts (1976) are also plotted on Figure 3 for comparison. It shows that the GM diameters
obtained in the current study were fairly close to that reported by Duguid (1946) but differed
rather significantly from that reported by Loudon & Roberts (1976). Figures 3a and b also show
that the GM diameter reduced modestly at the 60 mm distance when compared to the 10 mm

distance. The reduction in the GM diameter might be caused by the shrinkage of the droplets by
evaporation but this hypothesis is questionable since the travelling time might be very short
considering the high velocity of the expiration jets. The RH of the surrounding air might still be
high under the influence of the expiration jet. Another reason could be that the droplets became
more widely dispersed at the 60 mm distance. The chance for capturing the large droplets by the
camera became even less compared to the 10mm distance.
4. Discussion
4.1 Estimation of droplet evaporation/condensation
Expiratory droplets experience evaporation/condensation once they are produced and introduced
into the air, leading to changes in droplet size. In the current study, droplet measurements were
made at 10 mm and 60 mm from the mouth. The effects of evaporation/condensation on the
droplet size at these two distances were estimated to access if the current results are
representative of the ‘original’ size profile. For such estimation, information about the
surrounding air temperature and RH along the trajectory of the droplets is essential. Numerical
simulations were performed for the coughing and speaking cases. A two-dimensional numerical
geometry with dimensions adopted from the expiratory droplet investigation setup (800 mm ×
490 mm) was used. An opening of 15 mm in diameter was created at the position corresponding
to the mouth position in the experimental setup. One mm hexahedral meshing was generally used
in the geometry with grid adaptations near the tube walls to keep the y+ value of the first layer of
mesh within 30 - 60. The standard log-law wall function was adopted for the turbulence near-
wall treatment. The numerical geometry was constructed and meshed using the GAMBIT
(version 2.2) pre-processor. Conservation equations of mass, momentum and energy plus the
species transport equation for water vapor were solved using the SIMPLE algorithm and the

second-order upwind solution scheme by FLUENT (version 6.2). The density of the air-water
vapor mixture was set to follow a second-order polynomial function of temperature to capture
the buoyancy effect. Inputs of the numerical simulations are summarized in Table 2.
The profiles for the predicted horizontal air velocity along the center-line of the mouth opening
up to the 100 mm distance are shown in Figure 4a. The figure shows that the changes in
horizontal air velocities at the two measurement distances were very modest compared to that at
the mouth opening. This suggests that the two droplet measurement distances, 10 mm and 60
mm, were essentially within the core zone (or zone 1 in the classical jet theory (Rajaratnam,
1976)) where the center-line velocity is the same as the jet’s initial velocity. Figure 4b shows the
numerically predicted air temperature and RH at horizontal distances of up to 100 mm from the
mouth opening. The figure shows that, at the 10 mm distance, the air temperature and RH were
the same as at the mouth exit (37oC and 100%, respectively) for both coughing and speaking.
The RH was reduced by about 0.5% at the 60 mm distance for coughing but, for speaking, the air
became slightly supersaturated (RH > 100%) at this distance. This happened because the warm
and saturated air front of the exhalation air jet met with the cooler surrounding air. In reality, this
may trigger the nucleated condensation of water droplets and may lower the RH back to the
saturation state but modeling this rather complex phenomenon was not the intention of the
current simulations. Considering that the solutes might lower the vapor saturation pressure on the
droplet surface, the droplets were more likely to grow by condensation rather than shrink by
evaporation. The evaporation/condensation of droplets was estimated using the model proposed
by Kukkonen et al. (1989) with some simplifications. The models for diffusive mass flux of
vapor from a droplet surface and droplet temperature were

⎟⎟⎠
⎞⎜⎜⎝
⎛
−
−−=
∞∞ ,
,lnv
avvvp
pppp
rRTpDM
dtdr
(2)
and
32, 4
3)(
3r
LITT
rCK
dtdT d
ddp
ad
π−−= ∞ . (3)
The effect of forced convection due to the difference in velocity between the droplets and the
surrounding air was neglected in this estimation since the initial air velocity was more or less
maintained throughout the 60-mm distance, as shown in Figure 4a. However, it is worth noting
that significant velocity difference between the droplets and the air may develop at longer
distances. The convective heat and mass transfers should be considered if a longer traveling
distance is concerned. Dependence on temperature by the vapor diffusion coefficient was not
considered since such a correction would be less than 3% under atmospheric conditions
(Kukkonen et al., 1989). Radiation heat exchange between the droplets and the surroundings was
also neglected. The effect of the solute on the saturation vapor pressure on the droplet surface
was included using Raoult’s law:
)(, dvawav TpXp = , where sw
ww mm
mX
+= (4)
The expiratory fluid was considered as a saline solution with NaCl content of 150 mM (Nicas et
al., 2005). This solute content led to about 0.3% drop in the saturation vapor pressure on the
surface of freshly produced expiratory droplets. The effect of other non-volatile components,
e.g., glycoprotein, on the hygroscopic behavior is still uncertain and was ignored in this
estimation. The temperature and vapor pressure of the surrounding air along the trajectory of the
droplets were taken from the FLUENT simulation results. The system of equations was
numerically solved by the fourth-order Runge-Kutta method.

Table 3 shows the average number count per person before and after the
evaporation/condensation correction at the 60 mm distance. Changes in average number were
found only for droplets smaller than 12 μm for speaking and 6 μm for coughing by the
correction. This is because the rate of change in droplet size was inversely proportional to the
droplet size as indicated in equation (2). The average number for the smallest size class increased
while the average number decreased for larger size classes. This indicates that the droplets
experienced growth by condensation during their travel. However, the change in size distribution
was minor due to the short travelling time and the small difference in vapor pressure between the
droplet surface and the surroundings. The traveling time for reaching 60 mm was 5.13 ms for
coughing and 15.4 ms for speaking, as estimated from the expiratory air jet velocity. This
estimation suggests that the hygroscopic property of the droplets was not the reason for the
reduction in the GM diameter measured at 60 mm compared to 10 mm. Droplets falling out of
the IMI measurement area by gravitation settling was also not likely to be the major reason. This
can be seen by a simple estimation of a free falling object. The maximum droplet travelling time
to the measurement positions was about 20 ms. The downward distance traveled by a free falling
object without air resistance after 20 ms can be calculated by y = (1/2)at2. With a gravitational
acceleration, a, of -9800 mm/s2, at 20 ms, y = -1.96 mm, this is shorter than half of the vertical
height of the IMI measurement area, 8.9 mm / 2 = 4.45 mm. The falling distance should be even
less in reality due to air resistance. From the above analysis, the change in GM diameter could be
caused mainly by the wider dispersion of droplets at the 60 mm distance induced by the
expansion of the air jet. The estimated evaporation/condensation did not affect the size
distribution at the 10 mm distance since the traveling time was even shorter than that for the 60
mm distance. The traveling time for reaching 10 mm was 0.86 ms and 2.56 ms for coughing and

speaking, respectively. These results suggest that the size distribution obtained at the 10mm
distance may essentially represent the ‘original’ size distribution at the mouth opening.
4.2 Estimation of total droplet number and concentration
The measurement volume of the IMI system covered a 6.7 mm × 8.9 mm plane that was 1mm
thick (about 60 mm3 in volume), which is much smaller than the expiration jet envelope.
Therefore, the IMI measurement results can only give the statistical size distribution. To estimate
the total number of droplets produced in each of the activities, two projection methods were
used. One method was to divide the total volume of droplets produced by the statistical size
profiles obtained by IMI. This method requires information about the total volume of droplets
produced for the particular expiratory action tested but this information is rare. Zhu et al. (2006)
reported that the total mass of expiratory droplets in a cough was 6.7 mg but no data for speaking
was reported. Total expiratory droplet volumes estimated from the droplet size profile reported
by Duguid, (1946) and Loudon & Roberts (1967) may also be used for this purpose. This is
because the methods employed by these two studies were intended to collect all the expiratory
droplets using collection media instead of using sampling-based instruments (e.g., Yang et al.,
2007 and Papineni & Rosenthal, 1997). Employing the data from studies using collection media
should give better estimations of the expelled fluid volume compared to those using sampling-
based instruments. This is because the sampling-based instruments tend to miss the larger
droplets but they are the major contributors to the total expelled fluid volume. The speaking
activity in Duguid’s (1946) and Loudon & Roberts’s (1967) studies was also counting from 1 to
100, as in the current study. The droplet number concentrations in the expiration jets were
roughly estimated by assuming that a tidal volume of air (≈0.4 L for adults) was exhaled in a

cough. It was also assumed that the air volume exhaled per vocalization during speaking
followed the ratio of expiration jet velocity obtained from PIV measurements. Therefore, for
example, an air volume of (3.1 / 11.7) × 0.4 L was exhaled by counting ‘one’. Three times of this
volume was exhaled when counting ‘nine-ty-four’. Table 4 shows the estimated total droplet
numbers using the measured size profile at 10mm. For coughing, the estimated total number
ranged from 1085 – 2085 per cough using different data from the literature. However, due to the
large difference in the reported droplet size profiles for speaking between Duguid (1946) and
Loudon & Roberts (1967), the estimated total number differed significantly for using the data
from different studies. The estimated droplet number concentrations are shown in Table 5.
Another estimation method was to divide the total number of droplets captured by the total laser
measurement volume. For example, if a total of 50 droplets was captured in a measurement in
which 1000 IMI images were taken, the droplet concentration would be 50 / (1000 × 60 mm3) =
8.3×10⁻⁴ mm-3. The estimated droplet number concentrations using this laser volume method are
shown in Table 5, in the column marked ‘L. V.’. Using the exhalation air volumes defined
above, the estimated total number of droplets expelled was 947 per cough and 4539 droplets
were expelled when counting 1 to 100. This estimation method does not require information on
the total expelled liquid volume (or mass), which is uncertain. However, in determining the total
laser measurement volume, the images taken between coughs (or vocalizations) and during
pauses were also counted. This could induce uncertainties into the estimation. Another possible
source of error is that the droplet concentration in the measurement volume did not necessarily
represent the droplet concentration in the entire exhalation jet envelope. The maximum droplet
concentration found in the current study was 5.2/cm3. With a maximum travelling time of around

20 ms, the likelihood of droplet coalescence, that might subsequently affect the size distribution
measurements, was estimated to be insignificant via a simple scale analysis.
Both of the estimation methods have limitations. The above estimations are by no means
comments on the accuracy of droplet number and total expiration droplet volume measurements
provided in previous studies. However, our results suggest that further studies are needed for
better estimation of total expiratory droplet number during different expiratory activities. This
information is important for estimating the amount of pathogens disseminated to the air by the
source patient, which is crucial for exposure and infection risk analysis studies.
4.3 Uncertainties and limitations of the droplet size measurement
According to Equation (1), the refractive index of the droplet material and the camera’s
observation angle are two parameters that can affect the calculation of the final droplet size. In
the current study, the refractive index of water (n = 1.33) was used in the calculation but the
presence of solutes in the expiratory fluid may alter the refractive index. Using equation 1, the
effect of shifting the refractive index on the calculated droplet size was estimated. The
estimation is shown in Figure 5 for n between 1.00 and 2.00. It shows that the difference in the
calculated droplet sizes within this range of refractive index compared to the calculated droplet
size using n = 1.33 are within 4%. A major change in the solute content due to
evaporation/condensation was not likely according to the estimations discussed in Section 4.1.
Using the same method, the difference in the calculated droplet size due to errors in observation
angle measurements is estimated and shown in Figure 5 for a range of ± 5o for the preset
observation angle, 80o. The figure shows that the difference in calculated sizes is within ±1.5%
for this error range of observation angle measurement.

It is also worth noting that the lower size detection limit of the IMI system was about 2μm.
Several other studies employing sampling-based instruments reported size peaks that are outside
the IMI detection limit (e.g. <0.6 μm for both coughing and talking by Papineni & Rosenthal,
1997), which suggests that the IMI system might not cover the entire size range of expiratory
droplets and other size modes exist outside the IMI detection limit. Another set of measurements
using APS conduced in the EDIS showed that it was the case. The APS measurements found size
modes at 0.8μm for different expiratory activities. Details of the APS measurements are reported
in another paper (Morawska et al., 2008). Discrepancies between results obtained by different
instruments in the similar measurement setup indicate that instrumentation is still a major
limitation in this kind of research. An instrument that is able to cover the entire size range of
expiratory droplets with minimal sampling loss is still lacking.
The volunteers followed certain protocols when coughing and speaking. Although real human
subjects were involved, the question of how representative the ‘artificially produced’ expiratory
activities in the current study of the real expiratory activities is worth further considering. For
example, the volunteers were asked to close their lips before each cough. They were also
allowed to drink water any time as they need. From the experimenters’ observation, each
volunteer drank around 1 – 2 cups (regular foam coffee cup size) of water in each set of
experiments. These practices might have an impact on the expiration jet velocity and droplet size
distribution, compared to coughs made in other mouth patterns, e.g., coughing several times in a
row without closing the lips. This study involved healthy volunteers only. The speaking activity
tested in the current study was counting 1 to 100. Different mouth movements can be involved if
different speaking patterns are tested. Different speech patterns may affect the droplet size

distribution and expiration jet velocity as well. On the other hand, a recent study by Hersen et al.
(2008) indicated that the size distributions of exhaled respiratory aerosols from symptomatic
individuals were different from that exhaled by healthy individuals. However, a specific size
distribution for symptomatic individuals was not identified in their study and the reason for
causing such a difference remains unclear. This also gives rise to the question that the exhalation
jet velocity could be different according to health conditions.
5. Conclusion
The size distributions of the droplets expelled during coughing and speaking (counting 1 to 100)
were measured by a series of experiments involving 11 human subjects. IMI method was used to
obtain droplet sizing measurements at very close distances from the mouth, i.e., 10 mm and 60
mm in the current study. The optical remote sensing technique could eliminate the errors induced
by air sampling techniques. The average expiration air jet velocity was 11.7 m/s for coughing
and 3.1 m/s for speaking using the PIV technique. Impacts of the evaporation/condensation
effects on the droplet size distributions were estimated by numerical method and the effect of the
hygroscopic behavior was found to be negligible on the droplet size distributions at such close
distances. Our numerical results indicate that the measured droplet size distributions can
essentially represent the ‘original’ size distributions immediately in front of the mouth. The
geometric mean diameter of the droplets expelled during coughing was 13.5 μm and it was 16.0
μm for speaking. It was estimated that 947 – 2085 droplets were expelled per cough and 112 –
6720 droplets were expelled during speaking. Using different estimation methods and literature
reference data, the droplet concentrations were found to range from 2.4 - 5.2 cm-3 per cough and
0.004 – 0.223 cm-3 for speaking.

Comparison between the results obtained at the two measurement distances (10 mm and 60 mm)
suggests that the measured size distributions might be distorted if the measurement was not made
as close as possible to the mouth opening. In this particular setup, the distortion was mainly due
to wider spread of the droplets following the expansion of the expiration jet, resulting in fewer
droplets being detected at the 60 mm location Our analysis also suggests that other influential
factors, including hygroscopic behavior and droplet falling, would become more significant if
the droplet sensing element was placed at further distances.
This study is the first one employing the IMI technique to measure the original droplet size
profiles from human expiratory activities. The droplet size distributions obtained in the current
study are more in line with that reported by Duguid (1946), who employed collection media in
his study. Estimating from Duguid’s (1946) results, the geometric diameters for coughing and
speaking were 14 µm and 16 µm, respectively. The geometric mean diameters reported by
Loudon & Roberts (1967) differed from the current study more significantly compared to
Duguid (1946) but their measured droplet size ranges (about 3 - 1500 μm) were also similar to
the current study. Size peaks in the submicron range were reported by some previous studies
using sampling-based instruments (e.g., 0.8 µm in Morawska et al., 2008, less than 0.6 µm in
Papineni & Rosenthal, 1997 and less than 0.3 µm in Fairchild & Stampfer, 1987), indicating that
there are expiratory droplets smaller than the detection limit of the IMI system. Limitations and
uncertainties of the IMI technique were also addressed in the paper. It seems that instrumentation
is still a major limitation for this kind of research and the IMI technique can only capture the
droplet profiles at the larger size range.
Acknowledgement

This research was jointly supported by the Australian Research Council Discovery Project
DP0558410 and Hong Kong RGC Grant 611505. The expiratory droplet investigation setup and
other related laser safety installations were provided by the International Laboratory for Air
Quality and Health, Queensland University of Technology. The IMI and PIV systems were
provided by The Hong Kong University of Science and Technology. Technical support provided
by the mechanical workshop of the Faculty of Science, Queensland University of Technology is
greatly appreciated.
Reference
Duguid, J. P. (1946) The size and the duration of air-carriage of respiratory droplets and
droplet-nuclei. J. Hyg. 44, 471-479
Fairchild, C. I. and Stamper, J. F. (1987) Particle concentration in exhaled breath. Am. Ind.
Hyg. Assoc. J. 48, 948-949
Glantschnig, W. J. and Chen, S. H. (1981) Light scattering from water droplets in the
geometrical optics approximation. Appl. Opt. 20, 2499-2509
Glover, A. R., Skippon, S. M. and Boyle, R. D. (1995) Interferometric laser imaging for
droplet sizing: a method for droplet-size measurement in sparse spray systems. App. Opt. 34,
8409-8421
Hawkey, P. M., Bhagani, S. and Gillespie, S. H. (2003) Severe acute respiratory syndrome
(SARS): breathtaking progress. J. Med. Microbio. 52, 609-613
Hersen, G., Mularat, S., Robine, E., Géhin, E., Corbet, S., Vabret, A. and Freymuth, F.
(2008) Impact of health on particle size of exhaled respiratory aerosols: case-control study.
Clean 36, 572-577

Jennison, M. W. (1942) Atomizing of mouth and nose secretions into the air as revealed by
high speed photography. Aerobiology, 17, 106-128
Kukkonen, J., Vesala, T. and Kulmala, M. (1989) The interdependence of evaporation and
settling for airborne freely falling droplets. J. Aerosol Sci. 30, 749-763.
Loudon, R. G. and Roberts, R. M. (1967) Droplet expulsion from the respiratory tract. Am.
Rev. Resp. Dis. 95, 435-442
McFadden, E. R., Pichurko, B. M., Bowman, H. F., Ingenito, E., Burns, S, Dowling, N. and
Solway, J. (1985) Thermal mapping of the airways in humans. J. Appl. Physiol. 58, 564-570
Morawska, L., Johnson, G. R., Ristovski, Z., Hargreaves, M., Mengersen, K., Chao, C. Y.
H., Wan, M. P., Li, Y., Xie, X. and Katoshevski, D. (2008) Droplets expelled during human
expiratory activities and their origin. In: Proceedings of the 11th International Conference on
Indoor Air Quality and Climate. Eds.: Størm-Tejsen, P., Olesen, B. W., Wargocki, P., Zukowska,
D., Toftum, J. Indoor Air 2008, Copenhagen, Denmark, paper ID: 1023, ISBN: 9788778772701
Nicas, M., Nazaroff, W. W. and Hubbard, A. (2005) Toward understanding the risk of
secondary airborne infection: emission of respirable pathogens. J. Occup. Environ. Hyg., 2, 143-
154
Papineni, R. S. and Rosenthal, F. S. (1997) The size distribution of droplets in the exhaled
breath of healthy human subjects. J. Aerosol Med. 10, 105-161
Rajaratnam, N. (1976) Turbulent Jet. Elsevier, Amsterdam
Yang, S., Lee, G. W. M., Chen, C. M., Wu, C. C. and Yu, K.P. (2007) The size and
concentration of droplets generated by coughing in human subjects. J. Aerosol Med. 20, 484-494
Zhu, S., Kato, S. and Yang, J. H. (2006) Study on transport characteristics of saliva droplets
produced by coughing in a calm indoor environment. Build. Environ. 41, 1691-1702

Nomenclature
Cp,d Heat capacity of water J/gK
dp Droplet diameter m
Dv Binary diffusivity of water vapor in air m2/s
fn Droplet number fraction
Id Evaporation/condensation rate of droplet g/s
Ka Thermal conductivity of air W/mK
L Latent heat of fusion/vaporization J/g
L0 Length of core zone (zone 1) of air jet m
ms Number of mole of solute M
Mv Molecular weight of water vapor g/M
mw Number of mole of water M
n Refractive index
p Total pressure Pa
pv,a Vapor pressure at droplet surface Pa
pv,∞ Saturation vapor pressure of air Pa
rp Droplet radius m
R Universal gas constant
R0 Radius of jet opening m
t Time s
Td Droplet temperature K
T∞ Air temperature K
Vx Horizontal air velocity m/s
Xw Mole fraction of water
y Vertical distance mm
λ Wavelength of laser light m
Δφ Fringe spacing m
ϕ Observation angle rad
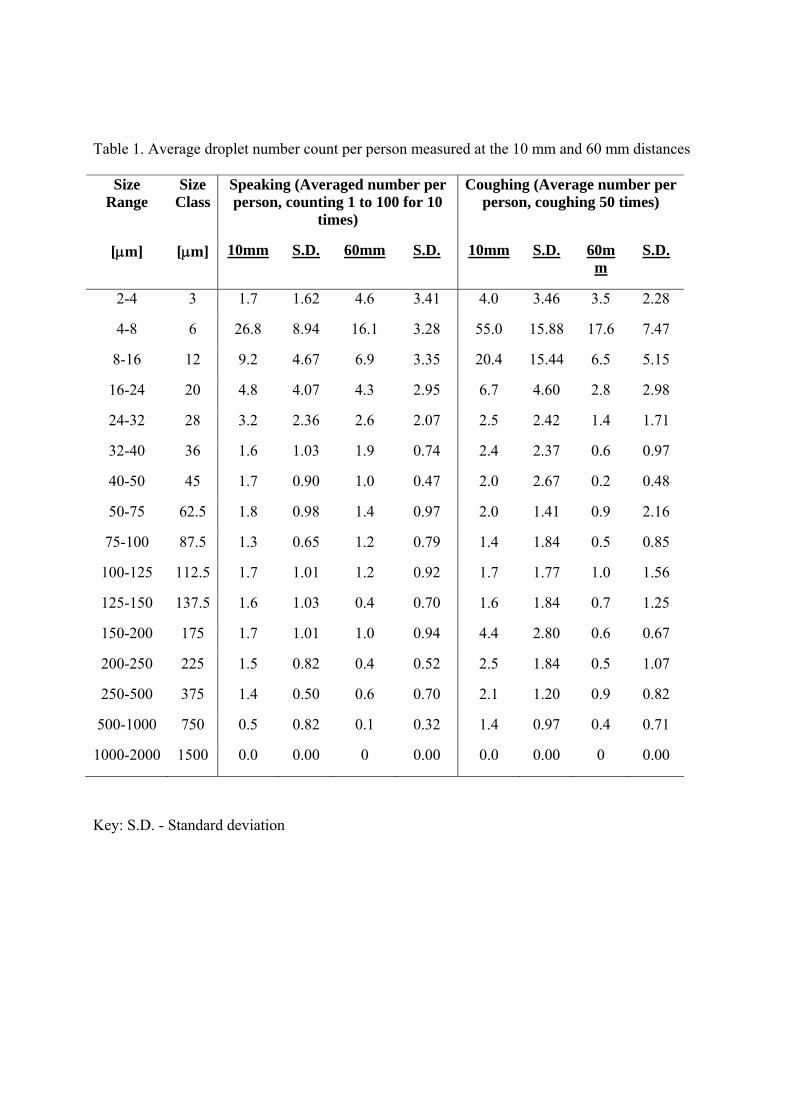
Table 1. Average droplet number count per person measured at the 10 mm and 60 mm distances
Size Range
Size Class
Speaking (Averaged number per person, counting 1 to 100 for 10
times)
Coughing (Average number per person, coughing 50 times)
[μm] [μm] 10mm S.D. 60mm S.D. 10mm S.D. 60mm
S.D.
2-4 3 1.7 1.62 4.6 3.41 4.0 3.46 3.5 2.28
4-8 6 26.8 8.94 16.1 3.28 55.0 15.88 17.6 7.47
8-16 12 9.2 4.67 6.9 3.35 20.4 15.44 6.5 5.15
16-24 20 4.8 4.07 4.3 2.95 6.7 4.60 2.8 2.98
24-32 28 3.2 2.36 2.6 2.07 2.5 2.42 1.4 1.71
32-40 36 1.6 1.03 1.9 0.74 2.4 2.37 0.6 0.97
40-50 45 1.7 0.90 1.0 0.47 2.0 2.67 0.2 0.48
50-75 62.5 1.8 0.98 1.4 0.97 2.0 1.41 0.9 2.16
75-100 87.5 1.3 0.65 1.2 0.79 1.4 1.84 0.5 0.85
100-125 112.5 1.7 1.01 1.2 0.92 1.7 1.77 1.0 1.56
125-150 137.5 1.6 1.03 0.4 0.70 1.6 1.84 0.7 1.25
150-200 175 1.7 1.01 1.0 0.94 4.4 2.80 0.6 0.67
200-250 225 1.5 0.82 0.4 0.52 2.5 1.84 0.5 1.07
250-500 375 1.4 0.50 0.6 0.70 2.1 1.20 0.9 0.82
500-1000 750 0.5 0.82 0.1 0.32 1.4 0.97 0.4 0.71
1000-2000 1500 0.0 0.00 0 0.00 0.0 0.00 0 0.00
Key: S.D. - Standard deviation

Table 2. Input conditions for the numerical simulations
Ambient air conditions: 24.9oC, 73.5%RH
Expiration air conditions: 37oC, 100%RH (McFadden et al., 1985)
Expiration air velocity 11.7 m/s (Coughing); 3.9 m/s (Speaking)
Mouth diameter: 15 mm

Table 3. Average droplet number count per person at 60 mm before and after the condensation
correction
Size
Range
Size
Class
Speaking (Averaged number per
person, counting 1 to 100 for 10
times)
Coughing (Average number
per person, coughing 50 times)
[μm] [μm] Measured Corrected Measured Corrected
2-4 3 4.6 5.0 3.5 3.8
4-8 6 16.1 16.4 17.6 17.3
8-16 12 6.9 6.2 6.5 6.5
16-24 20 4.3 4.3 2.8 2.8
24-32 28 2.6 2.6 1.4 1.4
32-40 36 1.9 1.9 0.6 0.6
40-50 45 1.0 1.0 0.2 0.2
50-75 62.5 1.4 1.4 0.9 0.9
75-100 87.5 1.2 1.2 0.5 0.5
100-125 112.5 1.2 1.2 1.0 1.0
125-150 137.5 0.4 0.4 0.7 0.7
150-200 175 1.0 1.0 0.6 0.6
200-250 225 0.4 0.4 0.5 0.5
250-500 375 0.6 0.6 0.9 0.9
500-1000 750 0.1 0.1 0.4 0.4
1000-2000 1500 0.0 0.0 0.0 0.0

Table 4. Estimated total expiratory droplet numbers produced during coughing and speaking
using the measured size profile at 10 mm.
Size Class Speaking Coughing
[μm] D L&R Z D L&R Z
3 3 191 76 39 67
6 50 2972 1041 542 924
12 17 1018 386 201 343
20 9 534 127 66 113
28 6 353 47 25 42
36 3 181 45 24 40
45 3 191 38 20 34
62.5 3 201 38 20 34
87.5 2 141 N.A. 27 14 24
112.5 3 191 32 17 29
137.5 3 181 30 16 27
175 3 191 83 43 74
225 3 161 47 25 42
375 3 151 40 21 35
750 1 60 27 14 24
1500 0 0 0 0 0
Total 112 6720 2085 1085 1850
Key:
D – refers to Duguid (1946), L&R – refers to Loudon & Roberts (1967), Z – refers to Zhu et al.
(2006)

Table 5. Estimated droplet number concentrations during coughing and speaking using the
measured size profile at 10 mm.
Size
Class
Speaking (L-1) Coughing (L-1)
[μm] D L&R Z L.V. D L&R Z L.V.
3 0.11 6.36 4.59 168 189 99 86
6 1.65 98.74 66.21 2311 2604 1355 1187
12 0.56 33.81 22.23 857 966 501 444
20 0.30 17.74 11.33 281 317 165 144
28 0.20 11.71 7.87 105 118 62 54
36 0.10 6.02 4.32 101 114 59 50
45 0.11 6.36 4.47 84 95 49 41
62.5 0.11 6.69 4.57 84 95 49 43
87.5 0.08 4.69 3.44 59 66 35 30
112.5 0.11 6.36 N.A. 4.52 71 80 42 36
137.5 0.10 6.02 4.31 67 76 39 34
175 0.11 6.36 4.52 185 208 108 93
225 0.09 5.36 3.85 105 118 62 53
375 0.08 5.02 3.45 88 99 52 44
750 0.03 2.01 1.11 59 66 35 30
1500 0.00 0.00 0.00 0 0 0.00 0
Total
(in cm-3)
3.72
(0.004)
223.25
(0.223)
150.80
(0.151)
5212
(5.212)
2713
(2.713)
4625
(4.625)
2368
(2.368)
Key:
D – refers to Duguid (1946), L&R – refers to Loudon & Roberts (1967), Z – refers to Zhu et al.
(2006), L.V. – estimation using laser measurement volume

Figure captions
Figure 1. Schematic diagrams of the expiratory droplet investigation setup
Figure 2. Measured air velocity fields for coughing and speaking from a male volunteer. The
block arrows indicate mouth position.
Figure 3a. Droplet size distribution for coughing.
Figure 3b. Droplet size distribution for speaking.
Figure 4a. Predicted horizontal air velocities at horizontal distances up to 100mm.
Figure 4b. Predicted distribution of air temperature and RH at horizontal distances up to 100 mm
Figure 5. Effect of the shifting of the refractive index and the observation angle on the calculated
droplet size

Figure 1. Schematic diagrams of the expiratory droplet investigation setup
Laser sheet
Safety screen
80o
CCD camera with macro lens
Mouth opening500mm
800mm
Nd:YAG Laser
Laser sheet optics and polarizer
Volunteer
Setup for IMI Setup for PIV
Laser sheet
Safety screen
PIV measurement area 45mm W x 60mm H
500mm
800mm
Nd:YAG Laser
Laser sheet optics and polarizer
Volunteer
Camera at 90o to the laser sheet

Figure 2. Measured air velocity fields for coughing and speaking from a male volunteer. The block arrows indicate mouth position.
Coughing Speaking

Figure 3a. Droplet size distribution for coughing.
0.0
0.1
0.2
0.3
0.4
0.5
0.6
0.7
1 10 100 1000 10000Size [micron]
dfn/d
ln(d
p)Coughing
This study, 10mm, GM = 13.5 micron
This study, 60mm, GM = 12.3 micron
Duguid (1946), coughing
Loudon & Roberts (1967), coughing

Figure 3b. Droplet size distribution for speaking.
0.0
0.1
0.2
0.3
0.4
0.5
0.6
0.7
1 10 100 1000 10000Size [micron]
dfn/d
ln(d
p)Speaking
This study, 10mm, GM = 16.0 micron
This study, 60mm, GM = 13.4 micron
Duguid (1946), speaking
Loudon & Roberts (1967), speaking

Figure 4a. Predicted horizontal air velocities at horizontal distances up to 100mm.
0
2
4
6
8
10
12
14
0 20 40 60 80 100Horizontal distance [mm]
Hor
izon
tal a
ir ve
loci
ty, V
x [m
/s]
10mm 60mm
Coughing
Speaking

Figure 4a. Predicted horizontal air velocities at horizontal distances up to 100mm.
34.0
34.5
35.0
35.5
36.0
36.5
37.0
37.5
0 20 40 60 80 100Horizontal distance x, [mm]
Air
tem
pera
ture
, [o C
]
96%
97%
98%
99%
100%
101%
102%
Rel
ativ
e hu
mid
ity
10 mm 60 mm
Air temperature, coughing
RH, coughing
Air temperature, speaking
RH, speaking supersaturated

Figure 5. Effect of the shifting of the refractive index and the observation angle on the calculated droplet size
1.0
1.1
1.2
1.3
1.4
1.5
1.6
1.7
1.8
1.9
2.0
0.95 0.96 0.97 0.98 0.99 1 1.01 1.02
Calculated size relative to the reference, Dp / Dp,n=1.33 or Dp / Dp,80o
Ref
ract
ive
inde
x, n
75
76
77
78
79
80
81
82
83
84
85
Obs
erva
tion
angl
e [d
eg]
Present observation angle
Water, n = 1.33