The impact of water droplet vibration on corona inception on ...
10
The University of Manchester Research The impact of water droplet vibration on corona inception on conductors under 50 Hz AC fields DOI: 10.1109/TPWRD.2018.2825886 Document Version Accepted author manuscript Link to publication record in Manchester Research Explorer Citation for published version (APA): Li, Q., Rowland, S., & Dupere, I. (2018). The impact of water droplet vibration on corona inception on conductors under 50 Hz AC fields. IEEE Transactions on Power Delivery. https://doi.org/10.1109/TPWRD.2018.2825886 Published in: IEEE Transactions on Power Delivery Citing this paper Please note that where the full-text provided on Manchester Research Explorer is the Author Accepted Manuscript or Proof version this may differ from the final Published version. If citing, it is advised that you check and use the publisher's definitive version. General rights Copyright and moral rights for the publications made accessible in the Research Explorer are retained by the authors and/or other copyright owners and it is a condition of accessing publications that users recognise and abide by the legal requirements associated with these rights. Takedown policy If you believe that this document breaches copyright please refer to the University of Manchester’s Takedown Procedures [http://man.ac.uk/04Y6Bo] or contact [email protected] providing relevant details, so we can investigate your claim. Download date:19. Aug. 2022
-
Upload
khangminh22 -
Category
Documents
-
view
0 -
download
0
Transcript of The impact of water droplet vibration on corona inception on ...

The University of Manchester Research
The impact of water droplet vibration on corona inceptionon conductors under 50 Hz AC fieldsDOI:10.1109/TPWRD.2018.2825886
Document VersionAccepted author manuscript
Link to publication record in Manchester Research Explorer
Citation for published version (APA):Li, Q., Rowland, S., & Dupere, I. (2018). The impact of water droplet vibration on corona inception on conductorsunder 50 Hz AC fields. IEEE Transactions on Power Delivery. https://doi.org/10.1109/TPWRD.2018.2825886
Published in:IEEE Transactions on Power Delivery
Citing this paperPlease note that where the full-text provided on Manchester Research Explorer is the Author Accepted Manuscriptor Proof version this may differ from the final Published version. If citing, it is advised that you check and use thepublisher's definitive version.
General rightsCopyright and moral rights for the publications made accessible in the Research Explorer are retained by theauthors and/or other copyright owners and it is a condition of accessing publications that users recognise andabide by the legal requirements associated with these rights.
Takedown policyIf you believe that this document breaches copyright please refer to the University of Manchester’s TakedownProcedures [http://man.ac.uk/04Y6Bo] or contact [email protected] providingrelevant details, so we can investigate your claim.
Download date:19. Aug. 2022

1
Abstract-- The relationship between the size of water droplets on the surface of AC high voltage conductors, their vibration and corona onset is investigated. Measurements have been carried out on individual droplets in high voltage experiments, including high speed photography, and discharge inception measurements. These have been correlated with acoustic emission from larger arrays of droplets on overhead transmission line conductors. A numerical model based on the finite element method has also been developed to simulate the vibration of the droplet enabling evaluation of the electric field and the characteristics of the droplet vibration. It is shown that the size of water droplet is critical in its mechanical response to the field and that corona does not necessarily occur when the droplet is deformed into its most conical state as is the case under DC fields. For larger droplets the phase shift between field and droplet vibration results in the maximum field occurring when the droplet is in a ‘flattened’ profile rather than when it is ‘pointed’. The phase relationship between the droplet vibration and the electric field thus controls the onset of corona. It is argued that conductors which facilitate the development of small, uniform, stable droplets on their surface are the cause of abnormally high levels of low-frequency audible noise sometimes observed by transmission utilities. Moreover the narrow resonant response of the droplet may lead to a difference in acoustic emissions experienced between power utilities with 50 Hz and 60 Hz system frequencies.
Index Terms-- overhead lines, acoustic, noise, corona discharge, vibration, water droplet, Finite Element Method.
I. INTRODUCTION
key aspect to the design of overhead line power transmission structures is the need to keep both acoustic
and high frequency electromagnetic emissions to acceptable levels. This requirement is sometimes re-stated as keeping corona discharges to an acceptable level. Designers have historically managed this by setting upper limits on the power frequency fields on conductor surfaces. The algorithms presently used were established in mid-20th century and are based on measurements made on traditional circular-stranded, mineral grease filled, aluminium clad steel reinforced (ACSR) conductors. To avoid the need to consider conductor strands and complications such as surface defects and wetting, the algorithms used by designers allow the assumption that conductors are perfect cylinders, and the maximum allowed design fields are compensated accordingly [1].
In contrast to traditional ACSR designs, recent developments of high temperature low sag (HTLS) conductors, designed to optimize power transfer through existing routes [2], use a wider range of alloys and strand geometries [1]. In addition, the need to increase the capacity of power transmission networks has pushed voltages to higher
levels. At the same time there is an environmental and planning imperative to make infrastructure as compact as possible, creating the aspiration to design for increased fields on conductor surfaces. At the same time, operational experience of some new designs of conductors has shown a deviation from the acoustic emissions predicted by the traditional, well proven, design tools. In particular low-frequency acoustic noise (hum) has been reported to be higher than acceptable in some cases [3–5].
In wet weather, raindrops which form on the surface of overhead line conductors distort the distribution of the local electric field. Due to the conductivity of rainwater, a divergent field appears around the droplets. This can result in corona discharge which then causes environmental concerns such as audible noise (AN) and radio interference (RI). Droplets also vibrate as a result of the alternating electric fields (i.e. the 50 or 60 Hz power system) and this develops additional self-modification of the field around the droplet. The formation of rain droplets on the surface of an overhead line conductor is affected by a number of factors. Weather conditions vary from region-to-region, and season-to-season and result in a wide range sized rain droplets on the surface of conductor. Results from both outdoor and laboratory measurements have shown that factors impacting audible noise generation include the surface electric field gradient, the surface finish and stranding shape, the surface hydrophobicity and the power frequency of the transmission line [5]. Experiments, an example of which is given in Figure 1, also reveal that, for example, a trapezoidal stranded conductor has a 6 dB (A) higher noise output compared to a circular stranded conductor with equivalent surface conditions, when the surface electric field is within the typical design range of 14 kV/cm to 17 kV/cm. If comparison is made between conductors with same surface shape but different hydrophobicity: the noise level from a hydrophobic conductor can be seen to be approximately 10 dB (A) higher than on the same trapezoidal strands which are hydrophilic. Experimental details can be found in [6].
Understanding how water droplet size controls acoustic emissions demands an understanding of the relationship between water droplet size, the conductor surface, droplet vibration and corona discharge. This paper describes experimental and simulation work carried out to understand the dynamic behaviour of a drop of water subjected to an alternating power frequency electric field, and the subsequent impact on corona behaviour.
Qi Li, Member, IEEE, Simon M. Rowland, Fellow, IEEE, Iain Dupere
The impact of water droplet vibration on corona inception on conductors under 50 Hz AC fields
A

2
II. DROPLET FORMATION ON CONDUCTOR SURFACES
Naturally occurring droplet size distributions on the surface of an overhead line conductor are primarily determined by the hydrophobicity of the surface. To evaluate the effect of hydrophobicity on the droplet size, a short section of conductor sample was treated by either polishing the surface (to render it hydrophilic) or applying a thin film of silicone rubber (to render it hydrophobic). After the treatment, three samples with contact angles of 63°, 75° and 104° were produced. These were subjected to the same wetting condition (a continuous fine mist spray) until fully wetted. A photograph of a single short length of conductor treated in this way is shown in Figure 2a [7].
An imaging technique, based on the Young–Laplace equation was utilized to estimate the size of the droplets presented on the surface. The distribution is plotted in Figure 2b [7]. It is observed that: the average droplet size is larger for a more hydrophilic
surface (1µl at 104°, 5 µl at 75°, and 7 µl at 63°) the standard deviations for surfaces with different
hydrophobicity are: 0.92 µl, 3.21 µl and 2.84 µl for contact angles of 104°, 75° and 63° respectively. A further experiment has been performed on high voltage
overhead line conductors to study the behaviour of large populations of water droplets. Two types of conductor were considered: firstly, one with traditional circular strands, and secondly, one with trapezoidal strands [1]. These were chosen since experience has shown these give different acoustic noise performance and water droplets physically sit and move on their surfaces differently.
Twenty sessile drops and twenty pendent drops (50 µl in volume each) were manually applied on the top and bottom surface of 20 cm sections of conductors using a micrometer syringe. A 50 Hz voltage of 110 kV rms, equivalent to a surface gradient on a uniform cylinder of equivalent radius of 18 kV/cm rms, was applied for 5 minutes, after which an equilibrium state had been reached. A high speed camera
capturing 1200 frames per second was used to record the motion. The images captured were processed using image deblurring algorithms and edge-detection algorithms to accurately define the boundaries of droplets. Ejection phenomena were observed from trapezoidal-strand conductors as fine water-jets and droplets are continuously being ejected from the tip of larger water droplets. For traditional hydrophilic, circular-strand conductors however, there are no ejection phenomena because that there is no hydrophobic flat surface on which droplets can become stable, larger droplets readily run off and round the conductor. After five minutes, thirty-four sessile drops and twenty-one pendent drops developed on the trapezoidal-strand conductor while twenty sessile drops and eighteen pendent drops developed on the circular-strand conductor. This is a typical result, leading to the conclusion that the trapezoidal-strand conductor tends to increase the population of drops while reducing the individual average volume through fission to a very uniform size. Circular-strand conductors retain the droplets approximately in their initial condition. Moreover, in general terms, under continuous wetting (a condition defined in [5]) the smaller droplets tend to be stable on the trapezoidal surface, but run off the surface in the circular strand case. Experience shows that changing the hydrophobicity and roughness of a conductor can produce a range of effects (as shown in Figure 2). However the descriptions of the performance of these two commercial conductors have been given here to illustrate the range of potential properties.
In summary, trapezoidal strand conductors tend to have a
higher noise output compared to the circular-strand equivalent conductors if their average radii are same. Emitted noise level increases when the surface of the trapezoidal-strand conductor is made more hydrophobic. This is because hydrophobic, trapezoidal strands tend to sustain a uniform sized set of water droplets on its surface, rather than a wider ranging set of apparently random sizes over the surface of a circular strand conductor. There is a need to develop a quantified view of this complex situation. The purpose of the work here is to link the water droplet size distribution to noise generation by establishing the relationship between droplet vibration, droplet size and the onset of corona.
III. LITERATURE REVIEW
Research of corona discharge initiated from pointed geometry, first established onset fields from solid surfaces at values of 3 kV/mm (rms) [8–10]. Subsequent experiments
Fig. 1. Audible noise level comparison for wetted hydrophobic trapezoidal, hydrophilic trapezoidal and hydrophobic round stranded conductors with equivalent diameter [5]. Contact angle (CA) quantifies strand hydrophobicity.
a) b)
Fig. 2. a). Formation of water droplets on the surface of different hydrophobicities; b). Measured droplet size distribution, with associated box and whisker plot and fitted normal distributions [7].

3
extended considerations to liquids, and considered dynamic surface/droplet distortion in high electric fields [11,12]. Taylor and Wilson conducted a seminal experiment on corona inception by using soap-bubbles in 1925 [13]. A further classic experiment by Taylor quantified the maximum vertex angles developed before a liquid surface becomes unstable (resulting in ejection of small jets of fluid) [14]. Being inspired by Taylor’s cone, a number of researchers conducted further investigations on this electro-hydrostatic phenomenon [15–23].
More recently interest has developed around the role of the dynamic behaviour of liquids on the surface of insulating materials [24–29]. Rowland and Lin [30] investigated this electro-hydrostatic phenomenon by applying alternating voltage to two adjacent droplets and identified that the contact angle of the insulating solid surface plays an important role in evolution of surface discharges on wet insulating materials.
Teich and Weber considered AC droplet vibration phenomena on transmission line conductors [31]. However due to the limited imaging technology, most of the work in this area assumes that the vibration of droplets under AC field has little impact on the inception of corona discharge [32,33]. The work here provides the opposite conclusion.
IV. METHODOLOGY
A. Experimental
To study the mechanical and electrical behaviour of droplets under alternating electric fields, a sphere-to-plane metallic electrode geometry is used as shown in Figure 3. The sessile arrangement is shown, but pendant droplets are studied by inverting the electrode geometries. The advantage of using a sphere-to-plane geometry is that the axial-rotational symmetry can avoid non-symmetrical effects (depending on the mode of droplet vibration) associated with a cylindrical conductor. The design parameters which determine the distribution of the electric field surrounding the sphere are: the diameter of the aluminium sphere, the distance of the gap between sphere and plane electrode. An electrostatic simulation based on the finite element method was used to choose parameters resulting in a surface stress equivalent to a typical overhead line conductor in service [1]. The earth plate has smooth round edges to prevent undesired corona discharges, and its diameter is sufficient to act as an infinite plane to the water droplet sitting on the sphere. The conductors tested to produce the results shown in Figure 1 were designed to have an average field of 16.5 kV/cm on the surface of the conductors in service. The tip of the sphere in the experiment is thus kept at 16.5 kV/cm by varying the supply voltage and the distance between sphere and plane, although in this case the field is divergent in two planes, not one as for a cylindrical geometry.
The design of the optical system concerns not only the level
of image quality obtained but also the accuracy of synchronisation between image and electrical signal being measured. To study the vibration characteristics, the shape of the droplet was captured with a high speed video camera. The quality of the image was improved by utilizing an intense back-light to establish a stable white background. However UV detection can be used to image discharges more sensitively. UV light from corona discharge has a wavelength ranging from 190 nm to 400 nm and is filtered out by standard optical lenses. To be able to capture UV emission from corona discharge, a Nikon 105mm F4.5 UV Lens was employed. To capture the relatively low light intensity of UV emission from corona discharge with the high speed camera, a high speed gated image intensifier (Hamamatsu C10880) was used to magnify the light intensity by a factor of 1000. This gave sufficient light intensity for the high speed camera to capture UV events. This electronic amplification increases the noise level presented on the image, so captured images are post-processed to reduce the noise.
As a result of the techniques used, capturing droplet shape and corona discharge requires completely different back light intensity, and this imposes a technical difficulty of obtaining high quality images of droplet shape and corona discharge simultaneously. A trade-off has to be made to determine the best back light condition to capture a clear droplet shape and corona discharge activity.
Synchronisation between images and measured voltages is achieved by electronic signal processing as shown in Figure 3. External triggers control both the image intensifier and camera. Buffers are introduced to store signals which are then assigned to individual images with the correct time reference. Analogue measurements from the voltage divider are digitised for easier synchronisation with discrete images. The measuring speed and resolution can be varied according to need (Table I). The overall experimental platform has been designed to achieve satisfactory quality of images and accuracy of synchronisation.
An 80 kV transformer is employed as the HV supply, as shown in Figure 4. A 125 kilo ohm resistor limits any potential flashover current. A spark gap protection device is introduced to protect the secondary measurement circuit. A voltage divider is used to determine the supplied voltage value on the spherical electrode. Rain-water in Manchester has an average conductivity of 80 μs/cm, and this value was used as a standardized value for the laboratory testing.
Fig. 3. Schematic of the instrumentation. Not shown is the HV connection to the two electrodes, captured in figure 5.
4
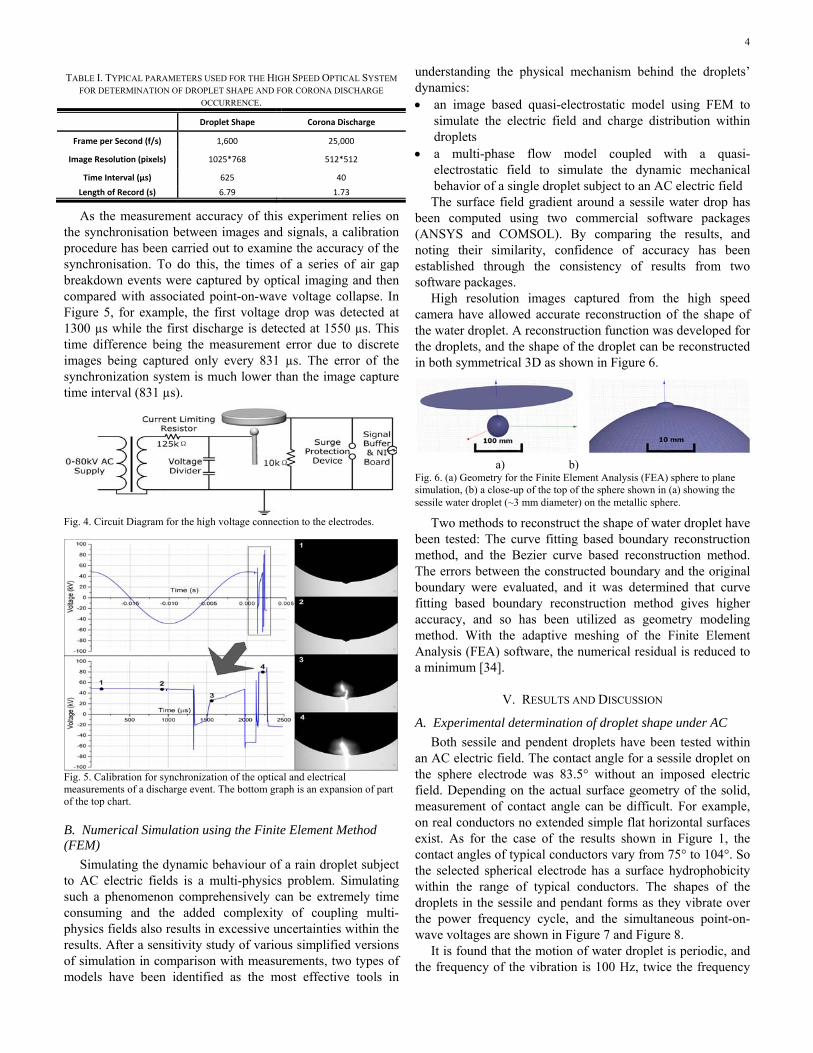
As the measurement accuracy of this experiment relies on
the synchronisation between images and signals, a calibration procedure has been carried out to examine the accuracy of the synchronisation. To do this, the times of a series of air gap breakdown events were captured by optical imaging and then compared with associated point-on-wave voltage collapse. In Figure 5, for example, the first voltage drop was detected at 1300 µs while the first discharge is detected at 1550 µs. This time difference being the measurement error due to discrete images being captured only every 831 µs. The error of the synchronization system is much lower than the image capture time interval (831 µs).
B. Numerical Simulation using the Finite Element Method (FEM)
Simulating the dynamic behaviour of a rain droplet subject to AC electric fields is a multi-physics problem. Simulating such a phenomenon comprehensively can be extremely time consuming and the added complexity of coupling multi-physics fields also results in excessive uncertainties within the results. After a sensitivity study of various simplified versions of simulation in comparison with measurements, two types of models have been identified as the most effective tools in
understanding the physical mechanism behind the droplets’ dynamics: an image based quasi-electrostatic model using FEM to
simulate the electric field and charge distribution within droplets
a multi-phase flow model coupled with a quasi-electrostatic field to simulate the dynamic mechanical behavior of a single droplet subject to an AC electric field The surface field gradient around a sessile water drop has
been computed using two commercial software packages (ANSYS and COMSOL). By comparing the results, and noting their similarity, confidence of accuracy has been established through the consistency of results from two software packages.
High resolution images captured from the high speed camera have allowed accurate reconstruction of the shape of the water droplet. A reconstruction function was developed for the droplets, and the shape of the droplet can be reconstructed in both symmetrical 3D as shown in Figure 6.
Two methods to reconstruct the shape of water droplet have
been tested: The curve fitting based boundary reconstruction method, and the Bezier curve based reconstruction method. The errors between the constructed boundary and the original boundary were evaluated, and it was determined that curve fitting based boundary reconstruction method gives higher accuracy, and so has been utilized as geometry modeling method. With the adaptive meshing of the Finite Element Analysis (FEA) software, the numerical residual is reduced to a minimum [34].
V. RESULTS AND DISCUSSION
A. Experimental determination of droplet shape under AC
Both sessile and pendent droplets have been tested within an AC electric field. The contact angle for a sessile droplet on the sphere electrode was 83.5° without an imposed electric field. Depending on the actual surface geometry of the solid, measurement of contact angle can be difficult. For example, on real conductors no extended simple flat horizontal surfaces exist. As for the case of the results shown in Figure 1, the contact angles of typical conductors vary from 75° to 104°. So the selected spherical electrode has a surface hydrophobicity within the range of typical conductors. The shapes of the droplets in the sessile and pendant forms as they vibrate over the power frequency cycle, and the simultaneous point-on-wave voltages are shown in Figure 7 and Figure 8.
It is found that the motion of water droplet is periodic, and the frequency of the vibration is 100 Hz, twice the frequency
TABLE I. TYPICAL PARAMETERS USED FOR THE HIGH SPEED OPTICAL SYSTEM
FOR DETERMINATION OF DROPLET SHAPE AND FOR CORONA DISCHARGE
OCCURRENCE.
Droplet Shape Corona Discharge
Frame per Second (f/s) 1,600 25,000
Image Resolution (pixels) 1025*768 512*512
Time Interval (µs) 625 40
Length of Record (s) 6.79 1.73
Fig. 4. Circuit Diagram for the high voltage connection to the electrodes.
Fig. 5. Calibration for synchronization of the optical and electrical measurements of a discharge event. The bottom graph is an expansion of part of the top chart.
a) b) Fig. 6. (a) Geometry for the Finite Element Analysis (FEA) sphere to plane simulation, (b) a close-up of the top of the sphere shown in (a) showing the sessile water droplet (~3 mm diameter) on the metallic sphere.

5
of the supply voltage. The droplet experiences a stretching process and a compression process within each half-period of 10 ms. Nine images have been selected to present the vibration characteristics for both sessile and pendent droplets. The shape of the droplets alters through each half power cycle between three states or outline shapes: semi-spherical, flattened, and conical.
It is also observed that in the cases detailed in Figure 7 and Figure 8 the applied voltage is close to the point-on-wave maximum when the shape of water droplet is flattened, and close to its minimum when the droplet is approaching the conical shape. From a vibration point of view, this phenomenon can be described by a phase shift between excitation force and response of nearly 90 degrees.
B. Results from the image-based electro-quasistatic model
The axial-symmetrical simulation from the electro-quasistatic model has been generated, and the 2D axial-symmetrical result is rotated to reconstruct the surface field distribution of the complete single droplet as shown in Figure 9. For reference, the original image from the high speed camera is attached in the first row. The second row shows the electric field distribution within the air surrounding the water droplet. The third row plots the 3-D surface electric field. As noted previously, the electric stress reaches its maximum when the shape of water droplet is flattened while encounters a minimum when the droplet is approaching the conical shape.
In Figure 10, the maximum electric field around the droplet
surface is plotted with applied voltage against time. Each point and associated number describes the maximum electric field strength for one FEA simulation as shown in Figure 9.
Figure 11 describes the enhancement that the droplet shape alone has on the electric field. To facilitate this, a field enhancement factor, due only to the shape of the drop (that is ignoring the effect of phase difference), is calculated from:
(1)
A natural position is first selected (position 11) at which the vertex of the droplet is closest to its height when no electric field is applied. When a constant DC voltage is applied to various shapes of droplet, the maximum electric field for the undisturbed natural position (at t0) and an instant time (t) are labelled Emax(t0) and Emax(t) respectively.
Fig. 7. Droplet Motion (sessile drop) shown with the instantaneous voltage.
Fig. 8. Droplet Motion (pendent drop) shown with the instantaneous voltage.

6
In Figure 11, positions 1-5 and 13 can be classified as
having flattened droplets. Positions 6 and 12 have a semi-spherical shape. Positions 7-10 are characterised by a conical shape. The field enhancement factor is approximately 0.8 for both flattened and semi-spherical shapes and increases to 1.3 for the conical shape. This result demonstrates that for this water droplet, the shape of water droplet can either enhance the maximum electric stress (by 30%) or reduce the maximum stress (by 20%). The modification of electric field depends on the combination of shape and instantaneous voltage. As an example, if the highest voltage is applied at position 7 or 8, the resultant maximum electric field will be 1.3 times higher than if it is applied at position 11.
The established field enhancement curve as shown in Figure 11 is related to this specific sized droplet, if the size of the droplet changed, this enhancement curve will change. At higher electric fields, it is expected that the factor K(t) will increase when the shape of the droplet is stretched further (i.e. the droplet will become more elongated and flattened). Ultimately there will be a field at which a droplet will become unstable [14]. As a result, K(t) can be written as a function of field, E, and droplet volume, V, as K(t, E, V).
C. Vibration characteristics and droplet size
The previous study examined the vibration characteristics of a typical but arbitrary droplet size. It is expected that when the size of the droplet changes, its vibration performance (in particular, the phase shift between input voltage and the magnitude of vibration) will also alter due to the mass of the vibration system being modified. The previous section illustrated that different shapes of the droplet result in different electric field enhancements, but the phase relationship between applied voltage and droplet motion means that in that case the maximum field occurred with the flattened shape. As
corona discharge initiates at a critical level of electric field, it is proposed that a different size of droplet will have different corona emission characteristics due to the different shape/phase relationship.
To verify this hypothesis, an experiment was designed to
capture both water droplet shape and corona discharge simultaneously. The droplet size is controlled by a micrometre syringe with a precision of 0.2 µl. A range of sizes of droplets (2, 3, 5, 6, 7 and 8 µl), with an equivalent diameter of a hemisphere of the same volume as: 2.0, 2.3, 2.7, 2.8, 3.0 and 3.1 mm respectively were applied on the sphere to plane experiment introduced previously in Figure 3. The sizes are chosen to represent a range of naturally occurring droplets on the conductor surface as shown in Figure 2.
The water droplet shape and corona discharge captured are presented in Figure 12. The magnitude of the vibration (measured from the tip of droplet to the base of the electrode) and the intensity of corona discharge (quantified by the intensity of photon emission from corona discharge) are plotted against the instantaneous applied voltage in Figure 13.
Fig. 9. Electric field evolution within half a power cycle for a sessile droplet. Peak fields are given in kV/cm.
Fig. 10. Electric Field and Applied Voltage within One Cycle.
Fig. 11. Electric field enhancement factor (K) for different droplet shapes

7
It is found that:
For a relatively small droplet (2 µl), only negative corona initiation has been captured by the high speed optical system. This result is consistent with previous observations that negative corona discharge starts at a lower voltage level than positive corona discharge [35].
For a droplet of size 3 and 5 µl, both positive and negative corona have been captured
For a smaller sizes (2 and 3 µl), the shape of the droplet is stretched into conical shape when the highest voltage
(electric field) exists while for the larger sizes (5 and 8 µl), the shape of the droplet is flattened into ellipse shape when the highest voltage (E field) exists as described previously.
The corona discharge initiated from the tip of the conical shape in both the 2 µl and 3 µl case while from the 5 µl and 8 µl case, corona is initiated from multiple locations from the flattened surface.
Figure 13 shown that the phase delay between the vibration magnitude and the applied instantaneous voltage has been increased significantly when droplet size increases.
VI. DISCUSSION
Using the small-scale sphere-to-plane experiment, a single droplet subject to AC electric field has been investigated. It is observed that droplet vibrates from a conical shape to flattened shape at twice the power frequency (100 Hz). By synchronising the voltage signal with the high speed images, the electric field associated with each image has been calculated from an FEA model. The calculations have shown that the electric field varies with both droplet shape and applied voltage. It is observed that for a large water droplet of 5 μl, the electric stress reaches its maximum when the shape of water droplet is flattened and encounters a minimum when the droplet is approaching the conical shape. This counter-intuitive result arises because of the phase lag between applied voltage and the resulting vibration. Without consideration of the phase relationship, the maximum field enhancement resulting from a conically extended droplet might otherwise be expected to have a field 1.3 times higher than its natural shape [7].
It has been verified by experiment that the phase relationship between the shape function of a water droplet sitting on a conductive surface and the applied voltage is strongly dependent to the size of droplet. 2 μl and 3 µl droplets see the highest electric field when the shape becomes conical while a 5 µl droplet experiences the highest electric field when the shape becomes flattened. The 8 µl flattened phase is somewhat less well defined giving less reproducible corona initiation points. The implications of this, also verified by experiment, are that the onset of corona is different in its nature in each case. In particular, for smaller droplets, discharges occur at a singular, central point on the water droplet when it is in a conical shape, whereas for a larger droplet corona will occur on the circular surface, presented as an edge on the flattened droplet of the well-defined 5 µl case.
Ejection phenomena are observed on droplets under AC excitation [30]. At higher fields large droplets eject sub-droplets to reduce their mass until stability is reached. This indicates that although the rain droplets can form randomly as an initial condition, their sizes tend to approach a certain value which is the threshold value under which droplets can vibrate stably without losing any mass. Empirical study of a large population of droplets on cylindrical conductors, has shown the vibration frequencies of droplets are identified to be distributed mainly at 100 Hz while some are at 200 Hz [36]. Droplets can reduce their mass by ejection until a steady state
Fig. 12. High speed images with UV detection for corona discharge from vibrating droplets.
Fig. 13. The phase-resolved diagram of corona discharges for various sized vibrating droplets.

8
vibration process is reached. This ejection process is controlled mainly by the surface condition of the conductor. It has been confirmed by experiment that a very uniform hydrophobic surface with flattened strand shapes, can give rise to a uniform set of water droplets all of which vibrate synchronously [36].
We argue that the unusual acoustic emissions experienced by some new conductor designs are a result of the establishment of uniform droplets over the surface of the conductor. Normally the naturally occurring range of conditions on the surface, due to geometry, pollution, greases, and oxidation result in a wide range of droplet sizes. These will vibrate with various amplitudes and phases. However, if a very uniform hydrophobic surface is achieved, a uniform sized set of droplets will naturally form, and be sized according to emission of fluid from the larger droplets. Because these uniform droplets will vibrate in the same way, they will all generate corona at the same point on wave, generating synchronised acoustic waves. As a result the overhead line conductors can operate as effective transducers at low frequencies – producing the anomalous hum effect. This is a different sound quality from the typical random corona noise (buzz) generated by corona from thousands of randomly vibrating droplets. Indeed the human ear is particularly sensitive to such hum, and the lower acoustic frequencies can penetrate buildings so that the environmental impact is more significant [37]. These observations do not imply that this is the only noise-generating mechanism; corona discharge and ionic vibration [4] may also contribute, but the circumstances in which low frequency hum can be substantially increased in volume as a result of particular conductor surface properties and environmental conditions has been identified.
VII. CONCLUSION
It has been shown that water droplets of different sizes will vibrate with different phase relationships to the power frequency. If the electric field is high enough corona inception will also occur at different times during the power frequency for different droplet sizes because of the varying phase relationships. For smaller droplets corona inception occurs when the droplet is extended into a cone, and from the tip of the cone: for larger droplets the highest fields occur when the droplet is in a flattened shape. Corona is seen to occur in various physical locations on a droplet in the latter case.
New high voltage overhead line conductors have inadvertently created surfaces which generate uniform and stable water droplets. This is because segmented strands present flatter surfaces and they have a relatively high and uniform hydrophobicity. The authors propose that as a result, the acoustic emission from vibration and corona activity are synchronised over large lengths of the conductors and maximum acoustic volume is thus achieved. Such synchronisation does not allow for random phase cancellation which would normally be expected, and historically experienced by previous conductor designs. This explains the recent experiences of higher noise generated by novel conductors than previously experienced.
It is proposed that by purposefully generating more randomised surfaces on conductors, the issue of hum can be negated. It is also noted that due to the proximity of the droplets’ mechanical resonance to the power frequency, noise levels from 50 Hz and 60 Hz power systems may be significantly different from the same conductor, and experience in different part of the world may not be identical.
VIII. REFERENCES [1] Q. Li, S. M. Rowland, and R. Shuttleworth, “Calculating the Surface
Potential Gradient of Overhead Line Conductors,” Power Delivery, IEEE Transactions on, vol. 30, no. 1. pp. 43–52, 2015.
[2] K. Kopsidas and S. M. Rowland, “A Performance Analysis of Reconductoring an Overhead Line Structure,” IEEE Trans. Power Deliv., vol. 24, no. 4, pp. 2248–2256, Oct. 2009.
[3] K. Tanabe, “Experimental study on the prediction of hum noise from conductor bundles for UHV transmission lines,” Electr. Eng. Japan, vol. 125, no. 1, pp. 27–36, 1998.
[4] U. Straumann, “Mechanism of the tonal emission from ac high voltage overhead transmission lines,” J. Phys. D. Appl. Phys., vol. 44, no. 7, p. 75501, 2011.
[5] Q. Li, R. Shuttleworth, G. Zhang, I. Dupere, and S. M. Rowland, “Acoustic noise evaluation for overhead line conductors,” in Electrical Insulation Conference (EIC), IEEE, pp. 119–123, 2013.
[6] Q. Li, S. Rowland, I. Dupere, and R. Shuttleworth, “Acoustic Noise Evaluation for Overhead Line Conductors using an Anechoic Chamber,” IEEE Transactions on Power Delivery, vol. PP, no. 99. p. 1, 2016.
[7] Q. Li and S. M. Rowland, “Wet conductor surfaces and the onset of corona discharges,” in 2015 IEEE Conference on Electrical Insulation and Dielectric Phenomena (CEIDP), 2015, pp. 245–248.
[8] J. Zeleny, “The Discharge of Electricity from Pointed Conductors Differing in Size,” Phys. Rev., vol. 25, no. 5, pp. 305–333, Nov. 1907.
[9] Z. X. Li, G. F. Li, J. B. Fan, and Y. Yu, “Corona Onset Voltage of Bipolar Bundle Conductors of HVDC Transmission Line,” IEEE Transactions on Power Delivery, vol. 26, no. 2. pp. 693–702, 2011.
[10] M. Farzaneh, J. Zhang, and X. Chen, “Modeling of the AC arc discharge on ice surfaces,” IEEE Transactions on Power Delivery, vol. 12, no. 1. pp. 325–338, 1997.
[11] J. Zeleny, “The Electrical Discharge from Liquid Points, and a Hydrostatic Method of Measuring the Electric Intensity at Their Surfaces,” Phys. Rev., vol. 3, no. 2, pp. 69–91, Feb. 1914.
[12] J. Zeleny, “Instability of Electrified Liquid Surfaces,” Phys. Rev., vol. 10, pp. 1–6, Jul. 1917.
[13] C. T. R. Wilson and G. I. Taylor, “The bursting of soap-bubbles in a uniform electric field,” Proc. Camb. Philol. Soc., vol. 22, pp. 728–730, Jul. 1925.
[14] G. Taylor, “Disintegration of water drops in an electric field,” Proc. R. Soc. London, vol. 280, no. 1382, pp. 383–397, 1964.
[15] Z. Guan, L. Wang, B. Yang, X. Liang, and Z. Li, “Electric field analysis of water drop corona,” IEEE Transactions on Power Delivery, vol. 20, no. 2. pp. 964–969, 2005.
[16] Z. Zhang, X. Jiang, H. Huang, C. Sun, J. Hu, and D. W. Gao, “Study on the Wetting Process and Its Influencing Factors of Pollution Deposited on Different Insulators Based on Leakage Current,” IEEE Transactions on Power Delivery, vol. 28, no. 2. pp. 678–685, 2013.
[17] A. I. Grigor’ev and S. O. Shiryaeva, “The mechanism of corona discharge from a water droplet,” J. Eng. Phys., vol. 60, no. 4, pp. 481–488, 1991.
[18] M. Brahami, et. al. “Numerical Analysis of the Induced Corona Vibrations on High-Voltage Transmission Lines Affected by Rainfall,” IEEE Transactions on Power Delivery, vol. 26, no. 2. pp. 617–624, 2011.
[19] W. N. English, “Corona from a Water Drop,” California Univ., Berkeley. Dept. of Physics., Jul. 1948.
[20] A. I. Zhakin, “Electrohydrodynamics of charged surfaces,” Physics-Uspekhi, vol. 56, no. 2, pp. 141–163, Feb. 2013.
[21] X. Jiang, S. Wang, Z. Zhang, S. Xie, and Y. Wang, “Study on AC Flashover Performance and Discharge Process of Polluted and Iced IEC Standard Suspension Insulator String,” IEEE Transactions on Power Delivery, vol. 22, no. 1. pp. 472–480, 2007.
[22] F. Ianna, G. L Wilson and D. J. Bosack, “Spectral Characteristics of Acoustic Noise from Metallic Protrusions and Water Droplets in High

9
Electric Fields”, IEEE Transactions on Power Apparatus and Systems, Vol. PAS-93, Nov/Dec 1974, pp. 1787-1795.
[23] J. F. Hoburg, J. R. Melcher, “Current-Driven, Corona-Terminated Water Jets As Sources of Charged Droplets and Audible Noise”, IEEE Transactions on Power Apparatus and Systems, Vol. PAS-94, January 1975, pp. 128-136.
[24] A. J. Phillips, D. J. Childs, and H. M. Schneider, “Water drop corona effects on full-scale 500 kV non-ceramic insulators,” IEEE Transactions on Power Delivery, vol. 14, no. 1. pp. 258–265, 1999.
[25] Y. Zhu, K. Haji, M. Otsubo, C. Honda, and N. Hayashi, “Electrohydrodynamic behaviour of water droplet on an electrically stressed hydrophobic surface,” J. Phys. D. Appl. Phys., vol. 39, no. 9, pp. 1970–1975, May 2006.
[26] Y. Higashiyama, T. Yamada, and T. Sugimoto, “Vibration of water droplet located on a hydrophobic sheet under the tangential AC field,” Industry Applications Conference, vol. 3. pp. 1825–1830 vol.3, 1999.
[27] S. Kumagai and N. Yoshimura, “Hydrophobic transfer of RTV silicone rubber aged in single and multiple environmental stresses and the behavior of LMW silicone fluid,” IEEE Transactions on Power Delivery, vol. 18, no. 2. pp. 506–516, 2003.
[28] R. Sarathi, V. S. Harsha, N. J. Vasa, H. Griffiths, and A. Haddad, “Water droplet initiated discharges on epoxy nanocomposites under DC voltages,” IEEE Transactions on Dielectrics and Electrical Insulation, vol. 23, no. 3. pp. 1743–1752, 2016..
[29] S. Yamashita, T. Hashiguchi, et. al, “Behavior of water droplets and their charged distribution on polymer surface,” Electrical Insulating Materials, Proceedings of 2001 International Symposium on. pp. 59–62, 2001.
[30] S. M. Rowland and F. C. Lin, “Stability of alternating current discharges between water drops on insulation surfaces,” J. Phys. D. Appl. Phys., vol. 39, no. 14, pp. 3067–3076, Jul. 2006.
[31] T. H. Teich and H.-J. Weber, “Origin and abatement of tonal emission from high voltage transmission lines,” e&i Elektrotechnik und Informationstechnik, vol. 119, no. 1, pp. 22–27, 2002.
[32] U. Straumann, “Simulation of the space charge near coronating conductors of ac overhead transmission lines,” J. Phys. D. Appl. Phys., vol. 44, no. 7, 2011.
[33] M. Abdel-Salam, A. A. Turky, and A. A. Hashem, “The onset voltage of coronas on bare and coated conductors,” J. Phys. D. Appl. Phys., vol. 31, no. 19, pp. 2550–2556, 1998.
[34] ANSYS Inc., ANSYS User’s Guide, 2010. [35] X. Zhou, X. Cui, T. Lu, Y. Liu, X. Li, J. He, R. Bai, and Y. Zhen,
“Shielding Effect of HVAC Transmission Lines on the Ion-Flow Field of HVDC Transmission Lines,” IEEE Transactions on Power Delivery, vol. 28, no. 2. pp. 1094–1102, 2013.
[36] Q. Li, 'Acoustic Noise Emitted from Overhead Line Conductors', PhD Thesis, the University of Manchester, 2013.
[37] J. R. Hassall and K. Zaveri, Acoustic noise measurements, Brüel & Kjaer Naerum, 1979.
IX. BIOGRAPHIES
Qi Li (aka Steven) was born in Hunan Province, China, in September 1984. He completed the B.Eng. degree in Electrical and Electronics Engineering at both the University of Birmingham and Huazhong University of Science and Technology, in 2007 (as an exchange student). He received the M.Sc. degree with distinction in electrical power engineering from the University of Manchester in 2009, and completed the Ph.D. degree in the same institution in 2013. Dr. Qi Li
was working as a research associate in the National Grid High Voltage Research Centre in the University of Manchester, UK from 2013 to 2016. He then joined National Grid Plc as a Power System Engineer in Network Access Planning, Network Capability Electricity in 2016. His main research interests include: Finite Element Analysis in high voltage application (electric field calculation for OHL conductors and treeing in underground cables), audible noise evaluation for OHL conductors, corona discharges and the applications of novel dielectric materials for future power systems.
Simon M. Rowland (SM ’07, F ‘014) was born in London, England. He completed the B.Sc. degree in physics at The University of East Anglia and the Ph.D. degree at London University. He has worked for many years on dielectrics and their applications and has also been Operations and Technical Director within multinational manufacturing companies. He joined The School of Electrical and Electronic Engineering in The University of Manchester as a Senior Lecturer in 2003, and was appointed Professor of Electrical Materials in 2009, and Head of School in
2015. He was President of the IEEE Dielectric and Electrical Insulation Society in 2011and 2012.
Iain Dupere graduated from Downing College, Cambridge with an MA and a PhD. He then worked as a Research Associate in the Engineering Department in Cambridge. Between 2000 and 2005 he was a Fellow of Downing College, Cambridge, where he was also Director of Studies for Engineering (1999-2005. Dr Dupere's research is in the area of Acoustics in the broad sense. His work has included fan noise on aero-engines, Computational Aero-acoustics, and Helmholtz resonators. He also works on innovative
deflectable speed bumps. Dr Dupere’s current key areas of research include noise generation from overhead lines, including from electrical discharges and the interaction of wind and insulators, and condition monitoring.