Revisiting 'colour' hot dip galvanizing by titanium bath alloying

Acta Materialia 53 (2005) 967–976
www.actamat-journals.com
Characterization of copper–cementite nanocomposite producedby mechanical alloying
P.A. Carvalho a,*, I. Fonseca a, M.T. Marques b, J.B. Correia b, A. Almeida a, R. Vilar a
a Instituto Superior Tecnico, Engenharia de Materiais, Av. Rovisco Pais, 1049-001 Lisboa, Portugalb INETI-DMTP, Estrada do Paco do Lumiar, 1649-038 Lisboa, Portugal
Received 8 June 2004; received in revised form 26 October 2004; accepted 27 October 2004
Available online 21 November 2004
Abstract
A copper–iron carbide nanocomposite has been synthesized by high-energy milling of elemental powders (Cu69–Fe23–C8), fol-
lowed by annealing at 873 K. Phase identification and microstructure characterization have been carried out by transmission elec-
tron microscopy and energy dispersive spectroscopy. The carbide phase found in the as-milled material has been identified as Fe3C
and/or Fe7C3, but clearly only Fe3C was present after annealing. Overall, grain sizes ranged from 10 to 50 nm in the as-milled con-
dition and from 30 to 160 nm after annealing, with the carbide phase presenting a higher growth rate than copper. Stacking faults
and a dispersion of Cu nanoparticles (5–10 nm) have been detected in annealed cementite while copper grains exhibited twins on
{1 1 1} planes. Cementite growth could be evaluated in terms of precipitate growth theory. The remarkable thermal stability of
the copper matrix is proposed to be related to solute drag effects.
� 2004 Acta Materialia Inc. Published by Elsevier Ltd. All rights reserved.
Keywords: Transmission electron microscopy; Mechanical alloying; Copper; Nanocomposite
1. Introduction
Ultrafine-grained copper is usually unstable when ex-
posed to moderate temperatures as a result of recovery
processes and grain growth. For instance, the 50% recrys-
tallization temperature in 98% cold-rolled 99.999% pure
Cu is as low as 360 K [1]. Thermal stability can, however,
be expected to increase if elements with low diffusivity
and limited solubility are added to Cu in order to delay
diffusion and promote grain boundary pinning by secondphase precipitates. The Cu–Fe–C system seems particu-
larly interesting in this respect due to the low to moderate
substitutional diffusivities and restricted equilibrium so-
lid solubilities. In fact, estimated diffusion coefficient val-
ues for Fe in Cu and for Cu in aFe at 873 K are,
1359-6454/$30.00 � 2004 Acta Materialia Inc. Published by Elsevier Ltd. A
doi:10.1016/j.actamat.2004.10.042
* Corresponding author. Tel.: +351 218 418 122; fax: +351 218 418
120.
E-mail address: [email protected] (P.A. Carvalho).
respectively, D873Fe in Cu ¼ 1:8� 10�17 m2 s�1 [2] and
D873Cu in aFe ¼ 9:9� 10�19 m2 s�1 [3]. Furthermore, the
equilibrium Cu–Fe phase diagram predicts negligible
mutual solid solubility at temperatures below 873 K [4]
and at this temperature the maximum solubility of C in
Cu is a few ppm [5].
Early work on mechanically alloyed (MA) Cu100�x–
Fex mixtures, based essentially on X-ray diffraction
(XRD), pointed to the formation of face centred cubic
(fcc) solid solutions for x < 60 (for a review see [6]).More recently, however, Mossbauer spectroscopy and
X-ray absorption studies have shown that, for high Cu
contents, Fe does not form a random solid solution with
Cu, but instead clusters of iron-rich c-phase tend to de-
velop in a copper-rich matrix [7,8]. Indeed, close compo-
sitions in both ‘‘phases’’ and the same crystalline
structure produce deceivably simple fcc diffraction pat-
terns, which have been masking the true nanocrystallinenature of these pseudo-solid solutions. The addition of
ll rights reserved.
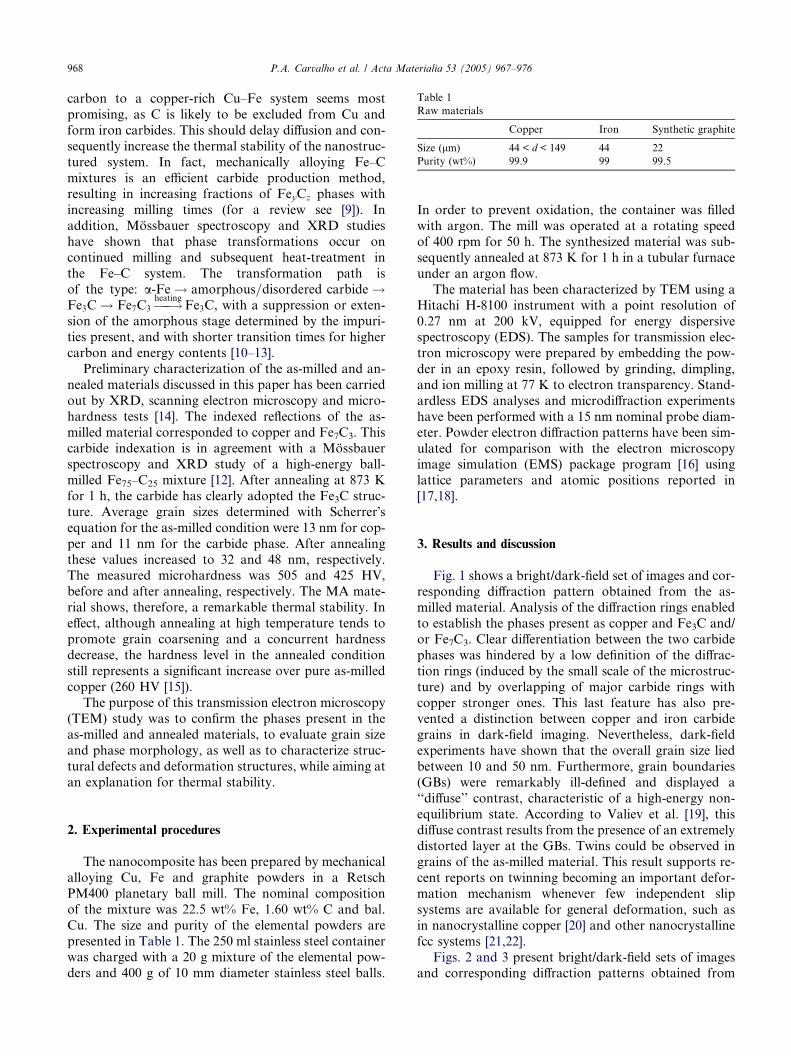
Table 1
Raw materials
Copper Iron Synthetic graphite
Size (lm) 44 < d < 149 44 22
Purity (wt%) 99.9 99 99.5
968 P.A. Carvalho et al. / Acta Materialia 53 (2005) 967–976
carbon to a copper-rich Cu–Fe system seems most
promising, as C is likely to be excluded from Cu and
form iron carbides. This should delay diffusion and con-
sequently increase the thermal stability of the nanostruc-
tured system. In fact, mechanically alloying Fe–C
mixtures is an efficient carbide production method,resulting in increasing fractions of FeyCz phases with
increasing milling times (for a review see [9]). In
addition, Mossbauer spectroscopy and XRD studies
have shown that phase transformations occur on
continued milling and subsequent heat-treatment in
the Fe–C system. The transformation path is
of the type: a-Fe ! amorphous=disordered carbide !Fe3C ! Fe7C3 ���!
heatingFe3C, with a suppression or exten-
sion of the amorphous stage determined by the impuri-
ties present, and with shorter transition times for higher
carbon and energy contents [10–13].
Preliminary characterization of the as-milled and an-
nealed materials discussed in this paper has been carried
out by XRD, scanning electron microscopy and micro-
hardness tests [14]. The indexed reflections of the as-
milled material corresponded to copper and Fe7C3. Thiscarbide indexation is in agreement with a Mossbauer
spectroscopy and XRD study of a high-energy ball-
milled Fe75–C25 mixture [12]. After annealing at 873 K
for 1 h, the carbide has clearly adopted the Fe3C struc-
ture. Average grain sizes determined with Scherrer�sequation for the as-milled condition were 13 nm for cop-
per and 11 nm for the carbide phase. After annealing
these values increased to 32 and 48 nm, respectively.The measured microhardness was 505 and 425 HV,
before and after annealing, respectively. The MA mate-
rial shows, therefore, a remarkable thermal stability. In
effect, although annealing at high temperature tends to
promote grain coarsening and a concurrent hardness
decrease, the hardness level in the annealed condition
still represents a significant increase over pure as-milled
copper (260 HV [15]).The purpose of this transmission electron microscopy
(TEM) study was to confirm the phases present in the
as-milled and annealed materials, to evaluate grain size
and phase morphology, as well as to characterize struc-
tural defects and deformation structures, while aiming at
an explanation for thermal stability.
2. Experimental procedures
The nanocomposite has been prepared by mechanical
alloying Cu, Fe and graphite powders in a Retsch
PM400 planetary ball mill. The nominal composition
of the mixture was 22.5 wt% Fe, 1.60 wt% C and bal.
Cu. The size and purity of the elemental powders are
presented in Table 1. The 250 ml stainless steel containerwas charged with a 20 g mixture of the elemental pow-
ders and 400 g of 10 mm diameter stainless steel balls.
In order to prevent oxidation, the container was filled
with argon. The mill was operated at a rotating speed
of 400 rpm for 50 h. The synthesized material was sub-
sequently annealed at 873 K for 1 h in a tubular furnace
under an argon flow.
The material has been characterized by TEM using a
Hitachi H-8100 instrument with a point resolution of
0.27 nm at 200 kV, equipped for energy dispersivespectroscopy (EDS). The samples for transmission elec-
tron microscopy were prepared by embedding the pow-
der in an epoxy resin, followed by grinding, dimpling,
and ion milling at 77 K to electron transparency. Stand-
ardless EDS analyses and microdiffraction experiments
have been performed with a 15 nm nominal probe diam-
eter. Powder electron diffraction patterns have been sim-
ulated for comparison with the electron microscopyimage simulation (EMS) package program [16] using
lattice parameters and atomic positions reported in
[17,18].
3. Results and discussion
Fig. 1 shows a bright/dark-field set of images and cor-responding diffraction pattern obtained from the as-
milled material. Analysis of the diffraction rings enabled
to establish the phases present as copper and Fe3C and/
or Fe7C3. Clear differentiation between the two carbide
phases was hindered by a low definition of the diffrac-
tion rings (induced by the small scale of the microstruc-
ture) and by overlapping of major carbide rings with
copper stronger ones. This last feature has also pre-vented a distinction between copper and iron carbide
grains in dark-field imaging. Nevertheless, dark-field
experiments have shown that the overall grain size lied
between 10 and 50 nm. Furthermore, grain boundaries
(GBs) were remarkably ill-defined and displayed a
‘‘diffuse’’ contrast, characteristic of a high-energy non-
equilibrium state. According to Valiev et al. [19], this
diffuse contrast results from the presence of an extremelydistorted layer at the GBs. Twins could be observed in
grains of the as-milled material. This result supports re-
cent reports on twinning becoming an important defor-
mation mechanism whenever few independent slip
systems are available for general deformation, such as
in nanocrystalline copper [20] and other nanocrystalline
fcc systems [21,22].
Figs. 2 and 3 present bright/dark-field sets of imagesand corresponding diffraction patterns obtained from

Fig. 1. Bright/dark-field set of images and corresponding diffraction pattern obtained from the as-milled material. The dark-field image was obtained
using a small aperture that included part of the two first diffraction rings. A grain presenting twin domains is shown in the magnified inset taken from
the dark-field image.
P.A. Carvalho et al. / Acta Materialia 53 (2005) 967–976 969
the annealed material. As can be seen, the microstruc-
ture in the annealed condition, which has evolved from
a 10–50 nm dispersion of as-milled grains, is still severely
fragmented. On the whole, the observed grain size ran-
ged from 30 to 160 nm. GBs were still generally ill-
defined and intensity variations in some of the smaller
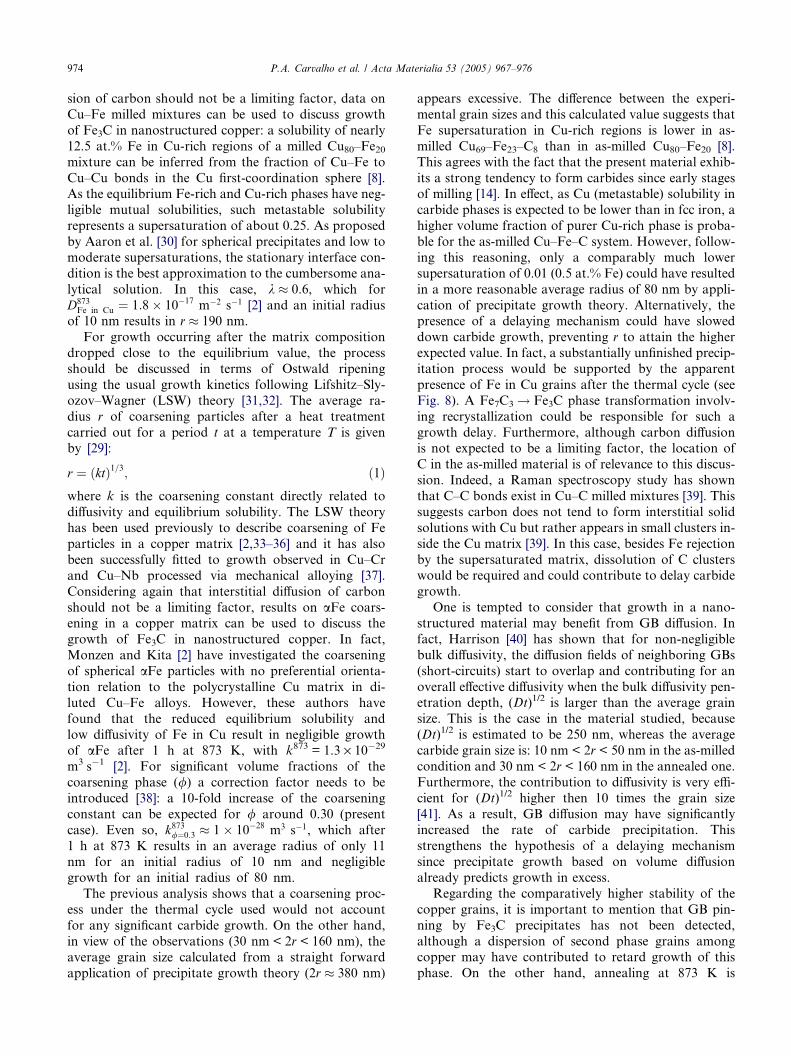
grains suggest high elastic strain (see for example grain1 in Fig. 3). Furthermore, long-range strain fields could
sometimes be detected in the vicinity of GBs (Fig. 4),
emphasizing the non-relaxed condition of the material
after annealing. In fact, these results are in agreement
with reports on non-equilibrium GBs in metals proc-
essed by intense straining [23,24]. Stacking faults (indi-
cated in Fig. 2) and twins (grain 2 in Fig. 3) were
frequently observed. These types of structural defect[25] and any existent mosaicity contribute to justify the
apparently smaller grain size values determined by
XRD [14]. Furthermore, a closer inspection at the grain
internal structure (magnified inset in Fig. 2) revealed 5–
10 nm particles dispersed within some of the grains.
Intense diffracting behavior under dark-field imaging
demonstrated the crystalline nature of these
nanoparticles.A radial intensity profile through a powder diffrac-
tion pattern obtained from the annealed material is
compared with simulations for Cu and Fe3C in Fig. 5.
As with the diffraction patterns of the as-milled condi-
tion (see Fig. 1), the large number of spots arranged in
rings indicates a random crystallographic orientation,
i.e., there is no evidence of texture in the granular struc-
ture. This suggests that many of the GBs are large-angle
boundaries. Grain growth and a certain degree of
recrystallization resulted in a better definition of the dif-fraction rings in the annealed condition. This allowed a
good matching between simulated and experimental pat-
terns enabling to assign the carbide rings to Fe3C. In
agreement with the XRD results obtained for the an-
nealed material [14], no other carbides, namely Fe7C3,
have been detected. This indicates that any Fe7C3 ini-
tially present suffered a phase transformation.
The use of dark-field imaging to strictly distinguishbetween carbide and copper grains was still hindered
after annealing by partial overlapping of the most in-
tense reflections (see Fig. 5). This means that it was
not possible to determine an average grain size for each
phase. Nevertheless, microdiffraction experiments and
EDS point analyses have been used instead to identify
and characterize Cu and Fe3C crystallites in the an-
nealed material. Figs. 6 and 7 present typical Cu andFe3C grains used for microdiffraction experiments.
Fig. 8 shows the result of point analyses performed at
the regions numbered from 1 to 6. Regions 1, 3 and 5
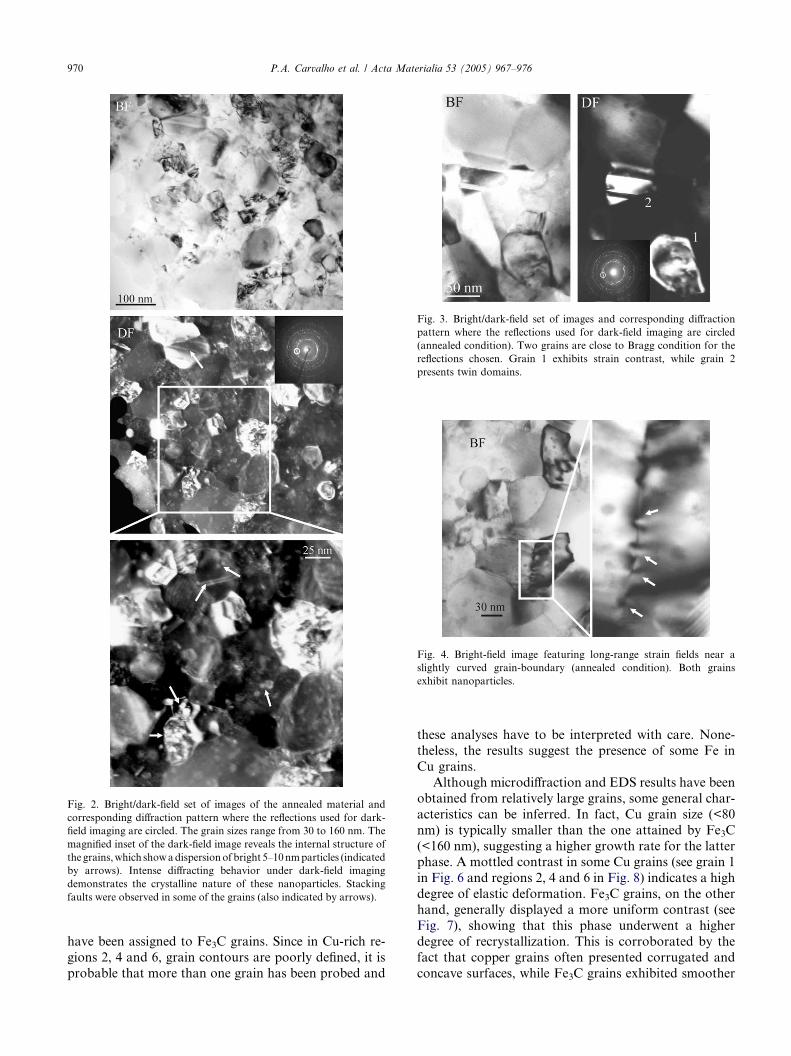
Fig. 2. Bright/dark-field set of images of the annealed material and
corresponding diffraction pattern where the reflections used for dark-
field imaging are circled. The grain sizes range from 30 to 160 nm. The
magnified inset of the dark-field image reveals the internal structure of
the grains,which showadispersionof bright 5–10nmparticles (indicated
by arrows). Intense diffracting behavior under dark-field imaging
demonstrates the crystalline nature of these nanoparticles. Stacking
faults were observed in some of the grains (also indicated by arrows).
Fig. 3. Bright/dark-field set of images and corresponding diffraction
pattern where the reflections used for dark-field imaging are circled
(annealed condition). Two grains are close to Bragg condition for the
reflections chosen. Grain 1 exhibits strain contrast, while grain 2
presents twin domains.
Fig. 4. Bright-field image featuring long-range strain fields near a
slightly curved grain-boundary (annealed condition). Both grains
exhibit nanoparticles.
970 P.A. Carvalho et al. / Acta Materialia 53 (2005) 967–976
have been assigned to Fe3C grains. Since in Cu-rich re-
gions 2, 4 and 6, grain contours are poorly defined, it is
probable that more than one grain has been probed and
these analyses have to be interpreted with care. None-
theless, the results suggest the presence of some Fe in
Cu grains.
Although microdiffraction and EDS results have been
obtained from relatively large grains, some general char-
acteristics can be inferred. In fact, Cu grain size (<80
nm) is typically smaller than the one attained by Fe3C
(<160 nm), suggesting a higher growth rate for the latterphase. A mottled contrast in some Cu grains (see grain 1
in Fig. 6 and regions 2, 4 and 6 in Fig. 8) indicates a high
degree of elastic deformation. Fe3C grains, on the other
hand, generally displayed a more uniform contrast (see
Fig. 7), showing that this phase underwent a higher
degree of recrystallization. This is corroborated by the
fact that copper grains often presented corrugated and
concave surfaces, while Fe3C grains exhibited smoother

Fig. 5. Radial intensity profile through a powder diffraction pattern and simulations for Cu and Fe3C.
Fig. 6. Bright-field images of Cu grains used for microdiffraction experiments in the annealed material. Grains 5 and 6 exhibit twins on {1 1 1}
planes.
P.A. Carvalho et al. / Acta Materialia 53 (2005) 967–976 971
and convex surfaces. Microdiffraction enabled to con-firm that neighboring grains were generally severely dis-
oriented, separated by large-angle GBs. Stacking faults
were present in Fe3C grains (see grain 4 in Fig. 7) whiletwins could be found on 1 1 1 planes of Cu (see grains 5
and 6 in Fig. 6). Since twins are typical deformation

Fig. 7. Bright-field images of Fe3C grains used for microdiffraction experiments in the annealed material. Grain 4 exhibits stacking faults on planes
close to (0 2 0).
Fig. 8. Bright-field image of the annealed material region where EDS point analyses were performed. The associated table presents the atomic
fraction of Fe and Cu contents found in the numbered regions. Regions 1, 3 and 5 were assigned to Fe3C grains. Cu-rich regions 2, 4 and 6 do not
have well-defined grain contours and it is probable that more than one grain has been probed.
972 P.A. Carvalho et al. / Acta Materialia 53 (2005) 967–976

Fig. 9. Bright-field image of a Fe3C grain with stacking faults and an internal dispersion of nanoparticles. Magnified insets reveal 0 2 0 Fe3C lattice
fringes. Bending of these fringes around the nanoparticles point to the presence of strain-fields. At the bottom inset some fringes terminate at the
nanoparticle suggesting that the elastic constraint may have been reduced by dislocation formation (white arrow at a terminating fringe).
P.A. Carvalho et al. / Acta Materialia 53 (2005) 967–976 973
structures in milled copper [26], and have been observedin the as-milled condition, some twin domains present in
the annealed material may have had a mechanical origin
being subsequently extended during grain growth.
Numerous nanoparticles have been found encapsu-
lated in Fe3C (see grains 1 and 2 in Fig. 7). Since EDS
analyses 1, 3 and 5 were carried out on well defined
and relatively large Fe3C grains (Fig. 8), the measured
Cu content resulted from Cu nanoparticles encapsulatedwithin the grains. The presence of Cu nanoparticles in
Fe3C does in effect explain an apparent excessive pres-
ence of Fe3C grains in an alloy with about 30% volume
of carbide. Frequently, only a few nanoparticles existent
in a grain displayed fringe contrast (probably Moire –
see magnified inset of grain 2 in Fig. 7). This confirms
their crystalline nature and reveals that no preferred ori-
entation relation exists between nanoparticles andencapsulating grains.
The bright-field image in Fig. 9, presents a Fe3C grain
with nearly ‘‘edge-on’’ stacking faults and an internal
dispersion of nanoparticles. The Fe3C lattice fringes
observable at the insets resulted from the inclusion of
small g reflections by the objective aperture. According
to their spacing, 0.33 nm, these fringes may correspond
to either {1 0 1} planes or more probably to {0 2 0}planes (d1 0 1 = 0.337 nm and d0 2 0 = 0.336 nm [18]). In
effect, stacking faults on 0 2 0 planes have been observed
in other cementite grains (see grain 4 in Fig. 7, where the
fault fringes are nearly perpendicular to g0 2 0) and have
been reported previously [27]. The observable fringe
bending around the nanoparticles results from the pres-
ence of strain-fields. Such strain may have originated
from differential contraction during cooling from 873K to room temperature. This can be justified by the dif-
ference in volumetric thermal expansion coefficients,
since aCu is 4.95 · 10�5 K�1 [28], while aFe3C is
4.1 · 10�5 K�1 for temperatures above the Curie tem-
perature (480 K) and under 1.8 · 10�5 K�1 for lower
temperatures [18]. Although the lack of preferred orien-
tation relation points to incoherent interfaces between
nanoparticles and encapsulating grains (ruling out lat-tice misfit strains), some fringes terminate at the nano-
particles. This indicates that elastic constraint induced
by thermal misfit may have been relieved by dislocation
formation as a consequence of the anisotropic thermal
expansion behavior of Fe3C [18].
The clearly convex surfaces of Fe3C grains (see Figs. 6
and 9) imply an undergoing growth process, which is not
so evident in the morphology of copper grains. In case ofa supersaturated copper matrix, growth of the carbide
phase takes place under the so-called precipitate growth
regime until supersaturation drops close to its equilib-
rium value (�0 at.% Fe), at which time a coarsening re-
gime can take over. In to order to discuss the
mechanisms behind the observed growth it seems neces-
sary to access the relevance of both regimes.
Diffusion-controlled growth of precipitates in asupersaturated matrix is described by the solution to
the diffusion field equation [29]:
r ¼ kðDtÞ1=2;where r is the precipitate thickness, k is a function of
supersaturation, D the volume diffusivity and t the
growth period considered. Given that interstitial diffu-
974 P.A. Carvalho et al. / Acta Materialia 53 (2005) 967–976
sion of carbon should not be a limiting factor, data on
Cu–Fe milled mixtures can be used to discuss growth
of Fe3C in nanostructured copper: a solubility of nearly
12.5 at.% Fe in Cu-rich regions of a milled Cu80–Fe20mixture can be inferred from the fraction of Cu–Fe to
Cu–Cu bonds in the Cu first-coordination sphere [8].As the equilibrium Fe-rich and Cu-rich phases have neg-
ligible mutual solubilities, such metastable solubility
represents a supersaturation of about 0.25. As proposed
by Aaron et al. [30] for spherical precipitates and low to
moderate supersaturations, the stationary interface con-
dition is the best approximation to the cumbersome ana-
lytical solution. In this case, k � 0.6, which for
D873Fe in Cu ¼ 1:8� 10�17 m�2 s�1 [2] and an initial radius
of 10 nm results in r � 190 nm.
For growth occurring after the matrix composition
dropped close to the equilibrium value, the process
should be discussed in terms of Ostwald ripening
using the usual growth kinetics following Lifshitz–Sly-
ozov–Wagner (LSW) theory [31,32]. The average ra-
dius r of coarsening particles after a heat treatment
carried out for a period t at a temperature T is givenby [29]:
r ¼ ðktÞ1=3; ð1Þwhere k is the coarsening constant directly related to
diffusivity and equilibrium solubility. The LSW theory
has been used previously to describe coarsening of Fe
particles in a copper matrix [2,33–36] and it has also
been successfully fitted to growth observed in Cu–Cr
and Cu–Nb processed via mechanical alloying [37].
Considering again that interstitial diffusion of carbon
should not be a limiting factor, results on aFe coars-ening in a copper matrix can be used to discuss the
growth of Fe3C in nanostructured copper. In fact,
Monzen and Kita [2] have investigated the coarsening
of spherical aFe particles with no preferential orienta-
tion relation to the polycrystalline Cu matrix in di-
luted Cu–Fe alloys. However, these authors have
found that the reduced equilibrium solubility and
low diffusivity of Fe in Cu result in negligible growthof aFe after 1 h at 873 K, with k873 = 1.3 · 10�29
m3 s�1 [2]. For significant volume fractions of the
coarsening phase (/) a correction factor needs to be
introduced [38]: a 10-fold increase of the coarsening
constant can be expected for / around 0.30 (present
case). Even so, k873/¼0:3 � 1� 10�28 m3 s�1, which after
1 h at 873 K results in an average radius of only 11
nm for an initial radius of 10 nm and negligiblegrowth for an initial radius of 80 nm.
The previous analysis shows that a coarsening proc-
ess under the thermal cycle used would not account
for any significant carbide growth. On the other hand,
in view of the observations (30 nm < 2r < 160 nm), the
average grain size calculated from a straight forward
application of precipitate growth theory (2r � 380 nm)
appears excessive. The difference between the experi-
mental grain sizes and this calculated value suggests that
Fe supersaturation in Cu-rich regions is lower in as-
milled Cu69–Fe23–C8 than in as-milled Cu80–Fe20 [8].
This agrees with the fact that the present material exhib-
its a strong tendency to form carbides since early stagesof milling [14]. In effect, as Cu (metastable) solubility in
carbide phases is expected to be lower than in fcc iron, a
higher volume fraction of purer Cu-rich phase is proba-
ble for the as-milled Cu–Fe–C system. However, follow-
ing this reasoning, only a comparably much lower
supersaturation of 0.01 (0.5 at.% Fe) could have resulted
in a more reasonable average radius of 80 nm by appli-
cation of precipitate growth theory. Alternatively, thepresence of a delaying mechanism could have slowed
down carbide growth, preventing r to attain the higher
expected value. In fact, a substantially unfinished precip-
itation process would be supported by the apparent
presence of Fe in Cu grains after the thermal cycle (see
Fig. 8). A Fe7C3 ! Fe3C phase transformation involv-
ing recrystallization could be responsible for such a
growth delay. Furthermore, although carbon diffusionis not expected to be a limiting factor, the location of
C in the as-milled material is of relevance to this discus-
sion. Indeed, a Raman spectroscopy study has shown
that C–C bonds exist in Cu–C milled mixtures [39]. This
suggests carbon does not tend to form interstitial solid
solutions with Cu but rather appears in small clusters in-
side the Cu matrix [39]. In this case, besides Fe rejection
by the supersaturated matrix, dissolution of C clusterswould be required and could contribute to delay carbide
growth.
One is tempted to consider that growth in a nano-
structured material may benefit from GB diffusion. In
fact, Harrison [40] has shown that for non-negligible
bulk diffusivity, the diffusion fields of neighboring GBs
(short-circuits) start to overlap and contributing for an
overall effective diffusivity when the bulk diffusivity pen-etration depth, (Dt)1/2 is larger than the average grain
size. This is the case in the material studied, because
(Dt)1/2 is estimated to be 250 nm, whereas the average
carbide grain size is: 10 nm < 2r < 50 nm in the as-milled
condition and 30 nm < 2r < 160 nm in the annealed one.
Furthermore, the contribution to diffusivity is very effi-
cient for (Dt)1/2 higher then 10 times the grain size
[41]. As a result, GB diffusion may have significantlyincreased the rate of carbide precipitation. This
strengthens the hypothesis of a delaying mechanism
since precipitate growth based on volume diffusion
already predicts growth in excess.
Regarding the comparatively higher stability of the
copper grains, it is important to mention that GB pin-
ning by Fe3C precipitates has not been detected,
although a dispersion of second phase grains amongcopper may have contributed to retard growth of this
phase. On the other hand, annealing at 873 K is

P.A. Carvalho et al. / Acta Materialia 53 (2005) 967–976 975
expected to have increased the ease of migration of
iron, carbon and impurities to grain boundaries. This
kind of solute migration can induce GB pinning by a
solute drag effect, which is known to stagnate growth
and increase the thermal stability of nanostructured
materials [42].The copper nanoparticles in cementite grains can be
remnants of an initial nanocrystalline structure. Indeed,
as the diffusivity of Cu in Fe3C (estimated by Fourlaris
for 832 K, D832Cu in Fe3C
¼ 2:6� 10�21 m2 s�1 [43]) is much
lower than that of Fe in Cu, any iron-rich clusters pre-
sent in Cu grains tend to dissolve away towards develop-
ing Fe3C grains, whereas copper-rich clusters inside
carbide grains may tend to remain there. Alternatively,some nanoparticles can result from encapsulation by
the fast growing carbide. Precipitation of Cu particles
in cementite cannot however be ruled out as it is known
to occur in copper steels [43–46]. In any case, inclusion
of Cu particles in cementite favors its growth and is det-
rimental to Cu grain growth contributing for its
stabilization.
In summary, a coarsening mechanism would not beable to account for the observed carbide growth. On
the other hand, the application of precipitate growth
theory seems to result in excessive growth rates (espe-
cially if GB diffusion and Cu encapsulation are taken
into account). It is therefore proposed that the growth
process is not solely diffusion-controlled, i.e., there is a
delaying mechanism hindering the fast growth of the
carbide phase. Since GB pinning by Fe3C precipitateshas not been detected, the comparatively higher stability
of the copper grains may result from a solute drag effect,
with a contribution from the Cu nanoparticles encapsu-
lation inside carbide grains.
The work carried out shows that MA in the Cu–
Fe–C system followed by heat-treatment involves com-
plex growth mechanisms and therefore deserves more
attention. In the particular mixture studied, the vari-ous factors affecting the kinetics of Fe3C grain growth
from a supersaturated Cu matrix need to be thor-
oughly analyzed. Namely, the delaying influences of
a Fe7C3 ! Fe3C phase transformation and of a possi-
ble presence of C clusters in the copper matrix need to
be assessed. On the other hand, the effect of GB vs.
volume diffusion on growth rate and the role of Cu
encapsulation must be evaluated. The mechanisms be-hind Cu encapsulation in cementite need to be further
scrutinized in order to establish whether the nanopar-
ticles present are remnants of the initial nanocrystal-
line structure, result from encapsulation by
developing Fe3C grains or even from Cu precipitation
in cementite. Furthermore, the solute drag effect at Cu
grain boundaries, which seems responsible for the
thermal stability of this phase, needs to be investi-gated. Evaluation of partially annealed states and of
other compositions and annealing temperatures is thus
required to fully comprehend this nanostructured
system.
4. Conclusions
The carbide phase present in the as-milled material
has been identified as Fe3C and/or Fe7C3, while only
Fe3C could be found after annealing, in agreement with
the XRD results previously reported. Overall, grain sizes
ranged from 10 to 50 nm in the as-milled condition and
from 30 to 160 nm after annealing, with the carbide
phase presenting a higher growth rate than copper,
which has proven to be remarkably stable under theannealing conditions used. Non-equilibrium features
observed at the grain boundaries indicate that the mate-
rial is in a high-energy non-relaxed condition even after
annealing. Stacking faults were present in Fe3C, whereas
copper grains exhibited twins on {1 1 1} planes. A dis-
persion of Cu nanoparticles (5–10 nm) has been detected
within annealed cementite; their presence was attributed
to the low diffusivity and solubility of Cu in Fe3C. Thethermal stability of the copper phase is proposed to be
related to solute drag effects, while the growth behavior
of cementite can be accountable by precipitation from
an Fe supersaturated Cu matrix. Nevertheless, a straight
forward application of precipitate growth theory results
in excessive growth rates, suggesting that a delaying
mechanism is affecting carbide growth.
Acknowledgement
The authors acknowledge Fundacao para a Ciencia e
a Tecnologia, projectPOCTI/CTM/40892/2001, for
financial support.
References
[1] Decker BF, Harker D. Trans AIME 1959;188:887.
[2] Monzen R, Kita K. Phil Mag Let 2002;82:373.
[3] Lazarev VA, Golikov M. Fiz Metallov Metalloved 1970;29:598.
[4] Alloy phase diagrams, ASM handbook, vol. 3. Materials Park
(OH): American Society for Metals; 1992, p. 110.
[5] Lopez GA, Mittemeijer EJ. Scripta Mater 2004;51:1.
[6] Ma E, Atzmon M. Mater Chem Phys 1995;39:249.
[7] Principi G, Spataru T, Gupta R, Enzo S, Kuncse V, Filoti G. J
Alloy Compd 2001;326:188.
[8] Wei S, Yan W, Li Y, Liu W, Fan J, Zhang X. Physica B
2001;305:135.
[9] Suryanarayana C. Prog Mater Sci 2001;46:1.
[10] Wang GM, Champbell SJ, Calka A, Kaczmarek WA. Nanostruct
Mater 1995;6:389.
[11] Campbell SJ, Wang GM, Calka A, Kaczmarek WA. Mater Sci
Eng 1997;A226–A228:75.
[12] Tokumitzu K, Umemoto M. J Metastable Nanocrystall Mater
2001;10:183.
[13] Umemoto M, Liu ZG, Masuyama K, Tsuchiya K. Scripta Mater
2001;45:391.
976 P.A. Carvalho et al. / Acta Materialia 53 (2005) 967–976
[14] Correia JB, Marques MT. Adv Materials Forum II 2004;455–
456:501.
[15] Marques MT, Correia JB, Criado JM, Dianez MJ, Matteazzi P.
Key Eng Materials 2002;230–232:652.
[16] Stadelmann PA. Ultramicroscopy 1987;21:131.
[17] Straumanis ME, Yu LS. Acta Crystallogr 1969;A25:676.
[18] Wood IG, Vocadlo L, Knight KS, Dobson DP, Marshall WG,
Price GD, et al. J Appl Cryst 2004;37:82.
[19] Valiev RZ, Korznikov AV, Mulyukov RR. Mater Sci Eng
1993;A168:141.
[20] Liao XZ, Zhao YH, Srinivasan SG, Zhu YT, Valiev RZ,
Gunderov DV. Appl Phys Lett 2004;84:592.
[21] Liao XZ, Zhou F, Lavernia EJ, He DW, Zhu YT. Appl Phys Lett
2003;83:5062.
[22] RosnerH,Markmann J,Weissmuller J. PhilMagLett 2004;84:321.
[23] Valiev RZ, Gertsman VY, Kaibyshev OA. Phys Status Solidi
1986;97A:97.
[24] Horita Z, Smith DJ, Nemoto M, Valiev RZ, Langdon TG. J
Mater Res 1988;13:446.
[25] Gayle FW, Biancaniello FS. Nanostruct Mater 1995;6:429.
[26] Huang JY, Wu YK, Ye HQ. Acta Mater 1996;44:1211.
[27] Nishiyama Z, Koreeda A, Katagiri S. Trans JIM 1964;5:115.
[28] Gray DE, editor. American institute of physics handbook. 3rd
ed. New York: McGraw-Hill; 1972.
[29] Martin JW, Doherty RD, Cantor B. Stability of microstructure in
metallic materials. Cambridge: Cambridge University Press;
1976. p. 67.
[30] Aaron HB, Fainstein D, Kotler GR. J Appl Phys 1970;41:4404.
[31] Lifshitz IM, Slyozov VV. J Phys Chem Solids 1961;19:35.
[32] Wagner C. Z Electrochem 1961;65:581.
[33] Fujii T, Kato M, Mori T. Trans JIM 1991;32:229.
[34] Kita K, Monzen K. Scripta Mater 2000;43:1039.
[35] Kita K, Monzen K. Trans JIM 2001;65:223.
[36] Monzen R, Tada T, Seo T, Higashimine. Mater Lett
2004;58:2007.
[37] Morris MA, Morris DG. Mater Sci Eng A 1989;111:115.
[38] Ardell AJ. Acta Metall 1972;20:61.
[39] Marques MT, Correia JB, Conde O. Scripta Mater 2004;50: 963.
[40] Harrison LG. Trans Faraday Soc 1961;57:1191.
[41] Le Claire AD, Rabinovitch A. J Phys 1983;C16:2087.
[42] Liu KW, Mucklich F. Acta Mater 2001;49:395.
[43] Fourlaris G, Baker AJ, Papdimitriou GD. Acta Mater
1996;44:4791.
[44] Fourlaris G, Baker AJ, Papdimitriou GD. Acta Metall Mater
1995;43:2589.
[45] Fourlaris G, Baker AJ, Papdimitriou GD. Acta Metall Mater
1995;43:4421.
[46] Fourlaris G, Baker AJ. J Phys IV 1997;C5:389.
Copyright © 2022 FDOKUMEN