The Role of Alloying Elements on the Crevice Corrosion ...
11
The Role of Alloying Elements on the Crevice Corrosion Behavior of Ni-Cr-Mo Alloys N. Ebrahimi, ‡, * P. Jakupi,* J.J. Noël,* and D.W. Shoesmith* ABSTRACT The roles of the alloying elements Mo, Cr, and W in resisting crevice corrosion of UNS N06022, UNS N06625, and UNS N10362 have been studied under galvanostatic conditions in 5 mol/L NaCl at 150°C. Corrosion damage patterns were in- vestigated using surface analytical techniques such as scanning electron microscopy and optical imaging, and the corrosion products characterized by energy dispersive x-ray spectroscopy. While the Cr content of the alloy is critical in controlling initiation of crevice corrosion, the rate of activation (passive- to-active transition) is influenced by both the Cr and the Mo (and W) contents. The alloy’s Mo content also determines the distri- bution of corrosion damage within the crevice. In alloys with high Mo content, corrosion propagates laterally across the sur- face, while in alloys with low Mo content, it penetrates into the alloy. This can be attributed to the accumulation of molyb- dates (and tungstates), which stifle alloy dissolution at active sites. Thus, as the Mo content of the alloy increases in the order N06625 (9 wt% Mo) < N06022 (13 wt% Mo [3 wt% W]) < N10362 (22 wt% Mo), the depth of corrosion penetration decreases. In addition, once crevice corrosion initiates and the crevice acidifies, metal oxidation can also couple to proton reduction inside the crevice. The role of internal proton reduction in driving the crevice corrosion of these Ni alloys was found to be quite significant; greater than 50% of the corrosion damage is caused by proton reduction inside the crevice. KEY WORDS: crevice corrosion, galvanostatic polarization, molybdenum, Ni-Cr-Mo alloys INTRODUCTION Extensive industrial effort has been invested in the design of nickel superalloys able to resist corrosion in aggressive media. This is generally achieved by alloying Ni with various amounts of Cr and Mo, along with small amounts of other alloying elements such as W, Cu, and Fe. 1 Mo is known to enhance the cor- rosion resistance in reducing conditions, while Cr is a beneficial element under oxidizing conditions. 2-3 While the properties of the oxides that protect these alloys generally enforce good passive corrosion behavior, the function of individual alloying elements in resisting localized corrosion processes, in particular pitting and crevice corrosion, is not fully understood, and opti- mization of alloy composition for corrosion reliability and cost has not yet been achieved. Ni-Cr-Mo alloys show a great resistance to gen- eral corrosion, 3 but under aggressive conditions they can suffer localized corrosion, such as pitting and crevice corrosion. The effects of many factors, such as temperature, pH, and the presence of aggressive halides, on the crevice corrosion of these alloys have been studied, and in general the susceptibility to crevice corrosion was found to increase when the temperature and chloride concentration were in- creased. 4-7 Generally, the localized corrosion perfor- mance of passive metals and alloys is assured by aggressive electrochemical testing, and a wide range of Ni-Cr-Mo alloys have been investigated. Many researchers have investigated the role of alloying elements on the localized corrosion of Ni alloys. 8-10 To date, studies have shown that Cr is the Submitted for publication: July 14, 2015. Revised and accepted: September 6, 2015. Preprint available online: September 7, 2015, http://dx.doi.org/10.5006/1848. ‡ Corresponding author. E-mail: [email protected]. * Department of Chemistry and Surface Science Western, The University of Western Ontario, London, Ontario, Canada. CORROSION—Vol. 71, No. 12 ISSN 0010-9312 (print), 1938-159X (online) 15/000237/$5.00+$0.50/0 © 2015, NACE International 1441 CORROSION SCIENCE SECTION
-
Upload
khangminh22 -
Category
Documents
-
view
1 -
download
0
Transcript of The Role of Alloying Elements on the Crevice Corrosion ...
The Role of Alloying Elements on the CreviceCorrosion Behavior of Ni-Cr-Mo Alloys
N. Ebrahimi,‡,* P. Jakupi,* J.J. Noël,* and D.W. Shoesmith*
ABSTRACT
The roles of the alloying elements Mo, Cr, and W in resistingcrevice corrosion of UNS N06022, UNS N06625, and UNSN10362 have been studied under galvanostatic conditions in5 mol/L NaCl at 150°C. Corrosion damage patterns were in-vestigated using surface analytical techniques such as scanningelectron microscopy and optical imaging, and the corrosionproducts characterized by energy dispersive x-ray spectroscopy.While the Cr content of the alloy is critical in controllinginitiation of crevice corrosion, the rate of activation (passive-to-active transition) is influenced by both the Cr and the Mo (andW) contents. The alloy’s Mo content also determines the distri-bution of corrosion damage within the crevice. In alloys withhigh Mo content, corrosion propagates laterally across the sur-face, while in alloys with low Mo content, it penetrates intothe alloy. This can be attributed to the accumulation of molyb-dates (and tungstates), which stifle alloy dissolution at activesites. Thus, as the Mo content of the alloy increases in theorder N06625 (9 wt% Mo)<N06022 (13 wt% Mo [3 wt% W])<N10362 (22 wt% Mo), the depth of corrosion penetrationdecreases. In addition, once crevice corrosion initiates and thecrevice acidifies, metal oxidation can also couple to protonreduction inside the crevice. The role of internal proton reductionin driving the crevice corrosion of these Ni alloys was foundto be quite significant; greater than 50% of the corrosion damageis caused by proton reduction inside the crevice.
KEY WORDS: crevice corrosion, galvanostatic polarization,molybdenum, Ni-Cr-Mo alloys
INTRODUCTION
Extensive industrial effort has been invested in thedesign of nickel superalloys able to resist corrosion inaggressive media. This is generally achieved byalloying Ni with various amounts of Cr and Mo, alongwith small amounts of other alloying elements suchas W, Cu, and Fe.1 Mo is known to enhance the cor-rosion resistance in reducing conditions, while Cr is abeneficial element under oxidizing conditions.2-3 Whilethe properties of the oxides that protect these alloysgenerally enforce good passive corrosion behavior, thefunction of individual alloying elements in resistinglocalized corrosion processes, in particular pitting andcrevice corrosion, is not fully understood, and opti-mization of alloy composition for corrosion reliabilityand cost has not yet been achieved.
Ni-Cr-Mo alloys show a great resistance to gen-eral corrosion,3 but under aggressive conditions theycan suffer localized corrosion, such as pitting andcrevice corrosion. The effects of many factors, such astemperature, pH, and the presence of aggressivehalides, on the crevice corrosion of these alloys havebeen studied, and in general the susceptibility tocrevice corrosion was found to increase when thetemperature and chloride concentration were in-creased.4-7 Generally, the localized corrosion perfor-mance of passive metals and alloys is assured byaggressive electrochemical testing, and a wide range ofNi-Cr-Mo alloys have been investigated.
Many researchers have investigated the role ofalloying elements on the localized corrosion of Nialloys.8-10 To date, studies have shown that Cr is the
Submitted for publication: July 14, 2015. Revised and accepted:September 6, 2015. Preprint available online: September 7, 2015,http://dx.doi.org/10.5006/1848.
‡ Corresponding author. E-mail: [email protected].* Department of Chemistry and Surface Science Western,The University of Western Ontario, London, Ontario, Canada.
CORROSION—Vol. 71, No. 12ISSN 0010-9312 (print), 1938-159X (online)
15/000237/$5.00+$0.50/0 © 2015, NACE International 1441
CORROSION SCIENCE SECTION
primary alloying element for maintaining passivity.11-17
Lloyd, et al.,11,18 studied the passive behavior inacidic solutions of five Ni-Cr-Mo alloys with varyingamounts of Cr and Mo, and found much lowerpassive dissolution currents, and a much slowerattainment of steady-state passive conditions, onthose alloys with >20% Cr content.
Kehler and Scully19-20 found that the rate ofoccurrence of metastable corrosion events in acidicsolution increased with a decrease in alloy Mo con-tent. Studies in simulated crevice solutions on a seriesof Ni-Cr-Mo alloys performed by Lillard, et al.,21
showed that, as the Mo content of the alloy increased,the passive current density and the dissolution rateassociated with the active region decreased. A decreasein crevice corrosion rate resulting from an increase inMo content has also been reported.22
Many other studies have also focused on the roleof Mo in corrosion behavior of Ni-based alloys.23-25
Mishra, et al.,26 studied the effects of Cr, Mo, and Won the crevice corrosion of a number of commercialNi-Cr-Mo(-W) alloys in 1.0mol/L sodium chloride anddemonstrated the synergistic influence of Cr and Mo incontrolling passive film breakdown. The “protectiontemperature” was used to rank the resistance of thesealloys to crevice corrosion, and the following rankingwas achieved: high Cr + lowMo < low Cr + high Mo <highCr + high Mo <high Cr + high (Mo +W).
While these studies26-27 yield little mechanisticinformation, an alloy’s resistance to localized corrosionis generally attributed to the quality and compositionof the passive film and how this is influenced by alloycomposition and microstructure. A combination ofelectrochemical impedance spectroscopy and x-rayphotoelectron spectroscopy (XPS) measurements onthe C22 alloy† (UNS N06022),(1) in neutral pH solutionand at different applied potentials, showed that theresistance of the oxide film (Rfilm) is controlled by itsCr2O3 content, and that once the transpassive po-tential region is reached, Rfilm decreases, accompaniedby a dramatic increase in the Cr(OH)3 content of thefilm.28 A later XPS and time-of-flight secondary ionmass spectrometry (ToF-SIMS) study on the samesystem showed that transpassive dissolution is ac-companied by the accumulation of Mo(VI) and W(VI)species in the outer region of the film.29 More recently,Zhang, et al.,29-31 studied the properties of the oxidefilm on Ni-Cr-Mo alloys as a function of applied po-tential, temperature, and pH using various surfaceanalytical techniques, such as angle-resolved XPS,synchrotron radiation XPS, ToF-SIMS, and scanningelectron microscopy (SEM). The presence of a layeredstructure in the passive film (<5 nm) was demon-strated, with an inner Cr2O3 layer, outer Cr/Ni
hydroxides, and Mo/Cu or Mo/W oxide in the out-ermost surface.
Once the passive film breaks down and stablepropagation is established, the role of alloying elementsin repassivation of the crevice becomes important.Published studies have indicated a role for Mo in de-termining the crevice propagation rate.9,21 Jakupi,et al.,32 studied the crevice corrosion of UNS N06022under galvanostatic polarization, and suggested thatpropagation was controlled by the Mo content, and thedamage distribution depended on a combination ofapplied current and the deposition of Mo-containingsolids. Enrichment of corrosion products comprisingO, Mo, and W was also reported by Shan, et al.,suggesting that propagation is controlled by the de-position of Mo and W.10
The goal of this research is to expand on previousstudies by investigating three commercial alloyswith various Cr and Mo contents in an attempt toconfirm that Cr and Mo work synergistically to controlcrevice corrosion susceptibility and propagation.26
The authors’ main interests are in the passive-to-activetransition and the propagation process, in particularthe distribution of corrosion damage and how it isinfluenced by the composition of the alloy. To achievethis goal, crevice corrosion was driven galvanostatically,to guarantee initiation and also to prevent repassi-vation. In this manner one can isolate the propagationstage and control the total amount of corrosiondamage.
EXPERIMENTAL PROCEDURES
The compositions of the alloys used in this studyare listed in Table 1. All alloys were supplied by HaynesInternational†. The specimens were machined andbent into a V-shape to produce an artificial creviceassembly containing only one crevice. The creviceelectrode design has been described elsewhere.32-34
A 0.8 mm thick PTFE slice was used as a creviceformer to produce a crevice with an area of ∼4 cm2. Thearea of uncreviced material exposed to solution was∼10.5 cm2. Each sample was wet-ground with siliconcarbide paper from a 180 to a 1200 grit finish, ul-trasonically cleaned in methanol, and rinsed in ultra-pure deionized water. Before tightening the creviceassembly, the metal electrode and the PTFE creviceformer were immersed in the electrolyte solution toensure the presence of electrolyte in the crevice interior.All tests were performed at 150°C in a 5 M NaClsolution. The solutions were prepared from reagentgrade NaCl and Type-I water (resistivity of 18.2 MΩ ·cm2) obtained from a Milli-Q Academic A-10† system.A new solution was used for each experiment.
Electrochemical CellAll of the crevice corrosion experiments were
conducted inside a cylindrical pressure vessel with a
† Trade name.(1) UNS numbers are listed in Metals and Alloys in the Unified Num-
bering System, published by the Society of Automotive Engineers(SAE International) and cosponsored by ASTM International.
1442 CORROSION—DECEMBER 2015
CORROSION SCIENCE SECTION
100 mm inner diameter and a volume of 1,000 cm3.The working electrode was suspended near the center ofthe cell using a cylindrical rod of the same materialfrom which the crevice was formed. The rod was con-nected to a tapped hole in one end of the crevicedelectrode. To avoid galvanic corrosion, the counterelectrode was made from the same material as thecrevice. To mimic the usual crevice corrosion geometry,the surface area of the counter electrode was muchlarger than that of the creviced electrode. The referenceelectrode was a homemade Ag/AgCl electrode in asaturated KCl solution.35 Before and after each experi-ment, its potential was checked against a saturatedcalomel electrode that was used only as a referenceelectrode, and the difference was always −45±3 mV.
For each experiment, 500 cm3 of electrolyte so-lution was air saturated by agitation in air. The sealedassembly was then pressurized with 400 kPa of ultra-high purity Ar gas (Praxair†) to ensure proper sealing ofthe pressure vessel. In this study, two galvanostaticcurrents, 10 μA and 200 μA, were applied to the workingelectrode at 150°C and the crevice potential (EC)response measured using an a WaveDrive 20 Bipoten-tiostat† (Pine Instruments).
Analyses of Corroded ElectrodesAfter the experiment, the creviced electrodes were
washed with deionized water, rinsed with ethanol, anddried using Ar gas. The crevice corroded surface anddepth of corrosion propagation were then examined byoptical microscopy, SEM, and energy-dispersive x-rayspectroscopy (EDS).
A LEO (Zeiss) 1540XB† FIB/SEM was used forimaging in secondary and backscatter modes and abeam energy of 10 KeV was used for all EDS analyses.
To measure the depth of corrosion penetration,the sample was polished from the edge of the sampletoward the center of the corroded area until the centerwas reached. Image analysis software (Image Pro Plus†)was used to measure the total damaged area withinthe crevice and also the maximum depth of crevicepenetration. EDS was used to determine the com-position of the corrosion products on the corrodedsurface and to map the corrosion front on a cross-sectioned crevice.
A series of BC1† (UNS N10362) alloy specimenswere weighed before and after corrosion. Weight loss (W)measurements were performed after corrosion thatwas forced by a constant applied charge (QA, the appliedcurrent multiplied by the time for which it was
applied). The dark-colored, gel-like corrosion productswere removed by wiping immediately on completingthe experiment. The specimen was then rinsedwith water and ultrasonically cleaned in ethanol for5 min, and then dried in ultra high purity Ar. Theworking electrode was dried in the desiccator for 1 dbefore being weighed. An uncertainty in W arises fromthe fact that some corrosion products that segregatedto grain boundaries could not be removed by thismethod, which leads to an underestimation of W.
A 10mL volume of the solution, sampled after thecorrosion experiment, was analyzed by inductively-coupled plasma mass spectrometry (ICP-MS) tomeasure the amounts of dissolved Cr, Mo, and Ni in thesolution. The detection limit was 0.2 μg/L for dis-solved Mo and Cr and, for Ni, 0.001 μg/L.
RESULTS
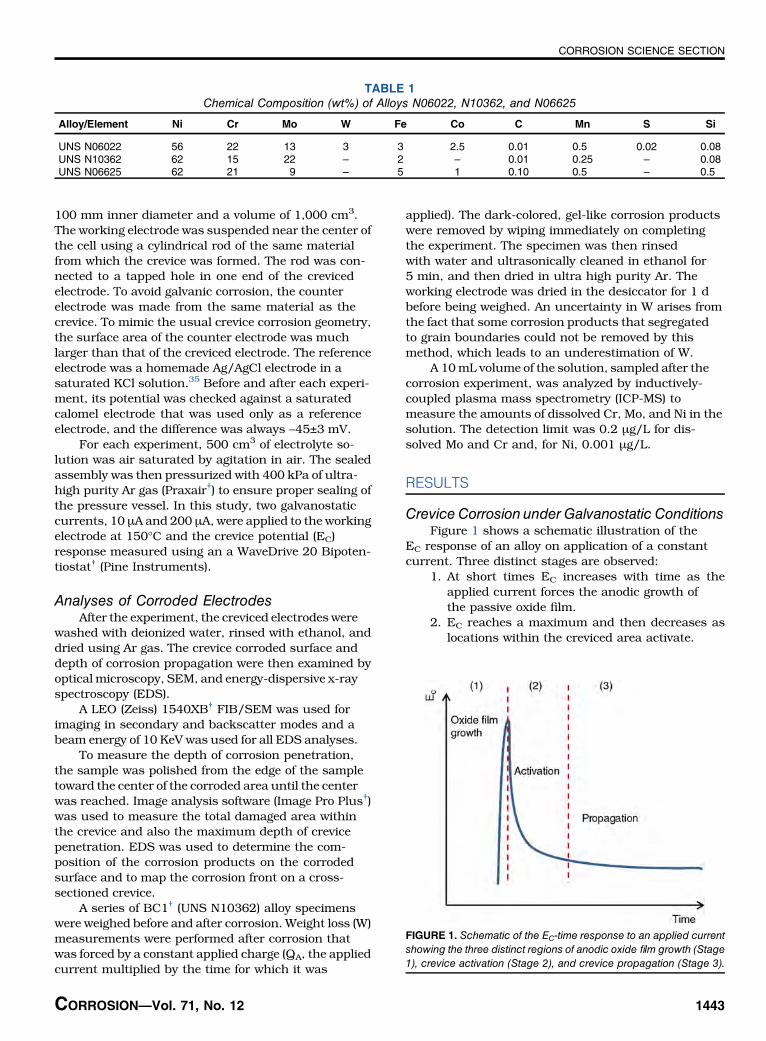
Crevice Corrosion under Galvanostatic ConditionsFigure 1 shows a schematic illustration of the
EC response of an alloy on application of a constantcurrent. Three distinct stages are observed:
1. At short times EC increases with time as theapplied current forces the anodic growth ofthe passive oxide film.
2. EC reaches a maximum and then decreases aslocations within the creviced area activate.
TABLE 1Chemical Composition (wt%) of Alloys N06022, N10362, and N06625
Alloy/Element Ni Cr Mo W Fe Co C Mn S Si
UNS N06022 56 22 13 3 3 2.5 0.01 0.5 0.02 0.08UNS N10362 62 15 22 – 2 – 0.01 0.25 – 0.08UNS N06625 62 21 9 – 5 1 0.10 0.5 – 0.5
FIGURE 1. Schematic of the EC-time response to an applied currentshowing the three distinct regions of anodic oxide film growth (Stage1), crevice activation (Stage 2), and crevice propagation (Stage 3).
CORROSION—Vol. 71, No. 12 1443
CORROSION SCIENCE SECTION

3. EC achieves an approximately steady-statevalue indicating the establishment of activepropagation conditions within the crevice.
The activation stage (Stage 2) represents the periodrequired to establish a sufficiently large IR drop andcritical crevice solution36-37 to place the creviced loca-tions in an active region.38
Figures 2(a) and (b) show the measured EC forcurrents of 10 μA, applied for 4 d, and 200 μA, appliedfor 6 d, for the three alloys. A previous study32 showedthat a minimum current of 10 μA was needed to initiatecrevice corrosion in a crevice of the same geometry onthe N06022 alloy at 120°C. Therefore, the 10 μA currentwas chosen to study the stages involved in thetransition from passive to active behavior. At the highercurrent, this transition was rapid and the electrodewas in the active propagation stage for the majority ofthe experiment.
In Stage 1, EC rose rapidly and at an effectivelyidentical rate for the two high-Cr alloys (N06022 andC625† [UNS N06625]) and to a higher value than forthe low-Cr alloy (N10362). Although only a qualitativefeature, this increase illustrated the more rapidgrowth of the Cr(III) oxide barrier layer associated withpassivity on the high-Cr alloys.39 The slower rise in
EC, and lower potential threshold for the onset of acti-vation, for the N10362 alloy could then be attributedto its lower Cr content. At the higher applied current, thedifference in behavior between the high- and low-Cralloys in Stage 1 became distinctly more marked. Aconsiderably higher potential threshold was ob-served for the N06022 and N06625 alloys, and thatfor the N10362 alloy was significantly reduced. Whilethe absolute value of EC had no particular significance,the comparative effect was consistent with the in-fluence of Cr content on breakdown potentials.26
The activation pattern (Stage 2) also varied withalloy composition and applied current (Figure 2). Asexpected, the time required to complete activationwas shorter at the higher applied current (Figure 2[c])and predominantly determined by Cr content, beingcompleted in ∼45 min to 1 h for the high-Cr alloys, butalmost instantaneously for the low-Cr-containingN10362 alloy. Passivity was not established on theN10362 alloy prior to the activation of crevicecorrosion.
At the lower applied current, however, activationoccurred much more slowly, and the time required tocomplete the activation process was not directly re-lated to the Cr content of the alloy. Despite the high Cr
FIGURE 2. EC-time for the three alloys: (a) and (b) under galvanostatic polarization at 10 μA, and (c) and (d) undergalvanostatic polarization at 200 μA.
1444 CORROSION—DECEMBER 2015
CORROSION SCIENCE SECTION
content, activation occurred in 1 h on the N06625alloy with a Mo content of only 9 wt%. For the N10362alloy, activation required 3 h to 4 h despite the sig-nificantly lower Cr content, showing that once the Cr(III)oxide layer was breached, the establishment of activecrevice propagation conditions was predominantlycontrolled by the Mo content. Closer inspection of theEC-time plot for the N10362 alloy during the activationstage detected minor negative-going transients (notshown in Figure 2[a]), which are typical of metastablefilm-breakdown/repair events.40 As noted previous-ly,20,23 such transients have been attributed to thesuppression by Mo of breakdown events that lead toestablishment of active crevice sites. While the very highMo content could suppress these minor metastableevents, it could not prevent eventual activation at such alow Cr content.
For the N06022 alloy, the passive-to-activetransition was not so readily achieved, and majorfluctuations occurred, the alloy apparently making anumber of major attempts to activate before finallyachieving the fully activated state. Because the Crand Mo contents are inverted in this alloy compared tothose in the N10362 alloy (Table 1), this behavior wasconsistent with an improved ability to resist filmbreakdown, resulting from the high Cr content, but alower ability to resist activation, resulting from the lowerMo (or Mo +W) content. The competition betweenthese two processes results in a slightly longer period tocomplete activation on N06022 than on theN10362 alloy.
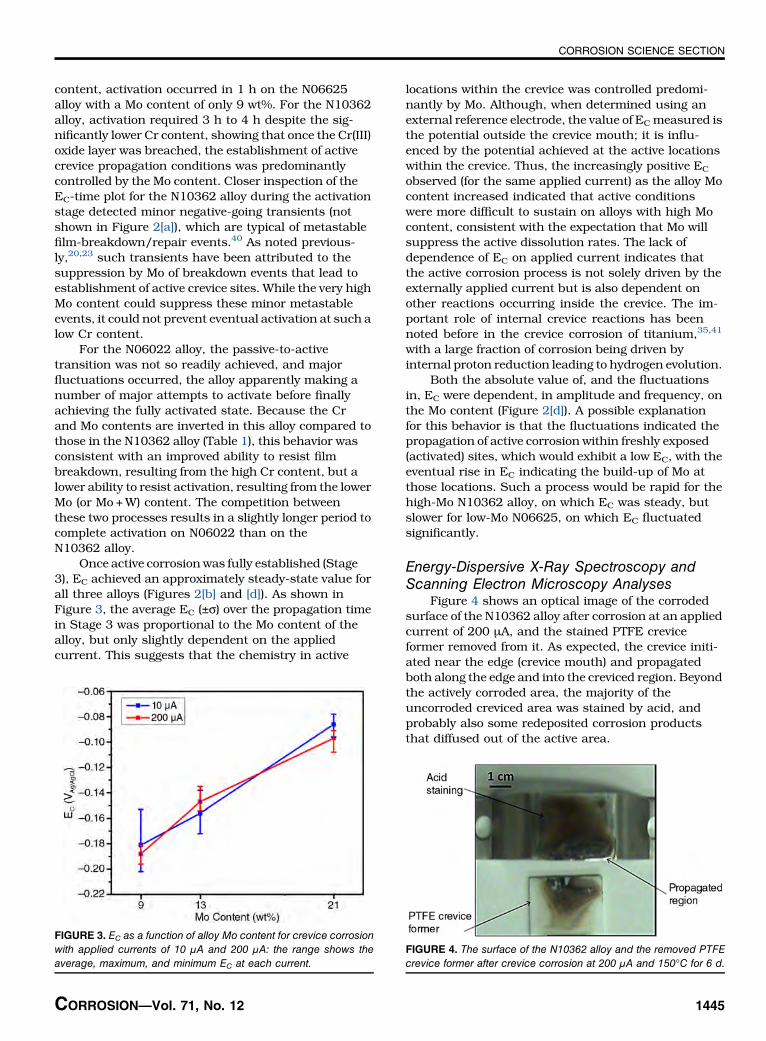
Once active corrosion was fully established (Stage3), EC achieved an approximately steady-state value forall three alloys (Figures 2[b] and [d]). As shown inFigure 3, the average EC (±σ) over the propagation timein Stage 3 was proportional to the Mo content of thealloy, but only slightly dependent on the appliedcurrent. This suggests that the chemistry in active
locations within the crevice was controlled predomi-nantly by Mo. Although, when determined using anexternal reference electrode, the value of EC measured isthe potential outside the crevice mouth; it is influ-enced by the potential achieved at the active locationswithin the crevice. Thus, the increasingly positive EC
observed (for the same applied current) as the alloy Mocontent increased indicated that active conditionswere more difficult to sustain on alloys with high Mocontent, consistent with the expectation that Mo willsuppress the active dissolution rates. The lack ofdependence of EC on applied current indicates thatthe active corrosion process is not solely driven by theexternally applied current but is also dependent onother reactions occurring inside the crevice. The im-portant role of internal crevice reactions has beennoted before in the crevice corrosion of titanium,35,41
with a large fraction of corrosion being driven byinternal proton reduction leading to hydrogen evolution.
Both the absolute value of, and the fluctuationsin, EC were dependent, in amplitude and frequency, onthe Mo content (Figure 2[d]). A possible explanationfor this behavior is that the fluctuations indicated thepropagation of active corrosion within freshly exposed(activated) sites, which would exhibit a low EC, with theeventual rise in EC indicating the build-up of Mo atthose locations. Such a process would be rapid for thehigh-Mo N10362 alloy, on which EC was steady, butslower for low-Mo N06625, on which EC fluctuatedsignificantly.
Energy-Dispersive X-Ray Spectroscopy andScanning Electron Microscopy Analyses
Figure 4 shows an optical image of the corrodedsurface of the N10362 alloy after corrosion at an appliedcurrent of 200 μA, and the stained PTFE creviceformer removed from it. As expected, the crevice initi-ated near the edge (crevice mouth) and propagatedboth along the edge and into the creviced region. Beyondthe actively corroded area, the majority of theuncorroded creviced area was stained by acid, andprobably also some redeposited corrosion productsthat diffused out of the active area.
FIGURE 3. EC as a function of alloy Mo content for crevice corrosionwith applied currents of 10 μA and 200 μA: the range shows theaverage, maximum, and minimum EC at each current.
FIGURE 4. The surface of the N10362 alloy and the removed PTFEcrevice former after crevice corrosion at 200 μA and 150°C for 6 d.
CORROSION—Vol. 71, No. 12 1445
CORROSION SCIENCE SECTION
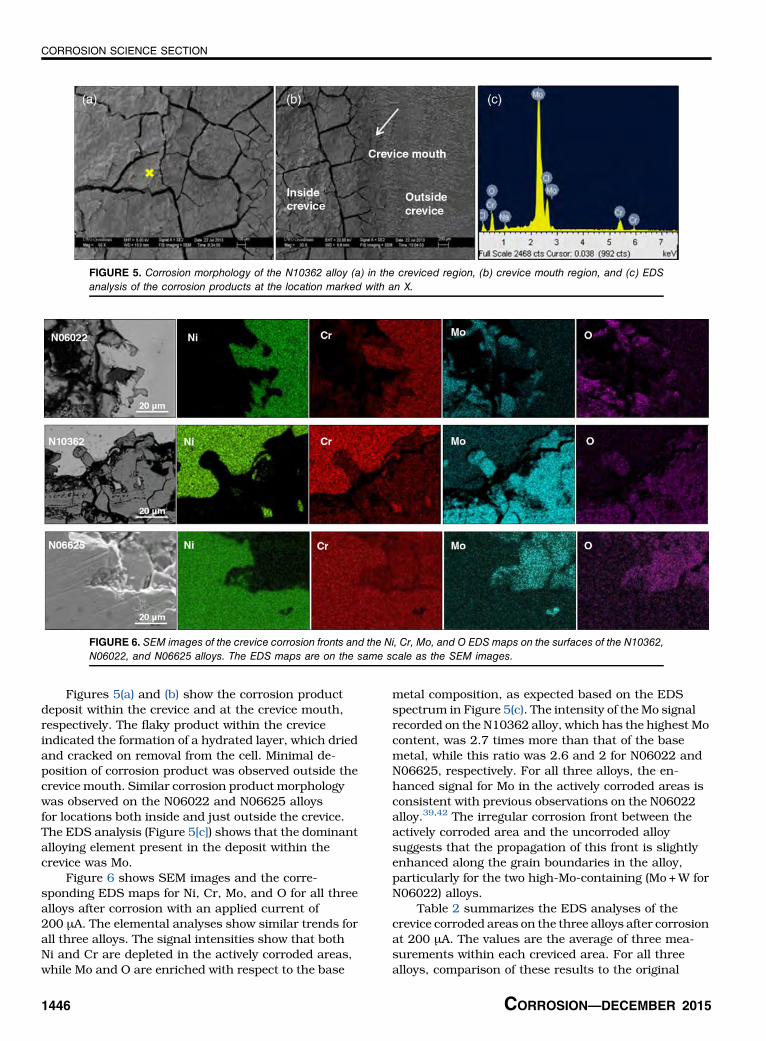
Figures 5(a) and (b) show the corrosion productdeposit within the crevice and at the crevice mouth,respectively. The flaky product within the creviceindicated the formation of a hydrated layer, which driedand cracked on removal from the cell. Minimal de-position of corrosion product was observed outside thecrevice mouth. Similar corrosion product morphologywas observed on the N06022 and N06625 alloysfor locations both inside and just outside the crevice.The EDS analysis (Figure 5[c]) shows that the dominantalloying element present in the deposit within thecrevice was Mo.
Figure 6 shows SEM images and the corre-sponding EDS maps for Ni, Cr, Mo, and O for all threealloys after corrosion with an applied current of200 μA. The elemental analyses show similar trends forall three alloys. The signal intensities show that bothNi and Cr are depleted in the actively corroded areas,while Mo and O are enriched with respect to the base
metal composition, as expected based on the EDSspectrum in Figure 5(c). The intensity of the Mo signalrecorded on the N10362 alloy, which has the highest Mocontent, was 2.7 times more than that of the basemetal, while this ratio was 2.6 and 2 for N06022 andN06625, respectively. For all three alloys, the en-hanced signal for Mo in the actively corroded areas isconsistent with previous observations on the N06022alloy.39,42 The irregular corrosion front between theactively corroded area and the uncorroded alloysuggests that the propagation of this front is slightlyenhanced along the grain boundaries in the alloy,particularly for the two high-Mo-containing (Mo +W forN06022) alloys.
Table 2 summarizes the EDS analyses of thecrevice corroded areas on the three alloys after corrosionat 200 μA. The values are the average of three mea-surements within each creviced area. For all threealloys, comparison of these results to the original
FIGURE 5. Corrosion morphology of the N10362 alloy (a) in the creviced region, (b) crevice mouth region, and (c) EDSanalysis of the corrosion products at the location marked with an X.
FIGURE 6. SEM images of the crevice corrosion fronts and the Ni, Cr, Mo, and O EDS maps on the surfaces of the N10362,N06022, and N06625 alloys. The EDS maps are on the same scale as the SEM images.
1446 CORROSION—DECEMBER 2015
CORROSION SCIENCE SECTION
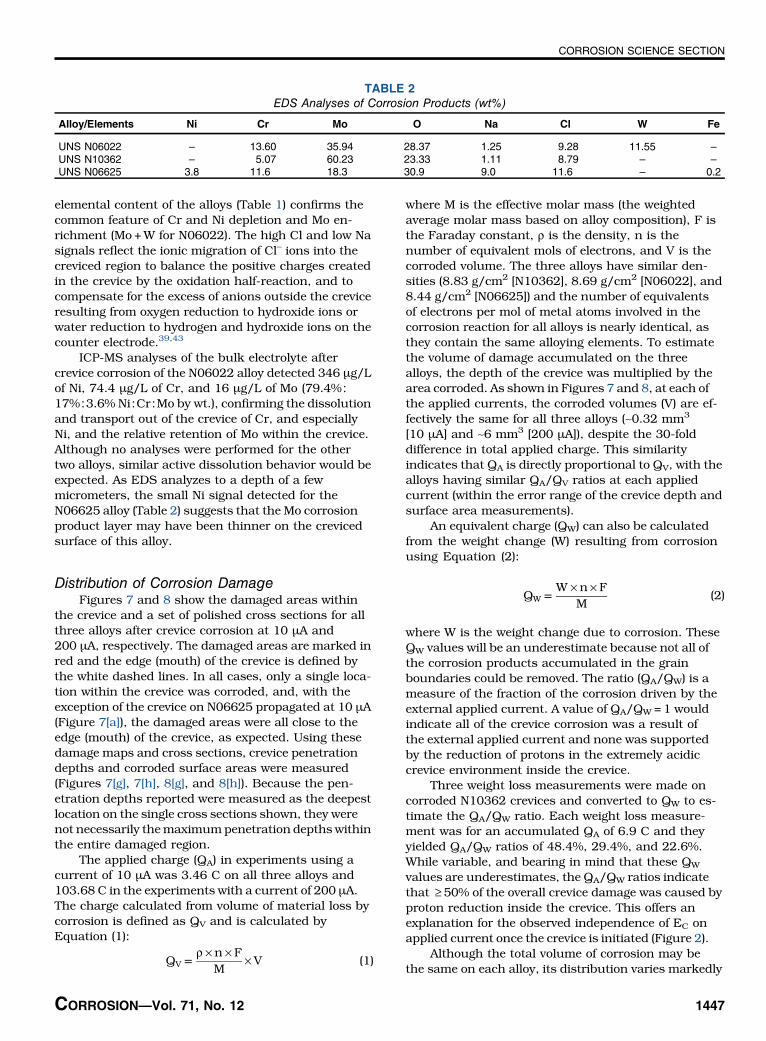
elemental content of the alloys (Table 1) confirms thecommon feature of Cr and Ni depletion and Mo en-richment (Mo +W for N06022). The high Cl and low Nasignals reflect the ionic migration of Cl− ions into thecreviced region to balance the positive charges createdin the crevice by the oxidation half-reaction, and tocompensate for the excess of anions outside the creviceresulting from oxygen reduction to hydroxide ions orwater reduction to hydrogen and hydroxide ions on thecounter electrode.39,43
ICP-MS analyses of the bulk electrolyte aftercrevice corrosion of the N06022 alloy detected 346 μg/Lof Ni, 74.4 μg/L of Cr, and 16 μg/L of Mo (79.4%∶17%∶3.6% Ni∶Cr∶Mo by wt.), confirming the dissolutionand transport out of the crevice of Cr, and especiallyNi, and the relative retention of Mo within the crevice.Although no analyses were performed for the othertwo alloys, similar active dissolution behavior would beexpected. As EDS analyzes to a depth of a fewmicrometers, the small Ni signal detected for theN06625 alloy (Table 2) suggests that the Mo corrosionproduct layer may have been thinner on the crevicedsurface of this alloy.
Distribution of Corrosion DamageFigures 7 and 8 show the damaged areas within
the crevice and a set of polished cross sections for allthree alloys after crevice corrosion at 10 μA and200 μA, respectively. The damaged areas are marked inred and the edge (mouth) of the crevice is defined bythe white dashed lines. In all cases, only a single loca-tion within the crevice was corroded, and, with theexception of the crevice on N06625 propagated at 10 μA(Figure 7[a]), the damaged areas were all close to theedge (mouth) of the crevice, as expected. Using thesedamage maps and cross sections, crevice penetrationdepths and corroded surface areas were measured(Figures 7[g], 7[h], 8[g], and 8[h]). Because the pen-etration depths reported were measured as the deepestlocation on the single cross sections shown, they werenot necessarily themaximumpenetration depths withinthe entire damaged region.
The applied charge (QA) in experiments using acurrent of 10 μA was 3.46 C on all three alloys and103.68 C in the experiments with a current of 200 μA.The charge calculated from volume of material loss bycorrosion is defined as QV and is calculated byEquation (1):
QV =ρ × n × F
M× V (1)
where M is the effective molar mass (the weightedaverage molar mass based on alloy composition), F isthe Faraday constant, ρ is the density, n is thenumber of equivalent mols of electrons, and V is thecorroded volume. The three alloys have similar den-sities (8.83 g/cm2 [N10362], 8.69 g/cm2 [N06022], and8.44 g/cm2 [N06625]) and the number of equivalentsof electrons per mol of metal atoms involved in thecorrosion reaction for all alloys is nearly identical, asthey contain the same alloying elements. To estimatethe volume of damage accumulated on the threealloys, the depth of the crevice was multiplied by thearea corroded. As shown in Figures 7 and 8, at each ofthe applied currents, the corroded volumes (V) are ef-fectively the same for all three alloys (∼0.32 mm3
[10 μA] and ∼6 mm3 [200 μA]), despite the 30-folddifference in total applied charge. This similarityindicates that QA is directly proportional to QV, with thealloys having similar QA/QV ratios at each appliedcurrent (within the error range of the crevice depth andsurface area measurements).
An equivalent charge (QW) can also be calculatedfrom the weight change (W) resulting from corrosionusing Equation (2):
QW =W × n × F
M(2)
where W is the weight change due to corrosion. TheseQW values will be an underestimate because not all ofthe corrosion products accumulated in the grainboundaries could be removed. The ratio (QA/QW) is ameasure of the fraction of the corrosion driven by theexternal applied current. A value of QA/QW = 1 wouldindicate all of the crevice corrosion was a result ofthe external applied current and none was supportedby the reduction of protons in the extremely acidiccrevice environment inside the crevice.
Three weight loss measurements were made oncorroded N10362 crevices and converted to QW to es-timate the QA/QW ratio. Each weight loss measure-ment was for an accumulated QA of 6.9 C and theyyielded QA/QW ratios of 48.4%, 29.4%, and 22.6%.While variable, and bearing in mind that these QW
values are underestimates, the QA/QW ratios indicatethat ≥ 50% of the overall crevice damage was caused byproton reduction inside the crevice. This offers anexplanation for the observed independence of EC onapplied current once the crevice is initiated (Figure 2).
Although the total volume of corrosion may bethe same on each alloy, its distribution varies markedly
TABLE 2EDS Analyses of Corrosion Products (wt%)
Alloy/Elements Ni Cr Mo O Na Cl W Fe
UNS N06022 – 13.60 35.94 28.37 1.25 9.28 11.55 –
UNS N10362 – 5.07 60.23 23.33 1.11 8.79 – –
UNS N06625 3.8 11.6 18.3 30.9 9.0 11.6 – 0.2
CORROSION—Vol. 71, No. 12 1447
CORROSION SCIENCE SECTION

from alloy to alloy. As the Mo content of the alloyincreases in the order:
N06625 ð9%MoÞ < N06022 ð13%Mo ½3%W�Þ< N10362 ð22%MoÞ
the depth of penetration decreases, while the areacorroded increases.
Figure 9 shows that the depth of crevice pene-tration decreases markedly as the Mo +W content of thecorrosion products increases (W is present only inN06022 but is enriched like Mo within the crevice[Table 2] and known to exert an identical influenceon crevice propagation34). Figure 10 shows the depth ofpenetration as a function of the Mo +W content ofthe original alloys (Table 1) for both applied currents.For a sufficiently high Mo +W content, the penetra-tion depth is only marginally dependent on the appliedcurrent, confirming that the dominant factor con-trolling active propagation is the chemical influence of
Mo +W. By contrast, the depth of penetration on theN06625 alloy increases markedly when the appliedcurrent is increased, a strong indication thatactive propagation is still mainly controlled by the ca-thodic reaction proceeding outside the crevice, whichcould reflect a higher QA/QW ratio, although thisremains to be demonstrated.
The damage maps in Figures 7 and 8 show that,besides the total area actively corroded, the lateraldimensions of damage propagation also vary with thealloy composition. This is particularly noticeable for theN06022 and N10362 alloys. For both alloys, propa-gation follows the edge of the crevice, but there is a moremarked tendency for propagation toward the center ofthe crevice on N10362 than on N06022. While observ-able in experiments with an applied current of 200 μA(Figures 8[b] and [c]), it is more obvious in experimentsat the lower current (10 μA) (Figures 7[b] and [c]). Thisability to propagate more deeply into the crevice couldreflect the lower Cr content of the N10362 comparedto N06022; i.e., it is kinetically easier to activate areas at
FIGURE 7. Alloy surfaces after crevice corrosion at an applied current of 10 μA and an accumulated charge of 3.46 C. Thetop row shows optical images of the crevice-corroded surface areas of (a) N06625, (b) N06022, and (c) N10362 alloys. Thecorroded region is colored red. The dashed white lines in (a) through (c) show the edge of the creviced region as defined bythe location of the crevice former. The middle row gives SEM images of crevice-corroded cross sections of (d) N06625,(e) N06022, and (f) N10362, and the bottom row plots (g) the maximum crevice depths, (h) crevice-corroded surface areas,and (i) crevice region volumes for the three alloys.
1448 CORROSION—DECEMBER 2015
CORROSION SCIENCE SECTION
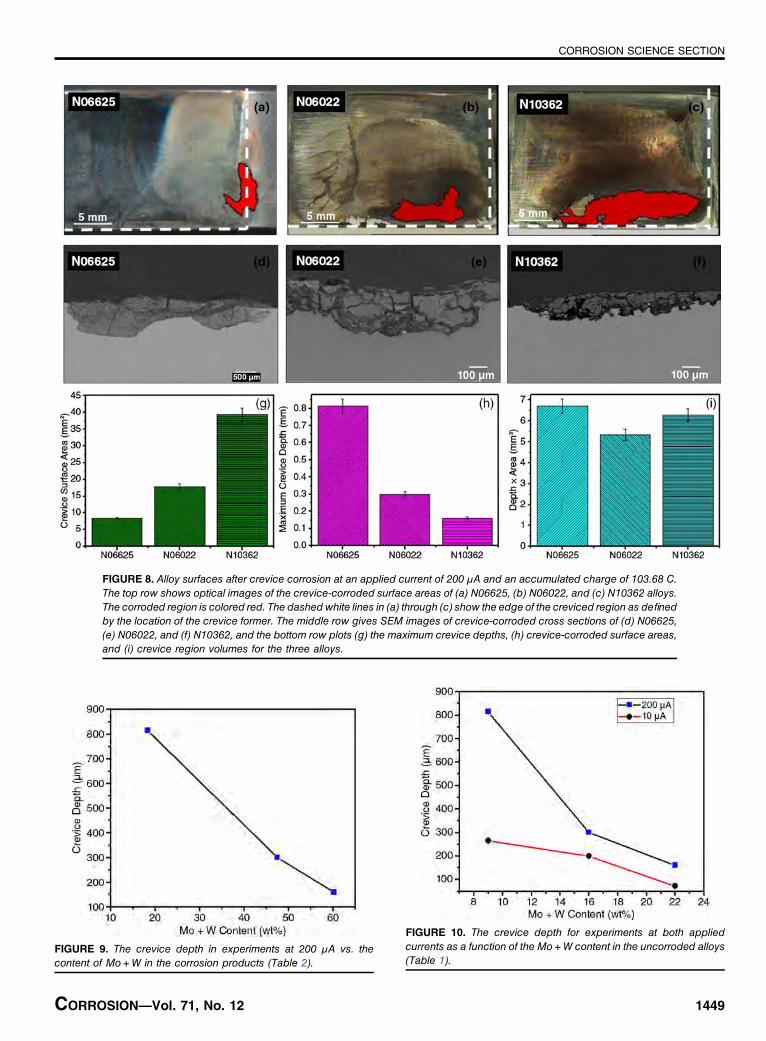
FIGURE 8. Alloy surfaces after crevice corrosion at an applied current of 200 μA and an accumulated charge of 103.68 C.The top row shows optical images of the crevice-corroded surface areas of (a) N06625, (b) N06022, and (c) N10362 alloys.The corroded region is colored red. The dashedwhite lines in (a) through (c) show the edge of the creviced region as definedby the location of the crevice former. The middle row gives SEM images of crevice-corroded cross sections of (d) N06625,(e) N06022, and (f) N10362, and the bottom row plots (g) the maximum crevice depths, (h) crevice-corroded surface areas,and (i) crevice region volumes for the three alloys.
FIGURE 9. The crevice depth in experiments at 200 μA vs. thecontent of Mo +W in the corrosion products (Table 2).
FIGURE 10. The crevice depth for experiments at both appliedcurrents as a function of the Mo +W content in the uncorroded alloys(Table 1).
CORROSION—Vol. 71, No. 12 1449
CORROSION SCIENCE SECTION
deeper locations onN10362. As discussed, the resultsin Figure 2 show that activation involves a competitionbetween breaching the Cr(III) oxide barrier layer andthe tendency to repassivate the breakdown site by theaccumulation of molybdate and tungstate deposits,and that activation is more readily achieved on the low-Cr-containing N10362. An explanation for this effectin terms of the potential distribution within the crevice(i.e., according to the IR drop model38,44) is not soreadily constructed, indicating that chemical effectsare dominant in determining crevice corrosion be-havior on these alloys at these enforced propaga-tion rates.
Discussion: Chemistry in Crevice-CorrodedRegions
The local chemistry within the active crevice isclearly a key feature in controlling the activationof corrosion and the propagation of the accumulateddamage. The pH in active locations could approachzero.20,45 Potential-pH diagrams for the three keyelements (Ni, Cr, and Mo), calculated for 4 M NaCl (at120°C) show that both Cr2O3 and NiO are unstable atpH < 3. Cation solubility is increased by the formation ofchloride complexes (e.g., CrCl2+, NiCl+). Thus, the lossof Cr and Ni as soluble species from the creviced area,detected by solution analyses and indicated by theirabsence from the corrosion products deposited withinthe crevice, is not surprising. The redeposition of Cr,as Cr(OH)3 or Cr2O3, at the higher pH values prevailingoutside the crevice would be expected.42
The role of Mo in controlling the active corrosionwithin a propagating crevice has been previously in-vestigated,32-34 and the accumulation of Mo(VI) aspolymeric species such as Mo8O26
4− (and possibly also asMo7O24
6− and Mo3O102− ) demonstrated using Raman
spectroscopy.34 Although undetected in this Ramananalysis,34 W is expected to accumulate as polymerictungstates also.
The initial dissolution of Mo within an activatingcrevice will be as MoO4
2−:
1MoO2 þ 2H2O → MoO2−4 þ 4Hþ þ 2e− (3)
but even for pH values slightly <6.5, paramolybdatespecies are known to form via proton-consumingreactions46-47 such as:
7MoO2−4 þ 8Hþ → Mo7O6−
24 þ 4H2O (4)
Similar reactions are anticipated for W:43,46
6WO2−4 þ 7Hþ → HW6O5−
21 þ 4H2O (5)
supporting the authors’ argument thatWwill exert aninfluence similar to that of Mo within an active crevice. Itwas previously suggested34 that the ability of Mo (andW) to suppress crevice propagation can be attributed to
this tendency to polymerize, with the extent of poly-merization, and hence proton consumption, increasingmarkedly as the pH decreases:
8MoO2−4 þ 12Hþ → Mo8O4−
26 þ 6H2O (6)
Under the constant current conditions used in theauthors’ experiments, metal dissolution will be on-going at a constant rate. Because this rate is the same(at the same current) irrespective of the alloy com-position, the rate of production of dissolved metal spe-cies will be constant, leading to the on-goingproduction of acidic conditions by cation hydrolysisprocesses, particularly for Cr, Mo, and W, e.g.:
Mo6þ þ 4H2O → MoO2−4 þ 8Hþ (7)
2Cr6þ þ 8H2O → 2CrO2−4 þ 16Hþ (8)
Although some of the protons produced by these reac-tions will be consumed by the polymerization reac-tions, the modification of the local pH by molybdateformation will not be as significant as suggestedpreviously.8,48 Each mol of Mo will, at best, neutralize1.5 mols of H+ (Equation [6]), while the hydrolysis of1 mol of Mo6+ leads to the formation of 8 H+ (Equa-tion [7]). In addition, the hydrolysis of other alloyelements, such as Cr and W (for N06022 alloy), will alsoproduce H+, eight in the case of Cr6+ (Equation [8]).Thus, the production of H+ will far exceed its con-sumption by molybdate formation, and polymeriza-tion will have little effect on the pH. The more likelyinfluence of molybdate formation is that it stiflesactive alloy dissolution by formation of a protectivelayer. The more rapid production of large amounts ofsoluble Mo(VI) for the high-Mo-containing alloy(N10362) compared to the low-Mo-containing alloys(N06022 and N06625) would then lead to themore rapidblockage of active sites. The analyses in Table 2 showthat the Mo content of the corrosion product depositincreased with the Mo content of the alloy. However,whether this reflects a higher Mo content of the poly-meric layer or a thicker molybdate layer is uncertain.
Irrespective of which of these is the case, thecorrelation between the Mo content of the corrosionproduct and the depth of penetration confirms theability of such a layer to stifle active dissolution.Because repassivation is prevented under constantcurrent conditions, this local site suppression leads tothe lateral spread of propagation, as previously de-scribed for N06022,34 a process that requires the on-going activation of new sites. This is sustained bythe concentration of current around the periphery of theexpanding damage area.
CONCLUSIONS
v The effects of the alloying elements Cr, Mo, and Won crevice corrosion initiation and propagation on
1450 CORROSION—DECEMBER 2015
CORROSION SCIENCE SECTION
three commercial Ni alloys were investigated undergalvanostatic control in 3 M NaCl at 150°C. The gal-vanostatic approach was used to study activationand propagation by avoiding repassivation.v The activation step was shown to depend on theMo content of the alloy and to involve competitionbetween Cr(III) barrier layer breakdown and Mo(VI)/W(VI) accumulation to repair breakdown sites.v Under stable propagation conditions, the EC mea-sured is proportional to the Mo +W content of thealloy, and almost constant and independent of theapplied anodic current, indicating that propagationis controlled by the crevice chemistry.v Mo content determines the distribution of corrosiondamage. For N06625 (9% Mo) propagation leadspredominantly to penetration into the alloy, whereasincreasedMo content (N06022 [13wt%] andN10362 [22wt%]) causes corrosion damage to spread laterallyacross the creviced surface. This is attributed to for-mation of polymeric molybdates, which occursmore rapidly as the Mo content increases, and limitsthe depth of penetration into the alloy.v The primary influence of Mo is to stifle the disso-lution of the alloy by accumulation at active sites.Its influence on controlling pH within the creviceis minor.v Greater than 50% of propagation is caused byproton reduction inside the crevice.
ACKNOWLEDGMENTS
The authors would like to thank Haynes Interna-tional (Kokomo, Indiana) for their generous donation ofmaterial and the Western Nanofabrication Facilityfor SEMand EDS analyses. This project received fundingfrom the Natural Sciences and Engineering ResearchCouncil of Canada (NSERC).
REFERENCES
1. R.W. Revie, H.H. Uhlig, Uhlig’s Corrosion Handbook, 3rd ed.(Hoboken, NJ: John Wiley & Sons, 2011).
2. J.C. Estill, K.J. King, D.V. Fix, D.G. Spurlock, G.A. Hust, S.R.Gordon, R.D. McCright, R.B. Rebak, G.M. Gordon, “Susceptibilityof Alloy 22 to Environmentally Assisted Cracking in YuccaMountain Relevant Environments,” Dept. of Energy, UCRL-JC-145992, January 2002.
3. R.M. Carranza, M.A. Rodríguez, R.B. Rebak, Corrosion 63 (2007):p. 480-490.
4. M.A. Rodríguez, R.M. Carranza, R.B. Rebak, Metall. Mater. Trans.A 36 (2005): p. 1179-1185.
5. R.M. Carranza, C.M. Giordano, M.A. Rodríguez, R.B. Rebak, “Effectof the Addition of Organic Acids to the General and CreviceCorrosion Behavior of Alloy 22 in Chloride Solutions,”CORROSION2008, paper no. 578 (Houston, TX: NACE International, 2008).
6. E.C. Hornus, C. Mabel Giordano, M.A. Rodríguez, R.M. Carranza,MRS Online Proceedings Library 1475 (2012): p. 251-258.
7. E.C. Hornus, C.M. Giordano, M.A. Rodríguez, R.M. Carranza,R.B. Rebak, “Effect of Temperature on Crevice Corrosion Suscep-tibility of Nickel Alloys for Nuclear Repositories,” CORROSION2013, paper no. 2504 (Houston, TX: NACE, 2013).
8. J.R. Hayes, J.J. Gray, A.W. Szmodis, C.A. Orme, Corrosion 62(2006): p. 491-500.
9. F. Wong, R. Buchheit, ECS Trans. 16 (2009): p. 91-100.10. X. Shan, J.H. Payer, J. Electrochem. Soc. 156 (2009):
p. C313-C321.11. A.C. Lloyd, J.J. Noël, S. McIntyre, D.W. Shoesmith, Electrochim.
Acta 49 (2004): p. 3015-3027.12. A.C. Lloyd, D.W. Shoesmith, N.S. McIntyre, J.J. Noël, J. Electro-
chem. Soc. 150 (2003): p. B120-B130.13. P. Marcus, J.M. Grimal, Corros. Sci. 33 (1992): p. 805-814.14. S. Haupt, H.H. Strehblow, Corros. Sci. 37 (1995): p. 43-54.15. C.O.A. Olsson, D. Landolt, Electrochim. Acta 48 (2003):
p. 1093-1104.16. K. Sieradzki, R.C. Newman, J. Electrochem. Soc. 133 (1986):
p. 1979-1980.17. P. Marcus, Electrochim. Acta 43 (1998): p. 109-118.18. A.C. Lloyd, J.J. Noël, N.S. McIntyre, D.W. Shoesmith, JOM 57
(2005): p. 31-35.19. B.A. Kehler, J.R. Scully, Corrosion 61 (2005): p. 665-684.20. B.A. Kehler, G.O. Ilevbare, J.R. Scully, Corrosion 57 (2001):
p. 1042-1065.21. R.S. Lillard, M.P. Jurinski, J.R. Scully, Corrosion 50 (1994):
p. 251-265.22. S. Haudet, M.A. Rodríguez, R.M. Carranza, “Effect of Alloy Com-
position on the Localized Corrosion Resistance of Nickel Alloys,” inScientific Basis for Nuclear Waste Management XXXV, eds. R.M.Carranza, G.S. Duffo, R.B. Rebak, MRS Symposium Proceedings,vol. 1475 (New York, NY: Cambridge University Press, 2012),p. 489-494.
23. F. Bocher, R. Huang, J.R. Scully, Corrosion 66 (2010):p. 55002-55015.
24. S. Haudet, M. Rodríguez, R.M. Carranza, R.B. Rebak, “Effect ofAlloy Composition on the Crevice Corrosion Resistance ofNickel Alloys,” CORROSION 2012, paper no. 1455 (Houston, TX:NACE, 2012).
25. P. Kritzer, N. Boukis, E. Dinjus, Corrosion 56 (2000): p. 265-272.26. A.K. Mishra, D.W. Shoesmith, Corrosion 70 (2014): p. 721-730.27. A.K. Mishra, D.W. Shoesmith, Electrochim. Acta 102 (2013): p. 328-
335.28. P. Jakupi, D. Zagidulin, J.J. Noël, D.W. Shoesmith, Electrochim.
Acta 56 (2011): p. 6251-6259.29. D. Zagidulin, X. Zhang, J. Zhou, J.J. Noël, D.W. Shoesmith, Surf.
Interface Anal. 45 (2013): p. 1014-1019.30. X. Zhang, D. Zagidulin, D.W. Shoesmith, Electrochim. Acta 89
(2013): p. 814-822.31. X. Zhang, D.W. Shoesmith, Corros. Sci. 76 (2013): p. 424-431.32. P. Jakupi, J.J. Noël, D.W. Shoesmith, Corros. Sci. 54 (2012):
p. 260-269.33. P. Jakupi, J.J. Noel, D.W. Shoesmith, Corros. Sci. 53 (2011):
p. 3122-3130.34. P. Jakupi, F. Wang, J.J. Noël, D.W. Shoesmith, Corros. Sci. 53
(2011): p. 1670-1679.35. X. He, J.J. Noël, D.W. Shoesmith, J. Electrochem. Soc. 149 (2002):
p. B440-B449.36. J. Oldfield, W. Sutton, Br. Corros. J. 13 (1978): p. 13-22.37. J. Oldfield, W. Sutton, Br. Corros. J. 13 (1978): p. 104-111.38. H.W. Pickering, Corrosion 42 (1986): p. 125-140.39. P. Jakupi, D. Zagidulin, J. Noël, D.W. Shoesmith, ECS Trans. 3
(2007): p. 259-271.40. N. Ebrahimi, M.H. Moayed, A. Davoodi, Corros. Sci. 53 (2011):
p. 1278-1287.41. D. Shoesmith, J. Noel, D. Hardie, B. Ikeda, Corros. Rev. 18 (2000):
p. 331-360.42. R.G. Kelly, K.C. Stewart, “Combining the Ohmic Drop and Critical
Crevice Solution Approaches to Rationalize Intermediate Attackin Crevice Corrosion,” in Passivity of Metals and SemiconductorsVIII, eds. M.B. Ives, B.R. MacDougall, J.A. Bardwell, PV 99-42(Pennington, NJ: The Electrochemical Society, 2001).
43. K.Y.S. Ng, E. Gulari, Polyhedron 3 (1984): p. 1001-1011.44. H.W. Pickering, J. Electrochem. Soc. 150 (2003): p. K1-K13.45. B.K. Nash, R.G. Kelly, Corros. Sci. 35 (1993): p. 817-825.46. C. Heitner-Wirguin, R. Cohen, J. Inorg. Nucl. Chem. 26 (1964):
p. 161-166.47. C.F. Baes, R.E. Mesmer, The Hydrolysis of Cations (New York,
NY: Wiley, 1976).48. R.S. Lillard, M.P. Jurinski, J.R. Scully, Corrosion 50 (1994):
p. 251-265.
CORROSION—Vol. 71, No. 12 1451
CORROSION SCIENCE SECTION