Proteinase inhibitor II gene in transgenic poplar: Chemical and biological assays
Upload
independentCategory
view
0download
0
543
Journal of Protein Chemistry, Vol. 22, No. 6, August 2003 (© 2003)
0277-8033/03/0800-0543/0 © 2003 Plenum Publishing Corporation
Characterization of a Proteinase Inhibitorfrom Cajanus cajan (L.)
Soghra Khatun Haq1 and Rizwan Hasan Khan1,2
Received March 14, 2003
A protein proteinase inhibitor (PI) has been purified from pigeonpea Cajanus cajan (L.) PUSA 33variety by acetic-acid precipitation, salt fractionation and chromatography on a DEAE-Cellulosecolumn. The content of inhibitor was found to be 15 mg/20 g dry weight of pulse. The molecularweight of the inhibitor as determined by SDS-PAGE under reducing conditions was found to beabout 14,000. It showed inhibitory activity toward proteolytic enzymes belonging to the serine pro-tease group, namely trypsin and �-chymotrypsin. The inhibitory activity was stable over a widerange of pH and temperatures. Estimation of sulfhydryl groups yielded one free cysteine and at leasttwo disulfide linkages. N-terminal sequence homology suggests that it belongs to the Kunitzinhibitor family. Structural analysis by circular dichroism shows that the inhibitor possesses alargely disordered structure.
KEY WORDS: Cajanus cajan; circular dichroism; fluorescence quenching; Kunitz inhibitor; N-terminalsequence; proteinase inhibitor.
1 Interdisciplinary Biotechnology Unit, Aligarh Muslim University,Aligarh 202 002, India.
2 To whom correspondence should be addressed. E-mail: [email protected]
1. INTRODUCTION
Proteinase inhibitors (PIs) comprise one of the mostabundant classes of proteins in plants (Ussuf et al.,2001). Most storage organs such as seeds and tubers con-tain 1 to 10% of their total proteins as PIs, which inhibitdifferent types of enzymes (Ryan, 1981; Pearce et al.,1982). These proteins have diverse biochemical func-tions, some of which include elimination of unwantedproteolysis (Laskowski and Kato, 1980), inhibition of in-traerythrocytic development of Plasmodium falciparum(Rockett et al., 1990), suppression of in vitro and in vivoreplication of retroviruses (Vonderfecht et al., 1988) andinhibition of growth of transformed cells (Schnebli andBurger, 1972; Chou et al., 1974). The plant proteinaseinhibitors of serine proteinases play a dominant rolein natural plant defence and infection processes(Ramasarma et al., 1994).
C. cajan (L.) Millsp. is one of the oldest food cropsand ranks fifth in importance among edible legumes of
the world (Salunkhe et al., 1986). It is important inhuman nutrition as a rich source of dietary protein(Singh et al., 1984). However, preharvest damage due toinsect pests on developing seed and postharvest lossesdue to storage pests are severe (Reed and Lateef, 1990).Consequently, the amylase inhibitors (AIs) and pro-teinase inhibitors (PIs) have gained attention as possibletools of natural and engineered resistance against pestsand pathogens (Ryan, 1990; Giri and Kachole, 1998).Besides this, increased exposure to dietary protease in-hibitors has been shown to protect against somechemically induced animal tumors (Weed et al., 1985;Mokhtar et al., 1988) and it has been suggested thatprotection against cancer may be achieved through thisavenue (Schelp and Pongpaew, 1988).
The legume proteinase inhibitors are classified intotwo main groups according to their size and cystine con-tent. One group of inhibitors, the Bowman-Birk type, hasmolecular weights of around 8000 and relatively highcystine content. The other main category of inhibitors, the
3 Abbreviations: BAPNA, N�-Benzoyl-L-Arg-p-nitroanilide; DTT,dithiothreitol; GPNA, Glutaryl-Gly-Gly-Phe �-naphthylamide;NATA, N-acetyl L-tryptophanamide; PI, proteinase inhibitor; SDS-PAGE, sodium dodecyl sulfate–polyacrylamide gel electrophoresis.
475748.qxd 10/31/03 5:32 PM Page 543
Kunitz type, has molecular weights of around 20,000 andlower cystine content. A common feature of plant PIs ishigh level of S-S bridges that confer great stability to heat,pH extremes, and to hydrolysis by proteases. The unique-ness of Bowman-Birk type inhibitors is that they have verylittle ordered structure in them (�-helix and �-structure)but have high content of aperiodic structure, which offersgreater flexibility to the molecule. However, the disulfidelinkages in the protein minimize the conformationalentropy and enhance the stability of these proteins(Ramasarma et al., 1994). Crystal structure analysis ofsoybean trypsin inhibitor (Kunitz) has also revealed theabsence of �-helix and most of the polypeptide chain isinvolved in approximate �-pleated sheet structures withlittle, if any, regular sheet structure. It is stabilized chieflyby hydrophobic interactions of short stretches of hydrogenbonded sheets and proved to be extremely stable againstthe denaturing effect of 6 M guanidine hydrochloride(Sweet et al., 1974; Jirgensons et al., 1969).
In continuation of the studies of proteinase inhibitorsfrom Leguminosae seeds, the present paper describes thepurification and some of the properties of a proteinaseinhibitor from C. cajan pulse.
2. MATERIALS AND METHODS
2.1. Materials
C. cajan pulse (decorticated split cotyledons) wasprocured from the local market. Trypsin (3× crystal-lized), �-chymotrypsin (3× crystallized), Dithiothreitoland Hammersten casein were purchased from Sisco Re-search Laboratories, India. N-Acetyl-L-tryptophanamide(NATA), N�-Benzoyl-L-Arg-p-nitroanilide (BAPNA)(Lot 37F0833), N-Glutaryl-Gly-Gly-Phe �-Naphthy-lamide (Lot 34F0402), DEAE cellulose (Lot 113H0367)and iodoacetamide were obtained from Sigma ChemicalCo. (St. Louis, MO).
2.2. Methods
2.2.1. Purification of C. cajan Inhibitor
C. cajan pulse was soaked overnight in 0.02 M Tris-HCl buffer, pH 8.2 containing 2 mM CaCl2. Thereafter itwas homogenized in a blender for 2 to 3 min at moderatespeed. The crude extract was filtered through a cheese-cloth to remove the coarse residual matter. It was thencentrifuged at 8000 rpm for 45 min at 4°C. The clear su-pernatant thus obtained was defatted with 0.1 M aceticacid (final pH of solution = 4.0). After overnight stirring,
the extract was subsequently centrifuged at 8000 rpm for45 min at 4°C. The supernatant was adjusted to pH 7.0with liquor ammonia and raised to 50% saturation withammonium sulphate. The precipitate was collected bycentrifugation at 8000 rpm for 45 min, 4°C; dissolved inminimum amount of 2 mM CaCl2 –20 mM Tris-HCl (pH8.2) and dialyzed against the same buffer for 24 hr.
The dialyzed sample (10 ml) was applied to aDEAE cellulose column (2.2 × 9.9 cm) equilibrated with2 mM CaCl2 –20 mM Tris-HCl (pH 8.2) and the boundprotein eluted with the same buffer containing 0.2 MNaCl. The fractions containing inhibitory activitiesagainst trypsin and �-chymotrypsin were pooled andused as the proteinase inhibitor.
2.2.2. Protein Estimation
Measurements of protein concentration were madeby the method of Lowry et al. (1951) using bovine serumalbumin as a standard.
2.2.3. SDS-PAGE
SDS-PAGE was performed on 15% polyacrylamideslab gel under reducing conditions (Laemmli, 1970).Proteins were detected by staining the gel with 0.1%Coomassie brilliant blue R-250.
2.2.4. Trypsin and Chymotrypsin Inhibitory Activities
For the assay of trypsin inhibitory activity in C.cajan PI; increasing amount of PI was incubated with afixed amount of trypsin in 1 ml of 2 mM CaCl2 – 20 mMTris-HCl (pH 8.2) at 37°C for 10 min. After addition of5 ml of BAPNA in dimethyl sulfoxide, the residual en-zyme activity was measured by monitoring the liberationof p-nitroaniline at 410 nm on an AIMIL SpectrochemMKII colorimeter.
�-Chymotrypsin inhibitory activity was assessed byincubating the enzyme with suitable quantities of theinhibitor in 2 mM CaCl2 – 20 mM Tris-HCl (pH 8.2) for10 min at 37°C, and thereafter assaying for residualenzyme activity using Hammersten casein or N-Glutaryl-Gly-Gly-Phe �-Naphthylamide as a substrate.
2.2.5. Determination of Tryptophan
Tryptophan content was assessed by the method ofGoodwin and Morton (1946). The absorption spectrum
544 Haq and Khan
475748.qxd 10/31/03 5:32 PM Page 544
of C. cajan PI was measured in the wavelength range300–220 nm in the presence of 0.1 M NaOH. The for-mula used was: w = (A280 − x · �y)/(�w – �y) where wwas estimated tryptophan content in moles per liter; A280
was absorbance at 280 nm; �y and �w were molar ex-tinction coefficients of tyrosine and tryptophan in 0.1 Malkali at 280 nm (�y = 1576 and �w = 5225).
Tryptophan content was also estimated by themethod of Spande and Witkop (1972). The initial opticaldensity of the C. cajan PI in 8 M urea at 280 nm wasrecorded and further decrease in optical density by theaddition of a fixed aliquot (10 �l) of 10 mM stock solu-tion of N-Bromosuccinimide. The addition was contin-ued in this stepwise fashion until further increments leadto no further decrease in optical density, with due al-lowance for the small decrease expected from dilution.The minimum optical density was recorded and correctedfor the volume increase due to the added reagent. Thereagent itself and succinimide display negligible absorp-tion at 280 nm.
2.2.6. Estimation of Tyrosine
Tyrosine content was estimated by the ionization ofphenolic hydroxyl groups. The titration of the phenolicgroups of the C. cajan PI was carried out spectrophoto-metrically (Qasim and Salahuddin, 1977; Salahuddin andKhan, 1997) at 30°C. Two identical solutions of PI atpH 6.0 and pH 13.0 were prepared and an alkaline differ-ence spectrum of the PI was recorded in the wavelengthregion 236–320 nm. Extreme care was taken to ensureidentical protein concentration in the two samples.
2.2.7. Measurement of Total Sulfhydryl Content
The total sulfhydryl content of the purified enzymewas measured by the method of Habeeb (1972), usingDTNB in which the release of nitrothiobenzoate anionwas measured by following the increase in absorbance at410 nm. The protein preparation was denatured by 6 MGdn. HCl and reduced by 0.025 M �-mercaptoethanol.After 2 hr the protein was precipitated with 5%trichloroacetic acid and precipitate resuspended in 8 Murea. Subsequently 2% SDS was added and the solutiontitrated against DTNB.
2.2.8. Effect of Temperature and pH on C. cajan PI
The thermal stability test of inhibitory activity wasdone in 20 mM CaCl2 – 20 mM Tris-HCl (pH 8.2) by
treating the PI sample for 30 min at various tempera-tures, viz 25°C, 30°C, 37°C, 56°C and 95°C in a ther-mostat. The samples were then adjusted to 37°C andchecked for residual inhibitory activity.
The effect of pH on the inhibitory potential of C.cajan PI were also checked by preincubating the PI withthe enzyme at the desired pH (2.0–10.0) for 10 min andthen assaying for residual enzyme activity. Ten-millimolesolutions of the following buffers were used to get thedesired pH: Gly-HCl (pH 3.0–4.0), sodium acetate(5.0–6.0), sodium phosphate (pH 7.0–8.0) and Gly-NaOH (pH 9.0–10.0).
2.2.9. Reduction of C. cajan PI
The inhibitor (0.5 mg/ml) in 2 mM CaCl2 –20 mMTris-HCl (pH 8.2) was treated with DTT (2 mM final con-centration) for 60 min at room temperature and the reac-tion stopped with 2-fold molar excess of iodoacetamide.After stirring for 30 min at 4°C, the reduced sampleswere dialyzed against the same buffer and used for activ-ity measurements as well as quenching experiments.
2.2.10. Fluorescence Titration Measurements
Fluorescence quenching measurements were per-formed on a Shimadzu RF 540 spectrofluorometerequipped with a data recorder DR-3 using an excitationwavelength of 280 nm and emission wavelength range of300–400 nm. C. cajan PI samples, native as well as re-duced, and N-acetyl-L-tryptophanamide (NATA) weretitrated with 2 M acrylamide and 1 M potassium iodide(containing 0.1 mM sodium thiosulphate to prevent oxi-dation and formation of I3
–). Relative fluorescence inten-sity was recorded with progressive addition of 10 �laliquots of the quenchers. Because acrylamide had in-trinsic absorption at 280 nm the inner filter effect wascorrected using the equation:
Fcorr = Fobs · 10A/2 (1)
where A is the absorbance of the sample at 280 nm bythe addition of acrylamide (Lakowicz, 1983).
The contribution of collisional quenching to the de-activation rate of an excited state fluorophore is given bythe Stern-Volmer equation:
FO/F = 1 + KSV[Q] (2)
where FO and F are the fluorescence intensities in the ab-sence and presence of a quencher at a molar concentration
Characterization of a Proteinase Inhibitor from Cajanus cajan (L.) 545
475748.qxd 10/31/03 5:32 PM Page 545
of [Q], and KSV is the Stern-Volmer constant which is theproduct of a collisional quenching rate constant and theexcited state lifetime of the fluorophore in the absence ofquencher. In a heterogenous population of fluorophores,such as tryptophan residues in a protein, the linear rela-tionship between FO/F and [Q] is generally not obeyed.In such species it is assumed that energy transfer betweenaccessible and inaccessible fluorophores is negligible andthat all fluorophores have identical absorptivities. The flu-orescence quenching is described by the modified Stern-Volmer equation:
FO
FO − F= 1
faKSV· 1
[Q]+ 1
fa(3)
where fa is the maximum fraction of the protein fluores-cence accessible to quencher.
2.2.11. CD Spectroscopy
Circular dichroism measurements were made on aJasco J-720 spectropolarimeter thermostated with a Neslabwater bath precalibrated with d-10-camphorsulfonic acid.The measurements were made at 25°C using quartz cellsof 1 mm path-length in the far-UV region and 1 cm path-length in the near-UV region. The path-lengths of the celland protein concentration (0.2–0.5 mg/ml) were chosen tooptimize the measuring conditions. Each spectrum was anaverage of two scans. Results are expressed in terms of[�]MRW (Schmid, 1990) where
[�]MRW = � × 100 × MRW
c × d(4)
where � is the measured ellipticity in degrees, c is theprotein concentration in mg/ml, d is the path-length incm, and MRW is the mean residue weight. The meanresidue weight used was 110 in all cases.
2.2.12. Kinetics of Binding to Serine Proteinases
The kinetics of association of Cajanus cajan PI totrypsin and �-chymotrypsin were analyzed by measure-ments of the loss of enzyme activity in the presence ofspecific chromogenic substrates under pseudo first-orderconditions. The enzymes were mixed with a large excessof inhibitor and samples withdrawn at timed intervalsto measure the residual enzyme concentration [E]. Theinitial concentration of PI was varied from 0.1–1.7 �M for analyses with trypsin and from 0.08–8.6 �Mfor analyses with �-chymotrypsin and substrate hydrolysis
did not exceed 10%. kass was calculated from therelationship:
kass = kobs/[I]o (5)
where kobs, (pseudo first-order rate constant) wasobtained from the slope of a plot of ln[E] (ln[residualenzyme activity]) against t (time of sampling) and [I]o
represents the inhibitor concentration. Inhibition constants, Ki, for the binding of C. cajan
PI to trypsin and �-chymotrypsin were determined fromthe equilibrium rates of substrate hydrolysis by the en-zymes at different inhibitor concentrations. Apparent in-hibition constants, Ki(app) were obtained by least-squaresregression of plots of the ratio between the inhibited anduninhibited rates of substrate hydrolysis against inhibitorconcentration as given by
vo/vi = 1 + [I]o/Ki(app) (6)
where vo represents the uninhibited rate and vi, theinhibited rate of substrate hydrolysis. Ki, the true equi-librium constants were calculated after correction forsubstrate competition.
2.2.12. Protein Sequencing
The N-terminal sequence was determined on aShimadzu PPSQ-10 automated protein sequencer usingEdman degradation. Phenylthiohydantoin amino acids(PTH-AA) were detected at 269 nm after separation on areverse-phase CR7A Chromatopac HPLC column(4.6 mm × 25 cm) from Shimadzu, under isocratic con-ditions, using 40% acetonitrile, 20 mM acetic acid and0.014% sodium dodecyl sulfate as the mobile phase at aflow rate of 1.0 ml/min at 40°C.
3. RESULTS AND DISCUSSION
3.1. Purification of C. cajan Proteinase Inhibitor
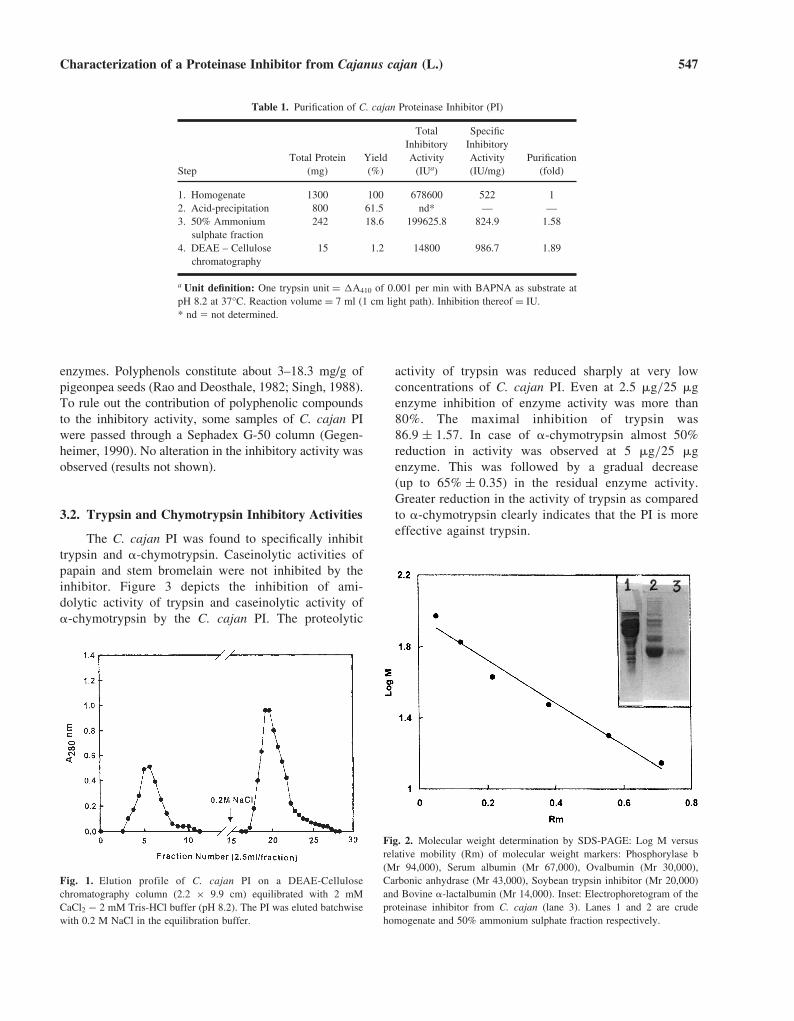
The purification of C. cajan PI yielded 15 mg of PIfrom a 20-g dry weight of pulse. The details are summa-rized in Table 1. The elution profile of the PI fromDEAE cellulose column is represented in Figure 1. SDS-polyacrylamide gel electrophoresis of the eluted C. cajanPI yielded a single band corresponding to a molecularweight of 14,000 (Fig. 2).
No appreciable amounts of tannins have been re-ported in pigeonpea but they do contain considerableamounts of polyphenolic compounds that inhibit digestive
546 Haq and Khan
475748.qxd 10/31/03 5:32 PM Page 546
enzymes. Polyphenols constitute about 3–18.3 mg/g ofpigeonpea seeds (Rao and Deosthale, 1982; Singh, 1988).To rule out the contribution of polyphenolic compoundsto the inhibitory activity, some samples of C. cajan PIwere passed through a Sephadex G-50 column (Gegen-heimer, 1990). No alteration in the inhibitory activity wasobserved (results not shown).
3.2. Trypsin and Chymotrypsin Inhibitory Activities
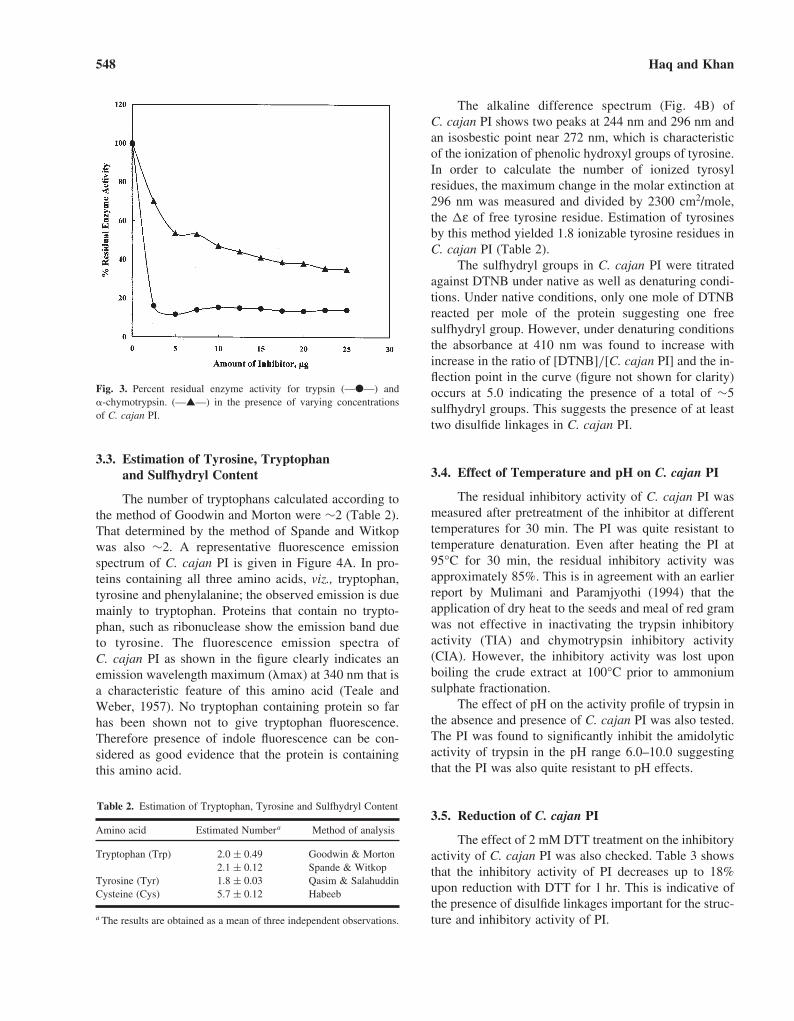
The C. cajan PI was found to specifically inhibittrypsin and �-chymotrypsin. Caseinolytic activities ofpapain and stem bromelain were not inhibited by theinhibitor. Figure 3 depicts the inhibition of ami-dolytic activity of trypsin and caseinolytic activity of�-chymotrypsin by the C. cajan PI. The proteolytic
activity of trypsin was reduced sharply at very lowconcentrations of C. cajan PI. Even at 2.5 �g/25 �genzyme inhibition of enzyme activity was more than80%. The maximal inhibition of trypsin was86.9 ± 1.57. In case of �-chymotrypsin almost 50%reduction in activity was observed at 5 �g/25 �genzyme. This was followed by a gradual decrease(up to 65% ± 0.35) in the residual enzyme activity.Greater reduction in the activity of trypsin as comparedto �-chymotrypsin clearly indicates that the PI is moreeffective against trypsin.
Characterization of a Proteinase Inhibitor from Cajanus cajan (L.) 547
Table 1. Purification of C. cajan Proteinase Inhibitor (PI)
Total SpecificInhibitory Inhibitory
Total Protein Yield Activity Activity PurificationStep (mg) (%) (IUa) (IU/mg) (fold)
1. Homogenate 1300 100 678600 522 12. Acid-precipitation 800 61.5 nd* — —3. 50% Ammonium 242 18.6 199625.8 824.9 1.58
sulphate fraction4. DEAE – Cellulose 15 1.2 14800 986.7 1.89
chromatography
a Unit definition: One trypsin unit = �A410 of 0.001 per min with BAPNA as substrate atpH 8.2 at 37°C. Reaction volume = 7 ml (1 cm light path). Inhibition thereof = IU.* nd � not determined.
Fig. 1. Elution profile of C. cajan PI on a DEAE-Cellulosechromatography column (2.2 × 9.9 cm) equilibrated with 2 mMCaCl2 − 2 mM Tris-HCl buffer (pH 8.2). The PI was eluted batchwisewith 0.2 M NaCl in the equilibration buffer.
Fig. 2. Molecular weight determination by SDS-PAGE: Log M versusrelative mobility (Rm) of molecular weight markers: Phosphorylase b(Mr 94,000), Serum albumin (Mr 67,000), Ovalbumin (Mr 30,000),Carbonic anhydrase (Mr 43,000), Soybean trypsin inhibitor (Mr 20,000)and Bovine �-lactalbumin (Mr 14,000). Inset: Electrophoretogram of theproteinase inhibitor from C. cajan (lane 3). Lanes 1 and 2 are crudehomogenate and 50% ammonium sulphate fraction respectively.
475748.qxd 10/31/03 5:32 PM Page 547
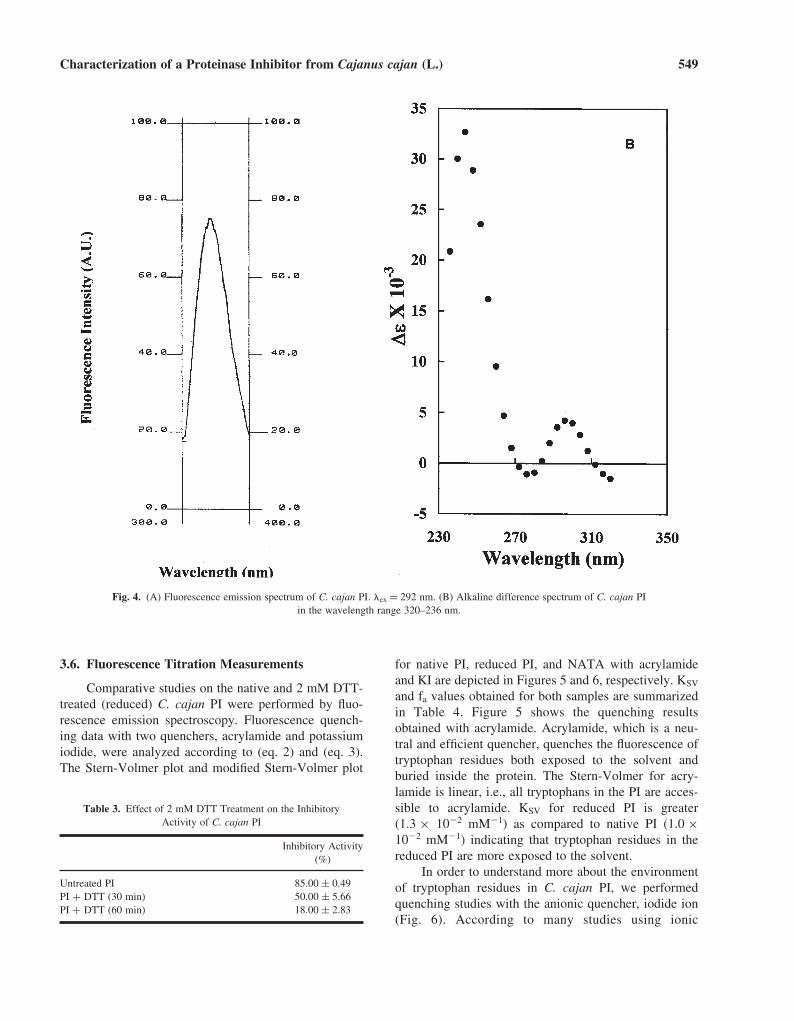
The alkaline difference spectrum (Fig. 4B) ofC. cajan PI shows two peaks at 244 nm and 296 nm andan isosbestic point near 272 nm, which is characteristicof the ionization of phenolic hydroxyl groups of tyrosine.In order to calculate the number of ionized tyrosylresidues, the maximum change in the molar extinction at296 nm was measured and divided by 2300 cm2/mole,the �ε of free tyrosine residue. Estimation of tyrosinesby this method yielded 1.8 ionizable tyrosine residues inC. cajan PI (Table 2).
The sulfhydryl groups in C. cajan PI were titratedagainst DTNB under native as well as denaturing condi-tions. Under native conditions, only one mole of DTNBreacted per mole of the protein suggesting one freesulfhydryl group. However, under denaturing conditionsthe absorbance at 410 nm was found to increase withincrease in the ratio of [DTNB]/[C. cajan PI] and the in-flection point in the curve (figure not shown for clarity)occurs at 5.0 indicating the presence of a total of ∼5sulfhydryl groups. This suggests the presence of at leasttwo disulfide linkages in C. cajan PI.
3.4. Effect of Temperature and pH on C. cajan PI
The residual inhibitory activity of C. cajan PI wasmeasured after pretreatment of the inhibitor at differenttemperatures for 30 min. The PI was quite resistant totemperature denaturation. Even after heating the PI at95°C for 30 min, the residual inhibitory activity wasapproximately 85%. This is in agreement with an earlierreport by Mulimani and Paramjyothi (1994) that theapplication of dry heat to the seeds and meal of red gramwas not effective in inactivating the trypsin inhibitoryactivity (TIA) and chymotrypsin inhibitory activity(CIA). However, the inhibitory activity was lost uponboiling the crude extract at 100°C prior to ammoniumsulphate fractionation.
The effect of pH on the activity profile of trypsin inthe absence and presence of C. cajan PI was also tested.The PI was found to significantly inhibit the amidolyticactivity of trypsin in the pH range 6.0–10.0 suggestingthat the PI was also quite resistant to pH effects.
3.5. Reduction of C. cajan PI
The effect of 2 mM DTT treatment on the inhibitoryactivity of C. cajan PI was also checked. Table 3 showsthat the inhibitory activity of PI decreases up to 18%upon reduction with DTT for 1 hr. This is indicative ofthe presence of disulfide linkages important for the struc-ture and inhibitory activity of PI.
548 Haq and Khan
Fig. 3. Percent residual enzyme activity for trypsin (—●—) and�-chymotrypsin. (—▲—) in the presence of varying concentrationsof C. cajan PI.
Table 2. Estimation of Tryptophan, Tyrosine and Sulfhydryl Content
Amino acid Estimated Numbera Method of analysis
Tryptophan (Trp) 2.0 ± 0.49 Goodwin & Morton2.1 ± 0.12 Spande & Witkop
Tyrosine (Tyr) 1.8 ± 0.03 Qasim & SalahuddinCysteine (Cys) 5.7 ± 0.12 Habeeb
a The results are obtained as a mean of three independent observations.
3.3. Estimation of Tyrosine, Tryptophanand Sulfhydryl Content
The number of tryptophans calculated according tothe method of Goodwin and Morton were ∼2 (Table 2).That determined by the method of Spande and Witkopwas also ∼2. A representative fluorescence emissionspectrum of C. cajan PI is given in Figure 4A. In pro-teins containing all three amino acids, viz., tryptophan,tyrosine and phenylalanine; the observed emission is duemainly to tryptophan. Proteins that contain no trypto-phan, such as ribonuclease show the emission band dueto tyrosine. The fluorescence emission spectra ofC. cajan PI as shown in the figure clearly indicates anemission wavelength maximum (�max) at 340 nm that isa characteristic feature of this amino acid (Teale andWeber, 1957). No tryptophan containing protein so farhas been shown not to give tryptophan fluorescence.Therefore presence of indole fluorescence can be con-sidered as good evidence that the protein is containingthis amino acid.
475748.qxd 10/31/03 5:32 PM Page 548
3.6. Fluorescence Titration Measurements
Comparative studies on the native and 2 mM DTT-treated (reduced) C. cajan PI were performed by fluo-rescence emission spectroscopy. Fluorescence quench-ing data with two quenchers, acrylamide and potassiumiodide, were analyzed according to (eq. 2) and (eq. 3).The Stern-Volmer plot and modified Stern-Volmer plot
for native PI, reduced PI, and NATA with acrylamideand KI are depicted in Figures 5 and 6, respectively. KSV
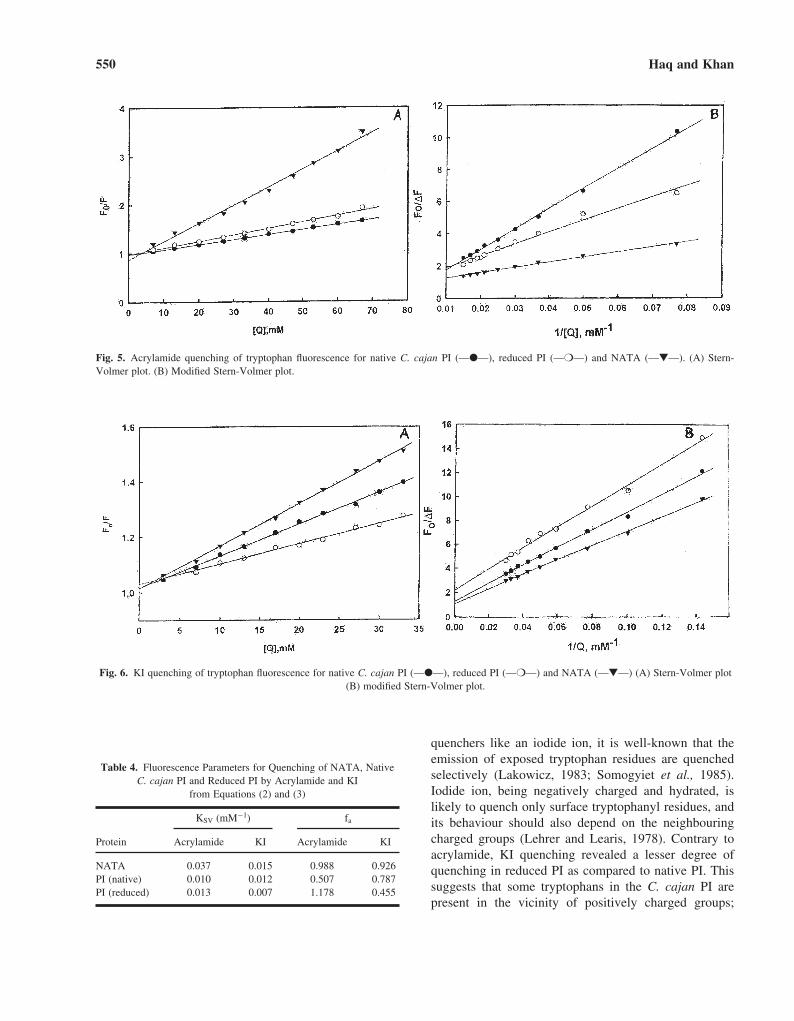
and fa values obtained for both samples are summarizedin Table 4. Figure 5 shows the quenching resultsobtained with acrylamide. Acrylamide, which is a neu-tral and efficient quencher, quenches the fluorescence oftryptophan residues both exposed to the solvent andburied inside the protein. The Stern-Volmer for acry-lamide is linear, i.e., all tryptophans in the PI are acces-sible to acrylamide. KSV for reduced PI is greater(1.3 × 10�2 mM�1) as compared to native PI (1.0 ×10�2 mM�1) indicating that tryptophan residues in thereduced PI are more exposed to the solvent.
In order to understand more about the environmentof tryptophan residues in C. cajan PI, we performedquenching studies with the anionic quencher, iodide ion(Fig. 6). According to many studies using ionic
Characterization of a Proteinase Inhibitor from Cajanus cajan (L.) 549
Fig. 4. (A) Fluorescence emission spectrum of C. cajan PI. �ex = 292 nm. (B) Alkaline difference spectrum of C. cajan PI in the wavelength range 320–236 nm.
Table 3. Effect of 2 mM DTT Treatment on the InhibitoryActivity of C. cajan PI
Inhibitory Activity(%)
Untreated PI 85.00 ± 0.49PI + DTT (30 min) 50.00 ± 5.66PI + DTT (60 min) 18.00 ± 2.83
475748.qxd 10/31/03 5:32 PM Page 549
550 Haq and Khan
Fig. 5. Acrylamide quenching of tryptophan fluorescence for native C. cajan PI (—●—), reduced PI (—❍—) and NATA (—▼—). (A) Stern-Volmer plot. (B) Modified Stern-Volmer plot.
Fig. 6. KI quenching of tryptophan fluorescence for native C. cajan PI (—●—), reduced PI (—❍—) and NATA (—▼—) (A) Stern-Volmer plot(B) modified Stern-Volmer plot.
quenchers like an iodide ion, it is well-known that theemission of exposed tryptophan residues are quenchedselectively (Lakowicz, 1983; Somogyiet et al., 1985).Iodide ion, being negatively charged and hydrated, islikely to quench only surface tryptophanyl residues, andits behaviour should also depend on the neighbouringcharged groups (Lehrer and Learis, 1978). Contrary toacrylamide, KI quenching revealed a lesser degree ofquenching in reduced PI as compared to native PI. Thissuggests that some tryptophans in the C. cajan PI arepresent in the vicinity of positively charged groups;
Table 4. Fluorescence Parameters for Quenching of NATA, NativeC. cajan PI and Reduced PI by Acrylamide and KI
from Equations (2) and (3)
KSV (mM−1) fa
Protein Acrylamide KI Acrylamide KI
NATA 0.037 0.015 0.988 0.926PI (native) 0.010 0.012 0.507 0.787PI (reduced) 0.013 0.007 1.178 0.455
475748.qxd 10/31/03 5:32 PM Page 550
hence inaccessible to KI quenching. The percentage ofthe total fluorescence quenched by the ionic quenchercalculated from the modified Stern-Volmer plot usingEq. 3 was found to be ∼50%. This suggests that approx-imately half of the total number of tryptophans present inPI are exposed to solvent. NATA was used as a referencefor free tryptophan and its quenching behaviour was sim-ilar in both cases. To rule out the effect of ionic strengthwe measured the fluorescence spectra for PI with varying
[NaCl] in the range of 3.3–33 mM (same as that of KI).No significant change was observed on the intensity ofthe steady-state fluorescence spectra.
3.7. CD Spectroscopy
The near-UV CD spectrum shown in Figure 7 forC. cajan PI at pH 7.0 exhibits a minima at 279 nm whichcould be due to tyrosine residues as previously reported
Characterization of a Proteinase Inhibitor from Cajanus cajan (L.) 551
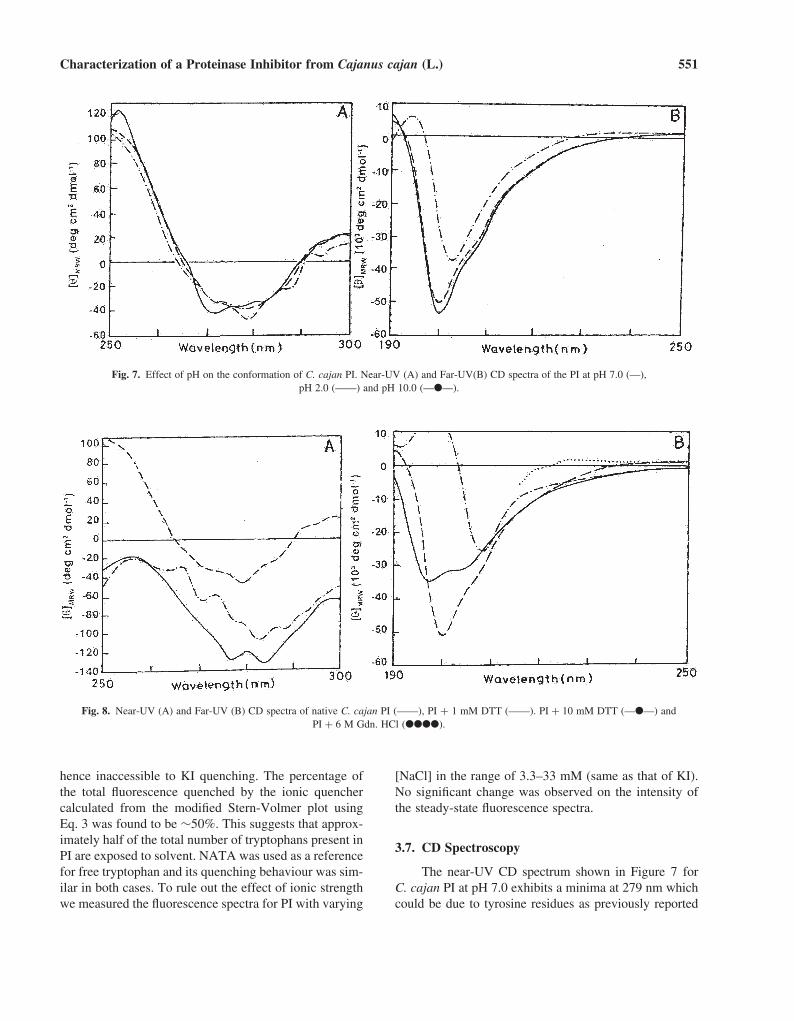
Fig. 7. Effect of pH on the conformation of C. cajan PI. Near-UV (A) and Far-UV(B) CD spectra of the PI at pH 7.0 (––),pH 2.0 (——) and pH 10.0 (—●—).
Fig. 8. Near-UV (A) and Far-UV (B) CD spectra of native C. cajan PI (——), PI + 1 mM DTT (——). PI + 10 mM DTT (—●—) and PI + 6 M Gdn. HCl (●●●●).
475748.qxd 10/31/03 5:32 PM Page 551
for horsegram proteinase inhibitor by P. R. Ramasarmaet al. (1994). A maximum at 250 nm is also observedwhich is attributed to disulfide linkages in the molecule(Venyaminov and Yang, 1996). In the far-UV CD spec-trum (Fig. 7) of C. cajan PI at pH 7.0, a strong negativeband centered at 200 nm and a positive band at 190 nm areobserved. This is indicative of unordered structure withdisulfide bonds as reported previously for Horse gram PI(Ramasarma et al., 1994). The class of unordered proteinsincludes many oligopeptides, short polypeptides withdisulfide bonds or prosthetic groups, and denatured pro-teins. These oligopeptides and polypeptides usually showa CD spectrum with a strong negative band near 200 nm,and some weak bands between 220 and 230 nm, whichcan have either positive or negative signs (Connelli et al.,1985). Most of these inhibitory polypeptides show ran-dom coil secondary structure (Woody and Dunker, 1996).
A probe into the structural features of C. cajan PI atthree different pH values, viz, 7.0, 2.0, and 10.0 yielded alargely stable conformation (Fig. 7). Near-UV CD spectrashow minor conformational alterations at the pH valuesexamined. In the far-UV CD spectrum observed at pH2.0, C. cajan PI retains the observed CD bands at 200 nmand 190 nm; the depth of the negative band at 200 nm
being slightly larger than that for pH 7.0. However, thespectrum is altered at alkaline pH. The positive band at190 nm is lost and the 200 nm band is red-shifted. Thissuggests that the C. cajan PI is a relatively stable proteinas its conformation is only slightly affected at low pH.
Figure 8 depicts the effect of DTT on the C. cajanPI. In the presence of 1 mM and 10 mM DTT, the PIclearly shows a loss in the 257 nm positive band whichhas been correlated to loss of disulfide linkages(Ramasarma et al., 1994). The trough at 279 nm is abol-ished, and new minima appeared at 278 nm and 284 nmin the presence of 1 mM DTT indicating gross confor-mational alterations in the overall tertiary structure.Far-UV CD spectra also show pronounced conforma-tional changes in the reduced PI samples. The positive
552 Haq and Khan
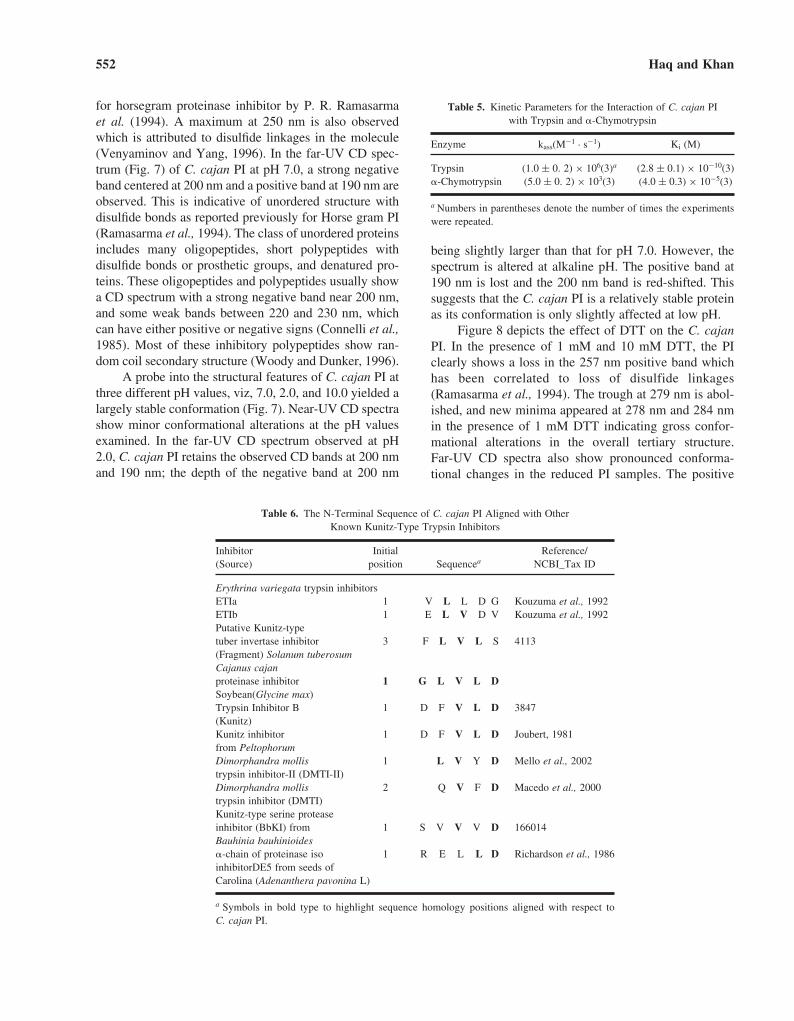
Table 5. Kinetic Parameters for the Interaction of C. cajan PIwith Trypsin and �-Chymotrypsin
Enzyme kass(M−1 · s−1) Ki (M)
Trypsin (1.0 ± 0. 2) × 106(3)a (2.8 ± 0.1) × 10−10(3)�-Chymotrypsin (5.0 ± 0. 2) × 103(3) (4.0 ± 0.3) × 10−5(3)
a Numbers in parentheses denote the number of times the experimentswere repeated.
Table 6. The N-Terminal Sequence of C. cajan PI Aligned with OtherKnown Kunitz-Type Trypsin Inhibitors
Inhibitor Initial Reference/(Source) position Sequencea NCBI_Tax ID
Erythrina variegata trypsin inhibitorsETIa 1 V L L D G Kouzuma et al., 1992ETIb 1 E L V D V Kouzuma et al., 1992Putative Kunitz-typetuber invertase inhibitor 3 F L V L S 4113(Fragment) Solanum tuberosumCajanus cajanproteinase inhibitor 1 G L V L DSoybean(Glycine max)Trypsin Inhibitor B 1 D F V L D 3847(Kunitz)Kunitz inhibitor 1 D F V L D Joubert, 1981from PeltophorumDimorphandra mollis 1 L V Y D Mello et al., 2002trypsin inhibitor-II (DMTI-II)Dimorphandra mollis 2 Q V F D Macedo et al., 2000trypsin inhibitor (DMTI)Kunitz-type serine protease inhibitor (BbKI) from 1 S V V V D 166014Bauhinia bauhinioides�-chain of proteinase iso 1 R E L L D Richardson et al., 1986inhibitorDE5 from seeds ofCarolina (Adenanthera pavonina L)
a Symbols in bold type to highlight sequence homology positions aligned with respect toC. cajan PI.
475748.qxd 10/31/03 5:32 PM Page 552
band at 190 nm attributed to disulfides is lost in thepresence of 1 mM DTT. The strong negative band near200 nm observed in native PI is greatly altered in thereduced preparations and disappears completely in thepresence of 6 M Gdn. HCl.
The above discussed conformational alterations inthe C. cajan PI as studied by CD spectroscopy undoubt-edly suggest the role of disulfide linkages in the structureand function (as observed by decrease in inhibitoryactivity upon reduction) of the proteinase inhibitor.
3.8. Kinetics of Binding to Serine Proteinases
The kinetics of association of C. cajan PI to trypsinand �-chymotrypsin were analyzed by measurements ofthe loss of enzyme activity in the presence of specificchromogenic substrates. All analyses showed a linear de-pendence of Kobs, on inhibitor concentration within theconcentration range covered, the slopes of these plots giv-ing kass (Table 5). The PI binds to trypsin with about 200-fold higher kass than to �-chymotrypsin. The dissociationequilibrium constant, Kd, for the binding of C. cajan PI totrypsin and �-chymotrypsin was determined as Ki bymeasurements of the decrease caused by the inhibitor ofthe equilibrium rate of cleavage of a chromogenic sub-strate by the respective proteinase (Table 5). As can beseen from the table, the affinity of C. cajan PI for trypsinis much higher to that for �-chymotrypsin. The main rea-son for the high affinity for trypsin is rapid association(kass ∼106 M−1 s−1), whereas the rate of binding to�-chymotrypsin is much slower.
3.9. N-Terminal Sequencing
The N-terminal sequence of C. cajan PI is given inTable 4. A comparison with other known inhibitors tocheck sequence homology revealed that it resemblesKunitz inhibitors especially Soybean trypsin inhibitor(Kunitz).
ACKNOWLEDGMENTS
Facilities provided by Aligarh Muslim Universityand financial assistance in the form of research fellow-ship to S. K. Haq by Council of Scientific and IndustrialResearch, New Delhi are gratefully acknowledged. TheN-terminal sequence was done by the National Facilityfor Photolabeling and Peptide Sequencing in Biomolec-ular Systems at IIT Bombay, Mumbai, India.
REFERENCES
Chou, I. N., Black, P. H., Roblin, R. O. (1974). Proc. Natl. Acad. Sci.USA 71: 1748–1752.
Clem Gruen, L., Tao, Z-J., Kortt, A. A. (1984). Biochim. Biophys. Acta791: 285–293.
Connelli, M., Cioni, P., Romagnoli, A., Gabellieri, E., Balestreri, E.,Felicioli, R. (1985). Arch. Biochem. Biophys. 238: 206–212.
Gegenheimer, P. (1990). Meth. Enzymol. 182: 174–193. Giri, A. P., Kachole, M. S. (1998). Phytochemistry 47: 197–202. Goodwin, W., Morton, R. A. (1946). Biochem. J. 40: 628–632. Habeeb, A. F. S. A. (1972). Meth. Enzymol. 25: 457–464. Jirgensons, B., Kawabata, M., Capetillo, S. (1969). Makromol. Chem.
125: 126–135.Joubert, F. J. (1981). Hoppe-Seyler’s Z. Physiol. Chem. 362:
1515–1521. Kouzuma, Y., Suetake, M., Kimura, M., Yamasaki, N. (1992). Biosc.
Biotech. Biochem. 56: 1819–1824. Laemmli, U. K. (1970). Nature 227: 680–685. Lakowicz, J. R. (1983). In Principles of Fluorescence Spectroscopy,
Plenum Press, New York. Laskowski, M. Jr., Kato, I. (1980). Ann. Rev. Biochem. 49: 593–626. Lehrer, S. S., Learis, P. C. (1978). In Methods Enzymol (Hirs, C. H. W.,
Timasheff, S. N., eds.), Vol. 49, Academic Press, pp. 222–236. Lowry, O. H., Rosebrough, N. J., Farr, A. L., Randall, J. J. (1951).
J. Biol. Chem. 193: 265–275. Macedo, M. L. R., Matos, D. G. G., Machado, O. L. T., Marangoni, S.,
and Novelloi, J. C. (2000). Phytochemistry 54: 553–558. Mello, G. C., Olivia, M. L. V., Sumikawa, J. T., Machado, O. L. T.,
Marangoni, S., Novello, J. C., and Macedo, M. L. R. (2002).J. Prot. Chem. 20: 625–632.
Mokhtar, N. M., El-Aaser, A. A., El-Bolkainy, M. N., Ibrahim, A. A.,El-Din, N. B., Moharram, N. Z. (1988). Eur. J. Cancer Clin.Oncol. 24: 403–411.
Mulimani, V. H., Paramjyothi, S. (1994). Plant Foods Hum. Nutr. 46:103–107.
Pearce, G., Sy, L., Russel, C., Ryan, C. A., Hass, M. (1982). Arch.Biochem. Biophys. 213: 456–462.
Qasim, M. A., Salahuddin, A. (1977). Biochim. Biophys. Acta 490:515–522.
Ramasarma, P. R., Rao, A. G. A., Rao, D. R. (1994). Biochim. Biophys.Acta 1248: 35–42.
Rao, P. U., Deosthale, Y. G. (1982). J. Sci. Food Agric. 33:1013–1016.
Reed, W., Lateef, S. S. (1990). In The Pigeonpea (Nene, Y. L., Hall,S. P., Sheila V. K., eds.), CAB International, Wallingford, p. 349.
Richardson, M., Campos, F. A. P., Xavier-Filho, J., Macedo, M. L. R.,Maia, G. M. C., Yarwood, A. (1986). Biochim. Biophys. Acta872: 134–140.
Rockett, K. A., Playfair, J. H. L., Ashall, F., Targetl, G. A. T., Anjliker,H., Shaw, E. (1990). FEBS Lett. 295: 257–260.
Ryan, C. A. (1990). Annu. Rev. Phytopathol. 28: 425–449.Ryan, C. A. (1981). In The Biochemistry of Plants (Marcus, A., ed.),
Academic Press, New York, pp. 6351–6370. Salahuddin, A., Khan, R. H. (1997). J. Prot. Chem. 17: 181–185. Salunkhe, D. K., Chavan, J. K., Kadam, S. S. (1986). CRC Crit. Rev.
Food Sci. Nutr. 23: 103–141. Schelp, F. B., Pongpaew, P. (1988). Int. J. Epidemiol. 17: 287–292. Schmid, F. X. (1990). In Protein Structure: A Practical Approach
(Creighton, T. E., ed.), IR L Press, Oxford, pp. 251–285. Schnebli, H. P., Burger, M. M. (1972). Proc. Natl. Acad. Sci. USA 69:
3825–3827. Singh, U. (1988). Plant Foods Hum. Nutr. 38: 251–261. Singh, U., Jain, K. C., Jambunathan, R., Faris, D. G. (1984). J. Food
Sci. 49: 799–802. Somogyi, B., Papp, S., Rosenbery, A., Seres, I., Matko, J., Welch,
G. R., Nagy, P. (1985). Biochemistry 24: 6674–6679. Spande, T. F., Witkop, B. (1972). Meth. Enzymol. 25: 498–506.
Characterization of a Proteinase Inhibitor from Cajanus cajan (L.) 553
475748.qxd 10/31/03 5:32 PM Page 553

Sweet, R. M., Wright, H. T., Janin, J., Chotia, C. H., Blow, D. M.(1974). Biochemistry 13: 4214–4228.
Teale, F. W. J., Weber, G. (1957). Biochem. J. 65: 476. Ussuf, K. K., Laxmi, N. H., Mitra, R. (2001). Current Science 80:
847–853. Venyaminov, S. Y., Yang, J. T. (1996). In Circular Dichroism and the
Conformational Analysis of Biomolecules (Fasman, G. D., ed.),Plenum Press, New York, pp. 69–107.
Vonderfecht, S. L., Miskuff, R. L., Wee, S. B., Sato, S., Tidwell, R. R.,Geratz, J. D., Yolken, R. H. (1988). J. Clin. Invest. 82:2011–2016.
Weed, W. G., McGandy, R. B., Kennedy, A. R. (1985). Carcinogene-sis 6: 1239–1241.
Woody, R. W., Dunker, A. K. (1996). In Circular Dichroism and theConformational Analysis of Biomolecules (Fasman, G. D., ed.),Plenum Press, New York, pp. 109–157.
554 Haq and Khan
475748.qxd 10/31/03 5:32 PM Page 554
Copyright © 2022 FDOKUMEN