Polyaniline–Carboxymethyl Cellulose Nanocomposite for Cholesterol Detection
Upload
independentCategory
view
0download
0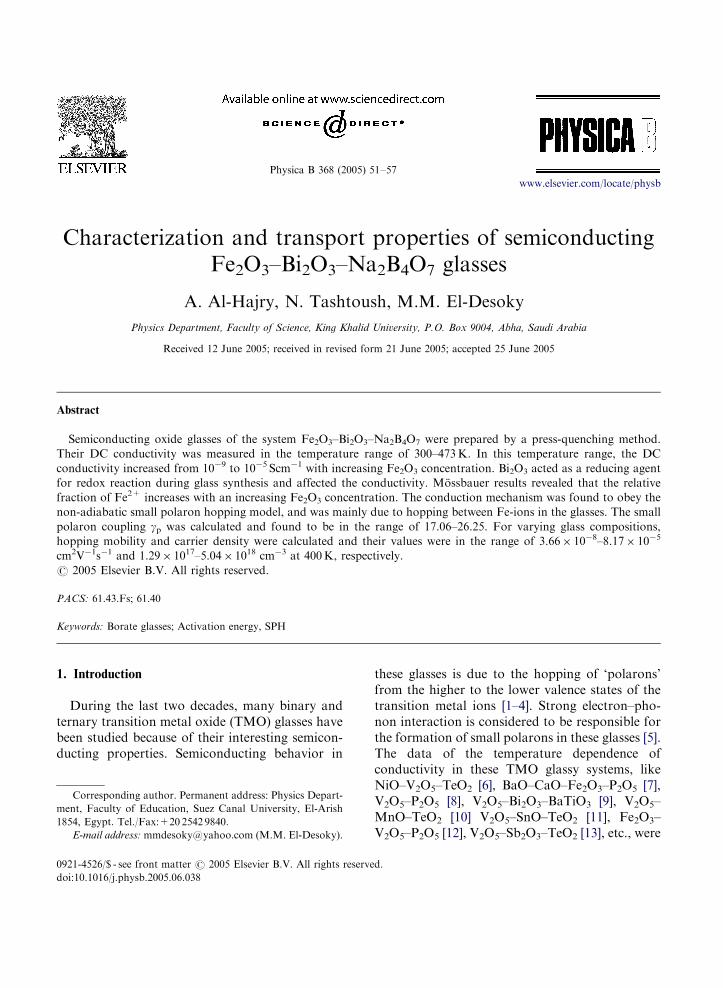
ARTICLE IN PRESS
0921-4526/$ - se
doi:10.1016/j.ph
�Correspondiment, Faculty o
1854, Egypt. Te
E-mail addre
Physica B 368 (2005) 51–57
www.elsevier.com/locate/physb
Characterization and transport properties of semiconductingFe2O3–Bi2O3–Na2B4O7 glasses
A. Al-Hajry, N. Tashtoush, M.M. El-Desoky�
Physics Department, Faculty of Science, King Khalid University, P.O. Box 9004, Abha, Saudi Arabia
Received 12 June 2005; received in revised form 21 June 2005; accepted 25 June 2005
Abstract
Semiconducting oxide glasses of the system Fe2O3–Bi2O3–Na2B4O7 were prepared by a press-quenching method.
Their DC conductivity was measured in the temperature range of 300–473K. In this temperature range, the DC
conductivity increased from 10�9 to 10�5 Scm�1 with increasing Fe2O3 concentration. Bi2O3 acted as a reducing agent
for redox reaction during glass synthesis and affected the conductivity. Mossbauer results revealed that the relative
fraction of Fe2+ increases with an increasing Fe2O3 concentration. The conduction mechanism was found to obey the
non-adiabatic small polaron hopping model, and was mainly due to hopping between Fe-ions in the glasses. The small
polaron coupling gp was calculated and found to be in the range of 17.06–26.25. For varying glass compositions,
hopping mobility and carrier density were calculated and their values were in the range of 3.66� 10�8–8.17� 10�5
cm2V�1s�1 and 1.29� 1017–5.04� 1018 cm�3 at 400K, respectively.
r 2005 Elsevier B.V. All rights reserved.
PACS: 61.43.Fs; 61.40
Keywords: Borate glasses; Activation energy, SPH
1. Introduction
During the last two decades, many binary andternary transition metal oxide (TMO) glasses havebeen studied because of their interesting semicon-ducting properties. Semiconducting behavior in
e front matter r 2005 Elsevier B.V. All rights reserve
ysb.2005.06.038
ng author. Permanent address: Physics Depart-
f Education, Suez Canal University, El-Arish
l./Fax:+20 2542 9840.
ss: [email protected] (M.M. El-Desoky).
these glasses is due to the hopping of ‘polarons’from the higher to the lower valence states of thetransition metal ions [1–4]. Strong electron–pho-non interaction is considered to be responsible forthe formation of small polarons in these glasses [5].The data of the temperature dependence ofconductivity in these TMO glassy systems, likeNiO–V2O5–TeO2 [6], BaO–CaO–Fe2O3–P2O5 [7],V2O5–P2O5 [8], V2O5–Bi2O3–BaTiO3 [9], V2O5–MnO–TeO2 [10] V2O5–SnO–TeO2 [11], Fe2O3–V2O5–P2O5 [12], V2O5–Sb2O3–TeO2 [13], etc., were
d.

ARTICLE IN PRESS
A. Al-Hajry et al. / Physica B 368 (2005) 51–5752
explained by using the ‘small polaron’ hopping(SPH) model based on the strong electron–latticeinteraction in the high temperature regime (abovethe Debye temperature) [14,15].
It was reported that it is possible to form a glassusing Fe2O3 ions with a concentration rangingbetween 15 and 20mol% [16]. Therefore, it soundsrelatively difficult to prepare a glass using highconcentration of Fe2O3 ions. In our endeavor toobtain Fe-ion-containing-glasses of high conduc-tivity, we were interested in the Fe2O3–Bi2O3–Na2-B4O7 system. This is because its glass formationregion and its maximum range of Fe2O3 concen-tration were expected to expand further, consider-ing that B2O3 is a good glass network former andBi2O3-containing-glasses could be formed withoutother conventional network formers by rapidquenching [2,3,17].
In this study, Fe2O3–Bi2O3–Na2B4O7 glasseswere prepared by the press quenching technique,and the DC conductivity was measured toelucidate the conduction mechanism.
2. Experimental
Glass samples were prepared from the reagentgrade chemicals Fe2O3 (99.9), Bi2O3 (99.9) andNa2B4O7 (99%). The chemicals in appropriateproperties (Table 1) were mixed uniformly. Themixture was melted in the temperature range of1150–12201C depending on the compositions for1 h. The melt was press-quenched between twocopper blocks. Glass samples of about 1mm thickand with an area of 4 cm2 were prepared. X-raydiffraction (XRD) of the samples wrerecordedusing a XRD – 6000 Shimadzo. The thermal
Table 1
Chemical composition and physical properties of Fe2O3–Bi2O3–Na2B
Glass no. Composition (mol%) W
Fe2O3 Bi2O3 Na2B4O7 (eV
1 5 20 75 0.89
2 10 15 75 0.83
3 15 10 75 0.78
5 20 5 75 0.62
behavior was investigated using a Shimadzu DSC-50 differential scanning calorimeter (DSC). Thedensities of the samples were estimated usingArchimedes principle with acetone as an immer-sion liquid. The concentration of iron ion,N(cm�3), was calculated using the formula:N ¼ dpNA=ðAw � 100Þ, where d is the density ofthe sample, p the weight percentage of atoms, NA
the Avogadro’s constant and Aw the atomicweight. The Fe2+/(Fe2+ +Fe3+) ratio (C) wasdetermined by Mossbauer spectral analysis atroom temperature in a transition geometry em-ploying 57Co in a rhodium matrix as the radio-active source. The results obtained were analyzedusing a computer program based on the Lorentz-ing distribution. Electrical measurements werecarried out using a Keithly electrometer (Model485). Silver paste electrodes were deposited onboth faces of the polished samples. The absence ofbarrier layers at the contacts was confirmed bylinear I–V characteristics. The DC conductivity ofthe as–quenched glasses was measured at tempera-tures between 300 and 473K.
3. Results and discussion
3.1. Characterization
From the XRD studies it is observed thathomogenous glasses were formed for Fe2O3
concentration between 5 and 20mol%. TheXRD patterns of present glasses, which is shownin Fig. 1, indicate a glassy behavior with a broadhump at about 2y ¼ 301. No peak correspondingto Fe2O3 is observed, which indicates that Fe2O3
has completely entered the glass matrix.
4O7 glasses
d R Tg ln s(400K)
) (gcm�3) (nm) (K) (Sm�1)
3.757 0.394 677.2 �7.53
3.706 0.388 678.6 �6.94
3.638 0.382 680.5 �6.44
3.587 0.375 682.7 �5.77

ARTICLE IN PRESS
0 10 20 30 40 50 60 70 80 902θ°
5 mol% Fe2 O3
10 mol% Fe2 O3
15 mol% Fe2 O3
20 mol% Fe2 O3
Fig. 1. XRD for different glass compositions.
2.0 2.2 2.4 2.6 2.8 3.0 3.2 3.41000/T(K-1)
-9.0
-8.5
-8.0
-7.5
-7.0
-6.5
-6.0
-5.5
-5.0
-4.5
log
σ (S
cm-1
)
5 mol% Fe2 O310 ``15 ``20 ``
Fig. 2. Temperature dependence of DC conductivity, s, for
different glass compositions. The solid lines are calculated by
using the least-squares technique.
4 6 8 10 12 14 16 18 20 22Fe2O3 (mol%)
0.60
0.63
0.66
0.69
0.72
0.75
0.78
0.81
0.84
0.87
0.90
W(e
V)
-6.8
-6.6
-6.4
-6.2
-6.0
-5.8
-5.6
-5.4
-5.2
log
σ (
Scm
-1)
Wσ
Fig. 3. Effect of Fe2O3 concentration on DC conductivity, s, atT ¼ 443K and activation energy W, for different glass
compositions .
A. Al-Hajry et al. / Physica B 368 (2005) 51–57 53
The glass transition temperature (Tg) of thepresent glasses was determined by DSC with aheating rate of 10 1Cmin�1 (Table 1). A relativelysmall change of Tg (677.2–682.7K) was observeddue to an increase in Fe2O3 concentration in theBi2O3 sites [16,18]. This indicates that when Fe2O3
is substituted for Bi2O3, the Fe–O–Bi and Bi–O–Bibonds are broken and new bonds such as theFe–O–Fe bonds are probably formed. This leadsto an increase of Fe2O3 concentration in theglasses, which causes an increase in their electricalconductivity and thermal stability [18].
Table 1 shows that the glass density (d)decreases with the increase of Fe2O3 concentrationin the glass. This indicates that the glass structurebecomes less tightly packed with increasing Fe2O3
concentration. These trends can be explainedrather simply as the replacement of heavier cation( Bi) by lighter one (Fe) [18,19].
3.2. Electrical conductivity
Fig. 2 shows the variation of the logarithm ofDC conductivity of Fe2O3–Bi2O3–Na2B4O7 glasses
as a function of inverse temperature (T). As shownin Fig. 3, the conductivity of the glasses increases,while the activation energy decreases with increas-ing Fe2O3 concentration in the glass. This isconsistent with the behavior of many other TMOglasses [3–8], where electrical conduction arises

ARTICLE IN PRESS
A. Al-Hajry et al. / Physica B 368 (2005) 51–5754
from the hopping of electrons or polarons betweenmixed valence states [17,19]. At high temperatures(T4yD=2, where yD is the Debye temperature),the conductivity data of the present glasses can beinterpreted in terms of the phonon-assisted hop-ping model given by Mott and Davis [20], namely
s ¼ ðso=TÞ exp ð�W=kT Þ, (1)
where so ¼ no Ne2R2 C(1�C) exp (�2 a R)/kT, nois the longitudinal optical phonon frequency, R isthe average distance between the transition metalion (TMI)), a is the inverse localization length ofthe s-like wave function assumed to describe thelocalized state at each site, C ( ¼ Fe2+/SFe) is thefraction sites occupied by an electron (or polaron)and therefore is the TMI concentration in the lowvalence state to the total TM ion concentration,and W is the activation energy of the hoppingconduction. There is no exact formula to deter-mine C for TMO glasses with transition metal ion.Therefore, used the value of C as shown inTable 1, which was estimated from the Mossbauerspectral. Those values have the same order ofmagnitude as compared with Fe2O3 doped Bi2O3–B2O3 glasses [18]. The experimental data ofconductivity, above a typical temperature yD/2(where non–linear behavior is observed as shownin Fig. 2), are fitted with Eq. (1) by the least-squared method. The best fit parameters areshown in Tables 1 and 2. The small polaronhopping model predicts an appreciable departurefrom the linear curve of log s against 1/T attemperature yD/2.
Assuming a strong electron-phonon interaction,Austin and Mott showed that [21]
W ¼ WH þ WD=2 forT4yD=2;
¼ WD forToyD=4;(2)
Table 2
Polaron hopping parameters of Fe2O3–Bi2O3–Na2B4O7 glasses
Glass no. yD (K) no (� 1013 s�1) WH (eV) rP
1 752 1.566 0.86 0.
2 766 1.595 0.81 0.
3 786 1.637 0.75 0.
4 816 1.699 0.60 0.
where WH is the polaron hopping energy, and WD
is the disorder energy arising from the energydifference of the neighbors between two hoppingsites.The increase in DC conductivity with increasing
Fe2O3 concentration, as indicated in Fig. 2,is attributed to the decrease in the average distanceR between Fe2+ and Fe3+ ions. It has been pre-viously reported [3,4,18] that in Fe2O3-dopedBi2O3–B2O3 the DC conductivity is electronicand strongly depends on the average distance R.The average distance R is calculated from
R ¼ ð1=NÞ1=3, (3)
where N is the concentration of iron ions per unitvolume, which can be calculated from batchcomposition and the measured density. Thecalculated average distance R is shown inTable 1. It is obvious that increasing Fe2O3
concentration cause a decrease in the distancebetween the iron ions. Assuming that the con-ductivity is due to electron hopping from Fe2+ toFe3+, then decreasing R from 0.394 to 0.375 nm, itis reasonable to expect an increase in DCconductivity. At the same time, the activationenergy appears to increase with increasing distancebetween the iron ions. This result suggests that theDC conductivity is controlled by electron hopping,and depends on the distance R [2,3,6,7].The values of the activation energy and the
average distance R are illustrated in Table 1. In therange of measurements, W depends on the site-to-site distance R. This result shows that there is aprominent positive correlation between W and R
of transition metal ions. This agrees with theresults suggested by Sayer and Mansingh [22],Killias [23], Austin and Garbert [24], delineated
(nm) ep N(EF) (� 1021 eV�1 cm�3) gp
159 22.49 4.538 26.25
156 24.18 5.046 24.52
154 26.58 5.710 22.13
151 33.86 7.545 17.06

ARTICLE IN PRESS
A. Al-Hajry et al. / Physica B 368 (2005) 51–57 55
the dependence of W on the Fe–O–Fe sitedistance.
Fig. 4 shows the electrical conductivity, s, andthe fraction of reduced transition metal ion C, as afunction of Fe2O3 concentration in the presentglasses. Fig. 4 shows that the electrical conductiv-ity, s, for the present glasses, is within an order ofmagnitude of that of iron borate glasses [2,3,18].Since the electrical conduction in iron borateglasses is assumed to be due to electron hoppingfrom Fe2+ to Fe3+ sites [18]. Also, it is clear thatC increases with increasing Fe2O3 concentration; asimilar behavior is shown for the electricalconductivity results. This indicates that the me-chanism of electrical conductivity of present glasssamples were understood by SPH between ironions under different valance states [6,7].
The optical phonon frequency no, in Eq. (1), wasestimated using the experimental data from Table1, and according to the formula kyD ¼ hno (whereh is Plank’s constant) [3,23]. To determine no forall different compositions, the Debye temperatureyD was estimated by T4yD=2 (Eq. (2)). yD of thepresent glasses was obtained to be in the range of752–816K, which are nearly the same values asthat of V2O5–P2O5 [25] and alkaline silicate glasses[26]. Thus, these estimated yD values are physicallyreasonable. The calculated values of yD and no aresummarized in Tables 1 and 2.
4 6 8 10 12 14 16 18 20 22Fe2O3 (mol%)
-8.7
-8.2
-7.7
-7.2
-6.7
-6.2
-5.7
log
σ (
Scm
-1)
0.01
0.02
0.03
0.04
0.05
0.06
C
Cσ
Fig. 4. The DC conductivity, s, at 343K and TM ion ratio, C,
for different glass compositions.
Moreover, W is expressed in terms of the densityof states at Fermi level N(EF) as follows [20]:
NðEFÞ ¼ 3=4pR3W (4)
we obtained N(EF) ¼ 4.538� 1021–7.545�1021 eV�1 cm�3, as shown in Table 2 with theestimated W and R values (Table 1). The values ofN(EF) are reasonable for a localized states.The nature of polaron hopping mechanism
(adiabatic or non-adiabatic), of all these glasses,can be estimated from a plot of logarithm of theconductivity against activation energy at fixedexperimental temperature T [5,15]. It is expectedthat the hopping will be in the adiabatic regime ifthe temperature estimated Te, from the slope ofsuch a plot, is close to the experimental tempera-ture T. Otherwise the hopping will be in the non-adiabatic regime. In this way, hopping at highertemperatures is inferred to be in the adiabaticregime for the vanadate glasses with conventionalglass formers [6]. From the plot of log s against W
for the present glasses (Fig. 5), the estimatedtemperatures (shown within parenthesis) obtainedfrom the slopes, are quite different from theexperimental temperature (shown outside theparenthesis). Fig. 6 presents the effect of Fe2O3
concentration on the pre-exponential factorsobtained from the least squares straight line fits
0.60 0.65 0.70 0.75 0.80 0.85 0.90 0.95W (eV)
-9.0
-8.6
-8.2
-7.8
-7.4
-7.0
-6.6
-6.2
-5.8
-5.4
-5.0
-4.6
log
σ (S
cm-1
)
T= 443K (1190K)
θ
slope = -1/2.302kT
Fig. 5. Effect of activation energy W, on DC conductivity, s, atT ¼ 443K for different glass compositions.

ARTICLE IN PRESS
4 6 8 10 12 14 16 18 20 22Fe2O3 (mol%)
1.6
1.8
2.0
2.2
2.4
2.6
2.8
3.0
3.2
3.4
3.6
log
σo (
Scm
-1)
Fig. 6. Effect of Fe2O3 concentration on pre-exponential
factor, so , for different glass compositions.
A. Al-Hajry et al. / Physica B 368 (2005) 51–5756
of the data so. The figure indicates a decrease in sowith Fe2O3 concentration from 5 to 20mol%.From the above results, we conclude that theconduction mechanism in the present glasses is dueto non-adiabatic hopping of the polarons [5,15].This non-adiabatic conduction mechanism isfurther confirmed from the calculation of thepolaron bandwidth (J) from the following relation[27]:
and
J42kTWH
p
� �1=4hvo
p
� �1=2
ðadiabaticÞ
Jo2kTWH
p
� �1=4hvo
p
� �1=2
ðnon-adiabaticÞ;
(5)
where J is the polaron bandwidth related to theelectron wave function overlap on the adjacentsites. The 4 and o are for adiabatic and non-adiabatic hopping, respectively. The values of(2kTWH/p)
1/4 (huo/p)//2 varies from 0.0507 to
.0533 eV at 400K for all glassy compositions.The values of J, independently estimated from therelation; J ¼ e3½NðEFÞ�3p�
1=2, are found to be in therange of 0.022–0.035 eV depending on the con-centration (Fe2O3 ¼ 5–20mol%). These values ofJ are much smaller than those estimated from the
right-hand side of Eq. (5) confirming non-adia-batic hopping conduction for these glasses.Next, using the average distance values R, given
in (Table 1), polaron radius rp can be calculatedusing the formula [28]
rp ¼p6
� �1=3 R
2, (6)
where rp was found to be between 0.151 and0.159 nm (Table 2) for values of R ranging between0.375 and 0.394 nm (Table 1). The polaronhopping energy given by WH ¼ Wp/2 is expressedby Sayer et al. [29]
WH ¼ Wp=2 ¼e2
4�p
� �1
rp�
1
R
� �, (7)
where 1/eP ¼ 1/eN�1/eo, and eo and eN are thestatic and high-frequency dielectric constant of theglass respectively, and eP the effective dielectricconstant. The values of rp, , eP and WH are given inTable 2.The values of small polaron coupling constant
gp, which is a measure of electron–phonon inter-action, is given by the formula gP ¼ 2WH=hnowere also evaluated for the present glasses [15].The estimated value of gp is in the range of17.06–26.25 (Table 2), which is larger than thosefor V2O5–Bi2O3 glasses doped with BaTiO3
(7.05–7.60) [30,31]. Such large values give anindication of a strong electron phonon interactionof the present glasses [6,7,15].Finally, the hopping carrier mobility m is
expressed for non-adiabatic hopping conductionas [15],
m ¼eR2
kT
� �1
_
� �p
4WHkT
� �1=2
J2 expð�W=kTÞ,
(8)
where m values were calculated for T ¼ 400K withthe data of W, R, J and WH given in Tables 1 and2. The hopping carrier concentration Nc, is thenobtained using the well–known formula s ¼ eNcm.Table 3 show these results, which indicate that mvalues increase with increasing Fe2O3 concentra-tion. m values were evaluated to be between8.17� 10�5 and 3.66� 10�8 cm2V�1 s�1 and Nc
values between 1.29� 1017 and 5.04� 1018 cm�3,being in the same order as those for NiO–V2O5–

ARTICLE IN PRESS
Table 3
Hopping carrier mobility, m, and carrier density, Nc, of
Fe2O3–Bi2O3–Na2B4O7 glasses
Glass no. m (cm2V�1 s�1) (400K) Nc (cm�3) (400K)
1 3.66� 10�8 5.04� 1018
2 1.99� 10�7 3.60� 1018
3 8.25� 10�7 2.74� 1018
4 8.17� 10�5 1.29� 1017
A. Al-Hajry et al. / Physica B 368 (2005) 51–57 57
TeO2 glasses [6]. Because the localization condi-tion for hopping electrons was given bym50.01 cm2V�1 s�1[15], these small m valuesconfirmed that hopping electrons in the presentglasses are localized mainly at iron sites, corre-sponding to the strong electron–lattice interactingthe large gP [6].
4. Conclusions
Glasses in the system Fe2O3–Bi2O3–Na2B4O7
were prepared using the press-quenching techniquefrom the glasses melts and the DC conductivitywas investigated. The conduction of the presentglasses was confirmed to be due to primarily non-adiabatic hopping between Fe2+ and Fe3+ ions inthe glass network. The small polaron coupling gpwas large (17.06–26.25). The estimated hoppingmobility was in the range of 3.66� 10�8–8.17�10�5 cm2V�1 s�1. The carrier density was estimatedto be between 1.29� 1017 and 5.04� 1018 cm�3 at400K. The principal factor determining conduc-tivity was the polaron hopping mobility in theseglasses.
References
[1] H. Hirashima, Y. Watanabe, T. Yoshida, J. Non-Cryst.
Solids 95/96 (1987) 825.
[2] Y. Sakuri, J. Yamaki, J. Electrochem. Soc. 132 (1985) 512.
[3] A. Al- Hajry, A.A. Soliman, M.M. El- Desoky, Thermo-
chim. Acta 427 (2005) 181.
[4] M.M. El-Desoky, A. Al- Shahrani, J. Mater. Sci.: Mater.
Electron. 16 (2005) 221.
[5] M. Sayer, A. Mansingh, J. Non-Cryst. Solids 42 (1980)
357.
[6] M.M. El-Desoky, J. Mater. Sci.: Mater. Electron. 14
(2003) 215.
[7] M.M. El-Desoky, I. Kashif, Phys. Stat. Sol. (a) 194 (1)
(2002) 89.
[8] M. Sayer, A. Mansingh, J.M. Reyes, G. Rosenblatt,
J. Appl. Phys. 42 (1991) 2857.
[9] S. Chakraborty, M. Sadhukhan, D.K. Modak, B.K.
Chaudhuri, J. Mater. Sci. 30 (1995) 5139.
[10] K. Sega, Y. Kuroda, H. Sakata, J. Mater. Sci. 33 (1998)
1303.
[11] H. Mori, K. Gotoh, H. Sakata, J. Non-Cryst. Solids 183
(1995) 1228.
[12] H. Hirashima, M. Mitsuhashi, T. Yoshida, J. Ceram. Soc.
Jpn. 90 (1982) 411.
[13] H. Mori, T. Kitami, H. Sakata, J. Non-Cryst. Solids 168
(1994) 157.
[14] A. Miller, E. Abrahams, Phys. Rev. 120 (1960) 745.
[15] N.F. Mott, Adv. Phys. 16 (1967) 49.
[16] T. Hirashima, F. Tanaka, Seramikkusu Ronbunshi 97
(1989) 1150.
[17] H.H. Qiu, H. Sakata, T. Hirayama, J. Ceram. Soc. Japan
104 (1996) 1004.
[18] H.H. Qiu, T. It, H. Sakata, Mater. Chem. Phys. 58 (1999)
243.
[19] A. Al-shahrani, A. Al-Hajry, M.M. El- Desoky, Phys.
Stat. Sol. (a) 200 (2003) 378.
[20] N.F. Mott, E.A. Davis, Electronic processes in Non-
Crystalline Materials, Clarendon, Oxford, 1979.
[21] I.G. Austin, N.F. Mott, Adv. Phys. 18 (1969) 41.
[22] M. Sayer, A. Mansingh, J. Non-Cryst. Solids 58 (1983) 91.
[23] H.R. Killias, Phys. Lett. 20 (1966) 5.
[24] I.G. Austin, E.S. Garbet, in: P.G. Le Comber, J. Mort
(Eds.), Electronic and Structural Properties of Amor-
phorus Semiconductors, Academic Press, New York, 1973,
p. 393.
[25] M.B. Field, J. Appl. Phys. 40 (1969) 2628.
[26] H. Nasu, K. Hirao, N. Soga, J. Am. Ceram Soc 64 (1981)
C63.
[27] D. Emin, T. Holstein, Ann. Phys. (NY) 53 (1969)439;
L. D. Friedman and T. Holstein, Am. Phys. (NY) 21(1963)
494.
[28] V.N. Bogomolov, E.K. Kudinov, Yu. Firsov, Sov. Phys.
Solid State 9 (1968) 2502.
[29] M. Sayer, A. Mansingh, J.M. Reyes, G. Rosemblatt,
J. Appl. Phys. 42 (1971) 2857.
[30] A. Ghosh, J. Appl. Phys. 66 (1989) 2425.
[31] M.H. Cohen, J. Non-Cryst. Solids 4 (1970) 391.
Copyright © 2022 FDOKUMEN