Characterization and Prediction of Flow Behavior in High-Manganese Twinning Induced Plasticity...
17
Characterization and Prediction of Flow Behavior in High-Manganese Twinning Induced Plasticity Steels: Part I. Mechanism Maps and Work-Hardening Behavior A. SAEED-AKBARI, L. MOSECKER, A. SCHWEDT, and W. BLECK Thermodynamic stacking fault energy (SFE) maps were developed using the subregular solution model for the Fe-Mn-Al-C system. These maps were used to explain the variations in the work- hardening behavior of high-manganese steels, both through experiments and by comparison with the published data. The suppression of the transformation induced plasticity (TRIP) mechanism, the similarity between the shape of the work-hardening rate diagrams for the produced iso-SFE materials, and an earlier onset of stage C of work hardening by decreasing SFE were shown to be efficiently predictable by the given mechanism maps. To overcome the limitations arising from studying the deformation response of high-manganese steels by SFE values alone, for example, the different work-hardening rate of iso-SFE materials, an empirical criterion for the occurrence of short-range ordering (SRO) and the consequently enhanced work-hardening, was proposed. The calculated values based on this criterion were superimposed on the thermodynamics-based mechanism maps to establish a more accurate basis for material design in high-manganese iron-based systems. Finally, the given methodology is able to clarify the work-hardening behavior of high-manganese twinning induced plasticity (TWIP) steels across an extensive range of chemical compositions. DOI: 10.1007/s11661-011-0993-4 Ó The Minerals, Metals & Materials Society and ASM International 2011 I. INTRODUCTION THE recently developed twinning induced plasticity (TWIP) steels are a class of high-manganese ( > 15 wt pct manganese) austenitic steels with superior mechanical properties such as ultrahigh strength and high formability. These steels have potential applica- tions in the auto industry, due to their increased strength-to-weight ratio and excellent energy absorption properties. [1–4] In these materials, a proper combination of alloying elements (such as manganese, aluminum, and carbon) increases the thermal or mechanical stability of the face-centered-cubic (fcc) austenite c phase, to the extent that no athermal or deformation-induced hexag- onal-close-packed (hcp) martensitic transformation can occur. The possible range of chemical compositions in which the hcp (e) martensite formation is suppressed can be efficiently predicted using the appropriate thermody- namic models and parameters and the resultant mech- anism maps. [5–7] The mechanism maps developed through the thermodynamics-based approach [5] not only show the existence range of transformation induced plasticity (TRIP) mechanisms, but also demonstrate the variations in the stacking fault energy (SFE) by chang- ing the chemical composition and temperature. There- fore, they were proposed as the practical tools for the tailored materials design in low-SFE austenitic systems. The main requirement for the activation of supportive deformation mechanisms for dislocation gliding, such as deformation-induced twinning and martensite forma- tion, is a low SFE value. Both TWIP and TRIP mechanisms (mechanical twinning and e martensite formation) are related to the dissociation of perfect dislocations into Shockley partials with a Burgers vector of type b ¼ 1 6 112 h i and, thus, are related to the energy of the created stacking faults (SFs). [8] The crystallographic changes associated with the formation of a twin or e martensite plate are explained in terms of the arrange- ment of SFs: identical Shockley partial dislocations are packed on every close-packed {111} plane for a twin and on every second close-packed {111} plane for e mar- tensite. [9,10] Therefore, the active plasticity mode is directly related to the SF probability and the SFE value. [3,11–13] In the proposed model by Mahajan and Chin, a three-layer fault formed by the dislocation reaction 1 2 01 1 þ 1 2 10 1 ! 3 1 6 11 2 can act as an embryonic twin. [14] Based on this model, the embryonic three-layer faults that are distributed throughout the slipped region grow into each other, leading to the formation of macroscopic twins. This approach was successfully employed by Kibey et al. [15] to establish a model for the prediction of twinning stress in fcc metals. Nevertheless, the specific dislocation interactions that A. SAEED-AKBARI, Postdoctoral Researcher and Research Team Leader, L. MOSECKER, Doctoral Candidate and Project Engineer, and W. BLECK, University Professor and Department Head, are with the Department of Ferrous Metallurgy, RWTH Aachen University, 52072 Aachen, Germany. Contact e-mail: alireza. [email protected] A. SCHWEDT, Head of the Scan- ning Electron Microscopy Group, is with the Central Facility for Electron Microscopy (GFE), RWTH Aachen University, 552074 Aachen, Germany. Manuscript submitted August 16, 2010. Article published online December 23, 2011 1688—VOLUME 43A, MAY 2012 METALLURGICAL AND MATERIALS TRANSACTIONS A
-
Upload
independent -
Category
Documents
-
view
4 -
download
0
Transcript of Characterization and Prediction of Flow Behavior in High-Manganese Twinning Induced Plasticity...
Characterization and Prediction of Flow Behaviorin High-Manganese Twinning Induced Plasticity Steels:Part I. Mechanism Maps and Work-Hardening Behavior
A. SAEED-AKBARI, L. MOSECKER, A. SCHWEDT, and W. BLECK
Thermodynamic stacking fault energy (SFE) maps were developed using the subregular solutionmodel for the Fe-Mn-Al-C system. These maps were used to explain the variations in the work-hardening behavior of high-manganese steels, both through experiments and by comparisonwith the published data. The suppression of the transformation induced plasticity (TRIP)mechanism, the similarity between the shape of the work-hardening rate diagrams for theproduced iso-SFE materials, and an earlier onset of stage C of work hardening by decreasingSFE were shown to be efficiently predictable by the given mechanism maps. To overcome thelimitations arising from studying the deformation response of high-manganese steels by SFEvalues alone, for example, the different work-hardening rate of iso-SFE materials, an empiricalcriterion for the occurrence of short-range ordering (SRO) and the consequently enhancedwork-hardening, was proposed. The calculated values based on this criterion were superimposedon the thermodynamics-based mechanism maps to establish a more accurate basis for materialdesign in high-manganese iron-based systems. Finally, the given methodology is able to clarifythe work-hardening behavior of high-manganese twinning induced plasticity (TWIP) steelsacross an extensive range of chemical compositions.
DOI: 10.1007/s11661-011-0993-4� The Minerals, Metals & Materials Society and ASM International 2011
I. INTRODUCTION
THE recently developed twinning induced plasticity(TWIP) steels are a class of high-manganese(> 15 wt pct manganese) austenitic steels with superiormechanical properties such as ultrahigh strength andhigh formability. These steels have potential applica-tions in the auto industry, due to their increasedstrength-to-weight ratio and excellent energy absorptionproperties.[1–4] In these materials, a proper combinationof alloying elements (such as manganese, aluminum, andcarbon) increases the thermal or mechanical stability ofthe face-centered-cubic (fcc) austenite c phase, to theextent that no athermal or deformation-induced hexag-onal-close-packed (hcp) martensitic transformation canoccur. The possible range of chemical compositions inwhich the hcp (e) martensite formation is suppressed canbe efficiently predicted using the appropriate thermody-namic models and parameters and the resultant mech-anism maps.[5–7] The mechanism maps developedthrough the thermodynamics-based approach[5] not onlyshow the existence range of transformation induced
plasticity (TRIP) mechanisms, but also demonstrate thevariations in the stacking fault energy (SFE) by chang-ing the chemical composition and temperature. There-fore, they were proposed as the practical tools for thetailored materials design in low-SFE austenitic systems.The main requirement for the activation of supportive
deformation mechanisms for dislocation gliding, such asdeformation-induced twinning and martensite forma-tion, is a low SFE value. Both TWIP and TRIPmechanisms (mechanical twinning and e martensiteformation) are related to the dissociation of perfectdislocations into Shockley partials with a Burgers vectorof type b ¼ 1
6 112h i and, thus, are related to the energy ofthe created stacking faults (SFs).[8] The crystallographicchanges associated with the formation of a twin or emartensite plate are explained in terms of the arrange-ment of SFs: identical Shockley partial dislocations arepacked on every close-packed {111} plane for a twin andon every second close-packed {111} plane for e mar-tensite.[9,10] Therefore, the active plasticity mode isdirectly related to the SF probability and the SFEvalue.[3,11–13] In the proposed model by Mahajan andChin, a three-layer fault formed by the dislocation
reaction 12 011� �
þ 12 101� �
! 3� 16 112� �
can act as anembryonic twin.[14] Based on this model, the embryonicthree-layer faults that are distributed throughout theslipped region grow into each other, leading to theformation of macroscopic twins. This approach wassuccessfully employed by Kibey et al.[15] to establish amodel for the prediction of twinning stress in fcc metals.Nevertheless, the specific dislocation interactions that
A. SAEED-AKBARI, Postdoctoral Researcher and ResearchTeam Leader, L. MOSECKER, Doctoral Candidate and ProjectEngineer, and W. BLECK, University Professor and DepartmentHead, are with the Department of Ferrous Metallurgy, RWTHAachen University, 52072 Aachen, Germany. Contact e-mail: [email protected] A. SCHWEDT, Head of the Scan-ning Electron Microscopy Group, is with the Central Facility forElectron Microscopy (GFE), RWTH Aachen University, 552074Aachen, Germany.
Manuscript submitted August 16, 2010.Article published online December 23, 2011
1688—VOLUME 43A, MAY 2012 METALLURGICAL AND MATERIALS TRANSACTIONS A

result in the formation of twins in high-manganese TWIPsteels were not clear until the recent publication of threeworks by Idrissi et al.[10,16,17] In this extensive trilogy, thepossible mechanisms of deformation twinning in fccmetals were reviewed, and the twins’ internal structurewas correlated with the work-hardening rate of TWIPsteels. They described major differences in the observedtwins in the Fe-Mn-C and Fe-Mn-Si-Al systems andrelated them to the variation of the work-hardeningbehavior of these steels. By comparing Fe-Mn-C andFe-Mn-Si-Al TWIP steels, Idrissi et al.[16] also showedthat the twins formed in the Fe-Mn-C system are thinnerand contain a much larger density of sessile defects; thus,they are much stronger than in the Fe-Mn-Si-Al steel.Moreover, the critical stress required for the plasticdeformation of the twin lamellae was lower in Fe-Mn-Si-Al steel than inFe-Mn-C steel, which led to a considerabledifference between the work-hardening behavior of thetwo materials. It was also suggested that carbon-manga-nese interactions could influence the dislocation reactionsrequired for the occurrence of faulted twins.
It had been reported that with decreasing SFE, thedeformation mechanisms are activated in the followingorder: dislocation glidefi dislocation glide+mechanicaltwinning fi dislocation glide+martensitic transforma-tion.[3,18,19] In addition, an increase in the operatingtemperature leads to an increase of the SFE value.Withinthe range of SFEs close to the upper limit of the TRIPmechanism (~20 mJ/m2),[5] deformation twinningbecomes operational. This activation results in the simul-taneous presence of TRIP and TWIP mechanisms in anarrow range of SFE values.[18,20] Also, other importantmicrostructural parameters such as grain size[21,22] andlocal stress and strain significantly impact the deforma-tion mechanism.[23] The dynamic Hall–Petch effect,[3,4,24]
a result of deformation twinning, causes rapid accumu-lation and storage of dislocations in which the twinboundaries act as strong barriers against dislocationmotion, similar to grain boundaries.[25] Consequently,deformation twinning in highly alloyed low-SFE steelsenhances the work hardening of samples during tensiletesting. Adler et al.[26] suggested that the upward trend offlowcurves in tensile testing is affected by the combinationof the softening effect of deformation twinning—as asupportive deformation mechanism—and the hardeningeffect of the twinned microstructure, as discussed earlier.
Nevertheless, according to Stepanskiy,[27] the factorsthat control the level and dynamics of work hardeningin austenitic steels are as follows: (a) the SFE value, (b)the e martensite start temperature, and (c) the initiationtemperature of the serrated plastic flow. The serratedflow suggests another proposed mechanism of workhardening in TWIP steels besides deformation twinning.In high-manganese Fe-Mn-C and Fe-Mn-Al-C steels,the interaction of short-range ordering (SRO) or clus-tering of alloying elements[28] with extended (such as inthe low-SFE TWIP steels)[25] or complete dislocations(such as in the high-SFE microband induced plasticity(MBIP) steels) is expected to produce a SFE-indepen-dent[29] planar glide mechanism that enhances the workhardening.[29–31] In their pioneering work, Dastur andLeslie[32] argued that deformation twinning is not the
primary factor in the rapid work hardening of Hadfieldsteels. Their hypothesis, which was supported by Zui-dema et al.,[33] Gerold and Karnthaler,[28] Shun et al.,[34]
Chen et al.,[25] and recently Kim et al.,[35] explains thehigh affinity of carbon and manganese atoms to generateclusters. In these clusters, carbon occupies the octahe-dral interstitial sites, and manganese atoms occupy thesix nearest neighbor sites with an occupancy higher thanthe expected value based on the atomic concentration ofmanganese. The interaction between ordered zones withextended dislocations and continuous disordering by thepassage of leading and trailing partial dislocationsgenerates conditions in which the required stress forthe glide of subsequent dislocations gradually decreases,leading to planar glide. The increased planar glidedescribed in this theory results in a higher level of workhardening. Finally, Chen et al.[25] discussed the interac-tion between the carbon-manganese octahedral clustersand the mobile extended dislocations. Not only is thisinteraction the primary reason for the planar dislocationglide, but it also explains other phenomena, such asdynamic strain aging (DSA) and the resultant jerky flowbehavior in high-manganese TWIP steels.In the present work, the effects of chemical composi-
tion and applied parameters such as temperature, strainrate, and grain size on the work-hardening behavior ofTWIP steels are experimentally reviewed from theviewpoint of the previously developed mechanismmaps,[5] which are further updated to account fordifferent work-hardening mechanisms such as deforma-tion twinning and planar glide. These maps are shown tobe able to predict thermodynamically and empirically thedeformation response of TWIP steels. Finally, the role ofthe studied parameters on changing the shape of thework-hardening rate diagrams are schematically pre-sented in conjunction with the published data concerningdifferent stages of the work hardening in TWIP steels.
II. EXPERIMENTAL PROCEDURE
A. Materials and Tensile Tests
Six grades of high-manganese austenitic TWIP steels(E1 through E6) with the nominal chemical composi-tions given in Table I were used. The as-receivedmaterials consisted of hot-rolled (2- to 2.4-mm thick-ness, HR) and cold-rolled (1.2-mm thickness, CR) sheetsin the Fe-Mn-C and Fe-Mn-Al-C systems. The cold-rolled grades were annealed (AN) at 1073 K (800 �C)for 30 minutes to achieve a fully recrystallized micro-structure. In addition, some selected high-manganeseaustenitic steels described in the literature (L1 throughL4 in Table II) were used to check the consistency of thedeveloped design and characterization methodology forthe TWIP steels used in this work with those used inother investigations.The tensile testing specimens were machined along the
rolling direction according to two different standards, asgiven in Figure 1. The variations in the applied tensilesample geometry (A30 and A50) and the as-receivedstate (HR and CR) were used to test the applicability of
METALLURGICAL AND MATERIALS TRANSACTIONS A VOLUME 43A, MAY 2012—1689
our predictions over a broad range of parameters.Nevertheless, the direct comparison between the work-hardening behavior of the experimental materials wasmade only between samples with the same as-receivedconditions and tensile geometry.
The tensile tests at temperatures of 233 K (–40 �C),300 K (27 �C), and 373 K (100 �C) were carried outusing a Zwick Z100/TL3S universal tensile testingmachine (Zwick GmbH & Co. KG, Ulm, Germany).Adjusted crosshead displacement rates of 1.8 to 5.4 mm/min for the A30 samples and 0.3 to 30 mm/min for theA50 samples were used to achieve applied strain rates of(SR, e) of 0.001 to 0.003 s�1 for the E1 through E4 steelsand 0.0001 to 0.01 s�1 for the E5 and E6 steels. Duringthe experiments, the length and the width changes of thetensile specimens were recorded using a high-resolutionvideo extensometer (Messphysic Materials TestingGmbH, Furstenfeld, Austria). The stress and strainvalues were then measured using Xpert software (ZwickGmbH & Co. KG, Ulm, Germany).
B. Microstructural Analysis
Microstructural investigations were carried out onthe HR samples using electron backscatter diffraction(EBSD). To prepare the specimens, the mountedsamples were mechanically polished with diamondpastes of 6 and 1 lm after grinding. The specimenswere further electropolished with electrolyte A2 fromStruers (Struers GmbH, Willich, Germany). The elec-tropolishing was performed between 3 and 6 K byapplying a voltage potential of 34 V for 15 seconds.The EBSD measurements were performed by a JEOL*
Table I. Nominal Chemical Composition of TWIP Steels Used in the Current Work*
Composition (Weight Percent)
Material Mn Al C Fe Condition SFE (mJ/m2) TOI (—)
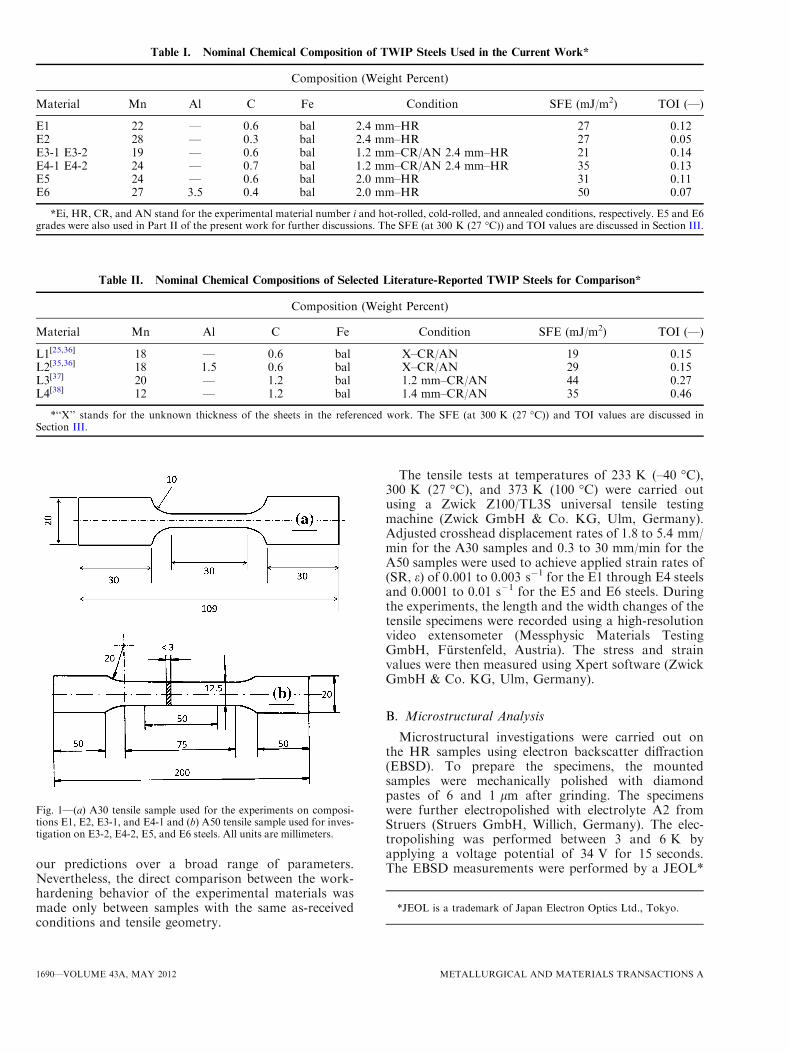
E1 22 — 0.6 bal 2.4 mm–HR 27 0.12E2 28 — 0.3 bal 2.4 mm–HR 27 0.05E3-1 E3-2 19 — 0.6 bal 1.2 mm–CR/AN 2.4 mm–HR 21 0.14E4-1 E4-2 24 — 0.7 bal 1.2 mm–CR/AN 2.4 mm–HR 35 0.13E5 24 — 0.6 bal 2.0 mm–HR 31 0.11E6 27 3.5 0.4 bal 2.0 mm–HR 50 0.07
*Ei, HR, CR, and AN stand for the experimental material number i and hot-rolled, cold-rolled, and annealed conditions, respectively. E5 and E6grades were also used in Part II of the present work for further discussions. The SFE (at 300 K (27 �C)) and TOI values are discussed in Section III.
Table II. Nominal Chemical Compositions of Selected Literature-Reported TWIP Steels for Comparison*
Composition (Weight Percent)
Material Mn Al C Fe Condition SFE (mJ/m2) TOI (—)
L1[25,36] 18 — 0.6 bal X–CR/AN 19 0.15L2[35,36] 18 1.5 0.6 bal X–CR/AN 29 0.15L3[37] 20 — 1.2 bal 1.2 mm–CR/AN 44 0.27L4[38] 12 — 1.2 bal 1.4 mm–CR/AN 35 0.46
*‘‘X’’ stands for the unknown thickness of the sheets in the referenced work. The SFE (at 300 K (27 �C)) and TOI values are discussed inSection III.
Fig. 1—(a) A30 tensile sample used for the experiments on composi-tions E1, E2, E3-1, and E4-1 and (b) A50 tensile sample used for inves-tigation on E3-2, E4-2, E5, and E6 steels. All units are millimeters.
*JEOL is a trademark of Japan Electron Optics Ltd., Tokyo.
1690—VOLUME 43A, MAY 2012 METALLURGICAL AND MATERIALS TRANSACTIONS A
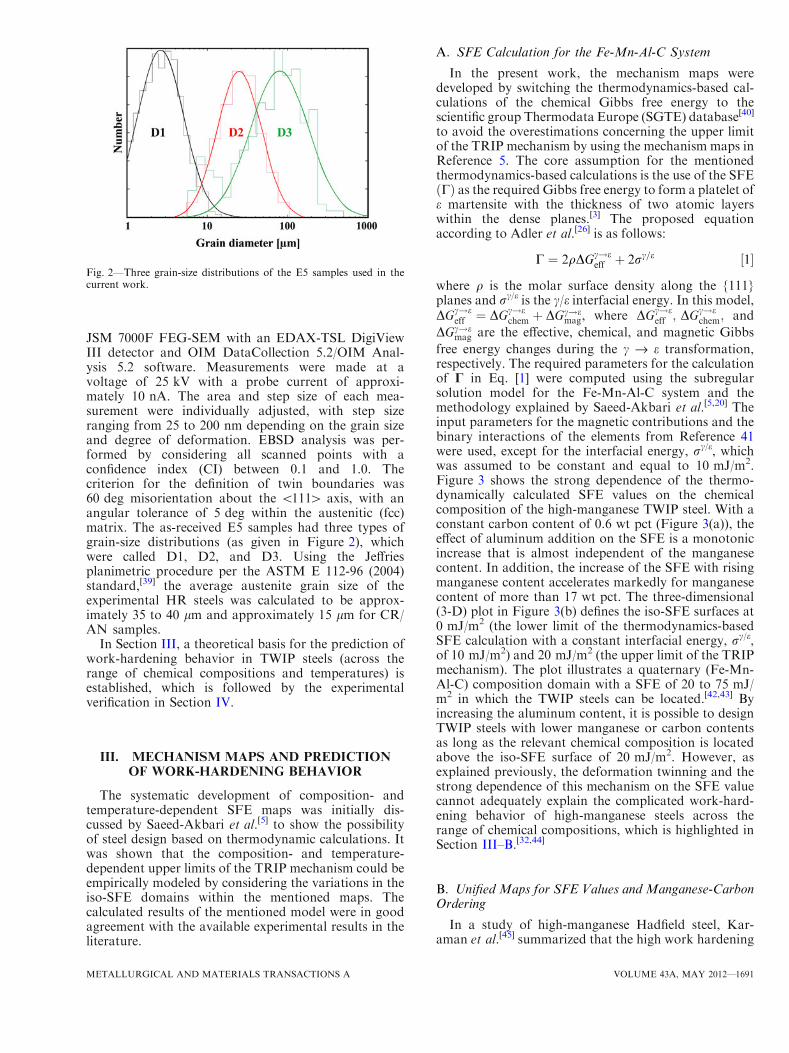
JSM 7000F FEG-SEM with an EDAX-TSL DigiViewIII detector and OIM DataCollection 5.2/OIM Anal-ysis 5.2 software. Measurements were made at avoltage of 25 kV with a probe current of approxi-mately 10 nA. The area and step size of each mea-surement were individually adjusted, with step sizeranging from 25 to 200 nm depending on the grain sizeand degree of deformation. EBSD analysis was per-formed by considering all scanned points with aconfidence index (CI) between 0.1 and 1.0. Thecriterion for the definition of twin boundaries was60 deg misorientation about the <111> axis, with anangular tolerance of 5 deg within the austenitic (fcc)matrix. The as-received E5 samples had three types ofgrain-size distributions (as given in Figure 2), whichwere called D1, D2, and D3. Using the Jeffriesplanimetric procedure per the ASTM E 112-96 (2004)standard,[39] the average austenite grain size of theexperimental HR steels was calculated to be approx-imately 35 to 40 lm and approximately 15 lm for CR/AN samples.
In Section III, a theoretical basis for the prediction ofwork-hardening behavior in TWIP steels (across therange of chemical compositions and temperatures) isestablished, which is followed by the experimentalverification in Section IV.
III. MECHANISM MAPS AND PREDICTIONOF WORK-HARDENING BEHAVIOR
The systematic development of composition- andtemperature-dependent SFE maps was initially dis-cussed by Saeed-Akbari et al.[5] to show the possibilityof steel design based on thermodynamic calculations. Itwas shown that the composition- and temperature-dependent upper limits of the TRIP mechanism could beempirically modeled by considering the variations in theiso-SFE domains within the mentioned maps. Thecalculated results of the mentioned model were in goodagreement with the available experimental results in theliterature.
A. SFE Calculation for the Fe-Mn-Al-C System
In the present work, the mechanism maps weredeveloped by switching the thermodynamics-based cal-culations of the chemical Gibbs free energy to thescientific group Thermodata Europe (SGTE) database[40]
to avoid the overestimations concerning the upper limitof the TRIP mechanism by using the mechanism maps inReference 5. The core assumption for the mentionedthermodynamics-based calculations is the use of the SFEðCÞ as the required Gibbs free energy to form a platelet ofe martensite with the thickness of two atomic layerswithin the dense planes.[3] The proposed equationaccording to Adler et al.[26] is as follows:
C ¼ 2qDGc!eeff þ 2rc=e ½1�
where q is the molar surface density along the {111}planes and rc/e is the c/e interfacial energy. In this model,DGc!e
eff ¼ DGc!echem þ DGc!e
mag, where DGc!eeff ; DGc!e
chem; and
DGc!emag are the effective, chemical, and magnetic Gibbs
free energy changes during the c fi e transformation,respectively. The required parameters for the calculationof C in Eq. [1] were computed using the subregularsolution model for the Fe-Mn-Al-C system and themethodology explained by Saeed-Akbari et al.[5,20] Theinput parameters for the magnetic contributions and thebinary interactions of the elements from Reference 41were used, except for the interfacial energy, rc/e, whichwas assumed to be constant and equal to 10 mJ/m2.Figure 3 shows the strong dependence of the thermo-dynamically calculated SFE values on the chemicalcomposition of the high-manganese TWIP steel. With aconstant carbon content of 0.6 wt pct (Figure 3(a)), theeffect of aluminum addition on the SFE is a monotonicincrease that is almost independent of the manganesecontent. In addition, the increase of the SFE with risingmanganese content accelerates markedly for manganesecontent of more than 17 wt pct. The three-dimensional(3-D) plot in Figure 3(b) defines the iso-SFE surfaces at0 mJ/m2 (the lower limit of the thermodynamics-basedSFE calculation with a constant interfacial energy, rc/e,of 10 mJ/m2) and 20 mJ/m2 (the upper limit of the TRIPmechanism). The plot illustrates a quaternary (Fe-Mn-Al-C) composition domain with a SFE of 20 to 75 mJ/m2 in which the TWIP steels can be located.[42,43] Byincreasing the aluminum content, it is possible to designTWIP steels with lower manganese or carbon contentsas long as the relevant chemical composition is locatedabove the iso-SFE surface of 20 mJ/m2. However, asexplained previously, the deformation twinning and thestrong dependence of this mechanism on the SFE valuecannot adequately explain the complicated work-hard-ening behavior of high-manganese steels across therange of chemical compositions, which is highlighted inSection III–B.[32,44]
B. Unified Maps for SFE Values and Manganese-CarbonOrdering
In a study of high-manganese Hadfield steel, Kar-aman et al.[45] summarized that the high work hardening
Fig. 2—Three grain-size distributions of the E5 samples used in thecurrent work.
METALLURGICAL AND MATERIALS TRANSACTIONS A VOLUME 43A, MAY 2012—1691

in such a low SFE material is due to the following: (a)deformation twinning and formation of twinned-un-twinned zones inside the grains and the consequentinterference of deformation with the twinned zone, (b)dynamic strain aging and the relevant interactionsbetween dislocations and a high concentration ofinterstitials, (c) exchange of position of carbon atomsfrom octahedral to tetrahedral sites, and (d) SF forma-tion and the Suzuki[46] effect. In addition, it has beensuggested that to overcome the barrier for SF formationand deformation twinning, the following factors mayfacilitate the process: the mobility of partial dislocationsunder applied stress; stress concentration caused bypiled-up dislocations at dislocation locks; motion ofcarbon atoms from octahedral to tetrahedral sites bymovement of the leading partial, trapping carbon in atransient structure; and, finally, short-range ordercaused by manganese-carbon clustering.[45,47] Further-more, the effects of carbon and manganese on thedeformation response and work-hardening behavior ofhigh-manganese steels have been extensively debated inthe literature. In principle, carbon in Fe-Mn-Al-C TWIPsteels is thought to define the morphology and theinternal structure of twins,[16] increase the SFEvalue,[5,48] and make SRO or SRC zones with manga-nese, causing the occurrence of the DSA phenomenonand planar dislocation glide.[25,49] All these mechanismswere found to be beneficial for strengthening or increas-ing the work hardening of high-manganese steels.
We attempted to combine the strong dependence ofhigh-manganese steel work hardening on the number ofmanganese-carbon bonds, as reported by Owen andGrujicic,[50] with the theories that support the prominenteffect of deformation twinning, as described by Bouazizet al.[44] Both approaches were attempted recently bydifferent investigators in attempts to model the flowbehavior of TWIP steels. Kim et al.[51] added a DSA-dependent term to the constitutive model of Kubin and
Estrin,[52,53] and Bouaziz et al.[54] followed a semiempir-ical methodology to overcome the deficiencies of phys-ical models of flow curves in dealing with differentchemical compositions. In the current article, theapproach recently proposed by von Appen and Drons-kowski[55] was followed. The most stable SRO zoneswere assumed to be the octahedral compounds contain-ing one carbon atom surrounded by six next neighbormanganese atoms in the fcc austenite lattice. Based ontheir ab initio calculations, the large energy differencebetween the CMn6 and CFe6 octahedra (in CMni, wherei stands for the number of manganese atoms as nextnearest neighbors of a carbon atom) is due to the highdriving force for SRO in the former case. This drivingforce was shown to decrease continuously as the numberof manganese atoms in the next nearest neighboringsites of carbon atoms was reduced and independent ofcarbon or manganese content. In the current work, asemiempirical dimensionless parameter called the ‘‘the-oretical ordering index’’ (TOI) was defined according toEq. [2], which provided a measurement of the fraction ofcarbon and manganese atoms in different Fe-Mn-Csteels:
TOI ¼ XC
XMn¼
xCPxi
xMnPxi
¼ xCxMn¼
NC
NNMn
N
¼ NC
NMn½2�
where Xi, xi, and Ni are the molar fraction, number ofmoles, and number of atoms for element i, respectively;N is the Avogadro constant, which is equal to6.022 9 1023. The defined TOI—in terms of its depen-dence on carbon and manganese content—very muchresembles the suggested dimensionless parameter calledthe ‘‘equivalent manganese content’’ by Bouaziz et al.[54]
The applied derivation technique and the application ofTOI to the explanation of the work-hardening behaviorof TWIP steels in the current work are exclusive and
Fig. 3—Effects of chemical composition on the SFE (C) value of Fe-Mn-Al-C TWIP steels: (a) with a constant carbon content of 0.6 wt pct andincreasing aluminum from 0 to 6 wt pct and (b) by simultaneous change of carbon, manganese, and aluminum content. A SFE of 20 mJ/m2 isregarded as the approximate upper limit of e for the TRIP mechanism.[5]
1692—VOLUME 43A, MAY 2012 METALLURGICAL AND MATERIALS TRANSACTIONS A

capable of clarifying the possible ambiguities in Refer-ence 54 for the development of a composition-dependentmodel of flow behavior.
The calculated TOI values were superimposed on thethermodynamics-based mechanism maps for high-man-ganese steels, and the locations of the chemical compo-sitions from Tables I and II were marked in the maps ofFigure 4. For TOI values less than 0.1, more than 10manganese atoms are available for every carbon atom.Therefore, there is a high probability for the existence ofCFe6�xMnx; however, the population of manganese-containing octahedral clusters with 1 carbon and 6manganese atoms (CMn6) is very low due to the relativeshortage of carbon for the number of manganese atomsin this composition range.
For TOI values between 0.1 and 0.3, the number ofmanganese atoms per carbon atom varies from 10 to 3.The increase in the number of carbon atoms in this TOIrange increases the population of CMn6 octahedra. Inaddition, it is crucial to consider the ab initio calcula-tions in Reference 55, which indicate that the reactionenergies DER for CFe6�xMnx clusters with x ‡ 3 areeither negative or close to zero, while DER is positive for
x< 3. Finally, the high concentration of carbon andrelative manganese depletion in the TOI range greaterthan 0.3 lead to a balance of substitutional (manganese)and interstitial (carbon) alloying elements that providesbetween 1 and 3 manganese atoms for every carbonatom. In this domain, the population of CMn6 octahe-dral clusters is likely to decrease; in contrast to thedecrease in the TOI range less than 0.1, this decrease isdue to the reduction of the number of manganese atoms.
IV. WORK-HARDENING BEHAVIOROF HIGH-MANGANESE TWIP STEELS
A. Results
1. Effect of TOI (thermodynamically iso-SFE steelsE1 and E2)As seen in Figure 5, the iso-SFE (~27 mJ/m2) TWIP
steels E1 and E2 showed similar variations of the work-hardening rate during deformation, despite the con-stantly higher value of approximately 800 MPa for E1e>0:10ð Þ. In addition, the image quality (IQ) maps
Fig. 4—Thermodynamics-based mechanism maps with the included TOI domains: (a) the Fe-Mn-C system with the location of the experimentalsteels in the current work, E1 through E5; (b) the Fe-Mn-Al-C system with the experimental steel E6; (c) the Fe-Mn-C system with the high-manganese steels from literature, L1,[25,36] L3,[37] and L4;[38] and (d) the Fe-Mn-Al-C system with the location of the L2 steel from litera-ture.[35,36] The black and red numbers inside the maps give the SFE and TOI values, respectively.
METALLURGICAL AND MATERIALS TRANSACTIONS A VOLUME 43A, MAY 2012—1693

(Figures 6(a) and (b)) of these materials showed thepresence of twin boundaries within the austenitic matrixin both cases. An increase in the twin boundariesfraction in the E2 steel compared to the E1 steel wasobserved based on the applied settings for the EBSDmeasurement. Nevertheless, it is noteworthy that the E1steel (Figure 6(a)), which had a higher TOI of 0.12compared with E2 (TOI = 0.05), showed larger areas ofnonindexed zones with CI< 0.1 (black) during theEBSD analysis, which can be related to the strong latticedistortions in these areas.[56–58]
2. Effect of SFE (iso-TOI steels E3 and E4)According to Figure 4(a), the E3 and E4 steels had
similar TOI values of 0.14 and 0.13, respectively.
However, the SFE value of the E3 steel (~21 mJ/m2) is14 mJ/m2 lower than that of the E4 steel (35 mJ/m2). Inaddition, the work-hardening rate diagrams of thesesteels, as depicted in Figure 7 for both the HR andCR/AN materials, show a constantly higher level for theE3 steel within the logarithmic strain range below 0.25and an earlier drop of the work-hardening rate at higherstrain values. The E4 steel showed fracture strain values(ef) that were 0.10 to 0.15 higher than those of the E3steel for the HR and CR/AN samples. The IQ maps ofthe E3 (Figure 8) and E4 (Figure 9) steels for logarith-mic strains of 0.02, 0.10, and 0.20 presented similar stepsin the evolution of deformation twinning, from the onsetof twin formation to twin saturation. No indication ofhigher twinning density for the low SFE E3 steel wasfound, based on the EBSD results of Figures 8 and 9.However, the limitations of the EBSD technique for thedetection of fine deformation twins must be considered.These limitations can result in an erroneously lowerestimate for the twinning density in the case of the E3steel. Recently, the use of low accelerating voltage (5 to7.5 kV, which is approximately 5 times lower than thevalues used in the current work) during the EBSDanalysis was proposed to improve the spatial resolutionand, thereby, detect deformation twins of nanoscopicsize.[59] In any case, such methods are still underdevelopment and beyond the scope of the present work.
B. Effects of Manganese and Aluminum(Steels L1 Through L4, E5 and E6)
As depicted in Figures 10(a) (steels L1 and L2) and(b) (steels L3 and L4), the increase of aluminum (withconstant manganese and carbon contents) and manga-nese content (with no aluminum and a constant carboncontent) can change the value of the work-hardeningrate. Both aluminum and manganese (<15 wt pct) areknown to increase the SFE value in TWIP steels,[5–7] butthe addition of aluminum to L2 steel decreased thework-hardening rate (as expected for the increase ofSFE), while the addition of manganese to L3 steelincreased the work-hardening rate. The fracture strain
Fig. 5—Work-hardening rate diagrams of HR steels E1 and E2, at300 K. The red squares indicate the location of the samples takenfor the EBSD analysis shown in Fig. 6.
Fig. 6—IQ maps of HR steels (a) E1 and (b) E2 after fracture (redsquares in Fig. 5) at 300 K (27 �C). The detectable twin boundariesare marked in yellow based on the criterion given in Section II–B.The scanned area has dimensions of 30 lm 9 60 lm, step size of50 nm.
Fig. 7—Work-hardening rate diagrams of CR/AN (black) and HR(red) steels of grades E3 and E4 at 300 K (27 �C). The red squaresindicate the location of the samples taken for the EBSD analysisshown in Figs. 8 and 9.
1694—VOLUME 43A, MAY 2012 METALLURGICAL AND MATERIALS TRANSACTIONS A

was also improved in the case of L3 steel, resulting in aDefvalue of approximately 0.10. In addition, the simulta-neous decrease of SFE and increase of TOI in E5 steelrelative toE6 steel (Figure 11(a)) resulted in an increase ofthe logarithmic fracture strain and true fracture stress toDef ¼ 0:20 and Drf ¼ 500MPa; respectively. In addition,aluminum-containing E6 steel showed a nonserrated(smooth) plastic flow (Figure 11(a)), with a lower work-hardening rate of approximately 950 MPa for logarith-mic strains of more than 0.10 (Figure 11(b)).
C. Effects of Temperature, Grain Size, and AppliedStrain Rate (Steel E5)
The EBSD analysis on the fractured samples of the E5steel after tensile deformation at 233 K (–40 �C), 300 K(27 �C), and 373 K (100 �C) was performed in threeways: (1) by increasing the deformation temperature(and, consequently, the SFE) from 233 K (–40 �C) to373 K (100 �C) in the intermediate grain-size regime;(2) by consideration of the increase in the value of the
grain-size distribution from D1 to D3; and (3) byincreasing the applied strain rate for a constant temper-ature and grain-size distribution. The temperaturevariation within the aforementioned range raised theSFE value from 29 mJ/m2 at 233 K (–40 �C) to 38 mJ/m2 at 373 K (100 �C), as seen in the SFE map ofFigure 12. According to the given map in Figure 12, thechange of the SFE was minor (29 to 31 mJ/m2) when thetemperature was increased from 233 K (–40 �C) to300 K (27 �C) and became more pronounced (31 to38 mJ/m2) as the temperature was further increasedto 373 K (100 �C). The work-hardening rate after theinitial drop was highest at 233 K (–40 �C) and lowest at373 K (100 �C), but the tests at 233 K (–40 �C) and300 K (27 �C) in Figure 13(a) returned almost similarvalues. The logarithmic fracture strain was found to beinversely proportional to the deformation temperature(and SFE).The change in the grain-size distribution from D1 to
D3 imposed similar variations in the work-hardeningrate (Figure 13(b)) as those imposed by a temperature
Fig. 8—IQ maps of HR steel E3 after the application of logarithmic strains of (a) e = 0.02, (b) e = 0.10, and (c) e = 0.20 (red squares inFig. 7) at 300 K (27 �C). The detectable twin boundaries are marked in yellow, based on the criterion given in Section II–B. The scanned areahas dimensions of 100 lm 9 300 lm, step size of 200 nm.
METALLURGICAL AND MATERIALS TRANSACTIONS A VOLUME 43A, MAY 2012—1695

increase (Figure 13(a)). However, the intermediategrain-size regime seemed to enhance slightly the loga-rithmic fracture strain. The applied strain rate, e, in the
range of 0.0001 s�1 to 0.001 s�1, did not change thework-hardening rate in a meaningful manner that wasconsistent with the reportedly low strain-rate sensitivity
Fig. 9—IQ maps of HR steel E4 after the application of logarithmic strains of (a) e = 0.02, (b) e = 0.10, and (c) e = 0.20 (red-colored squaresin Fig. 7) at 300 K (27 �C). The detectable twin boundaries are marked in yellow based on the criterion given in Section II–B. The scanned areahas dimensions of 100 lm 9 300 lm, step size of 200 nm.
Fig. 10—Work-hardening rate diagrams for steels (a) L1 and L2 and (b) L3 and L4 from the literature.[25,35–38]
1696—VOLUME 43A, MAY 2012 METALLURGICAL AND MATERIALS TRANSACTIONS A

of high-manganese steels (Figure 13(c)).[25,35] Neverthe-less, a further increase of the applied strain rate to0.01 s�1 resulted in a decrease of the work-hardeningrate, similar to the effect of temperature increase(Figure 13(a)).
In the EBSD IQ maps of Figures 14(a) and 15(a) forthe logarithmic strain of 0.02, annealing twin boundarieswere observed within the austenitic matrix, while defor-mation twins were not detected. The lack of deforma-tion twins at the mentioned deformation level could bedue to the selected area for the EBSD analysis and notnecessarily the lack of activity for this mechanism. Inaddition, the twins might also be too thin to be detectedby EBSD analysis. Deformation twins were recentlyobserved for a logarithmic strain of 0.02 by Barbieret al.[60] and Hamada et al.[61] in TWIP steels, whichsuggests an early activation of deformation twinning forthis group of low-SFE materials. At higher strain levels(e = 0.10), the samples with a coarser grain size (D3,Figure 15(b)) showed the activation of two non-copla-nar twin systems (red and white arrows), while in the
case of the finer grain-size regime (D2, Figure 14(b)), thedeformation twins were in their early stage of activation(white arrow). In general, a large fraction of themicrostructure in D1 (Figure 16) was occupied bydetected points with CI< 0.1, which are colored blackand cannot be used for further discussion. This findingmight be due to the large degree of deformation in thefractured (e > 0.35), fine-grained (D1) structure, forwhich the fine EBSD analysis step size of 25 nm was notsufficiently small to allow exact analysis. Nevertheless,the length of the twin boundaries increased as the grain-size distribution increased from D1 (Figure 16) to D3(Figure 17). Additionally, the volume fraction of twinsand the number of twins per grain, a measure also usedby Barnett,[62] increased in the same direction. This factcan be seen more easily when comparing the EBSDresults for the D1 sample (Figure 16(b)) at 373 K(100 �C) with those obtained for the D3 sample(Figure 17(b)) at 373 K (100 �C). The increase of theSFE value (29 to 38 mJ/m2) as the temperature increasedfrom 233 K (–40 �C) to 373 K (100 �C) did not seem toaffect the microstructural twin density in a meaningfulway, as seen by comparing Figure 16(a) with 16(b) orFigure 17(a) with 17(b).However, it must be noted that for a true comparison
of the twinning density in the fractured samples(e > 0.35), consideration of the undetected microstruc-tural twins via EBSD analysis is crucial but was notinvestigated in the present work.
V. DISCUSSION
A. Work-hardening Behavior of Iso-SFE TWIP SteelsE1 and E2
Based on the definition of the TOI value givenin Section III, the E1 and E2 steels have 8 and20 manganese atoms available, respectively, for everycompositional carbon atom. Considering a composi-tion-independent high driving force for the formation ofCMn6 octahedral clusters, as described by von Appenand Dronskowski,[55] it is assumed that all carbon atoms
Fig. 11—(a) Flow curves and (b) work-hardening rate diagrams for HR steels E5 (Fe-Mn-C) and E6 (Fe-Mn-Al-C) after the quasi-static tensiletests at 300 K (27 �C).
Fig. 12—Thermodynamics-based mechanism map (composition-tem-perature) with a constant carbon content of 0.6 wt pct: the positionsof the E5 steel at increasing temperatures are marked.
METALLURGICAL AND MATERIALS TRANSACTIONS A VOLUME 43A, MAY 2012—1697

(in both E1 and E2) are involved in forming CFe6�xMnxclusters with some possible configurations seen inFigure 18. Therefore, as a simplifying assumption, wefocus on CMn6 clusters and assume that the variationsin the population of other CFe6�xMnx clusters, if theyexist, monotonically follow the population of CMn6clusters.
The population of CMn6 clusters is substantiallylower in E2 steel than in E1 steel due to the shortage ofcarbon atoms in the former case (TOI< 0.1). Inaddition, it can be proposed that the interstitial occu-pancy probability (PnC(n) in Eq. [3]) defined by Owenand Grujicic[50] is reduced in E2 steel compared with E1for 0 £ n £ 6 because of the decrease in the number ofoctahedral clusters that contain a carbon atom:
PnC nð Þ ¼ NnC
Nn½3�
where NnC is the number of CMnn octahedral clusters(clusters containing one carbon atom and n manganeseatoms) and Nn is the total number of octahedral clusterswith n manganese atoms. According to Dastur andLeslie,[32] the resultant locking of dislocations via thereorientation of carbon-manganese couples in the coreof mobile dislocations results in an increase in thedislocation density for a given strain, thereby increasing
the work hardening of high-manganese steels. Thisphenomenon can be interpreted as the cause for thehigher work-hardening rate in E1 steel compared withE2 steel and the presumably stronger lattice distortion inthe IQ maps of Figure 6(a). Furthermore, other obser-vations concerning the role of solute atoms and theSRO regions on SFE values and deformation twinningmust not be neglected. Based on the explanations ofPetrov,[63] the thermodynamically calculated SFE valuesbased on a regular, solid solution[5,7,41,64] deviate fromreality. Specifically, for higher interstitial content(>1.50 at. pct), deviations occur because of the changesin the electronic structure of the solid solution[63] causedby increasing the interstitial solute content. This factormeans that E2 steel with an interstitial solute (carbon)concentration of 1.38 at. pct can be adequatelydescribed by the assumption of regularity, while E1steel with a carbon concentration of approximately2.70 at. pct deviates from the regular solution modeland the resultant SFE value. The segregation of solutesto the SFs (Suzuki effect)[46,65] reportedly decreases theSFE value[66] for the dilute solutions,[67] while in themore concentrated solid solutions, if any appreciablelocal order exists, the so-called Fisher interaction[68]
between the SRO regions and the extended dislocationssignificantly contributes to the strengthening.[69] TheSuzuki effect can have a measurable strengthening role
Fig. 13—Work-hardening rate diagrams of HR steel E5 by (a) temperature variation, (b) grain-size variation, and (c) applied strain-ratevariation.
1698—VOLUME 43A, MAY 2012 METALLURGICAL AND MATERIALS TRANSACTIONS A

only when a sufficiently high density of dislocationscauses the SFs to nearly overlap.[70] The two mecha-nisms—Suzuki and Fisher—can also be regarded assomewhat interconnected, as the nucleation of SRO canoccur preferentially on the SFs because of the Suzukiinteraction.[71] Despite the effect of the Suzuki mecha-nism, causing a clear decrease of the SFE value, theinfluence of SRO on the SFE and deformation twinninghas been the subject of debate. While an earlier work byThomas[72] suggests the increase of SFE by SRO, a laterextensive report by Pepplewell and Crane[73] definesSRO as an extremely potent hardening mechanism,acting by decreasing the local SFE value and the locallattice distortion resulting from the strain field of theordered regions. Moreover, it was proven that the sizeor the number of ordered regions specifies the amount ofthe resultant strengthening by SRO.[73] In the presentwork, the E1 steel, which is expected to have a higherpopulation of CFe6�xMnx ordered zones than the E2steel (because of a higher TOI value), showed a higherfraction of points with CI< 0.10, which could be relatedto a higher lattice distortion imposed by the strain fieldof the SRO regions. The lower observed fraction ofdeformation twins in the E1 steel than in the E2 steel
(ignoring the detection limitations of EBSD) can beexplained by the effect of SRO on the twinning stress.Karaman et al.[74] argued that in the intermediate SFEregime for nitrogen-containing stainless steel singlecrystals, the SRO of nitrogen and chromium results inincreased twinning stress because of the requirementthat SRO be destroyed in the successive twin planesduring twin growth.[74] On the other hand, a furtherdecrease of SFE, by increasing the nitrogen content,results in more pronounced deformation twinning as thedislocation glide becomes almost as difficult as twinnucleation.[74] This phenomenon was shown to be theresult of the competitive nature of different mechanisms,such as strain aging, planar glide, and deformationtwinning, in the range of SFE values and soluteconcentrations. Therefore, as E1 steel—based on thesubregular solution model of Eq. [1]—had an SFE valueof 27 mJ/m2 and a much higher population of SROregions, it had a slightly lower twinning density com-pared with the E2 steel due to an increase in twinningstress in the former case. This analysis can be correctonly if the Suzuki effect on the SFE for the more dilutealloy (E2) balances the SRO effect on the SFE for themore concentrated alloy (E1) so that the main governing
Fig. 14—IQ maps of HR steel E5 deformed at 300 K (27 �C) by anSR _eð Þ of 0.003 s�1 for the D2 grain-size distribution: (a) e = 0.02and (b) e = 0.10. The detectable twin boundaries are marked in yel-low. The scanned area has dimensions of 100 lm 9 300 lm, stepsize of 200 nm.
Fig. 15—IQ maps of HR steel E5 deformed at 300 K (27 �C) by anSR _eð Þ of 0.003 s�1 for the D3 grain-size distribution: (a) e = 0.02and (b) e = 0.10. The detectable twin boundaries are marked in yel-low. The scanned area has dimensions of 300 lm 9 700 lm, stepsize of 500 nm.
METALLURGICAL AND MATERIALS TRANSACTIONS A VOLUME 43A, MAY 2012—1699

factor for defining the twinning stress is the higher SROin E1. This analysis, however, must be validated byfurther investigation.
The work hardening in high-manganese TWIP steelsis initially driven by planar dislocation glide before theonset of deformation twinning due to the interaction ofSRO and dislocations.[49] The process is not dependenton other parameters, such as SFE or the value of theyield stress as discussed by Gerold and Karnthaler,[28]
even though they may support the arrangement ofdislocations in planar arrays. Therefore, the work-hardening rate for E1 steel is consistently higher thanthat of E2 steel, even from the onset of plasticdeformation (Figure 5).
B. Work-hardening Behavior of Iso-TOI TWIP Steels(E3/E4 and L1/L2)
The substantial decrease in the SFE value is likely tobe the principal reason for the higher work-hardeningrate and earlier onset of stage C[60] in the work-hardening rate diagrams of E3 steel compared with E4steel in Figure 7 (iso-TOI steels). The EBSD IQ maps ofFigures 8 and 9 show a similar evolution/intensity ofdeformation twinning for logarithmic strains of 0.02,0.10, and 0.20. In the case of the lower SFE scenario(E3), the deformation twins are finely structured, whilein the higher SFE scenario (E4), the deformation twinsare longer and widely separated. To explain thisdifference, Christian[75] suggested that with the increas-ing SFE, the nucleation stress for twinning increasesrapidly compared with the propagation stress. It wasobserved that in the very low-SFE regime, almosthomogenous deformation, the consequence of fine-scalelocalized twinning throughout the specimen, occurs.This conclusion is consistent with the comparison of theobservations in Figure 8(c) (SFE of 21 mJ/m2) withthose in Figure 9(c) (SFE of 35 mJ/m2). In addition, bycomparing the work-hardening rate diagrams of the L1
Fig. 16—IQ maps of HR steel E5 deformed at (a) 233 K (–40 �C)and (b) 373 K (100 �C) by an SR _eð Þ of 0.003 s�1 for the D1 grain-size distribution after fracture (e > 0.35). The detectable twin bound-aries are marked in yellow. The scanned area has dimensions of (a)15 lm 9 35 lm and (b) 20 lm 9 45 lm, step size of 25 nm.
Fig. 17—IQ maps of HR steel E5 deformed at (a) 233 K (–40 �C)and (b) 373 K (100 �C) by an SR _eð Þ of 0.003 s�1 for the D3 grain-size distribution after fracture (e > 0.45). The detectable twin bound-aries are marked in yellow. The scanned area has dimensions of (a)65 lm 9 120 lm and (b) 75 lm 9 150 lm, step size of 100 nm.
Fig. 18—Most stable atomic configurations in the CFe6�xMnx octa-hedral clusters, reconstructed based on the work of von Appen andDronskowski.[55] Iron, manganese, and carbon atoms are shown byyellow, red, and blue spheres, respectively.
1700—VOLUME 43A, MAY 2012 METALLURGICAL AND MATERIALS TRANSACTIONS A

and L2 steels (Figure 10(a)), the same conclusion can bedrawn: at a constant TOI value, the increase of SFEdecreases the work-hardening rate. Other investiga-tors[16,36] have discussed the effect of aluminum onincreasing the SFE value and decreasing the interactiontime between SFs and point defect complexes,[36] alongwith its effect on the internal structure of twins (whichcan reduce the work-hardening rate). However, increas-ing the aluminum content above 8 wt pct while increas-ing the carbon and manganese content, as seen inrecently developed MBIP, can result in the formation ofj carbides, thereby enhancing the planar dislocationglide and increasing the work-hardening rate. Becausethe formation of j carbides has not been reported in thecomposition range of high-manganese TWIP steels, it isnot considered for the Fe-Mn-Al-C TWIP steels in thepresent work.
C. Work-hardening Behavior of TWIP Steelswith Different SFE and TOI Values
The lower work-hardening rate for L4 steel than forL3, despite the lower SFE value of L4 (35 mJ/m2
compared to 44 mJ/m2), can be explained by consider-ation of the formation of CFe6�xMnx clusters in a groupof 100 atoms for the different steels used in this study.As depicted in Figure 19, the maximum number ofCMn6 clusters, which can define the SRO in Fe-Mn-CTWIP steels, increases from 1 (for the E2 steel) toapproximately 3 (for steels E1, E3, E4, E5, L1, and L3)and drops to 2 (for L4 steel) as the TOI value increasesfrom 0.05 to 0.46. As explained earlier, the shortage ofcarbon atoms for TOI< 0.1 and the shortage ofmanganese for TOI> 0.3 decrease the maximum pos-sible population of ordered zones with CFe6�xMnxcomposition. Therefore, because L4 steel is in theTOI> 0.3 domain, while L3 steel is located in theTOI< 0.3 domain, L3 steel shows a higher work-hardening rate because it has more ordered zones,higher dislocation density for a given strain, and a more
pronounced strengthening due to the interaction ofdislocations and SRO. Moreover, it is seen that thevariation trend in the thermodynamically calculatedSFE values of different steels, based on the assumptionof regularity in the solid solution, in Figure 19 showno correlation with the maximum number of CMn6clusters.
D. Change of Work-hardening Rate by Decreasing SFEand Increasing TOI
A simultaneous decrease of SFE (from 50 to 31 mJ/m2) and increase of TOI (from 0.07 to 0.11) in E5 steelcompared to E6 steel (Figure 11(b)) resulted in anincreased occurrence of deformation twinning and SRO,thereby increasing the work-hardening rate (e > 0.20) to2600 MPa. In addition, the serrations on the flow curveare seen in E5 steel and not in the high-SFE aluminum-containing E6 TWIP steel because of the limited DSAmechanism in the low-TOI regime. According to Kimet al.,[36] the increase of the SFE value by the addition ofaluminum causes the delayed onset of serrated flow,which may be another cause for the observation ofsmooth flow in E6 steel.
E. Work-hardening Behavior Across the Range ofDeformation Temperatures, Applied Strain Rates,and Grain-Size Regimes
The drop observed in the work-hardening rate dia-grams (Figures 13(a) and (b)) with increasing tempera-ture and grain size can be attributed to the limitation ofdeformation twinning due to a higher SFE value (in thecase of increasing temperature)[5] and the earlier satura-tion of deformation twinning (in the case of increasinglycoarse grains).[20] As seen in the IQ map of Figure 15,deformation twinning in the coarse-grained regimeexhibits a sudden increase in the activation of non-coplanar twinning systems and final saturation (as seenin the temperature range between 233 K (–40 �C) and373 K (100 �C) in the IQ maps of Figure 17). Thisbehavior can also be indicated by the earlier reduction ofthe work-hardening rate. The finest grain-size regime(D1) in Figure 13(b) shows a high work-hardening rate,which, according to Reference 76, is achieved by alimited dynamic recovery due to the low SFE, despite thelimited deformation twinning (IQ maps of Figure 16).The gradual decrease of the work-hardening rate for
the applied strain rate of 0.01 s�1 compared to lowerstrain-rate scenarios is due to the sequential andlocalized high-temperature motion of deformationbands and the resultant gradual increase of the SFEvalue, which is more pronounced at higher appliedstrain rates (Part II provides detailed information).As a complementary comment, it is worth noting that
the intermediate grain-size regime shows the highestfracture strain, presumably due to its longer lastingdeformation twinning. For the same reason, the fracturestrain of the sample deformed at 373 K (100 �C) withthe highest SFE value was the highest of all testingtemperatures (Figure 13(a)). This result is consistentwith the explanation of Huang et al.,[77] which suggests
Fig. 19—Maximum number of possible CMn6 octahedral clusters ina 100-atom sample of steels E1 to E5, L1, L3, and L4. The blacksquares indicate the number of clusters, while the red triangles showthe relevant SFE values for the given steels. The cross-hatched areasare ranges of TOI that result in a lower number of CMn6 clusters.
METALLURGICAL AND MATERIALS TRANSACTIONS A VOLUME 43A, MAY 2012—1701

that the reduction of twinning may have a positiveimpact by increasing fracture elongation.
F. A Commentary Concerning Austenite Grain Sizeand SFE Value
By consideration of the microstructural evolution andtwinning activity in the finest grain-size regime of steelE5 (D1 with the average value of about 2 lm) inFigure 16, as also suggested by other investigators,[78]
together with the increase in the work-hardening ratelevel by grain refinement in Figure 13(b), the previouslyproposed role of grain size on the SFE value (increase ofSFE by grain refinement)[5,21,79] is doubted. By compar-ing Figures 13(a) and (b), it is seen that the decrease ofSFE by decreasing temperature has almost the sameinfluence as grain refinement on increasing the work-hardening rate level. It is concluded that the SFE valueis mainly changed by variations in chemical compositionand temperature. The grain-size effect, on the otherhand, is mostly observed with respect to the changes inthe activation or saturation of deformation twinning inTWIP steels (Figures 14 and 15). In addition, the effectof grain size on the twinning stress according to theHall–Petch relationship was reported.[78]
G. Work-hardening Rate Diagrams of TWIP Steels:Stages and Mechanisms
The discussed effects of SFE, deformation tempera-ture, austenite grain size, applied strain rate, and TOI onthe work-hardening rate diagrams of TWIP steels aresummarized in the schematic diagram shown in Fig-ure 20. The deformation twinning in TWIP steelsreportedly happens in the early moments of plasticdeformation,[60,61] which has been marked as stage A.As explained earlier (Figure 13(b)), in the case of coarse-grained regimes, the activation of non-coplanar twinsystems can happen in the onset of stage B. Thisobservation is in contrast with the steps suggested byAsgari et al.,[80] in which stages C and D are describedas the times where twin intersection and twinning ratedecrease are most likely to occur. The onset of stage Bwas shifted to lower values of strain by increasing thegrain size, which can be related to the sudden burst ofdeformation twinning in the coarse-grained regime. Thedecrease of SFE, deformation temperature, appliedstrain rate, and grain size, together with the increaseof TOI (for TOI< 0.3), results in an increased work-hardening rate level in stage B. Finally, the increase oftemperature, which increases the SFE as well, and anintermediate grain size regime (of approximately 20 to30 lm) improve the fracture strain. However, it must bepointed out that the increase of SFE is not a universalpredictor of better plasticity, as the addition of alumi-num to L2 steel slightly compromised the plasticity,despite increasing the SFE value.
A very recent elaborate work by Gutierrez-Urrutiaand Raabe[81] on Fe-22 wt pct Mn-0.6 wt pct C TWIPsteel illustrated five main domains for the work-hard-ening rate diagrams (Figure 21): (a) initial downhill,which is mostly controlled by the dynamic recovery; (b)
evolution of the dislocation substructures (work-hard-ening rate of about G/40); (c) cutting of dislocationsubstructures by twin boundaries, which continues up tostage (d); (d) definition of the maximum work-hardeningrate (G/30, which is close to the values reported forHadfield steels); and (e) final downhill of the work-hardening rate due to an increased dislocation densityand the presence of twin bundles as barriers against thecontinuation of plastic deformation.[81] The shape of thework-hardening rate diagrams of TWIP steels E1 andE2 (Figure 5), L3 and L4 (Figure 10(b)), and E5 and E6(Figures 11(b) and 13) clearly include the proposedstages of the work hardening by Gutierrez-Urrutia andRaabe,[81] which might be considered as a hint to assume
Fig. 20—Schematic representation of variations in the work-harden-ing rate diagrams caused by changing the SFE value, the deforma-tion temperature (T), the austenite grain size, the applied strain rate_eð Þ, and the TOI value.
Fig. 21—Different stages of work hardening and the relevant micro-structural phenomena in Fe–22 wt pct Mn–0.6 wt pct C TWIP steel,as described by Gutierrez-Urrutia and Raabe.[81] G in the diagramstands for the shear modulus.
1702—VOLUME 43A, MAY 2012 METALLURGICAL AND MATERIALS TRANSACTIONS A

their given reasoning to be plausible in a broad range ofTWIP steel compositions. However, further research isrequired to validate experimentally the consistency ofthe mentioned microstructural features during the plas-tic deformation of different TWIP steels.
VI. CONCLUSIONS
Based on the given methodology in the present workand by consideration of a group of ten high-manganeseTWIP steels, the work-hardening behavior of this groupof materials was investigated. The following results wasdemonstrated.
1. A unified approach in terms of deformation twin-ning (controlled by SFE) together with DSA andplanar dislocation glide (controlled by SRO of man-ganese and carbon atoms) was required to explainthe variations in the work-hardening rate diagramsof TWIP steels across an extensive range of chemi-cal compositions within the Fe-Mn-C and Fe-Mn-Al-C systems.
2. The previously proposed mechanism maps wereupdated using the parameters extracted from theSGTE dataset, and by including the dimensionlessTOI parameter to account for the variations in thework-hardening rate diagrams of iso-SFE TWIPsteels. Second, it was shown that the shortage ofcarbon in the TOI range below 0.1 and the shortageof manganese in the TOI range above 0.3 coulddecrease the strengthening that was otherwiseachieved by the interaction of dislocations withSRO.
3. The increase of temperature or grain size wasshown to reduce the work-hardening because ofeither the limitation of deformation twinning(because of increase in the SFE value) or the sud-den burst and saturation of deformation twinning(in the coarse-grained regime).
4. The low SFE value, in general, increased the work-hardening rate and caused the earlier onset of stageC. The increase of SFE (by increasing the tem-perature or the manganese and carbon content)improved the fracture strain, despite the decrease ofthe work-hardening rate, which was in contrast withthe published results concerning the effect of alumi-num (which increases the SFE as well) in TWIPsteels. This contradiction could be related to therole of aluminum in limitation of the DSA mecha-nism and not necessarily its effect on the SFE value,which requires further investigation.
ACKNOWLEDGMENT
The authors gratefully acknowledge the financialsupport of the Deutsche Forschungsgemeinschaft(DFG) within the Collaborative Research Center(SFB) 761 ‘‘Steel–ab initio.’’
REFERENCES1. G. Frommeyer and U. Brux: Steel Res. Int., 2006, vol. 77, pp. 627–
33.2. O. Grassel, L. Kruger, G. Frommeyer, and L.W. Meyer: Int. J.
Plast., 2000, vol. 16, pp. 1391–1409.3. S. Allain, J.-P. Chateau, and O. Bouaziz:Mater. Sci. Eng. A, 2004,
vols. 387–389, pp. 143–47.4. O. Bouaziz, S. Allain, and C. Scott: Scripta Mater., 2008, vol. 58,
pp. 484–87.5. A. Saeed-Akbari, J. Imlau, U. Prahl, and W. Bleck:Metall. Mater.
Trans. A, 2009, vol. 40A, pp. 3076–90.6. J. Nakano and P.J. Jacques: CALPHAD, 2010, vol. 34, pp. 167–
75.7. S. Curtze, V.T. Kuokkala, A. Oikari, J. Talonen, and H. Hanni-
nen: Acta Mater., 2011, vol. 59, pp. 1068–76.8. O. Bouaziz, C.P. Scott, and G. Petitgand: Scripta Mater., 2009,
vol. 60, pp. 714–16.9. J.W. Christian and S. Mahajan: Prog. Mater. Sci., 1995, vol. 39,
pp. 1–157.10. H. Idrissi, L. Ryelandt, M. Veron, D. Schryversa, and P.J.
Jacques: Scripta Mater., 2009, vol. 60, pp. 941–44.11. L. Remy: Scripta Metall. Mater., 1977, vol. 11 (3), pp. 169–72.12. L. Remy: Acta Metall., 1978, vol. 26, pp. 443–51.13. L. Remy and A. Pineau: Mater. Sci. Eng. A, 1977, vol. 28, pp. 99–
107.14. S. Mahajan and G.Y. Chin: Acta Metall., 1973, vol. 21, pp. 1353–
63.15. S. Kibey, J.B. Liu, D.D. Johnson, and H. Sehitoglu: Acta Mater.,
2007, vol. 55, pp. 6843–51.16. H. Idrissi, K. Renard, D. Schryvers, and P.J. Jacques: Scripta
Mater., 2010, vol. 63, pp. 961–64.17. H. Idrissi, K. Renard, L. Ryelandt, D. Schryvers, and P.J. Jacques:
Acta Mater., 2010, vol. 58, pp. 2464–76.18. G. Frommeyer, U. Brux, and P. Neumann: ISIJ Int., 2003, vol. 43
(3), pp. 438–46.19. H. Ding, Z. Tang, W. Li, M. Wang, and D. Song: J. Iron Steel
Res. Int., 2006, vol. 13 (6), pp. 66–70.20. A. Saeed-Akbari: Mechanism Maps, Mechanical Properties, and
Flow Behavior in High-Manganese TRIP/TWIP and TWIP Steels,Shaker Verlag, Aachen, 2011.
21. Y.K. Lee and C.S. Choi: Metall. Mater. Trans. A, 2000, vol. 31A,pp. 355–60.
22. G. Dini, A. Najafizadeh, R. Ueji, and S.M. Monir-Vaghefi:Mater.Sci. Eng. A, 2010, vol. 527, pp. 2759–63.
23. T.S. Byun: Acta Mater., 2003, vol. 51, pp. 3063–71.24. O. Bouaziz and N. Guelton: Mater. Sci. Eng. A, 2001, vols. 319–
321, pp. 246–49.25. L. Chen, Han-soo Kim, Sung-Kyu Kim, and B.C. De-Cooman:
ISIJ Int., 2007, vol. 47, pp. 1804–12.26. P.H. Adler, G.B. Olsen, and W.S. Owen: Metall. Trans. A, 1986,
vol. 17A, pp. 1725–37.27. L.G. Stepanskiy: Scripta Mater., 2009, vol. 61, pp. 947–50.28. V. Gerold and H.P. Karnthaler: Acta Metall., 1989, vol. 37,
pp. 2177–83.29. J.D. Yoo and K. Park:Mater. Sci. Eng. A, 2008, vol. 496, pp. 417–
24.30. J.D. Yoo, S.W. Hwang, and K. Park: Mater. Sci. Eng. A, 2009,
vol. 508, pp. 234–40.31. K. Choi, C. Seo, H. Lee, S.K. Kim, J.H. Kwak, K.G. Chin, K.
Park, and N.J. Kim: Scripta Mater., 2010, vol. 63, pp. 1028–31.32. Y.N. Dastur and W.C. Leslie: Metall. Trans. A, 1981, vol. 12A,
pp. 749–59.33. B.K. Zuidema, D.K. Subramanyam, and W.C. Leslie: Metall.
Mater. Trans. A, 1987, vol. 18A, pp. 1629–39.34. T. Shun, C.M. Wan, and J.G. Byrne: Acta Metall. Mater., 1992,
vol. 50 (12), pp. 3407–12.35. J. Kim, L. Chen, H. Kim, S.K. Kim, Y. Estrin, and B.C.
De-Cooman:Metall. Mater. Trans. A, 2009, vol. 40A, pp. 3147–58.36. J. Kim, S.J. Lee, and B.C. De-Cooman: Scripta Mater., 2011,
vol. 65, pp. 363–66.37. K. Renard, S. Ryelandt, and P.J. Jacques: Mater. Sci. Eng. A,
2010, vol. 527, pp. 2969–77.38. E. Bayraktar, C. Levaillant, and S. Altintas: J. Phys. IV, 1993,
vol. 3, pp. 61–66.
METALLURGICAL AND MATERIALS TRANSACTIONS A VOLUME 43A, MAY 2012—1703

39. Annual Book of ASTM Standards, ASTM INTERNATIONAL,Philadelphia, PA, 2004, vol. 3, No. 01, E112-96, p. 227.
40. A.T. Dinsdale: CALPHAD, 1991, vol. 15 (4), pp. 317–425.41. S. Allain, J.-P. Chateau, O. Bouaziz, S. Migot, and N. Guelton:
Mater. Sci. Eng. A, 2004, vol. 387389, pp. 158–62.42. A.S. Hamada: Doctoral Thesis, University of Oulu, Oulu, Fin-
land, 2007.43. S. Vercammen: Doctoral Thesis, Katholieke Universiteit Leuven,
Leuven, Belgium, 2004.44. O. Bouaziz, S. Allain, C.P. Scott, P. Cugy, and D. Barbier: Curr.
Opin. Solid St. M., 2011, vol. 15 (4), pp. 141–68.45. I. Karaman, H. Sehitoglu, Y.I. Chumlyakov, and H.J. Maier:
JOM, 2002, July, pp. 31–37.46. H. Suzuki: J. Phys. Soc. Jpn., 1962, vol. 17 (2), pp. 322–25.47. I. Karaman, H. Sehitoglu, Y.I. Chumlyakov, H.J. Maier, and I.V.
Kireeva: Scripta Mater., 2001, vol. 44, pp. 337–43.48. Y.N. Petrov: Scripta Mater., 2005, vol. 53, pp. 1201–06.49. K.T. Park, K.G. Jin, S.H. Han, S.W. Hwang, K. Choi, and C.S.
Lee: Mater. Sci. Eng. A, 2010, vol. 527, pp. 3651–61.50. W.S. Owen and M. Grujicic: Acta Mater., 1999, vol. 47 (1),
pp. 111–26.51. J. Kim, Y. Estrin, H. Beladi, S. Kim, K. Chin, and B.C. De
Cooman: Mater. Sci. Forum, 2010, vol. 654656, pp. 270–73.52. Y. Estrin and L.P. Kubin: Acta Metall., 1986, vol. 34, pp. 2455–
64.53. L.P. Kubin and Y. Estrin: Acta Metall., 1990, vol. 38, pp. 697–708.54. O. Bouaziz, H. Zurob, B. Chehab, J.D. Embury, S. Allain, and M.
Huang: Mater. Sci. Technol., 2011, vol. 27 (3), pp. 707–09.55. J. von Appen and R. Dronskowski: Steel Res. Int., 2011, vol. 82
(2), pp. 101–07.56. E.P. Kwon, S. Fujieda, K. Shinoda, and S. Suzuki: Mater. Sci.
Eng. A, 2011, vol. 528, pp. 5007–17.57. R. Petrov, L. Kestens, A. Wasilkowska, and Y. Houbaert: Mater.
Sci. Eng. A, 2007, vol. 447, pp. 285–97.58. A. Weidner, S. Martin, V. Klemm, U. Martin, and H. Biermann:
Scripta Mater., 2011, vol. 64, pp. 513–16.59. D.R. Steinmetz and S. Zaefferer: Mater. Sci. Technol., 2010,
vol. 26 (6), pp. 640–45.60. D. Barbier, N. Gey, S. Allain, N. Bozzolo, and M. Humber:
Mater. Sci. Eng. A, 2009, vol. 500, pp. 196–206.
61. A.S. Hamada, L.P. Karjalainen, A. Ferraiuolo, J.G. Sevillano,F.D.L. Cuevas, G. Pratolongo, and M. Reis:Metall. Mater. Trans.A, 2010, vol. 41A, pp. 1102–08.
62. M.R. Barnett: Scripta Mater., 2008, vol. 59, pp. 696–98.63. Y.N. Petrov: Z. Metallkd., 2003, vol. 94 (9), pp. 1012–16.64. A. Dumay, J.-P. Chateau, S. Allain, S. Migot, and O. Bouaziz:
Metall. Mater. Trans. A, 2008, vols. 483–484, pp. 184–87.65. L. Remy, A. Pineau, and B. Thomas: Mater. Sci. Eng., 1978,
vol. 36, pp. 47–63.66. G.W. Han, I.P. Jones, and R.E. Smallman: Acta Mater., 2003,
vol. 51, pp. 2731–42.67. A. Herschitz and D.N. Seidman: Acta Metall., 1985, vol. 33 (8),
pp. 1547–63.68. J.C. Fisher: Acta Metall., 1954, vol. 2 (3), pp. 368–69.69. P.A. Flinn: Acta Metall., 1958, vol. 6 (10), pp. 631–35.70. S. Asgari, E. El-Danaf, E. Shaji, S.R. Kalidindi, and R.D. Doh-
erty: Acta Mater., 1998, vol. 46 (16), pp. 5795–5806.71. Y. Tomokiyo, N. Kuwano, and T. Eguchi: Trans. JIM, 1975,
vol. 16, pp. 489–99.72. G. Thomas: Acta Metall., 1963, vol. 11, pp. 1369–71.73. J.M. Popplewell and J. Crane: Metall. Trans., 1971, vol. 2,
pp. 3411–20.74. I. Karaman, H. Sehitoglu, H.J. Maier, and Y.I. Chumlyakov: Acta
Mater., 2001, vol. 49, pp. 3919–33.75. J.W. Christian: The Theory of Transformations in Metals and
Alloys, 1st ed., Pergamon Press Ltd., Oxford, United Kingdom,1965, pp. 743–77.
76. R. Ueji, N. Tsushida, D. Terada, N. Tsuji, Y. Tanaka, A.Takemura, and K. Kunishige: Scripta Mater., 2008, vol. 59,pp. 963–66.
77. B.X. Huang, X.D. Wang, and Y.H. Rong: Metall. Mater. Trans.A, 2008, vol. 39A, pp. 717–24.
78. I. Gutierrez-Urrutia, S. Zaefferer, and D. Raabe: Mater. Sci. Eng.A, 2010, vol. 527, pp. 3552–60.
79. P.Y. Volosevich, V.N. Grindnev, and Y.N. Petrov: Phys. Met.Metallogr., 1976, vol. 42, pp. 126–30.
80. S. Asgari, E. El-Danaf, S.R. Kalidindi, and R. Doherty: Metall.Mater. Trans. A, 1997, vol. 28A, pp. 1781–94.
81. I. Gutierrez-Urrutia and D. Raabe: Acta Mater., 2011, vol. 59,pp. 6449–62.
1704—VOLUME 43A, MAY 2012 METALLURGICAL AND MATERIALS TRANSACTIONS A