Lending Technologies in Italy: an Example of Hardening of Soft Information
27
1 Lending Technologies in Italy: an Example of Hardening of Soft Information? Pierluigi Murro * Abstract In questo articolo si studia il rapporto tra l’impresa e la sua banca principale in un ampio campione di imprese manifatturiere italiane. I risultati mostrano che le imprese ricevono credito attraverso differenti tecnologie di finanziamento. Questa complementarietà tra tecnologie sembra avere una base informativa, infatti la presenza della soft information risulta essenziale nella scelta di ciascuna tecnologia. Questo risultato conferma quel filone della letteratura che sottolinea la presenza di un processo di hardening of soft information, ossia la possibilità che anche le banche transazionali siano in grado di utilizzare l’informazione qualitativa, normalmente considerata una prerogativa delle banche relazionali, per concedere il credito alle imprese. We study the firm-main bank relationship in a large sample of Italy’s manufacturing enterprises. Our results show that the same firm tends to receive credit via different lending technologies. This complementarity across technologies may have an information basis, because the use of soft information is crucial for each lending technology. This supports the hardening-of-soft- information view, whereby also transactional lenders might somehow use difficult to codify qualitative information – traditionally believed a prerogative of relational banks – on borrowing enterprises. Key words: Lending technology, Transactional lending, Relationship lending and Small-and- medium sized enterprises JEL Classification: G21, L14, L22 * University of Bari (e-mail: [email protected] ).
Transcript of Lending Technologies in Italy: an Example of Hardening of Soft Information

1
Lending Technologies in Italy: an Example of Hardening of Soft Information?
Pierluigi Murro*
Abstract
In questo articolo si studia il rapporto tra l’impresa e la sua banca principale in un ampio
campione di imprese manifatturiere italiane. I risultati mostrano che le imprese ricevono credito
attraverso differenti tecnologie di finanziamento. Questa complementarietà tra tecnologie
sembra avere una base informativa, infatti la presenza della soft information risulta essenziale
nella scelta di ciascuna tecnologia. Questo risultato conferma quel filone della letteratura che
sottolinea la presenza di un processo di hardening of soft information, ossia la possibilità che
anche le banche transazionali siano in grado di utilizzare l’informazione qualitativa,
normalmente considerata una prerogativa delle banche relazionali, per concedere il credito alle
imprese.
We study the firm-main bank relationship in a large sample of Italy’s manufacturing enterprises.
Our results show that the same firm tends to receive credit via different lending technologies.
This complementarity across technologies may have an information basis, because the use of
soft information is crucial for each lending technology. This supports the hardening-of-soft-
information view, whereby also transactional lenders might somehow use difficult to codify
qualitative information – traditionally believed a prerogative of relational banks – on borrowing
enterprises.
Key words: Lending technology, Transactional lending, Relationship lending and Small-and-
medium sized enterprises
JEL Classification: G21, L14, L22
* University of Bari (e-mail: [email protected]).

2
Lending Technologies in Italy: an Example of Hardening of Soft Information?
Abstract
We study the firm-main bank rapport in a large sample of Italy’s manufacturing
enterprises. Our results show that the same firm tends to receive credit via different
lending technologies. This complementarity across technologies may have an
information basis, because the use of soft information is crucial for each lending
technology. This supports the hardening-of-soft-information view, whereby also
transactional lenders might somehow use difficult to codify qualitative information
– traditionally believed a prerogative of relational banks – on borrowing
enterprises.
1. Introduction
The choice of lending technology is a key component for the strategy of a small and
medium-sized enterprise (SME). Berger and Udell (2006) hold that lending
technologies play a key role as the conduit through which government policies and
national financial structures affect SME credit availability. These authors define a
lending technology as a unique combination of primary information source, screening
and underwriting policies/procedures, loan contract structure, and monitoring
strategies/mechanisms.
The mainstream literature generally distinguishes two ways in which SMEs are
financed by banks, depending on the type of information which is exchanged between
the firm and the bank. A transaction-based lending technology refers to a firm-bank
report in which the bank obtains from the borrowing firm “hard” type information, that
is quantitative in nature and, so, easily transferable. At the other extreme, a relationship
lending technology hinges on “soft” information, that is qualitative information that are
normally obtained via long-term informal/personal interaction and are, therefore, much
more difficult to transfer. Because of this, the academic literature views the “transaction
lending” technology as more desirable for relatively informationally transparent firms,
while judging the “relationship lending” technology to be more appropriate for
comparatively opaque firms (suffering more intense asymmetries of information).
Although this taxonomy is quite useful and interesting from a theoretical point of
view, its validity has been questioned on empirical grounds. In fact, this classification
derives from the idea that there are two types of production functions which use distinct
inputs: hard and soft information. However, the nature of information is not
exogenously fixed. The lenders practices of the latest years show us that it may be
possible to change the nature of information.

3
Berger and Udell (2006) underline that many banks lend to opaque SMEs by means
of transaction-based lending technologies, thereby dealing with informational
asymmetries by means of “hard” information. In fact, where no detailed and trustworthy
financial accounts are available, the large banks may often use other “hard” type
information to assess the probability that the enterprise will repay the loans it was
granted. This approach was tested by Uchida et al. (2006) investigating the choice of the
lending technologies on data for Japan. They found there is complementarity among
technologies. According to the authors, this result suggests that the banks, even though
possibly employing mainly some specific criteria to lend, might be using the various
lending technologies at the same time.
An alternative interpretation is that the “transactional” lending technologies have
become better substitutable to the “relational” ones, which could also explain the joint
adoption of different lending technologies at the same customers. For instance, Petersen
(2004) conjectures that transactional lenders might be able to “harden” soft information
to boost their local competitive behavior and allow them to compete more aggressively
outside core markets.
In the present paper, we utilize a novel component of survey micro-data allowing us
to learn the lending technology used by the firm’s main bank. The data refer to the end
of 2006 and come from the Tenth Survey of Italian Manufacturing Enterprises runs by
UniCredit Group. Based on these questions, we created four lending technology indices
which correspond to three transaction-based lending technologies and the one
relationship lending technology: (1) financial statement lending, (2) real estate lending,
(3) other fixed-asset lending; and (4) relationship lending. These indices represent the
extent to which a bank loan bears the characteristics of each of the four lending
technologies.
We first investigate (i) to what extent different lending technologies are used in terms
of the presence in the loan market, i.e., the level of usage of the four lending
technology. We then look into (ii) how complementary these technologies are. This
analysis focuses on the degree of correlation among the four indices. Finally, we
investigate by regression analysis (iii) what determines the choice of each technology.
Our dependent variables in these regressions are the four lending technologies as
measured by our indices. Our key independent variables of interest are the type of bank
lender and the availability of different kinds of information.

4
In line with the results obtained for Japan, we find indications of complementarity
among the various lending technologies, as the same firm obtains bank loans through
the various technologies. The existence of this complementarity makes it difficult to
identify the determinants of using a lending technology as an alternative to the others.
Nevertheless, we can notice that the use of soft information is strongly associated with
the bank’s reliance on the relationship lending and financial statement lending, although
it seems to be important for all the lending technologies. These results help us interpret
the complementarity among the technologies that was already suggested previously. We
may label this “information complementarity”, since it turns out that SOFT is
significant for all the four technologies. This outcome seems consistent with the
possibility of hardening soft information.
In the rest of the paper section 2 briefly discusses the literature on the ways for the
SMEs to obtain external finance. Section 3 is devoted to present the dataset we use,
explaining also our methodology to construct the variables we employ. In section 4 we
run our econometric analysis and show our main results. Section 5 concludes the paper.
2. Survey of the Literature
Among the various lending technologies used to finance SMEs, the literature has
thus far focused on two classes: transaction-based lending technologies and
relationship lending technologies. These two classes can be primarily distinguished by
means of the type of information a bank uses in granting and monitoring the loan.
Transaction-based lending technologies are typically based (primarily) on “hard”
quantitative information (e.g. those derived from the borrowers’ balance sheets and/or
the collateral guarantees they offer), while instead relationship lending assigns a key
role to “soft” information (difficult to codify qualitative information obtained via
personal interaction/acquaintance).
Both the theoretical and the empirical literature have mainly focused on the
characteristics and the possible pros/cons of “relationship lending”. This is, in fact,
considered the most appropriate technology to lend to firms with significant
informational asymmetries, as a tighter firm-bank relationship helps overcome those
informational asymmetries, improving the efficiency of the bank’s allocation of loans.
Boot (2000) defines relationship lending as “the provision of financial services by a
financial intermediary that: i. invests in obtaining customer-specific information, often
proprietary in nature; and ii. evaluates the profitability of these investments through

5
multiple interactions with the same customer over time and/or across products”. The
definition hinges on two crucial aspects: eliciting the release of “proprietary”
information from the client to the bank and the presence of multiple interactions
between the two parties.
The empirical research tried to test the results derived from the theoretical models. In
particular, several papers have analyzed – in various countries – the impact
“relationship lending” has on the financing of the SMEs. For the US, Berger and Udell
(1995) show that a longer firm-bank relationship lowers the cost of credit and reduces
also the requirements of collateral guarantees. On data for Italy, Angelini et al. (1998)
find that the intensity of “relationship banking” reduces the probability that borrowing
firms will be rationed, even though the lending rates charged by the banks tend to
increase as the firm-bank relationship lengthens. For Belgian enterprises, Degryse and
Van Cayseele (2000) detect the impact relationship banking along two different
dimensions: borrowing rates increase as the firm-bank relationship lengthens, while
borrowing rates decrease when the scope of the firm-bank relationship – defined as the
purchase of additional information intensive services (other than the loan) – increases.
Recently, both the theoretical and the empirical strands of the literature analyze also
the transaction-based lending technologies. Often, the literature has used the transaction
lending label for any type of loan based on information that is easily verifiable by
anybody. Instead now some authors underline that transaction lending is not a single
homogeneous lending technology. There are a number of distinct transaction
technologies used by financial institutions. Berger and Udell (2006) suggest that into
transactions technologies are including financial statement lending, small business
credit scoring, asset-based lending, factoring, fixed-asset lending, and leasing. The
authors briefly define and describe each of the lending technologies, highlight its
distinguishing features, and show how the technology addresses the opacity problem.
Each technology is distinguished by a unique combination of the primary source of
information, screening and underwriting policies/procedures, structure of the loan
contracts, and monitoring strategies and mechanisms.
Also the empirical literature tries to explain the characteristics of the each
technology. There are a number of studies on each individual technology in isolation.
For example, Berger and Frame (2006) study credit scoring and Udell (2004) asset-
based lending. However, most of these studies focus only on one lending technology
without consideration of other technologies.

6
Differently from these studies, Uchida et al. (2006), utilizing survey micro-data on
Japanese SMEs, tested the importance of the various “lending technologies” proposed
by Berger and Udell (2006). Specifically, they consider four lending technologies:
financial statement lending, real estate lending, other fixed-asset lending, and
relationship lending. Using the responding firm’s answer to the question as to which
were – in the firm’s own view – the criteria followed by its main bank to grant its loans,
the authors created a distinct index for each of those four lending technologies.
Analyzing econometrically the determinants of each index, the authors find there is
complementarity among the indices of the four technologies. This result suggests that
the banks, even though possibly employing mainly some specific criteria to lend, tend to
use the various lending technologies at the same time.
Although the literature generally distinguishes the lending technologies on the basis
of the type of information which is exchanged between the firm and the bank, some
contributions have been exploring the ability of harden soft information. In the previous
literature, the idea has been that there are two types of production functions which use
distinct inputs: hard or soft information. However, Petersen (2004) highlights that the
nature of information is not exogenously fixed. This is a simplification. The lenders
practices of the latest years show us that it may be possible to change the nature of
information.
The development of credit scoring is a typical example of the lenders’ ability to
harden soft information. The results in Agarwal and Hauswald (2006) verify the
conjecture in Petersen and Rajan (2002) that technological progress in the form of credit
scoring allows banks to overcome distance-related limits to lending through the
hardening of soft information. Berger and Frame (2007), using a survey conducted by
the Federal Reserve Bank of Atlanta in 1998, show that banks tend to use the credit
scoring technology in very different ways to achieve quite different objectives. In some
cases, banks use “rules” to automatically accept/reject credit applicants and to set credit
terms based on purchased credit scores. Other institutions use more of their own
“discretion” by adding credit scores to information gathered through one or more of the
other lending technologies (i.e. relationship lending). The motives for these banks are
likely to reduce opacity problems and set the credit terms more accurately to reduce
future credit losses. Some contributions suggest that “discretion” banks are successful in
lowering the reported risk and lengthening the maturity of their small business credits.
Albareto et al. (2008), reporting the results of an Italian survey conducted by Bank of

7
Italy in 2007, illustrate that medium and large banks use soft information (like
qualitative information on the firm’s governance) in their credit scoring models.
Finally, are interesting the results in Bartoli et al. (2010), based on the same survey
that we use. The authors show that, although the same firm tends to receive credit via
different lending technologies, the soft information variable lowers (raises) the
probability of rationing if the firm’s main bank uses relationship (transactional) lending
technologies. Thus, it appears that the way the soft information becomes embodied in
the lending decision might still differ between relational vs. transactional
banks/technologies.
3. Data and Methodology
3.1 Presenting the Dataset and Some Descriptive Statistics
Our main data source is the Tenth Survey on Italian Manufacturing Firms (SIMF),
runs by the Unicredit banking group in 2007. Every three years this survey gathers data
on a sample of Italian manufacturing firms having more than 10 employees. The 2007
wave consists of 5,137 enterprises. All the firms with more than 500 employees are
included, while those having a number of employees in the range 11 to 500 are sampled
according to a stratified selection procedure based on their size, sector, and geographic
localization. The main strength of this database depends on the very detailed
information it collects on individual firms. In particular, the 2007 wave features
information regarding the firm’s: a) ownership structure; b) number and skill degree of
employees; c) attitude to invest in R&D and whether it has made innovations; d) extent
of internationalization and exports; e) quality of the financial management and
relationships with the banking system. This information is gathered through a survey on
the three years previous to the survey year (thus, for the wave we use data go from 2004
to 2006).
The firms in the sample cover approximately 9% of the reference universe in terms
of employees and some 10% in terms of value added. Thanks to its stratification, the
sample is highly representative of the economic structure of Italian manufacturing.
Table 2 presents some descriptive statistics. At the mean, the surveyed firms have been
in business for 22 years; beyond 60% of them have fewer than 50 employees (below 4%
of the firms have more than 500 employees); 70% of them are localized in the North.
Only 1% are listed in the Stock Exchange, while 37% have their profit/loss and

8
financial statements certified by external auditors. As to sectoral specialization, almost
half of the enterprises belong to traditional sectors, according to the Pavitt classification,
while only 5% have their business in the high tech sectors.
Moving on their financial set up, the average length of the relationship with the main
bank is 17 years; 49% of the firms have a national bank as their main banking
counterpart, 10% entrust a banca popolare (larger-sized cooperative banks), 7% feature
a savings bank as their main bank, 5% entrust a banca di credito cooperativo (smaller-
sized cooperative mutual banks), while 28% of the firms have another type of bank as
their main bank. Finally, there is extensive multiple banking: on average firms have five
banks and the share of loans obtained from the main bank is 32% of the total banking
loans received.
Particularly relevant for our analysis, the 2007 wave of the survey features a
peculiarity with respect to the previous waves. Specifically, an entirely new set of
questions was introduced (partly inspired by an analogous detailed survey on SME
financing run in Japan, see Uchida et al. 2006; 2008), expressly tailored to investigate in
depth the relationship between the firm and its main bank. In this paper we will
particularly focus on two questions where the firm is asked to state which of the
characteristics – choosing from a given list – have been important in the firm’s selection
of its main bank, as well as stating which characteristics, in the firm’s view, best
describe the way its main bank grants credit. Unsurprisingly, given the fact that this
section of the survey required dedication, only one third of the total number of surveyed
enterprises (exactly 1,541 firms) answered these questions. Table 3 reports descriptive
statistics for this sub-sample of enterprises. We cannot rule out self-selection. In other
words, it is possible that the choice by a firm to answer this part of the questionnaire
was not random.
3.2 Construction of the Lending Technology Indices
We first characterize actual loans from a lending technology point of view. We
consider four indicators of lending technology similar to those in Uchida et al. (2006).
The indices are constructed to represent to what extent the relevant loans have
characteristics of different lending technologies. We capture these characteristics
inspecting the answers to the question “In your view, which criteria does your bank
follow in granting loans to you?”. In answering this question the firm was required to
give a weight (going, in descending order, from 1, very much, to 4, nil) to fifteen factors

9
(see the Appendix). Most of these factors are related to one of the lending technologies.
We then link the factors that we believe to be most closely associated with each lending
technology based on the Berger and Udell (2006) classification scheme. For reason of
comparability of our results with those in Uchida et al. (2006), we focus only on four
lending technologies from this classification.1
First, financial statement lending, is a transactions technology based primarily on the
strength of a borrower’s financial statements. Berger and Udell (2006) hypothesize that
banks underwrite commercial loans using the financial statement lending technology for
firms with a strong financial condition based on an assessment of verified (i.e., audited)
financial statements. From the list of fifteen criteria shown in the Appendix, we use the
initial four. These factors (financial solidity, profitability, growth of sales and ability of
the firm to repay its debt) represent qualities that are best assessed by an analysis of the
firms’ audited financial statements. From these four factors we created the financial
statement lending index, LT_FS, by calculating the average of the four dummy
variables which take a value of one if the firm answered 1 (very much) to the four
relevant lending factors, respectively. The virtue of using an average index is that it can
be directly compared with the other (averaged) indices, as we explain below, since all
the indices are constructed from dummy variables and thus take a value in the [0,1]
range.2
Next, we focus on fixed-asset lending. Fixed-asset lending technologies involve
lending against assets that are long-lived and are not sold in the normal course of
business (e.g., equipment, motor vehicles, or real estate). The factors that are related to
fixed-asset lending are items 5, 6 and 8. Keeping the distinction in Uchida et al. (2006),
we make a clear difference between real estate lending and other fixed-asset lending,
and so we construct two indices. The first, LT_RE, is a dummy variable that take the
value one if the firm answered 1 (very much) to lending factor no. 5. Second, LT_OF, is
an average of the two dummy variables which take a value of one if the firm answered
1 (very much) to lending factors no. 6 and 8, respectively.3
1 As mentioned above, Berger and Udell (2006) list six transaction-based lending technologies: (i)
financial statement lending, (ii) small business credit scoring, (iii) asset-based lending, (iv) factoring, (v)
fixed-asset lending, and (vi) leasing, together with relationship lending. 2 We also conducted preliminary analysis using the first principal component of the principal component
analysis over the dummy variables. Because the results were qualitatively the same, and because we
cannot easily compare these indices with each other, we only report results with the averaged indices. 3 Note that the basic technology used in real estate lending and other fixed-asset lending is the same, and
the distinction is solely based on the type of collateral.

10
Finally, we consider the relationship lending technology. Under relationship lending,
the financial institution relies primarily on soft information gathered through contact
over time with the SME, its owner and the local community to address the opacity
problem. We construct the relationship lending index, LT_RL, using the factors that
seem most related to soft information accumulation by banks through close
relationships. The index is an average of six dummy variables which take a value of one
if the firm answered 1 (very much) to lending factors, no. 9, 10, 11, 13, 14 and 15,
respectively.
These indices are not likely to be perfect proxies for the use of different lending
technologies, since they are based on the borrowers’ perception of the lending factors
used by the bank in underwriting its loans, and thus may not be precisely capturing the
banks’ screening process. However, this methodology of constructing the indices of
lending technologies has some advantages. We manage to perceive the actual features
of the bank (in the firm’s view) at the time the firm is asked. No such information was
available in the prior literature.
3.3 Methodology
In our analysis we will investigate the characteristics of the SME lending
technologies in Italy. Comparing across the various lending technology indices, we will
ascertain which one is more widespread. In addition, bearing in mind the results in
Uchida et al. (2006) referring to the Japanese market, we will analyze the degree of
complementarity among the various technologies, by looking at the correlation among
the indices as well as via a multivariate regressions of the indices. However, the most
important aspect pertaining to the study of the features of the SME lending technologies
regards identifying which factors affect the choice among these technologies.
We run regressions in which the four lending technology indices introduced above
are used as dependent variables. We use the following equation:
Lending Technologyiz = + 1 Softi + 2 Auditi + 3 Locali + 4 Agei + 5 Age-squaredi + 6
Sizei + 7 Performance_DSi + 8 Performance_SDi + 9 Performance_DDi + 10 Centeri + 11
Southi + 12 HHi + 13 Branchi + 14 Leveragei + 15 ROAi + 16 GDPi + 17 Corporationi + 18
SITC5i + 19 SITC4i + 20 SITC3i +
14
1J
ijj Sector + ui (1)

11
where i = 1, …, N represents the firm, j = 1, …, 14 is the economic activity sector, and
z = financial statement, real estate, other fixed-asset and relationship lending.
The lending index for firm i depends on characteristics of the lender and of the
borrowing SME that affect the feasibility and efficacy of each individual lending
technology. Hence, the variables that we use are a proxy for the inputs of the
technologies. We may separate these variables among bank complexity, nature of
information, bank competition, and firm characteristics.
We first classify banks into two types: LARGE banks and LOCAL banks. LARGE is
a dummy variable that takes value one if the main bank is a national bank or a foreign
bank. In turn, LOCAL is also a dummy taking value one if the main bank is a banca di
credito cooperativo, banca popolare, a saving bank or “other type of bank”.
Next we control for the availability of hard and soft information. The variable that
we use for hard information is AUDIT, a dummy variable that takes value one if the
firm has its financial statements audited. Instead, for the soft information, we employ a
methodology used by Scott (2004) and Uchida et al. (2006), to construct SOFT. The
Scott index is a composite measure of soft information production based on the
borrowing firm’s ratings of bank performance characteristics obtained from the Credit,
Banks and Small Business survey conducted by the National Federation of Independent
Business in 2001 in the United States. Specifically, we use a question available in our
survey: “Which characteristics are key in selecting your main bank?”. In answering this
question the firm was required to give a weight (going, in descending order, from 1,
very much, to 4, nil) to fourteen factors (see the Appendix). Six of the fourteen
characteristics are related to soft information: characteristics no. 1 through 6. Using
these six characteristics and following a similar procedure to Scott (2004), we created
our measure of soft information production.4
We also use different variables to represent firm characteristics as controls. AGE is
the age of the firm (we consider also the age squared, AGE-squared), SIZE is the
logarithm of the number of employees, CORPORATION, a dummy variable that takes
value of one if the firm is a joint stock company, and the degree of financial leverage
(LEVERAGE), given by the ratio of total liabilities to the sum of the total liabilities and
the firm’s assets.
4 For each of the six characteristics related to soft information, we constructed a dummy variable, which
takes a value of one if the firm chose 1. SOFT is the first principal component of the principal component
analysis over the resulting six dummies.

12
We use four independent variables to represent the firm’s performance. Three of
them are based on the firm’s financial statements. PERFORMANCE_DS is a dummy
variable indicating that the firm first posted a deficit (D) and then a surplus (S) (i.e.,
unprofitable and then profitable) in the past two years. PERFORMANCE_SD and
PERFORMANCE_DD are created similarly (surplus followed next year by
deficit/deficit followed next year by another deficit). The base case reflects two
consecutive years of surplus. The fourth performance related explanatory variable is
ROA (Returns on Assets), to control for firm’s profitability. Another factor to consider
is the extent of diversification. Plausibly, the higher the number of sectors in which the
firm is active, the more diversified is the firm. We thus code dummy variables for
whether the firm is classified in a three-, four-, or five-digit SITC sector.
We control also for the firm’s geographic localization (CENTER and SOUTH
dummies), its sector according to two-digit SITC classification and the average rate of
growth of value added in the province (GDP). Finally, we insert some variables
describing the local bank competition: the mean of the province level Herfindahl-
Hirschman concentration index from 1990 to 2006 (HHI) and the average number of
branches in the province (BRANCH)5.
Due to possible complementarity among the lending technologies, it is possible that
endogeneity problems arise in our analysis. It is essentially for this reason that we
estimated our model also with a two-stage approach. Thus, we estimate the regressions
also using a 2SLS (two-stage least squares) method.6
4. Results
4.1 Complementarity Among the Lending Technologies
Let us consider first the relative importance of each lending technology individually,
by directly comparing the magnitude of the corresponding index together with the
5 The level of competition may not only affect the overall supply of credit from all types of lending
technologies but may have a different effect on relationship lending. Under high competition, banks may
use relationship lending as an instrument to differentiate themselves from other banks. Relationship
lending, however, may be a sunk cost that makes it extremely costly to rely on soft information. 6 We use three instrumental variables. The first one is a dummy variable (MEET) which takes a value of
one whether contact between the firm and the loan officer is typically direct rather than by telephone,
email or other indirect methods. The other two instruments are typical in the literature on bank- firm
relationship. They are: the number of saving banks – per thousand inhabitants – measured at the province
level, refer to 1936, when a long-lasting new banking law virtually froze Italy’s banking structure for
several decades; and the average number of net branches created by incumbents in the province in the
period 1991-1998. See Guiso et al. (2003, 2004) and Herrera and Minetti (2007) for a more detailed
justification of the use of these instruments.

13
dummy variables constituting the index. Table 4 shows the summary statistics of these
variables. The lending factors related to financial statement technology are relatively
more frequently emphasized, so the index of financial statement technology is the
largest among the four indices. This shows that the financial statement technology is the
most frequently used lending technology. This result is robust also for each bank type.7
The relationship lending index is the second most important index. The real estate
lending index is the next largest, instead the other fixed-asset lending is the least
frequently used lending technology.
This finding does not allow for the possibility that these lending technologies may
not be strictly distinct from each other and, as a result, some complementarity might
exist among them.
For this reason we now proceed with the analysis of the interrelationship between the
four lending technologies. In fact, it is possible that different technologies complement
each other. In particular, it is possible that two technologies require screening and
monitoring processes that are similar in nature and in intensity, and so these may be
used in tandem.
The first analysis that we make is about the correlation among the four lending
technology indices. Table 5 shows their coefficients of correlation. Any combination of
indices appears significantly correlated, and the magnitude of the correlation is very
high among all the lending technologies. The correlation between LT_FS and LT_RL is
the biggest. An interpretation of this result is that the financial statement lending
technology and the relationship lending technology are highly complementary and their
technologies are used in tandem.
We obtain a similar result between LT_RE and LT_OF. This seems natural since
they are both based on an underwriting process that focuses on assessing the liquidation
value of a fixed-asset. Instead, the high correlation between LT_RL and LT_OF is
somewhat unexpected.
To confirm these results, we run a multivariate regression model among the four
indices. Furthermore, this analysis should contain information about which combination
of lending technologies is the most important when all the technologies are to some
7 The level of LT_FS was 0.192 for the firms for which the main bank is either a national bank, 0.214 for
those for which the main bank is a foreign bank, 0.166 for those of for which the main bank is a banca
popolare, 0.2 for those for which the main bank is saving bank, and 0.23 for those for which the main
bank is banca di credito cooperativo. The ranking among the four indices are the same even if we
compare by bank type, except for national bank, where the relationship lending index is the lower.

14
extent used at the same time. The results, shown in Table 6, are consistent with the
results in Table 5. Again, judging from the magnitudes of the coefficients, relationship
lending is closely tied with financial statement lending and other fixed-asset lending,
instead real estate lending is linked with other fixed-asset lending.
4.2 The Choice of the Lending Technology
Table 7 reports the results of the regressions on the four lending technologies we
considered. These results help us interpret the complementarity among the technologies
that was already suggested previously. We may label this as “information
complementarity”, since it turns out that SOFT is significant for all the four
technologies. In addition, for each one of the three transactional lending technologies
(financial statement, real estate and other fixed-assets), SOFT turns out more significant
than our proxy of hard information, that is the presence of external auditing. This
outcome might suggest that a process of “hardening of soft information” is under way8.
As to the other variables, in line with the results obtained by Uchida et al. (2006) for
the Japanese market, only few of the explanatory variables are significant. Starting with
the regression for the financial statement lending technology, we may notice that the
presence of external auditing is only marginally significant. This result is particularly
surprising, in as much as this technology is primarily based on the information retrieved
from the enterprise’s accounts. Thus, our a priori was that more trustworthy statements
would affect this lending technology to the largest extent.
An analogous result was obtained by Uchida et al. (2006). That paper shows that the
presence of external auditing significantly affects the use of this technology for the
smaller-sized firms. For this reason, we perform a similar procedure on Italy’s data.
Restricting the sample to those firms with fewer than 50 employees, our general result is
confirmed while AUDIT is barely significant. Beside SOFT, the other variables
increasing the likelihood of the choice of the financial statement lending technology are
a higher leverage and more diversification of the firm. The use of the financial
8 We have shown there is pervasive complementarity among lending technologies, and we have underline
the fundamental role of soft information. It would be interesting clarify how and if the increasing role of
soft information helps mitigate all the inefficiency stemming from information asymmetry. Bartoli et al.
(2010) try to do this. They show that, although the same firm tends to receive credit via different lending
technologies, the soft information variable lowers (raises) the probability of rationing if the firm’s main
bank uses relationship (transactional) lending technologies. Thus, it appears that the impact of soft
information still depend on lending technologies.

15
statement lending technology is instead less likely for higher ROA as well as having a
LOCAL bank as the firm’s main bank.
As to the real estate lending technology, both SOFT and AUDIT increase the
probability this technology will be chosen, while a high growth of provincial value
added lowers such probability. These results seem consistent with theory. Also using
the “fixed assets” lending technology is more likely when the firm has its statements
subject to external auditing and less likely when the firm exhibits low diversification.
As to the “relationship lending” technology, the only significant regressor in our
estimates is SOFT.
Table 8 reports the results of the regression performed using instrumental variables.
By and large these results confirm those obtained without instrumenting. Indeed, SOFT
is significant for all lending technologies excluding the real estate technology.
Furthermore, our tests to check for the endogeneity of SOFT find this situation is
confirmed only for “financial statement lending”.
5. Conclusions
In this paper we studied the extent of the recourse to the various technologies utilized
by the banks to lend to the SMEs in Italy. Employing the Tenth Survey on Italian
Manufacturing Firms, carried out by Unicredit at the end of 2006, we checked which
ones of the lending technologies are more widespread and which are the determinants
behind the choice of any of them. Specifically, we build on a recent strand of literature
stressing that banks lend to small and medium-sized enterprises via different lending
technologies. Accordingly, it is believed that, partly thanks to the enormous progress in
ICT, even transactional lenders – the banks once granting loans only based on “hard”
(e.g. balance sheet) information provided by the SMEs – may now be lending to SMEs
referring also to firm’s “soft” information (e.g. difficult to codify qualitative
information obtained via personal interaction/acquaintance). This process – labeled the
hardening-of-soft-information hypothesis – has three important implications. First, the
traditional distinction between relationship and transactional lenders becomes blurred.
Second, it is possible that different lending technologies – once believed alternatives –
are indeed complements. Third, in spite of the complementarity, the use of soft
information might have different implications depending on the lending technology. We
address these issues focusing particularly on the second one.

16
Our analysis on the factors affecting the choice of one technology over the others
showed that the use of soft information is crucial for each one of the technologies. This
suggests the complementarity across technologies may have an information basis. In
other words, the various lending technologies may be used at the same time exactly
because they employ a common information support. This evidence is partly at odds
with the theoretical prediction that the transactional technologies should rely almost
exclusively on hard information. The role played by soft information in accounting for
the use of transactional lending technologies seems to confirm the existence of a process
of “hardening of soft information”. Recently, the theoretical literature on SME
financing – and especially that addressing credit scoring – has, in fact, underscored the
trend by which the banks tend to include qualitative information within transactional
lending technologies.
Our analyses suggest deeper studies are needed to understand all the underpinnings
of how soft information affects SME lending. In fact, if, on the one hand, the use of
qualitative information seems fundamental to explain the choice of each lending
technology, on the other hand, it is possible that such use have rather different impacts
on the bank’s decisions depending on the prevailing lending technology of the bank.
Particular attention should be devoted to studying the determinants affecting the choice
of each lending technology. In carrying out this study, it could prove most useful to
explicitly consider the complementarity among technologies, which makes it more
difficult identifying the key elements behind the bank’s decisions.

17
References
Albareto, G., Benvenuti, M., Mocetti, S., Pagnini, M., Rossi., P., 2008.
L’organizzazione dell’attività creditizia e l’utilizzo di tecniche di scoring nel
sistema bancario italiano: risultati di un’indagine campionaria. Questioni di
Economia e Finanza 12, Bank of Italy.
Agarwal, S., Hauswald, R., 2006. Distance and Private Information in Lending, mimeo,
FRB of Chicago and American University.
Angelini, P., Di Salvo, R., Ferri, G., 1998. Availability and cost of credit for small
businesses: customer relationships and credit cooperatives. Journal of Banking and
Finance 22 (6-8), 925-54.
Bartoli, F., Ferri, G., Murro, P., Rotondi, Z., 2010. What’s Special About Banking in
Italy? Lending Technologies, Complementarity, and Impact of Soft Information,
in G. Bracchi and D. Masciandaro (Eds), The XV Report on Financial System:
“Le banche italiane sono speciali? Nuovi equilibri tra finanza, imprese e Stato”,
Italian Banking Association.
Berger, A.N., Frame W.S., 2006. Small business credit scoring and credit availability.
Journal of Small Business Management 46.
Berger, A.N., G.F. Udell 1995. Relationship lending and lines of credit in small firm
finance. Journal of Business 68, 351-81.
Berger, A. N., Udell, G.F., 2006. A more complete conceptual framework for SME
finance. Journal of Banking and Finance 30, 2945–2966.
Boot, A.W.A., 2000. Relationship banking: what do we know?. Journal of Financial
Intermediation 9 (1), 7–25.
Degryse, H., Van Cayseele, P.J.G., 2000. Relationship lending within a bank-based
system: evidence from European small business data. Journal of Financial
Intermediation 9 (1), 90-109.
Jappelli, T., 1990. Who is credit constrained in the US economy?. Quarterly Journal of
Economics 105, 219-234.
Levenson, A.R., Willard, K.L., 2000. Do Firms Get the Financing They Want?
Measuring Credit Rationing Experienced by Small Businesses in the U.S. Small
Business Economics 14, 83-94.
Petersen, M., 2004. Information: Hard and Soft, mimeo, Northwestern University.

18
Petersen, M. and Rajan, R., 2002. Does Distance Still Matter? The Information
Revolution in Small Business Lending. Journal of Finance 57, 2533-2570.
Scott, J.A., 2004. Small business and the value of community financial institutions.
Journal of Financial Services Research 25, 207-230.
Stein, J. C., 2002. Information production and capital allocation: Decentralized vs.
hierarchical firms. Journal of Finance 57, 1891-1921.
Uchida, H., Udell, G. F., Yamori, N., 2006. SME financing and the choice of lending
technology. RIETI Discussion Paper Series 06-E-025.
Uchida, H., Udell, G. F., Watanabe, W., 2008. Bank size and Lending relationship in
Japan. Journal of the Japanese and International Economies 22 (2), 242-267.
Udell, G.F., 2004. Asset-Based Finance. The Commercial Finance Association, New
York.

19
Appendix
Table 1. Variables definition
Variable Definition
LT_FS
Index for financial statement lending technology. We use a question
available in the Survey: “In your view, which criteria does your bank follow
in granting loans to you?”. In answering this question the firm was required
to give a weight (going, in descending order, from 1, very much, to 4, nil) to
fifteen factors. From the list of fifteen criteria shown in the Appendix, we
use the initial four. For each of the four characteristics we constructed a
dummy variable, which takes a value of one if the firm chose 1. LT_FS is
the average of these four dummy variables.
LT_RE
Index for real-estate lending technology. We use a question available in the
Survey: “In your view, which criteria does your bank follow in granting
loans to you?”. In answering this question the firm was required to give a
weight (going, in descending order, from 1, very much, to 4, nil) to fifteen
factors. LT_RE, is a dummy variable that take the value one if the firm
answered 1 (very much) to lending factor no. 5.
LT_OF
Index for other fixed-asset lending technology. We use a question available
in the Survey: “In your view, which criteria does your bank follow in
granting loans to you?”. In answering this question the firm was required to
give a weight (going, in descending order, from 1, very much, to 4, nil) to
fifteen factors. LT_OF, is an average of the two dummy variables which
take a value of one if the firm answered 1 (very much) to lending factors no.
6 and 8, respectively.
LT_RL
Index for relationship lending technology. We use a question available in
the Survey: “In your view, which criteria does your bank follow in granting
loans to you?”. In answering this question the firm was required to give a
weight (going, in descending order, from 1, very much, to 4, nil) to fifteen
factors. LT_RL, is an average of six dummy variables which take a value of
one if the firm answered 1 (very much) to lending factors, no. 9, 10, 11, 13,
14 and 15, respectively.
LT_TRANS
Index for the transactional lending technology. To construct this index, we
aggregate the three transactional lending technologies (LT_FS, LT_RE and
LT_OF) in a single index.
AUDIT
Dummy taking value one if firm has its statements externally certified; 0
otherwise.
AGE Log of the age of firm since foundation, in years.
AGE-squared Square of the age of firm since foundation, in years.
ROA
Average value of the ratio of firm’s EBIT to firm’s total assets during 2004-
2006 period.
LEVERAGE
Ratio of firm’s total loans to the sum of firm’s total loans and firm's equity
as of the end of December 2006.
CORPORATION
Dummy variable taking value one if firm is a join stock company; 0
otherwise.
BANKS Total number of firm’s reference banks
LARGE
Dummy variable taking value one if the main bank is either a national bank
or a foreign bank; 0 otherwise.
LOCAL
Dummy variable taking value one if the main bank is a smaller-sized
cooperative mutual banks, a larger-sized Volksbank type cooperative banks,
a saving bank or “other type of bank”; 0 otherwise.
SITC5
Dummy taking value one if firm has a 5 digit SITC classification; 0
otherwise.
SITC4
Dummy taking value one if firm has a 4 digit SITC classification; 0
otherwise.
SITC3
Dummy taking value one if firm has a 3 digit SITC classification; 0
otherwise.

20
CENTER
Dummy variable taking value 1 if the bank branch where the credit
relationship with the firm takes place is located in Central Italy; 0 otherwise.
SOUTH
Dummy variable taking value 1 if the bank branch where the credit
relationship with the firm takes place is located in Southern Italy; 0
otherwise.
HHI
Average value of the Herfindhal Hirschman index of concentration on bank
loans in the province during 1991-2004 period.
BRANCH
Average number of branches per thousands inhabitants in the province
during 1991-2004 period.
GDP
Average rate of growth of value added in the province in the 1989–1998
period.
PERFORMANCE_DS
Dummy variable indicating that the firm first posted a deficit (D) and then a
surplus (S) in the past two years.
PERFORMANCE_DD
Dummy variable indicating that the firm posted two deficit (D) in the past
two years.
PERFORMANCE_SD
Dummy variable indicating that the firm first posted a surplus (S) and then a
deficit (D) in the past two years.
PERFORMANCE_SS
Dummy variable indicating that the firm posted two surplus (S) in the past
two years.
SOFT
We use a question available in our survey: “Which characteristics are key in
selecting your main bank?”. In answering this question the firm was
required to give a weight (going, in descending order, from 1, very much, to
4, nil) to fourteen factors. Six of the fourteen characteristics are related to
soft information. For each of the six characteristics related to soft
information, we constructed a dummy variable, which takes a value of one if
the firm chose 1. SOFT is the first principal component of the principal
component analysis over the resulting six dummies.
SIZE Log of the firm’s number of employees as of the end of December 2006.
MEET
Dummy variable which takes a value of one whether contact between the
firm and the loan officer is typically direct rather than by telephone, email or
other indirect methods.
SAVINGBANKS_1936
Saving banks, per thousand inhabitants, measured at the province level, refer
to 1936.
NBRANCHES_INC
Average of the annual number of branches created minus those closed by
incumbent banks per inhabitants in the province in the 1991–1998 period.

21
Table 2. Summary statistics: Full Sample
Variables Mean Standard
Deviation Min Max
AUDIT 0.376 0.485 0 1
LISTED 0.013 0.113 0 1
AGE 22.663 14.388 1 134
ROA 0.025 2.097 -0.100 0.836
LEVERAGE 0.899 0.113 0.092 0.997
CORPORATION 0.331 0.471 0 1
BANKS 4.973 3.959 1 100
LARGE 0.497 0.500 0 1
LOCAL 0.503 0.500 0 1
PERFORMANCE_DS 0.100 0.301 0 1
PERFORMANCE_DD 0.109 0.342 0 1
PERFORMANCE_SD 0.135 0.312 0 1
PERFORMANCE_SS 0.655 0.475 0 1
SITC 5 0.281 0.450 0 1
SITC 4 0.416 0.493 0 1
SITC 3 0.282 0.450 0 1
CENTER 0.162 0.369 0 1
SOUTH 0.118 0.323 0 1
HHI 0.111 0.048 0.048 0.369
BRANCH 0.467 0.113 0.183 0.938
GDP 0.072 0.045 -0.131 0.236
SOFT -0.001 1.743 -1.065 5.823
SIZE 3.553 1.118 0 9.093

22
Table 3. Summary statistics: Sub-Sample
Variables Mean Standard
Deviation Min. Max.
AUDIT 0.345 0.476 0 1
LISTED 0.018 0.134 0 1
AGE 24.499 15.634 2 116
ROA 0.053 0.069 -0.339 0.836
LEVERAGE 0.890 0.113 0.092 1
CORPORATION 0.409 0.492 0 1
BANKS 5.690 4.286 1 50
LARGE 0.500 0.500 0 1
LOCAL 0.500 0.500 0 1
PERFORMANCE_DS 0.101 0.301 0 1
PERFORMANCE_DD 0.160 0.366 0 1
PERFORMANCE_SD 0.099 0.298 0 1
PERFORMANCE_SS 0.641 0.480 0 1
SITC 5 0.295 0.456 0 1
SITC 4 0.402 0.490 0 1
SITC 3 0.282 0.450 0 1
CENTER 0.170 0.376 0 1
SOUTH 0.097 0.296 0 1
HHI 0.110 0.048 0.048 0.332
BRANCH 0.474 0.107 0.188 0.938
GDP 0.072 0.043 -0.131 0.236
SOFT -0.001 1.743 -1.065 5.823
SIZE 3.826 1.304 0 9.093
23
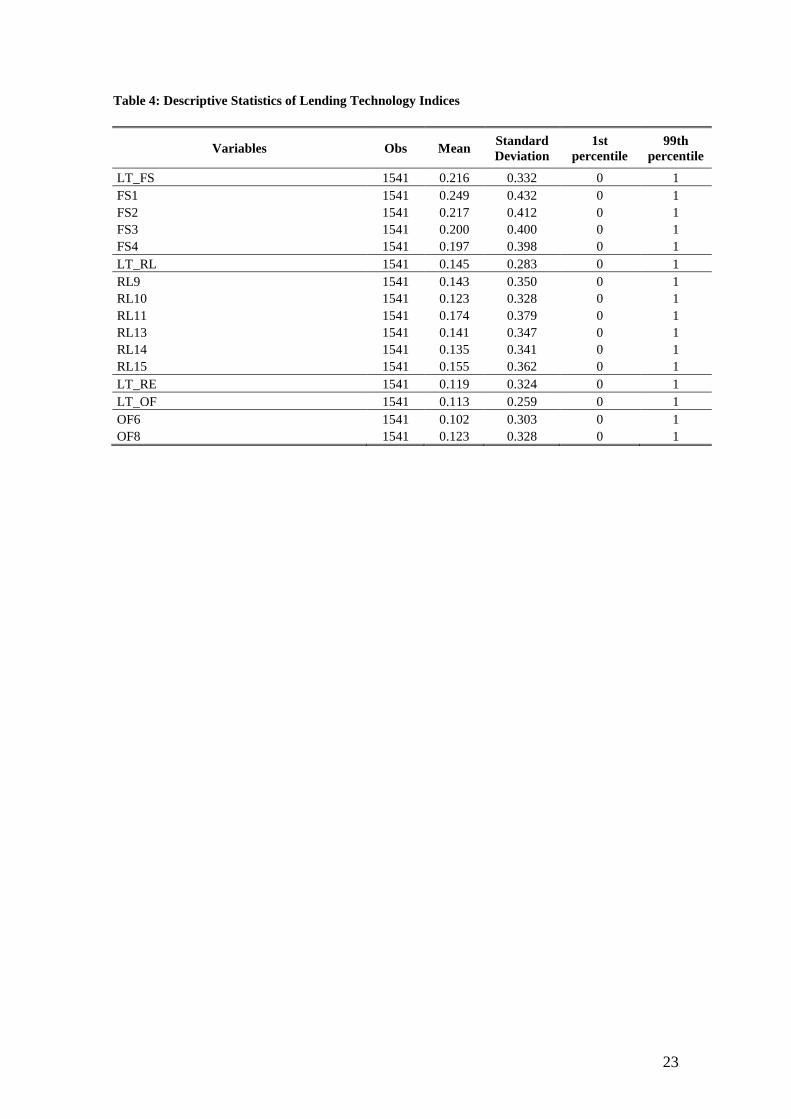
Table 4: Descriptive Statistics of Lending Technology Indices
Variables Obs Mean Standard
Deviation
1st
percentile
99th
percentile
LT_FS 1541 0.216 0.332 0 1
FS1 1541 0.249 0.432 0 1
FS2 1541 0.217 0.412 0 1
FS3 1541 0.200 0.400 0 1
FS4 1541 0.197 0.398 0 1
LT_RL 1541 0.145 0.283 0 1
RL9 1541 0.143 0.350 0 1
RL10 1541 0.123 0.328 0 1
RL11 1541 0.174 0.379 0 1
RL13 1541 0.141 0.347 0 1
RL14 1541 0.135 0.341 0 1
RL15 1541 0.155 0.362 0 1
LT_RE 1541 0.119 0.324 0 1
LT_OF 1541 0.113 0.259 0 1
OF6 1541 0.102 0.303 0 1
OF8 1541 0.123 0.328 0 1

24
Table 5: Correlation Among Lending Technology Indices
Variables LT_FS LT_RE LT_OF LT_RL
LT_FS 1.000
LT_RE 0.560 1.000
(0.000)
LT_OF 0.607 0.635 1.000
(0.000) (0.000)
LT_RL 0.714 0.556 0.682 1.000
(0.000) (0.000) (0.000)
The table reports the correlation coefficients among lending technology
indices and p-value (between parentheses).
Table 6: Multivariate Regression Among Lending Technology Indices
Variables Intercept LT_FS LT_RL LT_OF LT_RE
LT_FS 0.085 0.606*** 0.175*** 0.189***
(0.000) (0.000) (0.000) (0.000)
LT_RL 0.009* 0.389*** 0.392*** 0.064***
(0.086) (0.000) (0.000) (0.001)
LT_OF 0.005 0.104*** 0.363*** 0.271***
(0.306) (0.000) (0.000) (0.000)
LT_RE -0.006 0.222*** 0.118*** 0.534***
(0.406) (0.000) (0.001) (0.000)
The table reports regressions coefficients and associated standard errors (between
parentheses). The dependent variables are the four lending technologies. The
regressions are estimated by OLS. (*): coefficient significant at 10% confidence
level; (**): coefficient significant at 5% confidence level; (***): coefficient
significant at less than 1% confidence level.

25
Table 7. Lending Technologies Regressions
Variables LT_FS LT_RL LT_RE LT_OF
Soft 0.083*** 0.074*** 0.056*** 0.054***
0.009 0.008 0.011 0.009
Local -0.050** 0.007 -0.011 -0.013
0.020 0.012 0.017 0.015
Audit 0.042* -0.003 0.043** 0.044***
0.022 0.013 0.020 0.017
Age -0.001 -0.001 0.001 -0.001
0.001 0.001 0.001 0.001
Age-squared -0.000 0.000 -0.000 0.000
0.000 0.000 0.000 0.000
Size -0.014 0.005 -0.004 0.002
0.009 0.005 0.008 0.007
Performance_DS 0.008 0.020 -0.008 -0.005
0.038 0.024 0.031 0.024
Performance_SD -0.071** 0.008 -0.015 0.044
0.029 0.020 0.028 0.029
Performance_DD -0.065** -0.021 -0.035 -0.032
0.028 0.017 0.026 0.020
Center -0.007 0.016 -0.023 -0.009
0.025 0.016 0.024 0.020
South -0.009 0.024 -0.036 -0.052*
0.038 0.024 0.039 0.031
HHI 0.005 -0.058 -0.034 0.018
0.239 0.128 0.176 0.146
Branch 0.054 0.084 -0.080 -0.048
0.108 0.069 0.101 0.088
Leverage 0.152** 0.061 0.093 0.049
0.076 0.045 0.080 0.067
ROA -0.408*** -0.109 -0.175 -0.082
0.135 0.088 0.123 0.118
GDP -0.215 0.117 -0.328* -0.225
0.248 0.108 0.192 0.161
Corporation 0.023 -0.009 0.016 0.006
0.023 0.015 0.023 0.017
SITC 5 0.076*** -0.031 0.024 -0.100
0.025 0.031 0.018 0.048
SITC 4 0.108*** -0.020 0.037* -0.057
0.026 0.031 0.020 0.049
SITC 3 0.058** -0.016 0.010 -0.058
0.025 0.032 0.019 0.049
Constant 0.059 0.016 0.062 0.142
0.098 0.064 0.091 0.094
Observations 778 778 778 778
R squared 0.2525 0.3559 0.1471 0.2097
The table reports regressions coefficients. The endogenous variables are the four transactional lending technologies.
For the definition of the explanatory variables see Table 1. The regressions are estimated by OLS. The regressions
include sector dummies. Robust standard errors are reported below coefficients. (*): coefficient significant at 10%
confidence level; (**): coefficient significant at 5% confidence level; (***): coefficient significant at less than 1%
confidence level. The table also reports, as goodness-of-fit tests, the R-squared.

26
Table 8. Complementarity among lending technologies (instrumented)
Variables LT_FS LT_RL LT_RE LT_OF
Soft 0.180*** 0.061** 0.028 0.054*
0.051 0.025 0.042 0.029
Local 0.010 0.001 -0.038 -0.010
0.038 0.019 0.029 0.021
Audit 0.014 0.001 0.019 0.028
0.031 0.016 0.025 0.020
Age -0.000 -0.002 0.000 -0.001
0.002 0.001 0.002 0.001
Age-squared -0.000 0.000 0.000 0.000
0.000 0.000 0.000 0.000
Size -0.023* 0.004 0.003 0.008
0.012 0.006 0.010 0.008
Performance_DS -0.022 0.001 -0.005 -0.004
0.052 0.024 0.037 0.024
Performance_SD -0.112** 0.015 -0.000 0.065**
0.044 0.024 0.037 0.032
Performance_DD -0.080* -0.016 -0.017 -0.022
0.042 0.019 0.032 0.023
Center -0.013 0.023 -0.013 0.013
0.033 0.018 0.032 0.026
South -0.050 0.016 -0.061 -0.081**
0.058 0.029 0.051 0.039
HHI 0.192 -0.002 0.088 0.086
0.339 0.141 0.204 0.184
Branch -0.062 0.092 -0.175 -0.092
0.161 0.085 0.120 0.106
Leverage 0.106 0.039 0.073 0.005
0.109 0.047 0.093 0.073
ROA -0.536** -0.119 -0.130 -0.067
0.224 0.106 0.159 0.148
GDP -0.005 0.110 -0.168 -0.131
0.325 0.136 0.232 0.204
Corporation 0.027 -0.012 0.012 -0.006
0.033 0.015 0.026 0.017
SITC 5 0.027 -0.025 0.042 -0.105*
0.043 0.029 0.027 0.056
SITC 4 0.087* -0.013 0.058* -0.059
0.046 0.030 0.029 0.058
SITC 3 0.007 -0.005 0.014 -0.062
0.046 0.031 0.029 0.058
Constant 0.229 0.037 0.082 0.181
0.153 0.072 0.112 0.112
Observations 572 572 572 572
Test of excluded instruments, F-
statistic 5.225 5.225 5.225 5.225 Endogeneity test of instrumented
regressor 5.053** 0.272 0.694 0.022
Overidentification test,
Sargan 2-statistic 3.246 2.002 5.347 0.997
The table reports regressions coefficients. The endogenous variables are the four lending technologies. For the definition of the explanatory variables
see Table 1. The regressions are estimated by 2SLS. The regressions include sector dummies. Robust standard errors are reported below coefficients.
(*): coefficient significant at 10% confidence level; (**): coefficient significant at 5% confidence level; (***): coefficient significant at less than 1%
confidence level. The table also reports the F-test and the Sargan score as test of validity of the instruments, the Wooldridge test as a test of
endogeneity of SOFT.

27
Survey questions
Which of these characteristics are key in selecting your main bank?
1. The bank knows you and your business.
2. The bank knows a member of your Board of directors or the owners of the firm.
3. The bank knows your sector.
4. The bank knows your local economy.
5. The bank knows your relevant market.
6. Frequent contacts with the credit officer at the bank.
7. The bank takes quick decisions.
8. The bank offers a large variety of services.
9. The bank offers an extensive international network.
10. The bank offers efficient internet-based services.
11. The bank offers stable funding.
12. The bank offers funding and services at low cost.
13. The bank’s criteria to grant credit are clear.
14. The bank is conveniently located.
In your view, which criteria does your bank follow in granting loans to you?
1. Ability of the firm to repay its debt (e.g. years needed to repay its debt).
2. Financial solidity of the firm (capital/asset ratio).
3. Firm’s profitability (current profits/sales ratio).
4. Firm’s growth (growth of sales).
5. Ability of the firm to post (not personal) real estate collateral.
6. Ability of the firm to post tangible non-real estate collateral.
7. Support by a guarantee association (e.g. loan, export, R&D, etc.).
8. Personal guarantees by the firm’s manager or owner.
9. Managerial ability on the part of those running the firm’s business.
10. Strength of the firm in its market (number of customers, commercial network).
11. Intrinsic strength of the firm (e.g. ability to innovate).
12. Firm’s external evaluation or its evaluation by third parties.
13. Length of the lending relationship with the firm.
14. Loans are granted when the bank is the firm’s main bank.
15. Fiduciary bond between the firm and the credit officer at your bank.