Suspension-like hardening behavior of HDPE and time-hardening superposition
Upload
independentCategory
view
0download
0
International Journal of Plasticity 23 (2007) 44–86
www.elsevier.com/locate/ijplas
Hardening evolution of AZ31B Mg sheet
X.Y. Lou a, M. Li b,1, R.K. Boger a, S.R. Agnew c, R.H. Wagoner a,*
a Department of Materials Science and Engineering, The Ohio State University, 477 Watts Hall,
2041 College Road, Columbus, OH 43210, USAb Abaqus Central, Inc., 1440 Innovation Place, W. Lafayette, IN 47906-1000, USA
c Department of Materials Science and Engineering, University of Virginia, 116 Engineer’s Way,
P.O. Box 400745, Charlottesville, VA 22904, USA
Received 23 October 2005; received in final revised form 30 January 2006Available online 6 May 2006
Abstract
The monotonic and cyclic mechanical behavior of O-temper AZ31B Mg sheet was measured inlarge-strain tension/compression and simple shear. Metallography, acoustic emission (AE), and tex-ture measurements revealed twinning during in-plane compression and untwinning upon subsequenttension, producing asymmetric yield and hardening evolution. A working model of deformationmechanisms consistent with the results and with the literature was constructed on the basis of pre-dominantly basal slip for initial tension, twinning for initial compression, and untwinning for tensionfollowing compression. The activation stress for twinning is larger than that for untwinning, presum-ably because of the need for nucleation. Increased accumulated hardening increases the twin nucle-ation stress, but has little effect on the untwinning stress. Multiple-cycle deformation tends tosaturate, with larger strain cycles saturating more slowly. A novel analysis based on saturated cyclingwas used to estimate the relative magnitude of hardening effects related to twinning. For a 4% strainrange, the obstacle strength of twins to slip is 3 MPa, approximately 1/3 the magnitude of texturalhardening caused by twin formation (10 MPa). The difference in activation stress of twinning versusuntwinning (11 MPa) is of the same magnitude as textural hardening.� 2006 Elsevier Ltd. All rights reserved.
Keywords: Magnesium alloy; Tension/compression testing; Simple shear testing; Texture; Acoustic emission;Plastic deformation; Slip; Twinning; Untwinning
0749-6419/$ - see front matter � 2006 Elsevier Ltd. All rights reserved.
doi:10.1016/j.ijplas.2006.03.005
* Corresponding author. Tel.: +1 614 292 2079; fax: +1 614 292 6530.E-mail address: [email protected] (R.H. Wagoner).
1 Formerly Graduate Research Associate, Dept. Materials Science and Engineering, The Ohio State University.

X.Y. Lou et al. / International Journal of Plasticity 23 (2007) 44–86 45
1. Introduction
With increasing demand for the application of light materials in the transportationindustry, the plastic deformation behavior of magnesium alloys has been of recent interest.Compared with casting counterparts, wrought magnesium alloys have better mechanicalproperties, including tensile properties (Roberts, 1960; Bettles and Gibson, 2005) and fati-gue resistance (Duygulu and Agnew, 2003). However, because of poor formability at roomtemperature, the large-scale utilization of sheet-formed magnesium alloys, for exampleAZ31B magnesium alloy sheet, has not developed.
The low formability at room temperature mainly arises from the limited number of slipsystems in the hexagonal close packed (HCP) Mg alloys. The dominant slip system ofmagnesium AZ31B alloy at room temperature is slip in the close packed directionh1120i or Æaæ on the basal (0001) plane (Roberts, 1960). The critical resolved shear stress(CRSS) of basal slip in pure magnesium is about 0.5 MPa (Burke and Hibbard, 1952;Kelly and Hosford, 1968; Kleiner and Uggowitzer, 2004). Other slip systems, such asnon-basal slip of Æaæ on prismatic f1010g planes (Ward Flynn et al., 1961), Æaæ on pyra-midal f1011g planes and Æc + aæ on pyramidal f1122g planes (Obara et al., 1973; Agnewet al., 2001) were also observed in magnesium, although their critical resolved shear stres-ses are two orders higher than basal slip (Kelly and Hosford, 1968; Kleiner and Uggow-itzer, 2004). According to the Von Mises criterion (Von Mises, 1928; Taylor, 1938), fiveindependent slip systems are needed to accommodate the arbitrary homogeneous defor-mation of polycrystalline materials. (Fewer deformation systems can accommodate certainspecial strain paths.) Basal Æaæ slip, prismatic Æaæ slip and pyramidal Æaæ slip provide onlyfour independent slip systems. Pyramidal Æc + aæ slip, which in principle provides the addi-tional independent slip systems, is difficult to activate at room temperature because of itshigh CRSS (Agnew et al., 2001; Yoo et al., 2002). At elevated temperature, the activationof pyramidal Æc + aæ slip and other non-basal slip occurs at lower CRSS, reducing flowstress and increasing formability (Agnew and Duygulu, 2003, 2005). At room temperature,twinning can provide an independent deformation mechanism (in addition to basal andnon-basal Æaæ slip systems) to satisfy the Von Mises criterion (Kocks and Westlake, 1967).
In HCP crystals, the twinning systems are strongly correlated with c/a ratio (Partridge,1967; Yoo, 1981). The c/a ratio for pure magnesium is 1.624 (Roberts, 1960), which isclose to, but less than, the ideal hard-sphere value of 1.633. Two common twin modes,f1012gh10 11i and f1011gh101 2i, are observed in magnesium (Yoo, 1981), withf1012gh10 11i being the most common and easily activated twin in magnesium and manyother HCP metals (Roberts, 1960; Partridge, 1967; Kelly and Hosford, 1968). A CRSS fortwinning, while low (Koike, 2005), is not well established because twin nucleation is inho-mogeneous and depends on microstructure features (Partridge, 1967; Reed-Hill andAbbaschian, 1994). A fresh twin has a higher nucleation stress than the stress to propagatean existing twin (Partridge, 1965; Reed-Hill and Abbaschian, 1994).
Because of crystal symmetry, the shear direction for f101 2g twin reverses at c=a ¼ffiffiffi3p
.Since the c/a ratio of magnesium is smaller than
ffiffiffi3p
, the f10 12g twin is a ‘tension’ twin,that is, its activation is associated with extension parallel to the c-axis in the HCP crystalstructure (Yoo, 1981), and with contraction in a direction lying normal to Æcæ. Because ofthe polar nature of twinning, the shear can occur only in one direction rather than oppo-site directions (Kocks and Westlake, 1967; Agnew and Duygulu, 2005). Therefore, a con-traction along the c-axis cannot be accommodated by a f1 012g twin. In magnesium, a

46 X.Y. Lou et al. / International Journal of Plasticity 23 (2007) 44–86
theoretical maximum extension of 6.4% along c-axis can be accommodated by completereorientation of f1012gh1011i twins (Kocks and Westlake, 1967). After twinning, thec-axis will reorient to lie approximately in the original basal plane (Nave and Barnett,2004).
Rolled AZ31B magnesium sheet alloy usually has very strong basal texture generatedby rolling (Roberts, 1960; Agnew et al., 2001; Yukutake et al., 2003; Styczynski et al.,2004), where the c-axis of HCP lattice is predominantly aligned parallel to the sheet nor-mal (McDonald, 1937; Yukutake et al., 2003). A state of stress which causes an extensionin the sheet normal direction will activate twinning at low stress, while a state of stress thatcauses contraction normal to the sheet plane does not activate twinning (Kocks and West-lake, 1967; Reed-Hill, 1973; Gharghouri et al., 1999; Agnew et al., 2001; Nobre et al.,2002; Staroselsky and Anand, 2003; Styczynski et al., 2004). Conversely, an in-plane com-pression activates twinning but in-plane extension does not (Reed-Hill and Abbaschian,1994). Of course, local inhomogeneities from grain-to-grain interactions can activate lim-ited twinning, particularly in view of the limited number of independent slip systems, ascan orientations of some grains that do not lie in the predominant basal texture.
Table 1 summarizes CRSS values reported for Mg and its alloys containing aluminumand zinc solutes. The upper section represents single-crystal data for Mg and dilute
Table 1Critical resolved shear stresses (CRSS) reported for magnesium and its aluminum–zinc alloy
Metals Conditions CRSSbasal
(Mpa)CRSStwin
(Mpa)CRSSprism
(Mpa)CRSStwin/CRSSbasal
CRSSprism/CRSSbasal
Mg SC 0.81a; 0.76b;0.45c; 0.65d;0.52e
2f 39.2g 2.5 – 4.4 48 – 87
Mg 0.5 at. pct Zn SC 2.7–2.8h
AZ31B PC, VPSC, XRD 45i 15i 110i 0.33i 2.4i
AZ31B PC, EPSC, ND 10j 30j 55j 3j 5.5j
AZ31B PC, Taylor, XRD 2k 1–2.4k
AZ31B PC, TEM 1.1l
AZ31B PC, ND, Schmid factor 25–35m
AZ61 PC, XRD 1.5–2n
Mg 7.7 at. pct Al PC, ND 65–75o
SC, single crystal; PC, polycrystal; XRD, X-ray diffraction; ND, neutron diffraction; VPSC, visco-plastic self-consistent model; EPSC, elasto-plastic self-consistent model; Taylor, Taylor model.
a Schmid (1931).b Bakarian and Mathewson (1943).c Burke and Hibbard (1952).d Hsu and Cullity (1954).e Conrad and Robertson (1957).f Reed-Hill and Robertson (1957a,b); Miura (2004).g Reed-Hill and Robertson (1957a,b).h Miura (2004).i Agnew (2002).j Agnew et al. (2003).
k Styczynski et al. (2004).l Koike et al. (2003).
m Brown et al. (2005).n Koike and Ohyama (2005).o Gharghouri (1997).

X.Y. Lou et al. / International Journal of Plasticity 23 (2007) 44–86 47
Mg–Zn. Clearly, basal slip has the lowest CRSS, ranging from 0.45 to 0.81 MPa. Twin-ning has a CRSS two-to-four times larger, and prismatic slip has a CRSS much larger,48–87 times.
There is apparently no single-crystal data for AZ31B (second section of Table 1).Instead, CRSS values are fit by polycrystal texture calculations in order to match the mac-roscopic response, or CRSS values are obtained using in situ neutron diffraction to tracklattice strain and peak intensity variation (Gharghouri et al., 1999; Brown et al., 2005).The texture calculations include unknown errors and effects of stress concentration, grainsize, and incompatibility. The scatter is quite large. The neutron diffraction results in yieldactivation stresses only for twinning. Nonetheless, some generalizations may be drawn. Itappears that the addition of aluminum and zinc solutes raises the CRSS for all deforma-tion mechanisms, as expected, and compresses the ratios among them. For example, thebasal slip CRSS is in the range of 10–45 MPa while the CRSS range for twinning is 15–35 MPa. Thus, basal slip and twinning have roughly equal CRSS’s, as compared withtwinning having a CRSS twice that of basal slip in pure Mg. Prismatic slip in AZ31Bhas even more scattered results, with CRSS varying from 1-to-5 times that of basal slip,as compared with 48–87 times in pure Mg.
Sheet materials are typically formed by combinations of bending and stretching, both ofwhich are dominated by in-plane loading, with much smaller through-thickness stresses.Therefore, the in-plane plastic deformation properties are of interest for sheet formingapplication. The yield stress for in-plane compression of Mg sheet is typically one half ofthat for in-plane tension (Ball and Prangnell, 1994; Nobre et al., 2002). After yield, the com-pressive hardening curve exhibits an inflected stress–strain curve with initially low strainhardening rate, distinct from the tensile behavior of AZ31B Mg alloy (Klimanek and Pot-zsch, 2002; Nobre et al., 2002; Yukutake et al., 2003; Barnett et al., 2004; Nave and Barnett,2004). At larger compressive strain, when twinning is exhausted, or nearly so, and slip dom-inates, the compressive hardening curve takes on the appearance of the tensile one (Yuku-take et al., 2003). At high temperatures, as twinning is suppressed by lower slip systemCRSS’s, the inflection hardening curve disappears (Yukutake et al., 2003).
In addition to dislocation slip and twinning, untwinning (or detwinning) may occur in atwinned material. It is responsible for the shape memory effect in shape memory alloys(Liu et al., 1999; Liu and Xie, 2003; Sehitoglu et al., 2003), where untwinning is the growthof one variant in martensite at the expense of another (Liu and Xie, 2003; Sehitoglu et al.,2003). Microscopically, untwinning can be characterized by the disappearance of existingtwin bands. Deformed magnesium alloy, which has a high density of twins, can undergountwinning (Caceres et al., 2003; Keshavarz and Barnett, 2005). Twins can disappear orbecome narrower under reverse loading or unloading, and can reappear under reloading.The crystal deformation process of untwinning is similar to twinning, although nucleationis not required or occurs more readily. Therefore, untwinning can also result in an inflectedand concave strain hardening behavior (Kleiner and Uggowitzer, 2004). The strain causedby twinning in compression can be reversed by untwinning in subsequent tension. Untwin-ning is a contraction of twinned regions, a process that does not require nucleation(Partridge, 1965). The stress required for untwinning is less than that for twinning nucle-ation, but greater than that for twinning growth (Partridge, 1965). In cyclic loading, twin-ning and untwinning appear alternately (Gharghouri et al., 1999).
Understanding the large strain plastic behavior of sheet alloys along non-proportionalstrain paths is an important requirement for sheet metal forming application. The

48 X.Y. Lou et al. / International Journal of Plasticity 23 (2007) 44–86
Bauschinger Effect (Bauschinger, 1886), which refers to a lower yield stress developedwith strain upon reverse loading following an initial strain/stress path, has been relatedto various mechanisms: residual stresses generated in forward deformation (Abel, 1987),Orowan loops around strong precipitates (Atkinson et al., 1974; Brown, 1977), internalstress from dislocation interactions (Hasegawa et al., 1986), and dislocation pileups atgrain boundaries (Margolin et al., 1978). Regardless of mechanism, the macroscopicinterpretation involves development of a ‘‘back stress’’ during loading that assists reverseloading.
The foregoing interpretations of the Bauschinger Effect rely on material hardeningcharacteristics of dislocation slip. In materials that twin significantly, twinning and itsinteraction with slip can provide alternate Bauschinger Effect mechanisms. The twinboundaries operate as hard but deformable obstacles, with dislocation pileups developingat the twin boundaries which generate a long-range back stress field and large BauschingerEffect (Karaman et al., 2001). In magnesium alloys at room temperature, where deforma-tion in some stress states depends intimately on twinning, large asymmetry of cyclic defor-mation has been noted (Attari et al., 1990), but not studied in detail, particularly at largestrain. Noster and Scholtes (2003) reported a pronounced Bauschinger Effect for smallstrain reversal. Consistent with the role of twins as obstacles for slip, pre-compression fol-lowed by tension was reported to produce a larger Bauschinger Effect than the oppositepath, pre-tension followed by compression.
In contrast to extensive studies of magnesium bulk alloys, there is little data for large-strain in-plane compression of magnesium sheet alloys. Such measurements are limited bybuckling. The large-strain cyclic deformation behavior of magnesium alloy, important tosheet metal forming behavior and simulation, has not been reported. Knowledge of theBauschinger Effect, and more generally of the evolution of yield and hardening undernon-proportional loading paths, is required to enable development of novel forming meth-ods to take advantage of the unusual plastic properties of wrought Mg sheet.
In the current work, the constitutive behavior of O-tempered AZ31B Mg sheet alloywas investigated at room temperature. Monotonic and continuous reverse-path tests wereconducted in uniaxial tension/compression and simple shear. Novel test designs were uti-lized to obtain large-strain deformation (Gsell et al., 1983; Rauch and Schmitt, 1989;Rauch, 1998; Balakrishnan, 1999; Lopes et al., 2003; Boger et al., 2005). In order to under-stand the origins of the mechanical response, optical metallography, texture analysis andacoustic emission measurements were conducted in parallel with the mechanical tests.
2. Experimental procedures
O-temper Mg AZ31B sheet alloy was mechanically tested at room temperature usingnovel tension/compression (Balakrishnan, 1999; Boger et al., 2005) and simple shear (Gsellet al., 1983; Rauch and Schmitt, 1989; Rauch, 1998; Lopes et al., 2003) tests. The defor-mation mechanisms were revealed by standard optical metallography, texture measure-ment, and acoustic emission.
2.1. Materials
AZ31B magnesium alloy sheet, which is a commercial alloy produced by MagnesiumElektron (Magnesium, 2005) and distributed by Mark Metals Inc. (MetalMart, 2005),

Table 2Chemical compositions and elastic properties of AZ31B Mg alloy
Chemical composition (wt%) Elastic properties (Cubberly et al., 1979)
Mg Al Zn Mn Elastic modulus (GPa) Shear modulus (GPa) Poisson’s ratio, m
95.8 3.0 1.0 0.2 45 17 0.35
X.Y. Lou et al. / International Journal of Plasticity 23 (2007) 44–86 49
has chemical compositions and elastic properties as listed in Table 2. The additional alu-minum and zinc act as solute atoms to strengthen magnesium alloy (Cubberly et al., 1979).
Three thicknesses and processing paths were tested. Sheet with 6.4 mm thickness wasreceived in the O-condition. Sheet with 3.2 mm thickness was received in the H24 condi-tion. Sheet with 1.0 mm thickness was processed by a high density infrared (Horton et al.,2005a) heating and rolling technique starting from O-temper 6.4 mm sheet at Oak RidgeNational Laboratory. To eliminate the residual stresses from cutting and processing andto standardize the microstructures, all the materials were annealed at 345 �C for 2 h toobtain the O-temper (Cubberly et al., 1979; Agnew, 2003).
2.2. Uniaxial tensile tests
Standard ASTM tensile specimens (ASTM-E8-00, 2000) were machined parallel to therolling direction (RD), transverse direction (TD), and 45� to the rolling directions (45�),with a rectangular cross-section of 13 mm width by 1, 3.2, or 6.4 mm thickness and a gagelength of 50 mm. Testing was carried out using an Instron 1322 universal testing machinewith a 245 kN load cell and an Electronic Instrument Research LE-05 laser extensometer.
Fig. 1 shows typical uniaxial tensile test results. As shown in Fig. 1a, in the normal ten-sile testing strain rate range of 10�4 to 10�3/s, there is little effect of rate. The remainder oftests in the current work was carried out at a nominal initial strain rate of 1 · 10�3/s at aconstant crosshead speed. Fig. 1b shows that the sheets of three thicknesses have nearlyidentical mechanical properties. Note that the abrupt fracture behavior is quite differentfrom ductile failure by plastic strain localization for low-strength sheet alloys with cubiccrystal structures. Fig. 2 illustrates the brittle nature of fracture for AZ31B (left specimen),which occurs with little evidence of plastic localization (necking) in either the width orthickness directions. In contrast, the tensile fracture of aluminum alloy 6013, peak aged(right specimen), shows significant plastic localization in both directions before a shear-type failure occurs.
The tensile Lankford coefficient (r-value, defined as the plastic width strain divided bythe plastic thickness strain in tension) was measured by interrupting tensile tests at knownaxial extension and measuring the corresponding specimen width. Because the thicknesschange was small and thus involved large relative measurement uncertainty, the measuredaxial strain (el) and width strain (ew) were used with assumed volume constancy to infer thethickness strain (et). In contrast, because the width change in compression was small com-pared with the thickness change, the compressive r-value was measured by stopping com-pressive tests at known axial compressive strains and measuring the correspondingspecimen thickness. The tensile and compressive r-values are computed as follows:
rtensile �Dep
w
Dept
¼ � Depw
Depw þ Dep
l
; rcompressive �Dep
w
Dept
¼ �Dept þ Dep
l
Dept
ð1Þ

0
100
200
300
400
0 0.05 0.1 0.15 0.2 0.25
Tru
e S
tres
s (M
Pa)
Tru
e S
tres
s (M
Pa)
True Strain
True Strain
dε / dt = 2x10⁻⁴ /s, 1x10⁻³ /s, 4x10⁻³ /s
dε / dt = 2x10⁻² /s
Slope = 43GPa (50-100MPa)(E=45GPa (Cubberly et al., 1979))
TD, t = 3.2 mm
0
50
100
150
200
250
300
350
0 0.05 0.1 0.15 0.2 0.25
t = 1 mm
t = 3.2 mm
t = 6.4 mm
TD, Tension
a
b
Fig. 1. Baseline tensile hardening. (a) Effect of strain rate; (b) comparison of three material thicknesses.
50 X.Y. Lou et al. / International Journal of Plasticity 23 (2007) 44–86
where p refers to plastic strain, and l, w and t refer to length, width and thickness, respec-tively. For cumulative r-values, as commonly reported, the changes of strain are takenfrom the beginning of the tests. For instantaneous r-values, of more relevance to plasticyield function forms, the strain increments are computed in the vicinity of the currentstrain.
The plastic strains were obtained from the total strains by subtracting elastic strains, asfollows:
epl ¼ el �
rl
Eð2Þ
epw ¼ ew þ m
rl
Eð3Þ

Fig. 2. Tensile fracture characteristics of AZ31B (left) and aluminum alloy 6013, peak-aged.
X.Y. Lou et al. / International Journal of Plasticity 23 (2007) 44–86 51
where E is Young’s modulus (Table 2) and m is Poisson’s ratio (Table 2), and rl is the lon-gitudinal stress.
2.3. Compression and cyclic tests
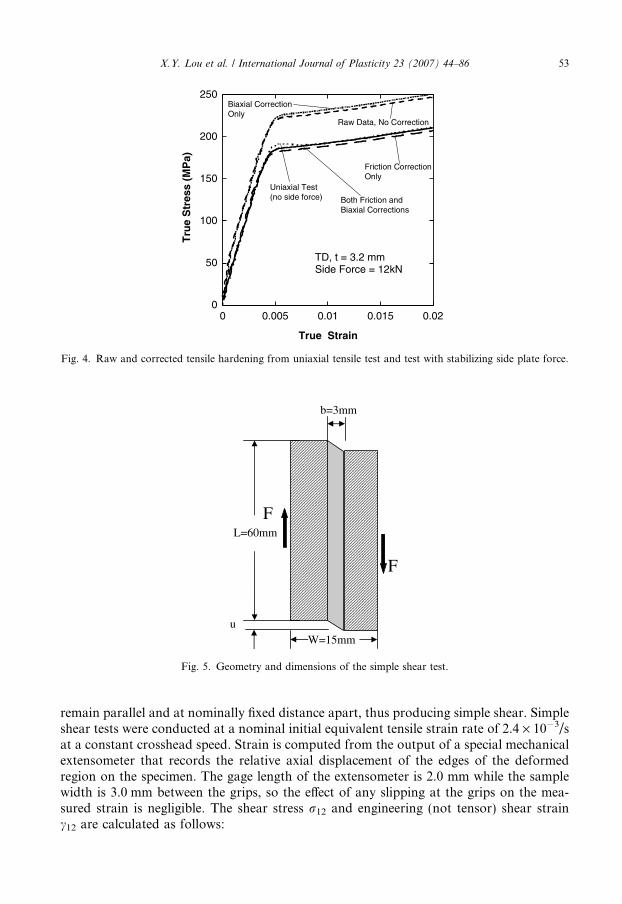
Large compressive strains, which are critical for many sheet metal forming operations,cannot be obtained easily in the planes of the sheet materials because of the limitation ofbuckling. A test method developed by Boger et al. (2005), which relies on through-thick-ness sheet stabilization to avoid buckling, was used to extend the attainable strain range ofMg sheet in compression to approximately �0.08. A schematic of the novel tension/com-pression test (Boger et al., 2005) and the sample dimensions are shown in Fig. 3. Two flatsteel plates and a hydraulic cylinder system were used to provide side force to support theexaggerated dog-bone specimen. Side forces of 12 kN were used to stabilize the sheet sam-ple. A laser extensometer (Boger et al., 2005) was used to measure specimen extensiondirectly.
The cyclic loading test was carried out using 3.2 and 6.4 mm thick samples. All mechan-ical tests were carried out under displacement control, except the multiple-cycle tests whichwere performed under strain control to improve the precision of the strain limits for eachcycle. The experiments were repeated to establish reproducibility; the standard deviationfor compression was found to be ±6 MPa.
The stabilizing side force requires correction for two effects in order to obtain uniaxialstress–strain curves comparable to standard tensile testing: (1) friction between the samplesurface and supporting plates, which reduces the effective axial loading force, and (2) biax-ial stress state. Analytical schemes for making corrections for each of these have been pre-sented by Balakrishnan (1999) and Boger et al. (2005), as discussed below.
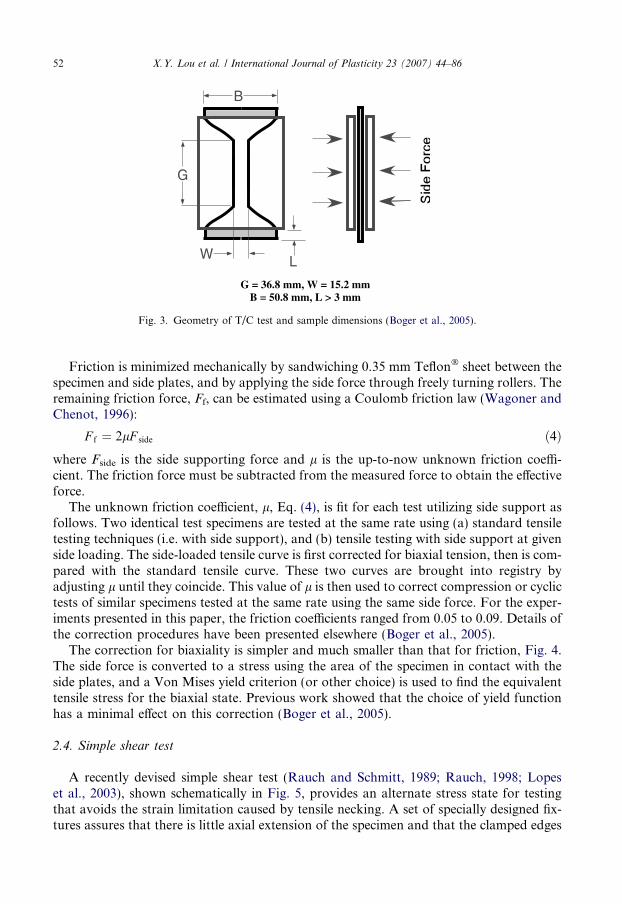
G
B
W L
G = 36.8 mm, W = 15.2 mm B = 50.8 mm, L > 3 mm
Fig. 3. Geometry of T/C test and sample dimensions (Boger et al., 2005).
52 X.Y. Lou et al. / International Journal of Plasticity 23 (2007) 44–86
Friction is minimized mechanically by sandwiching 0.35 mm Teflon� sheet between thespecimen and side plates, and by applying the side force through freely turning rollers. Theremaining friction force, Ff, can be estimated using a Coulomb friction law (Wagoner andChenot, 1996):
F f ¼ 2lF side ð4Þwhere Fside is the side supporting force and l is the up-to-now unknown friction coeffi-cient. The friction force must be subtracted from the measured force to obtain the effectiveforce.
The unknown friction coefficient, l, Eq. (4), is fit for each test utilizing side support asfollows. Two identical test specimens are tested at the same rate using (a) standard tensiletesting techniques (i.e. with side support), and (b) tensile testing with side support at givenside loading. The side-loaded tensile curve is first corrected for biaxial tension, then is com-pared with the standard tensile curve. These two curves are brought into registry byadjusting l until they coincide. This value of l is then used to correct compression or cyclictests of similar specimens tested at the same rate using the same side force. For the exper-iments presented in this paper, the friction coefficients ranged from 0.05 to 0.09. Details ofthe correction procedures have been presented elsewhere (Boger et al., 2005).
The correction for biaxiality is simpler and much smaller than that for friction, Fig. 4.The side force is converted to a stress using the area of the specimen in contact with theside plates, and a Von Mises yield criterion (or other choice) is used to find the equivalenttensile stress for the biaxial state. Previous work showed that the choice of yield functionhas a minimal effect on this correction (Boger et al., 2005).
2.4. Simple shear test
A recently devised simple shear test (Rauch and Schmitt, 1989; Rauch, 1998; Lopeset al., 2003), shown schematically in Fig. 5, provides an alternate stress state for testingthat avoids the strain limitation caused by tensile necking. A set of specially designed fix-tures assures that there is little axial extension of the specimen and that the clamped edges
Tru
e S
tres
s (M
Pa)
True Strain
0
50
100
150
200
250
0 0.005 0.01 0.015 0.02
Raw Data, No Correction
Uniaxial Test(no side force)
Friction CorrectionOnly
Both Friction andBiaxial Corrections
TD, t = 3.2 mmSide Force = 12kN
Biaxial CorrectionOnly
Fig. 4. Raw and corrected tensile hardening from uniaxial tensile test and test with stabilizing side plate force.
b=3mm
F
FL=60mm
uW=15mm
Fig. 5. Geometry and dimensions of the simple shear test.
X.Y. Lou et al. / International Journal of Plasticity 23 (2007) 44–86 53
remain parallel and at nominally fixed distance apart, thus producing simple shear. Simpleshear tests were conducted at a nominal initial equivalent tensile strain rate of 2.4 · 10�3/sat a constant crosshead speed. Strain is computed from the output of a special mechanicalextensometer that records the relative axial displacement of the edges of the deformedregion on the specimen. The gage length of the extensometer is 2.0 mm while the samplewidth is 3.0 mm between the grips, so the effect of any slipping at the grips on the mea-sured strain is negligible. The shear stress r12 and engineering (not tensor) shear strainc12 are calculated as follows:

54 X.Y. Lou et al. / International Journal of Plasticity 23 (2007) 44–86
r12 ¼F
L � t ; c12 ¼ub
ð5Þ
where t is the sheet thickness.
2.5. Metallography and texture measurement
Samples used for optical metallography were cut from the gauge regions where thematerial was deformed uniformly. Specimens were mounted and successively groundand polished, finishing with 1 lm diamond paste in ethanol. Acetic picral solution (4.2 gpicric acid, 10 ml acetic acid, 70 ml ethanol and 10 ml water) was then used to etch for5–10 s. Care was taken to etch and examine specimens immediately after polishing toavoid oxidation effects. Polishing in some cases produced surface porosity, consistent withreports in the literature (Perez-Prado and Ruano, 2002).
Crystallographic texture measurement was performed by X-ray reflection using a Scin-tag X1 diffractometer with Cu Ka radiation at 40 kV and 35 mA. Mid-section surfaceswere used because examination showed that sheet surface textures differed from the centralportion. Samples were ground to the mid-section of the sheet using standard metallogra-phy polishing procedures, finishing with 1 lm diamond paste, and then dipped into 10–20% nital (nitric acid in methanol) for 60 s to remove the mechanical damage from grind-ing (Agnew, 2005). Pole figures for (0002), ð1 0�10Þ and ð10�11Þ were calculated and gen-erated using popLA software (Kallend et al., 1991).
2.6. Acoustic emission
Acoustic emission (AE) technology is a non-destructive testing method used widely inindustry for detecting leakage in vessel and pipe systems. The internal structure evolution,such as crack growth, dislocation slip and twinning, can also be monitored during plasticdeformation (Huang et al., 1998). In recent years, deformation of magnesium alloys hasbeen studied using AE (Chmelik et al., 2002a,b; Bohlen et al., 2004a,b; Lamark et al.,2004). Two types of AE signal, burst AE and continuous AE, can often be distinguishedin AE analysis. The start and end of a burst signal can be distinguished from backgroundnoise, in contrast to a continuous signal. A burst-type AE signal with variable (Toron-chuk, 1977) amplitude is identified with twinning (Friesel and Carpenter, 1984a,b; Bohlenet al., 2002), in contrast to the continuous (Friesel and Carpenter, 1984a,b), much lessintense (Skalskyi et al., 2003) AE signal corresponding to dislocation slip. The AE signalis dominated by the formation of twins (Heiple and Carpenter, 1987), i.e. the nucleation oftwins rather than their growth (Toronchuk, 1977).
In situ AE measurement was performed during selected mechanical tests using a Vallen-Systeme AMSY4 AE workstation (Reed and Walter, 2003) and a Deci PICO-Z acousticsensor with a Vallen-Systeme AEP3 preamplifier (Reed and Walter, 2003) mounted out-side of the gage length of each specimen. The acoustic threshold was set immediately priorto each test at a level just above ambient noise. Other system parameters include: 40 dbpre-amplifier gain, rearm time of 4 ms and duration discrimination time of 400 ls.
AE signals may be analyzed in a variety of ways. Cumulative AE count (Toronchuk,1977), AE time count rate (Friesel and Carpenter, 1984a,b; Bohlen et al., 2002) and straincount rate were used to analyze the mechanism of the mechanical response. Cumulative

X.Y. Lou et al. / International Journal of Plasticity 23 (2007) 44–86 55
AE count is the sum of the counts of all AE events. It is associated with the extent of twinformation in the material (Bohlen et al., 2002). AE time count rate or strain count rate arethe time or strain derivative of the AE cumulative count, and are similarly associated withthe rate of twin nucleation.
3. Results
The deformation mechanisms of Mg have been reported as outlined in Section 1, as hasthe mechanical response of textured Mg sheet under either monotonic or small-strain cyc-lic deformation. The testing reported here seeks to clarify the evolution of hardening underlarge-strain non-proportional deformation paths (specifically, reverse tension/compressionpaths).
3.1. Monotonic tension and compression tests
Large asymmetry of yield and hardening evolution is evident in monotonic tensile andcompressive tests, Fig. 6, consistent with reports in the literature (Ball and Prangnell, 1994;Nobre et al., 2002; Noster and Scholtes, 2003; Yukutake et al., 2003; Barnett et al., 2004).With the exception of the larger compressive strains attainable for the thicker material,there is little difference between the two thicknesses. While the tensile curves exhibit thestandard concave-down appearance (i.e. steadily decreasing hardening rate), the compres-sive curves exhibit an unusual concave-up aspect. An inflection is just discernible at thelimit of attainable strain for the 6.4 mm thick specimens, at approximately 0.08 strain.The various tensile yield stresses show considerable in-plane anisotropy, as shown in Table3. An anisotropy ratio for yield stress defined by the ratio of the yield stress in the trans-verse direction (the largest one measured) to that in the rolling direction (the smallest onemeasured) is 1.17 (0.2% offset) or 1.14 (0.4% offset).
The unusual compressive behavior is related to the activation of twinning by in-planecompression (Ball and Prangnell, 1994; Nobre et al., 2002; Yukutake et al., 2003; Barnettet al., 2004), as will be shown later. The yield stress anisotropy ratio in compression is 1.06(0.2% or 0.4% offset), considerably smaller than that for the slip-dominated deformationin tension. Comparison of Fig. 6a with b reveals only insignificant differences between themechanical responses of the AZ31B material of various thicknesses. In the remainder ofthis paper, results will be shown for only one thickness unless a significant differencewas noted.
Plots of width strain (measured directly) and thickness strain (determined asdescribed in Section 2 from width and axial strains), Fig. 7a, can be used to determinethe evolution of the plastic anisotropy ratio, or r-value, Fig. 7b. Cubic curves are fit tothe data shown in Fig. 7a, as shown, and are used to determine both the cumulative r-value and the instantaneous one. The cumulative r-value (i.e. determined from totalstrains) is more typically reported while the instantaneous r-value (determined fromincremental strains along the path) is of more direct interest for plasticity formulationsvia the normality rule. The cumulative r-values shown in Fig. 7b are similar to onesmeasured elsewhere for AZ31B (Avery et al., 1965; Agnew, 2002; Agnew and Duygulu,2005).
Contrary to the expectation for most cubic metals, Fig. 7b shows considerableevolution of plastic anisotropy ratios (r-values) in tension, particularly in the TD. This

Absolute True Strain
Absolute True Strain
Ab
solu
te T
rue
Str
ess
(MP
a)A
bso
lute
Tru
e S
tres
s (M
Pa)
0
50
100
150
200
250
300
350
0 0.05 0.1 0.15 0.2 0.25
TD45o
RD
TD
45o RD
t = 3.2 mm
Compression
Tension
0
50
100
150
200
250
300
350
0 0.05 0.1 0.15 0.2 0.25
RD
TD
45o
RD
45o
TD
t = 6.4 mm
Compression
Tension
a
b
Fig. 6. Uniaxial hardening in tension and compression in three directions: (a) 3.2 mm thick material, (b) 6.4 mmthick material.
Table 3In-plane yield and strain anisotropy of AZ31B Mg alloy
RD 45� TD rTD/rRD or rTD/rRD
rtensionyield ð0:2% offsetÞ 164 MPa 180 MPa 192 MPa 1.17
rcompressionyield ð0:2% offsetÞ 104 MPa 105 MPa 110 MPa 1.06
rtensionyield ð0:4% offsetÞ 167 MPa 182 MPa 191 MPa 1.14
rcompressionyield ð0:4% offsetÞ 106 MPa 107 MPa 112 MPa 1.06
rcumulativetension ð0 � 0:074Þ 1.7 2.6 4.3 2.5
rcumulativecompression ð0 � �0:074Þ 0.2 0.25 0.4 2.0
56 X.Y. Lou et al. / International Journal of Plasticity 23 (2007) 44–86

Thickness Plastic True Strain
Wid
th P
last
ic T
rue
Str
ain
0
0.02
0.04
0.06
0.08
0.1
0.12
0 0.01 0.02 0.03 0.04 0.05
TD
45o
RD
t = 3.2 mm
1
2
3
4
5
6
7
0 0.02 0.04 0.06 0.08 0.1 0.12 0.14
R-V
alu
e
Axial Plastic True Strain
t = 3.2 mm
TD
45o
RD
Cumulative r-valueInstantaneous r-value
a
b
Fig. 7. Evolution of r-value with tensile strain. (a) Relationship between axial strain and width strain; (b)cumulative r-value and instantaneous r-value.
X.Y. Lou et al. / International Journal of Plasticity 23 (2007) 44–86 57
evolution has been related to a transition from basal slip to non-basal slip (Avery et al.,1965; Agnew, 2002; Agnew and Duygulu, 2005; Horton et al., 2005b). Fig. 7b and Table3 also show considerable in-plane anisotropy of strain ratios, with anisotropy ratios of2.5 in tension, and 2.0 in compression (over a cumulative plastic strain range of 0 to±0.074). In summary, the yield and plastic strain anisotropy are larger in tension thanin compression, and anisotropy evolves remarkably rapidly compared with that of cubicmetals that do not exhibit twinning.

58 X.Y. Lou et al. / International Journal of Plasticity 23 (2007) 44–86
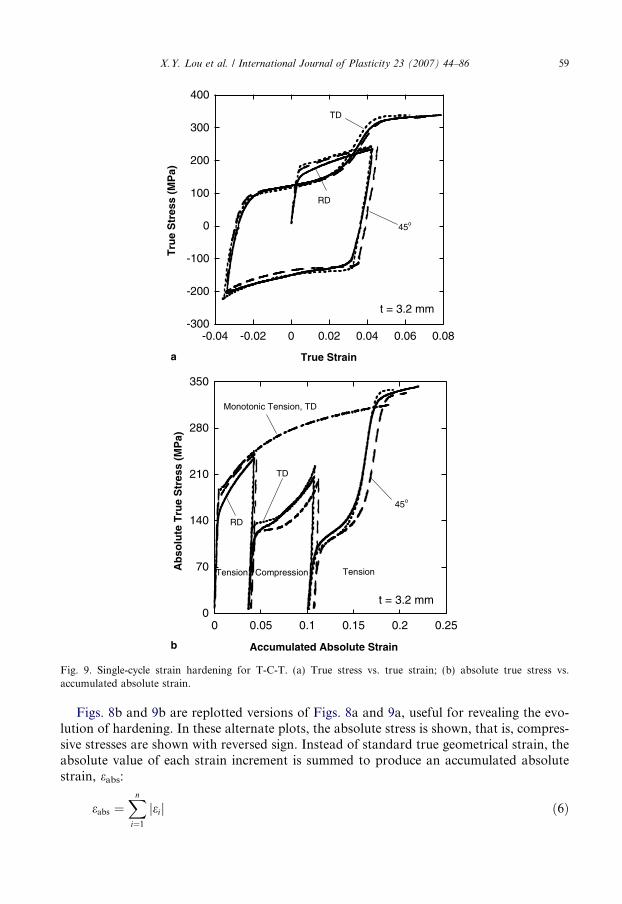
3.2. Cyclic tension/compression tests
Large-strain compression–tension-compression (C-T-C), Fig. 8, and tension–compres-sion-tension (T-C-T) tests, Fig. 9, were conducted for 3.2 mm thickness sheet in threedirections. Figs. 6, 8 and 9 illustrate the similarity of stress evolution among the threetested directions, although there are differences in yield stress related to textural anisotropyas discussed later. Subsequent plots will focus on a single direction unless significant dif-ference was noted.
-400
-200
0
200
400
-0.08 -0.06 -0.04 -0.02 0 0.02 0.04 0.06
True Strain
Tru
e S
tres
s (M
Pa)
TD
45o
RD
t = 3.2 mm
0
100
200
300
400
0 0.05 0.1 0.15 0.2 0.25 0.3
Accumulated Absolute Strain
Ab
solu
te T
rue
Str
ess
(MP
a)
Monotonic Tension, TD
t = 3.2 mm
TD
RD
45o
Compression Tension Compression
a
b
Fig. 8. Single-cycle strain hardening for C-T-C. (a) True stress vs. true strain; (b) absolute true stress vs.accumulated absolute strain.
True Strain
Tru
e S
tres
s (M
Pa)
Accumulated Absolute Strain
Ab
solu
te T
rue
Str
ess
(MP
a)
a
b
-300
-200
-100
0
100
200
300
400
-0.04 -0.02 0 0.02 0.04 0.06 0.08
TD
RD
t = 3.2 mm
45o
0
70
140
210
280
350
0 0.05 0.1 0.15 0.2 0.25
Monotonic Tension, TD
t = 3.2 mm
45o
TD
RD
Tension Compression Tension
Fig. 9. Single-cycle strain hardening for T-C-T. (a) True stress vs. true strain; (b) absolute true stress vs.accumulated absolute strain.
X.Y. Lou et al. / International Journal of Plasticity 23 (2007) 44–86 59
Figs. 8b and 9b are replotted versions of Figs. 8a and 9a, useful for revealing the evo-lution of hardening. In these alternate plots, the absolute stress is shown, that is, compres-sive stresses are shown with reversed sign. Instead of standard true geometrical strain, theabsolute value of each strain increment is summed to produce an accumulated absolutestrain, eabs:
eabs ¼Xn
i¼1
jeij ð6Þ

60 X.Y. Lou et al. / International Journal of Plasticity 23 (2007) 44–86
where ei refers to the strain accumulated in each of the n proportional-path segments of thetest. Plots in the form of Figs. 8b and 9b may readily be compared to those expected forthose obeying standard material models, i.e. those with isotropic hardening and symmetricyield (tension identical to compression). Under those conditions, plots such as Figs. 8b and9b collapse to a single curve, like that shown as ‘‘monotonic tension’’, with elastic unload-ing and loading excursions whenever the stress state is reversed. The very dramatic depar-ture of AZ31B from this ‘‘standard’’, or idealized, behavior is apparent.
The C-T-C tests reveal an inflected tension portion following the compressive pre-strain, an effect notably absent in the monotonic tensile tests. Similarly, the T-C-T testsshow no inflection upon initial tensile deformation, but the inflection appears duringcompression and subsequent tension. In all cases, the inflected hardening curve is accom-panied by yield stresses considerably less than those for the ‘‘normal’’ hardening behav-ior. The low flow stress appearing in tension after initial compression indicates that theasymmetry between monotonic tension and compression is not related to hydrostaticpressure.
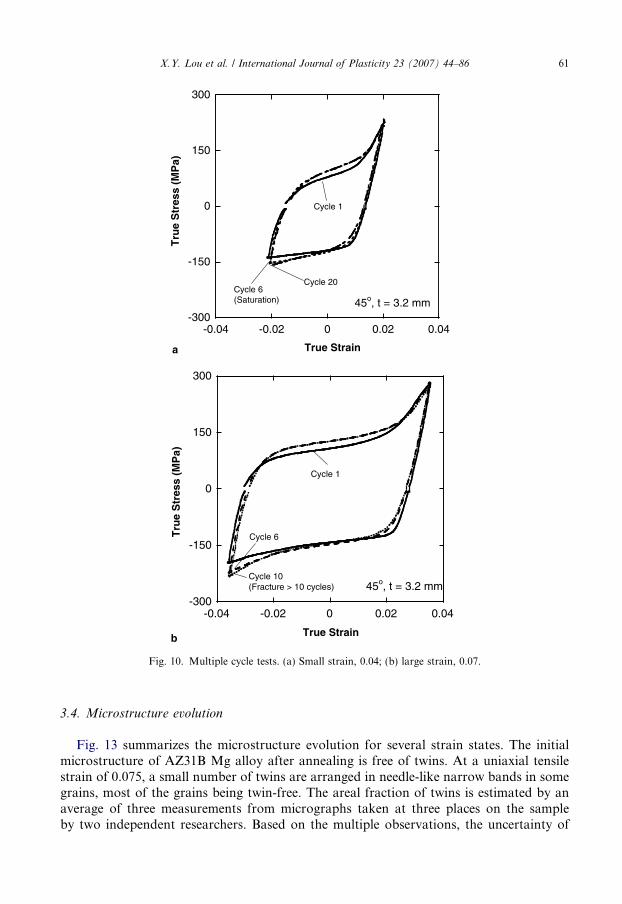
Multiple-cycle uniaxial tests were conducted using strain control for better cycle-to-cycle reproducibility. Strain ranges of 0.04 and 0.07 were set. All tests started with tension,and cycles were numbered starting from the first point of maximum compressive strain.(The initial tension and compression are labeled Cycle 0.)
Fig. 10 shows selected cycles from multiple-cycle tests. Both small and large strainamplitudes show a tendency to approach a saturated, static hysteresis loop, although inthe case of large strain amplitude, fracture initiated after 10 cycles. No fracture occurseven after 20 cycles at the small strain amplitude.
The saturation behavior of the cyclic tests may be quantified by the evolution of themaximum stress (rmax, positive in tension), the minimum stress (rmin, negative in compres-sion), and the stress amplitude ((rmax � rmin)/2), Fig. 11. The stress amplitude for bothstrain ranges saturates within 3–5 cycles. For the small-strain-range test, the maximumand minimum stresses saturate in a similar period. For the large-strain-range test, the min-imum stress continuously increases while the maximum stress first increases, thendecreases such that the average stress decreases continuously at large strains. This behav-ior may be related to damage evolution which reduces the tensile strength while having lesseffect on the compressive strength. The fact that the large-strain amplitude specimens frac-ture in tension at the 10th cycle tends to agree with this interpretation.
3.3. Simple shear test
In-plane simple shear is of interest for testing of basal-textured AZ31B Mg sheetbecause the in-plane principal strains nominally are opposite and equal, thus producingideally zero thickness strains. However, measurement in Mg sheet shows that smallthrough-thickness extensile strains, 0.02, occur during the initial deformation in simpleshear. Fig. 12 shows a typical result for simple shear in the RD. TD and 45� have similarflow curves as RD. Yield occurs at an equivalent tensile stress of �r ¼
ffiffiffi3p
r12 ¼ 175 MPa(0.2% offset). An equivalent tensile strain, �e ¼ c12=
ffiffiffi3p¼ 0:13, less than the tension limit,
is attained before fracture. Up to a strain of approximately 0.05, strain hardening is min-imal, with more rapid hardening thereafter. At a monotonic equivalent tensile strain of�e ¼ 0:13 the equivalent flow stress is 302 MPa. Upon reversal of shear, a significantBauschinger Effect appears.
True Strain
True Strain
Tru
e S
tres
s (M
Pa)
Tru
e S
tres
s (M
Pa)
a
b
-300
-150
0
150
300
-0.04 -0.02 0 0.02 0.04
Cycle 1
Cycle 6(Saturation)
Cycle 20
45o, t = 3.2 mm
-300
-150
0
150
300
-0.04 -0.02 0 0.02 0.04
Cycle 1
Cycle 6
Cycle 10(Fracture > 10 cycles) 45o, t = 3.2 mm
Fig. 10. Multiple cycle tests. (a) Small strain, 0.04; (b) large strain, 0.07.
X.Y. Lou et al. / International Journal of Plasticity 23 (2007) 44–86 61
3.4. Microstructure evolution
Fig. 13 summarizes the microstructure evolution for several strain states. The initialmicrostructure of AZ31B Mg alloy after annealing is free of twins. At a uniaxial tensilestrain of 0.075, a small number of twins are arranged in needle-like narrow bands in somegrains, most of the grains being twin-free. The areal fraction of twins is estimated by anaverage of three measurements from micrographs taken at three places on the sampleby two independent researchers. Based on the multiple observations, the uncertainty of

Cycles
Ab
solu
te S
tres
s (M
Pa)
Cycles
Ab
solu
te S
tres
s (M
Pa)
a
b
120
165
210
255
300
0 4 8 12 16
Max stress
Min stress
Stress amplitude
20
45o, t = 3.2 mm
120
165
210
255
300
0 4 8 12 16
Max stress
Min stress
Stress amplitude
20
45o, t = 3.2 mm
Fig. 11. Relationship between the stress and cycle number. (a) Small strain, 0.04; (b) large strain, 0.07.
62 X.Y. Lou et al. / International Journal of Plasticity 23 (2007) 44–86
the area measurement is estimated to be ±5% for larger twin fractions. The uncertaintyarises when twins intersect and it becomes difficult to distinguish twinned from untwinnedregions. At a tensile strain of 0.075, an areal fraction of 4% of the material is twinned, con-sistent with measurements reported in the literature (Koike, 2005).
When the material is loaded compressively, more twins in wider twin bands areobserved. The areal twin fraction increases from 26% (e = �0.023), to 58.4%(e = �0.046), to 71.9% (e = �0.072), similar to the reported results obtained using a neu-tron diffraction technique (Brown et al., 2005). This consistency suggests that the side-sup-porting force from the experimental fixture does not significantly suppress twinning

a
b
-200
-100
0
100
200
-400
-200
0
200
400
0 0.05 0.1 0.15 0.2
0 0.03 0.06 0.09 0.12
qE
iu
lav
e nt
T e
sn
elit
S er
ss1 ,.
3721
M(a
P)
Equivalent Tensile Strain,12
/1.73
Sh
eaert
S rss
,21
M(a
P)
Shear Strain,12
RD, t = 1mm
Shear stress-strain
Equivalent shearstress-strain
Ab
oslu
teh
S ae
S rtr
sse , |
21M( |
aP
)
0
50
100
150
200
0
50
100
150
200
250
300
350
0 0.1 0.2 0.3 0.4 0.5
0 0.05 0.1 0.15 0.2 0.25
Ab
o slu
t eq
E u
i va lent
T en
si let
S s e
rs,
. 1
|37
2 1( | M
aP
)
Accumulated Absolute EquivalentTensile Strain, |
12|/1.73
Accumulated Absolute Shear Strain, |12
|
RD, t = 1 mm
Shear stress-strain
Equivalent shearstress-strain
Fig. 12. Cyclic simple shear test results. (a) True stress–strain; (b) Effective stress–strain.
X.Y. Lou et al. / International Journal of Plasticity 23 (2007) 44–86 63
activity. Upon subsequent reverse tension to 0.04 strain, the wide twin bands formed dur-ing compression progressively disappear. Needle-shaped twins, similar to those observedin monotonic uniaxial tension, appear in the material. The areal fraction of twins drops

Fig. 13. Evolution of microstructure under various loading paths.
64 X.Y. Lou et al. / International Journal of Plasticity 23 (2007) 44–86
to about 6%, slightly larger than that of monotonic tension. As shown in Fig. 13, twinningalso occurs in monotonic simple shear, although at a slower rate than compression. Wide-band twins, similar in morphology to the compressive twins, can be readily identified.
3.5. Texture evolution
Fig. 14 illustrates the evolution of crystallographic texture during uniaxial tension andC-T tests. The scale indicates the diffraction intensity normalized to the randomly distrib-uted intensity, i.e. a value of 1.0 indicates the average intensity of random texture. The ini-tial texture of the annealed magnesium AZ31B sheet alloy is shown in Fig. 14a. The(000 2) basal pole figure exhibits a strong basal texture, with the majority of c-axes alignedin the sheet normal direction. There is some spreading of the basal pole along the rollingdirection and no preferred orientation for the prismatic plane f1010g or pyramidal planef1011g. As shown in Fig. 14b and reported in the literature, tensile straining does notalter the basal texture significantly (Agnew and Duygulu, 2003, 2005). After in-plane com-pression along the rolling direction, Fig. 14c, the basal pole moves to the rolling direction(i.e. the compression axis). Fig. 14d is the texture after the subsequent reverse tensionalong the rolling direction; it has a strong basal texture similar to the initial, annealedmaterial.
3.6. In situ acoustic emission
Figs. 15a and b show the cumulative acoustic emission count and time count rate dur-ing a T-C test. During the initial tension, the count rate is small, less than 104/s. During

01100002 1110
TD
RD
(a) Initial texture
(b) Texture after tension along RD (0.1 tensile strain)
RD
TD
01100002 1110
(c) Texture after compression along RD (0.07 compressive strain)
(d) Texture after reverse tension along RD (0.1 reverse tensile strain after
compression)
RD
TD
01100002 1110
RD
TD
01100002 1110
Fig. 14. Crystallographic texture in various deformation stages. The scale at right indicates the relative diffractionintensity (1.0 = random).
X.Y. Lou et al. / International Journal of Plasticity 23 (2007) 44–86 65
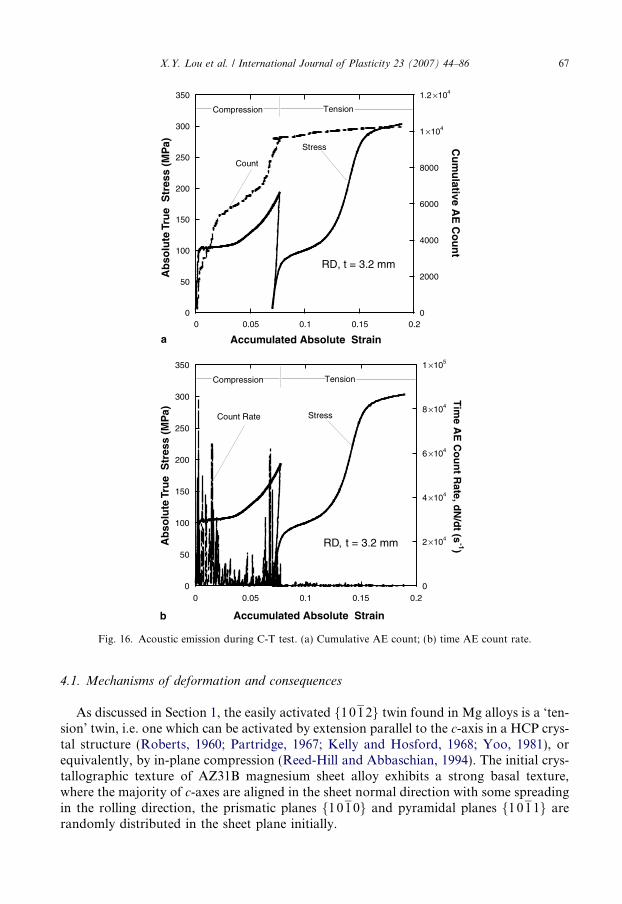
subsequent compressive yield, the count rate increases dramatically, and two strain rangeswith intense count rate are exhibited. The AE results are consistent with the metallo-graphic sections, pole figures and literature. Very limited twinning takes place duringin-plane tension starting from the initial texture. Upon in-plane compression, however,a rapid burst of twin creation occurs over a strain range of 0 to �0.02, followed by lowerrate from �0.02 to �0.05, followed by another burst from �0.05 to �0.07 (the largestcompressive strain attained in this test). It appears that there are two activation stressesfor twinning in this alloy, either related to two twin mechanisms or two sets of twin ori-entations. Rapid strain hardening accompanies the accumulated twin production, consis-tent with the role of twins as slip obstacles (Yoo, 1981).
Figs. 16a and b present AE and stress–strain results for a C-T test. Similar to the fore-going T-C test, initial compression induces two bursts of high twin rate separated by aregion of low twin rate. Again, the accumulated twin production is accompanied by highstrain hardening. The reverse tension hardening occurs at a much lower stress than initialcompression curve. This is consistent with the metallographic results showing the removalof twins throughout this region, or ‘‘untwinning’’ presumably without the large nucleationstress needed for twinning. However, the AE data shows only minimal activity in thisregion, similar to that for initial tension. Apparently the untwinning operation producesmuch lower acoustic signals than the twinning operation, which would be consistent witha lower activation stress.
A few T–C–T and C–T–C tests were preformed as acoustic emission was recorded. Thefinal compressive leg of the C–T–C tests show acoustic emission count rates that fallbetween those for initial twinning (initial compression) and for slip (initial tension) oruntwinning (tension after compression), Fig. 17. The final compression leg initially shows

0
50
100
150
200
250
0
5000
1 × 10⁴
1.5 × 10⁴
2 × 10⁴
2.5 × 10⁴
3 × 10⁴
3.5 × 10⁴
4 × 10⁴
0 0.02 0.04 0.06 0.08 0.1 0.12
Stress
Count
RD, t = 3.2 mm
Tension Compression
Accumulated Absolute Straina
b Accumulated Absolute Strain
Ab
solu
te T
rue
Str
ess
(MP
a)A
bso
lute
Tru
e S
tres
s (M
Pa)
Cu
mu
lative AE
Co
un
t
0
50
100
150
200
250
0
5 ×10⁴
1 ×10⁵
1.5 ×10⁵
2 ×10⁵
2.5 ×10⁵
3 ×10⁵
3.5 ×10⁵
0 0.02 0.04 0.06 0.08 0.1 0.12
emi
TA
EC
ou
nt
aR
t et
d/N
d ,( s
1-)
Stress
Count Rate
RD, t = 3.2 mm
Tension Compression
Fig. 15. Acoustic emission during T-C test. (a) Cumulative AE count; (b) time AE count rate.
66 X.Y. Lou et al. / International Journal of Plasticity 23 (2007) 44–86
count rates two or three times the minimal ones for untwinning or slip, but these risetoward the end of the leg to become one-third to one-half those for initial twinning.
4. Discussion
The foregoing experiments show that significant asymmetric yield and hardeningbehavior is exhibited in magnesium AZ31B sheet alloy at room temperature. An inflectedand concave strain hardening flow curve was observed in both compression and reversetension. A large Bauschinger Effect occurs during cyclic testing or simple shear testing.As has been widely reported in the literature, the origin of these effects lies in the activationof twinning under certain loading conditions.
Accumulated Absolute Straina
b Accumulated Absolute Strain
Ab
solu
te T
rue
Str
ess
(MP
a)A
bso
lute
Tru
e S
tres
s (M
Pa)
Cu
mu
lative AE
Co
un
te
miT
A E
Co
un
ta
R t e
td/
Nd,
(s1-)
0
50
100
150
200
250
300
350
0
2000
4000
6000
8000
1 ×10⁴
1.2 ×10⁴
0 0.05 0.1 0.15 0.2
Stress
Count
RD, t = 3.2 mm
Compression Tension
0
50
100
150
200
250
300
350
0
2 ×10⁴
4 ×10⁴
6 ×10⁴
8 ×10⁴
1 ×10⁵
0 0.05 0.1 0.15 0.2
Count Rate Stress
RD, t = 3.2 mm
Compression Tension
Fig. 16. Acoustic emission during C-T test. (a) Cumulative AE count; (b) time AE count rate.
X.Y. Lou et al. / International Journal of Plasticity 23 (2007) 44–86 67
4.1. Mechanisms of deformation and consequences
As discussed in Section 1, the easily activated f1012g twin found in Mg alloys is a ‘ten-sion’ twin, i.e. one which can be activated by extension parallel to the c-axis in a HCP crys-tal structure (Roberts, 1960; Partridge, 1967; Kelly and Hosford, 1968; Yoo, 1981), orequivalently, by in-plane compression (Reed-Hill and Abbaschian, 1994). The initial crys-tallographic texture of AZ31B magnesium sheet alloy exhibits a strong basal texture,where the majority of c-axes are aligned in the sheet normal direction with some spreadingin the rolling direction, the prismatic planes f1010g and pyramidal planes f1 011g arerandomly distributed in the sheet plane initially.

0
50
100
150
200
250
300
350
0
2000
4000
6000
8000
1×10⁴
1.2×10⁴
1.4×10⁴
1.6×10⁴
0 0.05 0.1 0.15 0.2 0.25
Ab
solu
te T
rue
Str
ess
(MP
a)
Accumulated Absolute Strain
Cu
mu
lative AE
Co
un
t
Count
Stress
Compression Tension Compression
RD, t = 3.2 mm
0
50
100
150
200
250
300
350
0
2×10⁴
4×10⁴
6×10⁴
8×10⁴
1×10⁵
0 0.05 0.1 0.15 0.2 0.25
Ab
solu
te T
rue
Str
ess
(MP
a)
Accumulated Absolute Strain
Tim
e AE
Co
un
t Rate, d
N/d
t (s-1)RD, t = 3.2 mm
Count Rate
Stress
Compression Tension Compression
Fig. 17. Acoustic emission during C–T–C test. (a) Cumulative AE count; (b) time AE count rate.
68 X.Y. Lou et al. / International Journal of Plasticity 23 (2007) 44–86
An in-plane compressive stress results in twinning, while in-plane tension with a con-traction along c-axes does not. Therefore, optical microscopy shows only a small numberof local, narrow band twins after in-plane uniaxial tension. These twins are producedunder tension stress state because even in the highly textured sheet the c-axis orientationof some grains may be aligned with the loading direction, or because of stress state inho-mogeneities introduced by inter-grain interactions (Koike, 2005). It should be noted that aspreading of basal pole along the rolling direction allows easier activation of basal slip byRD tension. The strong basal texture in TD requires activation of non-basal slip, whichincreases the yield stress. The higher incidence of non-basal Æaæ slip relative to basal Æaæ slipduring TD tension is responsible for the higher r-value of TD than that of RD and 45�(Agnew and Duygulu, 2003). Under tension, there is little thickness strain, but the activity

X.Y. Lou et al. / International Journal of Plasticity 23 (2007) 44–86 69
of non-basal Æaæ slip produces large width strain, thus a large r-value (Koike, 2005). Dur-ing tension, non-basal slip is progressively activated as the stress increases, thus the r-valueincreases with tensile strain.
After in-plane compression along RD, significant wide-band twins appear and the basalpole of the texture shifts rapidly to the rolling direction. This is characteristic of f1012gtwinning, which rotates the c-axes toward the compressive loading direction. An arealfraction of 71.9% twinned area is observed at a compressive strain of 0.072. Twinning pro-duces significant thickness strain in compression, thus, the compressive r-values in all threedirections are smaller than 1. For pure twinning deformation under in-plane compressionof a perfectly c-texture sheet with random axis orientations in the plane, an r-value of�0.09 is expected, as demonstrated in Appendix. An overall small, positive r-value forcompression reflects the contribution of slip to the total deformation. Because of theexhaustion of twinning and dominance of slip at large compressive strain, compressiver-values increase with compressive strain.
Subsequent in-plane tension produces an extension along the c-axes of these newlyaligned crystals, activating an untwinning process. Untwinning rotates the c-axes ofuntwinned regions back to the sheet normal direction, thus the strong basal texture againappears in the texture. The microstructure shows that the originally formed wide-bandtwins disappear, instead, only a few narrow-band twins remain, similar to the uniaxial ten-sile condition. Untwinning removes the original twins and produces the reverse of the pre-vious strain caused by twinning. From the metallographic and texture evidence, it is clearthat, untwinning is the critical mechanism during subsequent tensile deformation (i.e. fol-lowing compression) as opposed to nucleation and growth of new twins in alternate ori-entations. The untwinning flow curve is very similar in appearance to the originalcompression curve, i.e. with a sigmoidal aspect having an inflection.
4.2. Working model of deformation mechanisms
A working model of the deformation mechanisms under reverse loading may be con-structed consistent with the experimental results presented here and with those appearingin the literature (Staroselsky and Anand, 2003; Yukutake et al., 2003). (A ‘‘workingmodel,’’ as used here, is a conceptual framework of which some aspects are subject toexperimental verification.) The conceptual result is shown schematically in Fig. 18 forthree strain paths: monotonic tension, monotonic compression, and reverse tension fol-lowing compression. The first and last of these are experimental ones, with the monotoniccompression curve being a composite curve, derived as outlined below.
As shown in Fig. 18, the initial plastic modulus at yield in tension (after a brief yieldpoint phenomenon presumably related to twinning) is approximately 2000 MPa. Thisslope may be conveniently used to identify two other characteristic points on the stress–strain curves. When associated with concave-up curvature, it represents a mid-pointbetween twin-dominated and slip-dominated flows. When associated with concave-downcurvature, it signals the end of the twin-facilitated flow and may be used to characterizeslip resistance, or ‘‘slip-dominated flow stress’’.
The composite monotonic compression curve consists of a first experimental portionand second portion translated from an experimental reverse tension curve (which extendsthe attainable strain range). The second curve is translated in stress and strain until thepoints on the two curves having 2000 MPa slopes (and concave-up curvature) coincide.

Absolute True Strain
Hard
enin
g R
ateA
bso
lute
Tru
e S
tres
s (M
Pa)
0
100
200
300
400
0
5000
1×10⁴
1.5×10⁴
2×10⁴
2.5 ×10⁴
3×10⁴
0 0.05 0.1 0.15 0.2
Slip-dominated Yield(Slope = 2000MPa)
Monotonic tension
Monotoniccompression
Compressionhardening rate
Reverse tensionhardening rate
Reverse tensionTwin and textureobstacle effect
2000MPa
2000MPa
Fig. 18. Schematic of strain hardening. Note that the monotonic compression curve is a composite one,constructed as described in the text.
70 X.Y. Lou et al. / International Journal of Plasticity 23 (2007) 44–86
The working model may be described as follows. Monotonic tension exhibits the nor-mal strain-hardening aspect encountered in non-twinning materials, although some smallamount of twinning is present, as shown by metallography and AE, presumably asrequired for arbitrary deformation with activation of only four independent slip systems.Because twinning is difficult during in-plane tension, the constraints of the limited numberof independent slip systems cause a high yield and flow stress, with hardening consistentwith a predominant slip deformation.
Monotonic compression exhibits a lower yield stress and initial hardening rate than ten-sion because twinning is facilitated. However, after a strain of approximately 0.05, thehardening rate increases rapidly as the capacity for twinning is exhausted locally withinthe polycrystal. The reverse tension flow curve exhibits lower yield stress than monotoniccompression, consistent with reported low twin propagation stresses relative to twin nucle-ation stresses (Partridge, 1965; Reed-Hill and Abbaschian, 1994). Untwinning does notinvolve nucleation of twins, thus, the stress of untwinning is less than that of twinning(Partridge, 1965).
The simple shear test exhibits a similar, but less dramatic, flow curve. Initial yield is fol-lowed by a low hardening rate up to a strain of 0.05, at which time the hardening rateincreases, giving a concave-up aspect. This appearance is consistent with twinning andconcurrent slip. However, twinning cannot occur without an accompanying through-thickness extensile strain in the initially basal-texture sheet. After a simple shear strainof 0.1, the thickness strain was carefully measured and found to be 0.02 with a measure-ment uncertainty of ±0.007, consistent with the presence of twinning. The sheet area of theshear specimen is not constant during the deformation, as would be expected for an iso-tropic material or for a rigorously controlled shear test. It appears that the complianceof the fixture, or laterally slipping in the grips, allows some material contraction normalto the applied displacement. The in-plane compression resistance under a principal
X.Y. Lou et al. / International Journal of Plasticity 23 (2007) 44–86 71
compressive stress is less than that of the more difficult in-plane extension under the prin-cipal tensile stress, thus favoring a net contraction in the plane and net extension throughthe thickness.
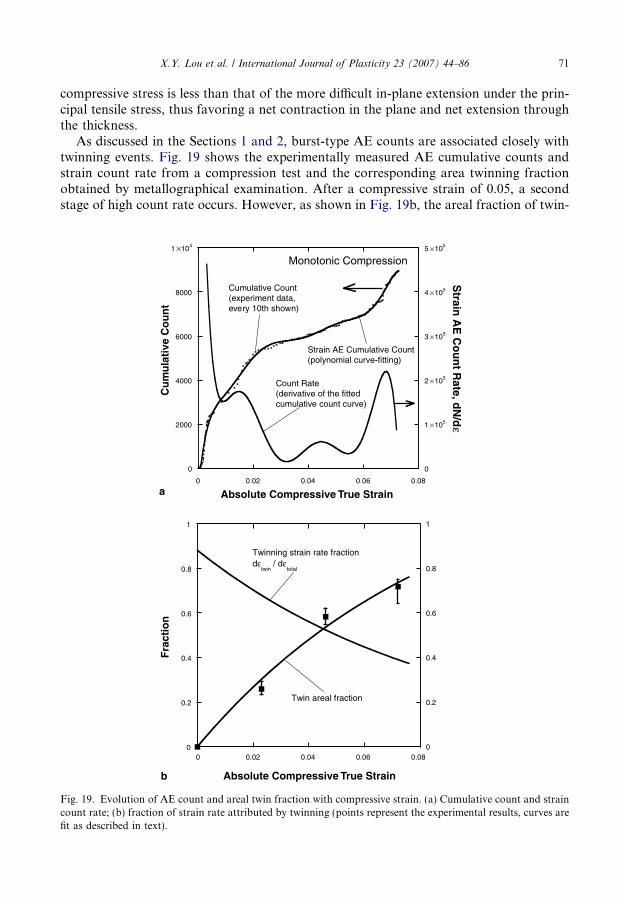
As discussed in the Sections 1 and 2, burst-type AE counts are associated closely withtwinning events. Fig. 19 shows the experimentally measured AE cumulative counts andstrain count rate from a compression test and the corresponding area twinning fractionobtained by metallographical examination. After a compressive strain of 0.05, a secondstage of high count rate occurs. However, as shown in Fig. 19b, the areal fraction of twin-
Absolute Compressive True Strain
Absolute Compressive True Strain
Fra
ctio
nC
um
ula
tive
Co
un
t
a
b
0
2000
4000
6000
8000
1 ×10⁴
0
1 ×10⁵
2 ×10⁵
3 ×10⁵
4 ×10⁵
5 ×10⁵
0 0.02 0.04 0.06 0.08
0 0.02 0.04 0.06 0.08
d /N
d ,et
aR
tn
uo
C E
A n i
a rt
Sε
Count Rate(derivative of the fittedcumulative count curve)
Cumulative Count(experiment data,every 10th shown)
Strain AE Cumulative Count(polynomial curve-fitting)
Monotonic Compression
0
0.2
0.4
0.6
0.8
1
0
0.2
0.4
0.6
0.8
1
Twin areal fraction
Twinning strain rate fractiondε
twin / dε
total
Fig. 19. Evolution of AE count and areal twin fraction with compressive strain. (a) Cumulative count and straincount rate; (b) fraction of strain rate attributed by twinning (points represent the experimental results, curves arefit as described in text).
72 X.Y. Lou et al. / International Journal of Plasticity 23 (2007) 44–86
ning increases at a steadily decreasing rate, seemingly in disagreement with the AE data. Infact, this discrepancy confirms reports in the literature (Toronchuk, 1977; Friesel and Car-penter, 1984a; Friesel and Carpenter, 1984b; Heiple and Carpenter, 1987; Bohlen et al.,2002) that the AE counts are related to twin nucleation and initiation, rather than togrowth and thickening. The growth of twins has been reported to contribute to AE signalsone-to-two orders of magnitude less than nucleation (Toronchuk, 1977). It is also for thisreason that the AE signal for untwinning, which does not require nucleation, is quitesmall, Fig. 16.
With this interpretation of AE signals in mind, the strain-count-rate plot of Fig. 19a canbe understood. The first peak is associated with nucleation of twins of the principal type inMg, f1012g twin. As straining proceeds, fewer new twins are nucleated because of unfa-vorable grain orientations and the already activated ones continue to grow without anaccompanying large AE signal. As these favorable twins become exhausted, the stress risesand either a new type of twin begins to be nucleated (for example, f1011g and f3032gtwins have been observed in large tensile strains in Mg (Koike, 2005)), or possibly unfa-vorably oriented grains can accommodate twinning at the high stress.
The strain rate fraction attributable to twinning plotted in Fig. 19b is computed from acurve fit to the measured cumulative twin fraction, that is, Ftwin = 1.3224 Æ (1 � e�11.301e) inFig. 19b. A fully twinned Mg single crystal produces an compressive strain of 6.4% (Kocksand Westlake, 1967). However, for a basal textured sheet with random in-plane orienta-tion of the Æaæ axes, the equivalent compressive strain is 5.9% (see Appendix A). Assumingthat the areal twin fraction is proportional to the strain from twinning, the twinning straincan be computed:
etwin ¼ F twin � 0:059 ð7Þ
Similarly, the slope of the twin fraction curve gives the twin fraction rate, i.e. the increaseof twin fraction per unit strain, _F twin:
_F twin ¼dF twin
detotal
ð8Þ
and the fraction strain rate attributable to twinning is:
_etwin ¼detwin
detotal
¼ _F twin � 0:059 ð9Þ
Since the total strain rate is contributed by slip strain rate and twinning strain rate, thus
_etotal ¼ _etwin þ _eslip ð10ÞCalculations such as these, which are clearly approximate, complete the basic workingmodel. The strain mechanisms are dominated by twinning activity in initial compression,but by slip as twinning becomes more difficult as it approaches exhaustion. A transitionpoint between twinning and slip dominated deformation may be defined by equal slipand twinning strain rates. This occurs at a compressive strain of 0.05 in AZ31B as testedhere. The flow stress is determined by the stress needed to activate all of the required mech-anisms in order to maintain compatibility by providing the Von Mises-required five inde-pendent deformation mechanisms. The initial twinning activation stress is high, withtwinning growth occurring more readily (and with little AE signal). However, twinningis both polar and of limited extent. In addition, twins function as obstacles to dislocation

X.Y. Lou et al. / International Journal of Plasticity 23 (2007) 44–86 73
motion and twinning causes rapid textural changes that in the case of Mg cause texturalsoftening initially. For all of these reasons, the flow stress inevitably increases as twinningproceeds, at first slowly during the growth stage. As exhaustion is approached, as a denseset of twin obstacles is established, the stress increases rapidly. Eventually, the flow stressbecomes so high that local cracks are created and propagated by incompatibility caused byremoving twinning from the mix of independent deformation mechanisms.
A working model has been established which accounts for the principal characteristicsof monotonic and reverse deformation paths in terms of slip, twinning and untwinning.Continuous reverse tests can also reveal secondary characteristics of interest for formulat-ing an accurate constitutive model.
4.3. Quantitative analysis of hardening mechanisms
The flow stress of a polycrystal is determined by the critical resolved shear stress of thedeformation mechanisms, their orientation to the applied stress, and the role of variousobstacles to the operation of such mechanisms: dislocations, solutes, precipitates, andgrain/twin boundaries. Determination of the relative magnitude of these effects is notstraightforward, but quantitative estimates can be made.
For the Mg AZ31B alloy tested here, the analysis is simplified because there are no pre-cipitates, the solute content is constant, and the grain size is constant. Furthermore, bylimiting the analysis to a saturated tension-compression loop (say, the 10th cycle shownin Fig. 10b, which is nearly identical to the 6th-through-9th cycles), isotropic hardeningfrom dislocation accumulation can be avoided and thus ignored in subsequent analysis(Ohno, 1982; Kang et al., 2003). Fig. 20a shows the same data as Fig. 10b, but in termsof more convenient variables for comparison: absolute stress and absolute true strain fol-lowing the stress reversal. Such a plot emphasizes the flow differences between tension andcompression, and the similarity of hardening for the first strain range after the stressreversal.
To begin to separate the other effects on hardening, the stresses near the start of plasticflow in the tension and compression segments of the saturated testing cycle, rT
0 andrC
0 , respectively, are compared. The difference arises from various roles of twinning:(1) CRSS for twinning vs. untwinning, rtwinning � runtwinning; (2) the obstacle effect of twinson slip, Drobstacle, (3) texture hardening caused by evolution of texture, Drtexture =rw/twins � rw/o twins (i.e. the difference in flow stress attributable to the difference in thetwinned texture and the annealed, untwinned texture):
rT0 � rC
0 ¼ �ðrtwinning � runtwinningÞ þ Drtexture þ Drobstacle ð11ÞAs noted above, dislocation multiplication is ignored in Eq. (11) because a) very little suchmultiplication is expected in saturated cycles; b) even if such multiplication did occur asstraining proceeded, the symmetry of the slip situation for the two legs would produceno change in the difference ðrT
0 � rC0 Þ, Eq. (11); and c) recent work has shown that dislo-
cation multiplication does not affect the CRSS for twinning (Jain and Agnew 2006). There-fore, (rtwinning � runtwinning) is expected to be approximately independent of strain.
The texture hardening component of Eq. (11) is related primarily to texture changescaused by twinning since texture hardening from slip evolves much more slowly andcan be ignored over the small strain range considered here. (Note that Drtexture is negative,Appendix B. This means that the twinned texture for which rT
0 is measured is oriented
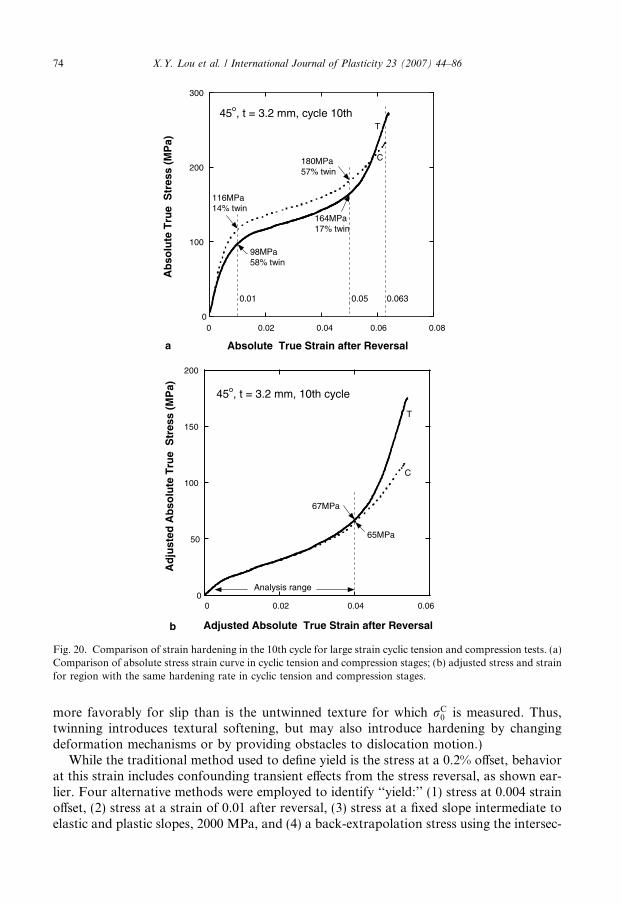
a
b
Absolute True Strain after Reversal
Adjusted Absolute True Strain after Reversal
Ab
solu
te T
rue
Str
ess
(MP
a)A
dju
sted
Ab
solu
te T
rue
Str
ess
(MP
a)
0
100
200
300
0 0.02 0.04 0.06 0.08
0 0.02 0.04 0.06
C
T
98MPa58% twin
45o, t = 3.2 mm, cycle 10th
0.0630.01
116MPa14% twin
164MPa17% twin
0.05
180MPa57% twin
0
50
100
150
200
C
T
45o, t = 3.2 mm, 10th cycle
67MPa
65MPa
Analysis range
Fig. 20. Comparison of strain hardening in the 10th cycle for large strain cyclic tension and compression tests. (a)Comparison of absolute stress strain curve in cyclic tension and compression stages; (b) adjusted stress and strainfor region with the same hardening rate in cyclic tension and compression stages.
74 X.Y. Lou et al. / International Journal of Plasticity 23 (2007) 44–86
more favorably for slip than is the untwinned texture for which rC0 is measured. Thus,
twinning introduces textural softening, but may also introduce hardening by changingdeformation mechanisms or by providing obstacles to dislocation motion.)
While the traditional method used to define yield is the stress at a 0.2% offset, behaviorat this strain includes confounding transient effects from the stress reversal, as shown ear-lier. Four alternative methods were employed to identify ‘‘yield:’’ (1) stress at 0.004 strainoffset, (2) stress at a strain of 0.01 after reversal, (3) stress at a fixed slope intermediate toelastic and plastic slopes, 2000 MPa, and (4) a back-extrapolation stress using the intersec-

X.Y. Lou et al. / International Journal of Plasticity 23 (2007) 44–86 75
tion of the extended linear region of the hardening curve with the extended initial linearelastic region. The last method is particularly convenient for this twinning materialbecause the hardening curves for both tension and compression show a very nearly linearregion with common slope of 1200 MPa over a significant strain range, Fig. 20a. As shownin Table 4, the individual yield stresses obtained by these methods differ by up to 12 MPa,but the difference between the tensile and compressive yield stresses, rT
0 and rC0 , is nearly
independent of method: 18–19 MPa.The difference in strains where the yield points occur in tension and compression for
each of the three methods, eT0 and eC
0 , differ only slightly, from �0.0002 to 0.0002 strain,Table 4. This consistency emphasizes the role of transient yield just following stress rever-sal. (Note. The yield strains corresponding to the yield stresses obtained by the back-extrapolation method are defined by the strain at which the measured flow curves attainthe yield stress.)
Adopting the predominant value of Drtexture for all subsequent analysis, Eq. (11) canthus be made explicit, as follows:
rT0 � rC
0 ¼ �ðrtwinning � runtwinningÞ þ Drtexture þ Drobstacle ¼ �18 MPa ð12ÞFig. 20a shows the yield stresses and strains determined by a strain of 0.01 after reversal,one of the choices compared in Table 4. Also shown on Fig. 20a are the estimated twinfractions at strains after reversal of 0.01 and 0.05 for tension and compression stages.These fractions are estimated from Fig. 19b as follows: For the compressive stage of cyclicdeformation, Fig. 19b is used directly. That is, at strains of 0.01 and 0.05, the correspond-ing twin fractions may be obtained from the corresponding twin areal fractions shown.This assumes that the twin fraction at the start of the cycle is nearly zero, consistent withthe metallographic measurement following a large tensile cycle. For the tensile stage ofcyclic deformation, Fig. 19b is used starting from a strain of 0.063 and reading backwardsto account for untwinning. That is, at the start of the tension stage, a twin fraction of 58%is expected based on Fig. 19b at 0.053 (=0.063 � 0.01). At a tensile strain of 0.05, a twinfraction of 17% is obtained at a strain of 0.013 (=0.063 � 0.05).
For the remaining analysis, the strain hardening over a common part of the strain rangefrom tension and compression legs of the saturated cycle will be analyzed. Fig. 20b is areplot of Fig. 20a in terms of ðrT � rT
0 Þ or ðrC � rC0 Þ, and ðeT � eT
0 Þ. That is, Fig. 20b rep-resents the strain hardening following the initial, transient region following the reversal,which is identical within experimental error up to a subsequent strain of 0.04. After that,the differences are presumably related to the earlier exhaustion of untwinning for the ten-sile curve, and consequent activation of deformation mechanisms with higher CRSS. Theearlier exhaustion is expected in tension because only 70% of the available regions areindeed twinned at a compressive strain of �0.07.
Table 4Stress and strain and their difference at starting point of parallel region in the 10th cycle of cyclic deformation
Criterion rT0 ðMPaÞ rC
0 ðMPaÞ rT0 � rC
0 ðMPaÞ eT0 eC
0 eT0 � eC
0
Strain offset of 0.004 98 117 �19 0.0100 0.0102 �0.0002Strain after reversal of 0.01 98 116 �18 0.01 0.01 0.00Slope of 2000 MPa 110 128 �18 0.0144 0.0142 0.0002Back-extrapolation 100 118 �18 0.0108 0.0106 0.0002

76 X.Y. Lou et al. / International Journal of Plasticity 23 (2007) 44–86
The remaining analysis compares strain hardening during tensile and compressive seg-ments of the saturated cycle over the common strain range following reversal: 0.01–0.05(or 0.0–0.04 range after ‘‘yield’’ as defined above). In terms of the definitions adoptedabove, the stress difference at the end of each segment may be expressed as follows:
ðrTf � rC
f Þ ¼ ðrtwinning � runtwinningÞ � Drtexture � Drobstacle ð13Þwhich may be combined with Eq. (12) and expressed explicitly using the differences shownin Fig. 20b:
ðrTf � rC
f Þ � ðrT0 � rC
0 Þ ¼ 2 MPa ¼ �2Drtexture � 2Drobstacle ð14ÞEqs. (12) and (14) have three unknowns and thus cannot be solved for the desired vari-ables. Fortunately, Drtexture can be assessed independently, Appendix B, from the texturesshown in Fig. 14: Drtexture = �10 MPa. With this additional information, the various con-tributions of twinning to hardening can be deconvoluted by solving equations: Drtexture =�10 MPa, Drobstacle = 9 MPa, and rtwinning � runtwinning = 17 MPa. Thus, the roles oftwins on texture hardening and as obstacles are of the same magnitude, while the differ-ence between activation of twinning vs. untwinning is twice as large.
4.4. Complex reverse paths
T-C-T tests were carried out with initial tensile prestrains of various values, followed byfixed compressive and tensile strain ranges of �0.07, Fig. 21. Raw plots like Fig. 21a aredifficult to interpret directly, but may be summarized in terms of yield stresses followingthe transitions, Fig. 20b and c. While it is traditional to use a yield stress defined by a0.2% offset, this value is insufficient to capture the essence of reverse yielding. Presumablybecause of large micro-plastic backflow of dislocations piled up at twin obstacles (Yoo,1981; Karaman et al., 2001), low effective unloading moduli and gradually curved elas-tic–plastic transitions are observed upon the stress transitions. As shown in Fig. 21b,the choice among slightly larger offset yield stresses, 0.4–1.0% makes little difference,but the 0.2% offset yield stress still lies in the rapidly changing portion of the stress–straincurve.
The behavior illustrated in Fig. 20a and b is typical of all of the transitions observed.Therefore, 0.4% offset yield stresses are used for comparison hereafter. In particular,Fig. 21 shows that tensile prestrain more than 0.03 increases the subsequent compressiveyield stress. The tentative conclusion is that the multiplication of dislocations in tension(and creation of a small number of local twins) creates obstacles that remain effective uponcompressive loading. This presumably occurs by increasing the activation stress for twin-ning which, according the working model, determines the flow stress.
Fig. 21c shows the subsequent compressive yield stress and the 2nd tensile yield stress(i.e. after variable tensile prestrain, the �0.07 compressive strain) as a function of the flowstress at the end of the first tension path. While the compressive yield stress (dominated bytwinning) increases markedly (50 MPa) corresponding to the pre-stress increase of80 MPa, the second reverse tension stress (dominated by untwinning) occurs at less thanhalf the compression value, and does not increase with pre-stress. These results indicatethat dislocation multiplication affects the twin nucleation stress, but has little or no effecton the untwinning stress, which does not require nucleation. The untwinning stress isapproximately half of the twinning stress.

a b
c
Tensile Plastic Prestrain
Tensile Prestress (MPa)
True StrainA
bso
lute
Co
mp
ress
ive
Yie
ld S
tres
s (M
Pa)
Ab
solu
te Y
ield
Str
ess
(MP
a)
Tru
e S
tres
s (M
Pa)
-400
-200
0
200
400
-0.1 -0.05 0 0.05 0.1 0.15 0.2
TD, t = 3.2 mm
Tensileprestrain:1 = 0.0172 = 0.043 = 0.0714 = 0.165
1 2 3 4
80
100
120
140
160
180
0 0.05 0.1 0.15 0.2
0.2%
0.4%
0.6%
0.8%
1.0%
TD, t = 3.2 mm
0
30
60
90
120
150
180
200 220 240 260 280 300 320
Compression yield(Twinning dominated)
2nd tension yield(Untwinning dominated)
TD, t = 3.2 mm
Fig. 21. Tension–compression-tension (T-C-T) results for various initial tensile prestrain. (a) Raw stress–straindata; (b) variation of reverse compressive yield stress based on several offset yield criteria; (c) variation of reversecompressive yield stress (0.4% offset) and second tensile yield stress (0.4% offset) with the final flow stress at theend of the tensile prestrain.
X.Y. Lou et al. / International Journal of Plasticity 23 (2007) 44–86 77
Fig. 22 analyzes C-T-C tests with various levels of initial compressive strain followed byfixed tensile strain and final compressive strain. Fig. 22a is the raw data and Fig. 22brelates reverse hardening parameters to initial compressive prestress (similar to Fig. 21cfor T-C-T tests). Consistent with the previous T-C-T results, the tension yield (untwinningcontrolled after the initial compression-produced twins) is unaffected by prestrain greaterthan 0.03 and occurs at a value of approximately 30–50 MPa. The slip-dominated flowpoint (where Eplastic = 2000 MPa) in tension increases dramatically (120 MPa) withincreasing compressive prestress (100 MPa), thus implying that even twinning followedby untwinning (and of course the even? large accumulated slip) leaves behind a high den-sity accumulated slip obstacle. The final compressive yield, in spite of the wide variation offlow stress immediately prior to the reversal, is almost unaffected by the preceding cycle

a
b
True Strain
Absolute Compressive Prestress (MPa)
Tru
e S
tres
s (M
Pa)
Ab
solu
te S
tres
s (M
Pa)
-400
-200
0
200
400
-0.1 -0.05 0 0.05 0.1
TD, t = 3.2 mm
Compressive prestrain:1 = 0.005 2 = 0.0153 = 0.021 4 = 0.0465 = 0.072
12345
0
70
140
210
280
350
100 120 140 160 180 200 220
Tension,slip-dominated flow point(E
plastic=2000MPa)
Tension yield(untwinning dominated)
2nd compression yield(twinning dominated)
TD, t = 3.2 mm
Fig. 22. Compression–tension-compression (C-T-C) results for various initial compressive prestrains. (a) rawstress–strain data; (b) variation of characteristic yield stresses (0.4% offset) and slip dominated flow points(Eplastic = 2000 MPa) with the final flow stress at the end of the compressive prestrain.
78 X.Y. Lou et al. / International Journal of Plasticity 23 (2007) 44–86
parameters, as is the subsequent hardening. It should be noted that the estimated slipactivity preceding the final compression is nearly the same in all cases, consistent withthe constant final compression yield stress observed.
In order to isolate the effect of untwinning better, C-T-C tests were conducted with sim-ilar compressive prestrains of 0.07, followed by tension to various strains, and then finalcompressive loading, Fig. 23a. The tensile part of the cycle subjects the material to moreuntwinning and slip. As shown in Fig. 23b, the second compressive yield stress increases(90 MPa) with increasing tensile flow stress just prior to the reversal (180 MPa). But
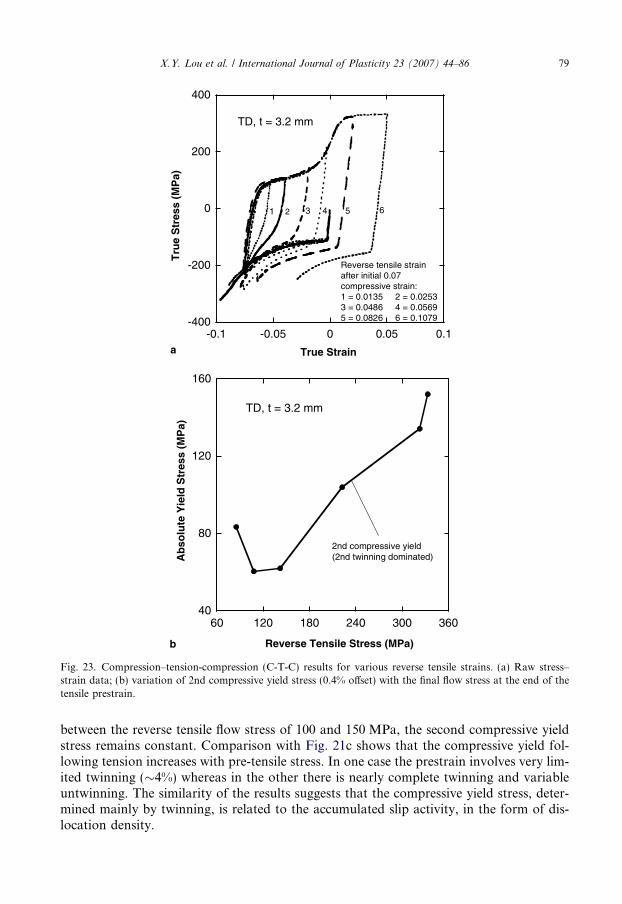
a
b
True Strain
Reverse Tensile Stress (MPa)
Tru
e S
tres
s (M
Pa)
Ab
solu
te Y
ield
Str
ess
(MP
a)
-400
-200
0
200
400
-0.1 -0.05 0 0.05 0.1
TD, t = 3.2 mm
1 2 3 4 5
Reverse tensile strainafter initial 0.07compressive strain:1 = 0.0135 2 = 0.02533 = 0.0486 4 = 0.05695 = 0.0826 6 = 0.1079
6
40
80
120
160
60 120 180 240 300 360
2nd compressive yield(2nd twinning dominated)
TD, t = 3.2 mm
Fig. 23. Compression–tension-compression (C-T-C) results for various reverse tensile strains. (a) Raw stress–strain data; (b) variation of 2nd compressive yield stress (0.4% offset) with the final flow stress at the end of thetensile prestrain.
X.Y. Lou et al. / International Journal of Plasticity 23 (2007) 44–86 79
between the reverse tensile flow stress of 100 and 150 MPa, the second compressive yieldstress remains constant. Comparison with Fig. 21c shows that the compressive yield fol-lowing tension increases with pre-tensile stress. In one case the prestrain involves very lim-ited twinning (�4%) whereas in the other there is nearly complete twinning and variableuntwinning. The similarity of the results suggests that the compressive yield stress, deter-mined mainly by twinning, is related to the accumulated slip activity, in the form of dis-location density.

80 X.Y. Lou et al. / International Journal of Plasticity 23 (2007) 44–86
5. Conclusions
A combination of mechanical and microstructural techniques has been used to revealthe nature and origin of continuous and reverse strain hardening of AZ31B magnesiumsheet alloy. The techniques include large-strain, continuous tension/compression testing,simple shear deformation, acoustic emission technology, optical metallography, and X-ray texture measurement. The monotonic deformation behavior, consistent with the lit-erature of Mg sheet deformation, involves multiple deformation mechanisms – basalslip, non-basal slip, and twinning. The reverse loading paths reveal new facets of thedeformation behavior. The mechanistic interpretation of four strain paths are asfollows:
1. For annealed sheet, uniaxial tensile deformation is dominated initially by basal slip withother contributions of non-basal slip and twinning to maintain local compatibility, giv-ing way progressively to non-basal slip as the flow stress rises. This is consistent withreports in the literature (Agnew and Duygulu, 2005). The hardening curve for this stressstate has the normal concave-down aspect.
2. In-plane compression of annealed sheet is initially predominantly by twinning with lim-ited basal slip for compatibility, progressively becoming dominated by basal slip as thestress rises and twinning approaches exhaustion. The transitions among these twostages provide the unusual S-shaped hardening curve observed in compression. Thisinterpretation is consistent with prior literature about deformation mechanisms of mag-nesium and magnesium alloy crystals (Kelly and Hosford, 1968).
3. In-plane tension following compressive deformation occurs predominantly by untwin-ning initially, a mechanism of shrinking existing twins that occurs at low appliedstress relative to twinning because it does not require twin nucleation. Compatibilityis maintained by slip. As existing twins disappear, the mechanism approaches exhaus-tion (the strain range depending on the degree of twinning introduced previously),and basal slip initially dominates, with growing fraction of non-basal slip. The tran-sitions among the three predominant mechanisms produce an S-shaped hardeningcurve similar to that in compression of annealed material, initially at a lower stressbecause of the relative ease of untwinning, but eventually at higher stress because unt-winning approaches exhaustion at a lower strain than that twinning did incompression.
4. In-plane simple shear excites a limited amount of twinning initially, consistent withobservations of small thickness changes. (Such thickness changes also arise from imper-fect boundary constraint of the shear specimen.) A concave-up hardening curve isobserved, related to this twinning, with a similar shape upon reverse tension, consistentwith untwinning.
Specific conclusions were also reached:
1. Acoustic emission (AE) signals of the burst type are strongly correlated with the nucle-ation of new twins, in agreement with a prior report (Toronchuk, 1977). The growth orshrinkage of twins, and deformation by slip, are more continuous and are nearly unde-tectable as AE burst activity. Therefore, strains from twinning cannot be correlatedquantitatively to burst-type AE signals.

X.Y. Lou et al. / International Journal of Plasticity 23 (2007) 44–86 81
2. Direct evidence from multiple techniques shows that the early stages of tensile deforma-tion following compression rely on untwinning rather than new twinning: a low flowstress consistent with no twin nucleation is observed, acoustic emission signals arelow during tension but are high during compression, metallographic observations showthat twin areal fractions decrease to prior levels during subsequent tension, and texturesreverse to near-original ones upon subsequent tension. Texture reversal correspondingto a low reverse stress is consistent with a report in the literature (Kleiner and Uggow-itzer, 2004).
3. The fraction of strain rate accommodated by twinning during compression has beenestimated quantitatively. It is initially near 90% and drops to 50% at a strain of �0.05.
4. AE signals show a second range of intense twin nucleation at compressive strains of0.06–0.07, near the exhaustion of primary twinning. Although it is has not been ver-ified metallographically, this appearance presumably correlates with the activation ofsecondary twins of the type f1011g and f3 032g, as noted in the literature (Koike,2005).
5. The exhaustion strain for 100% primary twinning (no slip contribution) is 0.059 for aperfectly c-textured, randomly a-textured, polycrystalline Mg sheet. A similar calcula-tion shows that the r-value for pure primary twinning is �0.09.
6. In-plane plastic anisotropy, of both yield stress and plastic strain ratios, is greater intension than in compression. The largest measured yield stresses and r-values are inthe TD and the smallest in RD, consistent with texture predictions of the ease ofnon-basal slip (Agnew and Duygulu, 2003).
7. R-values evolve rapidly in tension, consistent with observations in the literature of pro-gressively activated non-basal slip (Agnew and Duygulu, 2005).
8. Contrary to the behavior of ductile alloys with cubic crystal structures, fracture occursin simple shear at equivalent strains less than those attainable in uniaxial tension. Thisappears to be related to higher constraint of simple shear and the difficulty of HCPalloys to meet the Von Mises condition for arbitrary deformation, thus promoting brit-tle fracture rather than plastic localization.
9. The magnitudes of three strengthening mechanisms related to twinning have been esti-mated using a novel analysis of cyclic hardening. For a strain range of 4%, the harden-ing contributions as obstacles to slip and the texture change attributable to twinning areapproximately 9–10 MPa. The corresponding contribution of activation of twinning vs.untwinning is 17 MPa, approximately twice as large as the other contributions.
Acknowledgments
This work was sponsored through subcontract No. 4000028510 with UT-Battelle,with funding provided by the US Department of Energy, Assistant Secretary for EnergyEfficiency and Renewable Energy, Office of FreedomCAR and Vehicle Technologies, aspart of the High Strength Weight Reduction Materials Program. The authors thank Dr.Joe A. Horton (Oak Ridge National Laboratory) for providing the materials, Dr. MarkE. Walter (Ohio State University) for assistance with the acoustic emission technique,Dr. Frederic Barlat (Alcoa Technical Center) for the simple shear test equipment, andDr. Carlos Tome (Los Alamos National Laboratories) for the VPSC code with twinningcapabilities.

82 X.Y. Lou et al. / International Journal of Plasticity 23 (2007) 44–86
Appendix A. Equivalent in-plane compressive strain for a basal textured sheet with random
in-plane orientation of Æaæ axes
Simple shear caused by deformation twinning is expressed in a local coordinate systemas follows:
e0 ¼ 1
2
0 c 0
c 0 0
0 0 0
264
375 ðA1Þ
where c depends on c/a ratio of HCP metals. For AZ31B alloy, c/a = 1.624 and c = 0.129.Length change of arbitrary line element due to twinning can be examined by coordinatetransformation as follows:
e ¼ Re0RT ðA2Þwhere e is strain tensor expressed in the arbitrary coordinate system; R is rotation matrix,the components of which, Rij0 , is the direction cosine between two axes i and j 0.
Assuming an ideal basal texture with random in-plane Æaæ axes exists. Any arbitrary in-plane direction within ±30� of each f0�112gh01�11i twinning system is compressed withstrain ec by its activation, where ec is obtained from Eq. (A2). Only 30� is considereddue to crystalline symmetry. The effect of random in-plane Æaæ axes on equivalent compres-sive strain can be modeled by averaging ec of each line elements located between 0� and 30�away from the projection of twinning direction on basal plane as follows:
�e ¼R 30�
0� ecðhÞdhR 30�
0� dh¼ �0:059 ðA3Þ
Equivalent r-value from twinning in in-plane compression can be examined as follows:
�r ¼R 30�
0� rðhÞdhR 30�
0� dh¼ �0:09 ðA4Þ
where r is defined by the ratio of plastic strain in transverse direction to that in thicknessdirection.
Appendix B. Texture softening during in-plane compression
The role of texture evolution on strain hardening can be assessed by texture analysis.Visco-Plastic Self-Consistent method (Lebensohn and Tome, 1993), embodied in the soft-ware package VPSC, is one such method. VPSC was used to simulate the tensile yield oftwo measured textures: (a) an initial texture as measured before deformation, Fig. 14a, and(b) a texture after compression to a strain of �0.07, Fig. 14c. The differences in the textureare predominantly related to twinning, rather than to slip because evolution of texture isnearly imperceptible over this small strain range.
For purposes of separating the role of texture evolution on the ease of slip, only slipmodes were allowed in the tensile simulations: basal Æaæ, prismatic Æaæ and pyramidal Æc + a
slip modes were allowed while twinning modes were deactivated. A Voce-type hardeningwas employed
Table B1Voce parameters for slip modes used in VPSC, in MPa
sa0 sa
1 ha0
Basal Æaæ 24 26 180Prismatic Æaæ 88 50 250Pyramidal Æc + aæ 160 80 100
X.Y. Lou et al. / International Journal of Plasticity 23 (2007) 44–86 83
saCRSS ¼ sa
0 þ sa1 1� exp
�ha0c
sa1
� �� �ðB1Þ
where saCRSS denotes the threshold stress for slip system a; c denotes accumulated shear
strain in aggregate; sa0, ha
0, ha1 are material parameters for slip system a. The constants were
fit to reproduce the uniaxial tension flow curves along RD and TD as shown in Table B1.Tension tests along RD starting from the two textures are simulated using parameters
in Table B1. The 0.4% offset yield stresses computed for the annealed texture and thetwinned (i.e. compressed to �0.07 strain) texture are 190 and 172 MPa, respectively.Therefore, twinning produces texture softening of 18 MPa when compressively strainingfrom the annealed state (twin fraction = 0) to a strain of �0.07 (twin fraction = 0.72).
For application to a smaller strain range, the corresponding change of twin fraction(and therefore the corresponding texture) must be considered. For a strain range of0.01–0.05, the corresponding twin fractions are 0.14–0.17 (average 0.155) and 0.57–0.58(average 0.575), depending on whether the stage was tension or compression. The texturesoftening for this range can be estimated as follows:
Drtexture ¼0:575� 0:155
0:72� 0:0� ð�18 MPaÞ � �10 MPa ðB2Þ
References
Abel, A., 1987. Historical perspectives and some of the main features of the Bauschinger Effect. Mater. Forum 10(1), 11–26.
Agnew, S.R., 2002. Plastic anisotropy of magnesium alloy AZ31B sheet. In: Kaplan, H.I. (Ed.), TMS AnnualMeeting, Magnesium Technology 2002. TMS, Seattle, Washington, USA, pp. 169–174.
Agnew, S.R., 2003. Private communication.Agnew, S.R., 2005. Private communication.Agnew, S.R., Duygulu, O., 2003. A mechanistic understanding of the formability of magnesium: examining the
role of temperature on the deformation mechanisms. Mater. Sci. Forum 419–422, 177–188.Agnew, S.R., Duygulu, O., 2005. Plastic anisotropy and the role of non-basal slip in magnesium alloy AZ31B.
Int. J. Plast. 21, 1161–1193.Agnew, S.R., Tome, C.N., Brown, D.W., Holden, T.M., Vogel, S.C., 2003. Study of slip mechanisms in a
magnesium alloy by neutron diffraction and modeling. Scripta Mater. 48, 1003–1008.Agnew, S.R., Yoo, M.H., Tome, C.N., 2001. Application of texture simulation to understanding mechanical
behavior of Mg and solid solution alloys containing Li or Y. Acta Mater. 49, 4277–4289.ASTM-E8-00, 2000. Standard test methods for tension testing of metallic materials. ASTM, West Conshohocken,
PA, USA.Atkinson, J.D., Brown, L.M., Stobbs, W.M., 1974. Work-hardening of Cu–silica. Pt. 4. Bauschinger Effect and
plastic relaxation. Philos. Mag. 30 (6), 1247–1280.Attari, N., Robin, C., Pluvinage, G. 1990. Cyclic plastic deformation by twinning of a magnesium alloy GA3Z1.
In: (Ed.), Advanced Aluminium and Magnesium Alloys, Amsterdam, Netherlands, pp. 837–846.Avery, D.H., Hosford, W.F., Backofen, W.A., 1965. Plastic anisotropy in magnesium alloy sheets. Trans. Metall.
Soc. AIME 233, 71–78.
84 X.Y. Lou et al. / International Journal of Plasticity 23 (2007) 44–86
Bakarian, P.W., Mathewson, C.H., 1943. Slip and twinning of magnesium single crystals at elevatedtemperatures. Trans. AIME 152, 226.
Balakrishnan, V. 1999. Measurement of in-plane Bauschinger Effect in metal sheets. MS Thesis. The Ohio StateUniversity, Columbus, OH, USA.
Ball, E.A., Prangnell, P.B., 1994. Tensile-compressive yield asymmetries in high strength wrought magnesiumalloys. Scripta Metall. Mater. 31 (2), 111–116.
Barnett, M.R., Keshavarz, Z., Beer, A.G., Atwell, D., 2004. Influence of grain size on the compressivedeformation of wrought Mg–3Al–1Zn. Acta Mater. 52, 5093–5103.
Bauschinger, J. 1886. On the change of the elastic limit and the strength of iron and steel, by drawing out, byheating and cooling, and by repetition of loading (summary). Minutes of Proceedings of the Institution ofCivil Engineers with Other Selected and Abstracted Papers LXXXVII, p. 463.
Bettles, C.J., Gibson, M.A., 2005. Current wrought magnesium alloys: strengths and weaknesses. JOM 57(5), 46.
Boger, R.K., Wagoner, R.H., Barlat, F., Lee, M.G., Chung, K., 2005. Continuous, large strain, tension/compression testing of sheet material. Int. J. Plast. 21 (12), 2319–2343.
Bohlen, J., Chmelik, F., Dobron, P., Kaiser, F., Letzig, D., Lukac, P., Kainer, K.U., 2004a. Orientation effects onacoustic emission during tensile deformation of hot rolled magnesium alloy AZ31. J. Alloy. Compd. 378, 207–213.
Bohlen, J., Chmelik, F., Dobron, P., Letzig, D., Lukac, P., Kainer, K.U., 2004b. Acoustic emission during tensiletesting of magesium AZ alloys. J. Alloy. Compd. 378, 214–219.
Bohlen, J., Chmelik, F., Kaiser, F., Letzig, D., Lukac, P., Kainer, K.U., 2002. Acoustic emission generatedduring tensile deformation of an AZ31 magnesium sheet. Kovove Mater. 40, 290–297.
Brown, D.W., Agnew, S.R., Bourke, M.A.M., Holden, T.M., Vogel, S.C., Tome, C.N., 2005. Internal strain andtexture evolution during deformation twinning in magnesium. Mater. Sci. Eng. A 399, 1–12.
Brown, L.M., 1977. Orowan’s explaination of the Bauschinger Effect. Scripta Metall. Mater. 11, 127–131.
Burke, E.C., Hibbard, W.R., 1952. Plastic deformation of magnesium single crystals. Trans. Metall. Soc. AIME194, 295–303.
Caceres, C.H., Sumitomo, T., Veidt, M., 2003. Pseudoelastic behavior of cast magnesium AZ91 alloy under cyclicloading-unloading. Acta Mater. 51, 6211–6218.
Chmelik, F., Lukac, P., Janecek, M., Moll, F., Mordike, B.L., Kainer, K.U., Langdon, T.G., 2002a. Anevaluation of the creep characteristics of an AZ91 magnesium alloy composite using acoustic emission. Mater.Sci. Eng. A 338, 1–7.
Chmelik, F., Ziegenbein, A., Neuhauser, H., Lukac, P., 2002b. Investigating the Portevin-Le Chatelier effect bythe acoustic emission and laser extensometry techniques. Mater. Sci. Eng. A 324, 200–207.
Conrad, H., Robertson, W.D., 1957. Effect of temperature on the flow stress and strain-hardening coefficient ofmagnesium single crystals. Trans. AIME 209, 503.
Cubberly, W.H., Baker, H., Benjamin, D., Unterweiser, P.M., Kirkpatrick, C.W., Knoll, V., Nieman, K. (Eds.),. Properties and Selection: Nonferrous Alloys and Pure Metals, ninth ed.. Metals Handbook AmericanSociety for Metals.
Duygulu, O., Agnew, S.R., 2003. The effect of temperature and strain rate on the tensile properties of texturedmagnesium alloy AZ31B sheet. In: Kaplan, H. (Ed.), Magnesium Technology 2003. TMS, San Diego, CA,USA, pp. 237–242.
Friesel, M., Carpenter, S.H., 1984a. Determination of the source of acoustic emission generated during thedeformation of magnesium. J. Acous. Emission 3 (1), 11–17.
Friesel, M.A., Carpenter, S.H., 1984b. An inverted strain rate dependence of the acoustic emission generatedduring the deformation of high purity a-Ti. Mater. Sci. Eng. 68, 107–111.
Gharghouri, M.A. 1997. PhD Thesis. McMaster University, Ont., Canada.Gharghouri, M.A., Weatherly, G.C., Embury, J.D., Root, J., 1999. Study of the mechanical properties of Mg-
7.7at.% Al by in-situ neutron diffraction. Philos. Mag. A 79 (7), 1671–1695.Gsell, C., Boni, S., Shrivastava, S., 1983. Application of the plane simple shear test for determination of the
plastic behavior of solid polymersat large strains. J. Mater. Sci. 18 (3), 903–918.Hasegawa, T., Yakou, T., Kocks, U.F., 1986. Forward and reverse rearrangements of dislocations in tangled
walls. Mater. Sci. Eng. 81 (1–2), 189–199.Heiple, C.R., Carpenter, S.H., 1987. Acoustic emission produced by deformation of metals and alloys – a review:
part I. J. Acous. Emission 6 (3), 177–207.
X.Y. Lou et al. / International Journal of Plasticity 23 (2007) 44–86 85
Horton, J.A., Blue, C.A., Muth, T., Bowles, A.L., Agnew, S.R., 2005a. Infrared processing of magnesiumwrought alloys. In: Neelameggham, N.R., Kaplan, H.I., Powell, B.R. (Eds.), Magnesium Technology 2005.TMS, San Francisco, CA, USA, pp. 155–158.
Horton, J.A., Agnew, S.R., Diamond, S., Sklad, P.S., 2005b. Wrought magnesium alloy/process development. In:Wall, E., Sullivan, R., Diamond, S. (Eds.), FY 2004 Process Report for High Strength Weight ReductionMaterials. US Department of Energy, Washington, DC, pp. 25–32.
Hsu, S.S., Cullity, B.D., 1954. On the torsional deformation and recovery of single crystals. Trans. AIME 200,305.
Huang, M., Jiang, L., Liaw, P.K., Brooks, C.R., Seeley, R., Klarstrom, D.L., 1998. Using acoustic emission infatigue and fracture materials research. JOM-e 50 (11).
Jain, A., Agnew, S.R., 2006. Modeling the temperature dependent effect of twinning on the behavior ofmagnesium alloy AZ31B sheet. Mater. Sci. Eng. A, in press.
Kang, G., Ohno, N., Nebu, A., 2003. Constitutive modeling of strain range dependent cyclic hardening. Int. J.Plast. 19, 1801–1819.
Kallend, J.S., Kocks, U.F., Rollet, A.D., Wenk, H.R., 1991. Operational texture analysis. Mater. Sci. Eng. A 132,1–11.
Karaman, I., Sehitoglu, H., Chumlyakov, Y.I., Maier, H.J., Kireeva, I.V., 2001. The effect of twinning and slip onthe Bauschinger Effect of Hadfield steel single crystals. Metall. Mater. Trans. A 32A, 695–706.
Kelly, E.W., Hosford, W.F., 1968. Plane-strain compression of magnesium and magnesium alloy crystals. Trans.Metall. Soc. AIME 242, 5–13.
Keshavarz, Z., Barnett, M.R., 2005. In-situ investigation of twinning behavior in Mg–3Al–1Zn. In:Neelameggham, N.R., Kaplan, H.I., Powell, B.R. (Eds.), Magnesium Technology 2005. TMS, San Francisco,CA, USA, pp. 171–175.
Kleiner, S., Uggowitzer, P.J., 2004. Mechanical anisotropy of extruded Mg–6% Al–1% Zn alloy. Mater. Sci. Eng.A 379, 258–263.
Klimanek, P., Potzsch, A., 2002. Microstructure evolution under compressive plastic deformation of magnesiumat different temperatures and strain rates. Mater. Sci. Eng. A 324, 145–150.
Kocks, U.F., Westlake, D.G., 1967. The important of twinning for the ductility of CPH polycrystals. Trans.Metall. Soc. AIME 239, 1107–1109.
Koike, J., 2005. Enhanced deformation mechanisms by anisotropic plasticity in polycrystalline Mg alloys at roomtemperature. Metall. Mater. Trans. A 36A (7), 1689–1696.
Koike, J., Kobayashi, T., et al., 2003. The activity of non-basal slip systems and dynamic recovery at roomtemperature in fine-grained AZ31B magnesium alloys. Acta Mater. 51, 2055–2065.
Koike, J., Ohyama, R., 2005. Geometrical criterion for the activation of prismatic slip in AZ61 Mg alloy sheetsdeformed at room temperature. Acta Mater. 53 (7), 1963–1972.
Lamark, T.T., Chmelik, F., Estrin, Y., Lukac, P., 2004. Cyclic deformation of a magnesium alloy investigated bythe acoustic emission technique. J. Alloy. Compd. 378, 202–206.
Lebensohn, R.A., Tome, C.N., 1993. A self-consistent anisotropic approach for the simulation of plasticdeformation and texture development in polycrystals-application to zirconium alloys. Acta Metall. 41, 2611–2624.
Liu, Y., Xie, Z., Humbeeck, J.V., Delaey, L., 1999. Some results on the detwinning process in NiTi shape memoryalloys. Scripta Mater. 41 (12), 1273–1281.
Liu, Y., Xie, Z.L., 2003. Twinning and detwinning of Æ011æ type II twin in shape memory alloy. Acta Mater. 51,5529–5543.
Lopes, A.B., Barlat, F., Gracio, J.J., Duarte, J.F.F., Rauch, E.F., 2003. Effect of texture and microstructure onstrain hardening anisotropy for aluminum deformed in uniaxial tension and simple shear. Int. J. Plast. 19 (1),1–22.
Margolin, H., Hazaveh, F., Yaguchi, H., 1978. The grain boundary contribution to the Bauschinger Effect.Scripta Metall. Mater. 12 (12), 1141–1145.
McDonald, J.C., 1937. Grain orientation in rolled magnesium alloys. Phys. Rev. 52, 886–887.Magnesium Elektron Wrought Products North America, 1001 College Street, P.O. Box 258, Madison, IL 62060,
USA.MetalMart International, Inc. Mark Metals Division, 12225 Coast DR., Whittier, CA 90601, USA.Miura, S., 2004. Unpublished research. Hokkaido University, Hokkaido, Japan.Nave, M.D., Barnett, M.R., 2004. Microstructures and textures of pure magnesium deformed in plane-strain
compression. Scripta Mater. 51 (881–885).
86 X.Y. Lou et al. / International Journal of Plasticity 23 (2007) 44–86
Nobre, J.P., Noster, U., Kommeier, M., Dias, A.M., Scholtes, B., 2002. Deformation asymmetry of AZ31wrought magnesium alloy. Key Eng. Mater. 230–232, 267–270.
Noster, U., Scholtes, B., 2003. Isothermal strain-controlled quasi-static and cyclic deformation behavior ofmagnesium wrought alloy AZ31. Z. Metallkd. 94 (5), 559–563.
Obara, T., Yoshinga, H., Morozumi, S., 1973. f1122gh�1123 i slip system in magnesium. Acta Metall. Mater. 21,845–853.
Ohno, N., 1982. A constitutive model of cyclic plasticity with a nonhardening strain region. J. Appl. Mech. 49,721–727.
Partridge, P.G., 1965. Cyclic twinning in fatigued close-packed hexagonal metals. Philos. Mag. 12, 1043–1054.Partridge, P.G., 1967. The crystallography and deformation modes of hexagonal close-packed metals. Metall.
Rev. 12, 169–194.Perez-Prado, M.T., Ruano, O.A., 2002. Texture evolution during annealing of magnesium AZ31 alloy. Scripta
Mater. 46, 149–155.Rauch, E.F., 1998. Plastic anisotropy of sheet metals by simple shear tests. Mater. Sci. Eng. A 241, 179–183.Rauch, E.F., Schmitt, J.H., 1989. Dislocation substructures in mild steel deformed in simple shear. Mater. Sci.
Eng. A 113, 441–448.Reed, J.M., Walter, M.E., 2003. Observation of serrated flow of an Al–Mg alloy. Mater. Sci. Eng. A 359, 1–10.Reed-Hill, R.E., 1973. Role of deformation twinning in determining the mechanical properties of metalsThe
Inhomogeneity of Plastic Deformation. American Society for Metals, pp. 285–311.Reed-Hill, R.E., Abbaschian, R., 1994. Physical Metallurgy Principles. PWS Publ. Company, Boston.Reed-Hill, R.E., Robertson, W.D., 1957a. Additional modes of deformation twinning in magnesium. Acta
Metall. 5, 717–727.Reed-Hill, R.E., Robertson, W.D., 1957b. Deformation of magnesium single crystals by nonbasal slip. Trans.
TMS-AIME 220, 496–502.Roberts, C.S., 1960. Magnesium and Its Alloys. Wiley, New York/London.Schmid, E., 1931. Beitrage zur Physik und Metallographie des Magnesiums. Z. Elektrochem. 37, 447.Sehitoglu, H., Hamilton, R., Canadinc, D., Zhang, X.Y., Gall, K., Karaman, I., Chumlyakov, Y., Maier, H.J.,
2003. Detwinning in NiTi alloys. Metall. Mater. Trans. A 34A, 5–13.Skalskyi, V.R., Andreikiv, O.E., Serhienko, O.M., 2003. Investigation of the plastic deformation of materials by
the acoustic emission method (review). Mater. Sci. 39 (1), 86–107.Staroselsky, A., Anand, L., 2003. A constitutive model for hcp materials deforming by slip and twinning:
application to magnesium alloy AZ31B. Int. J. Plast. 19, 1843–1864.Styczynski, A., Hartig, C., Bohlen, J., Letzig, D., 2004. Cold rolling textures in AZ31 wrought magnesium alloy.
Scripta Mater. 50, 943–947.Taylor, G.I., 1938. Plastic strain in metals. J. Inst. Met. 62, 307.Toronchuk, J.P., 1977. Acoustic emission during twinning of zinc single crystals. Mater. Eval. (October), 51–53.Von Mises, R., 1928. Mechanik der plastischen formanderung von kristallen. Z. Angew. Math. Mech. 8, 161–185.Wagoner, R.H., Chenot, J.L., 1996. Fundamentals of Metal Forming. Wiley, New York.Ward Flynn, P., Mote, J., Dorn, J.E., 1961. On the thermally activated mechanism of prismatic slip in magnesium
single crystals. Trans. TMS-AIME 221, 1148–1154.Yoo, M.H., 1981. Slip, twinning, and fracture in hexagonal close-packed metals. Metall. Mater. Trans. A 12A,
409–418.Yoo, M.H., Morris, J.R., Ho, K.M., Agnew, S.R., 2002. Nonbasal deformation modes of HCP metals and alloys:
role of dislocation source and mobility. Metall. Mater. Trans. A 33, 813.Yukutake, E., Kaneko, J., Sugamata, M., 2003. Anisotropy and non-uniformity in plastic behavior of AZ31
Magnesium alloy plates. Mater. Trans. 44 (4), 452–457.
Copyright © 2022 FDOKUMEN