Multiple lending, credit lines and financial contagion
36
Working Paper Series Multiple lending, credit lines and financial contagion Giuseppe Cappelletti, Paolo Emilio Mistrulli Disclaimer: This paper should not be reported as representing the views of the European Central Bank (ECB). The views expressed are those of the authors and do not necessarily reflect those of the ECB. No 2089 / July 2017
-
Upload
khangminh22 -
Category
Documents
-
view
3 -
download
0
Transcript of Multiple lending, credit lines and financial contagion

Working Paper Series Multiple lending, credit lines and financial contagion
Giuseppe Cappelletti, Paolo Emilio Mistrulli
Disclaimer: This paper should not be reported as representing the views of the European Central Bank (ECB). The views expressed are those of the authors and do not necessarily reflect those of the ECB.
No 2089 / July 2017

Abstract
Multiple lending has been widely investigated from both an empirical and a theoret-
ical perspective. Nevertheless, the implications of multiple lending for the stability of
the banking system still need to be understood. By lending to a common set of borrow-
ers, banks are interconnected and then exposed to �nancial contagion phenomena, even
if not directly. In this paper, we investigate a speci�c type of externality that originates
from those borrowers that obtain liquidity from more than one bank. In this case, con-
tagion may occur if a bank hit by a liquidity shock calls in some loans and borrowers
then pay them back by drawing money from other banks. We show that, under certain
circumstances that make other sources of liquidity unavailable or too costly, multiple
lending might be responsible for a large liquidity shortage.
JEL classi�cation: G21, G28
Keywords: Interbank market, Financial contagion, Systemic risk, Multiple lending,
Credit lines
ECB Working Paper 2089, July 2017 1

Non-Technical Summary
The fact that more than one bank at the same time lends to the same debtor (multiple
lending relationships) has been widely analyzed in the economic literature as a way for
borrowers to diversify liquidity risk. The possible contagion channel between the interme-
diaries, which goes beyond what is meant by the presence of direct �nancial relationships
between banks (interbank deposits, cross-holding of banks�assets), remains unexplored.
This work shows, via simulations, that multiple lending relationships can be an indirect
channel of �nancial contagion. In the context of an acute �nancial crisis - such as the one
following the failure of Lehman Brothers - a bank that becomes illiquid can try to restore an
adequate liquidity condition by reducing the credit lines granted to its creditors. In turn,
creditors will seek to increase the actual use of existing credit lines with other banks that
are still trusted, thus contributing to transmitting a liquidity shock from one intermediary
to another.
The analysis, based on the simulation of alternative scenarios, shows that this contagion
can have signi�cant e¤ects on the banking system, and can trigger in some cases an extensive
reduction of bank lending to the economic system. These e¤ects may be more pronounced
if they interact with other channels of contagion linked to the existence of �nancial relations
between �nancial intermediaries.
The analysis con�rms the crucial role of central banks in providing liquidity to the
banking system: their timely intervention can avoid triggering a process of loan reduction.
ECB Working Paper 2089, July 2017 2

1 Introduction1
Multiple lending, i.e. the practice of �rms or households borrowing from more than one
lender at the same time, has been investigated by several papers, from both an empirical
and theoretical perspective (Degryse, Kim and Ongena, 2009). The literature has high-
lighted both pros (diversi�cation of risk, mitigation of hold-up phenomena) and cons (less
monitoring incentives, coordination failures) of it but only from a microeconomic point of
view. To our best knowledge we are the �rst to consider the link between multiple lending
and �nancial stability.
In this paper we take a di¤erent perspective as we look at the implications of multiple
lending in terms of �nancial contagion within the banking system. To this aim we rely
on very detailed data obtained from the supervisory reports and from the Italian Credit
Register both collected by the Bank of Italy. Since the seminal paper by Allen and Gale
(2000), many papers have investigated the role of direct �nancial interlinkages among banks
(e.g. interbank lending, share holdings) as a potential source of �nancial contagion. No
paper has stressed yet the importance of relatively fewer direct �nancial interlinkages among
banks arising from multiple lending in the market for credit to the real sector and, in
particular, stemming from the existence of multiple credit lines.
In a micro-economic perspective Detragiache, Garella and Guiso (2000) argued one
reason why �rms and households borrow from more than one lender is that in this way
they mitigate the risk of a premature liquidation of the project �nanced once a lender falls
short of liquidity. Indeed, in case one of the banks lending to a borrower falls short of
liquidity other lenders may easily step in as they are already lending to that borrower and
then asymmetric information problems are highly mitigated (Bolton et al., 2016). What
has been overlooked so far is that if the liquidity shock that hits a bank is large enough
many borrowers would also be hit and the liquidity shock may propagate to other lenders.
This may easily occur in particular when a �rm or an household has obtained credit lines
from more than one bank (Gobbi and Sette, 2013). Indeed, it is reasonable to assume that
a borrower that has to pay back part of its debt to the illiquid bank draws money from
other banks that have granted a credit line, up to the line ceiling.
Credit lines are an important source of liquidity for �rms around the world (Lins, Servaes
and Tufano, 2010) and have two crucial features. First, they are a pre-committed source of
liquidity, meaning that borrowers are entitled to draw cash from banks up to a pre-speci�ed
limit, at mutually agreed-upon terms. Second, banks may have the option of cutting credit
lines if circumstances change (Su�, 2009; Acharya et al., 2014). This implies that banks hit
1The views expressed in the paper are those of the authors and do not necessarily re�ect those of theBank of Italy or the European Central Bank. We thanks participants in a seminar given at the Bank of Italyand European Central Bank, Paolo Angelini, Giorgio Gobbi, Philipp Hartmann, Victoria Ivashina, Tony O�Connor, Carmelo Salleo and Aurea Ponte Marques for their comments on a previous version of the paper.
ECB Working Paper 2089, July 2017 3

by a liquidity shock may call back credit lines and �rms whose lines have been called may
in turn draw money from the credit lines they had been granted by other lenders and the
initial shock propagates to other lenders.
In this paper, we show that the consequences of this channel for contagion might be quite
severe when other sources of bank funding are not available or are too costly and banks are
hit by large liquidity shocks, as it occurred during the last �nancial crisis. Indeed, the recent
crisis showed that banks were hit by severe liquidity shocks they were unable to overcome by
tapping the interbank market since that market dried up. In �nancial turmoil banks might
then have an incentive to obtain liquidity from their borrowers by asking them to reduce
the amount of credit drawn on the credit lines they have been granted. This is of course a
quite costly source of cash in normal times since the interest rate banks charge on the credit
lines granted to their customers are usually much higher than those at which they are able
to borrow in the interbank market. However, in a crisis, banks may be severely rationed
in the interbank market or are only able to borrow at very high costs. In a situation of
this kind, calling credit lines back might then represent a reasonable way out of a liquidity
shortage.
For these reasons, it should be emphasized that this channel for contagion operates once
the interbank market is already not working smoothly and the central bank is absent or
can not intervene. This latter hypothesis, common to related papers, is useful in order to
highlight the crucial role of central banks in a crisis from a new angle.
Following the approach widely used in related papers (see Upper, 2011 for a survey)
we simulate the impact of contagion by letting each bank fall short of liquidity one at a
time. We assume that once a bank becomes illiquid it calls back some loans in order to
get liquidity from its borrowers. This may solve the liquidity problem of the bank hit by
a shock but at the cost of propagating it within the banking system if borrowers pay back
their loans by drawing money from credit lines they have been granted by other banks.
Those banks may in turn become illiquid and possibly rely on the same strategy, i.e. calling
back some loans, thus propagating further the contagion mechanism. We show that, under
certain circumstances, this kind of mechanism may represent a major contagion channel
threatening the �nancial stability of the economy. Moreover, the initial liquidity shock
might be ampli�ed by both the behaviour of banks and borrowers.
As far as the former is concerned, some papers have shown that during a crisis the
interbank market collapses because banks "hoard" liquidity for precautionary reasons and
are not willing to lend even to other banks (Heider, Hoerova and Holthausen, 2010). Indeed,
in a crisis, when the risk of a bank not being able to roll over its debt increases, banks
�hoard�liquidity by lending less and more expensively at longer term maturities (Acharya
and Skeie, 2011). In our setup, this may cause the bank once faces a massive overdraft on
the credit lines granted to its borrowers, to overreact and possibily to hoard liquidity. As a
ECB Working Paper 2089, July 2017 4

result, it may call back credit lines by an amount which is far beyond what it would need
in order to restore the pre-shock liquidity holdings.
Similarly, borrowers may also "hoard" liquidity once they are asked to pay back come
of their credit lines. As shown by Ivashina and Scharfstein (2010) during the crisis, �rms
tended to draw money as much as they could from their credit lines in order to mitigate
the risk of a premature liquidation of their investment projects. If this happens, then we
can identify another source for the ampli�cation of the initial liquidity shock. Indeed, �rms
would draw money from credit lines beyond what strictly required to compensate for the
reduction of lending due to the initial shortage of liquidity occuring at a lending bank.
Naturally, this channel may be triggered not only by a liquidity shock but also by a
shock that hits the regulatory capital of a bank. If this occurs, then a relative easy way to
improve the regulatory ratios is to reduce the level of risky assets. Credit lines, which can
be called back by banks at relatively short notice, might be quite suitable for deleveraging
quickly.
Once one is aware of this possible alternative triggering mechanism then it is easy also to
understand how this channel for contagion may interact with a more standard and already
well investigate one. In particular, many papers have analyzed how �nancial inter-linkages
among banks may give rise to �nancial contagion in the banking system stemming from
losses on di¤erent interbank claims (see Mistrulli, 2011 and Cappelletti and Guazzarotti,
2017 for an analysis on the Italian banking system).
One has to bear in mind the known limitations of this approach that are common to
papers related to ours. Indeed, we do not provide a micro-foundation of the behaviour of
banks and borrowers. We simply assume some hypotheses about reasonable behaviour on
the basis of the existing empirical evidence from the recent �nancial crisis. Furthermore,
our results crucially depends on the value used for the parameters used for the simulations.
For these reasons, we run alternative scenarios, assuming di¤erent values. We are aware of
the di¢ culty of measuring the exact impact of this channel for contagion. However, we are
at least con�dent that by this way we can assess whether this type of contagion may exist
and how it propagates within the banking system.
The analysis relies on the assumption that banks, in reaction to a liquidity shock, ask
for pay back of exposures at least partially. Some evidence seems to support our view that
this a potentially important channel for contagion. In December 2011 the twelve-month
rate of growth in lending by banks belonging to the �ve largest groups turned negative (by
1.0 per cent), with no signi�cant di¤erence between �rms and households. Lending by the
other large banks and by smaller banks continued to expand but its annual growth slowed
from 6.0 to 2.0 per cent for the former and from 5.4 to 2.3 per cent for the latter. During
the same period loans granted by branches of foreign banks accelerated sharply (to growth
of 7.9 per cent) and in December accounted for 5.6 per cent of total lending and 5.9 per cent
ECB Working Paper 2089, July 2017 5

of loans to households and �rms. The disparities in the growth in lending by category of
bank re�ect the di¤erent level of constraints encountered in fund-raising. The largest banks
were more a¤ected by the turmoil generated by the sovereign debt crisis, mainly because
they make greater recourse to international markets for wholesale funding. The slowdown
in lending by all categories of Italian banks was partly due to the cyclical deterioration in
credit quality (Bofondi et al., 2013).
Figure 1 shows that during the crisis and, in particular, after the Lehman collapse, the
interest rates on the overnight interbank deposits traded in the e-Mid rose spectacularly and
the volumes traded declined sharply. On the other hand, according to a survey run by the
Bank of Italy (INVIND) the percentage of �rms that were asked by banks to reduce their
bank debt exposures also sharply increased in 2011 and kept increasing in the following
years. Moreover, between the end of 2011 and 2012 �rms borrowing from more than one
bank recorded a decrease of around 90 billions on credit lines outstanding at the end of
2011. This reduction was partially compensated by increased drawing on existing credit
lines (around 40 billion) and on new credit lines (30 billion). The request of reducing the
loan exposures was more frequent for smaller �rms (Table 1). All in all, this seems to suggest
that the channel we investigate in this paper might have e¤ectively been working during the
crisis. In December 2011 theECB decided on additional enhanced credit support measures
to support bank lending and liquidity in the euro area money market. In particular, the
ECB�s Governing Council has decided to conduct two longer-term re�nancing operations
(LTROs) with a maturity of 36 months and the option of early repayment after one year.
Yet, in this paper we do not aim to perform a structural estimation (see Keane, Todd
and Wolpin, 2011) of the e¤ect of a liquidity shock on the credit supply. This would require
a completely di¤erent approach which would not allow us to use all the information provided
by the credit register, due to computational intractability.2 The simulation approach (see
Upper; 2011) adopted aims to provide a counterfactual assessment of the potential risk
of contagion through interbank�linkages related to existing multiple lending relations for a
range of possible parameter values. It remains to be estimated which value of the parameters
is the correct one.
Multiple lending is present in the major European countries. For example loans to
borrowers with credit lines outstanding with more than one banks represents more than
two third of the total loans in France, Germany and Spain.
To assess the potential importance of this channel for contagion we rely on very detailed
data from the Italian credit register and supervisory reports allowing us to observe all
�nancial interlinkages between banks, at the bilateral level, and all the indirect links between
2Following a causal estimation approach, Bofondi, Carpinelli and Sette (2013), exploiting the lower impactof sovereign risk on foreign banks operating in Italy than on domestic banks, estimate that the lending ofItalian banks grew by about 3 percentage points less than that of foreign banks, and their interest rateswere 15-20 basis points higher.
ECB Working Paper 2089, July 2017 6

Table 1: Percentage of �rms reporting that they were asked by banks for reducing theirbank debt exposures
Firm with lessthan 50employees
Firm with lessthan 100employees
Firm with more atleast 101employees
2010 3.9 4.5 4.72011 8.9 8.3 9.02012 10.7 7.8 8.52013 8.3 6.9 8.02014 4.8 8.1 5.22015 5.4 4.7 4.1
banks originated by the existence of multiple lending relationships between banks and their
non-bank customers. Many supervisory regulations and public facilities, such as liquidity
regulations (LCR, NFSR) and emergency liquidity assistance, have been set up to prevent
situations where illiquid banks cannot ful�ll their business and have to resort to �re sales
or ask repayment of loans. The results of the simulation could be framed as the potential
counterfactual impact of lacking of these facilities. It remains open for future research to
assess whether additional measures are needed.
We obtain data on individual bank-�rm relationships from the Italian Credit Register
(CR) at the end of 2011. This source lists all outstanding loan amounts above 30,000
Euros that each borrower (both �rms and households) has with banks operating in Italy.
Intermediaries are required by law to report this information. Loans are distinguished into
three classes: revolving credit lines, term loans, and loans backed by account receivables.
The dataset includes both granted and drawn amounts. Therefore, we can use in our
simulations the e¤ective drawable amount from credit lines on which a �rm can rely once
some of its other credit lines have been called back.
We �nd that, by simulating contagion in the Italian banking system, multiple lending
may be an important source of contagion especially when we allow for an interaction between
the multiple lending channel and that based on direct �nancial interlinkages between banks.
Therefore, this paper shows that the bene�ts from diversi�cation of funding sources may
come at the cost of increasing systemic risk.
This paper contributes to the vast literature on �nancial contagion. Indeed, since the
paper by Rochet and Tirole (1996) much attention has been paid to �nancial contagion in
the interbank market. Theoretical works (Allen and Gale, 2000; Freixas, Parigi and Rochet,
2000) have highlighted that the propagation of shocks within the interbank market is de-
pendent on the exact pattern of banks��nancial linkages and many papers have empirically
supported this view (see Upper, 2011, for a survey). More recently, the literature has gone
beyond the interbank lending market and has taken into account also cross holdings of share
ECB Working Paper 2089, July 2017 7
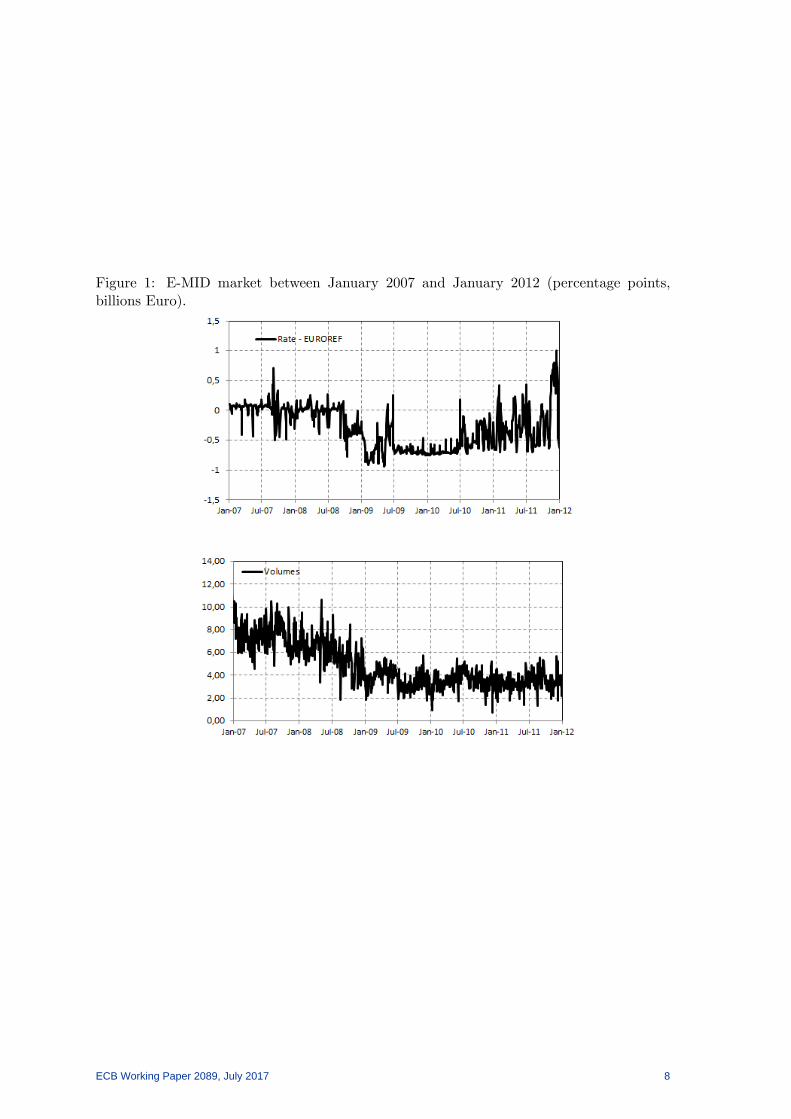
Figure 1: E-MID market between January 2007 and January 2012 (percentage points,billions Euro).
ECB Working Paper 2089, July 2017 8

and bonds and �re-sales on assets (Gai and Papadia, 2010). Karaas and Schoors (2012), in
addition, model bank runs as a response of depositors to signi�cant losses on assets. How-
ever, to our best knowledge, no paper has investigated the possibility that systemic risk
may arise not only from direct �nancial linkages among banks but also from indirect ones
involving non-bank borrowers. This allows us to model a bank run triggered not by panic
episodes (Diamond and Dybvig, 1983) or by informational cascades, but by some liquidity
shock that hit a bank and then propagates through a network of indirect linkages arising
from multiple lending relationships.
The rest of the paper is structured as follows: Section 2 describes the data and their
main characteristics. In Section 3 we outline the contagion channels and we report the
results of the simulations. Section 4 concludes.
2 The data
We rely on very detailed data obtained from the Italian Credit Register. The Credit Register
(CR) maintained by the Bank of Italy, contains detailed information on those loans granted
to each borrower whose total debt from a bank is above 75,000 euros (30,000 euros since
January 2009; no threshold is required for bad loans). The CR collects end-of-month stocks
broken down by maturity, currency, type of contract (mortgage, advances against receivables
and overdrafts) and type of collateral posted. Furthermore, for each exposure it is possible
to distinguish between the amount of lending used by the borrower and that granted by the
lender. We obtain information on all types of interbank bilateral exposures by supervisory
reports. Italian banks have to report to the Bank of Italy the outstanding amount of end-of-
month gross bilateral exposures relative to di¤erent interbank claims (loans, bonds, shares).3
The data allow distinguishing between di¤erent maturities (overnight, up to 18 months and
over 18 months), seniorities, currencies of denomination, counterpart nationalities and it is
also possible to distinguish between secured and unsecured claims.
We match interbank exposures with information, obtained from the Italian Credit Reg-
ister, referred to credit lines granted to non-bank customers.4 For each outstanding credit
line we look at the amount granted and actually used by the borrower. All information
are referred to the end of 2011. In all the simulations, banks are considered on a solo (un-
consolidated) basis. From a theoretical perspective a consolidated perspective could imply
smaller or to larger e¤ects than those shown in our simulation. On one hand, the initial
shock would impact all the subsidiaries in a group. On the other hand, the subsequent con-
tagion could be lower since the e¤ects could be absorbed more easily with mutual support
3Supervisory reports cover all Italian banks, locally incorporated and branches of foreign banks.4The Credit Register includes information on all outstanding loan amounts above 75,000 euros (30,000
since January 2009) granted by banks operating in Italy, including branches and subsidiaries of foreignbanks.
ECB Working Paper 2089, July 2017 9

within a banking group. There is some empirical evidence (see Mistrulli, 2011; JBF) that
contagion could be more or less severe, depending on the value of the parameters used in
the simulation. Yet from a regulatory perspective, liquidity requirements apply both on
an individual and consolidated basis (Regulation (EU) No 575/2013 (Capital Requirements
Regulation), art. 6).
In order to de�ne the multiple lending network we go through di¤erent steps. First, let
cj;h be the amount of credit line of bank j used by borrower h and gj;h the amount granted,
then the available margin is mj;h that is equal to the di¤erence between the amount granted
and the amount used (mj;h = gj;h � cj;h). Then, assume that borrower h has also beengranted a credit line by bank i and that this bank is hit by a liquidity shock and calls back
at least partially the credit line granted to borrower h. In case borrower h has no other
source of liquidity he may rely on the margin available on the credit line granted by bank
j, i.e. mj;h to pay back the loan granted by bank i.
Second, for each pair of bank i and j we can identify the set of common borrowers,
i.e. those debtors that have been granted a credit line from both bank i and bank j at the
same time. We denote the set of borrower in common between i and j as Hi;j . Therefore,
reducing the loans granted by � the maximum amount of liquidity bank i may obtain from
borrowers through the credit lines granted to Hi;j from bank j is equal to:
Li;j =MX
h2Hi;j
max (�� ci;h;mj;h)
where h = 1; :::;M . Then each Li;j is the (i; j)-entry of a matrix L of all bilateral "expo-
sures" between each pair of bank i and j. The matrix L represents the network arising from
the existence of multiple credit lines that we can compare with other networks generated
by the existence of direct links among banks (i.e. interbank loans, bonds and shares cross
holdings) that are already well known to researchers.
Third, in case borrower h has been granted credit lines by more than two banks, for
each bank i we can identify a set Bi of all banks that are connected to bank i, that is all
the intermediaries that have granted a credit line to bank i borrowers:
Bi = fj : Li;j > 0g
Fourth, the maximum amount that bank i may obtain by calling back the credit lines
it has granted to all borrowers is:
Li =
BXj2Bi
MXh2Hi;j
max (�� ci;h;mj;h)
where B is the total number of banks, andM is the total number of borrowers.
ECB Working Paper 2089, July 2017 10

At the end of 2011, the total amount of margins available on credit lines granted to
non-banks was equal to 352 billions, of which 230 billions were referred to borrowers with
multiple lending relations. Figure 2 represents the network generated by multiple lending
relations and the amount of liquidity that is at risk, meaning that it may be potentially
transferred from one bank to another in case the latter is hit by a liquidity or capital shock.
The network originated from multiple lending relations seems not to be very concen-
trated. The �rst 5 banks accounted for around one third of the total potential usage of
credit lines of other banks. In order to reach at least the 90 per cent of all usable credit
lines we have to consider more than 100 banks. The number of links is more than 60.000.
With respect to the interbank markets�network the multiple lending network is much more
dispersed. For unsecured interbank deposits the �rst 5 banks account for almost the 50 per
cent of total position at the June of 2011. As a result the network base on multi-lenders
loans seems more disperse but with a higher volume with respect the interbank unsecured
market5.
At the end of 2011, the multiple-lending relationship network amounted to 230 billions
euro while the total value of interbank�unsecured exposures in which either the borrower
or the lender is an Italian bank was around 750 billions euro, of which more than 70 per
cent was between banks a¢ liated with the same group. Focusing only on intermediaries
headquartered in Italy, the value reduces to around 250 billion euro, of which around 190
within the same banking group. The network between Italian banks related to cross-holding
of assets amounts to around to 120 billions. Table 2 show commonly used index for describ-
ing network topology6, Montagna and Kok (2016) show that standard network centrality
measures can seriously underestimate the real contagion risk faced by a network. The num-
ber of connected banks is similar if we look at the network related to multiple lending and
the monetary market, instead it is much less di¤use if we consider only the cross-holding
of bonds and shares. Instead, if we consider the number of banks connected the network
related to multiple lending is much more dense with an higher number of relation for each
bank.
Borrowers with more than one credit lines can have generally less than 5 outstanding
credit lines, although some borrowers can have a much higher number of available credit
sources. The median borrowers has two credit lines with a total value of 160.000 euro and
with one of banks having a majority share (Table 3).
5Until the recent Long Term Re�nancing Operation the unsecured segment has represented the mostrelevant part of interbank positions (see Cappelletti et al., 2011).
6See Acemoglu et al. (2013), Cont et al. (2012), Degryse and Nguyen (2007), Iori, et al. (2006), Kareset al. (2008), Fur�ne (2003) and Sheldon and Maurer (1998).
ECB Working Paper 2089, July 2017 11

Figure 2: Network based on multiple lending relations.
Figure 3: Unsecured interbank network
ECB Working Paper 2089, July 2017 12

Table 2: Statistics on plan participants
Interbank market Crossassets Network Multiple relations network
Number of nodes 782 299 646Number of relations 3,988 3,231 16,956Degree distribution
Mean 5 4 25Median 2 0 17p10 0 0 0p90 8 4 55
BetweennessMax 264,863 63,492 44,820Mean 892 458 303Median 13 0 0
Eigenvector centralityMax 0.00 0.19 0.17Mean 0.02 0.02 0.02Median 0.02 0.01 0.00
PageRankMax 82 91 727Mean 10 2 151Median 7 0 133
Note: In order to have comparable figures we consider only Italian banks.
3 Multiple lending and the contagion mechanism in a crisis
In this section we describe how contagion propagates within the banking system because of
indirect �nancial linkages stemming from multiple lending to non-banks. It is worthwhile
to emphasize that this contagion mechanism has very limited scope in "normal" times. On
the contrary, we argue that it might be quite harmful in a crisis by amplifying the e¤ects
of an already on-going crisis.
As it is generally assumed in many papers relying on simulations in order to investigate
�nancial contagion phenomena, we assume that a bank is hit by an idiosyncratic shock
which then may propagate to other banks �nancially linked to the former. This is justi�ed
by the fact that we tried to take a quite conservative perspective although the conditions
under which the contagion mechanism can be relevant could imply the presence of a systemic
shock hitting more than one bank contemporaneously.
In the �rst step, we assume that a bank i is hit by a shock and as a consequence bank
i calls back a share of all credit lines by an amount that depends on the size of the shock
ECB Working Paper 2089, July 2017 13
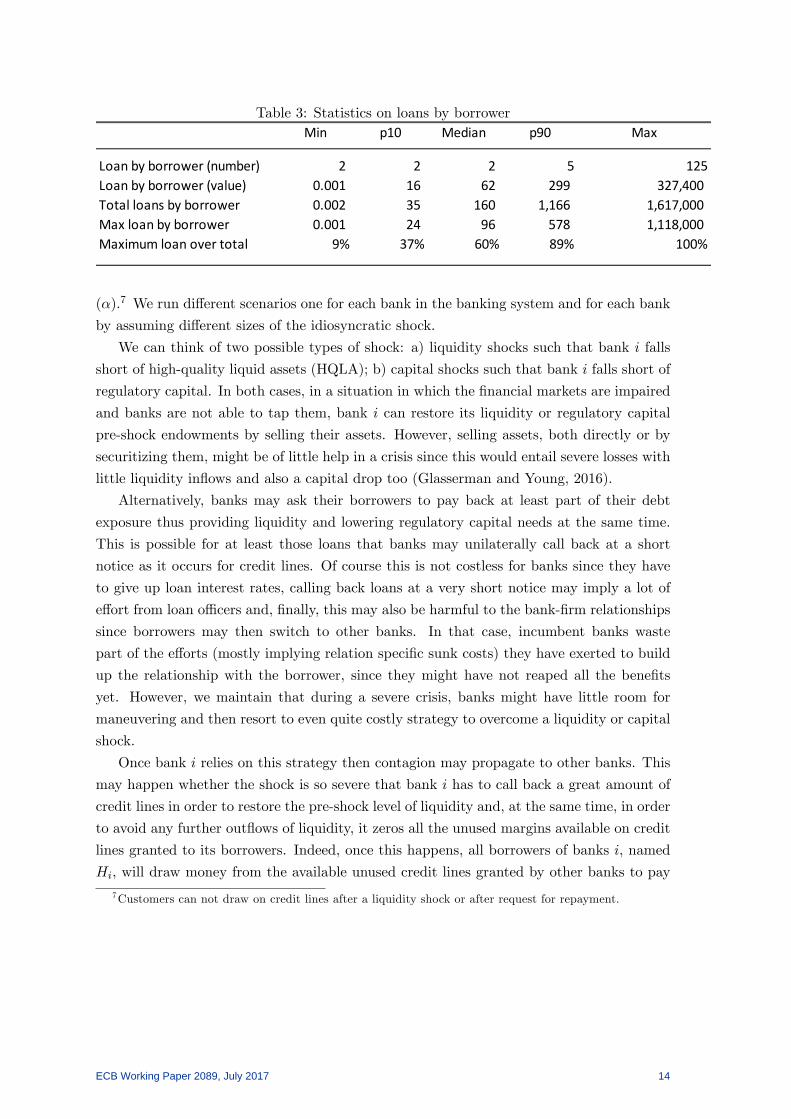
Table 3: Statistics on loans by borrowerMin p10 Median p90 Max
Loan by borrower (number) 2 2 2 5 125Loan by borrower (value) 0.001 16 62 299 327,400Total loans by borrower 0.002 35 160 1,166 1,617,000Max loan by borrower 0.001 24 96 578 1,118,000Maximum loan over total 9% 37% 60% 89% 100%
(�).7 We run di¤erent scenarios one for each bank in the banking system and for each bank
by assuming di¤erent sizes of the idiosyncratic shock.
We can think of two possible types of shock: a) liquidity shocks such that bank i falls
short of high-quality liquid assets (HQLA); b) capital shocks such that bank i falls short of
regulatory capital. In both cases, in a situation in which the �nancial markets are impaired
and banks are not able to tap them, bank i can restore its liquidity or regulatory capital
pre-shock endowments by selling their assets. However, selling assets, both directly or by
securitizing them, might be of little help in a crisis since this would entail severe losses with
little liquidity in�ows and also a capital drop too (Glasserman and Young, 2016).
Alternatively, banks may ask their borrowers to pay back at least part of their debt
exposure thus providing liquidity and lowering regulatory capital needs at the same time.
This is possible for at least those loans that banks may unilaterally call back at a short
notice as it occurs for credit lines. Of course this is not costless for banks since they have
to give up loan interest rates, calling back loans at a very short notice may imply a lot of
e¤ort from loan o¢ cers and, �nally, this may also be harmful to the bank-�rm relationships
since borrowers may then switch to other banks. In that case, incumbent banks waste
part of the e¤orts (mostly implying relation speci�c sunk costs) they have exerted to build
up the relationship with the borrower, since they might have not reaped all the bene�ts
yet. However, we maintain that during a severe crisis, banks might have little room for
maneuvering and then resort to even quite costly strategy to overcome a liquidity or capital
shock.
Once bank i relies on this strategy then contagion may propagate to other banks. This
may happen whether the shock is so severe that bank i has to call back a great amount of
credit lines in order to restore the pre-shock level of liquidity and, at the same time, in order
to avoid any further out�ows of liquidity, it zeros all the unused margins available on credit
lines granted to its borrowers. Indeed, once this happens, all borrowers of banks i, named
Hi, will draw money from the available unused credit lines granted by other banks to pay
7Customers can not draw on credit lines after a liquidity shock or after request for repayment.
ECB Working Paper 2089, July 2017 14

back the loans granted by bank i.8 As a consequence, all other banks lending to borrowers
in Hi will record an increase in their lending activity and also a out�ow of liquidity from
them to bank i.
This in turn may have two consequences on shocked banks. The unwanted growth in
their lending may lead to a shortage of regulatory capital; the out�ows of liquidity to bank
i might be so large that they fall short of liquidity. As a consequence those banks may in
turn call back at least part of the credit lines granted and, similarly to bank i, propagate
contagion further to banks that were not hit in the �rst round. Obviously this process may
go even further in case these other banks face a regulatory capital or a liquidity shortage
and they have to call back at least part of the credit lines they have granted. The contagion
mechanism stops only once no bank faces any liquidity and regulatory shortage or once all
banks have been infected and as a consequence they have zeroed all the available credit
lines margins. Indeed in this latter case it is impossible to draw liquidity from other banks.
The propagation of the initial liquidity shock depends on a condition that triggers sub-
sequent withdrawals from other banks that have not been infected yet. Since it is not easy
to empirically de�ne such a triggering condition we simulate di¤erent scenarios with di¤er-
ent liquidity thresholds. Speci�cally, we assume that a bank becomes illiquid if the total
liquidity out�ow is such that their high-quality liquid assets (HQLA) fall below a certain
threshold that is equal to � �HQLA, with � between 0 and 1 and where HQLA are com-puted according with Basel 3 Liquidity Coverage Ratio (LCR) rules. Let L = �0�HQLA bethe amount of liquidity out�ows that bank j su¤ered because of the bank i illiquidity, bank
j is illiquid if �0 > �. The liquidity coverage requirement provides for the maintenance of
a minimum liquidity bu¤er over a 30-day horizon to cover any net cash out�ows occurring
in the event of market-wide, idiosyncratic stress scenarios.9 If the liquidity requirements
� were already in place, � represents the distance distance of banks from the minimum
requirement. Based on EBA results of the CRDIV-CRR/Basel III monitoring exercise as of
end June 2016, the average LCR is 133.7% at end June 2016, while 95.4% of the banks in
the sample show an LCR above the full implementation minimum requirement applicable
from January 2018 (100%).
Alternative, new drawn from available credit lines could imply an increase in the capital
requirement of banks which is another reason why bank may decide to reduce their loan
exposures. According to the Capital Requirements Regulation (CRR; Article 166(8)) "for
credit lines that are unconditionally cancellable at any time by the institution without
prior notice, or that e¤ectively provide for automatic cancellation due to deterioration in
a borrower�s creditworthiness, a conversion factor (c) of 0% shall apply". Indeed, a rise
8We do not consider the possibility that borrowers can ask banks for new credit lines or, in general, anincrease in the amount of lending granted.
9The new minimum requirements, the LCR were phased-in, beginning with a minimum required level ofliquidity of 60% in 2015, which will be increased to 70% in 2016, 80% in 2017 and 100% in 2018.
ECB Working Paper 2089, July 2017 15

in the drawn amount would increase bank capital requirements and consequently reduce
regulatory capital relative to regulatory requirements (the actual solvency ratio goes down).
Undrawn credit lines may be considered as unconditionally cancellable if the terms permit
the institution to cancel them to the full extent allowable under consumer protection and
related legislation. Therefore, as a consequence of an increase in drawn credit lines (which
corresponds to a fall in the undrawn amount of credit lines), due to the liquidity shock,
banks would also su¤er an increase in capital absorption that could propagate contagion
even if infected banks meet their liquidity requirements.
If this e¤ect is big enough then banks would reduce lending and, as for the case of
liquidity shortage, a possible way to this is to call back credit lines. In order to explore
this additional mechanism of contagion we simulate di¤erent scenarios with di¤erent capital
thresholds. Speci�cally, we assume that a bank capital falls short of regulatory capital if the
total liquidity out�ow and the consequent increase in the drawn amount of credit is such
that the ratio between the total capital and risk weighted assets (RWA)10 decreases more
than certain percentage points. Let Dj be the amount of liquidity out�ows that bank j
register because of the other banks becoming illiquid. RWA will increase by (c� 0%)Dj ,where c is the conversion factor of the additionally drawn liquidity.11 The ratio between
the total capital and risk weighted assets will decrease by CapitalRWA � Capital
(c�0%)Dj+RWA = 0. We
assume that the bank j will become illiquid if 0 > .
If a bank become illiquid it will call back credit lines in order to restore the pre-shock level
of liquidity, there could be contagion across banks but there is no ampli�cation of the initial
shock. The overall decrease of credit in the economy is limited by the initial idiosyncratic
shock. Still, at each round of the contagion mechanism, the amount of liquidity available
on credit lines in the banking system shrinks since we assume that infected banks zero
credit line margins in order to avoid other borrowers�runs. This implies that, even without
assuming liquidity hoarding by banks and borrowers, the initial shock is ampli�ed by the
prudent behaviour of banks. This is what we de�ne as the baseline scenario (see Section
4.1). We simulate other scenarios in which we allow for banks� and borrowers� liquidity
hoarding. Consistently, in line with Heider, Hoerova and Holthausen (2009), we assume
that banks call back the amount of credit lines that is necessary to restore their pre-shock
liquidity plus a share �0 of all credit lines (Section 4.2). Similarly, borrowers, once they
are asked to pay back the credit lines granted by illiquid banks, draw more money than
needed from other banks (Ivashina and Scharfstein, 2010; Ippolito et al., 2016). Formally,
borrowers may withdraw (1 + ) of the credit line called back by illiquid banks, up to the
amount available on their credit lines (Section 4.3).
10Capital and risk weighted assets are those reported in supervisory data11 In gerneral, the increase in RWA is equal to (c� c0)L where c0 is the conversion factor of the undrawn
credit lines.
ECB Working Paper 2089, July 2017 16

In section 4.4 we report the results for some worst case scenarios where parameters are
set at a very harmful level. Section 5 compares the multiple lending contagion mechanism
(indirect contagion mechanism) with that based on losses on interbank assets (direct con-
tagion mechanism). Finally, we allow the multiple lending contagion mechanism to interact
with other contagion channels (Section 6). In particular, since the multiple lending mech-
anism may be triggered also by a capital shock we simulate the former together with the
channel based on losses on interbank assets (see Upper, 2011 for a survey).
Within each section, corresponding to alternative behavioral assumptions, we simulate
alternative scenarios corresponding to di¤erent values for the parameters involved. This
approach re�ects the di¢ culty to identify the "true" values for parameters. Our ambition is
to assess the potential impact of the aforementioned contagion mechanism and to identify
a reasonable range of possible measures of it, or at least to assess whether the channel for
contagion we are investigating does exist or not.
4 Results
In this section we report the results of the simulation based on the contagion mechanism
outlined in the previous section. The main aim is to assess whether the multiple lending
network is a source of contagion in the Italian banking system. We simulate di¤erent sce-
narios starting from the baseline one, which is the more conservative one, and subsequently
augmenting the contagion mechanism by alternatively allowing for banks�and borrowers�
liquidity hoarding. It is worthwhile to stress that in our scenarios we do not take the exis-
tence of a central bank into the account and that, as already argued, the multiple lending
contagion mechanism assumes that the markets for liquidity and capital are not working or
at least they do not allow banks to restore fast enough their liquidity or capital endowments,
as it happened during the last crisis.
4.1 Baseline scenario
We start from an idiosyncratic shock that hits bank i . The shock is such that bank i has to
call back, in order to restore the initial liquidity condition, a percentage � of the outstanding
credit lines granted to its borrowers. Assuming that these borrowers have no other source
of liquidity to pay back the credit lines they have been granted by bank i they draw cash
from the credit lines they have been granted by other banks that consequently will su¤er
a liquidity out�ow. We then assume that these banks would then call back the credit lines
to restore their initial liquidity conditions in case the amount of their high-quality liquid
assets (HQLA) is � percentage points lower than the pre-shock level.
In the baseline scenario we set all the parameters at a quite conservative level, assuming
that � is set at 50 percentage points, meaning that banks react to a liquidity shock once the
ECB Working Paper 2089, July 2017 17

amount of their high-quality liquidity assets drops by more than a half. Since this seems
quite a very conservative hypothesis, i.e. banks react only to quite large liquidity shocks, we
simulate less conservative scenarios assuming lower values for �. Since the average LCR was
133.7% at end June 2016 (EBA, 2016) the value for the simulation seems quite conservative.
We assume that infected banks do not hoard liquidity, i.e. �0 is equal to 0. And the reference
value of the initial reduction in the credit supply is 10% which is in line with the evidence
from the survey run by the Bank of Italy (INVIND; see Table 1 ) and the observed changes
in the credit supply between the end of 2011 and 2012.
Table 4 shows the results for di¤erent values of the idiosyncratic shock, i.e. for di¤erent
values of �. The number of cases in which contagion occurs and the change in outstanding
credit lines, net of the initial idiosyncratic shock, is quite limited. This re�ects the hypoth-
esis that banks react and call back the credit lines granted to their borrowers only in case
the liquidity shock is huge (50 per cent of total HQLA) and that they just want to restore
the initial amount of liquidity. Based
Table 4: Simulation results: baseline
α α' δContagion
(%) (1)Delta loans
(%) (2)Delta loan(mln) (3)
Delta available margin(%) (4)
Delta margin(mln) (5)
10% 0% 50% 1.1% 0.00% 3.86 0.126% 26920% 0% 50% 1.7% 0.00% 6.67 0.141% 26730% 0% 50% 2.1% 0.00% 9.84 0.149% 26640% 0% 50% 3.9% 0.01% 26.59 0.192% 47150% 0% 50% 4.4% 0.01% 36.56 0.210% 515
Note: (1) Share of cases where the number of illiquid banks is strictly higher than 1. (2) and (3) show the change inoutstanding credit line net of the initial idiosyncratic shock (percentage points and milions Euro). (4) and (5) show thechange in outstanding available margin on credit line gross of the initial idiosyncratic shock (percentage points andmilions Euro).
Once we assume a lower threshold that triggers the reaction of banks we obtain a larger
e¤ect for the multiple lending contagion. In particular, we run same simulation for lower
values for �. Table 5 reports the new results indicating a greater impact for this channel of
contagion. The percentage of cases in which contagion occurs rises, reaching 20.6 per cent
in the worst scenario and also lending drops up to 1.62 per cent.
In order to compare these results with those that take into account the potential role
of alternative sources of propagation related to capital requirement, we run the simulations
where we assume that banks would call back the credit lines to restore their initial liquidity
conditions in case the amount of their capital is percentage points lower than the pre-
shock level. We let the parameters, the conversion factor of undrawn credit lines and the
threshold of capital, at a quite conservative level, assuming that is set at 5 percentage
points, meaning that banks react to a liquidity shock once the amount of their capital drops
by more than a 5 percentage points and the conversion factor is 50 per cent. Since this
seems quite conservative hypothesis, i.e. banks react only to quite relevant liquidity shocks,
ECB Working Paper 2089, July 2017 18

Table 5: Simulation results: di¤erent liquidity thresholds
α α' δContagion (%)
(1)Delta loans (%) (2)
Delta loan (mln)(3)
Delta available margin(%) (4)
Delta margin(mln) (5)
10% 0% 50.0% 1.1% 0.002% 3.86 0.126% 268.7910% 0% 30.0% 1.9% 0.002% 3.99 0.140% 342.5410% 0% 10.0% 5.3% 0.002% 4.10 0.193% 473.0430% 0% 50.0% 2.8% 0.714% 17.71 16.984% 17.7130% 0% 30.0% 4.6% 0.721% 17.88 19.910% 17.8830% 0% 10.0% 15.2% 0.744% 18.46 33.150% 812.5950% 0% 50.0% 4.4% 1.474% 36.56 21.005% 36.5650% 0% 30.0% 8.1% 1.486% 36.86 25.962% 36.8650% 0% 10.0% 20.6% 1.619% 40.17 46.360% 1136.39
Note: (1) Share of cases where the number of illiquid banks is strictly higher than 1. (2) and (3) show the change in outstandingcredit line net of the initial idiosyncratic shock (percentage points and milions Euro). (4) and (5) show the change in outstandingavailable margin on credit line net of the initial idiosyncratic shock (percentage points and bilions Euro).
we simulate less conservative scenarios assuming lower values for and conversion factor.
We keep assuming that infected banks do not hoard liquidity, i.e. �0 is equal to 0.
Table 6: Simulation results: di¤erent liquidity thresholds
α α' γConversion
factorContagion (%)
(1)Delta loans (%)
(2)Delta loan (mln) (3)
Delta available margin (%)(4)
Delta margin (mln)(5)
10% 0% 5% 50% 0.8 0.00 4 0.12 29830% 0% 5% 50% 3.9 0.01 17 0.14 34550% 0% 5% 50% 6.6 0.02 38 0.20 48310% 0% 1% 50% 8.9 0.00 6 0.23 55430% 0% 1% 50% 22.5 0.01 30 0.52 128550% 0% 1% 50% 30.5 0.02 61 0.76 185110% 0% 5% 20% 1.7 0.00 4 0.12 30030% 0% 5% 20% 7.2 0.01 19 0.20 48750% 0% 5% 20% 11.0 0.02 45 0.28 68410% 0% 1% 20% 14.8 0.00 6 0.30 74630% 0% 1% 20% 32.0 0.01 34 0.78 190150% 0% 1% 20% 39.9 0.03 67 1.12 2751
Note: (1) Share of cases where the number of illiquid banks is strictly higher than 1. (2) and (3) show the change in outstanding credit linenet of the initial idiosyncratic shock (percentage points and milions Euro). (4) and (5) show the change in outstanding available margin oncredit line net of the initial idiosyncratic shock (percentage points and bilions Euro).
4.2 Liquidity hoarding by banks
Until now we have assumed that the infected banks that become illiquid reduce propor-
tionally all outstanding loans in order to restore the initial amount of outstanding credit
lines. In this sub-section, we assume that banks call back the amount of credit lines that
is necessary to restore their pre-shock liquidity plus a share �0 of all credit lines. This
corresponds to what we name bank liquidity hoarding scenario and it is consistent with a
ECB Working Paper 2089, July 2017 19

prudent behaviour of banks that try to restore a level of liquidity that is higher compared
to the pre-shock one.
In this case, the impact of contagion is quite severe. Following the initial idiosyncratic
shock we observe contagion in 5.3 to 20.6 per cent of the cases, depending on the value set for
�0. At the same time, assuming a high liquidity hoarding parameter (i.e. �0 = 30%) the
impact on lending ranges between -1,132 millions euro, when we have � = 10%; to -5,303
millions, in case � = 50%. Correspondingly, overall lending shrinks by 5,341 and 23,466
millions. It is also worthwhile to observe that margins on lines of credit shrink by even a
greater amount. This re�ects the behaviour of banks that once infected reduce the amount
granted on credit lines. This means that borrowers, after the shock, can not count anymore
on this bu¤er of liquidity and they might be quite in trouble.
Table 7: Simulation results: banks�liquidity hoarding
α α' δ Contagion (%) (1) Delta loans (%) (2) Delta loan (mln) (3)Delta available margin (%)
(4)Delta margin (mln) (5)
10% 10% 10% 5.3% 0.003 8 0.3 61710% 20% 10% 5.3% 0.019 46 0.4 1,00510% 30% 10% 5.3% 0.456 1,132 2.2 5,34130% 10% 10% 15.2% 0.017 42 0.5 1,21930% 20% 10% 15.2% 0.073 182 0.9 2,32330% 30% 10% 15.2% 1.489 3,693 6.8 16,55150% 10% 10% 20.6% 0.033 82 0.7 1,69450% 20% 10% 20.6% 0.109 271 1.3 3,07650% 30% 10% 20.6% 2.138 5,303 9.6 23,466
Note: (1) Share of cases where the number of illiquid banks is strictly higher than 1. (2) and (3) show the change in outstanding creditline net of the initial idiosyncratic shock (percentage points and milions Euro). (4) and (5) show the change in outstanding availablemargin on credit line net of the initial idiosyncratic shock (percentage points and bilions Euro).
4.3 Possible runs by borrowers
In this sub-section we explore another ampli�cation driver of the contagion mechanism.
Following Ivashina and Scharfstein (2010) we assume that borrowers draw down their credit
lines, aiming to hoard liquidity up to � per cent of the liquidity called back by the banks. At
the limit case we assume that borrowers draw down all the liquidity that is available on their
lines of credit. Table 8 reports the results of these new simulations. Allowing borrowers
to hoard liquidity has two e¤ects. On the one hand, it propagates contagion more widely
across banks. On the other hand, consistently with Detragiache, Garella and Guiso (2000)
and Ivashina and Scharfstein (2010), borrowers are less a¤ected by the liquidity shock and
the amount of lending increases, in case they draw down cash up to the line ceiling. In
these scenarios we observe a huge reduction in the available margins. Di¤erently, from the
results reported in the previous sub-section this is also partly harmful to borrowers since
it also re�ects the behaviour of borrowers themselves, not only that of infected banks, that
tend to hoard liquidity too.
ECB Working Paper 2089, July 2017 20

Table 8: Simulation results: borrowers�hoarding of liquidity
α α' δ βContagion (%)
(1)Delta loans (%)
(2)Delta loan (mln) (3)
Delta available margin (%)(4)
Delta margin (mln)(5)
10% 0% 10% 10% 5.8% 0.001 2 0.2 48910% 0% 10% 30% 7.3% 0.001 2 0.2 52910% 0% 10% 50% 8.3% 0.003 7 0.2 57810% 0% 10% oo 55.3% 4.908 12,174 54.7 134,05730% 0% 10% 10% 16.0% 0.005 13 0.4 86930% 0% 10% 30% 17.7% 0.000 1 0.4 99730% 0% 10% 50% 18.7% 0.004 10 0.5 1,13030% 0% 10% oo 55.3% 4.908 12,174 54.7 134,05750% 0% 10% 10% 21.0% 0.013 32 0.5 1,19250% 0% 10% 30% 22.9% 0.008 19 0.5 1,33350% 0% 10% 50% 24.3% 0.003 6 0.6 1,50650% 0% 10% oo 55.3% 4.908 12,174 54.7 134,057
Note: (1) Share of cases where the number of illiquid banks is strictly higher than 1. (2) and (3) show the change in outstanding creditline net of the initial idiosyncratic shock (percentage points and milions Euro). (4) and (5) show the change in outstanding availablemargin on credit line net of the initial idiosyncratic shock (percentage points and bilions Euro).
4.4 Worst case scenarios
Finally, we run a quite extreme scenarios where we set simulation parameters at a very
harmful level. In particular, in Table 6 we report some results obtained for large initial
liquidity shocks (alpha=90%), banks�liquidity hoarding, for the case in which banks react
to relatively small shocks to their liquidity endowments (delta=50%). We run these worst
case scenarios for 2 alternative behaviors of borrowers. In one case, borrowers are passive
and then just draw the amount of money necessary to pay back the loans to banks that
have called them back. At the other extreme, we assume that they are quite reactive to the
shock and draw money from their lines of credit up to the credit line ceiling.
Table 9: Simulation results: stressed scenarios
α α' δ βContagion (%)
(1)Delta loans (%)
(2)Delta loan (mln) (3)
Delta availablemargin (%) (4)
Delta margin (mln)(5)
90% 10% 10% 0% 20.6% 0.03 82 0.69 169490% 30% 10% 0% 20.6% 2.14 5303 9.57 2346690% 50% 10% 0% 20.6% 4.72 11706 12.12 29703
90% 10% 10% 50% 47.0% 0.79 1,970 42 103,46890% 30% 10% 50% 47.0% 7.92 19,646 43 104,49790% 50% 10% 50% 47.0% 15.36 38,106 44 107,116
Note: (1) Share of cases where the number of illiquid banks is strictly higher than 1. (2) and (3) show the change in outstandingcredit line net of the initial idiosyncratic shock (percentage points and milions Euro). (4) and (5) show the change in outstandingavailable margin on credit line net of the initial idiosyncratic shock (percentage points and bilions Euro).
In this case we obtain the most severe impact of contagion on lending. In the worst
scenario reported in Table 6, lending shrinks by more than 15 per cent.
ECB Working Paper 2089, July 2017 21

5 A comparison among contagion channels
In this section we compare the contagion mechanism due to multiple-lending relations with
alternative mechanism. In particular, we run simulations which take into the account bank
losses on interbank market due to defaults of other banks (see, among others, Mistrulli,
2011). Namely, all banks raising funds in the interbank market are allowed to fail one
at a time; the losses su¤ered by banks lending to the failed bank are then computed. If
the amount of the losses is greater than lenders�Tier-1 capital (i.e. capital and reserves)
then lenders default. The simulation is then iterated by verifying if banks that fail after
the �rst iteration make other banks fail as well. At each iteration banks that failed in
the previous one are dropped from the set of banks which may be a¤ected by contagion.
The simulation continues until at least one bank default occurs. More recently, Battiston
et al, 2013 consider also losses due to cross-holding of shares and the possibility of near
defaulting banks. Limiting ourselves to the �rst aspect we can run the same simulations
considering contagion due to losses related to shares and bonds holding of defaulted banks
(see Appendix).
Table 10 summarizes the parameters used in the baseline simulation. Once a bank
becomes illiquid it will reduce its loans by 10 percentage points and the threshold for the
out�ow of liquidity to cause a bank to become illiquid (�) is set at 50 percentage points.
For evaluate other source of contagion, already studied in the literature we assume that the
loss given default for unsecured and secured loans is respectively 40 and 80 per cent, and
the recovery rate for stocks and bonds is respectively the 0 and 40 per cent. These values
are in line with previous paper in the literature (Bargigli et al, 2015). The recovery rate is
di¤erentiated between shares and bonds but it is independent from the issuer and from the
holder.
Table 10: Simulation parameters: recovery rates and liquidity thresholdSimulation parameters� = initial idiosyncratic shock 0:10�0 = share of credit lines called back by banks 0:10� = threshold of HQLA 0:50� = LGD unsecured interbank loans 0:90� = LGD secured interbank loans 0:40� = LGD bonds holdings 0:40� = LGD share holdings 1:0
Note that generically we can not say whether one mechanism is stronger than another
since only the network structure related to each channel determine which one is more
relevant. In order to evaluate the relevance of di¤erent contagion�s mechanisms, we consider
the default and the becoming illiquid of every single Italian bank and see what is the e¤ect
ECB Working Paper 2089, July 2017 22

according to di¤erent contagion mechanism.
Contagion based on a pure interbank interlinkages is quite limited since in 98 per cent
of the cases it does not occur (Figure 1). Including the cross holding of bonds and share
increase the probability of contagion by only 1.2 per cent. Instead, the fact that banks share
a relevant number of borrowers implies alone that in almost 1 over 10 cases at least another
bank become illiquid. Even if the cross holding of assets does not change dramatically
the total number of banks defaulting the possibility that a bank become illiquid due to
new draws on existing credit lines implies a relevant increase in the total number of banks
becoming illiquid. Considering all three mechanisms of contagion implies that in 90 per
cent of cases there is not contagion. In 3.3 per cent of the cases (almost one third of the
total case of contagion) the number of illiquid or defaulted banks is higher than 10.
Figure 4: Contagion mechanisms: buckets of number of defaulting or illiquid banks (per-centage points).
6 Interactions among contagion channels
The di¤erent channels of contagion can interact and reinforce each other. Banks could call
back the credit lines granted not only because they fall short of liquidity but also because
they su¤er losses that reduce their capital and make di¢ cult to meet regulatory capital
requirements. Indeed, in case the market for capital is not working, as it happens in a
crisis, the only way to meet solvency requirements is by a deleveraging process.
Table 11 shows that the interaction of di¤erent channels of contagion could signi�cantly
increase the propagation of the shock across banks. If we assume that banks may become
illiquid if they su¤er losses equal to X per cent of their capital, the share of cases in which
ECB Working Paper 2089, July 2017 23

contagion occurs increases from 2:2% to 6:8% with a sizeable increase in the number of
banks potentially hit by the shock.
Table 11: Number of illiquid bank for di¤erent value of X (Alpha = 0.10 and K=50).
No Interaction 10 20 50 No Interaction 10 20 50
[1] 806 550 664 768 97,8 66,7 80,7 93,2[2] 8 183 102 29 1,0 22,2 12,4 3,5(2, 5] 5 57 37 11 0,6 6,9 4,5 1,3(5, 10] 3 20 8 8 0,4 2,4 1,0 1,0(10, 20] 1 5 3 3 0,1 0,6 0,4 0,4(20, 30] 0 0 2 2 0,0 0,0 0,2 0,2(30, 40] 1 1 1 0 0,1 0,1 0,1 0,0(40, 50] 0 3 2 1 0,0 0,4 0,2 0,1(50, 60] 0 1 2 0 0,0 0,1 0,2 0,0(60, 70] 0 0 0 1 0,0 0,0 0,0 0,1(70, 80] 0 1 0 1 0,0 0,1 0,0 0,1(80, 100] 0 1 0 0 0,0 0,1 0,0 0,0(100, 450] 0 2 2 0 0,0 0,2 0,2 0,0
Totale 824 824 823 824 100 100 100 100
X X
Num
ber
of il
liqui
d ba
nks
Finally, we explore a possible feed-back from the multiple lending channel to the loss on
interbank assets one. Once banks call back credit lines it has not necessarily true that all
borrowers would be able to pay back their loans. If we do not allow for borrowers to rely to
internal liquidity and therefore become insolvent if the available liquidity is not su¢ cient
to replace the calls backs from illiquid banks than banks would su¤er some losses even in
the multiple lending mechanism. As consequence, the interaction among di¤erent channels
of contagion would be reinforced.
7 Conclusions
A wide literature, starting from the seminal paper by Allen and Gale (2000), has shown,
both at the empirical and theoretical level, that contagion within the banking system may
propagate since banks are �nancially interconnected. However, the extant literature has
focused on direct �nancial exposures among banks (i.e. interbank lending, bank bonds and
shares cross holdings) that give rise to a quite interconnected network of relationships.
We explore another source of interconnectedness that has not being investigated yet
which originates from the existence of multiple credit lines. A quite common characteristics
of lending relationships is that debtors, especially �rms, borrow from many lenders at the
same time (multiple lending). There are many reasons for that. Lenders diversify credit
risk, borrowers diversify the risk of premature liquidations (Detragiache et al., 2000) and
avoid or at least mitigate hold-up problems (Rajan, 1992; Sharpe, 1992). We argue that
ECB Working Paper 2089, July 2017 24

this may hold in normal times. In this paper we have shown that, during a crisis, multiple
lending may be an important channel for contagion.
When the typical markets for liquidity are impaired, banks may call back credit lines in
order to obtain cash from borrowers. However, a reasonable reaction of the latter is that
of drawing money from credit lines available at other banks thus propagating the liquidity
shocks within the banking system. We �nd that this channel of contagion might have a
signi�cant impact on the stability of the banking system, in particular when that channel
interacts with other channels for contagion related to direct interbank exposures. Our
paper is the �rst to show that while multiple lending is bene�cial to banks and borrowers
(Detragiache et al., 2000) in normal times, it may amplify and propagate liquidity shocks
in a crisis.
Based on the results of the simulations, we �nd that in the baseline scenario contagion
may be limited for very conservative calibration of the parameter. Once we consider the
possibility of amplifying factors, namely hoarding of liquidity by banks or borrowers, the
e¤ects of initial liquidity shock are sizeable both in term of total volume of credit and total
available credit lines.
In section 5 we have provided a tentative comparison among di¤erent channels, showing
that multiple lending may be a major factor of contagion. However, this result has to
be considered with caution since the severity of contagion, as Allen and Gale (2000) have
shown, highly depends on the structure of �nancial interlinkages and, reasonably, this a¤ects
in a di¤erent way alternative channels. Moreover, we have shown (Section 6) that what we
call direct linkages (i.e. interbank �nancial assets) and the indirect ones, arising from the
existence of multiple lending, may make both channels for contagion interact and reinforce
each other.
All in all, our paper identify the trade-o¤ between the bene�ts of diversi�cation of
the liquidity risk that borrowers may pursue by establishing multiple lending relationships,
especially when they are granted credit lines, and the cost of propagating liquidity shocks
within the banking system. This trade-o¤ depends on the structure of the network and the
severity of the liquidity shock that hits a bank or part of the banking system. In particular,
multiple lending, in line with Detragiache, Garella and Guiso (2000), may mitigate the
impact of banks� liquidity shocks on the economic activity of borrowers. However, this
holds in normal times when the market for liquidity works smoothly. On the contrary, in
a crisis, when interbank market are impaired, a dark side of multiple lending may emerge
since, as we have shown, it may give rise to contagion and �nancial instability.
ECB Working Paper 2089, July 2017 25

Appendix
A Contagion mechanisms through multiple lending relation
Formally, Given the set of the banks Band the set of borrowers D let ci;hdenote the credit
line of bank i that borrower h has already outstanding and gi;h is the maximum credit
line that borrower h can drawn by bank i (Table ??). The margin usable is denoted asmi;h = gi;h � ci;h.
Let i be the �rst bank that become illiquid because of some idiosyncratic shock and
de�ne ILSn � Band LSn � B as the set of banks, respectively, illiquid or liquid at the nthstep of the contagion path initiated by bank i, as follow:
ILSn =�j 2 B : dnj > � �HQLATier 1j
LSn (i) = BnILSn (i)
where dnj is the total amount of credit lines drawn by borrowers at the nth step of contagion
from bank j and HQLATier 1j is Tier 1 high-quality liquid assets, de�ned following Basel
3 recommendations. Conditional on resulting new loans draws from surviving banks we
assume that banks facing an excessive �ow of liquidity become illiquid due to an increase in
the illiquidity risk or equivalently to an increase in the volatility of liquidity needs. Namely
we assume that if the ratio between total drawing and high-quality liquid assets is higher
than � the bank becomes illiquid. The amount of liquidity drawn at stage n from bank j is
equal to:12
dnj = dn�1j +
Xh2D
dnj;h
In the baseline scenario, once a bank i becomes illiquid at stage n of the simulation, it
reduces proportionally the outstanding loans in order to return to the initial total value of
loans, that is:
cn+1i;h =cni;hP
h2Dcni;h
Xh2D
ci;h for each borrower h and i 2 ILSnML (i) (Behavior 1)
where for each borrower h, wherePk2D
ci;h is the value of credit lines outstanding before the
shock. Alternatively, we can assume that all the banks becoming illiquid reduce propor-
12 In the simulation bank j can register a drawn on its credit lines only by borrowers that having out-standing loans from banks become illiquid at stage n� 1
Hn�1 (i) =
8<:h 2 H :X
j2ILSn�1(i)
lj;h > 0
9=;
ECB Working Paper 2089, July 2017 26

tionally all outstanding loans formally:13
cn+1i;h = �ci;h for all borrower h and bank i such that i 2 ILSnML (i) (Behavior 2)
where ci;k is the original value of the borrowing position of h with respect to bank i.
Similarly, in the baseline scenario we assume that each borrower h will try to compensate
the reduction in its banks�funding with the existing credit lines, drawing the unused granted
loans, that is for borrower h and liquid bank j at stage n of the simulation. Let us de�ne
the desired level of new loans by borrower h at the nth step of the contagion path as:
c�nh = (1 + �) cbnh
the resulting withdraw on available credit lines will be equal to:
dnj;h =
8>>>>>>><>>>>>>>:
min�0; gnj;h � cnj;h
�cbnhclnh
if clnh > cbnh
min�0; gnj;h � cnj;h
�if clnh � cbh
where cbnh =P
j2ILSn�1(i)cnj;h � c
n�1j;h and clnh =
Pj2LSn�1(i)
min (0; gj;h � cj;h). If the unused
margins are more than su¢ cient for the substitution we assume that the borrower draws
proportionally the available credit lines, instead if this is not the case the borrower simply
uses all the available credit lines.14 Alternatively, we allow that borrowers asked to reduced
their loan exposure by a bank want to draw funds in an higher amount for precautionary
reasons (� > 0).
Formally, we de�ne a set of illiquid banks due to defaulting banks and implied reduction
in the value of their capital as:
ILSnLBS (i) =
8><>:j 2 B : Capitalj �X
d2Dn�1LBS_ML(i)
(�unsecj;d + �secj;d)�X
d2Dn�1LBS_ML(i)
(sj;d + "bj;d) < X
9>=>;Therefore the set of illiquid banks is de�ned as:
ILSnLBS_ML (i) = ILSnML (i) [ ILSnLBS (i)
13One should note that the results are equivalent if we assume that illiquid banks zero the drawable creditlines and the existing credit positions naturally grows at the rate of � per cent.14We do not consider the default of borrowers in case of impossibility of fully substituting the closed loans.
This fact could enhance the contagion mechanism due to multi-lending relationships.
ECB Working Paper 2089, July 2017 27

Another source of interaction comes from the fact that �rms could not drawn liquidity from
banks that have defaulted. Since the condition of illiquidity due to losses is stricter than
the condition of defaulting, the equation that de�nes the drawing of credit lined does not
change, apart from replacing ILSnLBS (i) with ILSnLBS_ML (i).
15
Formally, in each step n of the simulation we compute the value of possible problematic
loans as:
NPLni;k =
8>>>><>>>>:0 if
Pj2LSnLBS_ML(i)
min (0; gj;k � cj;k) �P
j2ILSnLBS_ML(i)
�cj;k
�ci;k ��ci;k
�P
j2ILSn�1LBS_ML
(i)
cj;k
0@ Pj2LSn�1LBS_ML(i)
dnj;k
1A otherwise
for each borrower h that experience a reduction in the outstanding loans (formally for every
h 2 Hn�1 (i)). We assume that problematic loans are distributed across all the illiquid
banks, that have reduced their loans, in a proportional manner.
When we want to consider contagion due to losses su¤ered by banks we could include
losses due to non performing loans. Hence, we de�ne the set of insolvent banks as:
DnLBS_MAFF (i) =
8><>:z 2 B : Capitalz �X
j2Dn�1LBS_ML(i)
(sz;j + "bz;j + sz;j + "bz;j)� �X
k2Hn�1LBS_ML(i)
NPLnz;k < 0
9>=>;Note that DnLBS_MAFF (i) � DnL (i) [DnBS (i) for every bank i and for every step n of thesimulation.
B Contagion mechanisms through inter-banks exposures
Let us recall the di¤erent channel of contagion already study in the literature and the
conditions that leads to the default. Let B be the set of banks. Lending positions betweenbanks and cross-holding of assets within the banking system can be represented in matrix
form. Let unseci;j denote the unsecured loans that bank j 2 B borrows from bank i 2 B,let seci;j denote the secured loans that bank j 2 B borrows from bank i 2 B, let si;j denotethe value of shares of bank j held by bank i, let bi;j denote the value of bonds of bank j
held by bank j.
Let i be the �rst bank that defaults because of some idiosyncratic shock, and de�ne
Dnm (i) � B and Snl (i) � B as the set of banks, respectively, defaulted and surviving at thenth step of the contagion process initiated by bank i under mechanism m.16 We allow for
15Formally, for each bank i and n we the set of illiquid banks ILSnLBS (i) includes the set of defaultedbanks Dn
BS (i) where DnBS (i) = fz 2 B : cz � sz;i � �bz;i < 0g.
16 In general B = Snl (i) [Dnm (i).
ECB Working Paper 2089, July 2017 28
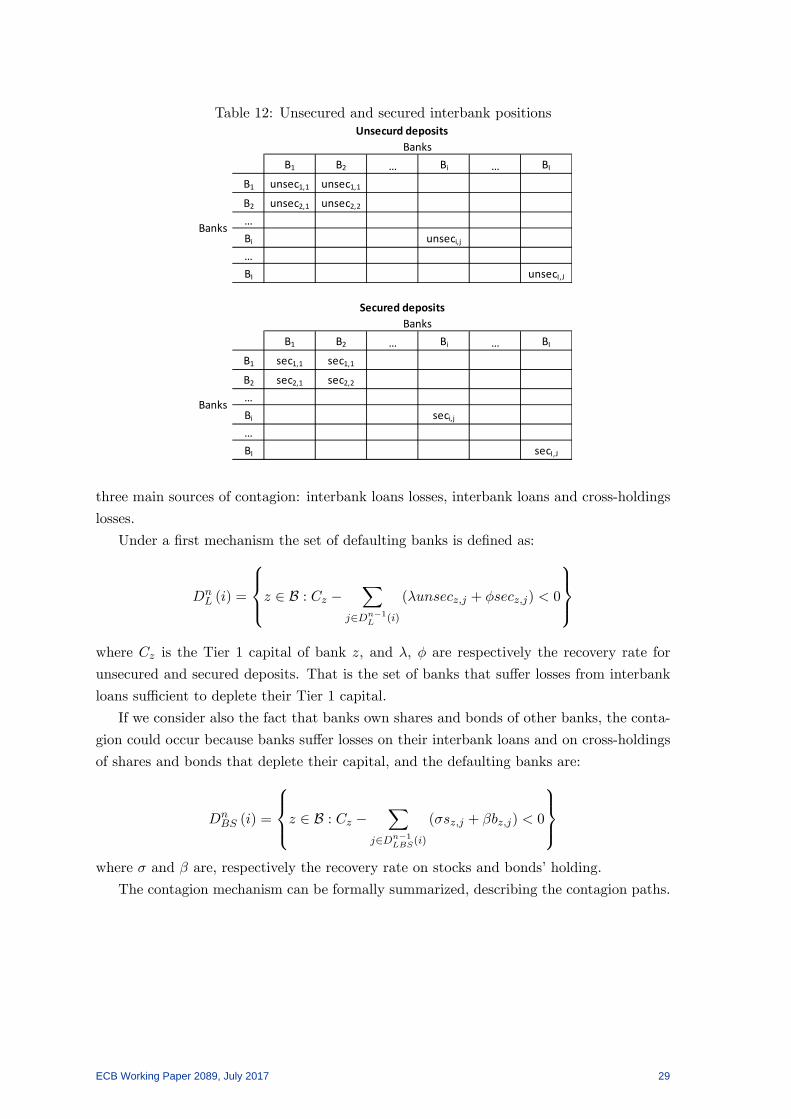
Table 12: Unsecured and secured interbank positions
B1 B2 … Bi … BI
B1 unsec1,1 unsec1,1
B2 unsec2,1 unsec2,2
…Bi unseci,j
…BI unsecI,J
B1 B2 … Bi … BI
B1 sec1,1 sec1,1
B2 sec2,1 sec2,2
…Bi seci,j
…BI secI,J
Unsecurd depositsBanks
Banks
Banks
Banks
Secured deposits
three main sources of contagion: interbank loans losses, interbank loans and cross-holdings
losses.
Under a �rst mechanism the set of defaulting banks is de�ned as:
DnL (i) =
8><>:z 2 B : Cz �X
j2Dn�1L (i)
(�unsecz;j + �secz;j) < 0
9>=>;where Cz is the Tier 1 capital of bank z, and �, � are respectively the recovery rate for
unsecured and secured deposits. That is the set of banks that su¤er losses from interbank
loans su¢ cient to deplete their Tier 1 capital.
If we consider also the fact that banks own shares and bonds of other banks, the conta-
gion could occur because banks su¤er losses on their interbank loans and on cross-holdings
of shares and bonds that deplete their capital, and the defaulting banks are:
DnBS (i) =
8><>:z 2 B : Cz �X
j2Dn�1LBS(i)
(�sz;j + �bz;j) < 0
9>=>;where � and � are, respectively the recovery rate on stocks and bonds�holding.
The contagion mechanism can be formally summarized, describing the contagion paths.
ECB Working Paper 2089, July 2017 29

Table 13: Interbank cross-holding of bonds and shares
B1 B2 … Bi … BI
B1 b1,1 b1,1
B2 b2,1 b2,2
…Bi bi,j
…BI bI,J
B1 B2 … Bi … BI
B1 s1,1 s1,1
B2 s2,1 s2,2
…Bi si,j
…BI sI,J
Banks
BondsBanks
Banks
SharesBanks
Given the initial default of a single bank i the initial sets of defaulted banks are trivial:
D0L (i) = DnBS (i) = ILS
n (i) = fig (1)
then the infection spreads according to di¤erent channel considered:
DnL (i) = fz 2 B : cz � �unsecz;i � �secz;i < 0g
D1BS (i) = fz 2 B : cz � �sz;i � �bz;i < 0g
ILS1ML (i) =
8><>:z 2 B :P
k2H0ML(i)
drawn_loansnj;k
HQLATier 1z
> K
9>=>;where H0
ML (i) = fh 2 H : li;h > 0g
Iterating the exercise we derive the relevant set of defaulted and illiquid banks.
ECB Working Paper 2089, July 2017 30

DnL (i) =
8><>:z 2 B :X
j2Dn�1L (i)
(cz � �unsecz;j � �secz;j) < 0
9>=>;DnBS (i) =
8><>:z 2 B :X
j2Dn�1LBS(i)
(cz � �sz;j � �bz;j) < 0
9>=>;ILSnML (i) =
8>><>>:z 2 B :P
k2Hn�1ML (i)
drawn_loansnz;k
HQLATier 1z
> K
9>>=>>;where Hn�1
ML (i) =
8><>:h 2 H :X
j2ILSn�1ML (i)
lj;h > 0
9>=>;
ECB Working Paper 2089, July 2017 31

References
[1] Acemoglu, D., A. Ozdaglar, and A. Tahbaz-Salehi (2013), "Systemic risk and stability
in �nancial networks." NBER Working Paper no. 18727
[2] Acharya, V. , Almeida, H., Ippolito, F. and Perez, A. (2014), "Credit lines as monitored
liquidity insurance: Theory and evidence", Journal of Financial Economics, 112, 287-
319.
[3] Acharya, V. and Skeie, D., (2011), "A model of liquidity hoarding and term premia in
interbank markets", Journal of Monetary Economics, Vol. 58, pp. 436-447.
[4] Allen, F., Gale D. (2000), �Financial contagion.� Journal of Political Economy, Vol.
108, 1�33.
[5] Bargigli, L., G. Di Iasio, L. Infante, F. Lillo, and F. Pierobon (2015), "The multiplex
structure of interbank networks.", Quantitative Finance, , Vol. 15(4), pp. 673-691
[6] Battiston, S., G. Di Iasio, L. Infante, and F. Pierobon (2013), "Capital adn Contagion
in Financial Networks.", mimeo
[7] Bofondi M., Carpinelli L. Sette E. (2013), "Credit supply during a sovereign debt
crisis," Temi di discussione (Economic working papers) 909, Bank of Italy, Economic
Research and International Relations Area
[8] Bolton, P., Freixas, X., Gambacorta, L. and Mistrulli, P.E. (2016), "Relationship and
Transaction Lending in a Crisis", Review of Financial Studies, forthcoming.
[9] Cappelletti, G.and Guazzarotti, G. (2017), "The role of counterparty risk and asym-
metric information in the interbank market," Working Paper Series 2022, European
Central Bank
[10] Cont, R., Moussa, A. and Santos, E.B. (2012), "Network Structure and Systemic Risk
in Banking Systems." In Handbook of Systemic Risk, edited by J.P. Fouque and J.
Langsam, (Cambridge University Press)
[11] Degryse, H., Nguyen, G., (2007), "Interbank exposures: an empirical examination of
systemic risk in the Belgian banking system." International Journal of Central Banking,
Vol. 3, pp. 123�171
[12] Degryse, H., M. Kim, and S. Ongena, (2009). Microeconometrics of Banking: Methods,
Applications and Results (Oxford University Press)
[13] Detragiache, E., Garella, P. and Guiso, L. (2000), "Multiple versus Single Banking
Relationships: Theory and Evidence." The Journal of Finance, Vol.55, pp. 1133�1161.
ECB Working Paper 2089, July 2017 32

[14] Diamond, D. W. and Dybvig P. H., (1983) "Bank Runs, Deposit Insurance, and Liq-
uidity," Journal Political Economy, Vol. 91(3), pp. 401
[15] EBA, CRD IV CRR / Basel III monitoring exercise results based on data as of 30 June
2016 (2017)
[16] Freixas, Xavier, Bruno M. Parigi, and Jean-Charles Rochet (2000), "Systemic risk,
interbank relations, and liquidity provision by the central bank." Journal of Money,
Credit and Banking, 32, 611�638.
[17] Fur�ne, C.H., (2003), "Interbank exposures: quantifying the risk of contagion." Journal
of Money, Credit and Banking, Vol. 35, pp. 111�128.
[18] Gao P. and Kapadia, S., (2010), "Contagion in �nancial networks", Bank of England
Working Paper No. 383
[19] Gobbi, G., Sette, E. (2013), "Do Firms Bene�t from Concentrating their Borrowing?
Evidence from the Great Recession." Review of Finance, Vol. 18:3, pp. 1-34.
[20] Heider, F., Hoerova, M. and Holthausen, C., (2010), "Liquidity Hoarding and Interbank
Spreads: The Role of Counterparty Risk", CEPR working paper, n. 7762.
[21] Ippolito, F., Peydrò, J.L., Polo, A., Sette E., (2016), "Double Bank Runs and Liquidity
Risk Management", Journal of Financial Economics, forthcoming.
[22] Ivashina, V. and Scharfstein, D., (2010), "Bank lending during the �nancial crisis of
2008", Journal of Fianncial Economics, Vol. 97, pp. 319-338.
[23] Iori, G., Jafarey, S., Padilla, F.G., (2006), "Systemic risk on the interbank market."
Journal of Economic Behavior & Organization, Vol. 61, pp. 525�542.
[24] Kares, A. and Schoors , Koen, Lanine, Gleb (2008), "Liquidity matters: Evidence from
the Russian interbank market." BOFIT Discussion Papers 19/2008, Bank of Finland
[25] Lins, K.V, Servaes, H., and Tufano, P. (2010), "What drives corporate liquidity? An
international survey of cash holdings and lines of credit", Journal of Fianncial Eco-
nomics, 98, 160-176
[26] Mistrulli P.E., (2011), "Assessing �nancial contagion in the interbank market: Maxi-
mum entropy versus observed interbank lending patterns", Journal of Banking & Fi-
nance, Vol. 35(5), pp. 1114-1127
[27] Rochet, J. C., & Tirole, J. (1996). Interbank lending and systemic risk. Journal of
Money, Credit and Banking, Vol. 28(4), pp. 733-762.
ECB Working Paper 2089, July 2017 33

[28] Sheldon, G., Maurer, M., (1998), "Interbank lending and systemic risk: an empirical
analysis for Switzerland." Swiss Journal of Economics and Statistics, Vol. 134, pp.
685�704.
[29] Su�, A. (2009), "Bank Lines of Credit in Corporate Finance: An Empirical Analysis",
Review of Financial Studies, 22, 1057-1088.
[30] Upper, C., (2011), "Simulation methods to assess the danger of contagion in interbank
markets." Journal of Financial Stability, Vol. 7,pp. 111-125.
[31] van Lelyveld, I., Liedorp, F., (2006), "Interbank contagion in the Dutch banking sector:
a sensitivity analysis." International Journal of Central Banking, Vol. 2, pp. 99�133.
ECB Working Paper 2089, July 2017 34

Giuseppe Cappelletti European Central Bank, Frankfurt am Main, Germany; email: [email protected] Paolo Emilio Mistrulli Bank of Italy, Rome, Italy; email: [email protected]
© European Central Bank, 2017
Postal address 60640 Frankfurt am Main, Germany Telephone +49 69 1344 0 Website www.ecb.europa.eu
All rights reserved. Any reproduction, publication and reprint in the form of a different publication, whether printed or produced electronically, in whole or in part, is permitted only with the explicit written authorisation of the ECB or the authors.
This paper can be downloaded without charge from www.ecb.europa.eu, from the Social Science Research Network electronic library or from RePEc: Research Papers in Economics. Information on all of the papers published in the ECB Working Paper Series can be found on the ECB’s website.
ISSN 1725-2806 (pdf) DOI 10.2866/662983 (pdf) ISBN 978-92-899-2811-3 (pdf) EU catalogue No QB-AR-17-101-EN-N (pdf)