Characterization and optimization of scan speed for tapping-mode atomic force microscopy
9
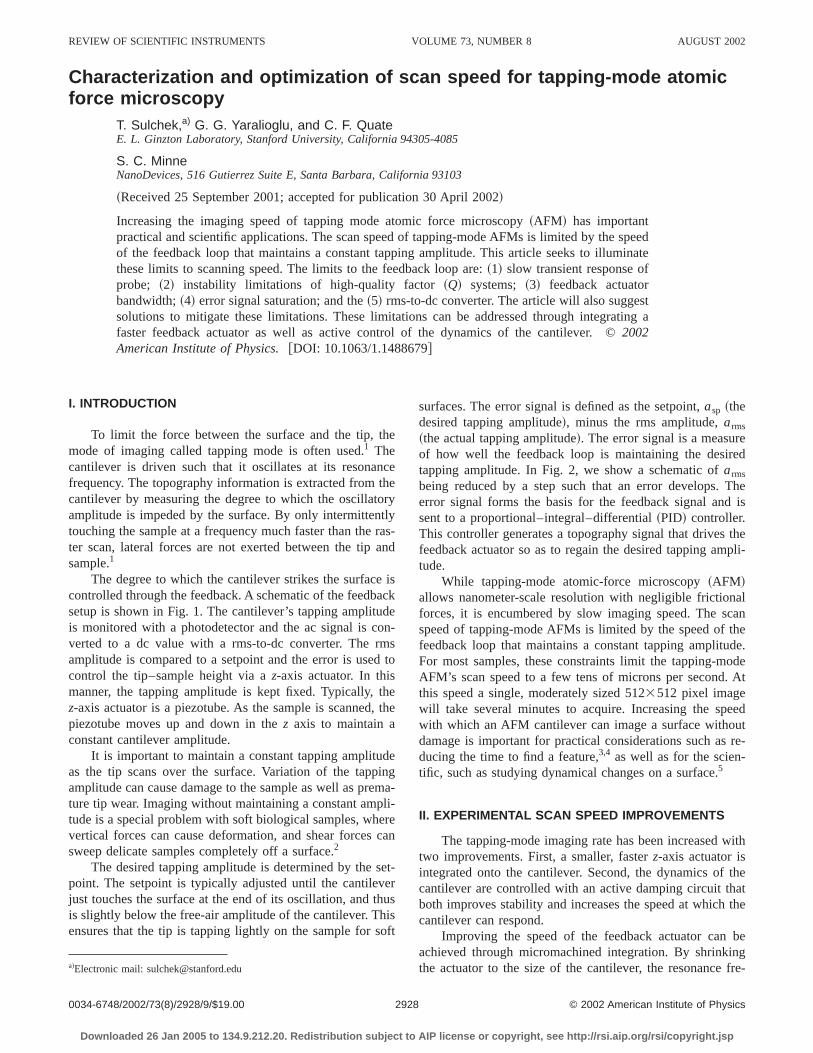
Characterization and optimization of scan speed for tapping-mode atomic force microscopy T. Sulchek, a) G. G. Yaralioglu, and C. F. Quate E. L. Ginzton Laboratory, Stanford University, California 94305-4085 S. C. Minne NanoDevices, 516 Gutierrez Suite E, Santa Barbara, California 93103 ~Received 25 September 2001; accepted for publication 30 April 2002! Increasing the imaging speed of tapping mode atomic force microscopy ~AFM! has important practical and scientific applications. The scan speed of tapping-mode AFMs is limited by the speed of the feedback loop that maintains a constant tapping amplitude. This article seeks to illuminate these limits to scanning speed. The limits to the feedback loop are: ~1! slow transient response of probe; ~2! instability limitations of high-quality factor ~Q! systems; ~3! feedback actuator bandwidth; ~4! error signal saturation; and the ~5! rms-to-dc converter. The article will also suggest solutions to mitigate these limitations. These limitations can be addressed through integrating a faster feedback actuator as well as active control of the dynamics of the cantilever. © 2002 American Institute of Physics. @DOI: 10.1063/1.1488679# I. INTRODUCTION To limit the force between the surface and the tip, the mode of imaging called tapping mode is often used. 1 The cantilever is driven such that it oscillates at its resonance frequency. The topography information is extracted from the cantilever by measuring the degree to which the oscillatory amplitude is impeded by the surface. By only intermittently touching the sample at a frequency much faster than the ras- ter scan, lateral forces are not exerted between the tip and sample. 1 The degree to which the cantilever strikes the surface is controlled through the feedback. A schematic of the feedback setup is shown in Fig. 1. The cantilever’s tapping amplitude is monitored with a photodetector and the ac signal is con- verted to a dc value with a rms-to-dc converter. The rms amplitude is compared to a setpoint and the error is used to control the tip–sample height via a z-axis actuator. In this manner, the tapping amplitude is kept fixed. Typically, the z-axis actuator is a piezotube. As the sample is scanned, the piezotube moves up and down in the z axis to maintain a constant cantilever amplitude. It is important to maintain a constant tapping amplitude as the tip scans over the surface. Variation of the tapping amplitude can cause damage to the sample as well as prema- ture tip wear. Imaging without maintaining a constant ampli- tude is a special problem with soft biological samples, where vertical forces can cause deformation, and shear forces can sweep delicate samples completely off a surface. 2 The desired tapping amplitude is determined by the set- point. The setpoint is typically adjusted until the cantilever just touches the surface at the end of its oscillation, and thus is slightly below the free-air amplitude of the cantilever. This ensures that the tip is tapping lightly on the sample for soft surfaces. The error signal is defined as the setpoint, a sp ~the desired tapping amplitude!, minus the rms amplitude, a rms ~the actual tapping amplitude!. The error signal is a measure of how well the feedback loop is maintaining the desired tapping amplitude. In Fig. 2, we show a schematic of a rms being reduced by a step such that an error develops. The error signal forms the basis for the feedback signal and is sent to a proportional–integral–differential ~PID! controller. This controller generates a topography signal that drives the feedback actuator so as to regain the desired tapping ampli- tude. While tapping-mode atomic-force microscopy ~AFM! allows nanometer-scale resolution with negligible frictional forces, it is encumbered by slow imaging speed. The scan speed of tapping-mode AFMs is limited by the speed of the feedback loop that maintains a constant tapping amplitude. For most samples, these constraints limit the tapping-mode AFM’s scan speed to a few tens of microns per second. At this speed a single, moderately sized 5123512 pixel image will take several minutes to acquire. Increasing the speed with which an AFM cantilever can image a surface without damage is important for practical considerations such as re- ducing the time to find a feature, 3,4 as well as for the scien- tific, such as studying dynamical changes on a surface. 5 II. EXPERIMENTAL SCAN SPEED IMPROVEMENTS The tapping-mode imaging rate has been increased with two improvements. First, a smaller, faster z-axis actuator is integrated onto the cantilever. Second, the dynamics of the cantilever are controlled with an active damping circuit that both improves stability and increases the speed at which the cantilever can respond. Improving the speed of the feedback actuator can be achieved through micromachined integration. By shrinking the actuator to the size of the cantilever, the resonance fre- a! Electronic mail: [email protected] REVIEW OF SCIENTIFIC INSTRUMENTS VOLUME 73, NUMBER 8 AUGUST 2002 2928 0034-6748/2002/73(8)/2928/9/$19.00 © 2002 American Institute of Physics Downloaded 26 Jan 2005 to 134.9.212.20. Redistribution subject to AIP license or copyright, see http://rsi.aip.org/rsi/copyright.jsp
-
Upload
independent -
Category
Documents
-
view
1 -
download
0
Transcript of Characterization and optimization of scan speed for tapping-mode atomic force microscopy
REVIEW OF SCIENTIFIC INSTRUMENTS VOLUME 73, NUMBER 8 AUGUST 2002
Characterization and optimization of scan speed for tapping-mode atomicforce microscopy
T. Sulchek,a) G. G. Yaralioglu, and C. F. QuateE. L. Ginzton Laboratory, Stanford University, California 94305-4085
S. C. MinneNanoDevices, 516 Gutierrez Suite E, Santa Barbara, California 93103
~Received 25 September 2001; accepted for publication 30 April 2002!
Increasing the imaging speed of tapping mode atomic force microscopy~AFM! has importantpractical and scientific applications. The scan speed of tapping-mode AFMs is limited by the speedof the feedback loop that maintains a constant tapping amplitude. This article seeks to illuminatethese limits to scanning speed. The limits to the feedback loop are:~1! slow transient response ofprobe; ~2! instability limitations of high-quality factor~Q! systems; ~3! feedback actuatorbandwidth;~4! error signal saturation; and the~5! rms-to-dc converter. The article will also suggestsolutions to mitigate these limitations. These limitations can be addressed through integrating afaster feedback actuator as well as active control of the dynamics of the cantilever. ©2002American Institute of Physics.@DOI: 10.1063/1.1488679#
h
ncthortlyraa
eacdonmd
he, t
deinemli
erc
seehiso
eed
Theis
thepli-
alcanthede.ode. At
eedutre-
-
with
theatthe
bengfre-
I. INTRODUCTION
To limit the force between the surface and the tip, tmode of imaging called tapping mode is often used.1 Thecantilever is driven such that it oscillates at its resonafrequency. The topography information is extracted fromcantilever by measuring the degree to which the oscillatamplitude is impeded by the surface. By only intermittentouching the sample at a frequency much faster than theter scan, lateral forces are not exerted between the tipsample.1
The degree to which the cantilever strikes the surfaccontrolled through the feedback. A schematic of the feedbsetup is shown in Fig. 1. The cantilever’s tapping amplituis monitored with a photodetector and the ac signal is cverted to a dc value with a rms-to-dc converter. The ramplitude is compared to a setpoint and the error is usecontrol the tip–sample height via az-axis actuator. In thismanner, the tapping amplitude is kept fixed. Typically, tz-axis actuator is a piezotube. As the sample is scannedpiezotube moves up and down in thez axis to maintain aconstant cantilever amplitude.
It is important to maintain a constant tapping amplituas the tip scans over the surface. Variation of the tappamplitude can cause damage to the sample as well as prture tip wear. Imaging without maintaining a constant amptude is a special problem with soft biological samples, whvertical forces can cause deformation, and shear forcessweep delicate samples completely off a surface.2
The desired tapping amplitude is determined by thepoint. The setpoint is typically adjusted until the cantilevjust touches the surface at the end of its oscillation, and tis slightly below the free-air amplitude of the cantilever. Thensures that the tip is tapping lightly on the sample for s
a!Electronic mail: [email protected]
2920034-6748/2002/73(8)/2928/9/$19.00
Downloaded 26 Jan 2005 to 134.9.212.20. Redistribution subject to AIP
e
eey
s-nd
isk
e-
sto
he
ga-
-ean
t-rus
ft
surfaces. The error signal is defined as the setpoint,asp ~thedesired tapping amplitude!, minus the rms amplitude,arms
~the actual tapping amplitude!. The error signal is a measurof how well the feedback loop is maintaining the desirtapping amplitude. In Fig. 2, we show a schematic ofarms
being reduced by a step such that an error develops.error signal forms the basis for the feedback signal andsent to a proportional–integral–differential~PID! controller.This controller generates a topography signal that drivesfeedback actuator so as to regain the desired tapping amtude.
While tapping-mode atomic-force microscopy~AFM!allows nanometer-scale resolution with negligible frictionforces, it is encumbered by slow imaging speed. The sspeed of tapping-mode AFMs is limited by the speed offeedback loop that maintains a constant tapping amplituFor most samples, these constraints limit the tapping-mAFM’s scan speed to a few tens of microns per secondthis speed a single, moderately sized 5123512 pixel imagewill take several minutes to acquire. Increasing the spwith which an AFM cantilever can image a surface withodamage is important for practical considerations such asducing the time to find a feature,3,4 as well as for the scientific, such as studying dynamical changes on a surface.5
II. EXPERIMENTAL SCAN SPEED IMPROVEMENTS
The tapping-mode imaging rate has been increasedtwo improvements. First, a smaller, fasterz-axis actuator isintegrated onto the cantilever. Second, the dynamics ofcantilever are controlled with an active damping circuit thboth improves stability and increases the speed at whichcantilever can respond.
Improving the speed of the feedback actuator canachieved through micromachined integration. By shrinkithe actuator to the size of the cantilever, the resonance
8 © 2002 American Institute of Physics
license or copyright, see http://rsi.aip.org/rsi/copyright.jsp

ub-wte
tile
togaar tronhethes
ngeniT
ncid
er,tieseed.is aeneedsur-
ver awillthe
pa-xi-the
ackorsttheand
erge.a
-tly
p-
ingrprtroua.
tg
nOand-
hen
2929Rev. Sci. Instrum., Vol. 73, No. 8, August 2002 Scan speeds in atomic force microscopy
quency is increased in comparison to a typical piezotactuator on a commercial system.6 Figure 3 contains the essence of the integrated actuator’s advantage in speed,over a factor of 30 increase in imaging bandwidth. The ingrated actuator is made from a zinc oxide~ZnO! piezoelec-tric bimorph and has been described previously.3,7 Here, weuse the ZnO piezoelectric actuator to both drive the canver at its resonant frequency and to providez-axis actuation.
Active control of the cantilever’s effectiveQ is a meansto increase imaging speed through optimizing feedback8 orimproving the bandwidth of transients.9–11 Active controluses an additional feedback loop within the drive circuitdampen the resonances of the cantilever. The feedbackerates an electrical drive that produces the desired mechcal response. For faster scanning, we want a lower mechcal response at resonance. If we examine the equation fomotion of the spring, we find that the damping term is pportional to velocity. By measuring deflection, and differetiating it, we generate a term that is proportional to tdamping term, and this gives us complete control overeffective cantilever response. We will refer to a cantilevwithout active control as ‘‘native’’ and with active control a‘‘damped.’’
III. ANALYSIS
It is useful to evaluate the speed limitations of imagiaccording to two metrics: bandwidth and scanning speThe bandwidth analysis is illuminating because it is a uversal measure that does not depend on surface type.bandwidth of a system is defined as the maximum frequeat which the output of a system will track an input sinusoin a satisfactory manner.12 Higher bandwidth systems allow
FIG. 1. Block diagram of the feedback that controls the cantilever’s tappamplitude. The cantilever is oscillated with a drive at resonance. Topophy of the sample causes a change in the tapping amplitude. The tapamplitude is monitored with a photodetector and the ac signal is conveto a dc value with a rms-to-dc converter. This amplitude is subtracted fa setpoint value, creating an error signal labeled in the diagram. The actseeks to restore the setpoint amplitude. Thez-axis actuator is a piezotubeThe actuator’s signal is also used to generate an image.
FIG. 2. Representation of a cantilever tapping on the surface. As thescans over the upward step, the tapping amplitude is reduced, creatinerror signal.
Downloaded 26 Jan 2005 to 134.9.212.20. Redistribution subject to AIP
e
ith-
-
en-ni-ni-he--
er
d.-hey
the cantilever to follow a surface more accurately. Howevthe bandwidth analysis becomes murky when nonlineariare considered. Ultimately, one is concerned with scan spScan speed is determined by the bandwidth but alsostrong function of the type of surface imaged. For a givacceptable error signal, flat surfaces allow faster scan spwhile vertical steps require us to slow the scan speed. Sfaces can be decomposed into spatial frequencies that cocertain band of frequencies. The maximum scan speedbe determined by the extent these frequencies lie withinbandwidth of the system. Alternatively, instead of using stial frequencies, a more direct approach to finding the mamum scan speed may be found with an analysis based intime domain.
An effective way to evaluate the response of a feedbsystem is the step response. Vertical steps provide a wcase scenario limit to imaging speed. A schematic ofactuator response of a typical system is shown in Fig. 4is explained as follows.
~1! As the tip scans over the downward step, it is no longclamped by the sample, allowing the amplitude to ‘‘rinup’’ according to the cantilever’s dynamical responsThe amplitude increase will follow an exponential withtime constant on the order ofQ/v0 whereQ is the qual-ity factor of the cantilever andv0 is the resonance frequency. Microfabricated cantilevers have an inherenhigh Q, giving typical time constants for transients a
ga-ingedmtor
ipan
FIG. 3. Open-loop transfer function of the piezotube and the integrated Zactuator. The ZnO actuator has over a 30-fold increase in imaging bwidth.
FIG. 4. Representation of the actuator signal and the error signal wscanning over downward and upward steps on the sample.
license or copyright, see http://rsi.aip.org/rsi/copyright.jsp

,ain
chacrm
ly
f
nuon
eatoth
he
ewn
dgto
s
an
vesaxire
e
ore
pe
nifi
50b
ingrehem 0
verlso
in-e to
nse.of
n-
edti-putnse
as a
ofis
e,
inge top-an
antthe
la-
de iscurs
y
ve-B is
2930 Rev. Sci. Instrum., Vol. 73, No. 8, August 2002 Sulchek et al.
proaching a millisecond. Theslow transient response~see Sec. III A below!, limits the error signal and, hencelimits the scanning speed if the cantilever is to maintcontact.
~2! If the cantilever is scanning fast, the amplitude will reaa maximum, called the free-air amplitude, before thetuator can restore the proper tapping amplitude. Hethe magnitude of the error signal will reach a maximuof (afree2asp). The error signal is stalled at a relativesmall value~typically, 10%–20% ofafree! until the ac-tuator returns contact with the sample. The problem osmall, maximum error signal is callederror signal satu-ration ~see Sec. III C!, and limits the scanning speed odownward steps. The topography will appear linear, dto the integration in the controller. The slope of the tpography signal will be determined by the setpoint athe gains of the PID controller.
~3! After feedback restores contact with the sample, theror returns to zero and the topography is once againcurately monitored. The speed with which the actuacan restore accurate topography is determined bymagnitude of the feedback gain. This is limited by tinstability of the high Q system~see Sec. III B!, as wellas the resonance frequency of the actuator~see Sec.III C !.
~4! As the cantilever encounters an upward step the slopthe error signal is steeper. It is no longer limited by slotransients, rather it will be determined by the hard cotact between the pyramidal-shaped tip and the step eThe magnitude of the error signal is no longer limiteda small value by error signal saturation. It can attainmaximum value less than or equal toasp—up to an orderof magnitude greater. The larger error signal producefaster response in the actuator.
~5! The tapping amplitude is restored to its desired valuethe topography is once again accurately recorded.
In addition, because many systems use analog consions of the oscillation amplitude to a dc value, there itrade off between accurate amplitude measurementelimination of the carrier signal. For this reason, appromately ten oscillations are needed for an accurate measuamplitude. We call this a limit of therms-to-dc converter~see Sec. III D!. We will now investigate these limits in mordetail.
A. Slow transient response of probe
1. Bandwidth analysis
For tapping mode, the cantilever sensor cannot respto downward steps instantly due to the slow transientsponse. For a given drive at resonance, high-Q systems arelimited in the amount of energy that can be addedcycle.13 The bandwidth for these transients scales asf 0 /Qand for typical cantilevers~Q;250 andf 0;300 000 Hz! isabout 1200 Hz. However, as the ZnO cantilevers are sigcantly longer than most tapping cantilevers~over 500mm!,the resonance frequency is much lower, on the order ofkHz. Here, the bandwidth limitation is approximately 20Hz. The bandwidth can be experimentally determined
Downloaded 26 Jan 2005 to 134.9.212.20. Redistribution subject to AIP
-e,
a
e-d
r-c-re
in
-e.
a
a
d
r-and-of
nd-
r
-
0
y
driving the ZnO cantilever at its resonance and modulatthe amplitude of the drive. For example, in Fig. 5 we amodulating the amplitude of the drive by 100% so that tenvelope of the drive has an amplitude that changes froto 1 ~in arbitrary units!. In Fig. 5~a!, the modulation fre-quency of 10 Hz is slow enough such that the cantileresponse follows the drive perfectly, with a response that achanges from 0 to 1. As the modulation frequency iscreased, the response of the cantilever becomes immunthe modulation envelope due the slow transient respoEventually, the amplitude of the envelope for the responsethe cantilever is reduced to 0 for high-modulation frequecies. In Figs. 5~b! and 5~c!, we show the response to 100%modulation of the drive for a native cantilever and a dampcantilever for higher-modulation frequencies. For both canlevers, the response envelope is reduced by 3 dB of the inenvelope. We define the bandwidth of the transient respoas those modulation frequencies where the cantilever hsignificant response~a 3 dB reduction or less!. This is sche-matically shown in Fig. 5~d! where the spectrum responsea harmonically driven, amplitude-modulated cantilevergiven. For a native cantilever this bandwidth is 23120 Hz@Fig. 5~b!#. Additional damping of the cantilever by closproximity to the surface, known as squeeze film damping14
reduces theQ by a factor of 3 or more while imaging~sotypical values while imaging are about 75!.15 This increasesthe bandwidth limit to approximately 23400 Hz. Control-ling the dynamics of the cantilever through active dampallows us to increase the speed of the transient responsthe point where the limit of the rms-to-dc converter is aproached~roughly ten cycles must be recorded to convertac signal to a dc value!. In Fig. 5~c!, we show an actively
FIG. 5. Response of a cantilever to amplitude modulation of a resondrive. In all cases the drive has a modulation factor of 100%, meaningdrive amplitude oscillates from 0 to 1~arbitrary units!. In ~a!, a nativecantilever is driven and amplitude modulated with a frequency of modution of 10 Hz. The response has an envelope reaching from 0 to 1. In~b!, themodulation frequency is increased to 120 Hz and the response amplitureduced by 3 dB. An equivalent reduction of the response amplitude ocat 2000 Hz for the damped cantilever, shown in~c!. Spectrum responseschematic of the cantilever,~d!, when driven with the drive described bA cos(v0t)@cos(vmt)11#. The resonance frequency of the cantilever isv0
and the drive is modulated with a frequencyvm . The amplitude of theresponse decreases asvm increases, as represented by the amplitude enlope. The modulation frequency where the amplitude decreases by 3 ddefined as the bandwidth due to slow transients.
license or copyright, see http://rsi.aip.org/rsi/copyright.jsp
n
blyhh
t
et
loaithll
m
ou
sen-efre
r-s
Ttin
eT
-g
terch
edtip
oneig.il-
the.ith a
cleeed.nly
-s
ileofhesainthearetheend
terin
r acanti-de tothe
tance,
upance
2931Rev. Sci. Instrum., Vol. 73, No. 8, August 2002 Scan speeds in atomic force microscopy
damped cantilever where the bandwidth limit due to trasients can be increased to over 232 kHz, by reducing theeffectiveQ by a factor of 6 (Q;15).
2. Scan speed analysis
For accurate imaging the topography signal shouldproportional to the change in topography—unfortunatethis is not always true. The tip can lose contact with tsurface as is evident from Fig. 4 where the amplitude reacits free-air amplitude before event~2!. To maintain contactbetween the tip and surface, the scanning speed musreduced.
The scanning speed limit due to transient responsdependent upon the type of surface imaged as well asdamping of the cantilever. The scan speed limit due to stransients can be analyzed as follows. If the sample conta sharp downward step, the sample will no longer clamposcillation atasp, and the driven cantilever amplitude wiincrease and saturate at the free-air amplitude,afree, asshown in Fig. 6. The amplitude increase as a function of tiis given by
Da~ t !5@afree2asp#@12exp~2v0t/2Q!#. ~1!
For a standard cantilever imaging a surface in air, viscand squeeze film damping produce aQ of approximately 75.For a commercial tapping-mode cantilever,v0
51 800 000 rad/s, a free-air amplitude of 50 nm, and apoint of 80% of the free-air amplitude, the amplitude icreases initially at 4 Å per cycle. For the ZnO cantilever thincrease per cycle is similar, but the lower-resonancequency implies each cycle takes more time (v0
5300 000 rad/s).For the cantilever tip to remain in contact with the su
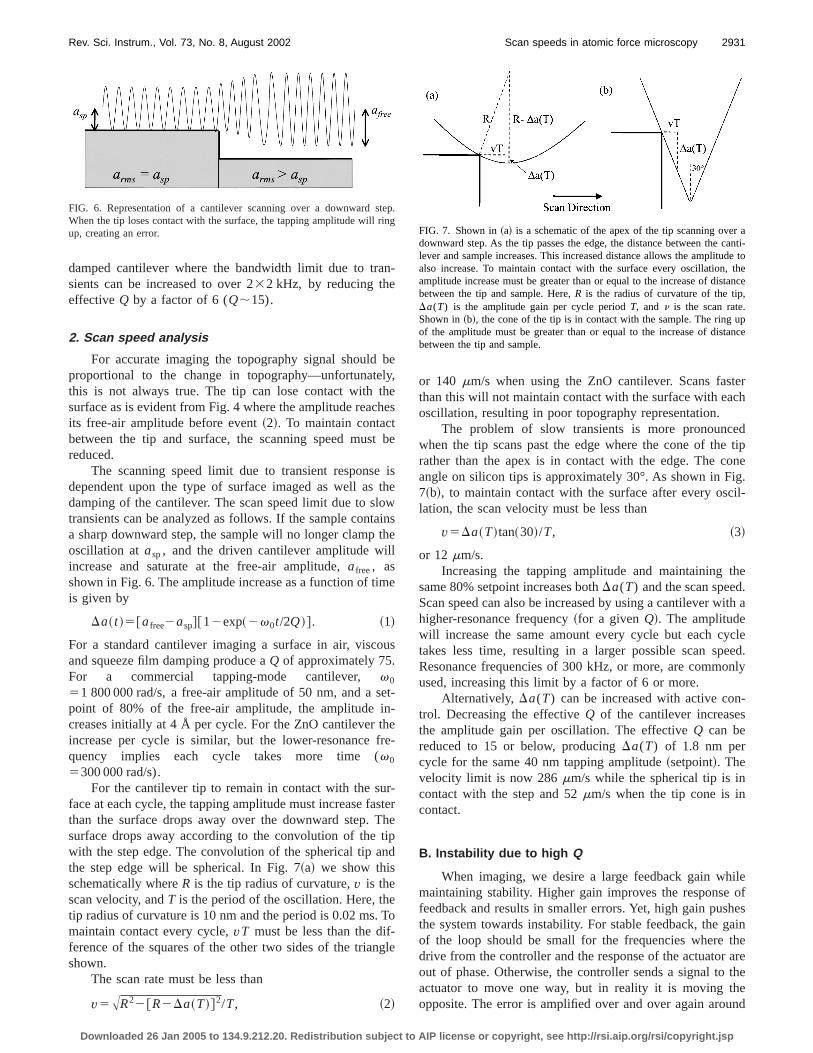
face at each cycle, the tapping amplitude must increase fathan the surface drops away over the downward step.surface drops away according to the convolution of thewith the step edge. The convolution of the spherical tip athe step edge will be spherical. In Fig. 7~a! we show thisschematically whereR is the tip radius of curvature,v is thescan velocity, andT is the period of the oscillation. Here, thtip radius of curvature is 10 nm and the period is 0.02 ms.maintain contact every cycle,vT must be less than the difference of the squares of the other two sides of the trianshown.
The scan rate must be less than
v5AR22@R2Da~T!#2/T, ~2!
FIG. 6. Representation of a cantilever scanning over a downward sWhen the tip loses contact with the surface, the tapping amplitude willup, creating an error.
Downloaded 26 Jan 2005 to 134.9.212.20. Redistribution subject to AIP
-
e,
ees
be
ishewnse
e
s
t-
-
terhepd
o
le
or 140 mm/s when using the ZnO cantilever. Scans fasthan this will not maintain contact with the surface with eaoscillation, resulting in poor topography representation.
The problem of slow transients is more pronouncwhen the tip scans past the edge where the cone of therather than the apex is in contact with the edge. The cangle on silicon tips is approximately 30°. As shown in F7~b!, to maintain contact with the surface after every osclation, the scan velocity must be less than
v5Da~T!tan~30!/T, ~3!
or 12 mm/s.Increasing the tapping amplitude and maintaining
same 80% setpoint increases bothDa(T) and the scan speedScan speed can also be increased by using a cantilever whigher-resonance frequency~for a givenQ!. The amplitudewill increase the same amount every cycle but each cytakes less time, resulting in a larger possible scan spResonance frequencies of 300 kHz, or more, are commoused, increasing this limit by a factor of 6 or more.
Alternatively, Da(T) can be increased with active control. Decreasing the effectiveQ of the cantilever increasethe amplitude gain per oscillation. The effectiveQ can bereduced to 15 or below, producingDa(T) of 1.8 nm percycle for the same 40 nm tapping amplitude~setpoint!. Thevelocity limit is now 286mm/s while the spherical tip is incontact with the step and 52mm/s when the tip cone is incontact.
B. Instability due to high Q
When imaging, we desire a large feedback gain whmaintaining stability. Higher gain improves the responsefeedback and results in smaller errors. Yet, high gain pusthe system towards instability. For stable feedback, the gof the loop should be small for the frequencies wheredrive from the controller and the response of the actuatorout of phase. Otherwise, the controller sends a signal toactuator to move one way, but in reality it is moving thopposite. The error is amplified over and over again arou
p.gFIG. 7. Shown in~a! is a schematic of the apex of the tip scanning ovedownward step. As the tip passes the edge, the distance between thelever and sample increases. This increased distance allows the amplitualso increase. To maintain contact with the surface every oscillation,amplitude increase must be greater than or equal to the increase of disbetween the tip and sample. Here,R is the radius of curvature of the tipDa(T) is the amplitude gain per cycle periodT, and n is the scan rate.Shown in~b!, the cone of the tip is in contact with the sample. The ringof the amplitude must be greater than or equal to the increase of distbetween the tip and sample.
license or copyright, see http://rsi.aip.org/rsi/copyright.jsp

ityth
f
a
th
.ll
-veoran-s
edfg
eedt of
m-
hetoron.the
rge,thathislag45°.z,z,
loo-a
d
ase
2932 Rev. Sci. Instrum., Vol. 73, No. 8, August 2002 Sulchek et al.
the loop, causing a loss of control and instability. Instabilplaces an upper limit on the gain that can be used andlimits the imaging speed.
For the cantilever system, the 180° phase shift occursfrequencies abovev0 . At v0 there is a 90° phase shift fromthe cantilever and the controller adds an additional 90° phshift ~it is dominated by an integrator!. Therefore, atv0 theclosed-loop gain must be less than 1. For a given error,loop gain is proportional to feedback gainG and cantilever–actuator system responseC, as shown schematically in Fig8. The productG3C(v5v0) must, therefore, be smaenough to ensure a closed-loop gain less than 1.C(v0) isproportional to cantileverQ. Thus, by decreasing the effective Q, G can be increased proportionally. Through acticontrol, effectiveQ can often be reduced by a factor of 5more, allowing an increase of feedback gain and a decrein the error signal by a similar amount. Figure 9 demostrates this. In Fig. 9~a!, we show the topography, error signal, and phase of a scan of a silicon grating. In the secondof traces@Fig. 9~b!#, the cantilever has been actively dampsuch that the feedback gain is increased by a factor oreducing the error signal by a like amount. If one is willin
FIG. 8. Schematic for the feedback controlling the actuator. The closed-gain is proportional to feedback gainG and cantilever–actuator system responseC. The productG3C(v5v0) must be small enough to ensureclosed-loop gain less than 1. A proportional decrease inC at resonanceallows a proportional increase inG, which leads to smaller error signal anfaster scanning.C(v0) may be decreased with active control.
Downloaded 26 Jan 2005 to 134.9.212.20. Redistribution subject to AIP
is
or
se
e
se-
et
4,
to accept the original error signal, then the scanning spcan be increased proportionally, as shown in the third setraces@Fig. 9~c!#.
C. Feedback actuator response
1. Bandwidth
The bandwidth for linear response of the actuator is liited by its resonance frequency. In addition, the highQ of theresonance provides a problem for the stability of tsystem—the imaging bandwidth of the feedback actuashould be determined from the closed-loop transfer functiAs the frequency of the input increases, the response ofactuator begins to lag the input. When the lag becomes lathe system becomes unstable. The measure of bandwidthis often used is a phase margin of 45° in the closed loop. Tphase margin indicates the frequency at which the phasebetween the input and response of the system reachesUsing these criteria, the piezotube is limited at 1.5 kHwhile the ZnO-integrated actuator is limited at 45 kHshown in Fig. 10.
p
FIG. 10. Closed-loop transfer function of the ZnO actuator. The 45° phshift occurs at 45 kHz.
s were madrs whenain.
FIG. 9. Typical scan of a 200 nm step. The first trace shows topography, the second the error signal, and the third is the phase. In all cases, scanewith a setpoint of 90% of the free-air amplitude. The feedback gain was maximized to within a few percent of the value where instability occuscanning. In~a!, a native cantilever is used and the scan velocity is 20mm/s. In~b!, the cantilever is damped, allowing a fourfold increase in the feedback gThe error signal is decreased by a like amount. If we accept the original error signal, then the damped cantilever can scan at 80mm/s. In all cases, thepiezotube is used as the feedback actuator.
license or copyright, see http://rsi.aip.org/rsi/copyright.jsp

ar-
plac
fpnenutthncooio
ors
so
ptidth
nthu
niog
ovactip
pli-de
lexayin
theenter-cantod asPIDInthed byn of
Us-
tor
, 0.8,
-by
e forer
p
d
is the
up-everoscil-
iontionnrror
2933Rev. Sci. Instrum., Vol. 73, No. 8, August 2002 Scan speeds in atomic force microscopy
2. Upward step scan speed analysis
A higher-resonance frequency translates into an increof imaging bandwidth. In the time domain, a higheresonance frequency allows a faster response time to apforces. The speed of imaging is limited by the time thetuator can restore a zero error signal; a higher-resonancequency translates directly to faster imaging for upward ste
The magnitude of response of the actuator is determiby the magnitude of the error signal and the feedback gaithe controller. As the actuator and the controller contrib180° phase shift at the resonance, it is important thatclosed-loop gain is kept less than 1 at or above resonaBut, to maintain a small steady-state error, a large open-lgain from the controller is desired. The controller is domnated by the integrator and the gain of the integrator rollsat 20 dB per decade of frequency increase. This allows flarge gain for low frequencies and a smaller gain at the renance. The actuator signal,zactuator, scales as
zactuator5GiE error~ t !dt, ~4!
whereGi is the gain on the integrator. Increasing the renance frequency allows an increase inGi by 20 dB for everydecade increase ofv0 . IncreasingGi directly results in aproportional increase in scan speed.
As the cantilever scans over an upward step, the amtude is sharply reduced as the surface clamps the oscillaof the cantilever. For steps larger than the tapping amplituoscillation can be completely quenched, in which caseerror signal becomes saturated atasp. Not only does thiscause increased vertical force, but with the tip now in cotinuous contact, the shear force is likely to damage bothsample as well as the tip. To avoid this, the error signal malways remain less than the setpoint.
For fast scans, it is possible to quench oscillation in ocycle. For a vertical step, we must consider the convolutof the tip and sample, which is dominated by the cone anof the tip. A glance at Fig. 7~b! will show that a scan ofdistancevT towards the step, whereT is the period of oscil-lation, will clamp the oscillation byvT tan(30). Therefore, avelocity of
v5asptan~30!/T, ~5!
will quench oscillation in one cycle, or about 1154mm/s.For slower speeds, oscillation can also be quenched
more than one cycle if the amplitude decrease from surfclamping is faster than the actuator can increase the
FIG. 11. Schematic of the actuator in feedback. The actuator is modelea second-order system, withC(s)5vn
2/@s21(vn /Q)s1vn2#, in closed loop
with a PID controller, withG(s)5Gi /s1Gp1Gds. The cantilever is ac-tively controlled withD(s)5kds.
Downloaded 26 Jan 2005 to 134.9.212.20. Redistribution subject to AIP
se
ied-re-s.d
ofeee.p
-ffa
o-
-
li-one,e
-e
st
enle
ere–
sample distance. For example, if in every cycle, the amtude is reduced by 5 nm, then in eight cycles, the amplituwill be reduced to zero.
Although the response of the system with a comperror signal can be difficult to determine analytically, we msimplify the system with several assumptions. Clampingthe z direction over durationDt is described byvDt/tan 30,whereDt can be taken to be small when compared toresponse time of the actuator. The actuator signal will thtake the form of a step response, with a step height demined by magnitude of the error signal. Therefore, the sis limited by the time it takes for the feedback to respondthis error signal. The actuator’s response can be simulatea second-order cantilever response in closed loop with acontroller.16 We model the system as shown in Fig. 11.Fig. 12 we show the unit step response of the system forpiezotube and integrated actuator. For a system dominatean integrator, the response approximates a linear functiot for a unit input. The slope of the actuator’s unit step,c, isdetermined by the rise time from 10% to 90% response.ing the 10%–90% rise time, the value ofc is ;550 s21
where the feedback actuator is a piezotube, to;1250 s21 forthe ZnO actuator. The damped cantilever with ZnO actuaallows larger feedback gains with ac of ;10 000 s21. Withthese values, the response to the step input occurs in 1.8and 0.1 ms, respectively.
The error as a function oft can be defined as the difference between the clamping of the cantilever’s amplitudethe step and the response of the actuator to compensatthis step. This is shown schematically in Fig. 13. A cantilevat time t will have a given tapping amplitude. As the ti
as
FIG. 12. Step response of the actuator in feedback where the actuator~a! piezotube,~b! native ZnO, and~c! damped ZnO.
FIG. 13. Schematic showing how tapping amplitude is affected by anward step. The solid outline represents the center position of the cantiland the two dashed outlines represent the extremes of the cantileverlation. The amplitude is shown by the double arrows. In~a! we show theamplitude at some timet as the tip scans an upward step. One oscillatlater, ~b!, the tip has advanced to the right. The step clamps the oscillawhile the actuator has increased thez-axis height of the cantilever, as seeby a higher center position. The net effect in this example is a larger esignal.
license or copyright, see http://rsi.aip.org/rsi/copyright.jsp

veene
Thi
th
in
te
--h
is
he
d(1
-t
o
ehtat
d0,
mk ac-forignal.an
tep.200
heap-b-l
me
rpedichor is
e
an.an
oxi-25
The
lla-rd
ap-verof 4de-p
en by
2934 Rev. Sci. Instrum., Vol. 73, No. 8, August 2002 Sulchek et al.
scans into the step, the amplitude will be reduced. Howethe actuator will seek to increase the distance between thand sample. Analytically, the error signal can be determiby dividing the time into smaller units ofDt, which aresmall compared to the response time of the actuator.incremental increase in the error signal over a unit of timegiven by the surface clamping over that time minusmovement of the actuator over that time:
error~ t1Dt !2error~ t !5zclamping~Dt !2zactuator~Dt !. ~6!
As the tip scans over the upward step, the vertical clampof the surface per unit time scales likevDt/tan 30. For smallDt, the response of the actuator for a given input is unit sresponsecDt times the magnitude of input error(t), orzactuator5error(t)cDt.
We can analyze the error signal as a function oft bydividing the time into small units ofDt with tn5nDt, wheren is an integer increasing from zero. Thus,t0 represents thetime at which the tip first comes in contact with the step,t1
equalst01Dt, and so on. Then
error~ tn!5error~ tn21!1vD/tan 302error~ tn21!cDt.~7!
For example, takingDt to be the time for one oscillation~about 0.02 ms!, error(t0) is zero. The error for one oscillation later is error(t1)5vDt/tan 30~there is not yet an actuator response!. However, by t2 the actuator responds witvcDt2/tan 30, and so
error~ t2!5vDt
tan 30~22cDt !, ~8!
and
error~ t3!5vDt
tan 30~323cDt1c2Dt2!. ~9!
Surface clamping will continue during the time that the tipin contact with the step. For a step of heightH, the tip is incontact for all t<H tan 30/v. We define n85(H tan 30)/vDt to be the time at which the tip passes tstep. By induction, the error as a function oftn is
error~ tn!5vDt
tan 30(b50
n21
~2cDt !b1
~b11!!
n!
~n2b21!!,
~10!
for all n<n8. After this time, clamping no longer occurs anthe error signal will steadily decrease by a factor of2cDt) everyDt units of time. For alln.n8, the error is
error~ tn!5error~ tn8!~12cDt !n2n8. ~11!
The duration ofDt is small compared to the time of response, therefore, the initial slope of the step response ismost appropriate measure of thec parameter. In this case,chas values of 1250, 3300, and 14 300 s21 for the piezotube,ZnO, and damped ZnO actuators, respectively. The abequation can be numerically solved and the error is foundincrease to a maximum value determined by the scan spand the speed of the actuator. If we encounter a step heig200 nm and set a limit to the maximum error that was
Downloaded 26 Jan 2005 to 134.9.212.20. Redistribution subject to AIP
r,tipd
ese
g
p
he
vetoedof-
tained for downward steps~10 nm for a 40 nm setpoint an50 nm free-air amplitude!, then scan speeds are limited to 129, and 116mm/s, respectively.
Figure 9 shows a typical scan line trace of a 200 nstep. In all cases, the piezotube is used as the feedbactuator with its topography signal shown in the first traceeach set. The second trace in each set shows the error sThe positive spikes indicate an rms amplitude smaller ththe desired amplitude while scanning over an upward sFor the scan velocity of 20 000 nm/s and a step height ofnm, the tip is in contact with the step edge until timen5285. The plot of the error as a function ofn, as calculatedfrom the above equation, is shown in Figs. 14~a!–14~c!. Forthe case of the piezotube actuator@Fig. 14~a!#, the maximumcalculated error signal from center to peak is 28 nm. Troot-mean square of the calculated error signal givesproximately 20 nm, and this compares well with the oserved value@Fig. 9~a!#. After this maximum, the error signadecreases and becomes negligible at a final timen5500, ort510 ms. This again compares well with the measured tiof spike of 15 ms from Fig. 9~a!. In Fig. 14~b!, we show thecalculated error as a function ofn when a piezotube actuatois used in conjunction with a damped cantilever. The damcantilever allows us to increase the feedback gain, whreduces the error of the step response. The maximum errcalculated to be 7 nm~5 nm rms!, which again is close to theerror shown in Fig. 9~b!. The calculated error signal for thdamped ZnO actuator is shown in Fig. 14~c!. Finally, in Fig.14~d! we show in greater detail the error signal from a scHere, the error signal is monitored during a scan overupward step. The tip makes contact with the step at apprmatelyn5250 and the error increases to a magnitude ofnm. The observed shape is similar to what is calculated.
FIG. 14. Simulation showing the error as a function of number of oscitions n ~proportional tot! for a cantilever scanning over a 200 nm upwastep. For the case of the piezotube actuator~a! the maximum error signal is28 nm center to peak. The root-mean square of the error signal givesproximately 20 nm. Using the same actuator but damping the cantileallows a larger feedback gain to be used, reducing the error by a factorin ~b!. A damped cantilever with a ZnO actuator has an error signalscribed by~c!. Finally, in ~d! the error signal from a scan of an upward steis shown using the piezotube feedback actuator. These data were takaveraging 16 scans and show fast scan in units ofn vs error signal innanometers center to peak.
license or copyright, see http://rsi.aip.org/rsi/copyright.jsp

th
-ap
ckedtoford
e.
geveo
nfo
rvetimthsi
ar
o
m
llauo
wn
aarnin
ig
ds
dctingvere isn-hisleakhez.f ther--
this
edimi-e torrorys,ndpa-beset-on
ings in
ps inps,husbeent or
iseedtactce.
n isbe-rtia
an-asDe-
olid
m.
2935Rev. Sci. Instrum., Vol. 73, No. 8, August 2002 Scan speeds in atomic force microscopy
small peaks in the error are due to the imperfections ontip and step edge. This trace is an average of 16 scans.
3. Error signal saturation
Since the setpoint is chosen to be close to the freeamplitude, the maximum error signal on a downward stesmall. As the error signal determines the actuator signal~af-ter integration!, a limited error signal constrains the feedbaloop to a relatively slow response. This limitation is call‘‘error signal saturation.’’ Typically, the setpoint is chosenbe as close to the free-air amplitude as possible. Therethe maximum magnitude of the error signal for downwasteps isafree-asp, often under 20% of the free-air amplitudThe speed of tapping-mode imaging can be increasedsimply using a smaller setpoint, since this allows a larerror signal while scanning over downward steps. Howethis strategy requires a stronger tapping force for ssamples, which is undesirable.17
With the description as in a previous section, the ustep response of the actuator for a closed-loop systemlows zactuator5error(t)ct wherec5550, 1400, and 10 000 fothe piezotube, ZnO, and damped ZnO actuators, respectiFor a downward step larger than a few nanometers, theto negotiate the step will be larger than the millisecondamplitude takes to respond. The magnitude of the errornal will saturate atafree-asp, or approximately 10 nm for asetpoint of 40 nm. The actuator signal due to a downwstep is thenzactuator5(afree-asp)ct or zactuator510ct, wherezactuatoris in nm. For a downward step ofH nm, the limitederror signal requirest5H/10c to move the actuatorH nm@notec has units~s!21 and 10 has units~nm!#. In that time,the scan coversH tan 30 nm. The scan velocity is limited t
v510cH tan 30/H, ~12!
or
v510c tan 30. ~13!
The scan speeds to maintain contact with the step at all tiafter ring up are limited to 3.2, 8, and 58mm/s, respectively.Most operators accept less fidelity to the surface. Typicathis does not increase tip wear or sample damage, becthe tip is not in contact with the surface during this time. Fexample, the scan over a downward step in Fig. 9~a! has anegative error signal that is stalled at about210 nm ~corre-sponding to an increase ofarms from asp to afree!, The tiploses contact with the surface for over 35 ms on the doward step, during this time the tip scans 0.7mm, or about3.5% of the scan. The setpoint and tapping amplitudechosen such that the maximum error signal for downwsteps is about 10 nm. During the 35 ms that the tip asample are out of contact, the piezotube actuator is movdown to follow the step. Moving 10ct nm for the time out ofcontact, the actuator moves 200 nm, equal to the step heto regain the zero error signal.
D. rms-dc converter
Most commercial systems use analog techniques tomodulate the tapping amplitude into a dc measure. Thi
Downloaded 26 Jan 2005 to 134.9.212.20. Redistribution subject to AIP
e
iris
re,
byrr,ft
itl-
ly.e
eg-
d
es
y,se
r
-
reddg
ht,
e-is
typically done with a rms-to-dc converter. The rms-to-converter measures the true rms amplitude of the oscillacantilever, where the instantaneous position of the cantileis measured by the photodetector and the averaging timset by the time constant on the chip. Typically, the time costant is equal to the time needed for ten oscillations. Ttime constant ensures the carrier frequency does notthrough significantly in the signal. If the resonance of tcantilever is 50 kHz, the bandwidth is then limited to 5 kHThis can be increased by using the second resonance ocantilever18 or by fabricating smaller cantilevers with higheresonance frequencies.19 The scan speed for the tappingmode images published in Ref. 8 are constrained bylimitation.
IV. DISCUSSION
Many of the limitations described here are interrelatand cannot be easily isolated to determine the greatest ltation on scan speed. For example, although the limits duslow transients are not typically as severe as that of esignal run out, the slow transients introduce time delawhich have an effect on the stability of the system, ahence, require reduced gains. In addition, many specificrameters will vary from system to system and shouldtaken into account. For example, resonance frequency,point, and tapping amplitude all have significant effectsscan speed.
The imaging speed limits were determined by examinthe response of the system to upward and downward steptopography. These calculations are based upon ideal stesurfaces. In practice, there are no perfectly vertical stewhich is to our advantage. The limits described here are ttempered by this fact. In addition, significant leeway canhad by the operator. If the sample is particularly robust, thdiscretion can be used when deciding upon the setpointhe acceptable error signal.
For an AFM operating in contact mode, where the tipin continuous contact with the microscope, the scan spcan be significantly faster than the tapping mode. In conmode, the cantilever is heavily damped by the surfaTherefore, the problem of high-Q systems is not a limitationto speed. Moreover, the problem of error signal saturatioavoided because of the strong attractive force that existstween the tip and sample due to capillary forces. Here, ineplays a larger part in limiting the scan speed.20
ACKNOWLEDGMENTS
The authors would like to thank Professor Gene F. Frklin for his expertise in feedback systems. This work wsupported by the National Science Foundation and thefense Advanced Research Projects Agency.
1Q. Zhong, D. Inniss, K. Kjoller, and V. B. Elings, Surf. Sci.290, L688~1993!.
2T. Shibata-Saka, J. Masai, T. Tagawa, T. Sorin, and S. Kondo, Thin SFilms 273, 297 ~1996!.
3S. R. Manalis, S. C. Minne, A. Atalar, and C. F. Quate, Rev. Sci. Instru67, 3918~1995!.
license or copyright, see http://rsi.aip.org/rsi/copyright.jsp

H.
M.a
A
. Fett
D
pl.
ted
B.
J..
. L.
2936 Rev. Sci. Instrum., Vol. 73, No. 8, August 2002 Sulchek et al.
4Y. Fang, T. S. Spisz, T. Wiltshire, N. P. D’Costa, I. N. Bankman, R.Reeves, and J. H. Hoh, Anal. Chem.70, 2123~1998!.
5S. Kasas, N. H. Thomson, B. L. Smith, H. G. Hansma, X. Zhu,Guthold, C. Bustamante, E. T. Kool, M. Kashlev, and P. K. HansmBiochemistry36, 461 ~1999!.
6Digital Instruments, Dimension 3000.7S. C. Minne, G. Yaralioglu, S. R. Manalis, J. D. Adams, J. Zesch,Atalar, and C. F. Quate, Appl. Phys. Lett.72, 2340~1998!.
8T. Sulchek, R. Hsieh, J. D. Adams, G. G. Yaralioglu, S. C. Minne, CQuate, J. P. Cleveland, A. Atalar, and D. M. Adderton, Appl. Phys. L76, 1473~2000!.
9J. Mertz, O. Marti, and J. Mlynek, Appl. Phys. Lett.62, 2344~1993!.10D. Rugar, O. Zuger, S. Hoen, C. S. Yannoni, H. M. Vieth, and R.
Kendrick, Science264, 1560~1994!.11K. J. Bruland, J. L. Garbini, W. M. Dougherty, and J. A. Sidles, J. Ap
Phys.83, 3972~1998!.12Gene F. Franklin, J. David Powell, and Abbas Emami-Naeini,Feedback
Control of Dynamic Systems~Addison-Wesley, New York, 1994!, p. 343.
Downloaded 26 Jan 2005 to 134.9.212.20. Redistribution subject to AIP
,
.
.
.
.
13R. Feynman,The Feynman Lectures on Physics~1963!, Vol. 1, p. 24–3.14F. M. Serry, P. Veuzil, R. Vilasuso, and G. J. Maclay, inProceedings of the
Second International Symposium on Microstructures and MicrofabricaSystems, Chicago~Electrochemical Society, Pennington, NJ, 1995!, p. 83.
15An observation made by the authors.16MATLAB UNIX & LINUX: version 6, Release 12, Mathworks, Inc., Nat-
ick, MA.17B. Anczykowski, B. Gotsmann, H. Fuchs, J. P. Cleveland, and V.
Elings, Appl. Surf. Sci.140, 376 ~1999!.18R. W. Stark, T. Drobek, and W. M. Heckl, Appl. Phys. Lett.74, 3296
~1999!.19M. B. Viani, T. E. Schaffer, G. T. Paloczi, L. I. Pietrasanta, B. L. Smith,
B. Thompson, M. Richter, M. Rief, H. E. Gaub, K. W. Plaxco, A. NCleland, H. G. Hansma, and P. K. Hansma, Rev. Sci. Instrum.70, 4300~1999!.
20H. J. Butt, P. Siedle, K. Seifert, K. Fendler, T. Seeger, E. Bamberg, AWeisenhorn, K. Goldie, and A. Engel, J. Microsc.169, 75 ~1993!.
license or copyright, see http://rsi.aip.org/rsi/copyright.jsp