Characterization and genetic diversity analysis of cotton cultivars using microsatellites
9
Characterization and genetic diversity analysis of cotton cultivars using microsatellites Cândida H.C. de Magalhães Bertini 1 , Ivan Schuster 5 , Tocio Sediyama 4 , Everaldo Gonçalves de Barros 1,2 and Maurílio Alves Moreira 1,3 1 Universidade Federal de Viçosa Instituto de Biotecnologia Aplicada à Agropecuária, Viçosa, MG, Brazil. 2 Universidade Federal de Viçosa, Departamento de Biologia Geral, Viçosa, MG, Brazil. 3 Universidade Federal de Viçosa, Departamento de Bioquímica e Biologia Molecular Viçosa, MG, Brazil. 4 Universidade Federal de Viçosa, Departamento de Fitotecnia, Viçosa, MG, Brazil. 5 COODETEC - Cooperativa Central de Pesquisa Agrícola, Cascavel, PR, Brazil . Abstract Genetic diversity and the relationship between varieties are of great importance for cotton breeding. Our work was designed to estimate the informativeness of the cotton (Gossypium hirsutum L.) simple sequence repeat (SSR) microsatellite locus and to estimate the genetic distance between 53 cotton cultivars as well as to select a set of SSR primers able to differentiate between the 53 cotton cultivars studied. After extracting DNA from the 53 cultivars and characterized it using 31 pairs of SSR primers we obtained a total of 66 alleles with an average of 2.13 alleles per SSR locus and values of polymorphism information content (PIC) varying from 0.18 to 0.62, the dissimilarity coeffi- cient varying from zero to 0.41. Statistical analysis using the unweighted pair-group method using arithmetic average (UPGMA) revealed seven subgroups which were consistent with the genealogical information available for some of the cultivars. The SSR genetic profile obtained for each of the cultivars made it possible to discriminate 52 of the 53 cultivars. This study of the genetic diversity of cotton cultivars with SSR markers support the need to introduce new alleles into the gene pool of the breeding cultivars. Key words: fingerprinting, Gossypium hirsutum L., genealogy, molecular markers. Received: December 14, 2004; Accepted: August 25, 2005. Introduction Many cotton (Gossypium hirsutum L.) varieties have been developed from crosses between closely related an- cestors but so far only limited increases in productivity have been obtained. Pressure for higher productivity in cot- ton farming has stimulated the search for more exotic germplasm, but although breeding methods have increased the efficiency of transferring alleles from exotic germplasm sources to cotton breeding gene pools many germplasm sources still remain underused. Van Esbroeck and Bowman (1998) have pointed out that genetic diversity ensures pro- tection procedures against diseases and pests and thus pro- vides a basis for future genetic gains. Molecular markers have been widely used in genetic analyses, breeding studies and investigations of genetic di- versity and the relationship between cultivated species and their wild parents because they have several advantages as compared with morphological markers, including high polymorphism and independence from effects related to en- vironmental conditions and the physiological stage of the plant. For research involving cotton (Gossypium hirsutum L.) the most widely used molecular method has been the random amplified polymorphic DNA (RAPD) technique (Multani and Lyon, 1995; Tatineni et al., 1996; Iqbal et al., 1997; Lu and Myers, 2002), although allozymes (Wendel et al., 1992), restriction fragment length polymorphism (RFLP) (Wendel and Brubaker, 1993) and amplified frag- ment length polymorphism (AFLP) (Pillay and Myers, 1999; Abdalla et al., 2001) have all been used successfully in genetic diversity analyses in many species including cot- ton. In spite of the success of these methods the level of polymorphism detectable is low, with allozymes and RFLP markers having particularly low intra- and interspecific polymorphism, and these types of markers tend not effi- cient when applied to the genotyping of large germplasm collections (Liu et al., 2000a). Genetics and Molecular Biology, 29, 2, 321-329 (2006) Copyright by the Brazilian Society of Genetics. Printed in Brazil www.sbg.org.br Send correspondence to Cândida H.C. de Magalhães Bertini. Rua Vicente Padilha 496, Bairro Vila União, 60.410-680 Fortaleza, CE, Brazil. E-mail: [email protected]. Research Article
Transcript of Characterization and genetic diversity analysis of cotton cultivars using microsatellites

Characterization and genetic diversity analysis of cotton cultivars usingmicrosatellites
Cândida H.C. de Magalhães Bertini1, Ivan Schuster5, Tocio Sediyama4, Everaldo Gonçalves de Barros1,2
and Maurílio Alves Moreira1,3
1Universidade Federal de Viçosa Instituto de Biotecnologia Aplicada à Agropecuária, Viçosa, MG, Brazil.2Universidade Federal de Viçosa, Departamento de Biologia Geral, Viçosa, MG, Brazil.3Universidade Federal de Viçosa, Departamento de Bioquímica e Biologia Molecular Viçosa, MG, Brazil.4Universidade Federal de Viçosa, Departamento de Fitotecnia, Viçosa, MG, Brazil.5COODETEC - Cooperativa Central de Pesquisa Agrícola, Cascavel, PR, Brazil .
Abstract
Genetic diversity and the relationship between varieties are of great importance for cotton breeding. Our work wasdesigned to estimate the informativeness of the cotton (Gossypium hirsutum L.) simple sequence repeat (SSR)microsatellite locus and to estimate the genetic distance between 53 cotton cultivars as well as to select a set of SSRprimers able to differentiate between the 53 cotton cultivars studied. After extracting DNA from the 53 cultivars andcharacterized it using 31 pairs of SSR primers we obtained a total of 66 alleles with an average of 2.13 alleles perSSR locus and values of polymorphism information content (PIC) varying from 0.18 to 0.62, the dissimilarity coeffi-cient varying from zero to 0.41. Statistical analysis using the unweighted pair-group method using arithmetic average(UPGMA) revealed seven subgroups which were consistent with the genealogical information available for some ofthe cultivars. The SSR genetic profile obtained for each of the cultivars made it possible to discriminate 52 of the 53cultivars. This study of the genetic diversity of cotton cultivars with SSR markers support the need to introduce newalleles into the gene pool of the breeding cultivars.
Key words: fingerprinting, Gossypium hirsutum L., genealogy, molecular markers.
Received: December 14, 2004; Accepted: August 25, 2005.
Introduction
Many cotton (Gossypium hirsutum L.) varieties have
been developed from crosses between closely related an-
cestors but so far only limited increases in productivity
have been obtained. Pressure for higher productivity in cot-
ton farming has stimulated the search for more exotic
germplasm, but although breeding methods have increased
the efficiency of transferring alleles from exotic germplasm
sources to cotton breeding gene pools many germplasm
sources still remain underused. Van Esbroeck and Bowman
(1998) have pointed out that genetic diversity ensures pro-
tection procedures against diseases and pests and thus pro-
vides a basis for future genetic gains.
Molecular markers have been widely used in genetic
analyses, breeding studies and investigations of genetic di-
versity and the relationship between cultivated species and
their wild parents because they have several advantages as
compared with morphological markers, including high
polymorphism and independence from effects related to en-
vironmental conditions and the physiological stage of the
plant.
For research involving cotton (Gossypium hirsutum
L.) the most widely used molecular method has been the
random amplified polymorphic DNA (RAPD) technique
(Multani and Lyon, 1995; Tatineni et al., 1996; Iqbal et al.,
1997; Lu and Myers, 2002), although allozymes (Wendel et
al., 1992), restriction fragment length polymorphism
(RFLP) (Wendel and Brubaker, 1993) and amplified frag-
ment length polymorphism (AFLP) (Pillay and Myers,
1999; Abdalla et al., 2001) have all been used successfully
in genetic diversity analyses in many species including cot-
ton. In spite of the success of these methods the level of
polymorphism detectable is low, with allozymes and RFLP
markers having particularly low intra- and interspecific
polymorphism, and these types of markers tend not effi-
cient when applied to the genotyping of large germplasm
collections (Liu et al., 2000a).
Genetics and Molecular Biology, 29, 2, 321-329 (2006)
Copyright by the Brazilian Society of Genetics. Printed in Brazil
www.sbg.org.br
Send correspondence to Cândida H.C. de Magalhães Bertini. RuaVicente Padilha 496, Bairro Vila União, 60.410-680 Fortaleza, CE,Brazil. E-mail: [email protected].
Research Article

Simple sequence repeat (SSR) markers (micro-
satellites) have been successfully employed in many ge-
netic diversity studies (Liu et al., 2000b; Gutiérrez et al.,
2002) and are useful for a variety of applications in plant
genetics and breeding because of their reproducibility,
multiallelic nature, codominant inheritance, relative abun-
dance and good genome coverage (Powel et al., 1996). The
availability and abundance of microsatellite markers
throughout the cotton genome coupled with the fact that
they are polymorphic, codominant and are based on the
polymerase chain reaction (PCR) make them particularly
useful in genetic diversity studies of cotton (Reddy et al.,
2001), with in excess of 1000 microsatellite primers having
already been isolated from cotton DNA genome libraries
(Nguyen et al., 2004).
Molecular studies of the genetic diversity of culti-
vated cotton have generally shown low genetic diversity
(Brubaker and Wendel, 1994; Tatineni et al., 1996; Iqbal et
al., 1997). However, more work needs to be carried out and
the purpose of the work described in our present paper was
to investigate the genetic diversity of cotton plants culti-
vated in several regions of Brazil, Argentine and Paraguay
with the specific objectives of estimating the informative-
ness of cotton microsatellite loci and selecting a set of
microsatellite primers able to differentiate between the 53
cultivars studied and to estimate the genetic distance
among 53 cotton cultivars cultivated on Cone Sur.
Materials and Methods
Plant material and DNA extraction
We investigated 53 Gossypium hirsutum L. cotton
cultivars developed and released by public and private in-
stitutions in Brazil, Argentine and Paraguay (Table 1). For
each cultivar we extracted total DNA from ten seeds using a
method based on that described by McDonald et al. (1994).
322 Bertini et al.
Table 1 - Cotton cultivars analyzed in this study with their descriptive data. Except for cultivars 19, 20, 21 and 43 all cultivars were from Brazil.
N. Origin1 Cultivar Genealogy2 Cropping-cycle
(days)
Region, state or country where
planted3
1 CSIRO-Australia Sicala 3-2 Acala1517-70/TamcotSP-37//DP6
1/csiro
135-175 -
2 EMBRAPA CNPA ITA 90 Selection in Deltapine AC-90 170/180 Cerrado
3 Fundação MT BRS 96 Selection in EPAMIG 3 170/180 Cerrado
4 EMBRAPA BRS Facual Sicala 34/cnpa sri5 170-180 Cerrado
5 Fundação MT/EMBRAPA BRS Antares Selection in cnpa sri5 160-170 Cerrado
6 Fundação MT FMT Saturno Selection in CS 50 160/170 Cerrado
7 DELTA PINE Delta-Opal - 145 Most Brazilian regions
8 BAYER SEEDS Fiber Max 966 Selection in cultivar Sicala 34 156 Northeast of SP, GO, MS, MT, TO
9 BAYER SEEDS Fiber Max 986 Selection in cultivar Sicala 3-2 160 Northeast of SP, GO, MS, MT, TO
10 IAC IAC 17 Selection in IAC RM3 140 SP
11 IAC IAC 19 Yucatanense/N1-HOA//IAC RM3 150 SP
12 IAC IAC 20 Selection in IAC 17 140 SP
13 IAC IAC 21 Selection in IAC 19 150 SP
14 IAC IAC 22 IAC 20/GH 11-9-75 140 SP, central-western Brazil
15 IAC IAC 23 Selection in IAC 20-RR. 150 SP
16 IAPAR IPR 94 IAPAR 71/Deltapine Acala 90 138-175 PR
17 IAPAR IPR 95 CNPA ITA 90/IAPAR 71 138-175 PR
18 IAPAR IPR 96 CNPA ITA 90/IAPAR 71 135-175 PR
19 Argentine Guazuncho 2 Guazuncho/SP 8535 - Argentine and Paraguay
20 Argentine Cacique MATACO/GUAZUNCHO - Argentine
21 Argentine Oro Blanco SP2473/SIOKRA - Argentine
22 SYNGENTA Makina KNX111/Acala SJ-5 160 MT, MS, GO, SP, BA
23 SYNGENTA Fabrika KNH390/Monar 135-366 175 MT, MS, GO, SP, BA
24 EMBRAPA CNPA 7H TAMCOT SP 37/IAC 17 120/130 Northeastern and central-southern
Brazil
25 EMBRAPA CNPA 8H - 130/140 North and northeastern Brazil
26 EMBRAPA CNPAPrecoce1 Selection in GH-11-9-75 110/120 North and northeastern Brazil and the
Cerrado

The quality of the DNA was evaluated by photospectro-
metry using the 260/280 nm absorbance ratio method and
by electrophoreses in 0.8% (w/v) agarose gel and the DNA
concentration estimated at 260 nm (Sambrook et al., 1989).
The stock DNA samples were stored at -20 °C and working
DNA samples (containing 10 ng µL-1) at 4 °C.
Microsatellite markers and amplification conditions
To select the markers to be used for investigating our
53 cotton cultivars we screened 12 cotton cultivars using
116 BNL (made available by Research Genetics) and
86 JESPR primer pairs (Reddy et al., 2001) synthesized by
Invitrogen Life Technologies as CNL primers, of which
34 BNL pairs and 1 CNL pair were polymorphic. However,
only 31 primer pairs produced easily-detected products
(Table 2).
Amplifications were carried out in 200 µL micro-
tubes containing 15 µL of reaction mix consisting of 30 ng
of template, 0.2 µM of each primer, 1 unit of Taq DNA
polymerase, 0.2 mM of each dNTP, 0.2 to 0.3 mM of
Genetic diversity of cotton cultivars 323
Table 1 (cont.)
N. Origin1 Cultivar Genealogy2 Cropping-cycle
(days)
Region, state or country where
planted3
27 EMBRAPA CNPAPrecoce2 C-100-7-81/PNH3 110/120 North and northeastern Brazil and the
Cerrado
28 EMBRAPA CNPAPrecoce3 C-80-18-80 / PNH3 170/180 Cerrado
29 EMBRAPA CNPA ITA 92 Selection in Island 542 110/120 North, northeastern and cen-
tral-western Brazil
30 EMBRAPA BRS 197 Selection in cnpa sri5 170/180 Cerrado
31 EMBRAPA BRS Itaúba Selection in CS 50 170/180 Cerrado
32 EMBRAPA BRS Aroeira Selection in CNPA SRI5 160/170 Cerrado
33 EMBRAPA BRS Ipê Selection in CNPA ITA 90 170/180 Cerrado
34 EMBRAPA BRSSucupira Sicala 34/cnpa srI5 160/180 Cerrado
35 EMBRAPA BRS 96-148 Selection in CS 50 160 Cerrado
36 EMBRAPA BRS 96-227 Selection in CS 50 157 Cerrado
37 Fundação MT FMT Fetagri Selection in CNPA SRI5 146 MT
38 EPAMIG Alva Double Haploid (C-25-1-80) 120 MG
39 EPAMIG Redenção Selection in IAC 17 120-150 MG
40 EPAMIG Epamig 5 Selection in C -25 - 1 - 80 120-140 MG and central-western Brazil
41 EPAMIG Liça Double Haploid (C -24-5-78) 120-140 MG and central-western Brazil
42 EPAMIG MG/UFU 91-02 S 6046/IAC 17 120-140 MG
43 Paraguay IAN 338 CHACO 510/ISA 205//Reba P279 140-160 Paraguay
44 COODETEC CD 401 SP86/ISA205 130-140 MS, PR and SP
45 COODETEC CD 402 DP Ac 90//IAC 20/S295*IAC 20 140 a 155 BA, GO, MT, MS, MG, SP
46 COODETEC CD 403 DP Ac 90//IAC 20/S295*IAC 20 140-145 BA, GO, MT, MS, MG, SP
47 COODETEC CD 404 CHACO 520/DP Ac90 140 a 160 MS, MT e PR.
48 COODETEC CD 405 CNPA86-387/P288//PR 3060/87 145 a 155 PR and SP.
49 COODETEC CD 98-87 OC92-165/Sicala 3-3 - -
50 COODETEC CD 98-101 OC92-165/Sicala 3-3 - -
51 COODETEC CD 406 OC92-165/Sicala V1 140 a 160 BA, GO, SP, MG, MT, MS and
Northern Brazil .
52 COODETEC CD 407 DP Ac90//IAC 20/S295 140 a 160 BA, GO, MG, SP, MT, PR, MS and
Northern Brazil.
53 COODETEC CD 98-440 DP Ac 90//IAC 20/S295*IAC 20 - -
1Key: (research institutes) EMBRAPA = Campina Grande-PB; Fundação MT = Rondonópolis-MT; IAC = Campinas-SP; IAPAR = Londrina-PR;
EPAMIG = Uberaba-MG; COODETEC = Cascavel-PR; (Private companies) DELTA PINE, Uberlândia-MG, Brazil; BAYER SEEDS, Patos de
Minas-MG, Brazil; SYNGENTA, São Paulo-SP, Brazil. Cultivar 1 came from CSIRO in Australia, cultivars 19, 20 & 21 from INTA in Argentine and
cultivar 43 from Paraguay. 2Information obtained by personal communications supplemented with information obtained in the literature. 3Key to Brazil-
ian states: BA = Bahia; GO = Goiás; MG = Minas Gerais; MS = Mato Grosso do Sul; MT = Mato Grosso; PR = Paraná; SP = São Paulo; TO = Tocantins.
Note: In all columns, a dash (-) indicates that data was unavailable for this item.
MgCl2 (Table 2) and 1X reaction buffer (10 mM Tris-HCL
and 50 mM KCl, pH 8.3). The amplification was carried out
in a Perkin Elmer thermocycler (Gene Amp PCR System
9600) using a touch-down program consisting of a denatur-
ation step of 4 min at 94 °C followed by a touch-down pro-
file starting with 10 cycles of 40 s at 94 °C, a pairing step of
40 s at 65 °C decreasing by 1 °C per cycle until 55 °C, and
1 min at 72 °C. After touch-down profiling the mixture was
subjected to 30 cycles of 40 s at 94 °C, 40 s at 55 °C and
1 min at 72 °C. The program ended with one polymeriza-
tion cycle at 72 °C for 7 min.
The amplified fragments were separated electropho-
retically using a denaturing gel consisting of 7% (w/v)
polyacrylamide (19:1 acrylamide:bisacrylamide), 32%
(w/v) formamide and 5.6 M urea (Litt et al. 1993). A 10 bp
DNA ladder (Life Technologies, Cat number 10821-015)
was spotted on each gel as a fragment length standard. The
gels were stained for 30 min using ethidium bromide
(1 µg mL-1) and photographed under ultraviolet light (Eagle
Eye II). Fragment length was determined visually by com-
parison with the DNA ladder and by using the One-Dscan
program (version 1).
Data analysis
The genetic diversity of each microsatellite locus was
obtained by calculating the frequency of the microsatellite
allele based on polymorphism information content (PIC)
using the equation:
324 Bertini et al.
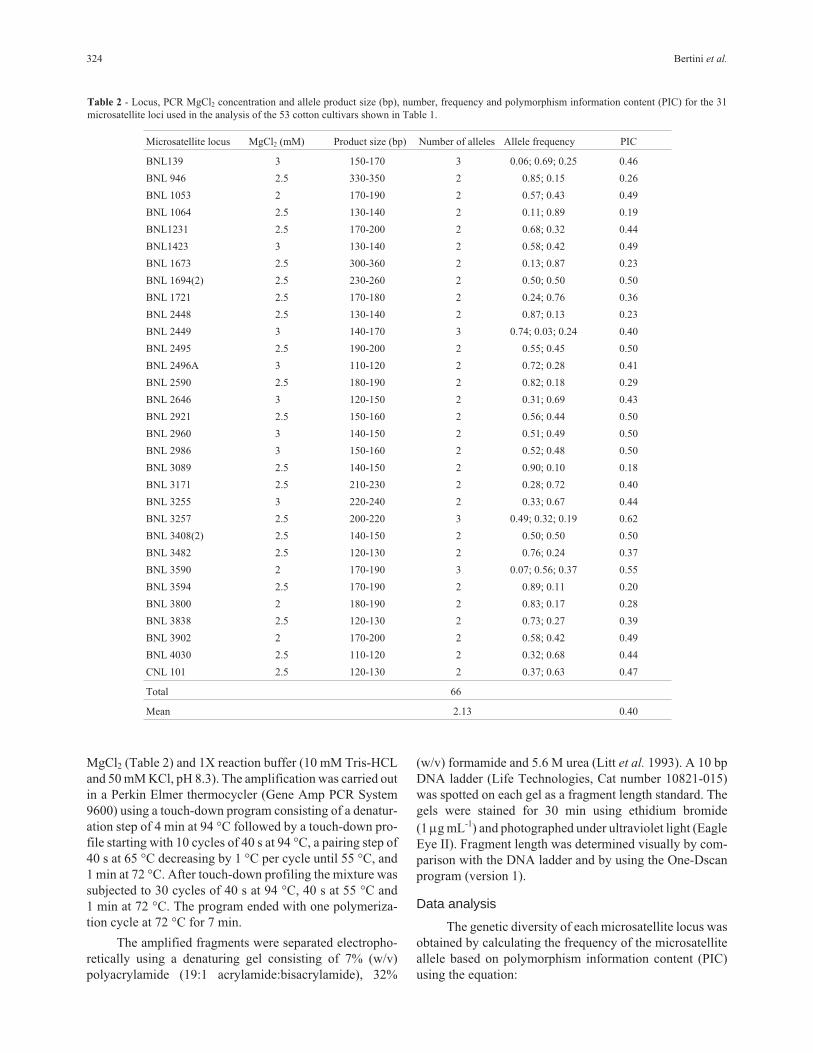
Table 2 - Locus, PCR MgCl2 concentration and allele product size (bp), number, frequency and polymorphism information content (PIC) for the 31
microsatellite loci used in the analysis of the 53 cotton cultivars shown in Table 1.
Microsatellite locus MgCl2 (mM) Product size (bp) Number of alleles Allele frequency PIC
BNL139 3 150-170 3 0.06; 0.69; 0.25 0.46
BNL 946 2.5 330-350 2 0.85; 0.15 0.26
BNL 1053 2 170-190 2 0.57; 0.43 0.49
BNL 1064 2.5 130-140 2 0.11; 0.89 0.19
BNL1231 2.5 170-200 2 0.68; 0.32 0.44
BNL1423 3 130-140 2 0.58; 0.42 0.49
BNL 1673 2.5 300-360 2 0.13; 0.87 0.23
BNL 1694(2) 2.5 230-260 2 0.50; 0.50 0.50
BNL 1721 2.5 170-180 2 0.24; 0.76 0.36
BNL 2448 2.5 130-140 2 0.87; 0.13 0.23
BNL 2449 3 140-170 3 0.74; 0.03; 0.24 0.40
BNL 2495 2.5 190-200 2 0.55; 0.45 0.50
BNL 2496A 3 110-120 2 0.72; 0.28 0.41
BNL 2590 2.5 180-190 2 0.82; 0.18 0.29
BNL 2646 3 120-150 2 0.31; 0.69 0.43
BNL 2921 2.5 150-160 2 0.56; 0.44 0.50
BNL 2960 3 140-150 2 0.51; 0.49 0.50
BNL 2986 3 150-160 2 0.52; 0.48 0.50
BNL 3089 2.5 140-150 2 0.90; 0.10 0.18
BNL 3171 2.5 210-230 2 0.28; 0.72 0.40
BNL 3255 3 220-240 2 0.33; 0.67 0.44
BNL 3257 2.5 200-220 3 0.49; 0.32; 0.19 0.62
BNL 3408(2) 2.5 140-150 2 0.50; 0.50 0.50
BNL 3482 2.5 120-130 2 0.76; 0.24 0.37
BNL 3590 2 170-190 3 0.07; 0.56; 0.37 0.55
BNL 3594 2.5 170-190 2 0.89; 0.11 0.20
BNL 3800 2 180-190 2 0.83; 0.17 0.28
BNL 3838 2.5 120-130 2 0.73; 0.27 0.39
BNL 3902 2 170-200 2 0.58; 0.42 0.49
BNL 4030 2.5 110-120 2 0.32; 0.68 0.44
CNL 101 2.5 120-130 2 0.37; 0.63 0.47
Total 66
Mean 2.13 0.40

PIC � � � ��
�1 1 2
1
j pij
j
n
where pij is the frequency of the jth allele for primer i (An-
derson et al., 1993). The identity probability (IP) represents
the probability that two cultivars are equal due to random-
ness and was calculated using the equation:
IP � �� ���
��� ( ) ( )p p pi i j
j i
n
i
n
i
n2 2 2
111
2
where pi and pj are the frequencies of alleles i and j where
i ≠ j. The combined IP was obtained by multiplying the IP
value for each locus.
Genetic distances between cultivars were calculated
using a dissimilarity matrix constructed using the similarity
index complement (SI) for co-dominant and or multiallelic
variables calculated using the Genes program (Cruz, 2001).
The SI estimated the similarity between genotypes for each
cultivar by awarding a score to each microsatellite (i.e. 0
when an allele was absent, 1 when the allele was heterozy-
gous and 2 when it was homozygous), the SI being calcu-
lated by dividing the total number of common alleles by the
total number of alleles evaluated. Cluster analysis was car-
ried out using tocher analysis, single linkage and complete
linkage dissimilarity matrices and the unweighted pair-
group method using arithmetic average (UPGMA) and the
dendrogram resulting from these calculations plotted using
the STATISTICA program (StatSoft Inc., 1999).
The efficiency of the cluster analysis was evaluated
by the cophenetic correlation coefficient, taking into ac-
count the concordance between the original dissimilarity
matrices and the dendrogram. The calculation of cophe-
netic correlation (rcof) was carried out using the equation:
r rCOV D C
V D V Ccof DC� �
� ( , )
�( ) �( )
where D represents the distances matrix and C the cophe-
netic matrix obtained from the dendrogram. The correlation
significance level was evaluated using the Mantel Z statis-
tic (Mantel, 1967) and the significance of Z determined us-
ing the Genes program by comparing the observed Z values
with a critical Z value obtained by calculating Z for one ma-
trix with 5000 permuted variants of the second matrix.
Results and Discussion
Microsatellite allelic diversity
For the 53 cotton cultivars evaluated we found that 31
primer pairs amplified 33 loci, with the BNL 1964 and
BNL 3408 primers amplifying two loci, one of which was
polymorphic. In their cotton microsatellite marker mapping
study, Liu et al. (2000a) also found that some primers (in-
cluding BNL 3408) amplified two loci.
The primers amplified a total of 66 alleles to give an
average of 2.13 alleles per microsatellite locus (Table 2),
similar to that found in cotton by Gutiérrez et al. (2002)
who used 60 pairs of polymorphic primers to which am-
plify 69 loci resulting in a total of 139 alleles and an average
of 2 alleles per locus. However, Liu et al. (2000b) used 56
polymorphic primer pairs to amplify 62 cotton loci and pro-
duce a total of 325 alleles with average of 5 alleles per lo-
cus.
The PIC value calculated to estimate the informative-
ness of each primer varied from 0.18 to 0.62 with an aver-
age of 0.40 (Table 2), within the range of the PIC values
calculated by Liu et al. (2000b) who found that cotton PIC
values varied from 0.05 to 0.82 with an average value of
0.31. The fact that our PIC values were somewhat lower
than those found by Liu et al. (2000b) might be due to the
fact that the cultivates used in our study came from breed-
ing programs and might therefore have a narrow genetic
base. In contrast, Liu et al. (2000b) used 97 wild G.
hirsutum accessions, which might explain the higher poly-
morphism (5 alleles per locus) found by these authors.
However, it should also be pointed out the PIC average
value found by Liu et al. (2000b) was 0.31, which means
that when the PIC general mean was taken into account for
all loci they actually found low polymorphism. Gutiérrez et
al. (2002) found an average of 2 alleles per microsatellite
locus, but a large number of the cotton cultivars used came
from breeding programs in the United States and Australia
which are known to have a narrow genetic base (Multani
and Lyon, 1995; Iqbal et al., 1997; Ulloa et al., 1999;
Gutiérrez et al., 2002).
The most informative primers were BNL primers
3257, 3590, 3408, 2495 and 1694. According to maps pre-
sented by Liu et al. (2000a) and Lacape et al. (2003), 13
primer sites are located in sub-genome A, two on chromo-
some 5, two on chromosome 6 and two on chromosome 9,
the other sites being distributed on chromosomes 2, 3, 7, 8
(A02), 10, 11 (A08) and 12. The sites for the remaining 11
primers are located in sub-genome D, two on chromosome
15, two on chromosome 20, two on chromosome 26 and the
others are distributed on chromosomes 16, 17, 18, 21 (D02)
and 22. The other seven primers were not mapped. This
data shows that the great majority of primers used in our
study were found to be well-distributed over the cotton ge-
nome.
A microsatellites profile was constructed for each
cultivar using 31 primer pairs which were able to discrimi-
nate between 52 of the 53 cultivars studied (98%), the two
cultivars that could not be separated being Sicala 3-2 and
CNPA ITA 90. The probability that these two cultivars
were equal due to randomness was calculated based on the
frequency product of the alleles detected in these cultivars
and was found to be very small (4.07 x 10⁻¹³ for each
microsatellite locus). However, the genealogy of the plants
clarifies the situation in that the Sicala 3-2 cultivar origi-
Genetic diversity of cotton cultivars 325

nated from a cross between the Acala and Tamcot SP-37
varieties and the DP 61 and CSIRO varieties while the
CNPA ITA 90 cultivar was a selection of the Deltapine
Acala (DPAc90) cultivar which was produced from a cross
involving DP 16 and John Cotton Polycross cultivars. Both
the DP 61 and CSIRO varieties are selections from the DP
16 cultivar while the John Cotton Polycross cultivars origi-
nated from a complex cross involving the Acala and
Tamcot SP-37 varieties.
Based on the PIC values of the most informative loci
it is possible to greatly reduce the number of loci employed
in cultivar discrimination. Employing only the primers
BNL 3257, 3590, 2495, 2921, 1694, 3408, 2960, 1053,
1423, 139 and 3255 instead of 31 primers it is possible to
differentiate 52 cultivars. The 11 BNL cited above can be
used to generate genetic profile definitions (genetic finger-
prints) for each cultivar which should be of help in cultivar
protection research, genetic purity analysis and other stud-
ies designed to be of assistance to breeding programs, such
as monitoring crossing, pollen contamination rates, accu-
racy during controlled crossing, etc.
Genetic distance and diversity
The coefficient of dissimilarity used to calculate the
genetic distance between the 53 cultivars evaluated using
microsatellite loci varied from 0.00 to 0.71 with average of
0.40 ± 0.01. The distribution analysis of 1.378 pairs of the
compared cultivars (Figure 1) displayed a concentration of
values in the classes from 0.3-0.4 to 0.4-0.5, with a value of
zero indicating similarity and values between 0.7 and 0.8
divergence. The highest genetic distance (0.71) occurred
between cultivars IAC 20 and BRS Itaúba and the lowest
distance (0.00) between Sicala 3-2 and CNPA ITA 90.
Figure 1 shows a high similarity between the cultivars
as did cluster analysis. The cophenetic correlations be-
tween dissimilarity data and the phenetic matrixes for the
53 cultivars were 65% for the UPGMA method, 63% for
the single linkage method and 43% for the complete link-
age method, these values being significant (p = 0.01) based
on 5000 simulations. The complete linkage method showed
the closest agreement with the results obtained by the
UPGMA method and UPGMA clustering, complete link-
age and Tocher analysis (not shown) were highly corre-
lated. The UPGMA method (Figure 2) was the most
efficient at representing the dissimilarity between the eval-
uated genotypes, this method being known to be the hierar-
chical method producing dendrograms with maximum
cophenetic correlation (Cruz and Carneiro, 2003).
Multani and Lyon (1995), using RAPD markers, also
been found low genetic distance values (0.01 to 0.08) be-
tween nine Australian cotton cultivars and Iqbal et al.
(1997) found low genetic distances (0.18 to 0.07) between
17 G. hirsutum cultivars, also using RAPD markers. Ulloa
et al. (1999) used microsatellite markers to investigate ge-
netic distance in cotton and found that the distance between
the Acala and Delta cultivars was 0.18 while that among the
Pima PS series of cultivars was 0.16 and work by Gutiérrez
et al. (2000) using microsatellite markers has detected nar-
row genetic distance between Australian and American
Cultivars. Van Esbroeck et al. (1998) have pointed out that
the monoculture of some successful cultivars and their ex-
tensive use as progenitors in breeding programs has limited
the genetic diversity of cultivated cotton cultivars.
The threshold value for grouping samples in a den-
drogram is generally empirical, but the best threshold for
grouping is generally considered to be the point where there
is a large distance between groups or where there is a clear
nesting of taxonomic units. In our study, the dendrogram of
the relationship between the 53 cultivars showed two large
groups (group A at a genetic distance threshold of 50% and
group B at a threshold of 35%) and seven well-nested sub-
groups (Figure 2).
The majority of group A cultivars were obtained by
selection and are planted in the semi-arid Brazilian cerrado
and have a long cropping-cycle of 140 to 180 days and
about 40% final fiber percentage. The group B cultivars
were produced by crossing and are recommended for plant-
ing in almost all regions of Brazil but are mainly planted in
central-western and southeastern regions, the majority of
group B cultivars being virus resistant and have a short
cropping-cycle of about 110 to 140 days and about 38 final
fiber percentage.
The seven subgroups exhibited independence be-
tween genetic clustering and cultivar characteristics such as
origin, planting region and cropping-cycle. It was interest-
ing to note that in each of the seven groups there were
cultivars from several origins (Research institutes, private
breeding companies), indicating that the organizations pro-
ducing cultivars employ similar germplasm which is shared
between them. The formation of subgroups (Figure 2) is
consistent with the genealogical information obtained for
some of the cultivars. Subgroup 1, for example, contains
326 Bertini et al.
Figure 1 - Distribution of genetic distance calculated for 1.378 cultivar
pairs.

some cultivars which have CS-50, Sicala 34 and CNPA
SRI5 as parents but both CS 50 and Sicala 34 cultivars have
Deltapine Acala 90 and Siokra 1-1 as parents, with Siokra
1-1 in its turn having the same parents as Sicala 3-2 (Table
1). Subgroup 3 contains some cultivars which have Delta-
pine Acala 90 and IAC 20 as parents (Table 1), the fact that
cultivar IAPAR 71 is a selection from IAC 20 may explain
the presence of cultivar IPR 96 within this subgroup. Sub-
group 4 contains cultivars CNPA P2 and CNPA P3 which
both have the same genealogy, thus explaining the presence
of these cultivars within the same group. Subgroup 5 is
made up of cultivars with parents including IAC RM3,
Tamcot SP-37 and IAC 17 (Table 1). Subgroup 6 contains
the cultivars CD 401, Cacique, Guazuncho, Oro Blanco and
IAN 338 which have parents whose genealogy shows culti-
vars such as Chaco 510, Guazuncho, Reba P279 and SP
8535 (Table 1). It is interesting to note that cultivar CNPA
SRI5 was obtained from a population with a large base,
with several cultivars being involved in its genealogy,
which may explain the presence of cultivars obtained from
CNPA SRI5 in various subgroups.
Although some subgroups were formed which were
consistent with the genealogy of the cultivars some incon-
sistencies were also evident. For example, cultivars IPR 95
and IPR 96 have the same parents but they were clustered in
different subgroups even though they shared 72% similar-
ity and this also occurred with other cultivars, (e.g. BRS
Facual and BRS Sucupira) which were 58% similar. The
fact that cultivar CNPA SRI5 was produced as a rest of a
complex cross may explain the divergence between these
cultivars. Cultivars such as Epamig 5 and Alva have the
same origin, presented 92% similarity and were clustered in
the same group. The presence of cultivars BRS 96 and Fiber
Max 986 in the same group is also inconsistent with the ge-
nealogy of these cultivars.
The lack of information about some genealogies may
be a factor that led to the inconsistencies mentioned above.
According to Carvalho et al. (2003) the lack of genealogy
makes it difficult to estimate diversity using genealogical
studies and Van Esbroeck et al. (1999) found no relation-
ship between cotton genealogy and similarity measure-
ments based on morphological and agronomic features.
Tatineni et al. (1996) detected a 0.63 correlation between
the genetic similarity of cotton lines calculated using
RAPD markers and morphological features. In general,
however, there is little information with respect to the cor-
relation between cotton genetic distances based on molecu-
lar markers and genealogical studies.
In our study we observed that a large number of the
cultivars studied descended from a few original cultivars
(e.g. Auburn 56, Tamcot SP-37, DP Smoothleaf and DP 45)
thus narrowing their genetic base and possibly making
them vulnerable to the present and future diseases. In a sim-
ilar way to Brazilian cultivars, cultivated upland G.
hirsutum presents limited genetic diversity (Wendel et al.
1992; Wendel and Brubaker 1993; Tatineni et al. 1996;
Iqbal et al. 1997). According to Iqbal et al. (2001), one hy-
pothesis which may explain the apparent lack of diversity
Genetic diversity of cotton cultivars 327
Figure 2 - UPGMA dendrogram constructed based on dissimilarities measures of 53 cotton cultivars. Groups A and B were obtained considering an up-
per dissimilarity limit of 50% while the G1, G2, G3, G4, G5, G6 and G7 subgroups shown below the figure were obtained considering an upper-limit of
35%.

in cultivated upland G. hirsutum is that one or more genetic
bottlenecks may have occurred during the later stages of the
development of G. hirsutum latifolium, possibly as a result
of rigorous selection for early maturity. Much of the origi-
nal genetic diversity of G. hirsutum, including valuable al-
leles that confer resistance to insects, pathogens and
environmental adversities, would have been lost during this
phase of its domestication. Iqbal et al. (2001) also pointed
out that the G. hirsutum cultivated around the world is de-
rived from upland cottons from the USA which were ex-
ported to other countries in the 19th and early twentieth
century, with most upland cotton used in early Brazilian
cotton breeding coming from this source. They also ob-
served that Pakistan cotton breeding coming from this
source.
It is interesting to note that in our study we found that
the majority of cultivars obtained from the different breed-
ing programs resulted from selection programs involving
previously successful cultivars or, less often, crosses be-
tween cultivars or between cultivars and lines. Van
Esbroeck and Bowman (1998) have suggested some expla-
nations to justify crosses between closely related individu-
als in cultivar breeding programs. These authors have
argued that there is enough allelic variation, mutation or re-
combination in crosses between closely related individuals
to allow improvement in agronomic performance and/or
that the coefficient of parentage may not reflect the real ge-
netic distance. The great number of successful cultivars ob-
tained through reselection show that a small quantity of
recombination results in sufficient genetic variance to pro-
duce genetic progress within breeding programs. Even so,
great efforts are currently being made to reduce the genetic
vulnerability of cultivars by introducing more diversified
germplasm into cotton cultivars while avoiding negative
effects on those cultivars already adapted to particular
countries or regions, and will bring many rewards to the
culture breeding.
Acknowledgments
The authors are most grateful to the Cooperativa Cen-
tral de Pesquisa Agrícola (COODETEC), EMPRAPA,
EPAMIG, IAC and IAPAR for their support in supplying
the cotton seeds analyzed in the current study. This research
received financial support from the Brazilian agency Con-
selho Nacional de Pesquisa e Desenvolvimento (CNPq)
References
Abdalla AM, Reddy OUK, El-Zik KM and Pepper AE (2001) Ge-
netic diversity and relationships of diploid and tetraploid
cottons revealed using AFLP. Theoretical and Applied Ge-
netic 102:222-229.
Anderson JA, Churchill GA, Autrique JE, Tanksley SD and Sor-
rells ME (1993) Optimizing parental selection for genetic
linkage maps. Genome 36:181-186.
Brubaker CL and Wendel JF (1994) Reevaluating the origin of do-
mesticated cotton (Gossypium hirsutum, Malvaceae) using
nuclear restriction fragment length polymorphism (RFLPs).
American Journal of Botany 81:1309-1326.
Carvalho LP, Lanza MA, Fallieri J and Santos JW (2003) Análise
da diversidade genética entre acessos de banco ativo de
germoplasma de algodão. Pesquisa Agropecuária Brasileira
38:1149-1155.
Cruz CD (2001) Programa Genes, Versão Windows: Aplicativo
Computacional em Genética e Estatística. UFV, Viçosa, 648
pp.
Cruz CD and Carneiro PCS (2003) Modelos biométricos apli-
cados ao melhoramento genético. v. 2. UFV, Viçosa, 585 pp.
Gutiérrez OA, Basu S, Saha S, Jenkins JN, Shoemaker DB,
Cheatham CLA and McCarty Jr JC (2002) Genetic distances
among selected cotton genotypes and its relationship with F2
performance. Crop Science 42:1841-1847.
Iqbal MJ, Aziz N, Saeed NA and Zafar Y (1997) Genetic diversity
evaluation of some elite cotton varieties by RAPD analysis.
Theoretical and Applied Genetic 94:139-144.
Iqbal MJ, Reddy OUK, El-Zik KM and Pepper AE (2001) A ge-
netic bottleneck in the `evolution under domestication’ of
upland cotton Gossypium hirsutum L. examined using DNA
fingerprinting. Theoretical and Applied Genetics 103:547-
554.
Lacape JM, Nguyen TB, Thibivilliers S, Courtois B, Bojinov BM,
Cantrell RG, Burr B and Hau B (2003) A combined RFLP-
SSR-AFLP map of tetraploide cotton based on a Gossypium
hirsutum x Gossypium barbadense backcross population.
Genome 46:612-626.
Litt M, Hauge X and Sharma V (1993) Shadows bands seen when
typing polymorphic dinucleotide repeats: Some causes and
cures. Biotechniques 15:280-284.
Liu S, Saha S, Stelly D, Burr B and Cantrell RG (2000a) Chromo-
somal assignment of microsatellite loci in cotton. Journal of
Heredity 91:326-332.
Liu S, Cantrell RG, McCarty-Jr JC, Stewart J McD (2000b) Sim-
ple sequence repeat based assessment of genetic diversity in
cotton race stock Accessions. Crop Science 40:1459-1469.
Lu HJ and Myers GO (2002) Genetic relationships and discrimi-
nation of ten influential upland cotton varieties using RAPD
markers. Theoretical and Applied Genetic 105:325-331.
Mantel NA (1967) The detection of disease clustering and a gen-
eralized regression approach. Cancer Research 27:209-220.
McDonald MB, Elliot LJ and Sweeney PM (1994) DNA extrac-
tion from dry seeds for RAPD analyses in varietal identifica-
tion studies. Seed Science & Technology 22:171-176.
Multani DS and Lyon BR (1995) Genetic fingerprinting of Aus-
tralian cotton cultivars with RAPD markers. Genome
38:1005-1008.
Nguyen TB, Giband M, Brottier P, Risterucci AM and Lacape JM
(2004) Wide coverage of the tetraploide cotton genome us-
ing newly developed microsatellite markers. Theoretical
and Applied Genetic 109:167-175.
One-Dimensional Gel Analyze. ONE-Dscan, ver. 1.0, Copyright
1994/1995, Scanaliytic, a dimensional CST Inc.
Pillay M and Myers GO (1999) Genetic diversity assessed by vari-
ation in ribosomal RNA genes and AFLP markers. Crop Sci-
ence 39:1881-1886.
328 Bertini et al.

Powell W, Machray GC and Provan J (1996) Polymorphism re-
vealed by simple sequence repeats. Trends in Plant Sciences
1:215-222.
Reddy OU, Pepper AE, Abdurakhmonov I, Saha S, Jenkins JN,
Brooks T, Bolek Y and El-zik KM (2001) New dinucleotide
and trinucleotide microsatellite marker resources for cotton
genome research. Crop Science 5:103-113.
Sambrook J, Fritsch EF and Maniatis T (1989) Molecular Clon-
ing: Laboratory Manual, 2nd edition, v. 3. CSHL, Cold
Spring Harbor, NY, appendix C-1.
Schuster I, Queiroz VT, Teixeira AI, Barros EG and Moreira MA
(2004) Determinação da pureza varietal de sementes de soja
com o auxílio de marcadores microssatélites. Pesquisa
Agropecuária Brasileira 39:247-253.
StaSoft Inc (1999) STATISTICA for Windows [Computer pro-
gram manual]. Tulsa. http://www.statsoft.com.
Tatineni V, Cantrell RG and Davis DD (1996) Genetic diversity in
elite cotton germplasm determined by morphological char-
acteristics and RAPDs. Crop Science 36:186-192.
Ulloa M, Meredith-Jr WR, Percy R and Moser H (1999) Genetic
variability within improved germplasm of Gossypium
hirsutum and G. barbadense cottons. Agronomy abstracts,
ASA, Madison, pp 73.
Van Esbroeck GA and Bowman DT (1998) Cotton germplasm di-
versity and its importance to cultivar development. Journal
of Cotton Science 2:121-129.
Van Esbroeck GA, Bowman DT, Calhoun DS and May OL (1998)
Changes in the genetic diversity of cotton in the USA from
1970 to 1995. Crop Science 38:33-37.
Van Esbroeck GA, Bowman DT, May OL and Calhoun DS (1999)
Genetic similarity indices for ancestral cotton cultivars and
their impact on genetic diversity estimates of modern
cultivars. Crop Science 39:323-328.
Wendel JF and Brubaker CL (1993) RFLP diversity in Gossypium
hirsutum L. and new insights into the domestication of cot-
ton. American Journal of Botany 80:71.
Wendel JF, Brubaker CL and Percival AE (1992) Genetic diver-
sity in Gossypium hirsutum and the origin of upland cotton.
American Journal of Botany 79:1291-1310.
Associate Editor: Márcio de Castro Souza Filho
Genetic diversity of cotton cultivars 329