Characterisation of recombinant CHO cell lines by investigation of protein productivities and...
10
Journal of Biotechnology 128 (2007) 716–725 Characterisation of recombinant CHO cell lines by investigation of protein productivities and genetic parameters Christine Lattenmayer a,∗ , Evelyn Trummer a , Kornelia Schriebl a , Karola Vorauer-Uhl b , Dethardt Mueller b , Hermann Katinger b,c , Renate Kunert b a Austrian Center of Biopharmaceutical Technology, Muthgasse 18, 1190 Vienna, Austria b Department of Biotechnology, Institute of Applied Microbiology, Muthgasse 18, 1190 Vienna, Austria c Polymun Scientific, Immunbiologische Forschung, Nussdorfer Laende 11, 1190 Vienna, Austria Received 29 October 2006; received in revised form 25 November 2006; accepted 15 December 2006 Abstract We have generated a recombinant CHO cell line expressing the fusion protein EpoFc. After selection and screening, protein expression, gene and mRNA copy numbers were analysed in order to gain more information on the influence of genetic parameters on the productivity and stability of production cells. Results from semi-quantitative blot methods were compared to quantitative PCR (qPCR) analyses, whose advantage mainly lies in their higher sensitivity, and the cheaper and faster methodology. We developed stable and high producing clones with low gene copy numbers, in contrast to other cell lines where multiple steps of methotrexate amplification have lead to hundreds of copies of inserts with the risk of karyotypic instabilities and decreased growth rates that overcome the benefits of increased productivities. When comparing genetic parameters to productivity, a good correlation of mRNA levels with specific productivity was observed, whereas high gene copy numbers were not always accompanied by high protein expressions. Based on our data derived from a typical example of a cell line development process, genetic parameters are useful tools for the selection of scalable production clones. Nevertheless, a wider range of cell lines has to be investigated in order to implement genetic analyses into a screening process. © 2007 Elsevier B.V. All rights reserved. Keywords: CHO cells; Quantitative PCR; Taqman; Genetic characterisation; Genetic parameters; Gene copy number Abbreviations: CHO, Chinese Hamster Ovary; dhfr, dihydrofolate reductase; EpoFc, erythropoietin-huIgG1Fc fusion protein; GCN, gene copy number; MCB, master cell bank; MTX, methotrexate; OPD, orthophenylenediamine; q p , specific productivity; qPCR, quantitative PCR; RT, reverse transcription ∗ Corresponding author. Tel.: +43 676 88088 678. E-mail address: [email protected] (C. Lattenmayer). 0168-1656/$ – see front matter © 2007 Elsevier B.V. All rights reserved. doi:10.1016/j.jbiotec.2006.12.016
Transcript of Characterisation of recombinant CHO cell lines by investigation of protein productivities and...
Journal of Biotechnology 128 (2007) 716–725
Characterisation of recombinant CHO cell lines by investigationof protein productivities and genetic parameters
Christine Lattenmayer a,∗, Evelyn Trummer a, Kornelia Schriebl a,Karola Vorauer-Uhl b, Dethardt Mueller b,Hermann Katinger b,c, Renate Kunert b
a Austrian Center of Biopharmaceutical Technology, Muthgasse 18, 1190 Vienna, Austriab Department of Biotechnology, Institute of Applied Microbiology, Muthgasse 18, 1190 Vienna, Austria
c Polymun Scientific, Immunbiologische Forschung, Nussdorfer Laende 11, 1190 Vienna, Austria
Received 29 October 2006; received in revised form 25 November 2006; accepted 15 December 2006
Abstract
We have generated a recombinant CHO cell line expressing the fusion protein EpoFc. After selection and screening, proteinexpression, gene and mRNA copy numbers were analysed in order to gain more information on the influence of genetic parameterson the productivity and stability of production cells. Results from semi-quantitative blot methods were compared to quantitativePCR (qPCR) analyses, whose advantage mainly lies in their higher sensitivity, and the cheaper and faster methodology.
We developed stable and high producing clones with low gene copy numbers, in contrast to other cell lines where multiple stepsof methotrexate amplification have lead to hundreds of copies of inserts with the risk of karyotypic instabilities and decreasedgrowth rates that overcome the benefits of increased productivities.
When comparing genetic parameters to productivity, a good correlation of mRNA levels with specific productivity wasobserved, whereas high gene copy numbers were not always accompanied by high protein expressions. Based on our dataderived from a typical example of a cell line development process, genetic parameters are useful tools for the selection ofscalable production clones. Nevertheless, a wider range of cell lines has to be investigated in order to implement genetic analyses
into a screening process.© 2007 Elsevier B.V. All rights reserved.Keywords: CHO cells; Quantitative PCR; Taqman; Genetic characterisation; Genetic parameters; Gene copy number
Abbreviations: CHO, Chinese Hamster Ovary; dhfr, dihydrofolate reductase; EpoFc, erythropoietin-huIgG1Fc fusion protein; GCN, genecopy number; MCB, master cell bank; MTX, methotrexate; OPD, orthophenylenediamine; qp, specific productivity; qPCR, quantitative PCR;RT, reverse transcription
∗ Corresponding author. Tel.: +43 676 88088 678.E-mail address: [email protected] (C. Lattenmayer).
0168-1656/$ – see front matter © 2007 Elsevier B.V. All rights reserved.doi:10.1016/j.jbiotec.2006.12.016
of Biote
1
eoctsKwoamnroreBhocBia1dnc1
okuPsitb(asmp
rpB
tacs
2
2
pdCCpctuptwKnant cells was performed in the presence of 0.05,and afterwards 0.1 �M MTX. After 18 passages inT25-flasks (Nunclon) 5 primary transfectants (2C10,2G4, 2G6, 8C6 and 10D9) were adapted to protein-
C. Lattenmayer et al. / Journal
. Introduction
Gene amplification techniques are frequentlymployed for the production of glycoproteins and mon-clonal antibodies in recombinant cell technology. Inase of the Chinese Hamster Ovary (CHO) cell lines,he dihydrofolate reductase (dhfr) gene amplificationystem is the most widely used (Alt et al., 1978;aufman, 1993), resulting in high productivities asell as high gene copy numbers (GCNs) in the rangef some hundred inserts (Kaufman et al., 1985; Kim etl., 1998b, Yoshikawa et al., 2000) after several steps ofethotrexate (MTX) amplification. On the other hand,
egative effects (like chromosome rearrangements andecombination in response to amplification procedures)f high gene copy numbers on karyotypic stability areeported especially after long time cultivation (Hammilt al., 2000; Michel et al., 1985; Pallavicini et al., 1990;acsi et al., 1986; Flintoff et al., 1984). Furthermore, aigh gene copy number might have a detrimental effectn the cell growth, which may outweigh any benefi-ial effect of an enhanced specific productivity (qp).esides, analysis of mRNA copy number showed a pos-
tive correlation with specific productivity (Kaufman etl., 1985; Gu et al., 1992; Pendse et al., 1992; Kim et al.,998a). Nevertheless, during long-term cultivation ofifferent subclones of antibody expressing CHO cellso correlation between qp and GCN and only a weakorrelation of qp and mRNA was observed (Kim et al.,998b).
Beside the investigation of genetic parameters inrder to gain additional criteria for clone selection,nowledge of these data is also required from reg-latory authorities: FDA, EMEA and the Europeanharmacopoeia suggest analysis of the expression con-truct for copy number, insertions, deletions and thentegration status as well as the number of integra-ion sites in order to evaluate the stability of the cellanks. For characterisation of the master cell bankMCB) and the end-of-production cells Northern blotnd Southern blot are commonly used, although onlyemi-quantitative information is gained. The rather newethod of quantitative PCR (qPCR) has not yet become
art of routine analyses.
In our studies we analysed different subclones of aecombinant EpoFc (erythropoietin-huIgG1Fc fusionrotein) producing cell line by qPCR and blot methods.eside the evaluation of these methods we investigated
Fti
chnology 128 (2007) 716–725 717
he influence of genetic parameters on the productivitynd stability of our subclones. Afterwards we will dis-uss the use of genetic parameters as criteria for cloneelection.
. Materials and methods
.1. Recombinant production clones
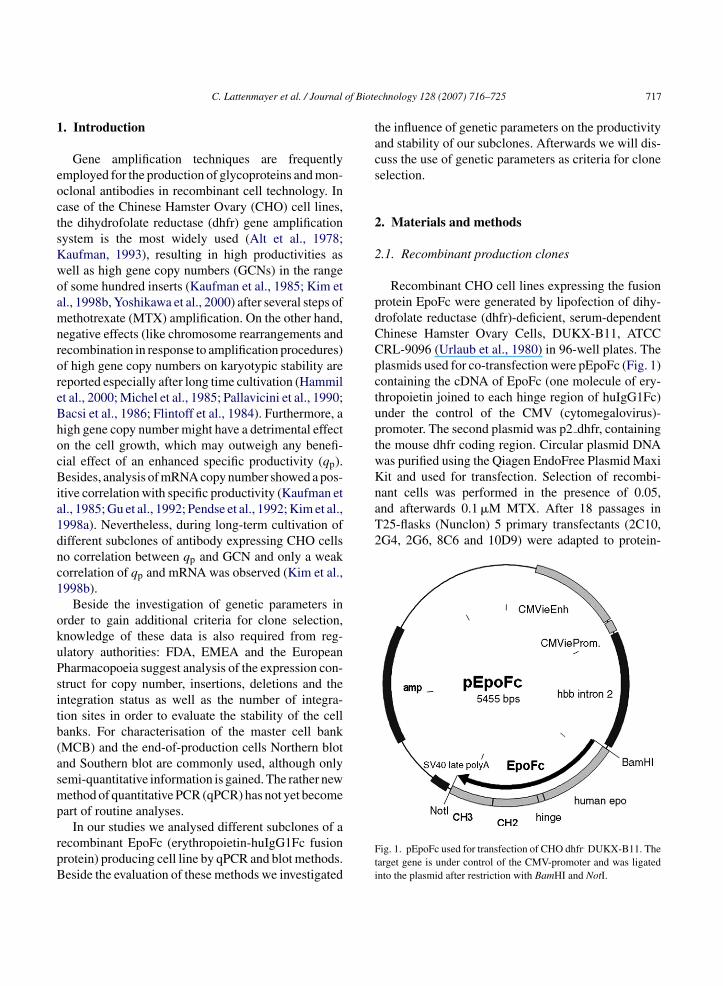
Recombinant CHO cell lines expressing the fusionrotein EpoFc were generated by lipofection of dihy-rofolate reductase (dhfr)-deficient, serum-dependenthinese Hamster Ovary Cells, DUKX-B11, ATCCRL-9096 (Urlaub et al., 1980) in 96-well plates. Thelasmids used for co-transfection were pEpoFc (Fig. 1)ontaining the cDNA of EpoFc (one molecule of ery-hropoietin joined to each hinge region of huIgG1Fc)nder the control of the CMV (cytomegalovirus)-romoter. The second plasmid was p2 dhfr, containinghe mouse dhfr coding region. Circular plasmid DNAas purified using the Qiagen EndoFree Plasmid Maxiit and used for transfection. Selection of recombi-
ig. 1. pEpoFc used for transfection of CHO dhfr. DUKX-B11. Thearget gene is under control of the CMV-promoter and was ligatednto the plasmid after restriction with BamHI and NotI.
718 C. Lattenmayer et al. / Journal of Biote
Ft
fc0a01cf2a0afiaasccs0Pi5f(bg
2
cCc
if(ar(as
2
aDudG
2
TttRiDRtRMd(Qtsc
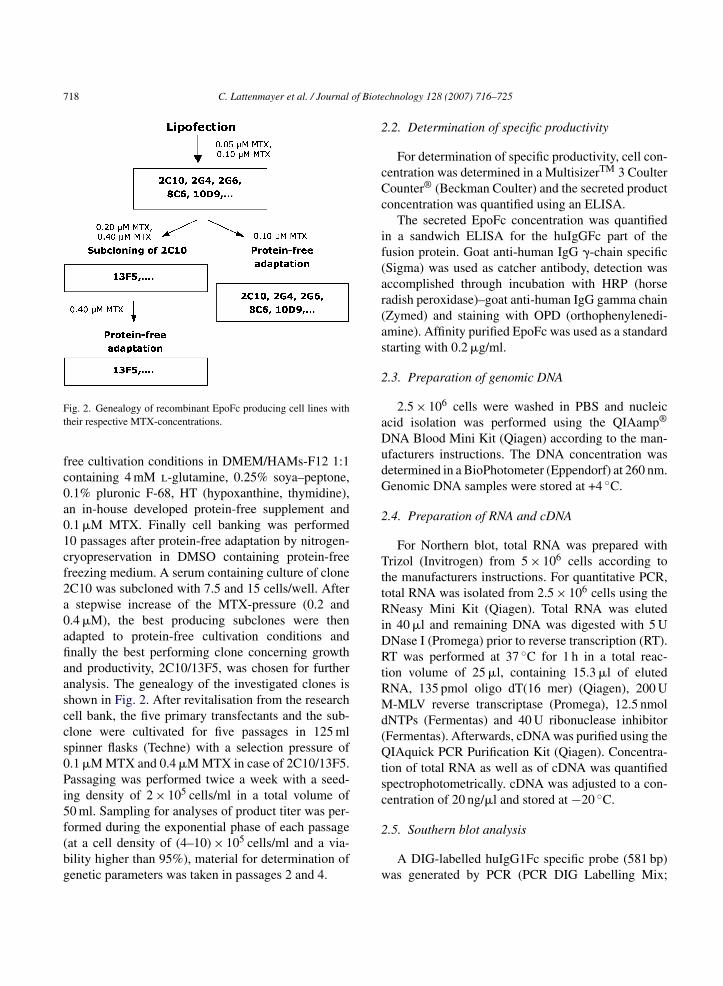
ig. 2. Genealogy of recombinant EpoFc producing cell lines withheir respective MTX-concentrations.
ree cultivation conditions in DMEM/HAMs-F12 1:1ontaining 4 mM l-glutamine, 0.25% soya–peptone,.1% pluronic F-68, HT (hypoxanthine, thymidine),n in-house developed protein-free supplement and.1 �M MTX. Finally cell banking was performed0 passages after protein-free adaptation by nitrogen-ryopreservation in DMSO containing protein-freereezing medium. A serum containing culture of cloneC10 was subcloned with 7.5 and 15 cells/well. Afterstepwise increase of the MTX-pressure (0.2 and
.4 �M), the best producing subclones were thendapted to protein-free cultivation conditions andnally the best performing clone concerning growthnd productivity, 2C10/13F5, was chosen for furthernalysis. The genealogy of the investigated clones ishown in Fig. 2. After revitalisation from the researchell bank, the five primary transfectants and the sub-lone were cultivated for five passages in 125 mlpinner flasks (Techne) with a selection pressure of.1 �M MTX and 0.4 �M MTX in case of 2C10/13F5.assaging was performed twice a week with a seed-
ng density of 2 × 10⁵ cells/ml in a total volume of0 ml. Sampling for analyses of product titer was per-
ormed during the exponential phase of each passageat a cell density of (4–10) × 105 cells/ml and a via-ility higher than 95%), material for determination ofenetic parameters was taken in passages 2 and 4.2
w
chnology 128 (2007) 716–725
.2. Determination of specific productivity
For determination of specific productivity, cell con-entration was determined in a MultisizerTM 3 Coulterounter® (Beckman Coulter) and the secreted productoncentration was quantified using an ELISA.
The secreted EpoFc concentration was quantifiedn a sandwich ELISA for the huIgGFc part of theusion protein. Goat anti-human IgG �-chain specificSigma) was used as catcher antibody, detection wasccomplished through incubation with HRP (horseadish peroxidase)–goat anti-human IgG gamma chainZymed) and staining with OPD (orthophenylenedi-mine). Affinity purified EpoFc was used as a standardtarting with 0.2 �g/ml.
.3. Preparation of genomic DNA
2.5 × 10⁶ cells were washed in PBS and nucleiccid isolation was performed using the QIAamp®
NA Blood Mini Kit (Qiagen) according to the man-facturers instructions. The DNA concentration wasetermined in a BioPhotometer (Eppendorf) at 260 nm.enomic DNA samples were stored at +4 ◦C.
.4. Preparation of RNA and cDNA
For Northern blot, total RNA was prepared withrizol (Invitrogen) from 5 × 10⁶ cells according to
he manufacturers instructions. For quantitative PCR,otal RNA was isolated from 2.5 × 10⁶ cells using theNeasy Mini Kit (Qiagen). Total RNA was eluted
n 40 �l and remaining DNA was digested with 5 UNase I (Promega) prior to reverse transcription (RT).T was performed at 37 ◦C for 1 h in a total reac-
ion volume of 25 �l, containing 15.3 �l of elutedNA, 135 pmol oligo dT(16 mer) (Qiagen), 200 U-MLV reverse transcriptase (Promega), 12.5 nmol
NTPs (Fermentas) and 40 U ribonuclease inhibitorFermentas). Afterwards, cDNA was purified using theIAquick PCR Purification Kit (Qiagen). Concentra-
ion of total RNA as well as of cDNA was quantifiedpectrophotometrically. cDNA was adjusted to a con-entration of 20 ng/�l and stored at −20 ◦C.
.5. Southern blot analysis
A DIG-labelled huIgG1Fc specific probe (581 bp)as generated by PCR (PCR DIG Labelling Mix;
of Biote
R(cowsacMt50paddFaFbu1bM1m
2
y(aMpTmwa
2
Rscit
ow
rofl6ta1ouo
2
dwaehutrt
2
aift
2
tiiqfRttq
C. Lattenmayer et al. / Journal
oche) and purified by QIAquick PCR Purification KitQiagen). Genomic DNA was digested with BamHIutting at the 5′ site of the EpoFc coding region. 1.5 �gf BamHI-digested genomic DNA of each clone asell as 1, 0.1 and 0.01 ng of BamHI-digested pEpoFc
tandard (1 ng = 1.7 × 10⁸ copies) were separated on1% agarose gel and transferred to the positively
harged nylon membrane according to the Rocheanual (DIG Application Manual for Filter Hybridiza-
ion). After 1 h in prehybridisation buffer (7% SDS,0% formamide, 5× SSC, 2% blocking reagent and.1% N-lauroylsarcosine in 50 mM sodium-phosphateH 7.0), the membrane was incubated in hybridis-tion buffer additionally containing 10 ng/ml of theenatured probe for 12–18 h at 42 ◦C. Washing andetection was performed using anti-digoxigenin-APab fragments (Roche) and CPD-Star® (Tropix). Visu-lisation was done on the LumiImagerTM (Roche).inally, the GCN was determined by the standard curveased on the Boehringer luminescence units (BLU)sing the LumiAnalyst 3.0 Software (Filtered Profile,0%). The calculation of the target gene per cell wasased on the size of the hamster genome (3 × 10⁹ bp;arshall, 2001) that results in 3.3 pg DNA/cell. Thus,
.5 �g genomic DNA used in Southern blot experi-ents represent 4.5 × 10⁵ copies of the genome.
.6. Northern blot analysis
One microliter of the total RNA preparation (anal-sed in duplicates) and 1 �l of each plasmid standard1.7 × 108 and 3.3 × 10⁷ copies) were separated on
formamide/formaldehyde agarose gel according toaniatis et al. (1982). For hybridisation the same
robes and methods were used as in Southern blot.he mRNA copy number was determined by the plas-id standard curve as described for Southern blot andas then related to the number of cells from which the
nalysed amount of RNA was derived.
.7. Quantitative PCR
Taqman quantitative PCR was performed in theotor-Gene 2000 (Corbett Research). The plasmid
tandard pEpoFc (stock solutions of 1 × 10⁸ copies/�lorresponding to 0.6 ng/�l, stored at −20 ◦C) was usedn the range of 3 × 10⁶ to 3 × 10³ copies in a 1:10 dilu-ion series. Six nanograms of genomic DNA and 0.6 ng
c(ww
chnology 128 (2007) 716–725 719
f cDNA were used as a template. The standard curveas analysed in duplicates, samples in triplicates.The reaction mix consisted of iQ Supermix (Bio-
ad), 18 pmol of sense and antisense primers and 3 pmolf the fluorogenic probe labelled with 6-carboxy-uorescein (FAM) and the fluorescent quencher dye-carboxytetramethylrhodamin (TAMRA). Amplifica-ion was done by denaturation at 95 ◦C for 5 min andfterwards running 45 cycles consisting of 95 ◦C for5 s and 60 ◦C for 1 min. Recording was done at the endf the second step at 495/620 nm, and results were eval-ated with the Rotor-Gene Software V 5.0 at a thresholdf 0.06.
.7.1. Validation of qPCR-analysesFor validation, five independent analyses of the stan-
ard curve were performed in duplicates. The resultsere calculated with a statistic program based on
n Excel macro. On the basis of these analyses, lin-ar regression (ANOVA), linearity (Mandel), varianceomogeneity (F-test) and range were statistically eval-ated. The logarithm of the copy number was relatedo the CT-value (cycle number where the fluorescenceises above the defined threshold) in a first order equa-ion (CT = slope log(copy number) + intercept).
.7.2. Determination of gene copy numberThe gene copy number of EpoFc was quantified by
nalysing 6 ng genomic DNA of each clone (represent-ng 1820 molecules of the genome). Genomic DNArom passages 2 and 4 of each clone was analysed threeimes and the GCN was averaged from the six results.
.7.3. Determination of the mRNA copy numberCompared to the GCN, the calculation of the
ranscript copy number is more complex. In each exper-ment 0.6 ng cDNA were used as template. Since littles known about the total RNA content per cell, weuantified the RNA isolated from 2.5 × 10⁶ cells andound (comparable to Bustin, 2002) 12.2 ± 3.7 pg totalNA/cell. The initial cell number used for quantita-
ive PCR is influenced by the efficiency of the reverseranscriptase reaction. Therefore we introduced theuotient q for back-transformation: initial
cDNA/RNAell number = analysed cDNA (pg)/(qcDNA/RNA·12.2pg/cell)). RNA from passages 2 and 4 of each cloneas analysed three times and the mRNA copy numberas averaged from the six results.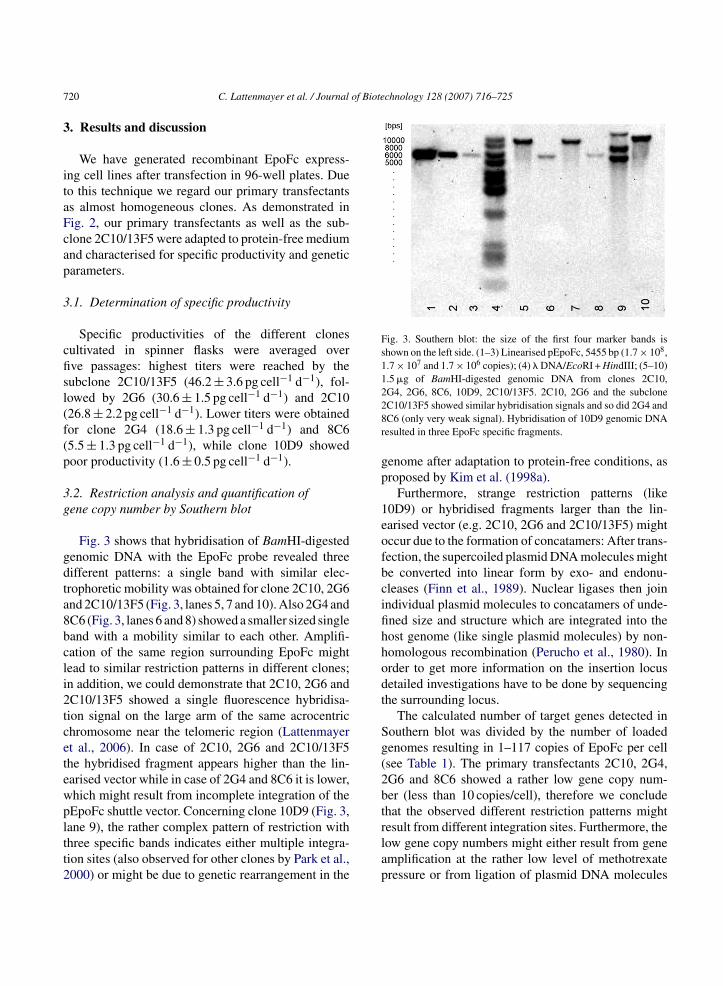
7 of Biotechnology 128 (2007) 716–725
3
itaFcap
3
cfisl(f(p
3g
gdta8bcli2tcetewpltt2
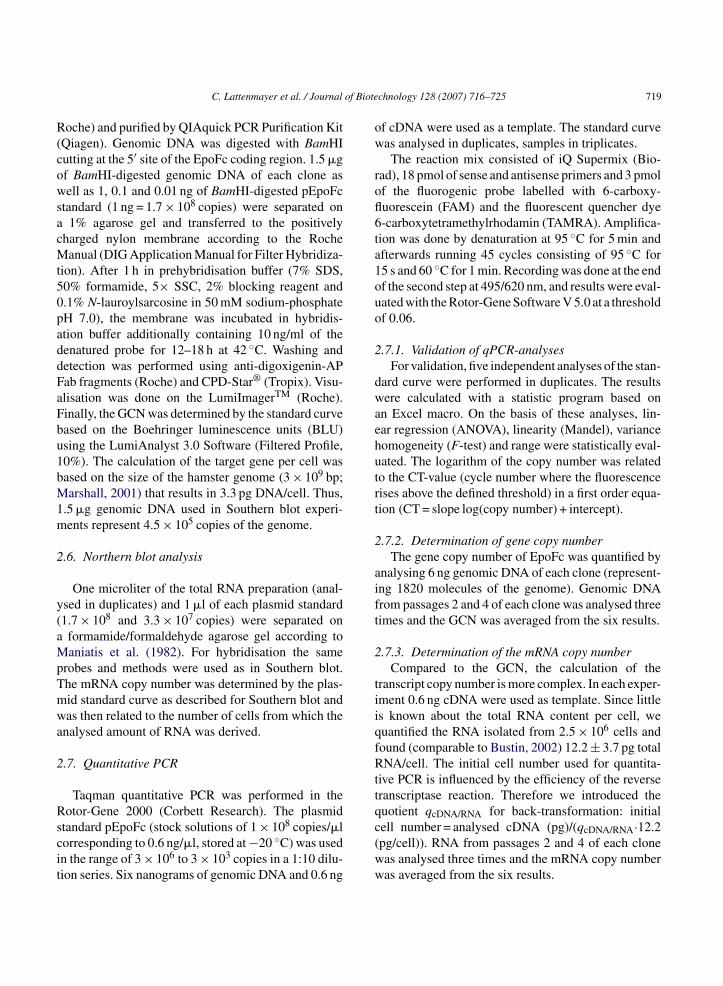
Fig. 3. Southern blot: the size of the first four marker bands isshown on the left side. (1–3) Linearised pEpoFc, 5455 bp (1.7 × 108,1.7 × 107 and 1.7 × 10⁶ copies); (4) � DNA/EcoRI + HindIII; (5–10)1.5 �g of BamHI-digested genomic DNA from clones 2C10,228r
gp
1eofbcifihhodt
Sg(2bt
20 C. Lattenmayer et al. / Journal
. Results and discussion
We have generated recombinant EpoFc express-ng cell lines after transfection in 96-well plates. Dueo this technique we regard our primary transfectantss almost homogeneous clones. As demonstrated inig. 2, our primary transfectants as well as the sub-lone 2C10/13F5 were adapted to protein-free mediumnd characterised for specific productivity and geneticarameters.
.1. Determination of specific productivity
Specific productivities of the different clonesultivated in spinner flasks were averaged overve passages: highest titers were reached by theubclone 2C10/13F5 (46.2 ± 3.6 pg cell−1 d−1), fol-owed by 2G6 (30.6 ± 1.5 pg cell−1 d−1) and 2C1026.8 ± 2.2 pg cell−1 d−1). Lower titers were obtainedor clone 2G4 (18.6 ± 1.3 pg cell−1 d−1) and 8C65.5 ± 1.3 pg cell−1 d−1), while clone 10D9 showedoor productivity (1.6 ± 0.5 pg cell−1 d−1).
.2. Restriction analysis and quantification ofene copy number by Southern blot
Fig. 3 shows that hybridisation of BamHI-digestedenomic DNA with the EpoFc probe revealed threeifferent patterns: a single band with similar elec-rophoretic mobility was obtained for clone 2C10, 2G6nd 2C10/13F5 (Fig. 3, lanes 5, 7 and 10). Also 2G4 andC6 (Fig. 3, lanes 6 and 8) showed a smaller sized singleand with a mobility similar to each other. Amplifi-ation of the same region surrounding EpoFc mightead to similar restriction patterns in different clones;n addition, we could demonstrate that 2C10, 2G6 andC10/13F5 showed a single fluorescence hybridisa-ion signal on the large arm of the same acrocentrichromosome near the telomeric region (Lattenmayert al., 2006). In case of 2C10, 2G6 and 2C10/13F5he hybridised fragment appears higher than the lin-arised vector while in case of 2G4 and 8C6 it is lower,hich might result from incomplete integration of theEpoFc shuttle vector. Concerning clone 10D9 (Fig. 3,
ane 9), the rather complex pattern of restriction withhree specific bands indicates either multiple integra-ion sites (also observed for other clones by Park et al.,000) or might be due to genetic rearrangement in therlap
G4, 2G6, 8C6, 10D9, 2C10/13F5. 2C10, 2G6 and the subcloneC10/13F5 showed similar hybridisation signals and so did 2G4 andC6 (only very weak signal). Hybridisation of 10D9 genomic DNAesulted in three EpoFc specific fragments.
enome after adaptation to protein-free conditions, asroposed by Kim et al. (1998a).
Furthermore, strange restriction patterns (like0D9) or hybridised fragments larger than the lin-arised vector (e.g. 2C10, 2G6 and 2C10/13F5) mightccur due to the formation of concatamers: After trans-ection, the supercoiled plasmid DNA molecules mighte converted into linear form by exo- and endonu-leases (Finn et al., 1989). Nuclear ligases then joinndividual plasmid molecules to concatamers of unde-ned size and structure which are integrated into theost genome (like single plasmid molecules) by non-omologous recombination (Perucho et al., 1980). Inrder to get more information on the insertion locusetailed investigations have to be done by sequencinghe surrounding locus.
The calculated number of target genes detected inouthern blot was divided by the number of loadedenomes resulting in 1–117 copies of EpoFc per cellsee Table 1). The primary transfectants 2C10, 2G4,G6 and 8C6 showed a rather low gene copy num-er (less than 10 copies/cell), therefore we concludehat the observed different restriction patterns might
esult from different integration sites. Furthermore, theow gene copy numbers might either result from genemplification at the rather low level of methotrexateressure or from ligation of plasmid DNA molecules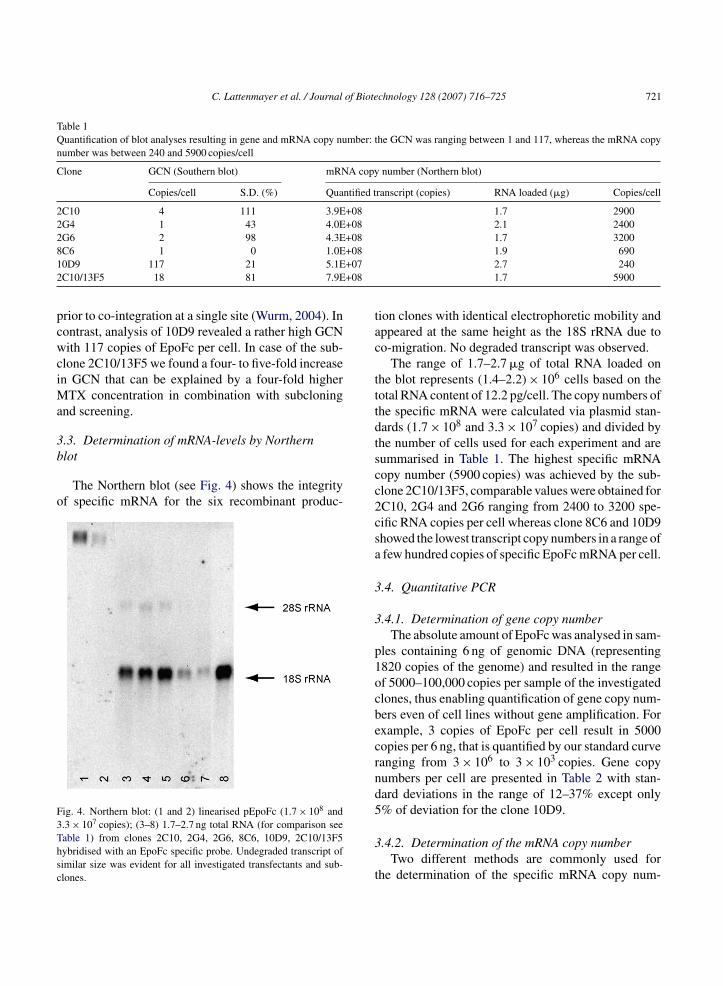
C. Lattenmayer et al. / Journal of Biotechnology 128 (2007) 716–725 721
Table 1Quantification of blot analyses resulting in gene and mRNA copy number: the GCN was ranging between 1 and 117, whereas the mRNA copynumber was between 240 and 5900 copies/cell
Clone GCN (Southern blot) mRNA copy number (Northern blot)
Copies/cell S.D. (%) Quantified transcript (copies) RNA loaded (�g) Copies/cell
2C10 4 111 3.9E+08 1.7 29002G4 1 43 4.0E+08 2.1 24002G6 2 98 4.3E+08 1.7 32008 +081 +072 +08
pcwciMa
3b
o
F3Thsc
tac
tttd
C6 1 0 1.0E0D9 117 21 5.1EC10/13F5 18 81 7.9E
rior to co-integration at a single site (Wurm, 2004). Inontrast, analysis of 10D9 revealed a rather high GCNith 117 copies of EpoFc per cell. In case of the sub-
lone 2C10/13F5 we found a four- to five-fold increasen GCN that can be explained by a four-fold higher
TX concentration in combination with subcloningnd screening.
.3. Determination of mRNA-levels by Northern
lotThe Northern blot (see Fig. 4) shows the integrityf specific mRNA for the six recombinant produc-
ig. 4. Northern blot: (1 and 2) linearised pEpoFc (1.7 × 10⁸ and.3 × 107 copies); (3–8) 1.7–2.7 ng total RNA (for comparison seeable 1) from clones 2C10, 2G4, 2G6, 8C6, 10D9, 2C10/13F5ybridised with an EpoFc specific probe. Undegraded transcript ofimilar size was evident for all investigated transfectants and sub-lones.
tscc2csa
3
3
p1ocbecrnd5
3
t
1.9 6902.7 2401.7 5900
ion clones with identical electrophoretic mobility andppeared at the same height as the 18S rRNA due too-migration. No degraded transcript was observed.
The range of 1.7–2.7 �g of total RNA loaded onhe blot represents (1.4–2.2) × 106 cells based on theotal RNA content of 12.2 pg/cell. The copy numbers ofhe specific mRNA were calculated via plasmid stan-ards (1.7 × 10⁸ and 3.3 × 10⁷ copies) and divided byhe number of cells used for each experiment and areummarised in Table 1. The highest specific mRNAopy number (5900 copies) was achieved by the sub-lone 2C10/13F5, comparable values were obtained forC10, 2G4 and 2G6 ranging from 2400 to 3200 spe-ific RNA copies per cell whereas clone 8C6 and 10D9howed the lowest transcript copy numbers in a range offew hundred copies of specific EpoFc mRNA per cell.
.4. Quantitative PCR
.4.1. Determination of gene copy numberThe absolute amount of EpoFc was analysed in sam-
les containing 6 ng of genomic DNA (representing820 copies of the genome) and resulted in the rangef 5000–100,000 copies per sample of the investigatedlones, thus enabling quantification of gene copy num-ers even of cell lines without gene amplification. Forxample, 3 copies of EpoFc per cell result in 5000opies per 6 ng, that is quantified by our standard curveanging from 3 × 10⁶ to 3 × 10³ copies. Gene copyumbers per cell are presented in Table 2 with stan-ard deviations in the range of 12–37% except only% of deviation for the clone 10D9.
.4.2. Determination of the mRNA copy numberTwo different methods are commonly used for
he determination of the specific mRNA copy num-
722 C. Lattenmayer et al. / Journal of Biotechnology 128 (2007) 716–725
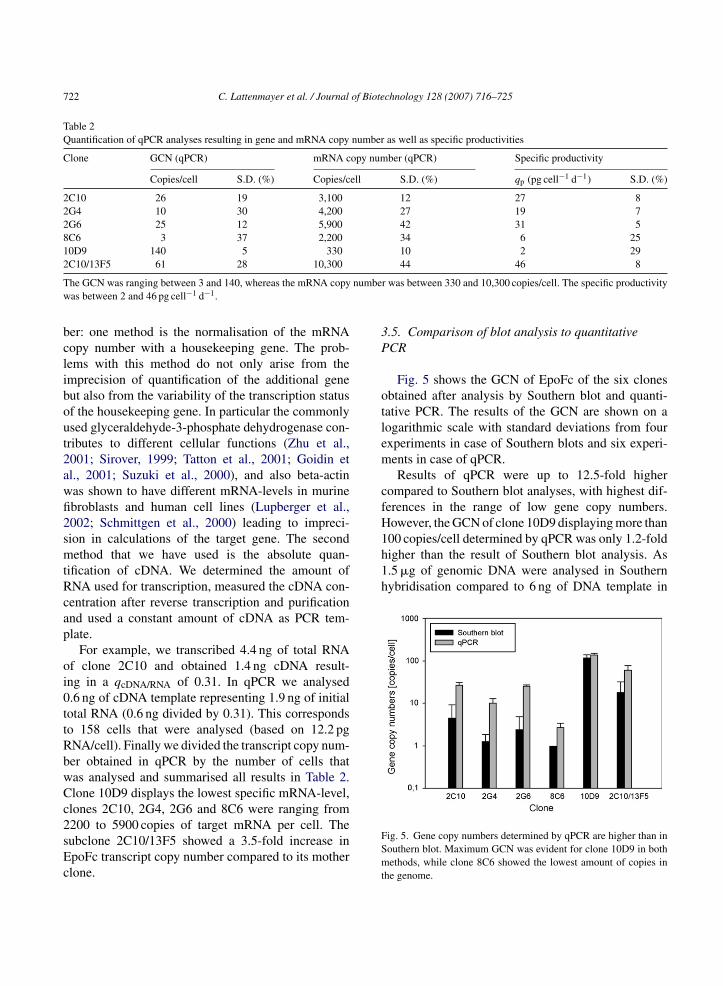
Table 2Quantification of qPCR analyses resulting in gene and mRNA copy number as well as specific productivities
Clone GCN (qPCR) mRNA copy number (qPCR) Specific productivity
Copies/cell S.D. (%) Copies/cell S.D. (%) qp (pg cell−1 d−1) S.D. (%)
2C10 26 19 3,100 12 27 82G4 10 30 4,200 27 19 72G6 25 12 5,900 42 31 58C6 3 37 2,200 34 6 2510D9 140 5 330 10 2 292
T numbew
bclibout2awfi2smtRcap
oi0ttRbwCc2sEc
3P
otlem
cfH100 copies/cell determined by qPCR was only 1.2-foldhigher than the result of Southern blot analysis. As1.5 �g of genomic DNA were analysed in Southernhybridisation compared to 6 ng of DNA template in
C10/13F5 61 28 10,300
he GCN was ranging between 3 and 140, whereas the mRNA copyas between 2 and 46 pg cell−1 d−1.
er: one method is the normalisation of the mRNAopy number with a housekeeping gene. The prob-ems with this method do not only arise from themprecision of quantification of the additional geneut also from the variability of the transcription statusf the housekeeping gene. In particular the commonlysed glyceraldehyde-3-phosphate dehydrogenase con-ributes to different cellular functions (Zhu et al.,001; Sirover, 1999; Tatton et al., 2001; Goidin etl., 2001; Suzuki et al., 2000), and also beta-actinas shown to have different mRNA-levels in murinebroblasts and human cell lines (Lupberger et al.,002; Schmittgen et al., 2000) leading to impreci-ion in calculations of the target gene. The secondethod that we have used is the absolute quan-
ification of cDNA. We determined the amount ofNA used for transcription, measured the cDNA con-entration after reverse transcription and purificationnd used a constant amount of cDNA as PCR tem-late.
For example, we transcribed 4.4 ng of total RNAf clone 2C10 and obtained 1.4 ng cDNA result-ng in a qcDNA/RNA of 0.31. In qPCR we analysed.6 ng of cDNA template representing 1.9 ng of initialotal RNA (0.6 ng divided by 0.31). This correspondso 158 cells that were analysed (based on 12.2 pgNA/cell). Finally we divided the transcript copy num-er obtained in qPCR by the number of cells thatas analysed and summarised all results in Table 2.lone 10D9 displays the lowest specific mRNA-level,lones 2C10, 2G4, 2G6 and 8C6 were ranging from
200 to 5900 copies of target mRNA per cell. Theubclone 2C10/13F5 showed a 3.5-fold increase inpoFc transcript copy number compared to its motherlone.FSmt
44 46 8
r was between 330 and 10,300 copies/cell. The specific productivity
.5. Comparison of blot analysis to quantitativeCR
Fig. 5 shows the GCN of EpoFc of the six clonesbtained after analysis by Southern blot and quanti-ative PCR. The results of the GCN are shown on aogarithmic scale with standard deviations from fourxperiments in case of Southern blots and six experi-ents in case of qPCR.Results of qPCR were up to 12.5-fold higher
ompared to Southern blot analyses, with highest dif-erences in the range of low gene copy numbers.owever, the GCN of clone 10D9 displaying more than
ig. 5. Gene copy numbers determined by qPCR are higher than inouthern blot. Maximum GCN was evident for clone 10D9 in bothethods, while clone 8C6 showed the lowest amount of copies in
he genome.
C. Lattenmayer et al. / Journal of Biote
Fe2c
qt2fgdhbItldotte
NPtimdqwmmd
3q
pwsnatWlperG
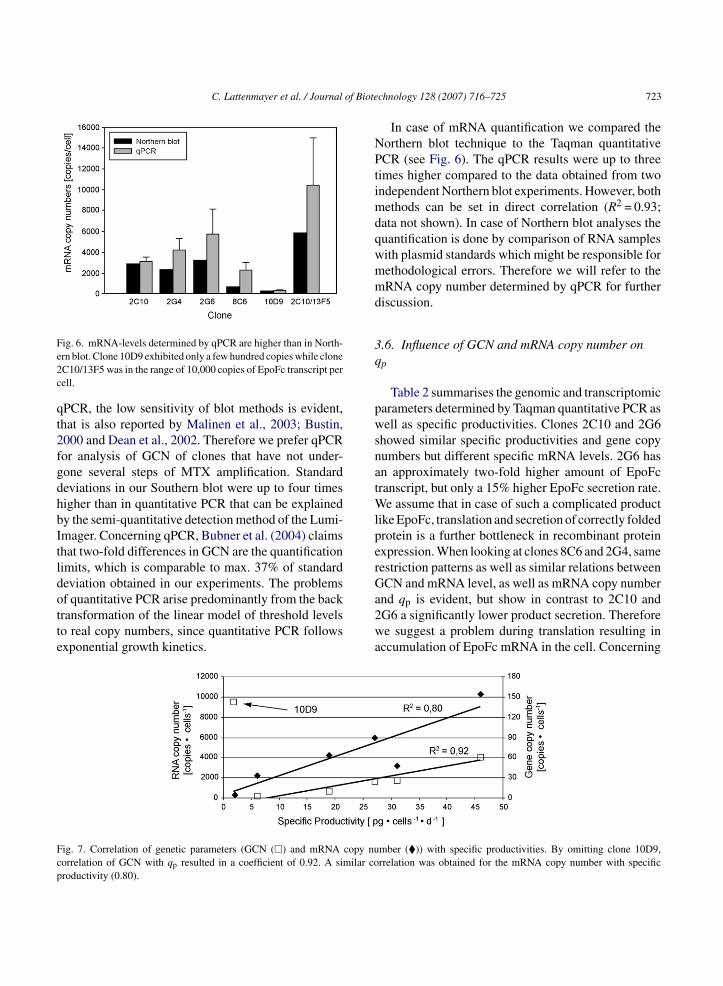
Fcp
ig. 6. mRNA-levels determined by qPCR are higher than in North-rn blot. Clone 10D9 exhibited only a few hundred copies while cloneC10/13F5 was in the range of 10,000 copies of EpoFc transcript perell.
PCR, the low sensitivity of blot methods is evident,hat is also reported by Malinen et al., 2003; Bustin,000 and Dean et al., 2002. Therefore we prefer qPCRor analysis of GCN of clones that have not under-one several steps of MTX amplification. Standardeviations in our Southern blot were up to four timesigher than in quantitative PCR that can be explainedy the semi-quantitative detection method of the Lumi-mager. Concerning qPCR, Bubner et al. (2004) claimshat two-fold differences in GCN are the quantificationimits, which is comparable to max. 37% of standardeviation obtained in our experiments. The problems
f quantitative PCR arise predominantly from the backransformation of the linear model of threshold levelso real copy numbers, since quantitative PCR followsxponential growth kinetics.a2wa
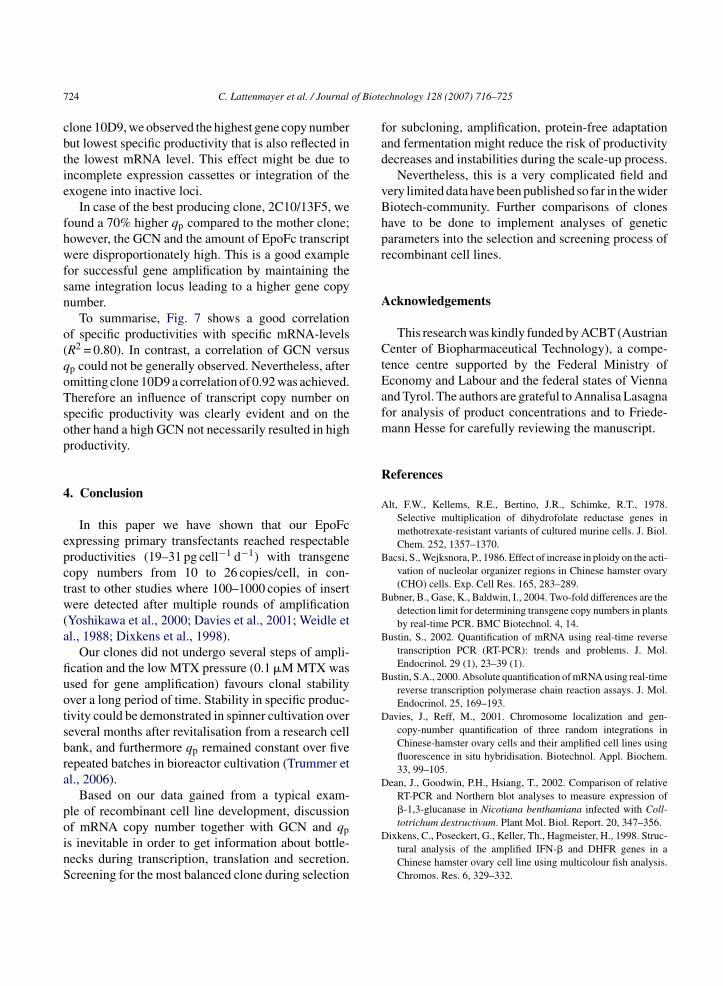
ig. 7. Correlation of genetic parameters (GCN (�) and mRNA copy nuorrelation of GCN with qp resulted in a coefficient of 0.92. A similar coroductivity (0.80).
chnology 128 (2007) 716–725 723
In case of mRNA quantification we compared theorthern blot technique to the Taqman quantitativeCR (see Fig. 6). The qPCR results were up to three
imes higher compared to the data obtained from twondependent Northern blot experiments. However, both
ethods can be set in direct correlation (R2 = 0.93;ata not shown). In case of Northern blot analyses theuantification is done by comparison of RNA samplesith plasmid standards which might be responsible forethodological errors. Therefore we will refer to theRNA copy number determined by qPCR for further
iscussion.
.6. Influence of GCN and mRNA copy number onp
Table 2 summarises the genomic and transcriptomicarameters determined by Taqman quantitative PCR asell as specific productivities. Clones 2C10 and 2G6
howed similar specific productivities and gene copyumbers but different specific mRNA levels. 2G6 hasn approximately two-fold higher amount of EpoFcranscript, but only a 15% higher EpoFc secretion rate.
e assume that in case of such a complicated productike EpoFc, translation and secretion of correctly foldedrotein is a further bottleneck in recombinant proteinxpression. When looking at clones 8C6 and 2G4, sameestriction patterns as well as similar relations betweenCN and mRNA level, as well as mRNA copy number
nd qp is evident, but show in contrast to 2C10 andG6 a significantly lower product secretion. Thereforee suggest a problem during translation resulting in
ccumulation of EpoFc mRNA in the cell. Concerning
mber (�)) with specific productivities. By omitting clone 10D9,rrelation was obtained for the mRNA copy number with specific
7 of Biote
cbtie
fhwfsn
o(qoTsop
4
epctw(a
fiuotsbra
poinS
fad
vBhpr
A
CtEafm
R
A
B
B
B
B
D
D
24 C. Lattenmayer et al. / Journal
lone 10D9, we observed the highest gene copy numberut lowest specific productivity that is also reflected inhe lowest mRNA level. This effect might be due toncomplete expression cassettes or integration of thexogene into inactive loci.
In case of the best producing clone, 2C10/13F5, weound a 70% higher qp compared to the mother clone;owever, the GCN and the amount of EpoFc transcriptere disproportionately high. This is a good example
or successful gene amplification by maintaining theame integration locus leading to a higher gene copyumber.
To summarise, Fig. 7 shows a good correlationf specific productivities with specific mRNA-levelsR2 = 0.80). In contrast, a correlation of GCN versusp could not be generally observed. Nevertheless, aftermitting clone 10D9 a correlation of 0.92 was achieved.herefore an influence of transcript copy number onpecific productivity was clearly evident and on thether hand a high GCN not necessarily resulted in highroductivity.
. Conclusion
In this paper we have shown that our EpoFcxpressing primary transfectants reached respectableroductivities (19–31 pg cell−1 d−1) with transgeneopy numbers from 10 to 26 copies/cell, in con-rast to other studies where 100–1000 copies of insertere detected after multiple rounds of amplification
Yoshikawa et al., 2000; Davies et al., 2001; Weidle etl., 1988; Dixkens et al., 1998).
Our clones did not undergo several steps of ampli-cation and the low MTX pressure (0.1 �M MTX wassed for gene amplification) favours clonal stabilityver a long period of time. Stability in specific produc-ivity could be demonstrated in spinner cultivation overeveral months after revitalisation from a research cellank, and furthermore qp remained constant over fiveepeated batches in bioreactor cultivation (Trummer etl., 2006).
Based on our data gained from a typical exam-le of recombinant cell line development, discussion
f mRNA copy number together with GCN and qps inevitable in order to get information about bottle-ecks during transcription, translation and secretion.creening for the most balanced clone during selectionD
chnology 128 (2007) 716–725
or subcloning, amplification, protein-free adaptationnd fermentation might reduce the risk of productivityecreases and instabilities during the scale-up process.
Nevertheless, this is a very complicated field andery limited data have been published so far in the wideriotech-community. Further comparisons of clonesave to be done to implement analyses of geneticarameters into the selection and screening process ofecombinant cell lines.
cknowledgements
This research was kindly funded by ACBT (Austrianenter of Biopharmaceutical Technology), a compe-
ence centre supported by the Federal Ministry ofconomy and Labour and the federal states of Viennand Tyrol. The authors are grateful to Annalisa Lasagnaor analysis of product concentrations and to Friede-ann Hesse for carefully reviewing the manuscript.
eferences
lt, F.W., Kellems, R.E., Bertino, J.R., Schimke, R.T., 1978.Selective multiplication of dihydrofolate reductase genes inmethotrexate-resistant variants of cultured murine cells. J. Biol.Chem. 252, 1357–1370.
acsi, S., Wejksnora, P., 1986. Effect of increase in ploidy on the acti-vation of nucleolar organizer regions in Chinese hamster ovary(CHO) cells. Exp. Cell Res. 165, 283–289.
ubner, B., Gase, K., Baldwin, I., 2004. Two-fold differences are thedetection limit for determining transgene copy numbers in plantsby real-time PCR. BMC Biotechnol. 4, 14.
ustin, S., 2002. Quantification of mRNA using real-time reversetranscription PCR (RT-PCR): trends and problems. J. Mol.Endocrinol. 29 (1), 23–39 (1).
ustin, S.A., 2000. Absolute quantification of mRNA using real-timereverse transcription polymerase chain reaction assays. J. Mol.Endocrinol. 25, 169–193.
avies, J., Reff, M., 2001. Chromosome localization and gen-copy-number quantification of three random integrations inChinese-hamster ovary cells and their amplified cell lines usingfluorescence in situ hybridisation. Biotechnol. Appl. Biochem.33, 99–105.
ean, J., Goodwin, P.H., Hsiang, T., 2002. Comparison of relativeRT-PCR and Northern blot analyses to measure expression of�-1,3-glucanase in Nicotiana benthamiana infected with Coll-
totrichum destructivum. Plant Mol. Biol. Report. 20, 347–356.ixkens, C., Poseckert, G., Keller, Th., Hagmeister, H., 1998. Struc-tural analysis of the amplified IFN-� and DHFR genes in aChinese hamster ovary cell line using multicolour fish analysis.Chromos. Res. 6, 329–332.
of Biote
F
F
G
G
H
K
K
K
K
L
L
M
M
M
M
P
P
P
P
S
S
S
T
T
U
W
W
Y
Zhu, G., Chang, Y., Zuo, J., Dong, X., Zhang, M., Hu, G., Fang,
C. Lattenmayer et al. / Journal
inn, G.K., Kurz, B.W., Cheng, R.Z., Shmookler Reis, R.J., 1989.Homologous plasmid recombination is elevated in immortallytransformed cells. Mol. Cell Biol. 9, 4009–4017.
lintoff, W., Livingston, E., Duff, C., Worton, R., 1984. Moderate-level geneamplification in methotrexate-resistant Chinese ham-ster ovary cells is accompanied by chromosomal translations at ornear the site of amplified DHFR gene. Mol. Cell. Biol. 4, 69–76.
oidin, D., Mamessier, A., Staquet, M., Schmitt, D., Berthier-Vergnes, O., 2001. Ribosomal 18S RNA prevails over glyceral-dehyde-3-phosphate dehydrogenase and beta-actin genes asinternal standard for quantitative comparison of mRNA levels ininvasive and noninvasive human melanoma cell subpopulations.Anal. Biochem. 295 (1), 17–21.
u, M., Kern, J., Todd, P., Kompala, D., 1992. Effect of amplifica-tion of dhfr and lac Z genes on growth and beta-galactosidaseexpression in suspension cultures of recombinant CHO cells.Cytotechnology 9 (1–3), 237–245.
ammil, L., Welles, J., Carson, G., 2000. The gel microdrop secre-tion assay: identification of a low productivity subpopulationarising during the production of human antibody in CHO cells.Cytotechnology 34, 27–37.
aufman, R.J., 1993. Amplification and expression of transfectedgenes in mammalian cells. Gene Amplif. Mammal. Cells,315–343.
aufman, R.J., Wasley, L.C., Spilotes, A.J., Gossels, S.T., Latt, S.A.,Larsen, G.R., Kay, R.M., 1985. Coamplification and coexpres-sion of human tissue-type plasminogen activator and murinedihydrofolate reductase sequences in Chinese Hamster ovarycells. Mol. Cell. Biol. 5 (7), 1750–1759.
im, S.J., Kim, N.S., Ryu, C.J., Hong, H.J., Lee, G.M., 1998a. Char-acterization of chimeric antibody producing CHO cells in thecourse of dihydrofolate reductase-mediated gene amplificationand their stability in the absence of selective pressure. Biotech.Bioeng. 58 (1), 73–84.
im, N.S., Kim, S.J., Lee, G.M., 1998b. Clonal variability withindihydrofolate reductase-mediated gene amplified Chinese ham-ster ovary cells: stability in the absence of selective pressure.Biotech. Bioeng. 60 (6), 680–688.
attenmayer, C., Loeschel, M., Steinfellner, W., Trummer, E.,Mueller, D., Schriebl, K., Vorauer-Uhl, K., Katinger, H., Kunert,R., 2006. Identification of transgene integration loci of differ-ent highly expressing recombinant CHO cell lines by FISH.Cytotechnology 51 (3), 171–182.
upberger, J., Kreuzer, K., Baskaynak, G., Peters, U., Le Coutre, P.,Schmidt, C., 2002. Quantitative analysis of beta-actin, beta-2-microglobulin and porphobilinogen deaminase mRNA and theircomparison as control transcripts for RT-PCR. Mol. Cell. Probes16, 25–30.
alinen, E., Kassinen, A., Rinttilae, T., Palva, A., 2003. Compari-son of real-time PCR with SYBR Green I or 5′-nuclease assaysand dot-blot hybridization with rNDA-targeted oligonucleotideprobes in quantification of selected feacal bacteria. Microbiology
149, 269–277.aniatis, T., Fritsch, E.F., Sambrook, J., 1982. Molecular Cloning: ALaboratory Manual. Cold Spring Harbor Laboratory Press, ColdSpring Harbor, NY.
chnology 128 (2007) 716–725 725
arshall, E., 2001. Rat genome spurs an unusual partnership. Sci-ence 291 (5510), 1872.
ichel, M.-L., Sobczak, E., Malpie‘ce, Y., Tiollais, P., Streeck, R.,1985. Expression of amplified hepatitis B virus surface antigengenes in Chinese hamster ovary cells. Biotechnology 3, 561–566.
allavicini, M.G., De Teresa, P.S., Rosette, C., Gray, J.W., Wurm,F., 1990. Effects of methotrexate on transfected DNA stability inmammalian cells. Mol. Cell Biol. 10 (1), 401–404.
ark, J.H., Kim, C., Kim, W.B., Kim, Y.K., Lee, S.Y., Yang, J.M.,2000. Efficiency of promoter and cell line in high-level expres-sion of erythropoietin. Biotechnol. Appl. Biochem. 32, 167–172.
endse, G.J., Karkare, S., Bailey, J.E., 1992. Effect of cloned genedosage on cell growth and hepatitis B surface antigen synthesisand secretion in recombinant CHO cells. Biotech. Bioeng. 40 (1),119–129.
erucho, M., Hanahan, D., Wigler, M., 1980. Genetic and physicallinkage of exogenous sequences in transformed cells. Cell 22,309–317.
chmittgen, T., Zakrajsek, B., 2000. Effect of experimental treat-ment on housekeeping gene expression: validation by real-time,quantitative RT-PCR. J. Biochem. Biophys. Meth. 46, 69–81.
irover, M., 1999. New insights into an old protein: the functionaldiversity of mammalian glyceraldehyde-3-phosphate dehydro-genase. Biochim. Biophys. Acta 1432 (2), 159–184.
uzuki, T., Higgins, P.J., Crawford, D.R., 2000. Control selection forRNA quantitation. Biotechniques 29, 332–337.
atton, W., Chalmers-Redman, R., Elstner, M., Leesch, W., Jagodzin-ski, F., Stupak, D., Sugrue, M., Tatton, N., 2000. Glyceral-dehyde-3-phosphate dehydrogenase in neurodegeneration andapoptosis signaling. J. Neural Transm. Suppl. 60, 77–100.
rummer, E., Fauland, K., Seidinger, S., Schriebl, K., Lattenmayer,C., Kunert, R., Vorauer-Uhl, K., Weik, R., Borth, N., Katinger,H., Muller, D., 2006. Process parameter shifting. Part I. Effectof DOT, pH, and temperature on the performance of Epo-Fcexpressing CHO cells cultivated in controlled batch bioreactors.Biotechnol. Bioeng. 94, 1033–1044.
rlaub, G., Chasin, L.A., 1980. Isolation of Chinese Hamster cellmutants deficient in dihydrofolate reductase activity. Proc. Natl.Acad. Sci. U.S.A. 77 (7), 4216–4220.
eidle, U., Buckel, P., Wienberg, J., 1988. Amplified expressionconstructs for human tissue-type plasminogen activator in Chi-nese hamster ovary cells: instability in the absence of selectivepressure. Gene 66 (2), 193–203.
urm, F.M., 2004. Production of recombinant protein therapeuticsin cultivated mammalian cells. Nat. Biotechnol. 22, 1393–1398.
oshikawa, T., Nakanishi, F., Ogura, Y., Oi, D., Omasa, T., Katakura,Y., Kishimoto, M., Suga, K., 2000. Amplified gene location inchromosomal DNA Affected recombinant protein production andstability of amplified genes. Biotechnol. Prog. 16, 710–715.
F., 2001. Fudenine, a C-terminal truncated rat homologue ofmouse prominin, is blood glucose-regulated and can up-regulatethe expression of GAPDH. Biochem. Biophys. Res. Commun.281 (4), 951–956.