Characterisation of a novel Fc conjugate of macrophage colony-stimulating factor
46
© 2014 The American Society of Gene & Cell Therapy. All rights reserved ACCEPTED ARTICLE PREVIEW Accepted Article Preview: Published ahead of advance online publication Characterisation of a novel Fc conjugate of Macrophage Colony-Stimulating Factor (CSF1) Deborah J. Gow, Kristin A. Sauter, Clare Pridans, Lindsey Moffat, Anuj Sehgal, Ben M. Stutchfield, Sobia Raza, Philippa M. Beard, Yi Ting Tsai, Graeme Bainbridge, Pamela L. Boner, Greg Fici, David Garcia-Tapia, Roger A. Martin, Theodore Oliphant, John A. Shelly, Raksha Tiwari, Thomas L. Wilson, Lee B. Smith, Neil A. Mabbott, David A. Hume Cite this article as: Deborah J. Gow, Kristin A. Sauter, Clare Pridans, Lindsey Moffat, Anuj Sehgal, Ben M. Stutchfield, Sobia Raza, Philippa M. Beard, Yi Ting Tsai, Graeme Bainbridge, Pamela L. Boner, Greg Fici, David Garcia-Tapia, Roger A. Martin, Theodore Oliphant, John A. Shelly, Raksha Tiwari, Thomas L. Wilson, Lee B. Smith, Neil A. Mabbott, David A. Hume, Characterisation of a novel Fc conjugate of Macrophage Colony-Stimulating Factor (CSF1), Molecular Therapy accepted article preview online 25 June 2014; doi:10.1038/mt.2014.112 This is a PDF file of an unedited peer-reviewed manuscript that has been accepted for publication. NPG is providing this early version of the manuscript as a service to our customers. The manuscript will undergo copyediting, typesetting and a proof review before it is published in its final form. Please note that during the production process errors may be discovered which could affect the content, and all legal disclaimers apply. This work is licensed under a Creative Commons Attribution 3.0 Unported License. The images or other third party material in this article are included in the article’s Creative Commons license, unless indicated otherwise in the credit line; if the material is not included under the Creative Commons license, users will need to obtain permission from the license holder to reproducethe material. To view a copy of this license, visit http://creativecommons.org/licenses/by/3.0/ Received 06 February 2014; accepted 09 June 2014; Accepted article preview online 25 June 2014 Accepted manuscript
-
Upload
vaporworldnwa -
Category
Documents
-
view
1 -
download
0
Transcript of Characterisation of a novel Fc conjugate of macrophage colony-stimulating factor
© 2014 The American Society of Gene & Cell Therapy. All rights reserved
ACCEPTED ARTICLE PREVIEW
Accepted Article Preview: Published ahead of advance online publication
Characterisation of a novel Fc conjugate of Macrophage
Colony-Stimulating Factor (CSF1)
Deborah J. Gow, Kristin A. Sauter, Clare Pridans, Lindsey
Moffat, Anuj Sehgal, Ben M. Stutchfield, Sobia Raza,
Philippa M. Beard, Yi Ting Tsai, Graeme Bainbridge, Pamela
L. Boner, Greg Fici, David Garcia-Tapia, Roger A. Martin,
Theodore Oliphant, John A. Shelly, Raksha Tiwari, Thomas
L. Wilson, Lee B. Smith, Neil A. Mabbott, David A. Hume
Cite this article as: Deborah J. Gow, Kristin A. Sauter, Clare Pridans, Lindsey
Moffat, Anuj Sehgal, Ben M. Stutchfield, Sobia Raza, Philippa M. Beard, Yi Ting
Tsai, Graeme Bainbridge, Pamela L. Boner, Greg Fici, David Garcia-Tapia, Roger A.
Martin, Theodore Oliphant, John A. Shelly, Raksha Tiwari, Thomas L. Wilson, Lee
B. Smith, Neil A. Mabbott, David A. Hume, Characterisation of a novel Fc conjugate
of Macrophage Colony-Stimulating Factor (CSF1), Molecular Therapy accepted
article preview online 25 June 2014; doi:10.1038/mt.2014.112
This is a PDF file of an unedited peer-reviewed manuscript that has been accepted
for publication. NPG is providing this early version of the manuscript as a service to
our customers. The manuscript will undergo copyediting, typesetting and a proof
review before it is published in its final form. Please note that during the production
process errors may be discovered which could affect the content, and all legal
disclaimers apply.
This work is licensed under a Creative
Commons Attribution 3.0 Unported License. The images
or other third party material in this article are included in
the article’s Creative Commons license, unless indicated
otherwise in the credit line; if the material is not
included under the Creative Commons license, users will
need to obtain permission from the license holder to
reproducethe material. To view a copy of this license,
visit http://creativecommons.org/licenses/by/3.0/
Received 06 February 2014; accepted 09 June 2014; Accepted article preview online
25 June 2014
Accep
ted m
anusc
ript
ACCEPTED ARTICLE PREVIEW
© 2014 The American Society of Gene & Cell Therapy. All rights reserved
Characterisation of a novel Fc conjugate of Macrophage Colony-Stimulating Factor
(CSF1).
Deborah J. Gow1*
, Kristin A. Sauter1*
, Clare Pridans1, Lindsey Moffat
1, Anuj Sehgal
1, Ben
M. Stutchfield2, Sobia Raza
1, Philippa M. Beard
1, Yi Ting Tsai
4, Graeme Bainbridge
3, Pamela
L. Boner3, Greg Fici
3, David Garcia-Tapia
3, Roger A. Martin
3, Theodore Oliphant
3, John A.
Shelly3, Raksha Tiwari
3, Thomas L. Wilson
3, Lee B. Smith
4, Neil A. Mabbott
1, David A.
Hume1
* These authors contributed equally to this work
1 The Roslin Institute and Royal (Dick) School of Veterinary Studies, the University of
Edinburgh, Easter Bush, Midlothian EH25 9RG, Scotland, UK
2The University of Edinburgh/MRC centre for Inflammation Research, The Queen’s Medical
Research Institute, 47 Little France Crescent, Edinburgh EH16 4TJ, Scotland, UK
3Zoetis, 7000 Portage Road, Kalamazoo, MI 49001, USA
4The University of Edinburgh/MRC Centre for Reproductive Health, The Queen’s Medical
Research Institute, 47 Little France Crescent, Edinburgh EH16 4TJ, Scotland, UK
Running Head: Expansion of the mononuclear phagocyte system
Correspondence should be addressed to D.A.H
Professor David A. Hume
The Roslin Institute and Royal (Dick) School of Veterinary Studies, University of
Edinburgh, Easter Bush, Midlothian, EH25 9RG, Scotland, UK
[email protected], Phone: +44(0) 1316519100, Fax: +44(0) 1316519105
Accep
ted m
anusc
ript

ACCEPTED ARTICLE PREVIEW
© 2014 The American Society of Gene & Cell Therapy. All rights reserved
Abstract
We have produced an Fc conjugate of CSF1 with an improved circulating half-life.
CSF1-Fc retained its macrophage growth-promoting activity, and did not induce
proinflammatory cytokines in-vitro. Treatment with CSF1-Fc did not produce adverse
effects in mice or pigs. The impact of CSF1-Fc was examined using the Csf1r-EGFP
reporter gene in MacGreen mice. Administration of CSF1-Fc to mice drove extensive
infiltration of all tissues by Csf1r-EGFP positive macrophages. The main consequence
was hepatosplenomegaly, associated with proliferation of hepatocytes. Expression
profiles of the liver indicated that infiltrating macrophages produced candidate mediators
of hepatocyte proliferation including urokinase, TNF and IL6. CSF1-Fc also promoted
osteoclastogenesis and produced pleiotropic effects on other organ systems, notably the
testis, where CSF1-dependent macrophages have been implicated in homeostasis.
However, it did not affect other putative CSF1 targets, notably intestine, where Paneth
cell numbers and villus architecture were unchanged. CSF1 has therapeutic potential in
regenerative medicine in multiple organs. We suggest that the CSF1-Fc conjugate retains
this potential, and may permit daily delivery by injection rather than continuous infusion
required for the core molecule.
Accep
ted m
anusc
ript

ACCEPTED ARTICLE PREVIEW
© 2014 The American Society of Gene & Cell Therapy. All rights reserved
Introduction
The mononuclear phagocyte system is a family of cells comprising progenitors in the bone
marrow (BM), circulating monocytes and tissue macrophages1. The proliferation,
differentiation and survival of these cells depends upon macrophage colony-stimulating
factor (CSF1). Mutations in the CSF1 locus produce pleiotropic effects on many tissues,
reflecting the many roles of macrophages in development and homeostasis2,3
. A subset of
these effects can be mimicked by prolonged treatment with a blocking antibody against the
CSF1 receptor (CSF1R)4. A Csf1r-EGFP transgene provides a marker for macrophages in
tissues, and enables monitoring of the impacts of treatments that later tissue macrophage
numbers5. The effects of the blocking antibody supported the concept that macrophage
survival/replacement in most tissues, with possible exception of the lung, requires continuous
CSF1R signalling4,6
.
Monocyte and macrophage numbers can be increased above the normal homeostatic levels by
CSF1 treatment. Recombinant CSF1 has been tested in clinical trials for several indications2,
but has not yet found a clinical application. The original studies when the molecule was
cloned focussed on cancer therapy as the indication7. Further studies have been constrained
by the cost of the agent. CSF1 has a very short half-life in the circulation of mice (1.6 hours),
being cleared by CSF1R-mediated internalisation and degradation by Kupffer cells of the
liver8. Renal excretion becomes the major mechanism of clearance when the receptor-
mediated clearance is saturated. The 150 amino acid active CSF1 protein produced in bacteria
is well below the renal clearance threshold of around 68kDa (the size of albumin), and
consequently the majority of any injected bolus dose is rapidly removed by the kidney. Early
studies of human CSF1 actions in mice by Hume et al.2 used the large glycoprotein form of
Accep
ted m
anusc
ript
ACCEPTED ARTICLE PREVIEW
© 2014 The American Society of Gene & Cell Therapy. All rights reserved
the protein produced in mammalian cell culture. It was active with daily injections of 0.5 to 1
mg/kg. In subsequent studies using the smaller protein expressed in bacteria a 5-10 fold
higher dose was required to achieve an increase in circulating monocyte numbers2.
When CSF1 was originally identified, it was administered by continuous infusion and was
well-tolerated7 The dose-limiting toxicity was thrombocytopenia, which recovered rapidly
upon cessation of treatment7,9
. Recent studies have reinvigorated interest in CSF1 as a
therapeutic agent in tissue repair2. To enable reinvestigation of therapeutic applications of
CSF1, especially preclinical evaluations in large animals, we sought to increase the half-life
by producing a conjugate with the Fc region of immunoglobulin10
. Aside from increasing the
molecular size, such conjugates bind the recycling neonatal Fc-receptor (FcRN), which
salvages the protein from endosomal degradation and may allow less frequent dosing of
patients. The most studied example is Fc-erythropoietin (EPO), which is in clinical use10
.
There are several other reports of functional Fc fusion proteins including G-CSF which, like
EPO, is structurally related to CSF1. However, the production of active Fc conjugates may
be complicated by inappropriate formation of disulphide bonds11
. In the case of CSF1, the
active protein has three intra-chain disulphides and is a disulphide-linked dimer. The
additional concern is that a conjugate might potentially link CSF1 to macrophage Fc
receptors, which could promote, rather than decrease clearance, or might activate the
macrophages in unanticipated ways12
.
The domestic pig has been used extensively in biomedical research, including preclinical
studies of Fc conjugates of EPO13. CSF1 from the domestic pig has the advantage of
providing a molecule that is equally active across all mammalian species examined14
. We
produced a pig CSF1 active fragment conjugated to CH-3 region of pig IgG1a. In this paper
we describe the ability of this molecule to drive a massive expansion of tissue macrophage
populations in mice. The actions of the molecule in-vivo led to the surprising conclusion that
Accep
ted m
anusc
ript
ACCEPTED ARTICLE PREVIEW
© 2014 The American Society of Gene & Cell Therapy. All rights reserved
CSF1 is involved in homeostatic control of the size of the liver and has pleiotropic effects in
several other organ systems. These findings expand the potential applications of CSF1
therapy in regenerative medicine.
Results
Production and activity of pig CSF1-Fc.
A fusion protein comprising pig CSF1 joined to the hinge-CH3 region of pig IgG1a (Fig. 1A)
was expressed in HEK293F cells and purified using Protein A affinity chromatography under
contract from Genscript. We have previously demonstrated that pig CSF1 is biologically
active on the mouse CSF1R14
. The activity of CSF1-Fc was tested in parallel with native
recombinant pig CSF1 on the Ba/F3pCSF1R cell assay previously described14
and on pig BM
cells. The CSF1-Fc protein was equally active on the cell line, and significantly more active
on pig BM (Fig. 1B). Prior to in-vivo studies, we wished to be certain that the CSF1-Fc did
not have any direct macrophage-activating effect, potentially through cross-linking of Fc
receptors. Pig BM-derived macrophages (BMDM) were grown in CSF1 as described
previously15
then treated with pig CSF1-Fc or LPS. Where LPS produced a massive increase
in TNF secretion there was no detectable response to CSF1-Fc (data not shown). To test the
effect of the Fc conjugate on clearance, pig serum samples were collected at various time
points following subcutaneous injection of either CSF1-Fc or CSF1 and assayed using an
anti-CSF1 antibody ELISA developed in-house (Fig. 1C). As anticipated, the administration
of CSF1-Fc achieved a 10-100-fold higher peak concentration than unconjugated CSF1
alone, and an elevated concentration was maintained for up to 72 hours.
Previous studies in humans and primates have indicated that CSF1 is relatively well-
tolerated7,16
. However, the Fc conjugate could produce a secondary stimulus. An initial study
indicated that a daily dose of 0.5 mg/kg was sufficient to induce a 2-3 fold increase in total
Accep
ted m
anusc
ript

ACCEPTED ARTICLE PREVIEW
© 2014 The American Society of Gene & Cell Therapy. All rights reserved
leukocytes after 3 days, and also produced substantial increases in tissue histiocytes in the
liver (not shown). We subsequently treated a cohort of 13 newborn piglets with 0.5 mg/kg
every second day for two weeks, and sacrificed them 2 weeks later. Animals were weighed
and monitored continuously, and blood taken at days 1, 7, 13 and 24. As observed in patients
treated with recombinant CSF17,9
, there was an increase in total white blood cells (WBC),
which was not restricted to monocytes. Total WBC and total lymphocytes were increased
transiently even in the control piglets; this was extended by the CSF1-Fc treatment. All of the
WBC populations declined following the cessation of treatment. There was no evidence of
increased temperature or behavioural changes during the treatment period, and all animals
gained weight rapidly (Fig. S1). In summary, the CSF1-Fc conjugate appears active, safe and
well-tolerated in a large animal.
CSF1-Fc expands macrophage populations in blood and organs.
As noted in the introduction, the effects of CSF1 mutation in mice suggest that CSF1-
dependent macrophages have many roles in homeostasis. Notwithstanding the apparent
safety, side effects that have not been considered could constrain therapeutic applications of a
much more active form of CSF1. To test the effect of CSF1-Fc in more detail in mice, we
first performed a dose response study. We treated daily to maintain continuous elevation of
CSF1, since there is some evidence of decline in levels after 24 hours. It may be that less
frequent treatment would produce the same outcome, but this has not been evaluated
systematically. A series of 4 daily treatments with CSF1-Fc produced a maximal increase in
blood leukocytes at 0.5 and 1mg/kg. Administration of 1mg/kg of recombinant pig CSF1
produced no detectable increase in circulating leukocytes or tissue macrophages, despite the
equivalent activity in the in vitro assays (data not shown). We therefore used the dose of
Accep
ted m
anusc
ript

ACCEPTED ARTICLE PREVIEW
© 2014 The American Society of Gene & Cell Therapy. All rights reserved
1mg/kg for subsequent studies. By contrast to many previous studies, and in the light of the
known roles of CSF1 in both male and female fertility3 , we examined equal numbers of male
and female mice. There was a significant increase in total body weight in the CSF1-Fc
treated group (Fig. 2A). The most obvious effect of the CSF1-Fc was hepatosplenomegaly,
which was visibly evident upon necropsy, and which accounted for almost all of the body
weight gain. Administration of CSF1-Fc doubled the spleen/body weight ratio (Fig. 2B) and
increased the liver/body weight ratio by 50% (Fig. 2C). There was no difference in gross
kidney or lung weight or organ/body weight ratios. The total white blood cell count was
significantly increased in mice treated with CSF1-Fc, mainly due to monocytosis and
neutrophilia (Fig. 2D-G).
The Csf1r-EGFP+ MacGreen reporter mice
5 provide a unique tool to monitor the response to
CSF1-Fc. The increased numbers of EGFP+ cells in the lung, spleen and liver (Fig. 3A) after
CSF1-Fc treatment was so great that it could be detected as a global increase in total
fluorescence (Fig. 3B). Increased macrophage numbers were confirmed by F4/80
immunostaining for both liver and spleen (Fig. 3C). The effect of CSF1-Fc in the lung was
unexpected. Prolonged treatment of mice with anti-CSF1R antibody was shown to deplete
alveolar macrophages, but not interstitial macrophages6. In the lung of CSF1-Fc treated mice,
there was a 2-3 fold increase in EGFP+ cells that appeared to be confined to the interstitium.
The increased numbers and diffuse infiltration of EGFP+ cells within the spleen of CSF1-Fc
treated mice was so extensive it was impossible to identify the boundaries of the red and
white pulp, implying that there was extensive infiltration of the lymphoid follicles by EGFP+
cells (Fig. 3A-B). In the liver, the EGFP reporter gene is expressed solely in Kupffer cells
which constitute about 8% of the total liver cell population5. The relative proportion of
EGFP+
cells was increased around 2-fold in the CSF1-Fc-treated mice (Fig. 3A-B). The
Accep
ted m
anusc
ript

ACCEPTED ARTICLE PREVIEW
© 2014 The American Society of Gene & Cell Therapy. All rights reserved
location of the positive cells was unchanged, and was consistent with the sinusoidal location
of Kupffer cells (Fig. 3C).
Pleiotropic effects of CSF1-Fc treatment.
The close physical and functional interaction between testicular interstitial macrophages
(TIM) and Leydig Cells (LC) is essential for normal testis function. TIMs have been
demonstrated to be associated with development and function of LC and CSF1 has also been
implicated in control of male fertility and testosterone production17
. To preserve the histology
of the testis for this application, the mice were perfusion fixed which decreases EGFP
detection. Macrophages were localised in the testis of MacGreen mice injected with CSF1-
Fc using anti-GFP antibody and confirmed using the Mac2 antibody, which detects galectin-
3, and the anti-macrophage ER-HR3 antibody (data not shown). There was a clear increase
in interstitial macrophage numbers in CSF1-Fc-treated animals compared to controls (Fig.
4A). To assess the consequence of these changes, we examined the circulating levels of
testosterone and Luteinizing hormone (LH), which participates in a physiological feedback
loop with testosterone, in the blood. The CSF-1-deficient op/op mouse was reported to have
depleted levels of both testosterone and LH, indicating a disruption of the hypothalamic
feedback loop17
. We demonstrated a significant increase in circulating testosterone, with no
difference in circulating LH, in CSF1-Fc-treated animals compared to PBS controls (Fig.
4B). CSF1 has been inferred to have direct effects on epithelial cell proliferation and
differentiation in the intestine. The Paneth cells of the crypt appear to be depend upon CSF1
signaling, and are absent from the CSF1-deficient op/op mouse18
. The MacGreen reporter
gene is not detected on any cells within the epithelium in the intestine, including the crypts
and Paneth cells, but there are large numbers of EGFP+ cells in intimate contact with the
Accep
ted m
anusc
ript

ACCEPTED ARTICLE PREVIEW
© 2014 The American Society of Gene & Cell Therapy. All rights reserved
underlying basement membrane (Fig. S2A). The lamina propria of MacGreen mice contains
a very dense network of EGFP+ cells
5. Against this high background, we did not detect any
increase in EGFP+ cells following CSF1-Fc treatment, nor any overt change in villus
thickness or architecture. Cryosections were immunostained to detect the Paneth cell marker,
lysozyme in intestinal crypts. There was no difference in apparent numbers, location or
staining intensity between the control and CSF1-Fc treated samples, nor any effect on villus
architecture or morphology to suggest impacts on epithelial proliferation (Fig. S2B).
Together with RANK ligand, CSF1 can activate multiple intracellular signalling pathways in
osteoclasts2,19
. The administration of CSF1-Fc caused a clear increase in the number of
TRAP+
osteoclasts within the epiphyseal plate compared to PBS control mice (Fig. 5A-B).
Within the BM, there was a significant increase in the myeloid:erythroid ratio from the
normal range of 1.3-1.5 to a ratio of 1.8-2.0 (Fig. 5B). CSF1 treatment of mice was reported
to increase the numbers of CSF1 responsive cells within the BM20
, consistent with more
recent evidence that it has a direct instructive role on progenitors21
. Marrow cells were also
stained with the macrophage specific antibody F4/80 and anti-Ly6C/G (Gr1). CSF1-Fc
caused a large increase in the proportions of marrow cells that were EGFP+, F4/80
+ and Gr1
+
(Fig. 5C).
The origin of the increase in liver and spleen weight in CSF1-Fc treated mice.
In the spleen, the majority of the increase in size was attributable to increased red pulp, and
also to expansion of the marginal zones (Fig. 6A). In the liver, the sinusoidal macrophage
numbers were substantially increased. There was no evidence of haemostasis, no infiltration
by other leukocytes such as neutrophils that would indicate tissue damage, nor of apoptosis of
hepatocytes (Fig. 6B). Histological examination revealed numerous mitotic figures in
Accep
ted m
anusc
ript
ACCEPTED ARTICLE PREVIEW
© 2014 The American Society of Gene & Cell Therapy. All rights reserved
hepatocytes in the treated mice, where they were absent from controls. Accordingly, sections
of liver, spleen, lung and kidney were stained for proliferating cell nuclear antigen (PCNA).
There was a significant increase in the number of PCNA+
cells in the liver and spleen of
CSF1-Fc treated mice (Fig. 7A-B). In the liver, the majority of PCNA+ cells were
hepatocytes (Fig. 7A, black arrow), but the PCNA+ cells within the sinusoids resembled
Kupffer cells (Fig. 7A, red arrow). Both nuclear and cytoplasmic PCNA staining was
identified in the treated mice livers (Fig. 7A, dashed arrow). A transition from cytoplasmic
to nuclear PCNA staining in hepatocytes is also observed in regenerating liver22
. PCNA+ cells
were distributed throughout the parenchyma. The same pattern of widespread hepatocyte
proliferation is seen after partial hepatectomy, where new hepatocytes derive from pre-
existing hepatocytes rather than stem cells23
.
CSF1-Fc can drive recruitment of cells to the peritoneal cavity, including both Ly6C+
monocytes and granulocytes, and many of the infiltrating cells are actively proliferative24
. To
confirm the apparent proliferative capacity of the macrophages in the treated liver, we
disaggregated the livers of control and CSF1-Fc treated mice following labeling with
bromodeoxyuridine (BrdU), and examined the phenotype of the macrophages by FACS. The
labeling index in the controls was <1% whereas around 10% of F4/80+ Kupffer cells were
dual positive for the proliferative marker Ki67 and for BrDU labeling in the CSF1-Fc treated
mice (Fig. 7C). CSF1-Fc also produced a significant increase in splenic PCNA+ cells,
probably reflecting the ability to drive extramedullary haemopoiesis2 (Fig. 7A-B).
Microarray data of liver gene expression.
Gene expression arrays were used to determine whether there were any changes in liver
function and whether there was expression of known hepatocyte growth factors. 2969
Accep
ted m
anusc
ript

ACCEPTED ARTICLE PREVIEW
© 2014 The American Society of Gene & Cell Therapy. All rights reserved
transcripts were differentially-expressed in the CSF1-Fc treated livers, with 1020 genes
repressed by CSF1-Fc treatment and 1948 genes induced. To segregate these data into co-
expressed gene sets that were likely to be expressed by liver cells versus macrophages, and
genes potentially induced in the macrophages by exposure to LPS in the portal venous blood,
the liver datasets were analysed alongside data from BMDM cultured in CSF1, with or
without stimulation with LPS25
. Network analysis of the normalised expression data was
performed using BioLayout Express3D
as described previously25
. This generated a graph of
2,555 nodes representing distinct transcripts (Fig. 8A). To identify groups of tightly co-
expressed genes, the graph was clustered using the graph-based Markov clustering algorithm
set at an inflation value (which determines the granularity of the clusters) of 1.8. This
generated 45 clusters of co-expressed transcripts with membership sizes ranging from 690 to
4 nodes. Fig. 8B shows the average expression profiles of the five largest clusters. Cluster 1
comprised 690 transcripts collectively repressed in the livers of treated mice and absent or
low-expressed in the BMDM samples. The gene ontology (GO) annotation indicated
enrichment for intermediary metabolism, and the list includes numerous enzymes of glucose,
amino acid and lipid metabolism and cytochrome P450 members. The most interesting
members of this cluster were the growth hormone receptor (Ghr), glucagon receptor (Gcgr)
and insulin receptor (Insr), which could be linked to the changes in metabolism. Note that
the repressed cluster did not contain liver-specific genes such as albumin (Alb), which
indicates inter alia that the influx of macrophages is not sufficient to dilute the hepatocyte
contribute to the total mRNA pool.
Cluster 2 (545 transcripts) contained genes expressed in BMDMs (regardless of LPS
treatment) that were also inducible in CSF1-Fc treated livers. As anticipated, this cluster is
clearly enriched in known macrophage-specific genes, including Emr1 (F4/80), Csf1r, Itgam
(CD11b), CD68, lyz1 (lysozyme) and Mpeg1 consistent with an increase in macrophage
Accep
ted m
anusc
ript

ACCEPTED ARTICLE PREVIEW
© 2014 The American Society of Gene & Cell Therapy. All rights reserved
representation within the total mRNA pool of treated livers. The cluster also contains the
chemokines Ccl2, Ccl3 and Ccl7. Clusters 3 and 6 also contained genes inducible in CSF1-Fc
treated livers, but in contrast to cluster 2, these 378 transcripts were down-regulated by LPS
in BMDMs. Both these clusters contain numerous cell-cycle associated genes, including
Pcna, identified previously in cluster of a mouse gene expression atlas26
; they may differ in
the stages of the cycle they represent. Cluster 3 also contains the well-characterised CSF1
target gene, Plau (urokinase plasminogen activator27
). Their repression in the BMDM is
consistent with the known ability of LPS to block CSF1 action and cause growth arrest in
these cells28
. Finally, and importantly, there is a cluster of genes (Cluster 4) that is induced by
LPS in the BMDM and also induced, to a lesser extent, in the CSF1-Fc treated livers. These
include both pro-inflammatory (Il1, Il6 and Tnf), and anti-inflammatory (Il10) cytokines,
several chemokines (Cxcl10, Cxcl16) and numerous known targets of interferon signaling
(e.g. Oas1, Gbp3, Ifit1, Irf7 etc.) identified previously25,26
. Hence, the infiltration of the liver
by macrophages in response to CSF1-Fc is accompanied by induction of classical
proinflammatory cytokines. Interestingly, despite the expression of these genes, the inducible
gene clusters did not include any known hepatocyte acute-phase gene products.
Discussion
This study describes the biological efficacy of an Fc conjugate of CSF1. As shown in Fig.
1C, the Fc addition to pig CSF1 increased the circulating half-life substantially without
reducing biological efficacy measured on factor-dependent cells. There was formal
possibility that the CSF1-Fc would trigger proinflammatory cytokine production by
signalling through the Fc receptor, CD6429
. However, the conjugate did not induce pro-
inflammatory cytokine release in-vitro. More importantly, in-vivo, there was no evidence of
Accep
ted m
anusc
ript

ACCEPTED ARTICLE PREVIEW
© 2014 The American Society of Gene & Cell Therapy. All rights reserved
pyrexia or weight loss in treated mice or pigs, nor any infiltration of the tissues by
granulocytes indicative of acute tissue inflammation.
With the CSF1-Fc, daily injections can maintain a maximally active concentration, and even
dosing every second day produced elevated monocyte numbers in the pig (Fig S1). CSF1-Fc
thus provides a novel reagent to study the role of macrophages in immunity, repair and
homeostasis2. Using this novel new agent, we sought evidence for an effect of excess CSF1
on CSF1-dependent pathways identified from studies of the op/op mice. There is no evidence
for the expression of the Csf1r–EGFP transgene within epithelia in any region of the gut5.
The intimate association of Csf1r-EGFP positive macrophages with the crypt epithelium (Fig.
S2A) could produce indirect effects, but CSF1-Fc had no effect on epithelial architecture or
Paneth cell numbers (Fig. S2B). By contrast, and in keeping with known dependence of
osteoclasts upon CSF1, the administration of CSF1-Fc greatly increased their numbers within
the epiphyseal plate (Fig. 6A-B). This finding indicates that osteoclast numbers are sensitive
to the availability of CSF1 in the steady state. There was no change in bone density or
trabecular architecture in the short time frame examined. The treatment will not necessarily
reduce bone density, because of the tight coupling of calcium homeostasis. In fact, Lloyd et
al.30
found that bone density was increased in mice administered high-dose rh-CSF1 for 21
days and CSF1 can promote intramembranous ossification in a fracture model31
. These
findings may reflect a separate role for the abundant population of CSF1-dependent
macrophages that line bone surfaces32
. CSF1-Fc could therefore find applications in treatment
of bone injury and osteoporosis.
The op/op mouse has deficiencies in both male and female fertility3. Previous studies have
described the close physical and functional relationship between testicular macrophages
(TIM) and Leydig cells and the role of CSF1 in control of male fertility. CSF1 may also
Accep
ted m
anusc
ript

ACCEPTED ARTICLE PREVIEW
© 2014 The American Society of Gene & Cell Therapy. All rights reserved
control testosterone production at the level of the hypothalamus and pituitary, by influencing
the negative-feedback control of LH secretion17
. We demonstrated that CSF1-Fc increased
TIM numbers and supported increased testosterone production, over and above the normal
stimulation provided by pituitary LH (Fig. 4). Furthermore, the observed increase in serum
testosterone occurred in the absence of a change in circulating LH concentration. These data
suggest that CSF1 acts both to support testosterone production at the level of the testis, and
also to disrupt the negative feedback mechanism at the level of the hypothalamus and
pituitary. Our data indicate for the first time that the availability of CSF1 can control
testosterone production in an adult animal. As such CSF1-Fc has a potential role as a
gonadotropin-independent promoter of testicular testosterone production, with potential
applications in medical and agricultural areas.
The most striking and unexpected effect of CSF1-Fc was the 50% increase in the size of the
liver (Fig. 2C). By comparison, there was a 15-37% increase in liver weight of mice infused
with hepatocyte growth factor33
. Neither the Csf1r-EGFP transgene5, nor Csf1r mRNA
34 is
expressed by hepatocytes. So, as in the context of renal regeneration and lung development35
,
we favour an indirect effect via macrophage-expressed gene products. Broadly-speaking,
macrophages elicited by CSF1 treatment fall within the broad M2 or alternative classification
of activation states35
, but the actions of CSF1 are quite distinct from those of the alternative
activator, IL424
. Following removal of two-thirds of the liver, the remaining liver becomes
hyperplastic and mature hepatocytes replicate to restore the original liver mass36
. As many as
95% of normally quiescent hepatocytes enter into the cell cycle in response to the priming
cytokines (TNFα and IL-6) followed by progression through the cell cycle in response to
growth factors such as hepatocyte growth factor, epidermal growth factor and transforming
growth factors36,37
. The treatment with CSF1-Fc largely mimics the effect of partial
Accep
ted m
anusc
ript

ACCEPTED ARTICLE PREVIEW
© 2014 The American Society of Gene & Cell Therapy. All rights reserved
hepatectomy. The CSF1-dependent expression of urokinase plasminogen activator (Plau)
may be a key mediator in the response to CSF1-Fc, since this protease is required for the
release and activation of hepatocyte growth factor36
. Insulin, glucagon37
and growth
hormone38
have also been implicated in liver regeneration, and all three receptors were down-
regulated in the livers of CSF1-Fc treated mice. Both TNFα and IL-6, which were induced in
the liver of treated mice, have been identified as initiators of liver regeneration after partial
hepatectomy based upon inhibitory effects of anti-TNFα antibodies39
and defective
regeneration in mice lacking IL-640
. These cytokines are presumably induced through
encounter with microbial products arriving in the portal circulation, but the levels are not
sufficient to produce systemic effects (Fig. 1), nor local infiltration of granulocytes, nor
induction of classical acute phase genes.
CSF1 is itself cleared from the circulation by the liver8. Liver regeneration does not occur in
the CSF1 deficient op/op mouse41
and is also prevented by macrophage depletion using toxic
liposomes42,43
. Together, these observations indicate that CSF1-dependent macrophages are
necessary for liver regeneration. We reported elsewhere that prolonged anti-CSF1R antibody
treatment can reduce the size of the liver4. The surprising result herein is that CSF1-Fc
treatment alone is sufficient to promote proliferation in an undamaged liver. The impact of
CSF1-Fc treatment indicates that there is a simple feedback loop between circulating CSF1
availability, monocyte production and release by the bone marrow, monocyte extravasation
and the size of the liver. The remarkable effect of CSF1-Fc on the liver (Fig. 7) has clear
implications for regenerative therapy. We reported previously that administration of CSF1-
stimulated macrophages via the portal vein can promote repair in chronic liver injury44
. Our
current data suggest that the same outcome may be achieved by the administration of the
agonist alone without adverse effects.
Accep
ted m
anusc
ript
ACCEPTED ARTICLE PREVIEW
© 2014 The American Society of Gene & Cell Therapy. All rights reserved
In other regenerative medicine applications, increasing the size of the liver may, or may not,
be desirable. It could improve the clearance of agents that mediate the pathology. The Fc
conjugate will certainly improve the efficacy and viability of CSF1 as a treatment in the
many other organ systems in which it has already been shown to have a beneficial effect2 and
others such as heart45
and spinal cord46
, where macrophages are crucial to repair. Systemic
CSF1 administration was recently found to be effective in protection against acute brain
injury47
and promoted the clearance of beta-amyloid deposits in a mouse model of
Alzheimer’s disease48
. The CSF1-Fc provides a new and significantly more cost-effective
reagent to extend these preclinical studies to large animals. We have established transgenic
chicken lines that produce the protein in eggs to produce the large amounts of protein
required for these studies (unpublished). An additional advantage of the Fc tag is that the
protein can also be made using standard commercial protein expression, and readily purified
by protein A affinity chromatography. Clearly applications in humans and companion
animals will require the production of the appropriate species-specific reagents, but the pig
offers many opportunities for preclinical evaluation.
Nevertheless, our data also demonstrate that treatment also has pleiotropic effects, most of
which would be predicted from the complex phenotype of the op/op mouse. The array data
indicate a global effect on hepatocyte lipid and amino acid metabolism and on responsiveness
to insulin and glucagon. Taking all of these findings together, CSF1 emerges as a central
homeostatic regulator. Accordingly, therapeutic applications will need to proceed with
caution.
Accep
ted m
anusc
ript
ACCEPTED ARTICLE PREVIEW
© 2014 The American Society of Gene & Cell Therapy. All rights reserved
Materials and methods
Cloning and expression of pig CSF1-Fc
The sequence corresponding to the active fragment of pig CSF1 (SENCSHMIGDGHLKVLQ
QLIDSQMETSCQIAFEFVDQEQLTDPVCYLKKAFLQVQDILDETMRFRDNTPNANVI
VQLQELSLRLNSCFTKDYEEQDKACVRTFYETPLQLLEKIKNVFNETKNLLKKDWNI
FSKNCNNSFAKCSSQHERQPEGR) was linked to the hinge-CH3 region of the pig IgG1a
sequence
(GTKTKPPCPICPGCEVAGPSVFIFPPKPKDTLMISQTPEVTCVVVDVSKEHAEVQFSW
YVDGVEVHTAETRPKEEQFNSTYRVVSVLPIQHQDWLKGKEFKCKVNNVDLPAPIT
RTISKAIGQSREPQVYTLPPPAEELSRSKVTVTCLVIGFYPPDIHVEWKSNGQPEPEGN
YRTTPPQQDVDGTFFLYSKLAVDKARWDHGETFECAVMHEALHNHYTQKSISKTQ
GK). This entire region was codon optimised for mammalian expression by GeneArt
(Invitrogen, CA, USA) and cloned into the expression plasmid pS00524 using HindIII and
NotI restriction sites engineered into the 5’ and 3’ ends respectively. The resulting plasmid
was sequenced to ensure ORF integrity and protein was expressed from transfected
HEK293F or CHO cells.
Isolation of pig CSF1-Fc fusion protein
Pig CSF1-Fc fusion protein produced under contract by Genscript Inc. Briefly, it was
isolated using Protein A affinity chromatography. Briefly, conditioned medium from cell
culture was centrifuged and loaded onto Protein A Sepharose that was equilibrated with PBS.
Following loading, the column was washed with PBS and 35 mM Na Acetate pH 5.5.
Accep
ted m
anusc
ript

ACCEPTED ARTICLE PREVIEW
© 2014 The American Society of Gene & Cell Therapy. All rights reserved
Protein was eluted using a step gradient of 80% B Buffer (35 mM Acetic acid, no pH
adjustment), 85% B buffer and 100% B buffer. The 80 and 85% B fractions were pooled
based on lack of aggregated protein (analytical SEC) and the 100% B fraction was not
included. Pooled protein was pH adjusted to 7.2 and dialyzed against PBS. Purity was
assessed by mass spectrometry, and endotoxin was certified less than 10EU/mg. The protein
migrated as a single band of the expected Mr (85-90kD) on SDS-PAGE, and of 45-50kD
under reducing conditions.
Cell viability assay
Stable Ba/F3 cells expressing pig CSF1R14
were maintained in culture with complete RPMI
supplemented with 104 Units/ml rh-CSF1 prior to MTT assay. 2x10
4 cells/well (Ba/F3 cells,
or 5x10⁴
cells/well (pig BMM) of a 96 well plate were plated in triplicate or quadruplicate
and treated (serial dilutions of pig CSF1 or CSF1-Fc were added to make a total volume of
100μl per well. Cells were incubated for 48 hours at 37°C, 5% CO2. For Ba/F3pCSF1R
cells, 10μl of MTT (Sigma Aldrich M5655) stock solution (5mg/ml) was added directly to
each well to achieve a final concentration of 0.5mg/ml and incubated at 37°C for 3 hours
prior to solubilisation overnight. For adherent pig BMM cells, the culture medium was
replaced with 50µl of 1mg/ml MTT solution and incubated for 1 hour at 37°C. The MTT
solution was removed and tetrazolium salt solubilised with 100μl of solubilisation agent
(0.1M HCL, 10% Triton x -100 and isopropanol) followed by incubation at 37°C with 5%
CO2 for 10 minutes. Plates were read at 570nm with reference wavelength of 405nm.
Accep
ted m
anusc
ript

ACCEPTED ARTICLE PREVIEW
© 2014 The American Society of Gene & Cell Therapy. All rights reserved
Pig CSF1 and CSF1-Fc ELISA
Pig CSF1-Fc-fusion plasma levels were detected using an ELISA, developed in-house using
human anti-CSF1 antibody (Abcam, ab9693) at 0.3 µg/mL and rabbit anti-pig IgG (Fc)
biotinylated antibody (Alpha Diagnostic, 90440) at 1:5000 dilution. Standard protein was
generated and purified in-house by Zoetis. Standards were added to each plate along with the
samples resulting in an 11 point standard range of 2700 ng/mL to 0.046 pg/mL. This allowed
for quantitation of each sample to a standard curve on every assay plate. Assay detection was
done using Pierce High Sensitivity Streptavidin-HRP (1:10,000 dilution) and TMB
Microwell Peroxidase Substrate System solution (KPL).
Pig CSF1-Fc pharmacokinetic study
Weaner age barrows (castrated male) (<14kg) were assigned to three treatment groups
receiving a single intravenous (i.v.) or subcutaneous (s.c.) dose as follows: 0.5 mg/kg CSF1
s.c. (n = 3), 1.2mg/kg CSF1-Fc i.v. (n = 2) or 1.2mg/kg CSF1-Fc s.c. (n = 2). Blood was
collected from the jugular into EDTA tubes followed by separation of plasma. Serial plasma
samples were obtained from each animal at pre-dose and 5 min, 30 min, 1 h, 2 h, 4 h, 6 h, 8,
h, 24 h, 48 h, and 72 h post-dose. CSF1 and CSF1-Fc plasma protein concentrations were
quantitated using ELISA assays.
In vivo mouse study
Csf1r-EGFP+ (MacGreen), Csf1r-EGFP
- wild-type mice were bred, genotyped and obtained
from The Roslin Institute Biological Research Facility. C57BL/6 mice were purchased from
Accep
ted m
anusc
ript

ACCEPTED ARTICLE PREVIEW
© 2014 The American Society of Gene & Cell Therapy. All rights reserved
Charles River Laboratories (UK). Approval was obtained from The Roslin Institute’s and
The University of Edinburgh’s Protocols and Ethics Committees. The experiments were
carried out under the authority of a UK Home Office Project Licence under the regulations of
the Animals (scientific procedures) Act 1986. Male and female 6-10 week MacGreen (n = 8
per sex), and C57BL/6 mice (n = 12 per sex), were injected subcutaneously with either PBS
(n=24) or 1mg/Kg pig CSF1-Fc (n=24) for 4 days prior to sacrifice on day 5. Mice were
weighed every day prior to injection and before cull. One mouse from each treatment group
was tissue perfused with 4% PFA. Blood was collected by cardiac puncture.
Bone marrow (BM) cells
Bones were stripped carefully of any tissue/muscle placed in 70% ethanol for 1 minute prior
to PBS for 1 minute. The proximal and distal ends of the femur were cut and cells flushed
with RPMI. Cells were re-suspended prior to centrifugation at 400g for 5 minutes and
counted. Cells for FACS analysis were harvested as above and prepared at a concentration of
5x 10⁶ cell/sample.
FACS
BM cells were washed, pelleted and re-suspended in PBS containing 0.1% NaN3, 2% heat
inactivated FCS, 0.1% BSA) with 2% heat inactivated normal mouse serum (200 µl/sample),
and incubated on ice for 20 minutes. Following washes (PBS containing 0.1% NaN3, 0.2%
heat inactivated FCS, 0.1% BSA: Lo-block), cells were re-suspended in the appropriate
antibody or isotype control (1:200 of PE anti-mouse F4/80 Biolegend 122616, 1:200 PE anti-
mouse Ly-6G/Ly-6C (Gr-1) Biolegend 108408 or 1:200 PE Rat IgG2b, k isotype control
Accep
ted m
anusc
ript

ACCEPTED ARTICLE PREVIEW
© 2014 The American Society of Gene & Cell Therapy. All rights reserved
Biolegend 400608) and incubated for 30 minutes. Cells were re-suspended in 400 µl of Lo-
block with 0.1% Sytox Blue (Invitrogen). Samples were analyzed on CyAn (Dako) and
analysed using Summit 4.1 software (DAKO).
The liver was perfused via the inferior vena cava and portal vein with PBS and then digested
in 2mg/ml collagenase D (Sigma Aldrich) at 37°C for 30min and passed through a 100μm
filter. A 7 minute 50G spin was performed to remove hepatocytes. Nonparenchymal cells
were further purified using a 30% percoll (Sigma) gradient. Cells were stained with fixable
viability die eFluor 780 then incubated with Fc block (TrustainfcX™, Biolegend) prior to
staining with CD45 (AF700, Biolegend) and F480 (PECy7, Biolegend). Cells were fixed and
permeablized using BD Pharminogen BRDU flow kit then stained with antiBRDU (FITC,
BD Pharminogen) and Ki67 (eF660, eBioscience). Flow cytometry was performed using the
LSR Fortessa.
Tissue processing
Tissues from perfusion-fixed Csf1r-EGFP+ mice were placed into 4% PFA for 2 hours
followed by overnight incubation in 18% sucrose at 4°C. The following day, tissues were
embedded in Tissue-Tek OCT compound and frozen in isopentane. Frozen sections were cut
(8-12um thick) at -16°C using LEICA cryostat and mounted with DAKO fluorescent
mounting medium (DAKO). The fluorescence of the EGFP was visualised using Zeiss
confocal and pictures taken under oil at x400 magnification. Additional tiled images
composed of 9 images as above were also generated. The total fluorescence was analysed
using Image J. Tissues from non-perfused mice were weighed and placed in 10% formal
saline and RNALater. The left femur after thorough muscle and tissue stripping was placed
Accep
ted m
anusc
ript

ACCEPTED ARTICLE PREVIEW
© 2014 The American Society of Gene & Cell Therapy. All rights reserved
in formalin at room temperature overnight followed by transfer into 70% ethanol the
following day.
Immunohistochemistry
For tissue histology, tissues were processed using Excelsior tissue processor (Thermo Fisher
Scientific). Sections were then placed in moulds, embedded in paraffin wax 4µm sections cut
and mounted onto slides (Superfrost Plus, Thermo Fisher Scientific). Antigen retrieval was
performed in Proteinase K (Dako S302030) for 10 minutes at 25°C. Non-specific protein
binding was blocked using 2.5% goat serum for 20 minutes at room temperature (Vector
Laboratories). Endogenous peroxidase activity was blocked using Dako REAL peroxidase
blocker (Dako REAL blocking agent S202386) for 10 minutes following antibody
incubations. Sections were incubated at room temperature for 30 minutes using rat anti-F4/80
(Serotec MCA497G) diluted 1/400 in TBST. Negative controls were carried out using rat
IgG at the same concentration as the primary antibody. Visualisation was carried out using
the secondary reagent Immpress anti rat HRP (Vector Labs MP-7444-15) for 15 minutes at
room temperature followed by DAB (Newmarket Scientific Monosan Dab substrate kit Cat
No. MON-APP177) for 10 minutes and DAB enhancer for 3 minutes (Newmarket Scientific
DAB concentrate Cat No.CO7-25). For Proliferating Cell Nuclear Antigen (PCNA) sections
were prepared as above on poly-L-lysine coated slides with antigen retrieved by boiling 10
mmol/L sodium citrate buffer followed by blocking for endogenous peroxidase activity with
3% H2O2 in methanol for 10 minutes. Immunohistochemistry was performed using PCNA
staining kit (Invitrogen, 93-1143) as per manufacturer’s instructions.
Mouse femurs were decalcified using 14% EDTA (pH7) for 3 days at room temperature,
dehydrated and embedded in wax for cutting of sections. TRAP+ cells were identified using
an Acid Phosphatase kit (Sigma-Aldrich 387) according to manufacturer’s instructions.
Accep
ted m
anusc
ript

ACCEPTED ARTICLE PREVIEW
© 2014 The American Society of Gene & Cell Therapy. All rights reserved
For detection of lysozyme in intestinal crypts, 4% paraformaldehyde-fixed sections were
permeabilized with 50% methanol for 20 minutes before immunostaining with anti-lysozyme
monoclonal antibody. Appropriate species and immunoglobulin isotype control antibody
were used as controls. Species-specific Alexa-Fluor 594 (red; Invitrogen, Paisley) secondary
antibody dye was used and sections were counterstained with Alexa-647 Phalloidin (blue;
Dako, Ely). Sections were mounted in fluorescent mounting medium (Dako, Ely) and
examined using a Zeiss LSM5 confocal microscope (Zeiss, Welwyn Garden City).
For detection of macrophages in the testis, samples were fixed in 4% paraformaldehyde at
4°C for 24 hours, and then moved to PBS, prior to analysis. Sections were deparaffinized,
rehydrated and antigen retrieved using a citrate buffer epitope retrieval method (10 Psi (0.68
atm), 125°C, 30 min, in citrate buffer pH 6.0) before blocking of endogenous peroxidase and
nonspecific binding sites. Anti-Mac 2 (Cedarlane labs, Cat. No. CL8942) was applied at
1:500 in normal horse serum, and incubated at 4°C for 24 hours, followed by incubation for
secondary detection (Vector, immpressTM, Reagent Kit, Cat. No. MP-7401), for one hour.
Samples were washed in TBS, and DAB detection (Vector, ImmPACT™ Peroxidase
Substrates, Cat. No. SK-4105) was used to resolve sites of immunolocalization, while
hematoxylin was used as counterstain. Sections were then mounted for downstream analysis.
And visualised using an Olympus Research Microscope AX70 Provis, Scotia, NY, USA,
software: AxioVision Rel.4.8).
Accep
ted m
anusc
ript
ACCEPTED ARTICLE PREVIEW
© 2014 The American Society of Gene & Cell Therapy. All rights reserved
Hormone assays
Quantification of circulating hormones was carried out as previously described49,50
.
Statistical analysis
Data on body weight changes, complete blood counts, organ weights, CSF1, CSF1-Fc and
IGF-1 ELISA were analysed using a Mann-Whitney test or Kruskal-Wallis test with Dunn’s
multiple comparison test. Results are presented as either individual value with the mean +
standard error of the mean (SEM) or group mean + SEM. All analyses were performed using
GraphPad Prism 5.0 (GraphPad Software Inc, San Diego, CA). A P value < 0.05 was
considered statistically significant.
Microarray
RNA was extracted from mouse liver using RNA Bee as per manufacturer’s instructions.
RNA integrity and quality was assessed using Following the RNA 6000 LabChip Kit
(Agilent). Samples with a RNA integrity number (RIN) greater than 7 was used for
microarray. Microarray was performed by ARK Genomics, The Roslin Institute. 50ng Total
RNA was amplified using the Nugen Pico SL kit, 2.5ug of the resulting cDNA was biotin
labelled using the Nugen Encore labelling kit using the half volume protocol. The biotin
labelled product was prepared for hybridisation according to the Nugen protocol for
Affymetrix Gene Titan hybridisation, using the Affymetrix Gene Titan Hybridization Wash
& Stain Kit for WT Array Plates (PN 901622). The samples were hybridised to Affymetrix
Mouse Gene 1.1 ST Array plates using the appropriate Hyb-Wash-Scan protocol for this plate
Accep
ted m
anusc
ript

ACCEPTED ARTICLE PREVIEW
© 2014 The American Society of Gene & Cell Therapy. All rights reserved
and the Gene Titan Hyb Wash Stain kit for the reagents (Affymetrix). Image generation and
the resulting CEL files for analysis were produced in Affymetrix® GeneChip® Command
Console® Software (AGCC) version 3.0.1. Initial QCs were performed in Expression
Console. The obtained AffymetrixCEL files were imported into the Genomics Suite software
package version 6.13.0213 (Partek software. Copyright, ©2012. Partek Inc.)
Expression data from the liver +/- CSF1-Fc study was analysed alongside that of BMDM
data generated from the same strain of mice (C57BL/6) (see BMDM method below). A
network analysis of the normalised expression data was performed using BioLayout
Express3D
. (www.biolayout.org) Using this tool, a Pearson correlation matrix of a transcript-
to-transcript profile comparison was used to filter for expression correlation relationships of r
> 0.96 across the microarray samples. Nodes within the network graph represent transcripts
and the edges between them represent expression correlations above the set threshold (r
>0.96 in this case). To identify groups of tightly co-expressed genes, the graph was clustered
using the graph-based clustering algorithm MCL set at an inflation value (which determines
the granularity of the clusters) of 1.8. Gene lists associated with the clusters were exported
for GO annotation analysis (Biological and Metabolic Processes Level-FAT) using the
DAVID (Database for Annotation, Visualization and Integrated Discovery) tool. GEO
accession No. GSE52636.
BMDM production for microarray
BMDM were prepared as above from C57BL/6J mice and cultured for 6 days in RPMI 1640
(Sigma-Aldrich, Gillingham, UK) supplemented with 10% heat inactivated fetal bovine
serum (HIFBS) (Sigma-Aldrich), 25 U/ml penicillin (Invitrogen, Paisley, UK), 25 μg/ml
streptomycin (Invitrogen), and 2 mM L-glutamine (Invitrogen) and 10,000 U/ml CSF1 on 10
Accep
ted m
anusc
ript

ACCEPTED ARTICLE PREVIEW
© 2014 The American Society of Gene & Cell Therapy. All rights reserved
cm2 bacteriological plastic plates. On day 6 cells were harvested, counted, re-suspended in
complete medium with 10,000 U/ml CSF1 and seeded into 24-well tissue culture plates at a
density of 200,000 cells/well. 24 h later, (day seven) C57BL/6 derived macrophages were
treated with 50ng/ml LPS at harvested 8h post-treatment, or harvested as untreated (control)
macrophages. GEO accession No. GSE44292
Acknowledgements
CSF1-Fc is the subject of a provisional patent held by the University of Edinburgh. Several of
the authors are named as inventors. There is no current licence. Graeme Bainbridge, Pamela
L. Boner, Greg Fici, David Garcia-Tapia, Roger A. Martin, Theodore Oliphant, John A.
Shelly, Raksha Tiwari, Thomas L. Wilson are employees of Zoetis Plc. The authors have no
additional financial interests.
The authors appreciate the efforts of Sandra Johnson for in-vivo studies. We are grateful for
the help of Dr Kyle Upton and Dr Carla Garcia-Morales for their help harvesting tissues for
this study and Forbes Howie for technical support with the hormone assays. Additionally the
R(D)SVS clinical pathology laboratory are thanked for their help with F4/80
immunohistochemistry (Neil MacIntyre) and biochemical analysis (Yvonne Crawford). Both
Dr Rob van’t Hof and Lorraine Rose from the University of Edinburgh Centre for Molecular
Medicine are acknowledged for their help and assistance performing micro-CT scan.
Accep
ted m
anusc
ript

ACCEPTED ARTICLE PREVIEW
© 2014 The American Society of Gene & Cell Therapy. All rights reserved
References
1 Hume, D. A. The mononuclear phagocyte system. Current Opinion in
Immunology 18, 49-53 (2006).
2 Hume, D. A. & Macdonald, K. P. Therapeutic applications of macrophage
colony-stimulating factor-1 (CSF-1) and antagonists of CSF-1 receptor (CSF-1R)
signaling. Blood 119, 1810-1820 (2012).
3 Pollard, J. W. Trophic macrophages in development and disease. Nat Rev
Immunol 9, 259-270 (2009).
4 Sauter, K. A. et al. Pleiotropic effects of extended blockade of CSF1R signaling in
adult mice. J Leukoc Biol (2014).
5 Sasmono, R. T. et al. A macrophage colony-stimulating factor receptor-green
fluorescent protein transgene is expressed throughout the mononuclear
phagocyte system of the mouse. Blood 101, 1155-1163 (2003).
6 MacDonald, K. P. et al. An antibody against the colony-stimulating factor 1
receptor depletes the resident subset of monocytes and tissue- and tumor-
associated macrophages but does not inhibit inflammation. Blood 116, 3955-3963
(2010).
7 Cole, D. J. et al. Phase I trial of recombinant human macrophage colony-
stimulating factor administered by continuous intravenous infusion in patients
with metastatic cancer. J Natl Cancer Inst 86, 39-45 (1994).
8 Bartocci, A. et al. Macrophages specifically regulate the concentration of their
own growth factor in the circulation. Proc Natl Acad Sci U S A 84, 6179-6183
(1987).
9 Jakubowski, A. A. et al. Phase I study of continuous-infusion recombinant
macrophage colony-stimulating factor in patients with metastatic melanoma.
Clin Cancer Res 2, 295-302 (1996).
10 Beck, A. & Reichert, J. M. Therapeutic Fc-fusion proteins and peptides as
successful alternatives to antibodies. mAbs 3, 415-416 (2011).
11 Way, J. C. et al. Improvement of Fc-erythropoietin structure and
pharmacokinetics by modification at a disulfide bond. Protein engineering,
design & selection : PEDS 18, 111-118 (2005).
Accep
ted m
anusc
ript

ACCEPTED ARTICLE PREVIEW
© 2014 The American Society of Gene & Cell Therapy. All rights reserved
12 Mancardi, D. A. et al. The high-affinity human IgG receptor FcgammaRI
(CD64) promotes IgG-mediated inflammation, anaphylaxis, and antitumor
immunotherapy. Blood 121, 1563-1573 (2013).
13 Matejkova, S. et al. Carbamylated erythropoietin-FC fusion protein and
recombinant human erythropoietin during porcine kidney ischemia/reperfusion
injury. Intensive Care Med 39, 497-510 (2013).
14 Gow, D. J. et al. Cloning and expression of porcine Colony Stimulating Factor-1
(CSF-1) and Colony Stimulating Factor-1 Receptor (CSF-1R) and analysis of the
species specificity of stimulation by CSF-1 and Interleukin 34. Cytokine (2012).
15 Kapetanovic, R. et al. Pig Bone Marrow-Derived Macrophages Resemble Human
Macrophages in Their Response to Bacterial Lipopolysaccharide. J Immunol
(2012).
16 Munn, D. H., Garnick, M. B. & Cheung, N. K. Effects of parenteral recombinant
human macrophage colony-stimulating factor on monocyte number, phenotype,
and antitumor cytotoxicity in nonhuman primates. Blood 75, 2042-2048 (1990).
17 Cohen, P. E., Hardy, M. P. & Pollard, J. W. Colony-stimulating factor-1 plays a
major role in the development of reproductive function in male mice. Mol
Endocrinol 11, 1636-1650 (1997).
18 Huynh, D. et al. Colony stimulating factor-1 dependence of paneth cell
development in the mouse small intestine. Gastroenterology 137, 136-144, 144
e131-133 (2009).
19 Meadows, N. A. et al. The expression of Clcn7 and Ostm1 in osteoclasts is
coregulated by microphthalmia transcription factor. J Biol Chem 282, 1891-1904
(2007).
20 Hume, D. A., Pavli, P., Donahue, R. E. & Fidler, I. J. The effect of human
recombinant macrophage colony-stimulating factor (CSF-1) on the murine
mononuclear phagocyte system in vivo. J Immunol 141, 3405-3409 (1988).
21 Mossadegh-Keller, N. et al. M-CSF instructs myeloid lineage fate in single
haematopoietic stem cells. Nature 497, 239-243 (2013).
22 Nakane PK, M. T., Koji T, Taniguchi Y, Izumi S, Hui L. Proliferating Cell
Nuclear Antigen (Pcna/Cyclin): Review and Some New Findings. Acta
Histochem. Cytochem. 22, 105-116 (1989).
23 Malato, Y. et al. Fate tracing of mature hepatocytes in mouse liver homeostasis
and regeneration. J Clin Invest 121, 4850-4860 (2011).
Accep
ted m
anusc
ript

ACCEPTED ARTICLE PREVIEW
© 2014 The American Society of Gene & Cell Therapy. All rights reserved
24 Jenkins, S. J. et al. IL-4 directly signals tissue-resident macrophages to
proliferate beyond homeostatic levels controlled by CSF-1. J Exp Med 210, 2477-
2491 (2013).
25 Raza, S. Barnett, M.W., Barnett-Itzhaki, Z., Amit, I., Hume, D.A. & Freeman-
TC. Analysis of the transcriptional networks underpinning the activation of
murine macrophages by inflammatory mediators. J.Leukocyte Biol. Epub April
10 (2014).
26 Hume, D. A., Summers, K. M., Raza, S., Baillie, J. K. & Freeman, T. C.
Functional clustering and lineage markers: insights into cellular differentiation
and gene function from large-scale microarray studies of purified primary cell
populations. Genomics 95, 328-338 (2010).
27 Stacey, K. J., Fowles, L. F., Colman, M. S., Ostrowski, M. C. & Hume, D. A.
Regulation of urokinase-type plasminogen activator gene transcription by
macrophage colony-stimulating factor. Mol Cell Biol 15, 3430-3441 (1995).
28 Sester, D. P. et al. Bacterial/CpG DNA down-modulates colony stimulating
factor-1 receptor surface expression on murine bone marrow-derived
macrophages with concomitant growth arrest and factor-independent survival. J
Immunol 163, 6541-6550 (1999).
29 Ravetch, J. V. & Kinet, J. P. Fc receptors. Annual review of immunology 9, 457-
492 (1991).
30 Lloyd, S. A. et al. Administration of high-dose macrophage colony-stimulating
factor increases bone turnover and trabecular volume fraction. J Bone Miner
Metab 27, 546-554 (2009).
31 Alexander, K. A. et al. Osteal macrophages promote in vivo intramembranous
bone healing in a mouse tibial injury model. J Bone Miner Res 26, 1517-1532
(2011).
32 Chang, M. K. et al. Osteal tissue macrophages are intercalated throughout
human and mouse bone lining tissues and regulate osteoblast function in vitro
and in vivo. J Immunol 181, 1232-1244 (2008).
33 Roos, F., Ryan, A. M., Chamow, S. M., Bennett, G. L. & Schwall, R. H.
Induction of liver growth in normal mice by infusion of hepatocyte growth
factor/scatter factor. The American journal of physiology 268, G380-386 (1995).
34 A promoter-level mammalian expression atlas. Nature 507, 462-470 (2014).
Accep
ted m
anusc
ript
ACCEPTED ARTICLE PREVIEW
© 2014 The American Society of Gene & Cell Therapy. All rights reserved
35 Alikhan, M. A. et al. Colony-stimulating factor-1 promotes kidney growth and
repair via alteration of macrophage responses. Am J Pathol 179, 1243-1256
(2011).
36 Michalopoulos, G. K. Liver regeneration after partial hepatectomy: critical
analysis of mechanistic dilemmas. Am J Pathol 176, 2-13 (2010).
37 Jia, C. Advances in the regulation of liver regeneration. Expert review of
gastroenterology & hepatology 5, 105-121 (2011).
38 Zerrad-Saadi, A. et al. GH receptor plays a major role in liver regeneration
through the control of EGFR and ERK1/2 activation. Endocrinology 152, 2731-
2741 (2011).
39 Akerman, P. et al. Antibodies to tumor necrosis factor-alpha inhibit liver
regeneration after partial hepatectomy. The American journal of physiology 263,
G579-585 (1992).
40 Blindenbacher, A. et al. Interleukin 6 is important for survival after partial
hepatectomy in mice. Hepatology 38, 674-682 (2003).
41 Amemiya, H., Kono, H. & Fujii, H. Liver regeneration is impaired in
macrophage colony stimulating factor deficient mice after partial hepatectomy:
the role of M-CSF-induced macrophages. J Surg Res 165, 59-67 (2011).
42 Meijer, C. et al. Kupffer cell depletion by CI2MDP-liposomes alters hepatic
cytokine expression and delays liver regeneration after partial hepatectomy.
Liver 20, 66-77 (2000).
43 Abshagen, K., Eipel, C., Kalff, J. C., Menger, M. D. & Vollmar, B. Kupffer cells
are mandatory for adequate liver regeneration by mediating hyperperfusion via
modulation of vasoactive proteins. Microcirculation 15, 37-47 (2008).
44 Thomas, J. A. et al. Macrophage therapy for murine liver fibrosis recruits host
effector cells improving fibrosis, regeneration and function. Hepatology (2011).
45 Santini, M. P. & Rosenthal, N. Myocardial regenerative properties of
macrophage populations and stem cells. Journal of cardiovascular translational
research 5, 700-712 (2012).
46 Shechter, R. et al. Infiltrating blood-derived macrophages are vital cells playing
an anti-inflammatory role in recovery from spinal cord injury in mice. PLoS
medicine 6, e1000113 (2009).
47 Luo, J. et al. Colony-stimulating factor 1 receptor (CSF1R) signaling in injured
neurons facilitates protection and survival. J Exp Med 210, 157-172 (2013).
Accep
ted m
anusc
ript

ACCEPTED ARTICLE PREVIEW
© 2014 The American Society of Gene & Cell Therapy. All rights reserved
48 Boissonneault, V. et al. Powerful beneficial effects of macrophage colony-
stimulating factor on beta-amyloid deposition and cognitive impairment in
Alzheimer's disease. Brain 132, 1078-1092 (2009).
49 McNeilly, J. R. et al. Loss of oocytes in Dazl knockout mice results in maintained
ovarian steroidogenic function but altered gonadotropin secretion in adult
animals. Endocrinology 141, 4284-4294 (2000).
50 Corker, C. S. & Davidson, D. W. A radioimmunoassay for testosterone in
various biological fluids without chromatography. Journal of steroid biochemistry
9, 373-374 (1978).
Accep
ted m
anusc
ript

ACCEPTED ARTICLE PREVIEW
© 2014 The American Society of Gene & Cell Therapy. All rights reserved
Legends to Figures
Fig. 1: Pig CSF1-Fc produces viable CSF1 dependent proliferation in-vitro and has
extended plasma half-life in-vivo
(A) CSF1-Fc molecule was produced by CSF1 joined to the hinge-CH3 region of pig IgG1a.
(B) CSF1 dependent Ba/F3pCSF1R cells were cultured in rh-CSF1, harvested, washed twice
in PBS and plated for the optimised cell viability assay with either pig CSF1 or pig CSF1-Fc
for 48 hours. Pig BM cells were flushed from an adult pig rib and placed in culture with
either pig CSF1 or pig CSF1-Fc for 48 hours. Following addition of MTT solution and
solubilisation, optical density was read at 570nm using a plate reader. Results are the average
of triplicate determinations + SEM from three experiments. (C) Three weaner pigs were
injected with either 0.5 mg/Kg or 1.2 mg/Kg pig CSF1 or Fc CSF1-Fc respectively and blood
collected at time points above for CSF1 and Fc CSF1-Fc levels to be determined by ELISA.
The mean + SEM is graphed.
Fig. 2: Effect of CSF1-Fc on body weight, organ weights, and white blood cell counts
Mice were injected with PBS or 1 µg/g pig CSF1-Fc for four days prior to sacrifice on day 5.
Blood was collected into EDTA tubes post-mortem and complete blood count assessment
performed. Graphs show the mean + SEM. Significance is indicated by *p<0.05, **p<0.01,
***p<0.001 using a Mann-Whitney test. n = 20 mice per group for weights and n = 12 mice
per group for blood cell counts (A) Body weight was recorded before each injection. Total
body weight change over the duration of the experiment was graphed (B) Liver/body weight
Accep
ted m
anusc
ript

ACCEPTED ARTICLE PREVIEW
© 2014 The American Society of Gene & Cell Therapy. All rights reserved
ratio (C) Spleen/body weight ratio (D) Total white blood cell count (E) Monocyte number (F)
Neutrophil number (G) Lymphocyte number.
Fig. 3: Effect of CSF1-Fc on tissue macrophage populations
Mice were injected with PBS or 1 µg/g pig CSF1-Fc for four days prior to sacrifice on day 5.
(A) Organs from Csf1r-EGFP+
mice were removed post-mortem and frozen in OCT prior to
cutting and examination of EGFP+ cells. Tiled images of 3x3 x400 field of view were
generated. Bar = 50µm RP=red pulp, WP=white pulp (B) The total number of EGFP+
cells
were calculated along with mean total fluorescence + SEM from five representative
images/mouse/organ. A Kruskal-Wallis test with Dunn’s multiple comparison test was
performed with significance set as *p<0.05, **p<0.01, ***p<0.001. (C) Formalin fixed liver
and spleen tissue was prepared and stained for F4/80. n = 12 mice per group.
Fig. 4: Effect of pig CSF1-Fc on male reproductive tract
Mice were injected with PBS or 1 µg/g pig CSF1-Fc for four days prior to sacrifice on day 5.
Serum was collected as well as tissue, which was fixed and processed as described in
materials and methods. Graphs show the mean + SEM. Significance is indicated by *p<0.05
using unpaired t-tests. (A) Representative sections show macrophages within the testicular
interstitium, stained with a macrophage marker, Mac2. Bar = 50µM. (B) Serum levels of
testosterone and (C) Luteinizing hormone.
Accep
ted m
anusc
ript
ACCEPTED ARTICLE PREVIEW
© 2014 The American Society of Gene & Cell Therapy. All rights reserved
Fig. 5: Effect of pig CSF1-Fc on BM cells and bone.
Mice were injected with PBS or 1 µg/g pig CSF1-Fc for four days prior to sacrifice on day 5.
The right femur from each mouse was harvested and prepared for histological examination.
All graphs show the mean + SEM. Significance is indicated by *p<0.05, **p<0.01,
***p<0.001 using a Mann-Whitney test (A) BM cells were flushed from the femurs post-
mortem and prepared for FACS as described in materials and methods. The percentage of
F4/80 and Gr1 cell populations were determined by exclusion of dead cells using Sytox blue.
n = 12 mice/group. (B) TRAP IHC was performed. Black arrows represent OCL in
epiphyseal plate. The number of positive cells in each section was counted. n = 4 mice/group.
(C) The myeloid:erythroid ratio was determined and graphed. n = 4 mice/group.
Fig. 6: Effect of pig CSF1-Fc on liver and spleen pathology
Mice were injected with PBS or 1 µg/g pig CSF1-Fc for four days prior to sacrifice on day 5.
The spleen (A) and liver (B) were removed post-mortem and placed in 10% formal saline
prior to sections being cut and stained with H&E for blind histological examination.
Representative images are shown. F=follicle, MZ=marginal zone, RP=red pulp. Arrows
represent sinusoidal infiltrate.
Fig. 7: Effect of pig CSF1-Fc on liver PCNA and Ki67 as markers of proliferation
Mice were injected with PBS or 1 µg/g pig Fc CSF1-Fc for four days prior to sacrifice on day
5. (A) Following harvest of organs and preservation in 10% formal saline, 8 µm sections
were cut and PCNA immunohistochemistry performed. Slides from each mouse were
Accep
ted m
anusc
ript
ACCEPTED ARTICLE PREVIEW
© 2014 The American Society of Gene & Cell Therapy. All rights reserved
examined for the presence of PCNA+ cells (brown colour) and a representative image is
shown. Black arrow= bi-nucleate hepatocyte, dashed arrow= cytoplasmic PCNA staining, red
arrow= Kupffer cells. MF = mitotic figure. PV = portal vein. Bar = 100µm. (B) The mean
number of PCNA+ cells + SEM is graphed. Significance is indicated by *p<0.05, **p<0.01,
***p<0.001 using a Mann-Whitney test. (C) Following PBS perfusion, the liver was
removed, digested and non-parenchymal cells were purified. Live CD45+F4/80
+ cells were
stained for BRDU and Ki67.
Fig. 8: Network analysis of liver transcripts post pig CSF1-Fc treatment
Expression data for mouse livers +/- CSF1-Fc (n=3) was analysed alongside that of
BMDM expression data (+/- LPS). (A) A network graph of transcript-to-transcript
Pearson correlation relationships was filtered to show relationships of r >0.96, resulting
in a graph of 2,555 nodes (transcripts) connected by 265,108 edges (Pearson correlation
relationships). The graph was then clustered using the MCL clustering algorithm into
groups of co-expressed genes. Nodes with the same colour belong to the same cluster of
co-expressed genes and tend to be highly connected within the network. (B) Expression
data for five clusters with each point on the graph representing an individual mouse:
Cluster 1 (690 transcripts), GO terms: oxidation-reduction; carboxylic acid catabolic
process; organic acid catabolic process; fatty acid metabolic process; cellular amino acid
catabolic process, E.g. Genes: Abcb11, Abcb4, Abcb6, Acaa1b, Acacb, Acad8, Acsf2,
Adh4, Aldh4a1, Car1, Ces1d, Ces1e, Ces1f, Ces2a, Cyp1a2, Cyp2d10, Cyp2d9, Cyp2je,
Dio1, Fitm2, Glo1, Igfals, Insr, Lipc, Nr1h4, Nr1i2, Scp2, Slc15a5, S1c17a2, S1c19a2,
Slc37a4, Slc6a9, Ugt2b5, Ugt3a1, Cluster 2 (545 transcripts), GO terms: actin filament-
based process; (actin) cytoskeleton organisation; chemotaxis; mononuclear cell
Accep
ted m
anusc
ript

ACCEPTED ARTICLE PREVIEW
© 2014 The American Society of Gene & Cell Therapy. All rights reserved
proliferation; leukocyte proliferation; leukocyte activation, E.g. Genes: Actg1, Actn1,
Anxa1, Arpc1b, Arpc2, Atp1a3, Ccl2, Ccl3, Ccl7, Ccnb1, Cd33, Cd68, Csf1r, Csf2ra,
Csf2rb, Ctsd, Ctss, Itgam, Lilra6, Mpeg1, Prkcb, S100a4, Scl11a, Slc25a4, Snx1, Cluster
3 (378 transcripts), GO terms: cell cycle; cell cycle phase/process; mitotic cell cycle; cell
division; M phase; nuclear division; mitosis, E.g. Genes: Aurka, Brca1, Bub1, Bub1b,
Ccna2, Ccnd1, Ccne1, Cdc6, Cdca2, Cdca5, Cdk4, Cenpf, Cenpn, Cenpo, Chaf1a,
Chek1, Chek2, E2f1, E2f2, Etv1, Incenp, Kif11, Kif14, Kif22, Kif23, Kif24, Mcm2, Mcm3,
Mcm5, Pola2, Pold1, Polh, Rohb, Tnfrsf21, Tubb5, Wee1, Cluster 4 (287 transcripts), GO
terms: immune response; regulation of cytokine production; defense response; response
to virus; inflammatory response; positive regulation of cytokine production, E.g. Genes:
Atf3, Casp1, Casp4, Cd14, Cd40, Cflar, Csf3r, Gbp2, Gbp3, Gbp5, H2-Ab1, H2-M3,
Ifi203, Ifi44, Ifit1, Il10, Il15, Il6, Irf5, Irf7, Mx1, Myd88, Nod1, Oas1a, Oas2, Oas3,
Psmb8, Slamf8, Slfn2, Slfn5, Stat1, Tap1, Tlr1, Tlr2, Tlr6, Tlr7, Tnf, Vasp, Cluster 5 (138
transcripts), GO terms: immune response; chemotaxis; G-protein signalling; cell
adhesion; cAMP-mediated signalling; regulation of blood pressure, E.g. Genes: Ace,
C1qa, Cd163, Cd38, Cd7, Clec4n, Cxcl14, Ear1, Emr4, Gsta1, Ifitm6, Ly6a, Pld1,
Siglec1, Slc16a5, Tagln, Trem3, Tspan15.
Accep
ted m
anusc
ript

ACCEPTED ARTICLE PREVIEW
© 2014 The American Society of Gene & Cell Therapy. All rights reserved
Fig. S1: Effect of pig CSF1-Fc on piglet growth and white blood cell counts
(A) Newborn piglets from a single litter were assorted into two groups so that each was
size-matched with a sibling and the average weight of the group was identical. Piglets
were injected (red *) on days 1, 3, 5, 7, 9 and 11 with 0.5 mg/Kg pig CSF1-Fc. Body
weight was recorded before each injection and every 2-3 days until the end of the
experiment. The mean body weight for the treatment and control groups was recorded.
(B) Blood samples were obtained from piglets 24 hours after birth before any injections
(day 1) and subsequently on days 7 (24 hours after the 3rd
injection), day 13 (24 hours
after the 6th
injection) and day 24 (cull day). Blood was collected and full blood count
including manual differential count performed. The error bars represent SEM.
Fig. S2: Effect of pig CSF1-Fc on intestine
(A) Intestines from Csf1r-EGFP+ mice were removed post-mortem and frozen in OCT
prior to cutting and examination of EGFP+ cells. Dotted line represents crypt of
Lieberkühn. (B) Mice were injected with PBS or 1 µg/g pig CSF1-Fc for four days prior
to sacrifice on day 5. PFA-fixed 5µm Cryosections of intestine were immunostained to
detect lysozyme (red) in intestinal crypts; sections were counter-stained for f-actin (blue).
Representative images are shown from n = 4 mice/group.
Accep
ted m
anusc
ript

ACCEPTED ARTICLE PREVIEW
© 2014 The American Society of Gene & Cell Therapy. All rights reserved
Figure 1
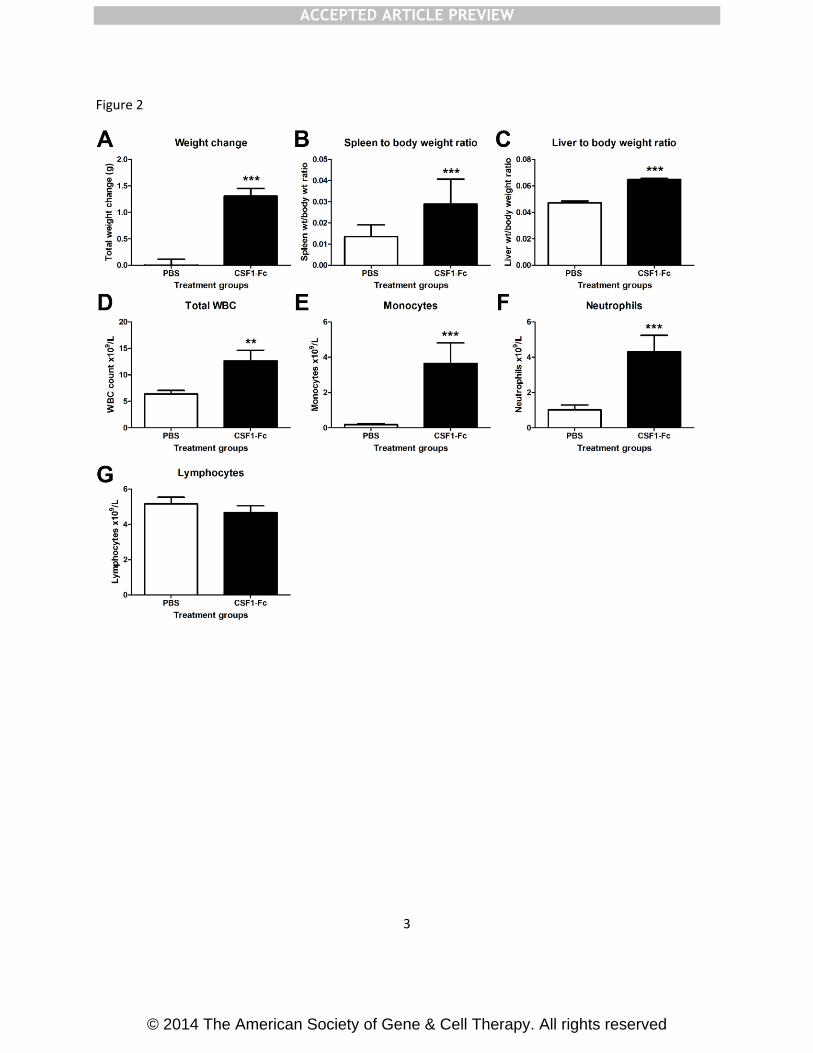
ACCEPTED ARTICLE PREVIEW
© 2014 The American Society of Gene & Cell Therapy. All rights reserved
Figure 2
3

ACCEPTED ARTICLE PREVIEW
© 2014 The American Society of Gene & Cell Therapy. All rights reserved
Figure 3
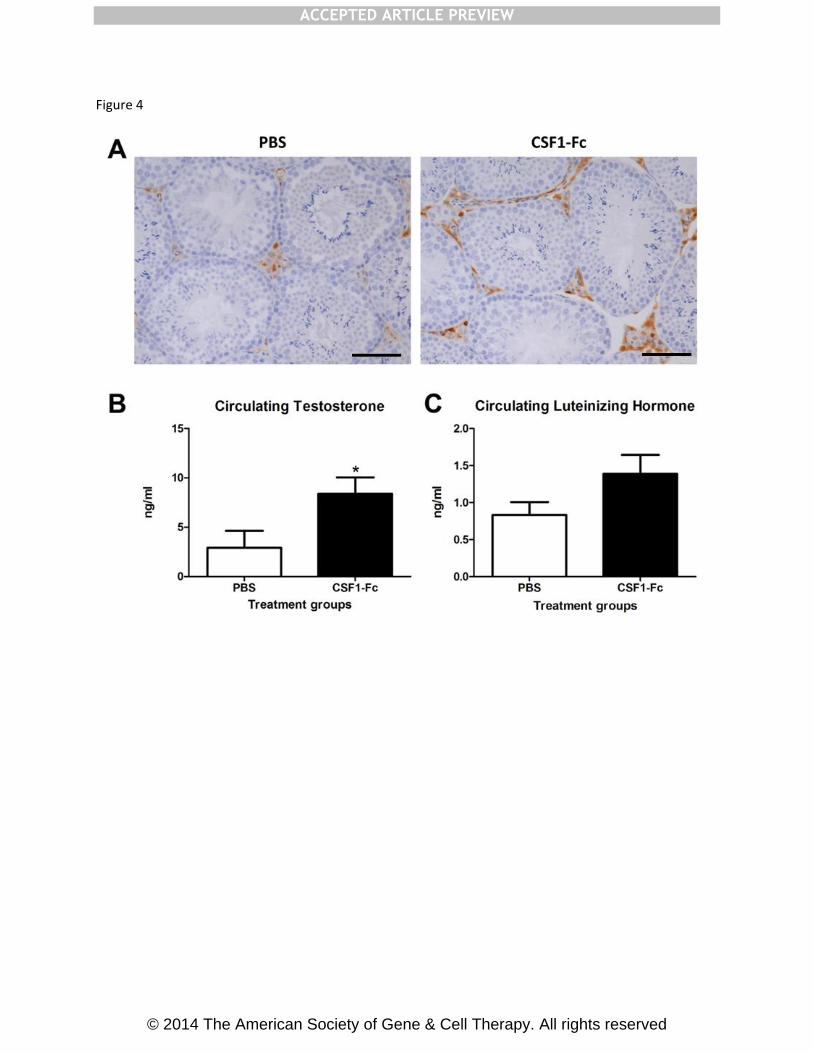
ACCEPTED ARTICLE PREVIEW
© 2014 The American Society of Gene & Cell Therapy. All rights reserved
Figure 4

ACCEPTED ARTICLE PREVIEW
© 2014 The American Society of Gene & Cell Therapy. All rights reserved
Figure 5

ACCEPTED ARTICLE PREVIEW
© 2014 The American Society of Gene & Cell Therapy. All rights reserved
Figure 6

ACCEPTED ARTICLE PREVIEW
© 2014 The American Society of Gene & Cell Therapy. All rights reserved
Figure 7

ACCEPTED ARTICLE PREVIEW
© 2014 The American Society of Gene & Cell Therapy. All rights reserved
Figure 8