CHAPTER ONE - College of Education and External Studies
49
i MAKERERE UNIVERSITY EVALUATION OF COST CONTROL TECHNIQUES AND PROFITABILITY IN MANUFACTURING FIRM CASE STUDY: CENTURY BOTTLING COMPANY LIMITED BY WASIKE DANIEL WAMUKOTA 07/U/15905/EXT SUPERVISOR: BY MR KITALE CHRIS APROJECT REPORT SUMITED IN PARTIAL FULFILMENT OF THE REQUIREMENT FOR AWARD OF DEGREE OF BACHERLORS OF COMMERCE OF MAKERERE UNIVERSITY June 2011
-
Upload
khangminh22 -
Category
Documents
-
view
6 -
download
0
Transcript of CHAPTER ONE - College of Education and External Studies
i
MAKERERE UNIVERSITY
EEVVAALLUUAATTIIOONN OOFF CCOOSSTT CCOONNTTRROOLL TTEECCHHNNIIQQUUEESS AANNDD
PPRROOFFIITTAABBIILLIITTYY IINN MMAANNUUFFAACCTTUURRIINNGG FFIIRRMM
CCAASSEE SSTTUUDDYY::
CCEENNTTUURRYY BBOOTTTTLLIINNGG CCOOMMPPAANNYY LLIIMMIITTEEDD
BBYY
WWAASSIIKKEE DDAANNIIEELL WWAAMMUUKKOOTTAA
0077//UU//1155990055//EEXXTT
SSUUPPEERRVVIISSOORR:: BBYY MMRR KKIITTAALLEE CCHHRRIISS
APROJECT REPORT SUMITED IN PARTIAL FULFILMENT OF THE
REQUIREMENT FOR AWARD OF DEGREE OF BACHERLORS OF
COMMERCE OF MAKERERE UNIVERSITY
June 2011
ii
DECLARATION
I, Wasike Daniel wamukota declare that the piece of work is my original effort and never
been submitted to any institution known to me for any award.
Signature…………………. Date………………………
Wasike Daniel wamukota
Reg No :07/u/15905/ext
iii
APROVAL
This is to certify that this report was done under my supervision
APROVED
MR KITALE CHRIS
SIGNATURE…………………….DATE……………….
iv
ABSTRACT
COST CONTOL TECHNIQUES AND PROFITABILITY IN MANUFACTURING FIRMS
The purpose of this study was to evaluate the relation between cost control techniques and
profitability in the Century Bottling Company. The study was guided by determining various
control techniques used examining profitability and analyzing the relationship between the cost
control techniques and profitability. Primary data from Century Bottling Company was used
through use of questionnaires, Secondary data by doing further reading through other authors
work by use of journal articles.
The findings revealed that there is a relationship between cost control techniques
and profitability

v
DEDICATION
This book is dedicated to my late parents, jaja glades, brothers and sisters, friends for all the love,
financial support and encouragement the have given me during my studies and entire life.
vi
ACKNOWLEDGEMENT
Many people have given me support during my entire life and time of studies. am grateful to god
for gift of life
I also thank my supervisor Mr.KITALE CHRIS for his guidance and assistance that without him
this research would have not been successful.
I thank management of coco-cola plant for information they provided to me during my research
My sincere appreciation goes to my brother Julius for all the support he has provided me and
entire family.
Lastly I thank all my friends and all those who helped me during mi study and entire life .GOD
BLESS YOU ALL
vii
TABLE OF CONTENTS
DECLARATION .............................................................................................................................. i
ABSTRACT .................................................................................................................................... iv
DEDICATION ................................................................................................................................. v
ACKNOWLEDGENT .................................................................................................................... vi
INTRODUCTION ............................................................................................................................ 1
1.1 Background to the study ............................................................................................................. 1
1.2 Statement of the problem ........................................................................................................... 2
1.3 Purpose of the Study .................................................................................................................. 2
1.4 Objectives of the Study .............................................................................................................. 2
1.5 Research Questions .................................................................................................................... 2
1.6 Scope of the Study ................................................................................................................... 3
1.6.2 Subject scope ........................................................................................................................... 3
1.6.3 Time scope .............................................................................................................................. 3
1.7 Significance of the Study ........................................................................................................... 3
CHAPTER TWO .............................................................................................................................. 4
LITERATURE REVIEW ................................................................................................................. 4
2.0 Introduction ................................................................................................................................ 4
2.1 The concept of Cost Control ...................................................................................................... 4
2.2 Various techniques used in Cost Control ................................................................................... 4
2.2.1 Standard Costing ..................................................................................................................... 4
2.2 Budgetary control ....................................................................................................................... 6
2.2.3 Other Cost Control Techniques ............................................................................................... 8
2.2.4 Profitability ............................................................................................................................ 10
2.2.5 Concept of Profitability ......................................................................................................... 11
2.2.6 Measurement of Profitability ................................................................................................ 12
CHAPTER THREE ........................................................................................................................ 15
METHODOLOGY ......................................................................................................................... 15
3.0 Introduction .............................................................................................................................. 15
3.1 Research Design ....................................................................................................................... 15
viii
3.2 Study population ...................................................................................................................... 15
3.3 Sample size ............................................................................................................................... 15
3.4 Data Type ................................................................................................................................. 15
3.5 Data Sources ............................................................................................................................. 15
3.6 Data Collection Method ........................................................................................................... 16
3.6.1 Interview ................................................................................................................................ 16
3.6.2 Questionnaires ....................................................................................................................... 16
3.7 Data Analysis ........................................................................................................................... 16
3.8 Data Presentation ...................................................................................................................... 16
3.9 Limitations to the Study ........................................................................................................... 16
CHAPTER FOUR .......................................................................................................................... 17
PRESENTATION AND INTERPRETATION OF THE FINDINGS ........................................... 17
4.1 INTRODUCTION .................................................................................................................... 17
4.2 Costs Control Techniques Used ............................................................................................... 17
4.2.1 Budgets .................................................................................................................................. 17
4.2.2 Standard Costing ................................................................................................................... 20
4.2.3 Bench Marking ...................................................................................................................... 23
4.2.4 Inventory Management ......................................................................................................... 24
4.2.5 Just in time s .......................................................................................................................... 26
4.2.6 Target Costing ....................................................................................................................... 27
4.2.7Total Quality Management (TQM) ........................................................................................ 28
CONCLUSIONS AND RECOMMENDATIONS ......................................................................... 32
5.1 Introduction .............................................................................................................................. 32
5.2 Conclusions .............................................................................................................................. 32
5.2.1Cost Control Techniques ........................................................................................................ 32
5.2.3 Profitability ............................................................................................................................ 33
5.2.4 Cost Controls techniques and Profitability ............................................................................ 33
5.3 Recommendations .................................................................................................................... 34
Areas for further research ............................................................................................................... 35
APPENDIX .................................................................................................................................... 37
1
CHAPTER ONE
INTRODUCTION
This chapter will contain the background to the study, objectives of the study, research questions,
scope of the study, and significance of the study.
1.1 Background to the study
Cost according to Lucey (1996) is the amount of expenditure actual or notional incurred on or to
a specified product or activity. Cost control in manufacturing firms means that control of all
items of expenditure by regular and frequent comparisons of actual expenditure with
predetermined standards. This means that undesirable trends away from the standard can be
detected and corrected at the early stage, (Horngren, 2002).
Profitability is the total net gains from the business, which exceeds interest on capital at current
rates (Marshall, 1998). Profit is regarded as the most common and theoretically plausible
objective of business firms to the extent that some firms take it as the only objective (Dwivedi,
2002). As per Lipsy (2006), to an accountant, profit means the difference between total receipts
and total costs of producing commodities. To the economic sense, profit means net increase in the
wealth which is cash flow plus change in the value of the firm’s assets, (Pandey, 2005).
According to Arora (1995), cost control techniques aims at improving efficiently by controlling
and reducing costs to the lowest profitable figure. If the selling price remains constant, the
reduction of costs involved results in a greater profit. When the commodities produced are sold,
cost control as a preventive function aims to prevent costs from exceeding the predetermined
target. In order to et an adequate return on capital employed, its essential to aim at minimum cost
and maximum quality bearing in mind the price charged (atty, 2000).
Coca , cola is one of the largest beverage company in the world, in Uganda it secured a century
bottling company limited during 1995, its production centers are located in Namanve Kampala
Jinja high way and other production centre in Mbarara, by 1996 the company was producing 720
cases per day and today produces around 23000 cases per day. The company employees around
2
679 employees. The company has a number of products including Coco, Fanta orange, Fanta
passion, Fanta lemon, sprite among others. The main costs incurred in production include
production, human resource, finance, procurement among others.
1.2 Statement of the problem
Cost control techniques aim at improving efficiency by controlling and reducing costs to the
lowest profitable figure Arora (1995). This implies that where there are cost controls techniques,
firms are expected to have high levels of profitability. In addition firms using the same cost
controlling techniques are expected to have the same level of profitability. However, many firms
using the same cost controlling techniques have had varying levels of profitability (Lucey, 1996).
Some have even gone to the extent of making losses while others are continuously making losses.
In the coca cola company, despite using the same cost controlling techniques, the value of profits
keep changing that is, either higher or lower. I would like to find out if there is any relationship
between cost control and profitability and what actually causes the variations in profits.
1.3 Purpose of the Study
The study was aimed at finding the relationship between cost control techniques and profitability
in manufacturing firms and recommendations were made.
1.4 Objectives of the Study
i. To determine the various cost controlling techniques used by Century Bottling
Company.
ii. To examine how profitability is measured in Century Bottling Company
iii. To analyze the relationship between cost control techniques and profitability.
1.5 Research Questions
i. What are the techniques used in cost control in Century Bottling Company?
ii. How is profitability measured in Century Bottling Company?
iii. Is there a relationship between cost controls techniques and profitability?
3
1.6 Scope of the Study
1.6.1 Geographical scope
The study will be conducted in Coca-cola plant in Namanve along Jinja Kampala highway.
1.6.2 Subject scope
The study will focus on the relationship between cost control techniques and profitability.
1.6.3 Time scope
The research will be conducted between May 2010 and June 2011.
1.7 Significance of the Study
Manufacturing firms will be able to choose the most appropriate cost control technique
which has the lowest operation costs to increase their profits
The study will widen the researcher’s knowledge on cost control techniques and
profitability.
Future researchers will use the research as a source of data. The data provided will be
secondary data.
4
CHAPTER TWO
LITERATURE REVIEW
2.0 Introduction
This chapter looks at the concept of cost control, techniques of cost control, concept of
profitability, measurement of profitability, the relationship between cost control and profitability.
2.1 The concept of Cost Control
Harper (2007) defined a cost as the value of economic resources used as a result of producing .
Horngren (2007) defined a cost as a sacrifice made for goods and services. That is, cost may
result into increase in liability or decrease in assets. Horngren (2002) looked at cost control
techniques as a control of all items of expenditure by regular and frequent comparisons of actual
expenditure with predetermined standards. He also added that the aim of this control is to detect
and correct any undesirable trend from the standard. Arora (1995) further looked at cost control
as a function of keeping costs to confirm to planned costs. Pizzey (1999), also defined cost
control as a regulation of executive action of costs of operating and undertaking, particularly
where such action is guided by cost accounting. He further said that it involves control of
material usage and material prices of wage costs, separating the effect of efficiency from rates of
pay, of maintenance and service costs of all the other items of direct expenses.
2.2 Various techniques used in Cost Control
2.2.1 Standard Costing
According to Saleemi (2001), standard costing is a technique of cost control which compares the
standard cost of each product and service with actual cost to determine the efficiency of operation
so that any action may be taken immediately.
5
Horngren (2001), said that costing is carefully predetermining of standards costs, which are target
costs that is cost should be attained. Standard costs are the building blocks of flexible budgetary
and feedback system. These costs help to build budget gauge performance, save book keeping
costs and obtain product costs. Pizzey (1999) said, standard costing is the name given to a
technique where standard costs are predetermined and subsequently compared with the actual as
recorded.
Owler (2004) said that standard costing is a method of ascertaining costs whereby statistics are
prepared to show the standard costs, the actual costs, and the difference between these costs that
is variance is there after calculated. Standard costing is a system of cost accounting which makes
use of predetermined standard costs relating to each element of cost, that is, labour, material and
overheads for each unit of product manufactured or service offered, (Batty 2000). Arora (1995)
said that standard costing is simply the name given to a technique where by standard costs are
computed and subsequently compared with actual costs to find out the difference between the
two. He further defined it as a technique of cost accounting which compares standard costs of
each product or service with the actual costs to determine the efficiency of the operations so that
any remedial action may be taken immediately.
Lucey (1996) defined standard costing as a technique which establishes predetermined estimates
of the costs of the product and services and then compare the predetermined costs with actual as
standard costs and the difference between the standard costs and actual costs is known as
variance. According to him, there are three types of standards that is, basic standards, ideal
standards and attainable standards. Basic standards are long term standards which would remain
unchanged over years. There sole role is to show trends over time for such items as material
prices, labour rates and efficiency and the effect of changing method which is a standard
established for use over a long period from which a current standard can be developed. Ideal
6
standards are standards which can be attained under the most favorable conditions with no
allowance for normal losses, waste and machine breakdown also as a potential standard.
Attainable standards are based on efficient operation conditions an attainable standards is one
which can be attained if a standard unit of work carried out efficiently, a machine properly
operated or material properly used, allowances are made for normal loses, wastes, and machine
break times.
Standard costing has been traditionally considered a very useful technique in planning and
control, product costing and performance evaluation (Sulaiman et al 2004). According to
Michelle (2005), standard costing provides a number of benefits in performance evaluation.
Standard cost variables provide feedback information designed to help managers control
operations in accord with the plans they have set. They highlight the difference between the
planned costs of a period and actual costs incurred that time.
Since mid 1980s, standard costing has come under intense criticism, (Sulaiman 2005). A number
of researchers have reported that as a result of changing manufacturing environment, the
applicability of standard costing and variance analysis is decreasing as a planning and control
technique. Contrary to the above views, empirical evidence indicates that many companies are
using standard costing for decision making product costing, planning and control and
performance evaluation both in developed and developing countries, (Lyall & Grahan 1993: Joshi
2001)
2.2 Budgetary control
Pandey (1995) went further to explain a budget as a comprehensive and consistent plan expressed
in financial forms showing operations and resources of an outputs for some specific period in our
future. Pandey also cited basic elements of a budget to include a comprehensive and consistent
programme, expresses in financial terms, a plan for the firm’s operations, resources and future
plan for a specific period.
7
For Brench (1993) he defines a budget as a reflection of management intentions while it is
referred to as quantified plan by Horrigen (1996).
Therefore a budget is a management technique used to control income and expenditures and
indicates that performance expected of employees who may therefore be used to serve as an
index for measuring of the level of profitability and fund utilization in the organization.
Frank Wood (1999) said that budgets are drawn up for control purposes. The budget is used as a
guide and not a straight jacket. The author added that budgets show the action that management is
taking to influence future events. For example if its aim is to increase sales, its shown by the sales
budget. Wayne (2003) looked at budgets as a means of motivation, that is, they provide guide to
action where various managers can know what is expected of them, provide the basis for
performance evaluation by spelling out what employees should do and when to do it and
promotes coordination and communication. Pizzey (1999) however said that budgets are based on
an anticipated actual level of costs. These controls may be applied in such businesses as in
jobbing where standard costing is impossible. Incomes and expenditures are controlled by means
of predetermined budgets.
Saleemi (2001) defined budgets as financial or qualitative statements prepared and approved
prior to a define period of time. Budgets may be prepared for departments, business as a whole or
functions such as sales and production. He said that budgetary control is a management technique
which is adopted to control the business more effectively and it involves planning in advance of
various functions of a business on how they can be controlled. Owler (2004) said that budgetary
control is the establishment of budgets relating to the responsibilities of executives tot eh
requirements of a policy and the continuous comparison of actual with budgeted results either to
8
secure by individual action the objective of that policy or to provide a basis of its revision. Lucey
(1996) said that budgetary control is a process of comparing actual results with planned results
and reporting on variations. That it involves setting a control frame work which helps expenditure
to be kept with in agreed limits. Deviations are noted so that corrective action can be taken. Frank
Woods (1999) gave various types of budgets to include; sales budgets, production budgets, raw
material budgets, cash budgets and forecasted budgets.
Arora (1995) said that budgetary control is a system of controlling costs through budgets.
Budgeting is thus only a part of budgetary control. He further defined budgetary control as the
establishment of budgets relating to the responsibility of executives of a policy and the
continuous comparison of actual with budgeted results, either to secure by individual action the
objectives of the policy or to provide a basis for its revision. Some of the objectives of budgetary
control are planning, coordination and control.
Planning is the provision of a detailed plan of action for a business over a defined period of time.
Coordination aids managers in coordinating their efforts so that objectives of the organization as
a whole are harmonized with the objectives of its parts. Control is necessary to ensure that plans
and objectives as laid down in the budget are being achieved.
2.2.3 Other Cost Control Techniques
Anthony (2003) suggested that in management of costs, the specific cost elements have to be first
identified as either controllable or non controllable. An element of costs is controllable according
to the author if the amount of cost incurred or charged to a responsibility centre is significantly
influenced by the actions of the manager of that responsibility centre. The author suggests that
non controllable costs can be changed into controllable centre. The author suggests that non
controllable costs can be changed into controllable costs by; changing the locus of responsibility
for decision, changing the management control system. Flippo (2005) gives the following as the
9
major concern in management especially of labor costs. Contract and piece rate employment. He
suggests that the control costs personnel may be recruited on contract basis to avoid redundancy,
or remuneration should be done on basing on the tasks performed. Downsizing could also be
another technique for cost control Kazloswki et al (2003) says that downsizing refers to
deliberate decision to reduce the work force hence improving organizational performance. Stoner
(2000) said that downsizing is the reduction of the number of workforce in order to attain
efficiency, productivity and quality which can help maintain a profit level acceptable to the
shareholders.
Employee profit sharing (Flippo, 2005) states that an element in which employees may be paid in
relation to the profits at a predetermined rate, they will be motivated to work harder hence
leading to lower costs. Variable compensation of individuals or groups. The costs incurred to
reward the labor force should vary according to the contribution in terms of benefits of the
organization.
Morse (2002) suggested the following approaches in management and control of costs.
Coordination of the development of the budget, designing, installing and maintaining the cost
accounting system, preparing reports for external users, internal auditing, accumulating and
analyzing performance reports, providing information for special decisions. The author states that
to be able to perform the above, there is need to have a position of the controller who has the
overall responsibility for all cost accounting activities within the organizations. Morality (2004)
suggested the following considerations; Proper matching of the cost data gathered according to
the period costs centre products, eliminate the effect of changing prices, the objective to predict
and manage future costs, any changes in the prices of inputs should be incorporated in the data
collected, eliminate un representative periods, balance the cost benefit of more accurate
10
information, ensure constant technology depending on the rate of technological changes in the
firm, the accountant should vary data of few or old years.
2.2.4 Profitability
Profitability is a measure of return your business creates after operating and other expenses are
subtracted from income. An income statement helps in determining if your enterprise ideal will
be profitable. It records all business receipts and expenses related to the years of production,
expenses are then subtracted from receipts the resulting amount being the net income. Net income
is the measure of profitability and represents the return on the operators labour management time
and equity. When an annual income statement is prepared, the progress of the business can easily
be analyzed plus it becomes an indispensable part of your business plan or loan proposal. It also
helps in preparation of a tax plan (Lossel, 2000).
Dwivid (2002) says that profit means different things to different people. It means differently to
businesses, accountants, tax collectors, workers and economists. In business, profit is the income
accruing to equity shareholders in the sense that as wages accrues to labor, rent accrues of rental
assets and interest accrues to money lenders. To an accountant, profit means the difference
between the total revenues and total costs. He also said that for all practical purposes, profit or
business income means profits in the accounting sense plus allowances. That is, Total revenue –
Total costs = profit.
According to Jennings (2000), profitability is the relationship between profit and the resources
employed in earning it. A subsidiary measure of profitability is the relationship between gross
profit and net profit to sales while Salmonson (2002) stated that profitability is the ability of the
firm to operate income and it is reflected in the firm’s income statement. Generally, all those
interested in the affairs of the firm are interested especially in its profitability.
11
According to Edward (2004), profitability is a very important measure of a firm’s operating
success. There are two areas of concern when judging profitability; The relationship in the
income statement that indicates the firm’s ability to recover costs and expenses. The relationship
of income to various balance sheet measures that indicates the firm’s relative availability to earn
income on assets employed.
2.2.5 Concept of Profitability
Profitability is a measure of return your business creates after operating and other expenses are
subtracted from income to obtain net income. Net income is a measure of profitability and
represents the return on the operator’s labor management time and equity. (Lossel, 2000). Income
is the payment you receive in exchange for your goods and services. Steps followed to ensure that
all sources of income are included in the income statement. In the income statement, estimate the
value of your sales, include the size of the business you plan to operate in, adjust for changes in
accounts receivables, adjust for changes in productive inventory, an estimate of the future recipes
in a series of income statement for future years must be developed to analyze profitability
(Robinson, 1999).
While estimating expenses, the following steps are followed, Estimate what will it cost to
produce your goods and services, include the operating and depreciation, adjust for accounts
receivables, and account for changes in inventory by counting your inventory supplies and
charging their cost the year in which they are used not in the year they were bought. Calculate
labor and marketing expenses, assess the share of shared costs, estimate future expenses by
preparing a series of income statements in order to assess profitability of the firm, (Robinson
1999)
12
Further more, the income statement can be used to perform sensitivity analysis. What effect do
changes in prices and yields have on profitability? By completing this financial analysis on your
proposed business, you are able to have information needed to make an informed business
decision. It is important to note that several other methods can be used to determine whether a
business opportunity is profitable or not and these include; payback period, net profit value,
average rate of return on investment among others (Lossel, 2000).
2.2.6 Measurement of Profitability
Pizzey (1999) said that profits can be measured in terms of gross profit. He also noted that the
primary aim of a commercial business is to make profits and that this profit is the excess of
selling price and costs. Any excess the producer derives depends on the ability to control costs.
Gross profit = Selling price – (production costs + Selling costs + Administrative costs) Vanhorne
(2002) quoted that profits can be measured in different ways depending on how it’s perceived. He
said that profit is deemed realized when managers invest proceeds in treasury bills and that this
would imply, profits had been maximized and that the excess can be reinvested. Arora (1995)
said that profits can be measured by subtracting total costs of materials, labour and other
operating expenses. This compared with total revenue which is a result of output and price. It
implies that if total revenue exceeds total revenue which is a result of output and price. It implies
that if total revenue exceeds total costs, net profits will be realized.
Dwividi (2002) said that profits can be measured in terms of net profits. He said that profit is got
from excess of revenue over production costs including both manufacturing and overhead
expenses. If a positive difference is got, net profit is realized and if a negative difference is got,
net loss is realized. Pandey (2008) noted that profit measurement is one of the most difficult
issues facing the accounting profession. He said that this can be handled by applying Generally
13
Acceptable accounting Principles (GAAP). The principles are compromised by lack of financial
support and political influence. Profits can be measured in terms of gross or net profits or total
profits in that the total profit is the same as the gross profit. Fama & French (2000) used the ratio
of earnings before interest but after taxes over assets as a measure of profitability. They
forecasted profitability with year by year gross section regressions and they used the average
slopes and their time series standard errors to draw inferences.
Smith (1998) said that profitability metrics measure the return that the firm’s owners receive
from their investments. He advocated for the use of return on assets and net profit margin to pain
a firm’s profit picture. Besides, cost drivers can also be used in forecasting profitability at various
levels of operations to enable the firm plan its future activities better since the cost drivers and
their relationship to costs should be known prior to planning in order to predict the profitability.
The simplest way of exploiting the knowledge of cost drivers and their associated costs is to use a
unit level analysis. This type of analysis although it has many limiting features, allows a
framework for organizing data for planning (Dale Robinson, 2000).
The profit associated with a product is equal to its total revenue minus total costs and revenues
are function of unit selling price multiplied with volume of sales. This can be used to create
contribution margin income statements for the firm. This type of income statement which
separates the company cost by behavior at the unit level (fixed or variable), can be used to focus
attention on the contribution margin at various levels of production. In this type of statement,
fixed manufacturing costs are excluded from inclusion in margin calculation where as variable
selling and administration costs are included in the margin calculation (Lossel, 2000).
14
2.3 Relationship between Cost Control and Profitability
Dwividi (2002) profit is got by;
Total revenue – (Wage + rent + cost of material)
The total of variables in brackets is the total costs. This implies that total revenue – total costs is
equal to profitability. He also added that if these costs are maintained at the lowest, there will be
profit maximization but if they are not maintained at the lowest, there will be limited profits.
Manufacturing firms end up with losses when total costs exceed total revenue.
Horngren (2002) said that variable costs are subject to various degrees of control where when
effective control is put in place, there is increase in profitability. Where poor controls techniques
are in place, there is decrease in the level of profitability which affects the performance of
manufacturing firms. Pandey (2005) said that also management affects profitability. In case of
good effective management, its possible to realize high profits and low profits incase higher
prices are charged due to high demand, higher profits are got.
15
CHAPTER THREE
METHODOLOGY
3.0 Introduction
This chapter contains the research design, data type, data sources, data collection method, data
analysis, data presentation, limitation to the study.
3.1 Research Design
The researcher used a descriptive, analytical and narrative research design determining the
relationship between cost control and profitability in manufacturing firms.
3.2 Study population
The researcher used Coca-cola as the case study and the main population composed of employees
and management of Coca-cola plant.
3.3 Sample size
The researcher used 50 employees as his sample size.
3.4 Data Type
The data involved both secondary and primary data. The secondary data was theorized by
different authors on the study of the variables. The primary is the one I got from century bottling
company in Namanve.
3.5 Data Sources
Data was obtained from both secondary and primary sources. Secondary source include, journal
articles, online sources, text books, primary data was obtained from century bottling company in
Namanve. This was from the management accountant.
16
3.6 Data Collection Method
3.6.1 Interview
Interviewing of different people within Coca-cola plant helped the researcher to get the necessary
information.
3.6.2 Questionnaires
Open ended questions which required the respondents to fill also helped the researcher to acquire
the necessary information.
3.7 Data Analysis
Data was analyzed by making references to the available existing literature and comparing it with
data collected from Coca Cola Company. Also comparisons and contrasts were made in relation
to work in different scholars.
3.8 Data Presentation
Data was presented in a narrative form which clearly brought out the relationship between cost
control techniques and profitability in manufacturing firms. A few computations were included
too.
3.9 Limitations to the Study
I encountered the following problems during the study.
Inadequate time frame required for a detailed study. Had to study, revise for exams and
also carry out the research. I over came this carrying out part of the research during
holidays.
Difficulty in accessing the required information from century bottling company. Had to
wait for some two weeks and also, values, of sales and profits would not be disclosed.
The resources were a constraint due to limited finances for printing and typing the work,
transport daily to century bottling company.
17
CHAPTER FOUR
PRESENTATION AND INTERPRETATION OF THE FINDINGS
4.1 INTRODUCTION
This chapter covers different costs control techniques used, measurement of profitability and
analysis of the findings from cocoa cola.
4.2 Costs Control Techniques Used
Technique one:
4.2.1 Budgets
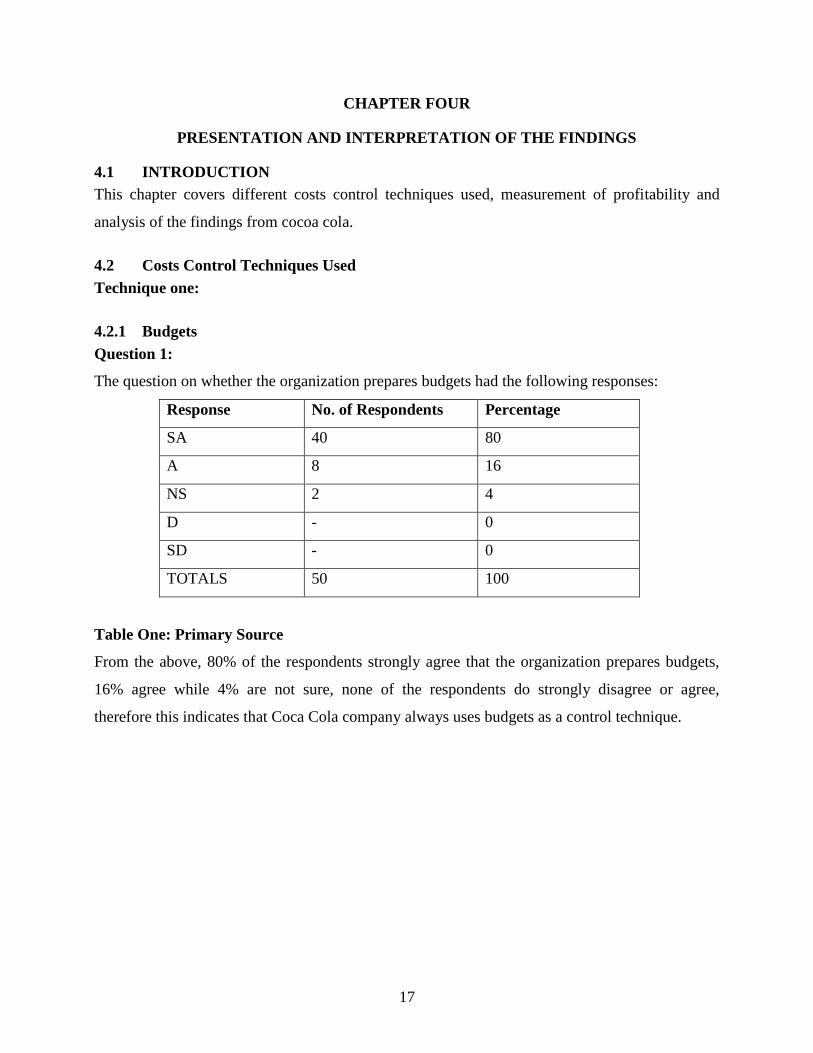
Question 1:
The question on whether the organization prepares budgets had the following responses:
Response No. of Respondents Percentage
SA 40 80
A 8 16
NS 2 4
D - 0
SD - 0
TOTALS 50 100
Table One: Primary Source
From the above, 80% of the respondents strongly agree that the organization prepares budgets,
16% agree while 4% are not sure, none of the respondents do strongly disagree or agree,
therefore this indicates that Coca Cola company always uses budgets as a control technique.
18
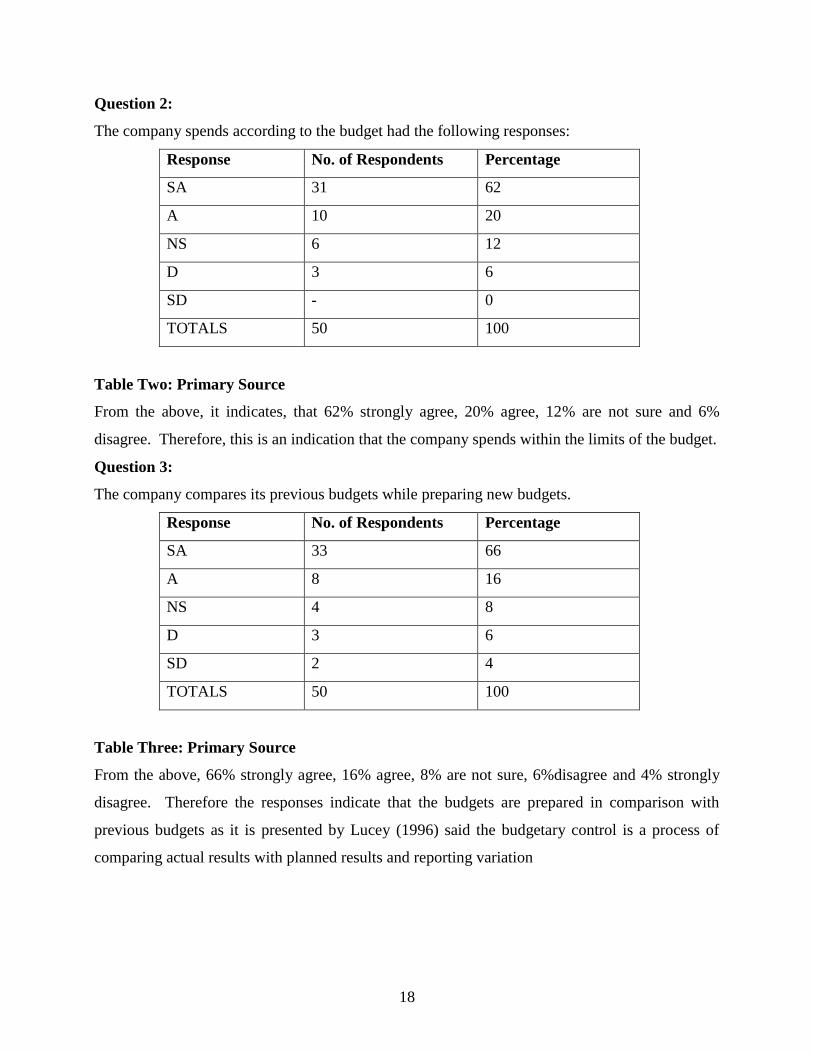
Question 2:
The company spends according to the budget had the following responses:
Response No. of Respondents Percentage
SA 31 62
A 10 20
NS 6 12
D 3 6
SD - 0
TOTALS 50 100
Table Two: Primary Source
From the above, it indicates, that 62% strongly agree, 20% agree, 12% are not sure and 6%
disagree. Therefore, this is an indication that the company spends within the limits of the budget.
Question 3:
The company compares its previous budgets while preparing new budgets.
Response No. of Respondents Percentage
SA 33 66
A 8 16
NS 4 8
D 3 6
SD 2 4
TOTALS 50 100
Table Three: Primary Source
From the above, 66% strongly agree, 16% agree, 8% are not sure, 6%disagree and 4% strongly
disagree. Therefore the responses indicate that the budgets are prepared in comparison with
previous budgets as it is presented by Lucey (1996) said the budgetary control is a process of
comparing actual results with planned results and reporting variation
19
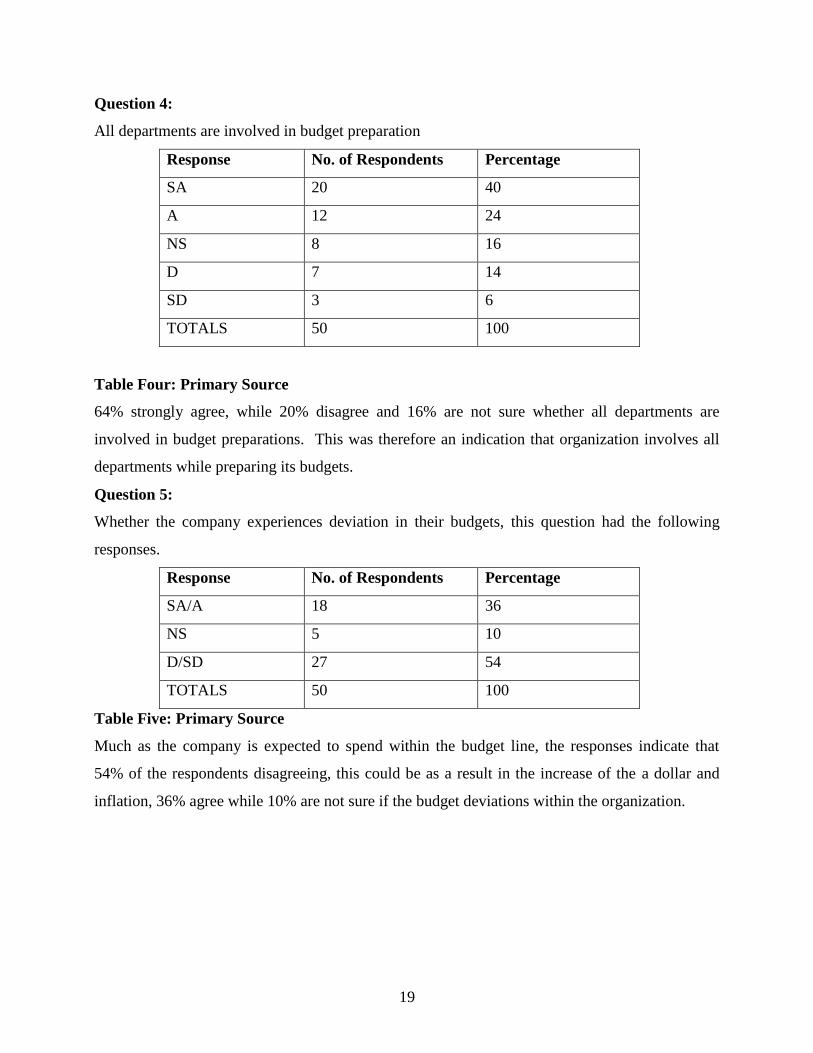
Question 4:
All departments are involved in budget preparation
Response No. of Respondents Percentage
SA 20 40
A 12 24
NS 8 16
D 7 14
SD 3 6
TOTALS 50 100
Table Four: Primary Source
64% strongly agree, while 20% disagree and 16% are not sure whether all departments are
involved in budget preparations. This was therefore an indication that organization involves all
departments while preparing its budgets.
Question 5:
Whether the company experiences deviation in their budgets, this question had the following
responses.
Response No. of Respondents Percentage
SA/A 18 36
NS 5 10
D/SD 27 54
TOTALS 50 100
Table Five: Primary Source
Much as the company is expected to spend within the budget line, the responses indicate that
54% of the respondents disagreeing, this could be as a result in the increase of the a dollar and
inflation, 36% agree while 10% are not sure if the budget deviations within the organization.
20
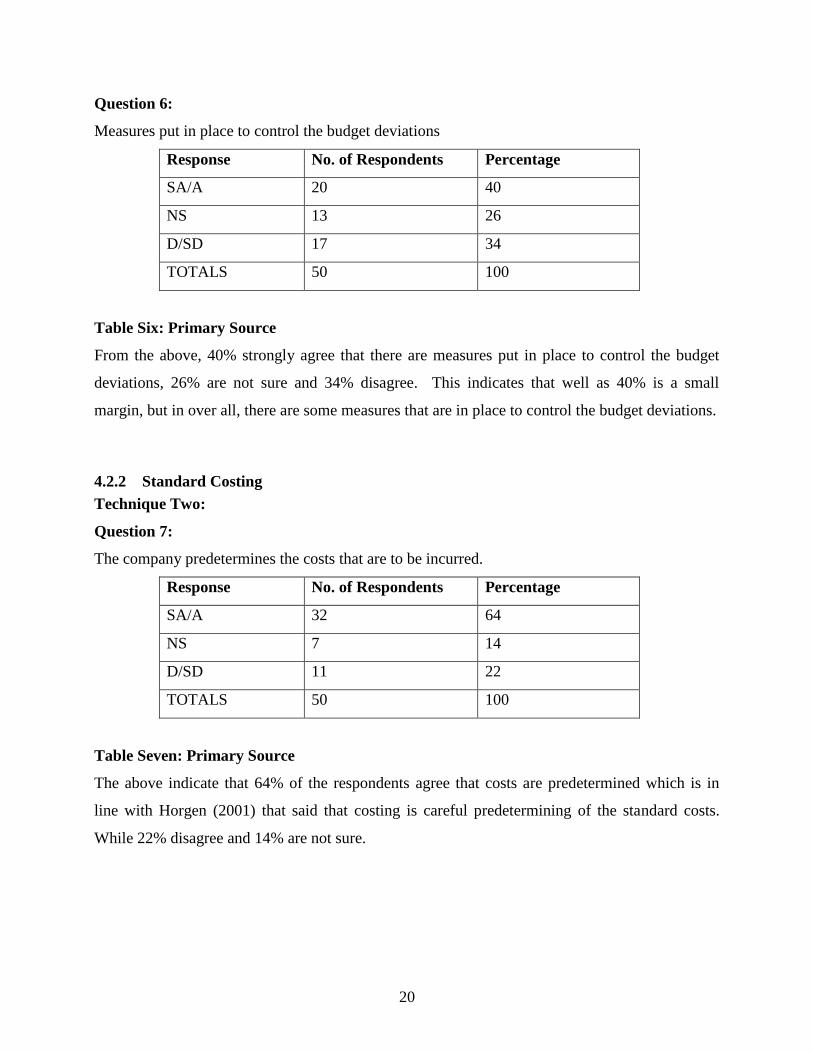
Question 6:
Measures put in place to control the budget deviations
Response No. of Respondents Percentage
SA/A 20 40
NS 13 26
D/SD 17 34
TOTALS 50 100
Table Six: Primary Source
From the above, 40% strongly agree that there are measures put in place to control the budget
deviations, 26% are not sure and 34% disagree. This indicates that well as 40% is a small
margin, but in over all, there are some measures that are in place to control the budget deviations.
4.2.2 Standard Costing
Technique Two:
Question 7:
The company predetermines the costs that are to be incurred.
Response No. of Respondents Percentage
SA/A 32 64
NS 7 14
D/SD 11 22
TOTALS 50 100
Table Seven: Primary Source
The above indicate that 64% of the respondents agree that costs are predetermined which is in
line with Horgen (2001) that said that costing is careful predetermining of the standard costs.
While 22% disagree and 14% are not sure.
21
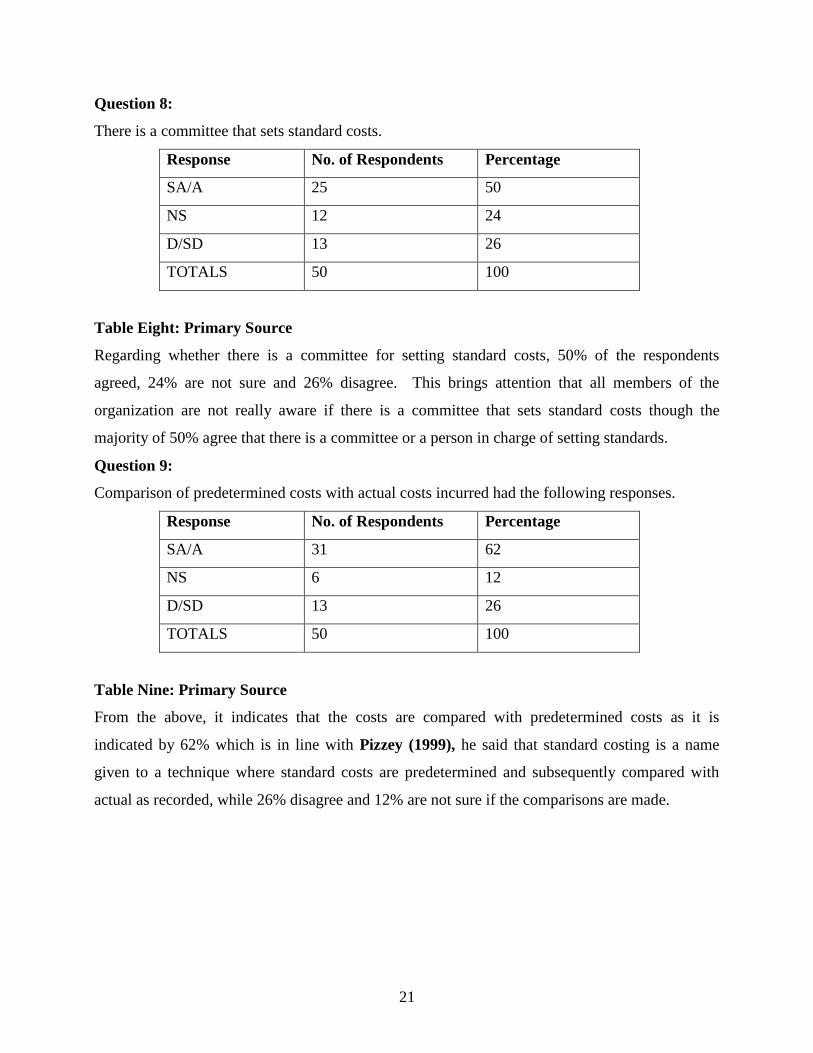
Question 8:
There is a committee that sets standard costs.
Response No. of Respondents Percentage
SA/A 25 50
NS 12 24
D/SD 13 26
TOTALS 50 100
Table Eight: Primary Source
Regarding whether there is a committee for setting standard costs, 50% of the respondents
agreed, 24% are not sure and 26% disagree. This brings attention that all members of the
organization are not really aware if there is a committee that sets standard costs though the
majority of 50% agree that there is a committee or a person in charge of setting standards.
Question 9:
Comparison of predetermined costs with actual costs incurred had the following responses.
Response No. of Respondents Percentage
SA/A 31 62
NS 6 12
D/SD 13 26
TOTALS 50 100
Table Nine: Primary Source
From the above, it indicates that the costs are compared with predetermined costs as it is
indicated by 62% which is in line with Pizzey (1999), he said that standard costing is a name
given to a technique where standard costs are predetermined and subsequently compared with
actual as recorded, while 26% disagree and 12% are not sure if the comparisons are made.
22
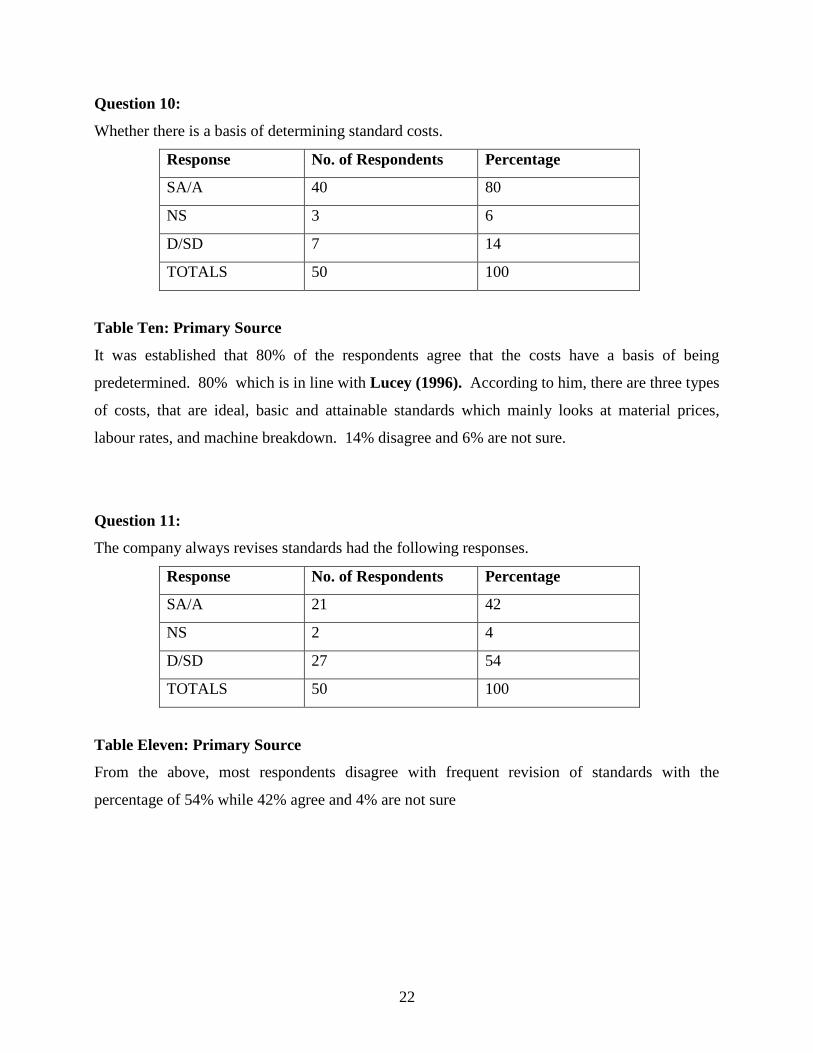
Question 10:
Whether there is a basis of determining standard costs.
Response No. of Respondents Percentage
SA/A 40 80
NS 3 6
D/SD 7 14
TOTALS 50 100
Table Ten: Primary Source
It was established that 80% of the respondents agree that the costs have a basis of being
predetermined. 80% which is in line with Lucey (1996). According to him, there are three types
of costs, that are ideal, basic and attainable standards which mainly looks at material prices,
labour rates, and machine breakdown. 14% disagree and 6% are not sure.
Question 11:
The company always revises standards had the following responses.
Response No. of Respondents Percentage
SA/A 21 42
NS 2 4
D/SD 27 54
TOTALS 50 100
Table Eleven: Primary Source
From the above, most respondents disagree with frequent revision of standards with the
percentage of 54% while 42% agree and 4% are not sure
23
4.2.3 Bench Marking
Technique Three:
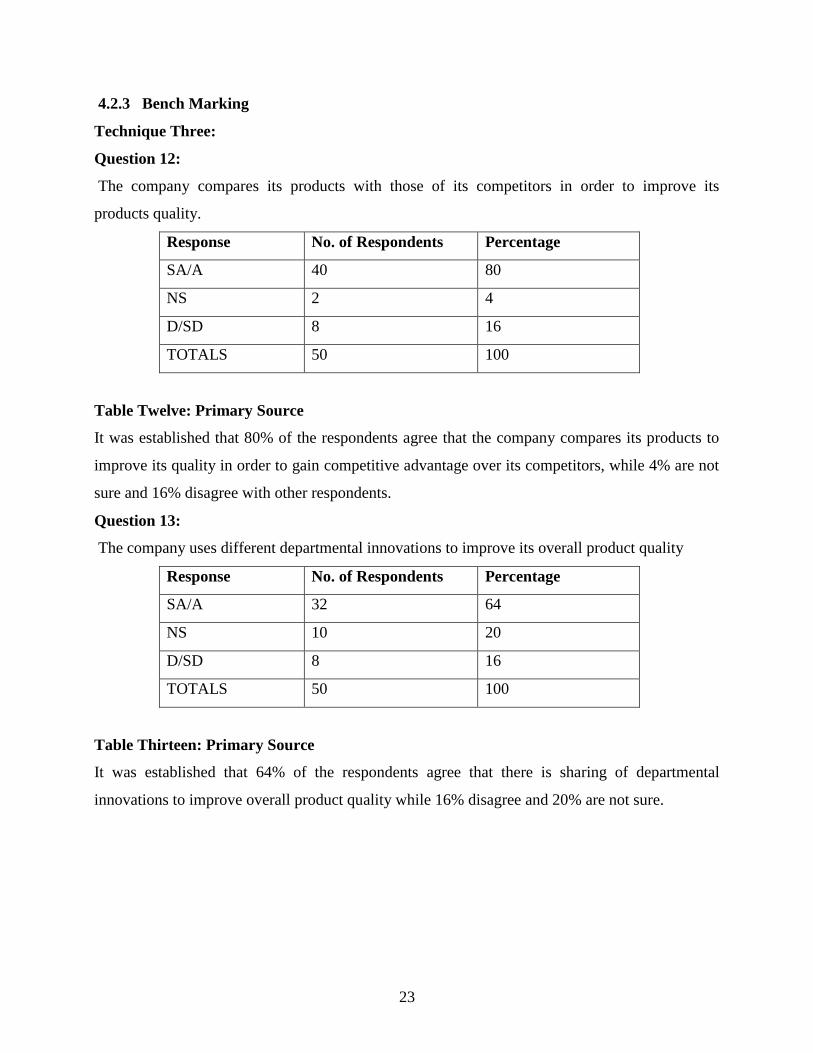
Question 12:
The company compares its products with those of its competitors in order to improve its
products quality.
Response No. of Respondents Percentage
SA/A 40 80
NS 2 4
D/SD 8 16
TOTALS 50 100
Table Twelve: Primary Source
It was established that 80% of the respondents agree that the company compares its products to
improve its quality in order to gain competitive advantage over its competitors, while 4% are not
sure and 16% disagree with other respondents.
Question 13:
The company uses different departmental innovations to improve its overall product quality
Response No. of Respondents Percentage
SA/A 32 64
NS 10 20
D/SD 8 16
TOTALS 50 100
Table Thirteen: Primary Source
It was established that 64% of the respondents agree that there is sharing of departmental
innovations to improve overall product quality while 16% disagree and 20% are not sure.
24
4.2.4 Inventory Management
Technique Four:
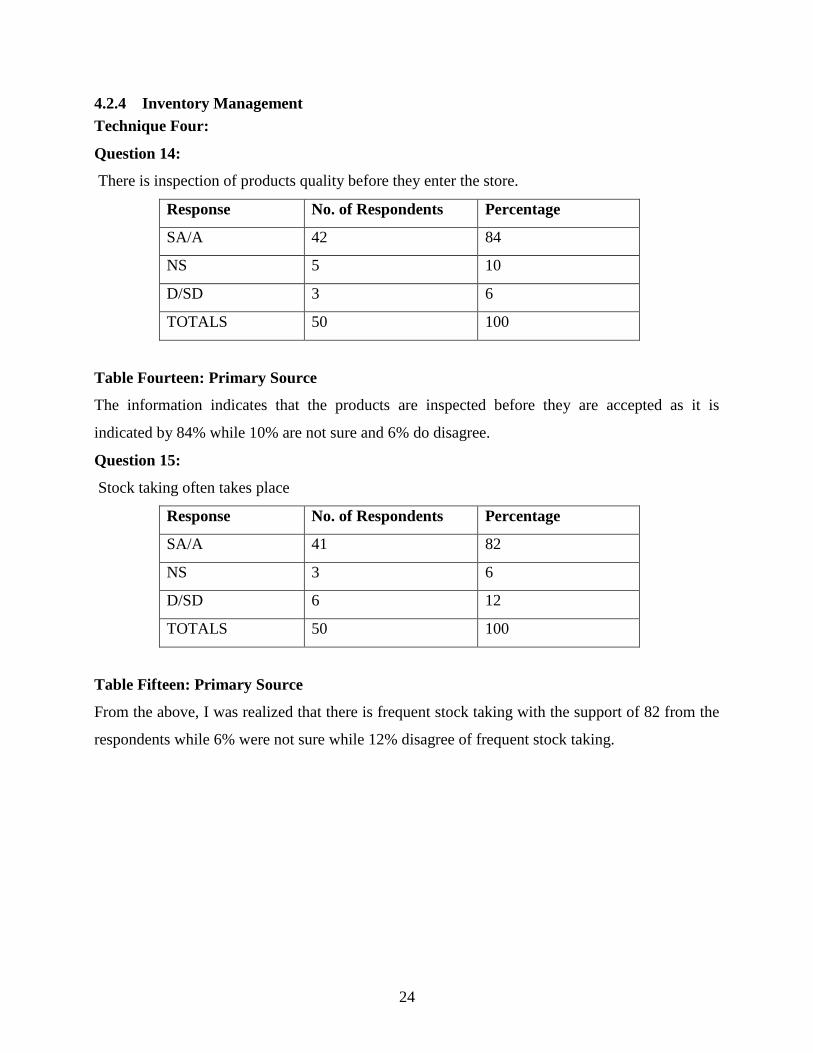
Question 14:
There is inspection of products quality before they enter the store.
Response No. of Respondents Percentage
SA/A 42 84
NS 5 10
D/SD 3 6
TOTALS 50 100
Table Fourteen: Primary Source
The information indicates that the products are inspected before they are accepted as it is
indicated by 84% while 10% are not sure and 6% do disagree.
Question 15:
Stock taking often takes place
Response No. of Respondents Percentage
SA/A 41 82
NS 3 6
D/SD 6 12
TOTALS 50 100
Table Fifteen: Primary Source
From the above, I was realized that there is frequent stock taking with the support of 82 from the
respondents while 6% were not sure while 12% disagree of frequent stock taking.
25
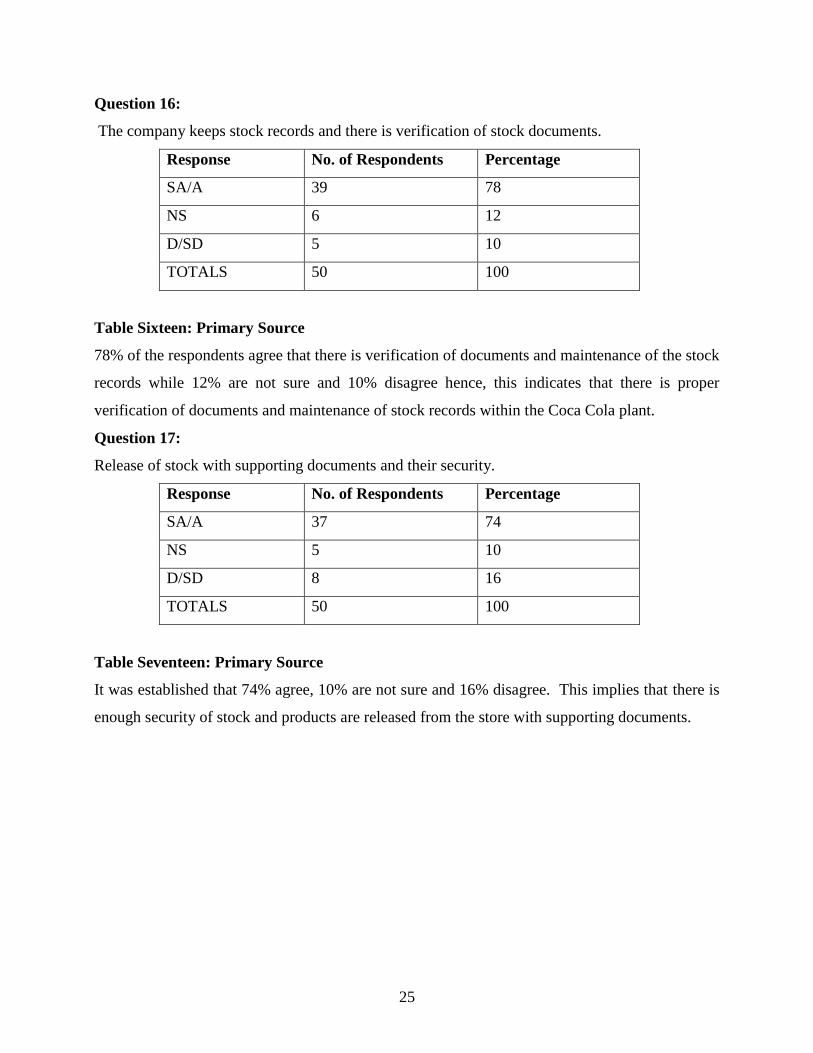
Question 16:
The company keeps stock records and there is verification of stock documents.
Response No. of Respondents Percentage
SA/A 39 78
NS 6 12
D/SD 5 10
TOTALS 50 100
Table Sixteen: Primary Source
78% of the respondents agree that there is verification of documents and maintenance of the stock
records while 12% are not sure and 10% disagree hence, this indicates that there is proper
verification of documents and maintenance of stock records within the Coca Cola plant.
Question 17:
Release of stock with supporting documents and their security.
Response No. of Respondents Percentage
SA/A 37 74
NS 5 10
D/SD 8 16
TOTALS 50 100
Table Seventeen: Primary Source
It was established that 74% agree, 10% are not sure and 16% disagree. This implies that there is
enough security of stock and products are released from the store with supporting documents.
26
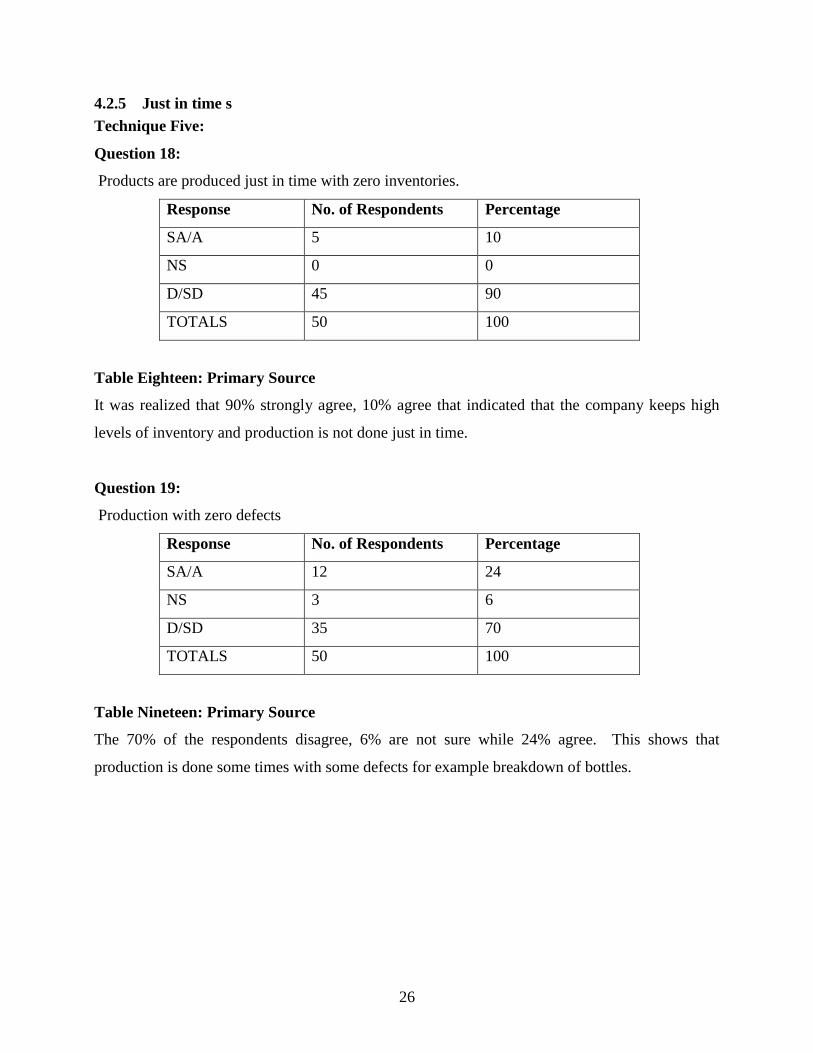
4.2.5 Just in time s
Technique Five:
Question 18:
Products are produced just in time with zero inventories.
Response No. of Respondents Percentage
SA/A 5 10
NS 0 0
D/SD 45 90
TOTALS 50 100
Table Eighteen: Primary Source
It was realized that 90% strongly agree, 10% agree that indicated that the company keeps high
levels of inventory and production is not done just in time.
Question 19:
Production with zero defects
Response No. of Respondents Percentage
SA/A 12 24
NS 3 6
D/SD 35 70
TOTALS 50 100
Table Nineteen: Primary Source
The 70% of the respondents disagree, 6% are not sure while 24% agree. This shows that
production is done some times with some defects for example breakdown of bottles.
27
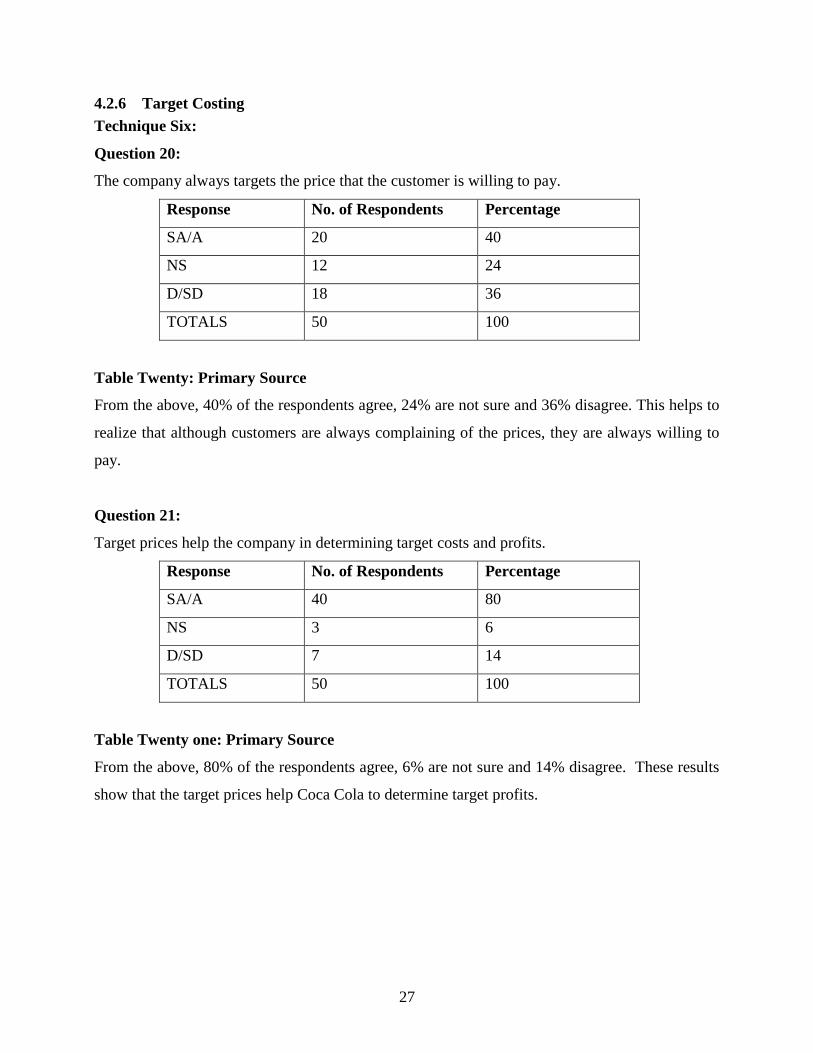
4.2.6 Target Costing
Technique Six:
Question 20:
The company always targets the price that the customer is willing to pay.
Response No. of Respondents Percentage
SA/A 20 40
NS 12 24
D/SD 18 36
TOTALS 50 100
Table Twenty: Primary Source
From the above, 40% of the respondents agree, 24% are not sure and 36% disagree. This helps to
realize that although customers are always complaining of the prices, they are always willing to
pay.
Question 21:
Target prices help the company in determining target costs and profits.
Response No. of Respondents Percentage
SA/A 40 80
NS 3 6
D/SD 7 14
TOTALS 50 100
Table Twenty one: Primary Source
From the above, 80% of the respondents agree, 6% are not sure and 14% disagree. These results
show that the target prices help Coca Cola to determine target profits.
28
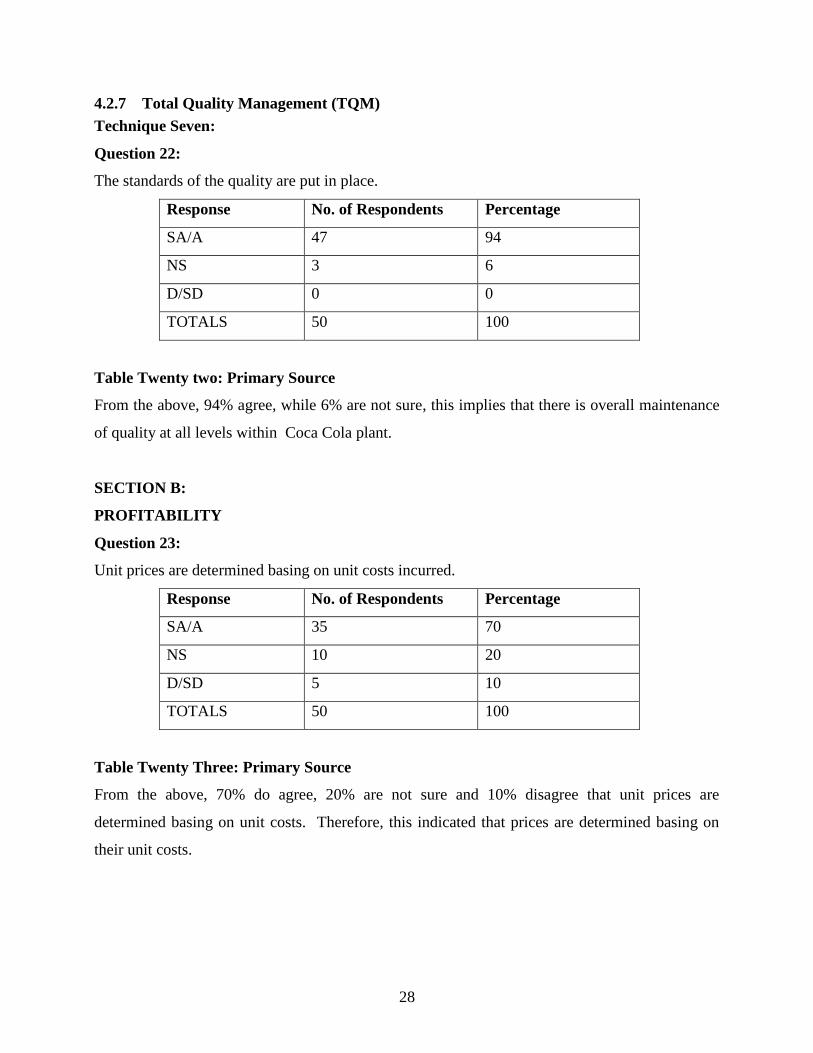
4.2.7 Total Quality Management (TQM)
Technique Seven:
Question 22:
The standards of the quality are put in place.
Response No. of Respondents Percentage
SA/A 47 94
NS 3 6
D/SD 0 0
TOTALS 50 100
Table Twenty two: Primary Source
From the above, 94% agree, while 6% are not sure, this implies that there is overall maintenance
of quality at all levels within Coca Cola plant.
SECTION B:
PROFITABILITY
Question 23:
Unit prices are determined basing on unit costs incurred.
Response No. of Respondents Percentage
SA/A 35 70
NS 10 20
D/SD 5 10
TOTALS 50 100
Table Twenty Three: Primary Source
From the above, 70% do agree, 20% are not sure and 10% disagree that unit prices are
determined basing on unit costs. Therefore, this indicated that prices are determined basing on
their unit costs.
29
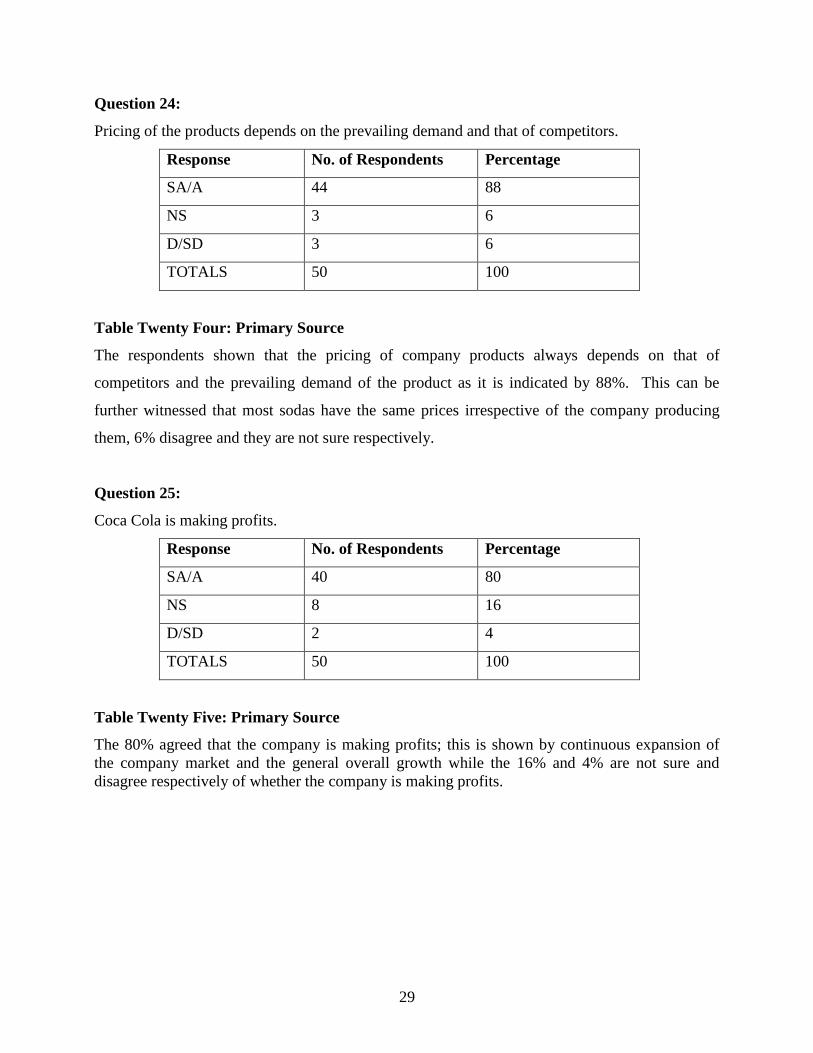
Question 24:
Pricing of the products depends on the prevailing demand and that of competitors.
Response No. of Respondents Percentage
SA/A 44 88
NS 3 6
D/SD 3 6
TOTALS 50 100
Table Twenty Four: Primary Source
The respondents shown that the pricing of company products always depends on that of
competitors and the prevailing demand of the product as it is indicated by 88%. This can be
further witnessed that most sodas have the same prices irrespective of the company producing
them, 6% disagree and they are not sure respectively.
Question 25:
Coca Cola is making profits.
Response No. of Respondents Percentage
SA/A 40 80
NS 8 16
D/SD 2 4
TOTALS 50 100
Table Twenty Five: Primary Source
The 80% agreed that the company is making profits; this is shown by continuous expansion of
the company market and the general overall growth while the 16% and 4% are not sure and
disagree respectively of whether the company is making profits.
30
SECTION C
RELATIONSHIP BETWEENs CONTROL TECHNIQUES AND PROFITABILITY.
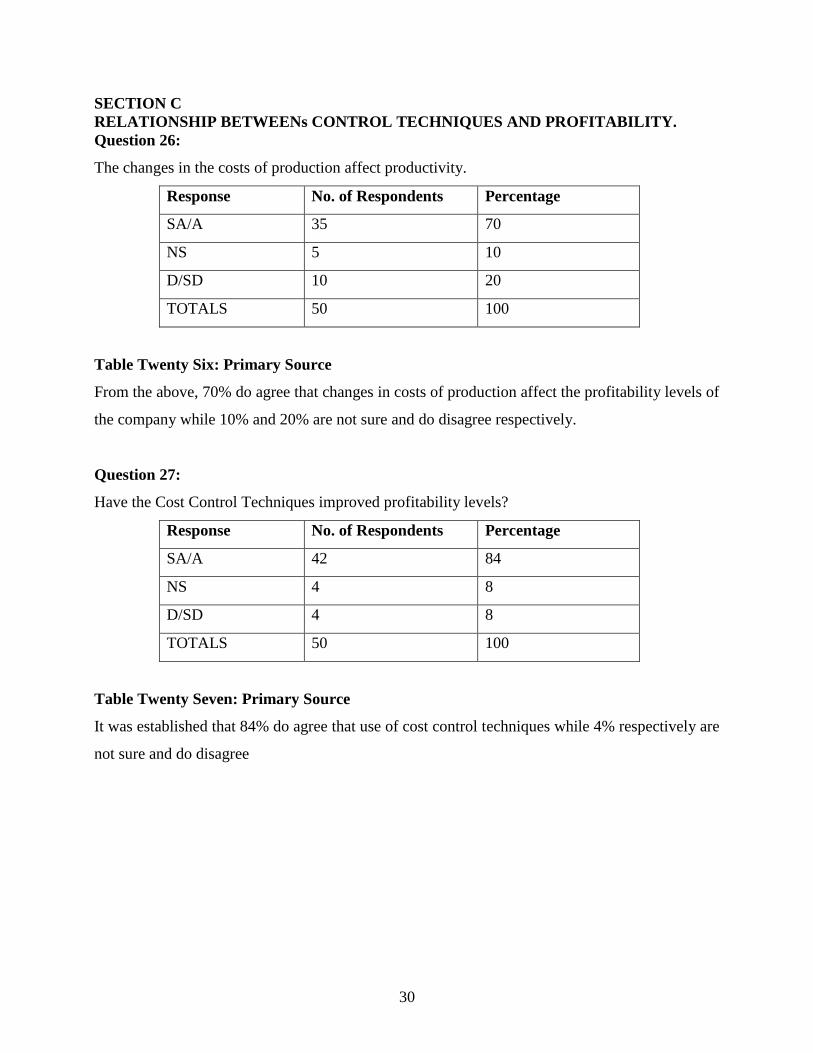
Question 26:
The changes in the costs of production affect productivity.
Response No. of Respondents Percentage
SA/A 35 70
NS 5 10
D/SD 10 20
TOTALS 50 100
Table Twenty Six: Primary Source
From the above, 70% do agree that changes in costs of production affect the profitability levels of
the company while 10% and 20% are not sure and do disagree respectively.
Question 27:
Have the Cost Control Techniques improved profitability levels?
Response No. of Respondents Percentage
SA/A 42 84
NS 4 8
D/SD 4 8
TOTALS 50 100
Table Twenty Seven: Primary Source
It was established that 84% do agree that use of cost control techniques while 4% respectively are
not sure and do disagree
31
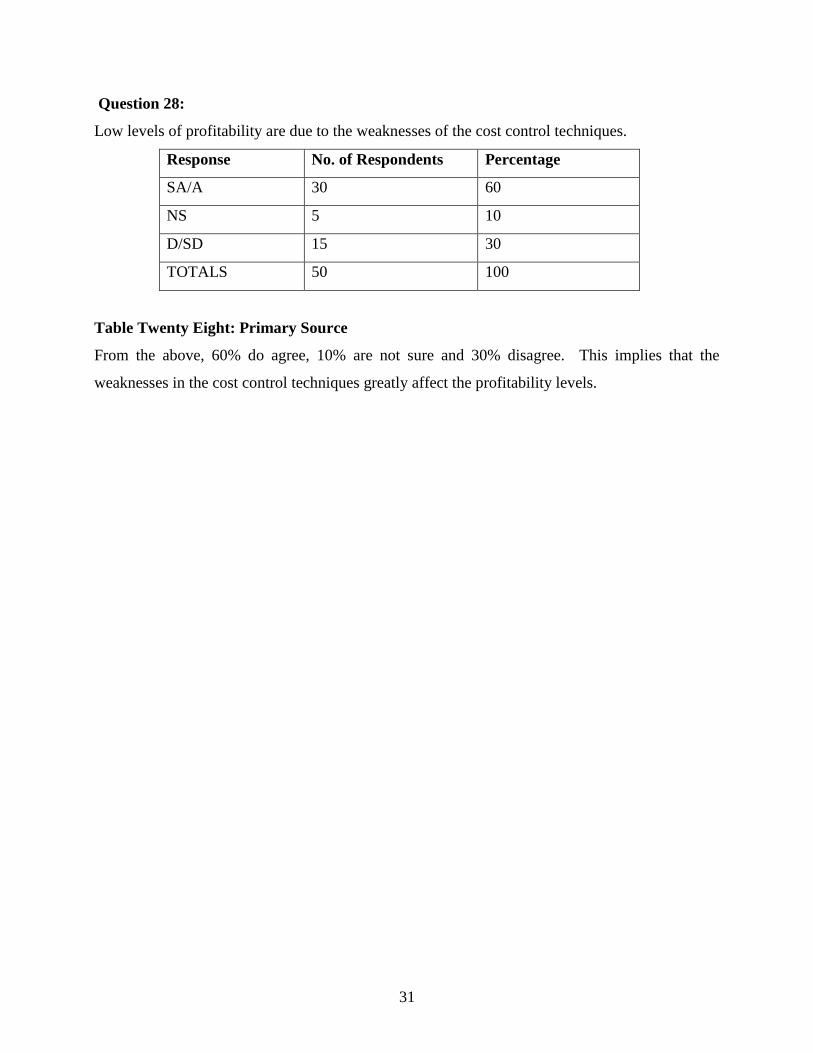
Question 28:
Low levels of profitability are due to the weaknesses of the cost control techniques.
Response No. of Respondents Percentage
SA/A 30 60
NS 5 10
D/SD 15 30
TOTALS 50 100
Table Twenty Eight: Primary Source
From the above, 60% do agree, 10% are not sure and 30% disagree. This implies that the
weaknesses in the cost control techniques greatly affect the profitability levels.
32
CHAPTER FIVE
CONCLUSIONS AND RECOMMENDATIONS
5.1 Introduction
This chapter presents conclusions and recommendations that are based on findings of the
study. It also covers any other areas of study.
5.2 Conclusions
5.2.1Cost Control Techniques
A company should put in place an effective cost control technique depending on its nature,
activities, resources and ability. With these techniques in place, desired results are expected to be
achieved.
The cost control techniques used should be applicable in all sections of the organization for
example all departments and all members should be accountable in order to achieve a high and
desired level of profitability.
Having cost controlling techniques in place helps to protect the company’s assets, management of
risk, and maintenance of proper accounting records, prevention and detection of fraud as well as
enhancing accountability. Effective cost controls also promote compliance with the law and
regulations and therefore lead to efficiency in operations.
33
5.2.3 Profitability
Profitability of any business organization can be determined by use pf various profitability ratios
and methods depending on the most appropriate method for a particular organization. These
ratios and methods clearly indicate the return on capital employed or invested in the business.
An organization should set a particular level of profitability it aims to achieve for a particular
period. This will keep it focused on achieving that level of profitability hence fulfilling
organizational goals.
5.2.4 Cost Controls techniques and Profitability
Cost control techniques if effective and well designed enhance the level of profitability in the
firm. Cost controls assist in detection and prevention of fraud and errors. This therefore mitigates
fraudulent practices of managers leading to an improved level of profitability of the organization.
Techniques like budgets help the organization to plan in advance the costs and level of
profitability expected to be earned.
Effective cost control techniques like budgets, benchmarking, target costing, inventory
management, standard costing, downsizing, and use of tenders among others create a favorable
environment for an organization to maximize its business advantage and make more profit thus
enhancing the return on their investor’s funds.
It can therefore be concluded that cost control techniques and profitability have a direct
relationship. If controls are in place, a better level of profitability is achieved and where there are
not costs controls or where controls are ineffective, a low level of profitability will always be
experienced.
34
5.3 Recommendations
To improve on cost controls, manufacturing firms should focus their effort on the following;
The control environment, risk assessment, control activities, information, communication and
monitoring.
Segregation of duties, authorization of organizational structure internal and external audits,
physical restrictions, and documents should be put in place and emphasized to enhance efficiency
and effectiveness.
A policy should be put in place for heavy punishment for employees who manipulate the cost
control techniques in place.
Firms should always ensure that they achieve profits with in the requirements set for example in
the budgets. This can be done by computing various profitability ratios to find out whether they
are operating efficiently so as to identify the gaps and set ways to close them.
The organization’s level of profitability should always be matched with the efficiency of cost
control techniques and the causes of deviations or gaps determined. To compute the level of
profitability, analytical procedures should be utilized that is, those based on two or more fiscal
periods.
35
Areas for further research
The relationship between internal controls and organizational performance.
The effect of Auditing in the accounting Profession.
The relationship between record keeping and financial reporting
36
REFERENCES
Arora M. N (1995), Cost accounting principles and practice, 4th
edition, Vikas publishing house.
Batty (2000), Cost and management accounting for students, 3rd
edition, Institute of cost and
management accounting.
Dwividi (2002), Managerial Economics, New Delhi, 6th
edition, Vikas Publishing House.
Frank Woods and Alan Sangster (1999), Business Accounting two, 8th
edition, Printice Hall.
Harper. W.M (2007), Cost and Management Accounting, London, Low priced edition,
Macdonald and Evans publisher.
Horngren. T. Charles (2002), cost accounting A Managerial emphasis, USA, 9th
edition, Printice
Hall International.
Lucey. T. (1996), Costing, London, 5th
edition, ELST publication
Lipsey. G. Richard (2006), Introduction to Positive Economics, London, 6th
edition.
Lossel (2000), Auditing, 7th
edition, Letts educational London.
Morse. J. Wayne (2003), Cost Accounting, Processing, Evaluating, Classifying cost data, 2nd
edition.
Marshall (1998), Principles of Economics, London, 8th
edition, Macmillan.
Owler. L. W and Brown J. W. (2004), Wheldon’s Cost Accounting, London, 6th
edition . Pitman
publisher
Pizzey Allan (1999), Principles of cost accountancy a managerial perspective, India, 5th
edition,
Macmillan.
Pandey. I. M (2005), Financial Management, New Delhi, 7th
edition, Dow Jones Jrwin Chicopee.
Stoner. A. F James etal (2000) Management, India, 6th edition, Prentice Hall.
Saleemi. N. A (2001), Financial Accounting, Nairobi, 2nd
edition, Salami publications.
Van Horne (2002), Fundamentals of Financial Management, London, 7th
edition, Prentice Hall.
37
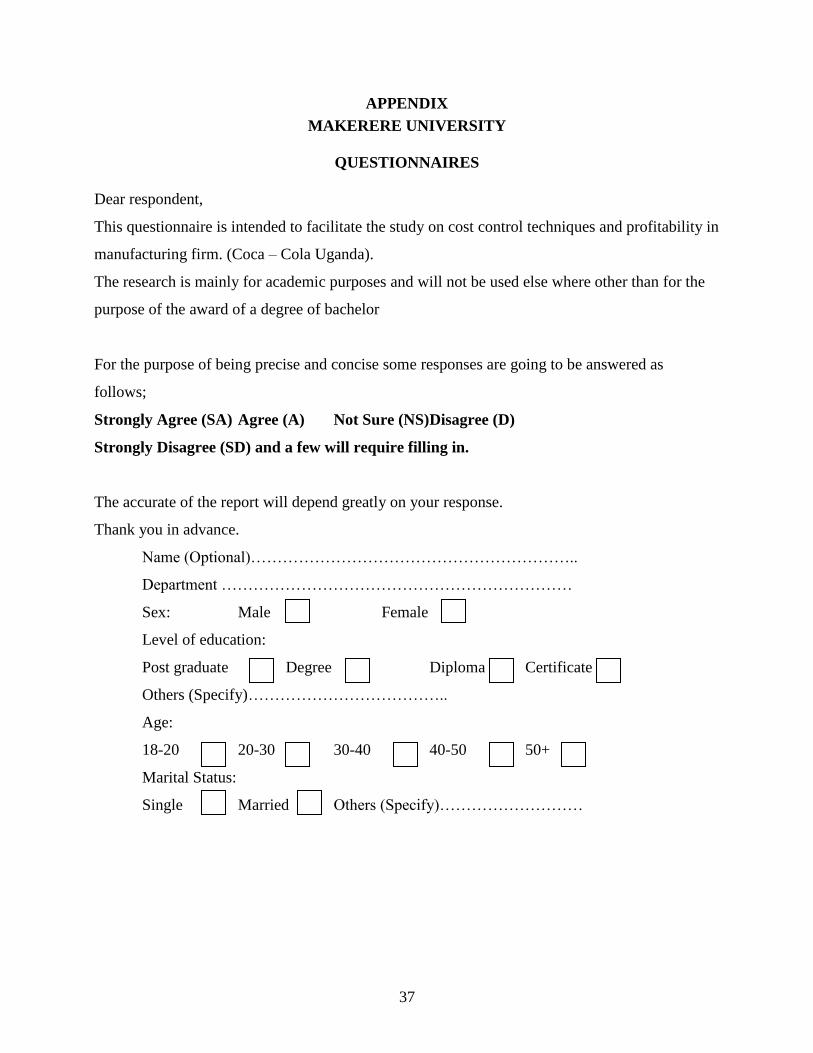
APPENDIX
MAKERERE UNIVERSITY
QUESTIONNAIRES
Dear respondent,
This questionnaire is intended to facilitate the study on cost control techniques and profitability in
manufacturing firm. (Coca – Cola Uganda).
The research is mainly for academic purposes and will not be used else where other than for the
purpose of the award of a degree of bachelor
For the purpose of being precise and concise some responses are going to be answered as
follows;
Strongly Agree (SA) Agree (A) Not Sure (NS)Disagree (D)
Strongly Disagree (SD) and a few will require filling in.
The accurate of the report will depend greatly on your response.
Thank you in advance.
Name (Optional)……………………………………………………..
Department …………………………………………………………
Sex: Male Female
Level of education:
Post graduate Degree Diploma Certificate
Others (Specify)………………………………..
Age:
18-20 20-30 30-40 40-50 50+
Marital Status:
Single Married Others (Specify)………………………
38
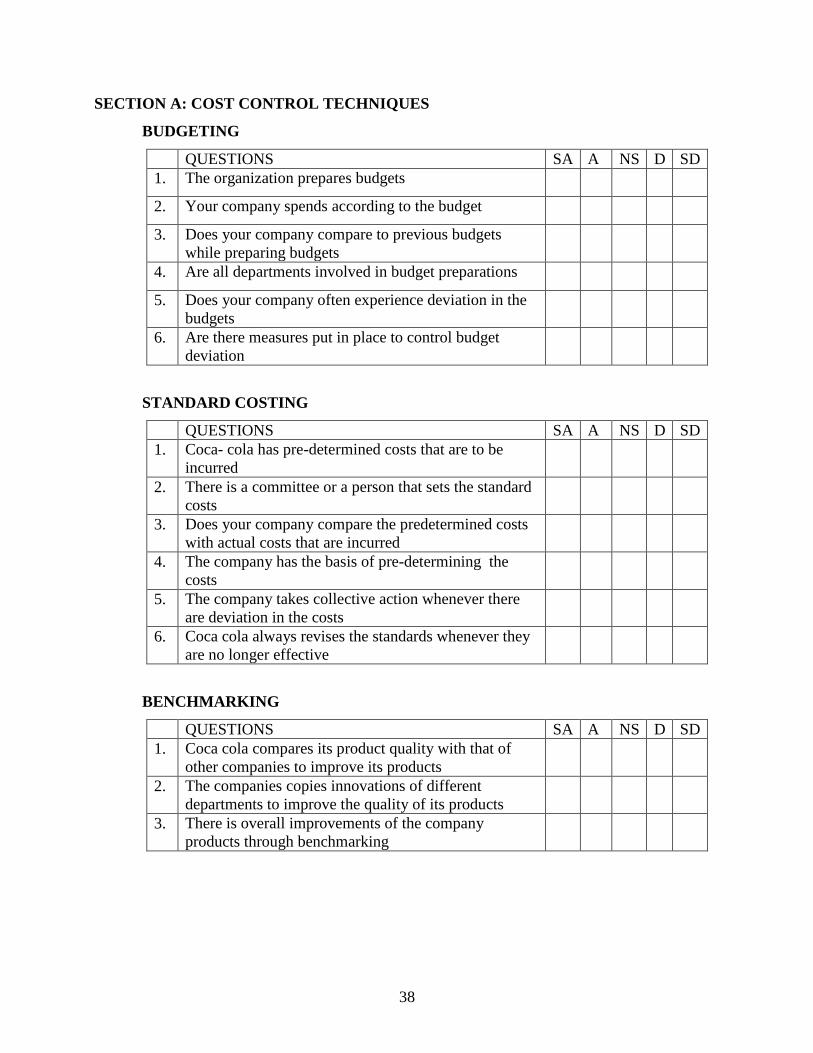
SECTION A: COST CONTROL TECHNIQUES
BUDGETING
QUESTIONS SA A NS D SD
1. The organization prepares budgets
2. Your company spends according to the budget
3. Does your company compare to previous budgets
while preparing budgets
4. Are all departments involved in budget preparations
5. Does your company often experience deviation in the
budgets
6. Are there measures put in place to control budget
deviation
STANDARD COSTING
QUESTIONS SA A NS D SD
1. Coca- cola has pre-determined costs that are to be
incurred
2. There is a committee or a person that sets the standard
costs
3. Does your company compare the predetermined costs
with actual costs that are incurred
4. The company has the basis of pre-determining the
costs
5. The company takes collective action whenever there
are deviation in the costs
6. Coca cola always revises the standards whenever they
are no longer effective
BENCHMARKING
QUESTIONS SA A NS D SD
1. Coca cola compares its product quality with that of
other companies to improve its products
2. The companies copies innovations of different
departments to improve the quality of its products
3. There is overall improvements of the company
products through benchmarking
39
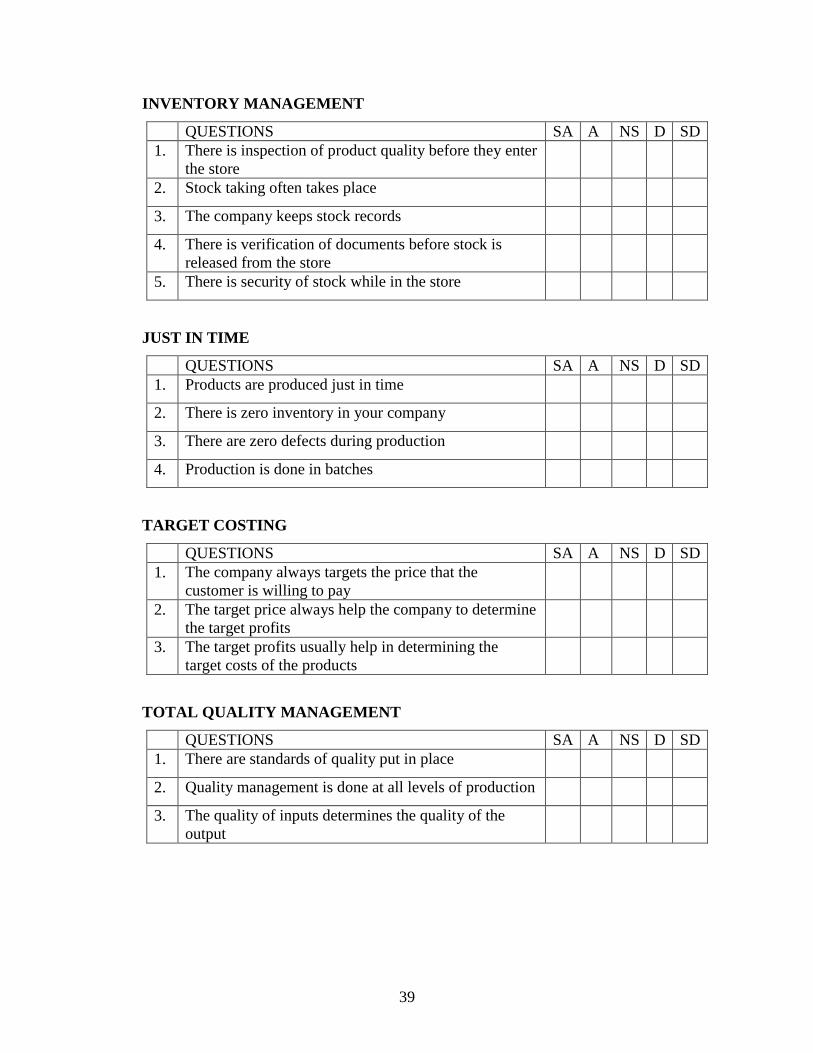
INVENTORY MANAGEMENT
QUESTIONS SA A NS D SD
1. There is inspection of product quality before they enter
the store
2. Stock taking often takes place
3. The company keeps stock records
4. There is verification of documents before stock is
released from the store
5. There is security of stock while in the store
JUST IN TIME
QUESTIONS SA A NS D SD
1. Products are produced just in time
2. There is zero inventory in your company
3. There are zero defects during production
4. Production is done in batches
TARGET COSTING
QUESTIONS SA A NS D SD
1. The company always targets the price that the
customer is willing to pay
2. The target price always help the company to determine
the target profits
3. The target profits usually help in determining the
target costs of the products
TOTAL QUALITY MANAGEMENT
QUESTIONS SA A NS D SD
1. There are standards of quality put in place
2. Quality management is done at all levels of production
3. The quality of inputs determines the quality of the
output
40
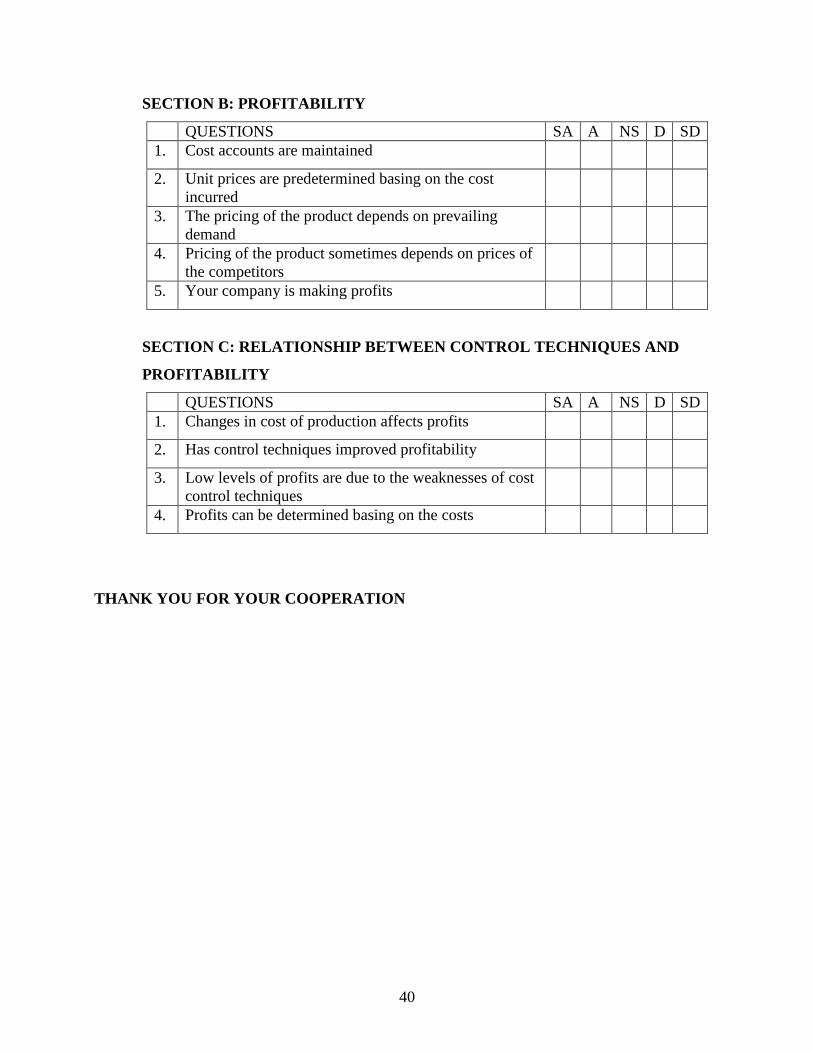
SECTION B: PROFITABILITY
QUESTIONS SA A NS D SD
1. Cost accounts are maintained
2. Unit prices are predetermined basing on the cost
incurred
3. The pricing of the product depends on prevailing
demand
4. Pricing of the product sometimes depends on prices of
the competitors
5. Your company is making profits
SECTION C: RELATIONSHIP BETWEEN CONTROL TECHNIQUES AND
PROFITABILITY
QUESTIONS SA A NS D SD
1. Changes in cost of production affects profits
2. Has control techniques improved profitability
3. Low levels of profits are due to the weaknesses of cost
control techniques
4. Profits can be determined basing on the costs
THANK YOU FOR YOUR COOPERATION

1