WG III contribution to the Sixth Assessment Report CHAPTER 16
Upload
khangminh22Category
view
0download
0
43
CHAPTER III
RESEARCH METHOD
This chapter presents the research method. It focuses the method
used in conducting this research which covers research design, population
and sample, research instrument, data collecting method and data analysis.
A. Research Design
Research is process that is the step combination that is done
systematically and logically to get the solution of the problems or to get the
answer from the certain question (Suryabarata : 2003).
Ary et al (2006 : 325) states “Experimental research design is to
enable researcher to estimate the effect of an experimental treatment”.
Experimental research can be done in the laboratory, in the class and in the
field. In this study, the experimental research is done in the class with
taking students as population. A researcher chooses the design to determine
the validity of conclusions can be drawn from the study.
According to Prasetyo (2008 : 160) there are many kinds of
experimental research design that is Classical experimental design, Pre
experimental design and Quasi experimental and special design.
Experimental research is unique in two very important respects. It is the
only type of research that directly attempts to influence a particular
44
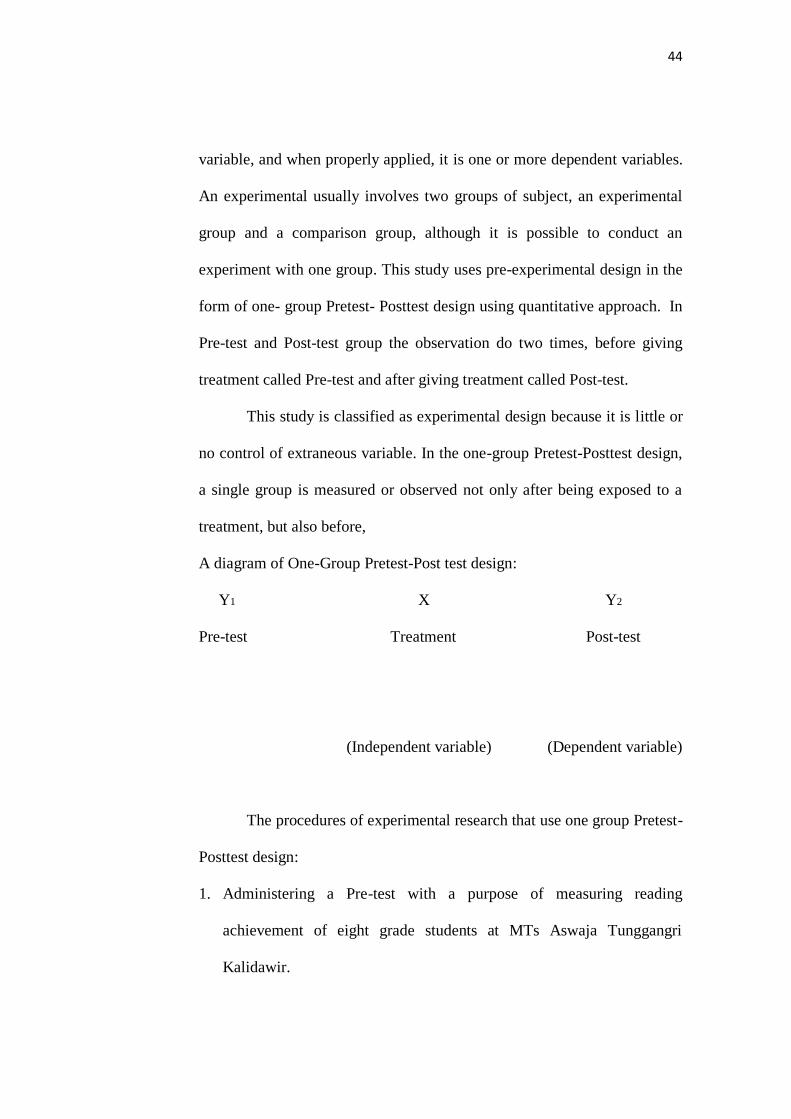
variable, and when properly applied, it is one or more dependent variables.
An experimental usually involves two groups of subject, an experimental
group and a comparison group, although it is possible to conduct an
experiment with one group. This study uses pre-experimental design in the
form of one- group Pretest- Posttest design using quantitative approach. In
Pre-test and Post-test group the observation do two times, before giving
treatment called Pre-test and after giving treatment called Post-test.
This study is classified as experimental design because it is little or
no control of extraneous variable. In the one-group Pretest-Posttest design,
a single group is measured or observed not only after being exposed to a
treatment, but also before,
A diagram of One-Group Pretest-Post test design:
Y1 X Y2
Pre-test Treatment Post-test
(Independent variable) (Dependent variable)
The procedures of experimental research that use one group Pretest-
Posttest design:
1. Administering a Pre-test with a purpose of measuring reading
achievement of eight grade students at MTs Aswaja Tunggangri
Kalidawir.

45
2. Applying the treatment in teaching reading comprehension by using
student team achievement division (STAD) as a technique.
3. Administering a Post-test with a purpose of measuring reading
comprehension of eight grade students at MTs Aswaja Tunggangri
Kalidawir.
In this study, the researcher uses experimental research with
quantitative approach. The researcher wants to know the effectiveness of
using student team achievement division (STAD) technique in teaching
reading to the students’ reading comprehension by experimental research.
The impact is assessed by providing a specific treatment. The effectiveness
will be know the significant differences between the students who are
taught without using student team achievement division (STAD) technique
and those are taught using student team achievement division (STAD)
technique.
B. Population and Sample
Fraenkel and Wallen (1993 : 79) stated that a population is the
group to which the results of the study are intended to apply. Kountour in
Azib (2008 : 6) stated that population is the large group about which the
generalization is made. It is defined as all members of any well-define class
of people, events, or objects.

46
The population in this research was the eight grade of the students
at MTs Aswaja Tunggangri Kalidawir, in which the total of class VIII are
two classes and in this research just conducted in one class. In this
research, the researchers use one class of A class as sample of this research
which consist of 21 students.
Ary et al (2006:167) stated that sampling is technique taking
sample which give opportunity for every element or population member to
be chosen as sample. In this study, the researcher used purposive sampling
technique. Because the students of the A class has homogeneity than other
classes. In A class, there are 21 students consist of 10 boys and 11 girls.
C. Variable
Variable is any entity that can take on different values. Variables
can be classified in several ways. The most important classification is on
the bass of their use within the research under consideration, when they are
classified as dependent variables or dependent variables (Ary, 1985; 30).
1. Independent variables (Y) is variable that consequence of or upon
atecendent variables. One independent variable must be the treatment
variable. One or more group receive the experimental manipulation or
treatment. In this study the teaching reading comprehension by using
student team achievement division (STAD) technique is independet
variable.

47
2. Dependent variable (X) is the response or the criterion variable that is
presumed to be caused by or influenced by the independent treatment
conditions and any other independent variables. In this study the
dependent variable is student’s reading comprehension.
D. Data and Data Source
Data is result of research record in number and fact (Arikunto, 1997
: 91), it means that data is number of fact is found by researcher. Data in
this study only uses primary data. Ari (1985) stated that primary data is
data which are collected directly from the sample. For this study, the data
was got from score by administering Pre-test and Post-test.
Arikunto (1998 : 114) stated that, Sources of data are subjects
where data comes from. Those can be:
1. Person
Person is man who gives the data or information orally, it can be done
by interviewing or by giving questionnaire for the subject.
2. Place
Place is the resources of data that deals with place or moving, some
place can be the room. The location of the resources of material the
place of this research was in MTs Aswaja Tunggangri Kalidawir.

48
3. Paper
Paper is resources of data that deals with symbol; picture the document,
book number, the paper of this research document about structure of
MTs Aswaja Tunggangri Kalidawir.
Primary data source of this research is the eight grade students of MTs
Aswaja Tunggangri Kalidawir.
E. Instrument and Technique of Collecting Data
1. Instrument
According to Arikunto (1997 : 225 – 235), Instrument is the
tool when the researcher uses a method so that instrument is needed to
get the data in a researcher. There are five ways of collecting data in
this research. Those are observation, test, questionnaire, interview and
document.
In this study, researcher uses test as instrument, therefore, the
researcher applied a set of tests: Pre-test and Post-test test. Test is draft
of question or drill used for to know the skill, intelligence and ability of
individual of group (Arikunto, 1997 : 18). Here, Pre-test was given
before doing an experimental research study or before teaching by
using student team achievement division (STAD) technique and Post-
test was given after doing the treatment or after teaching by student
team achievement division (STAD) technique.

49
Before instrument was used to collect the data, the writer,
firstly, have to Try-out test to the eight grade students of MTs Aswaja
Tunggangri Kalidawir.
There were 21 students as the respondents of the Try-out test.
They had to complete the test, consisting of 25 items of multiple
choices, in 45 minutes. The item of Try-out test can be seen in
appendix 1.
According to Mouly’s as quoted by Sidik, a Try-out test is
necessary since the result will be used to make sure that the measuring
instrument has such characteristics as validity and reliability (Sidik,
1994 : 33).
Harris (1969 : 13) states that all good tests possessed two
qualities: validity and reliability. That was to say, any test that we use
has to be appropriate in terms of our objectives, dependable in the
evidence it provides, and applicable to our particular situation. Those
characteristics of a good test would be explained further below.
a. Validity
Validity refers to the precise measurements of the test.
Validity is defined as the extent to which the instrument measures
what it supposes to measure. It means that a valid test of subject
would measure the subject itself. For instance, the valid of reading
test would measure reading.

50
There are three kinds of validity: content validity, empirical
validity, and face validity (Harris, 1969 : 18). Harris (1969 : 18 – 2)
explained: Content validity meant the test reflected an analysis
according to the views of recognized authorities in the skill area.
Empirical validity depended in large part on the reliability of the
test and criterion measure. Face validity was the way the test look
whether it was irrelevant, silly, inappropriate, etc.
In this study, content validity is used. Content validity is the
content about what we say the test is about. This kind of validity
depends on careful analysis of the language being tested. The test
should be so constructed as to contain representative sample. The
relevancy of the objective of the test and the content of the test
items are show the content validity of the test. The questions used
to measure the comprehension of reading can be seen in
appendix 1.
b. Reliability
Reliability is the consistency of the measurement, or the
degree to which an instrument measures the same way each time it
is used under the same condition with the same subjects. In short, it
is the repeatability of your measurement. Frankle ( 1990 ) states
that reliability refers to the consistency of scores obtained. How the
consistency of each individual student from one administration to
the other and the administration of set of items to the other set.

51
To measure that reliability of test item, the researcher firstly
gaining the Try-out. It is to know whether the instrument suitable or
not. The computation of reliability showed in appendix 3.
To check the reliability of the test, the researcher used the formula
proposed by Heaton as follow:
r11 = N (1- m (N - m))
N - 1 Nx2
Where N = the number of the test items
m = the mean score of items in the test
X = the standard deviation of all test
r11 = reliability
From the result in append 3, it shows that the value of
reliability is 0.40. It means that the reliability of the test was good
since the reliability of the test was between the range of 0 and + 1.
Since the reliability of the test was good, it could be assume that the
validity of the test was also good. So, it can conclude that these
instruments are reliable and can be used for research.
c. Technique of Collecting Data
Data of this study was collected by administering test. Test
is draft of question or drill used for to know the skill, intelligence
and ability of individual or group (Arikunto, 1997 : 18). It means
52
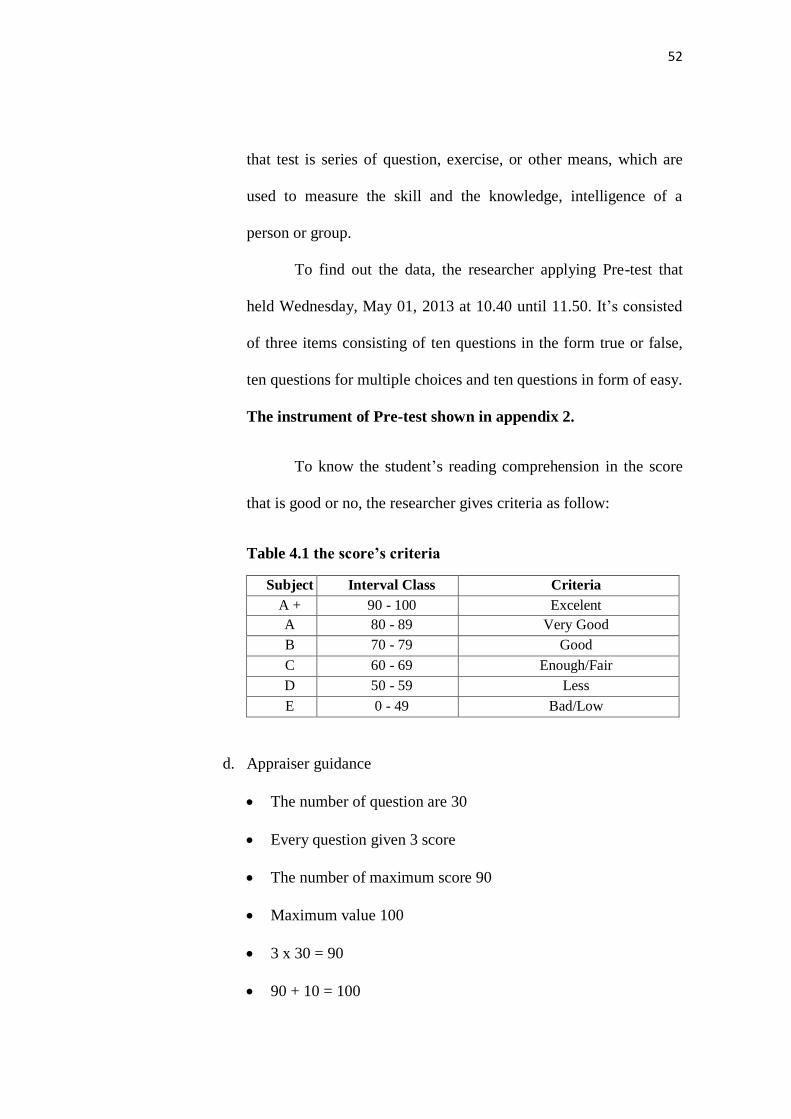
that test is series of question, exercise, or other means, which are
used to measure the skill and the knowledge, intelligence of a
person or group.
To find out the data, the researcher applying Pre-test that
held Wednesday, May 01, 2013 at 10.40 until 11.50. It’s consisted
of three items consisting of ten questions in the form true or false,
ten questions for multiple choices and ten questions in form of easy.
The instrument of Pre-test shown in appendix 2.
To know the student’s reading comprehension in the score
that is good or no, the researcher gives criteria as follow:
Table 4.1 the score’s criteria
Subject Interval Class Criteria
A + 90 - 100 Excelent
A 80 - 89 Very Good
B 70 - 79 Good
C 60 - 69 Enough/Fair
D 50 - 59 Less
E 0 - 49 Bad/Low
d. Appraiser guidance
The number of question are 30
Every question given 3 score
The number of maximum score 90
Maximum value 100
3 x 30 = 90
90 + 10 = 100

53
After gaining the Pre-test, the researcher gave the treatment by
taught using student team achievement division (STAD) technique.
The process of using student team achievement division
(STAD) technique in the classroom deals with the preparation and
schedule of activities as the implementation of the student team
achievement division (STAD) technique.
1. Preparation
Before using student team achievement division (STAD) technique
we need some preparation in order to make the learning process run
successfully. The preparation is as follows:
a) Material
In this study, the researcher used some texts which are available
in the source book as the material.
b) Assigning students to teams
As we know, student team achievement division (STAD)
represents across-section of the class. A good team in the class
is a three to four persons that e half male and half female. The
writer may take likes, dislike and deadly combination of
students into account in assigning students to team, but in
deciding teams do not let the students choose their own because
they will tend to choose others like themselves.

54
Instead follow these steps:
(1) Make copies of team summary sheet
The researcher makes one copy of a team summary sheet
for every three to four students in her class.
(2) Rank students
On a sheet of paper, the researcher ranked the students in
her class from the highest to lowest in past performance.
(3) Decide on the number of teams
Each team should have four members if possible. To
decide how many teams the writer would have, she
divided the number of students in the class by seventh
groups.
(4) Assign the students to teams
In assigning students to teams, balance the team so that 1)
each team is composed of students whose performance
levels range from low to average to high and 2) the
average performance levels of all the teams in the class is
about equal.
(3) Fill out team summary sheet
Fill in the name of the students on each team summary
sheet, leaving the team name of space blank. In this

55
study, the researcher assigned the students into team.
In this phase, the researcher used the students’ result
of the last test they have done. Because the total of the
students was 21 students, so they were divided into
seventh groups.
(4) Determining initial base score
Base score represent students’ average score on the
past quizzes.
(5) Team building
Before starting any cooperative learning program, the
researcher started off with one or more team building
exercises just to give members a chance to do
something funny and to get to know one another.
2. Schedule of Activities
Student team achievement division (STAD) technique consists of
a regular cycle of instructional activities, as follows:
a) Teaching
It means that the researcher presents the lesson. The
presentation should cover: opening, development, and guide-
practice and assessment respectively. (Adapted from Good,
Grouws, and Ebmeir,1983). The steps of teaching are:

56
(1) Opening
Tell the students what they are about to learn and
why it is important
The teacher may have students work in their team to
“discover” concept or what their appetites for the
lesson
Briefly review any pre requisite skills or
information.
(2) Development
Stick close to the objectives that the teacher wants
the students to learn
Focus on meaning, not memorization
Actively demonstrate concept skills, using visual
aids, manipulative, and many examples
Frequently assess students’ comprehension by
asking many questions
Explain why and answer is correct or incorrect,
unless this is obvious
Move to the next concept as soon as students have
gasped the main idea
Maintain momentum by eliminating interruptions,
asking many questions, and moving rapidly through
the lesson.

57
3) Guided Practice
Have the students work problems or example or
prepare answer to the questions.
Call on the students at random. This make the
students prepare themselves to answer.
Do not give long class assignment at this point.
Have students work one or two problems or
examples or prepare one or two answers, then give
them feedback.
b) Team Study
(1) Team
Half a class period
(2) Main idea
Student study in their teams
(3) Material needs
The work sheet and answer sheet for every team. During
team study, team members’ tasks are expected to master
the material teacher presents in the lass on and to help
their team mates master the material. Students have work
sheet and answer sheet in their teams to practice the skill
being taught and to assess themselves and their team
mates. On the first day of team work in student team

58
achievement division (STAD) technique, the researcher
should explain to students what it means to work in teams.
c) Test
1) Time
Half a class period
2) Main idea
Students take quiz
3) Material needed
One copy of the quiz for each student. During the quiz, do
not allow the students to work together on quiz, at this
point students must show what they have learned as
individuals.
d) Team Recognition
The main idea of team recognitions are figuring individual
Improvement scores and team scores and awarding team
rewards. Team may earn certificate or the rewards if their
average a certain criterion. Students’ team scores may also be
used determine up to twenty percent of their grades (Slavin,
1995 : 71 – 73).

59
In the last meeting the researcher gaining the Post-test. It was done
on Friday 10, May 2013 at 10.40 until 11.50 am. It was given after the
researcher giving the treatment or after teaching using student team
achievement division (STAD) technique. The question of Post-test shown
in appendix 2.
F. Technique and Data Analysis
In this research, the writer uses a quantitative data analysis
technique. The quantitative data of this research is analyzed by using
statistical method. The technique is used to find the significant difference
on the students’ comprehension taught using student team achievement
division (STAD) technique and taught without using student team
achievement division (STAD) technique.
The researcher in this research uses T-test as formulated below:
t = Md
∑ X2 d
N ( N – 1)
Notes :
t = t-test
Md = means of different pre-test and post-test
Xd = deviation in every subject (d – Md)
∑x 2d = total of quadrate deviation
N = subject of sample

60
d.b = decide by N – I
G. Hypothesis Testing
The hypothesis of this study as follow:
1. If T-test score is bigger than T-table, the alternative hypothesis (Ha) is
accepted. It means that there is significant different in the score to the
eight grade of student MTs Aswaja Tunggangri Kalidawir taught
without using student team achievement division (STAD) technique
and taught using student team achievement division (STAD). The
difference is significant.
2. If T-test score is smaller than T-table, the Null Hypothesis (Ho) is
rejected. It means that there is no different score to the eighth grade of
students taught without using student team achievement division
(STAD) technique and taught using student team achievement division
(STAD) technique.
Copyright © 2022 FDOKUMEN