CHAPTER –III IMPACT OF CORPORATE GOVERNANCE ON ...
76
Chapter III. Impact of C.G. on Value Creation of the companies: Case Study Page 65 CHAPTER –III IMPACT OF CORPORATE GOVERNANCE ON VALUE CREATION OF THE COMPANIES: A STUDY OF SELECTED COMPANIES IN INDIA 3.1 Introduction: Corporate Governance is a very wide concept and it covers a range of compliances and responsibilities of the board. It deals with principles and practices which have a direct impact on the performance of the companies and their capacity to be accountable to its various stakeholders. Corporate governance is a four-dimensional term and those dimensions are: 1) Enforcing rights and equitable treatment of shareholders 2) Accountability 3) Disclosures and Transparency 4) Responsibilities of the Board There are some generally accepted key convictions or components of good governance that are applicable to both the public and private sector. The most trivial principles are a) accountability—both internal and external, b) transparency/openness and c) recognition of stakeholder/shareholder rights. Some more principles that are generally accepted for the batter governance are efficiency, stewardship, leadership, integrity and an emphasis on performance as well as compliance, and stakeholder participation or inclusiveness. The need for corporate governance has arisen because of the increasing concern about the non-compliance of standards of financial reporting and accountability by boards of directors and management of corporate inflicting heavy losses on investors. The collapse of international giants likes Enron, World Com of the US and Xerox of Japan are said to be due to the absence of good corporate governance and corrupt practices adopted by the management of these companies and their financial consulting firms. The failures of these multinational giants bring out the importance of good corporate governance structure making clear the distinction of power between the Board of Directors and the management which can lead to appropriate governance processes and
-
Upload
khangminh22 -
Category
Documents
-
view
1 -
download
0
Transcript of CHAPTER –III IMPACT OF CORPORATE GOVERNANCE ON ...
Chapter III. Impact of C.G. on Value Creation of the companies: Case Study Page 65
CHAPTER –III
IMPACT OF CORPORATE GOVERNANCE ON VALUE
CREATION OF THE COMPANIES: A STUDY OF
SELECTED COMPANIES IN INDIA
3.1 Introduction:
Corporate Governance is a very wide concept and it covers a range of
compliances and responsibilities of the board. It deals with principles and
practices which have a direct impact on the performance of the companies and
their capacity to be accountable to its various stakeholders. Corporate
governance is a four-dimensional term and those dimensions are:
1) Enforcing rights and equitable treatment of shareholders
2) Accountability
3) Disclosures and Transparency
4) Responsibilities of the Board
There are some generally accepted key convictions or components of good
governance that are applicable to both the public and private sector. The most
trivial principles are a) accountability—both internal and external, b)
transparency/openness and c) recognition of stakeholder/shareholder rights.
Some more principles that are generally accepted for the batter governance are
efficiency, stewardship, leadership, integrity and an emphasis on performance
as well as compliance, and stakeholder participation or inclusiveness.
The need for corporate governance has arisen because of the increasing
concern about the non-compliance of standards of financial reporting and
accountability by boards of directors and management of corporate inflicting
heavy losses on investors. The collapse of international giants likes Enron,
World Com of the US and Xerox of Japan are said to be due to the absence of
good corporate governance and corrupt practices adopted by the management
of these companies and their financial consulting firms. The failures of these
multinational giants bring out the importance of good corporate governance
structure making clear the distinction of power between the Board of Directors
and the management which can lead to appropriate governance processes and
Chapter III. Impact of C.G. on Value Creation of the companies: Case Study Page 66
procedures under which management is free to manage and board of directors
is free to monitor and give policy directions. In most of the crises in Asian,
American and Russian countries frequently identified that Corporate
Governance as the underlying cause for the domino effect. It is opportune to
ask the question here ―Whether Corporate Governance affects the performance
of the company, which intern affects the shareholders' confidence?‖ Some
recent researches have however answered these questions by showing that
companies with good governance system have actually comparatively more
returns for their shareholders thereby gaining shareholders confidence and
improving economic conditions of a country.
3.2 Need of the Study:
A large number of studies provide evidence of an association between
Corporate Governance and performance of the companies measured based on
profitability and measures related to profit maximization such as net profit,
profitability ratios, return on investment, return on fix assets employed,
Market Capitalization to BV ratio, Tobin‘s q and so on by using Strong Cross-
Sectional Correlation, Pooled OLS Regressions, Ordinary Least Squares
Regressions Simultaneous Equations Approach or Simultaneous Equations
Framework.
It is revealed from the literature that no studies have been conducted to
measure the association of corporate governance with the value creation of the
companies or a shareholder‘s value creation or shareholders‘ wealth
maximization. The real investors (who are not speculators) and the long term
investors, who invest in the equity of the company invest with long term
motive of wealth maximization and value creation. So it is necessary to
conduct the study to establish and gauge the relationship between the
corporate governance practices followed the companies and the long-term
motive of the shareholder i.e. wealth maximization or value creation, by
analyzing the data of more than one year for the more than one company and
for more than one sector.
Chapter III. Impact of C.G. on Value Creation of the companies: Case Study Page 67
In nutshell, it is necessary to conduct the study to establish and gauge the
relationship between corporate governance practices and value creation by
using panel data analysis.
The objective of this chapter is to examine the level to which companies are
complying with Corporate Governance guidelines and how it affects the
shareholders‘ value creation and value creation of the companies i.e. the main
objective of the present chapter is to examine the impact of Corporate
Governance practices on value creation of companies by Value-based
performance measurements Economic Value Added (EVA) and Market Value
Added (MVA).
Corporate governance is an effective tool for extremely all kinds of
companies. Corporate Governance protects the financial interests of
stakeholders in a company, whether they are owners, managers, employees or
outside stakeholders. In India SEBI and the Ministry of Corporate Affairs
(MCA) regulates the companies to comply with Corporate Governance norms.
This study is important and useful for understanding the level of Corporate
Governance compliance by Indian companies and how this compliance can
impact the value creation of companies and create or destroy the investors'
confidence in the company. In the present study, 80 companies private and
public sectors have been selected from 15 sectors and corporate governance
scores were computed and they were ranked based on their level of Corporate
Governance compliance.
To achieve the objective of the study the present chapter is divided into four
parts, Part one identifies the sample selection criteria and selection of sample
based on criteria. Part two deals with the corporate governance practices in
India and determining the corporate governance score for selected sample
companies. Part three computes the Economic value Added (EVA) and
Market Value Added (MVA) for selected sample companies. Part four of the
chapter establishes the relationship between corporate governance practices
through the corporate governance score (CG Score) and Value creation of the
Chapter III. Impact of C.G. on Value Creation of the companies: Case Study Page 68
companies i.e. EVA and MVA and testing of the hypothesis formed based on
the objective of the study.
3.3 Hypotheses of the Study:
Based on the objectives of the chapter, the following hypotheses are formed to
understand and analyze the impact of Corporate Governance on value creation
of the companies which is measured by two important approaches i.e.
Economic Value Added (EVA) and Market Value Added (MVA).
Hypothesis 1(Ho): There is no impact of corporate governance practices on
Economic Value Added (EVA)
Hypothesis 2(Ho): There is no impact of corporate governance practices on
Market Value Added (MVA)
3.4 Sample Selection Criteria:
The total number of companies in India is divided into two categories that are
listed and non-listed companies on leading exchanges like BSE/NSE. Among
the total number of companies, it is found that there are 5,463 listed
companies and remaining all companies is not listed on BSE/NSE. The
Bombay Stock Exchange (BSE) which is one of the leading stock exchanges
of India from February 2008, has classified Equity scripts into various
categories such as A, B, T, & Z to provide assistance to the investors. The
classification is based on a number of factors such as market capitalization,
trading volumes and numbers, track records, profits, dividends, shareholding
patterns, and some qualitative aspects. In the present study, 80 companies are
selected representing A, B, T, & Z group from 15 sectors. So that impact of
the corporate governance practices in India and its impact of value creation
can be measured for the companies representing different market
capitalization, trading volumes, and numbers, track records, profits, dividends,
shareholding patterns, and sectors. Based on the contribution to the total
market capitalization 15 most contributing sectors are identified and from each
sector, 5 companies belonging to A, B, T, & Z group have been selected. In
course of the sample selection, banking and insurance entities which are body
corporate e.g. banks (including both private and public sector), insurance
Chapter III. Impact of C.G. on Value Creation of the companies: Case Study Page 69
companies, financial institutions, etc. have not been considered for the present
study since the statutes of these body corporates are different from other listed
companies.
3.4.1 Period of the Study:
The study is covered over a period of five years and the data has been
collected on an annual basis i.e. for the purpose of analysis, the data were
collected for five respective years i.e. 2012-13, 2013-14, 2014-15, 2015-16
and 2016-17.
3.4.2 Sectors from Where the Sample Companies Are Selected:
A sector is an area of the economy in which businesses share the same or a
related product or service. It can also be thought of as an industry or market
that shares common operating characteristics. Dividing an economy into
different pieces allows for a more in-depth analysis of the economy as a
whole. Almost all economies are comprised of four, high-level sectors, which
are then each made up of smaller sectors. Of the large sectors within an
economy, the first is called the primary sector and involves companies that
involved in the extraction and harvesting of natural products from the earth,
such as agriculture, mining, and forestry. The secondary sector consists of
processing, manufacturing and construction companies. The tertiary sector is
comprised of companies that provide services, such as retail sales,
entertainment, and financial organizations. The quaternary sector is made up
of companies in intellectual pursuits, such as educational businesses.
Investors use sectors to place stocks and other investments into categories
such as technology, healthcare, energy, utilities, and telecommunications.
Each sector has unique characteristics and a different risk profile that attracts a
specific type of investor. It is, therefore, common for analysts and other
investment professionals to specialize in certain sectors. For example, at a
large research firm, an analyst may cover only pharmaceutical companies.
Additionally, investment funds often specialize in a particular economic
Chapter III. Impact of C.G. on Value Creation of the companies: Case Study Page 70
sector, a practice known as sector investing. The oil and gas sector is an
example of a portion of an economy that attracts specialized investment funds.
The present study has taken the sample companies from the service sector and
industrial sectors of the sectors based on their contribution to the total market
capitalization. 15 industries are identified as most important industries based
on share in total market cap and the contribution to the GDP of the Indian
economy, however in course of the sample selection, banking and insurance
entities which are body corporate e.g. banks (including both private and public
sector), insurance companies, financial institutions, etc. have not been
considered for the present study since the statutes of these body corporates are
different from other listed companies.
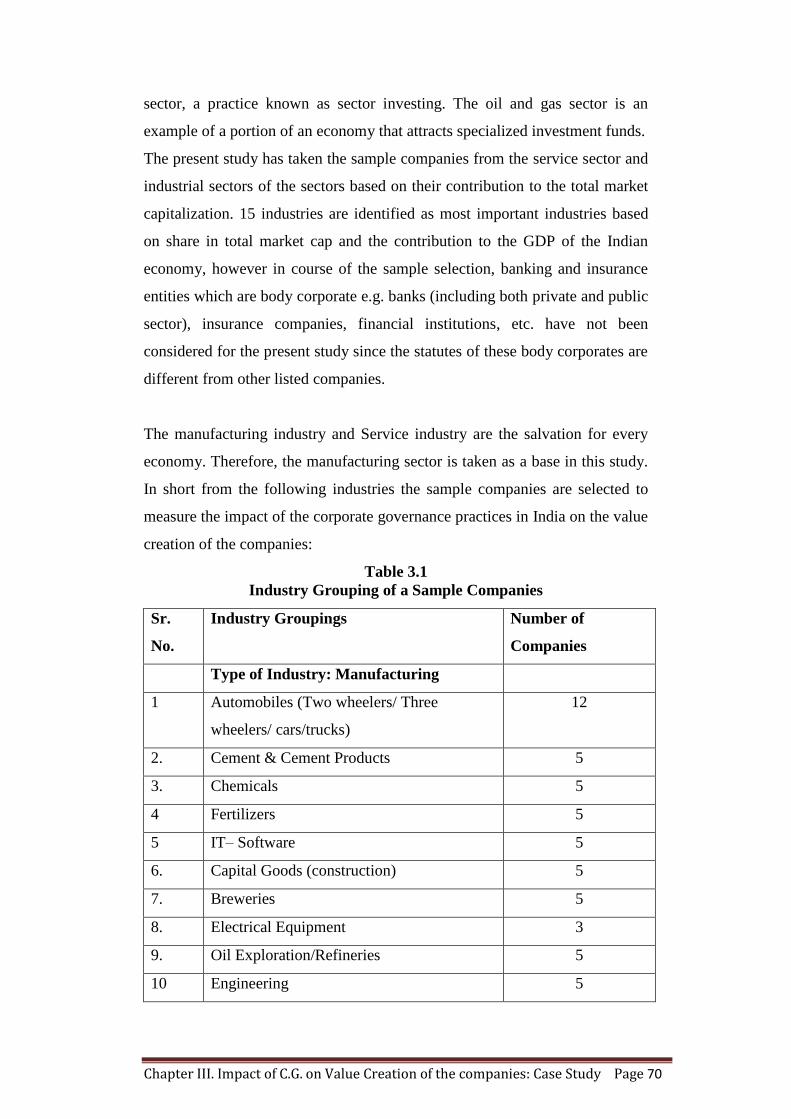
The manufacturing industry and Service industry are the salvation for every
economy. Therefore, the manufacturing sector is taken as a base in this study.
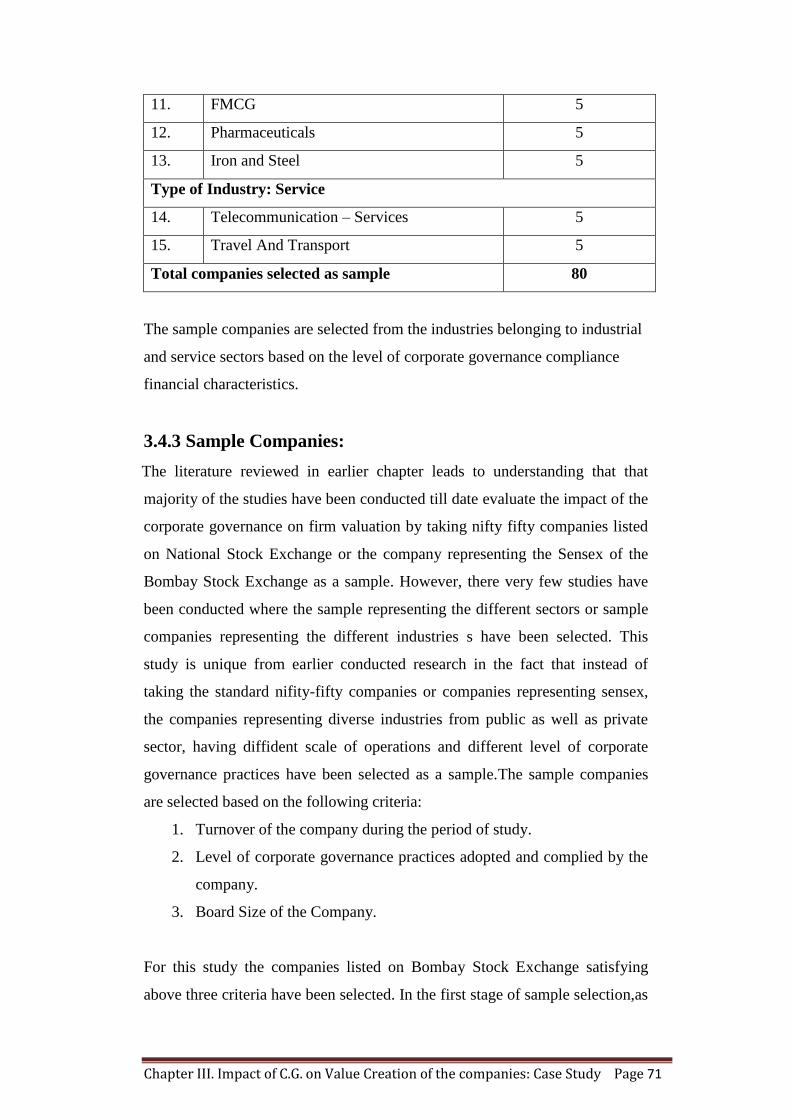
In short from the following industries the sample companies are selected to
measure the impact of the corporate governance practices in India on the value
creation of the companies:
Table 3.1
Industry Grouping of a Sample Companies
Sr.
No.
Industry Groupings Number of
Companies
Type of Industry: Manufacturing
1 Automobiles (Two wheelers/ Three
wheelers/ cars/trucks)
12
2. Cement & Cement Products 5
3. Chemicals 5
4 Fertilizers 5
5 IT– Software 5
6. Capital Goods (construction) 5
7. Breweries 5
8. Electrical Equipment 3
9. Oil Exploration/Refineries 5
10 Engineering 5
Chapter III. Impact of C.G. on Value Creation of the companies: Case Study Page 71
11. FMCG 5
12. Pharmaceuticals 5
13. Iron and Steel 5
Type of Industry: Service
14. Telecommunication – Services 5
15. Travel And Transport 5
Total companies selected as sample 80
The sample companies are selected from the industries belonging to industrial
and service sectors based on the level of corporate governance compliance
financial characteristics.
3.4.3 Sample Companies:
The literature reviewed in earlier chapter leads to understanding that that
majority of the studies have been conducted till date evaluate the impact of the
corporate governance on firm valuation by taking nifty fifty companies listed
on National Stock Exchange or the company representing the Sensex of the
Bombay Stock Exchange as a sample. However, there very few studies have
been conducted where the sample representing the different sectors or sample
companies representing the different industries s have been selected. This
study is unique from earlier conducted research in the fact that instead of
taking the standard nifity-fifty companies or companies representing sensex,
the companies representing diverse industries from public as well as private
sector, having diffident scale of operations and different level of corporate
governance practices have been selected as a sample.The sample companies
are selected based on the following criteria:
1. Turnover of the company during the period of study.
2. Level of corporate governance practices adopted and complied by the
company.
3. Board Size of the Company.
For this study the companies listed on Bombay Stock Exchange satisfying
above three criteria have been selected. In the first stage of sample selection,as
Chapter III. Impact of C.G. on Value Creation of the companies: Case Study Page 72
reflected in table 3.1 fifteen industries were identified and from each industry
20 companies with highest turnover were selected, which amounts to 300
companies. In the second stage of sample selection, from the 300 companies,
150 companies were eliminated on the ground of having common level of
corporate governance practices in terms of a) fairness (b) accountability (c)
board responsibilities (d) Transparency and disclosure and 150 companies
having different postulates of corporate governance were selected for the third
level of sample section. The 150 companies were further screened-out on the
basis of different type of board composition in terms of (a) combination of
executive and non-executive director (b) women director is executive director
or non-executive director (c) number of committees formed by the company,
which resulted in to elimination of 70 companies and finally 80 companies
were selected for the study. During the sample selection process effort has
been made to select 5 companies from each identified industry. However in
case of Auto (2/3 Wheeler) industry , Auto(Cars) industry , Auto (trucks)
industry and Electrical Equipment industry, less than 5 companies are
selected; as the number of companies satisfying the sample selection criteria
are less than 5. The selected 80 companies represents all the identified
Industries.
The selected companies are the homogeneous companies with heterogeneous
characteristics, this sample will lead to accuracy in evaluation of results, as the
sample companies are selected to represent all kind of industries with different
corporate governance level and operational and financial characteristics.
The final list of the companies considered for the study is
annexed as (Annexure II)
3.5 Corporate Governance Principles:
It is been observed by reviewing provisions of the Companies Act,2013
relating to corporate governance, regulations of SEBI (Listing Obligations and
Disclosure Requirements) Regulations, 2015 relating to corporate governance
and reports and recommendation of various committees on corporate
governance, that all the provisions, regulations and recommendations for
Chapter III. Impact of C.G. on Value Creation of the companies: Case Study Page 73
better corporate governance are based on the principles of the corporate
governance given by The Organization for Economic Co-operation and
Development (OECD) developed and revised from time to time and the
principles of disclosures given by International Organization of Securities
Commissions (IOSCO).The basic principles underlying corporate governance
practices are as follows:
1. The rights of shareholders
2. Timely information:
3. Equitable treatment:
4. Role of stakeholders in corporate governance:
5. Disclosure and transparency
6. Responsibilities of the board of directors
These principles based on which all most model codes, regulations, and
provisions of the statutes relating to corporate governance have been emerging
can be further minimized as into the ethics or pillars. So, the pillars on which
the entire framework of corporate governance is created are:
1. Fairness:
Fairness refers to equal treatment, for example, all shareholders should receive
equal consideration for whatever shareholdings they hold. In addition to
shareholders, there should also be fairness in the treatment of all stakeholders
including employees, communities and public officials. The fairer the entity
appears to stakeholders, the more likely it is that it can survive the pressure of
interested parties.
2. Accountability:
Corporate accountability refers to the obligation and responsibility to give an
explanation or reason for the company‘s actions and conduct.
In brief:
The board should present a balanced and understandable assessment of
the company‘s position and prospects;
The board is responsible for determining the nature and extent of the
significant risks it is willing to take;
The board should maintain sound risk management and internal control
systems;
Chapter III. Impact of C.G. on Value Creation of the companies: Case Study Page 74
The board should establish formal and transparent arrangements for
corporate reporting and risk management and for maintaining an
appropriate relationship with the company‘s auditor, and
The board should communicate with stakeholders at regular intervals, a
fair, balanced and understandable assessment of how the company is
achieving its business purpose.
3. Responsibility:
The Board of Directors is given authority to act on behalf of the company.
They should, therefore, accept full responsibility for the powers that it is given
and the authority that it exercises. The Board of Directors is responsible for
overseeing the management of the business, affairs of the company,
appointing the chief executive and monitoring the performance of the
company. In doing so, it is required to act in the best interests of the company.
Accountability goes hand in hand with responsibility. The Board of Directors
should be made accountable to the shareholders for the way in which the
company has carried out its responsibilities.
4. Transparency:
A principle of good governance is that stakeholders should be informed about
the company‘s activities, what it plans to do in the future and any risks
involved in its business strategies.
Transparency means openness, a willingness by the company to provide clear
information to shareholders and other stakeholders. For example, transparency
refers to the openness and willingness to disclose financial performance
figures which are truthful and accurate.
Disclosure of material matters concerning the organization‘s performance and
activities should be timely and accurate to ensure that all investors have access
to clear, factual information which accurately reflects the financial, social and
environmental position of the organization. Organizations should clarify and
make publicly known the roles and responsibilities of the board and
management to provide shareholders with a level of accountability.
Transparency ensures that stakeholders can have confidence in the decision-
making and management processes of a company.
Chapter III. Impact of C.G. on Value Creation of the companies: Case Study Page 75
3.6 Rating Corporate Governance Performance:
Anything that exists can be quantified. Those quantifiable get measured.
Corporate governance can be measured by value imperatives. In the absence
of a normative and measurable approach, corporate governance may creep into
boardrooms and executive suites. (Mishra K. C., 1998)
Growth and development of the Indian corporates have taken place after the
liberalization in 1991 and it is created a avenues capital markets for raising the
funds for the corporates Initially, equity research before making investment
decisions was considered an entirely new and essential concept that would
lead to better returns for investors. It is anybody‘s guess if someone who has
invested on the basis of such research in the last few years got any better
return. Then, attention shifted to the concept of earning per share, level
playing field, and transparency in decision-making. None of these concepts
have helped make better investment decisions or improved the bottom line.
One such flair of the time is the talk about corporate governance in this
country.
Corporate governance has to be accepted as a fundamental fiduciary
responsibility of corporate managers and the board of directors. The
measurement approach to corporate governance would enable boards to
recognize that despite good projections, the company‘s increasing cost of
capital; rising investment requirements per Rupee of sale and lower margins
on sales are clear signs of value erosion due to bad corporate governance.
(Mishra K. C., 1998)
A recent study conducted by the Organization for Economic Cooperation &
Development (OECD) reflects that non-financial performance data is relevant
to shareholder evaluations and investment decisions.(Inta Kotane, 2011)
In a prevalent prosperity-oriented world, profits are the magnitude of success.
It is essential to compare the benefits of good governance practices with the
cost of compliance in monitory and ethical form.
Financial performance of is a benchmark of the success of anybody corporate
in the globe and it is always measured in monetary term, on the other hand, the
corporate governance practices is a qualitative aspect and it cannot be
measured in monetary, so for measuring the effect of the corporate governance
Chapter III. Impact of C.G. on Value Creation of the companies: Case Study Page 76
on the financial performance of the corporates, it is essential to quantify the
corporate governance practices. Corporate governance score or corporate
governance rating is a tool through which the corporate governance practices
can be quantified.
Corporate Governance Score or corporate governance rating of a company
expresses an opinion about the extent to which a company adopts and
conforms to codes and guidelines of good corporate governance practices.
Corporate Governance Rating is an emerging concept over the globe. In India,
the corporate governance rating was obtained by ITC Limited by the ICRA in
the year 2002.
The Institute of Company Secretaries of India (ICSI) has introduced an annual
national award for the best-governed company. The ICSI has been quantifying
the corporate governance practices by allocating marks to specified criteria.
ICSI allocates marks in the following manner:
1. Statutory compliance 20%
2. Compliances of corporate Governance norms in true letter and spirit-
50%
3. Other criteria such as investor-friendly procedures and practices useful
for the investor and society at large-30%
Credit Rating Information Services Agency Limited (CRISAL) and Standard
& poor's(S&P) are jointly engaged in India for Corporate Governance rating in
collaboration with. They have developed a methodology to appraise Corporate
Governance Standards of individual firms, which is a synthesis of principles of
Corporate Governance practices followed by the corporates worldwide.
Durga Prasad Samontaray had also developed a tool to measure the level of
corporate governance of the Nifty 50 companies based on the guidelines
issued by the N.R. Narayan Murthu committee report on Corporate
Governance, 2003 (Durgaprashad, 2010)
Department of public enterprises of the Ministry of heavy industries and
public enterprises rates the public sector enterprises for the corporate
governance practice adopted by them on the basis of compliance with
guidelines on corporate governance for the central public sector.
Chapter III. Impact of C.G. on Value Creation of the companies: Case Study Page 77
In order to address these issues and as an initiative for the public good, BSE
has collaborated with the International Finance Corporation (IFC)
Washington, a member of the World Bank Group for developing a "CG
Scorecard" for Indian corporates. The CG Scorecard will help companies to
benchmark themselves on their Corporate Governance status as well as
provide investors a standardized measure of the Corporate Governance status
of any company. ( Bombay Stock exchange)
There are many agencies have created a methodology and have developed the
corporate governance rating tool, through which the qualitative practices
adopted by the corporates are quantified. The vary object of rating is to testify
the relative level to which an organization accepts and follows the codes and
guidelines of corporate governance practices. The rate of corporate
governance emulates the level and quality of governance practices.
3.6.1 Development of Corporate Governance Score Card:
This part of the chapter has made an attempt to develop a corporate
governance scorecard and to adopt the rating process to measure level the
corporates compliance for all 80 companies selected as a sample for the
financial years 2012-13, 2013-14, 2014-15, 2015-16 & 2016-17.
Most corporates and legislators have focused on the model code of corporate
governance. They do not have the number to communicate or estimate the
scale of corporate governance. Observance of code can only be monitored on-
line. No measurement may be perfect to quantify a qualitative dimension, but
a good measurement can always show the direction of movement, considering
this an effort has been made to develop the corporate governance scorecard to
quantify the corporate governance practices adopted by the sample companies.
The corporate governance scorecard is developed based following tools
developed by:
1. ICRA Limited
2. Marking scheme for CG Awards Adopted by The Institute of
Company Secretaries of India (ICSI)
3. Credit Rating Information Services Agency Limited (CRISAL) and
Standard & poor's(S&P)
Chapter III. Impact of C.G. on Value Creation of the companies: Case Study Page 78
4. BSE & International Finance Corporation (IFC)
The corporate governance scorecard is developed based on the tools and
principles of corporate governance scoring adopted by the above-cited
agencies, however considering the level of CG practices, financial
characteristics and period of the study only selected variables are considered.
The corporate governance scorecard is created by considering all the
principles of corporate governance given by the OECD as well as the basic
principles of corporate governance. As the principal base corporate
governance scorecard is formed to measure the level of corporate governance
practices in selected sample companies, the statutory, as well as non-statutory
components, are taken into consideration to allot the corporate governance
score (CG Score) to the selected corporates.
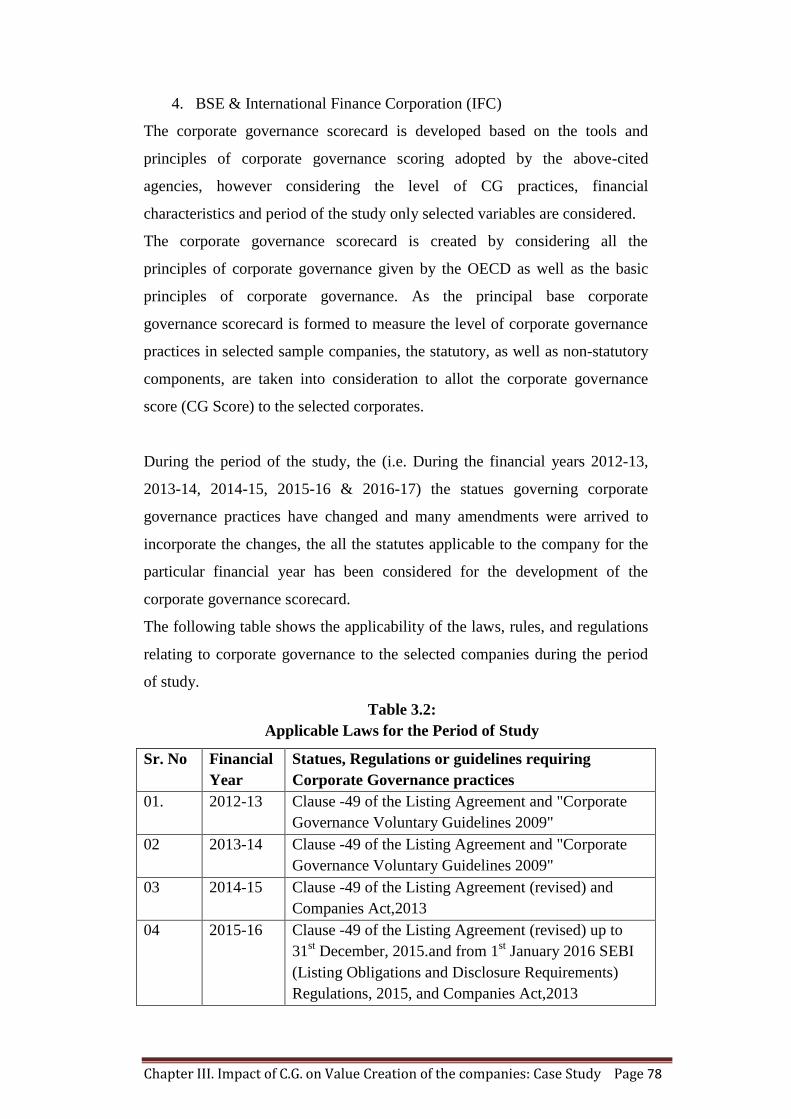
During the period of the study, the (i.e. During the financial years 2012-13,
2013-14, 2014-15, 2015-16 & 2016-17) the statues governing corporate
governance practices have changed and many amendments were arrived to
incorporate the changes, the all the statutes applicable to the company for the
particular financial year has been considered for the development of the
corporate governance scorecard.
The following table shows the applicability of the laws, rules, and regulations
relating to corporate governance to the selected companies during the period
of study.
Table 3.2:
Applicable Laws for the Period of Study
Sr. No Financial
Year
Statues, Regulations or guidelines requiring
Corporate Governance practices
01. 2012-13 Clause -49 of the Listing Agreement and "Corporate
Governance Voluntary Guidelines 2009"
02 2013-14 Clause -49 of the Listing Agreement and "Corporate
Governance Voluntary Guidelines 2009"
03 2014-15 Clause -49 of the Listing Agreement (revised) and
Companies Act,2013
04 2015-16 Clause -49 of the Listing Agreement (revised) up to
31st December, 2015.and from 1
st January 2016 SEBI
(Listing Obligations and Disclosure Requirements)
Regulations, 2015, and Companies Act,2013
Chapter III. Impact of C.G. on Value Creation of the companies: Case Study Page 79
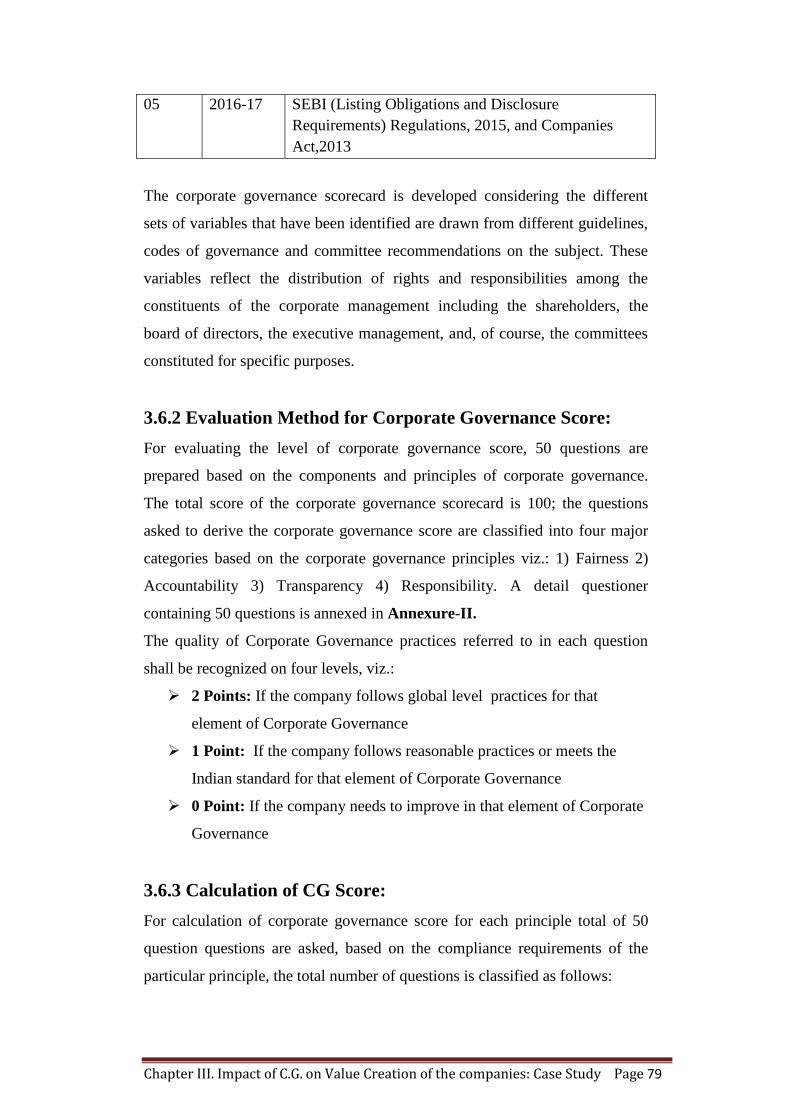
05 2016-17 SEBI (Listing Obligations and Disclosure
Requirements) Regulations, 2015, and Companies
Act,2013
The corporate governance scorecard is developed considering the different
sets of variables that have been identified are drawn from different guidelines,
codes of governance and committee recommendations on the subject. These
variables reflect the distribution of rights and responsibilities among the
constituents of the corporate management including the shareholders, the
board of directors, the executive management, and, of course, the committees
constituted for specific purposes.
3.6.2 Evaluation Method for Corporate Governance Score:
For evaluating the level of corporate governance score, 50 questions are
prepared based on the components and principles of corporate governance.
The total score of the corporate governance scorecard is 100; the questions
asked to derive the corporate governance score are classified into four major
categories based on the corporate governance principles viz.: 1) Fairness 2)
Accountability 3) Transparency 4) Responsibility. A detail questioner
containing 50 questions is annexed in Annexure-II.
The quality of Corporate Governance practices referred to in each question
shall be recognized on four levels, viz.:
2 Points: If the company follows global level practices for that
element of Corporate Governance
1 Point: If the company follows reasonable practices or meets the
Indian standard for that element of Corporate Governance
0 Point: If the company needs to improve in that element of Corporate
Governance
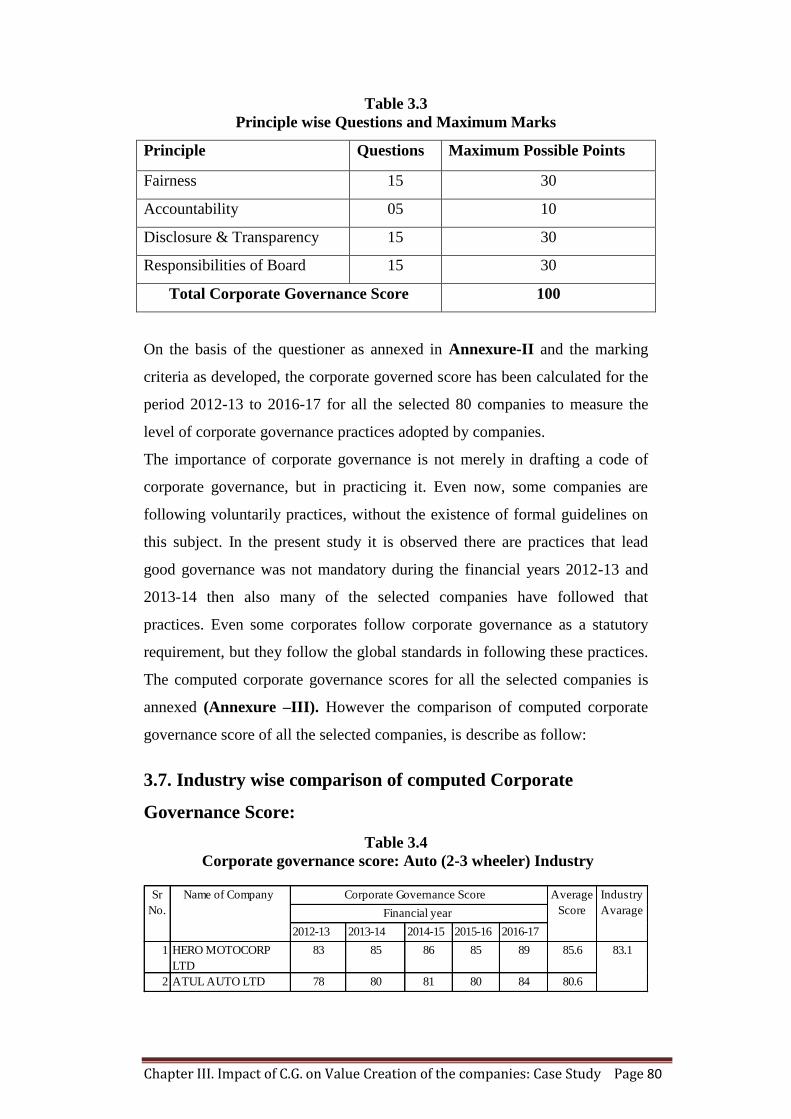
3.6.3 Calculation of CG Score:
For calculation of corporate governance score for each principle total of 50
question questions are asked, based on the compliance requirements of the
particular principle, the total number of questions is classified as follows:
Chapter III. Impact of C.G. on Value Creation of the companies: Case Study Page 80
Table 3.3
Principle wise Questions and Maximum Marks
Principle Questions Maximum Possible Points
Fairness 15 30
Accountability 05 10
Disclosure & Transparency 15 30
Responsibilities of Board 15 30
Total Corporate Governance Score 100
On the basis of the questioner as annexed in Annexure-II and the marking
criteria as developed, the corporate governed score has been calculated for the
period 2012-13 to 2016-17 for all the selected 80 companies to measure the
level of corporate governance practices adopted by companies.
The importance of corporate governance is not merely in drafting a code of
corporate governance, but in practicing it. Even now, some companies are
following voluntarily practices, without the existence of formal guidelines on
this subject. In the present study it is observed there are practices that lead
good governance was not mandatory during the financial years 2012-13 and
2013-14 then also many of the selected companies have followed that
practices. Even some corporates follow corporate governance as a statutory
requirement, but they follow the global standards in following these practices.
The computed corporate governance scores for all the selected companies is
annexed (Annexure –III). However the comparison of computed corporate
governance score of all the selected companies, is describe as follow:
3.7. Industry wise comparison of computed Corporate
Governance Score:
Table 3.4
Corporate governance score: Auto (2-3 wheeler) Industry
2012-13 2013-14 2014-15 2015-16 2016-17
1 HERO MOTOCORP
LTD
83 85 86 85 89 85.6
2 ATUL AUTO LTD 78 80 81 80 84 80.6
Average
Score
Industry
Avarage
83.1
Sr
No.
Name of Company Corporate Governance Score
Financial year
Chapter III. Impact of C.G. on Value Creation of the companies: Case Study Page 81
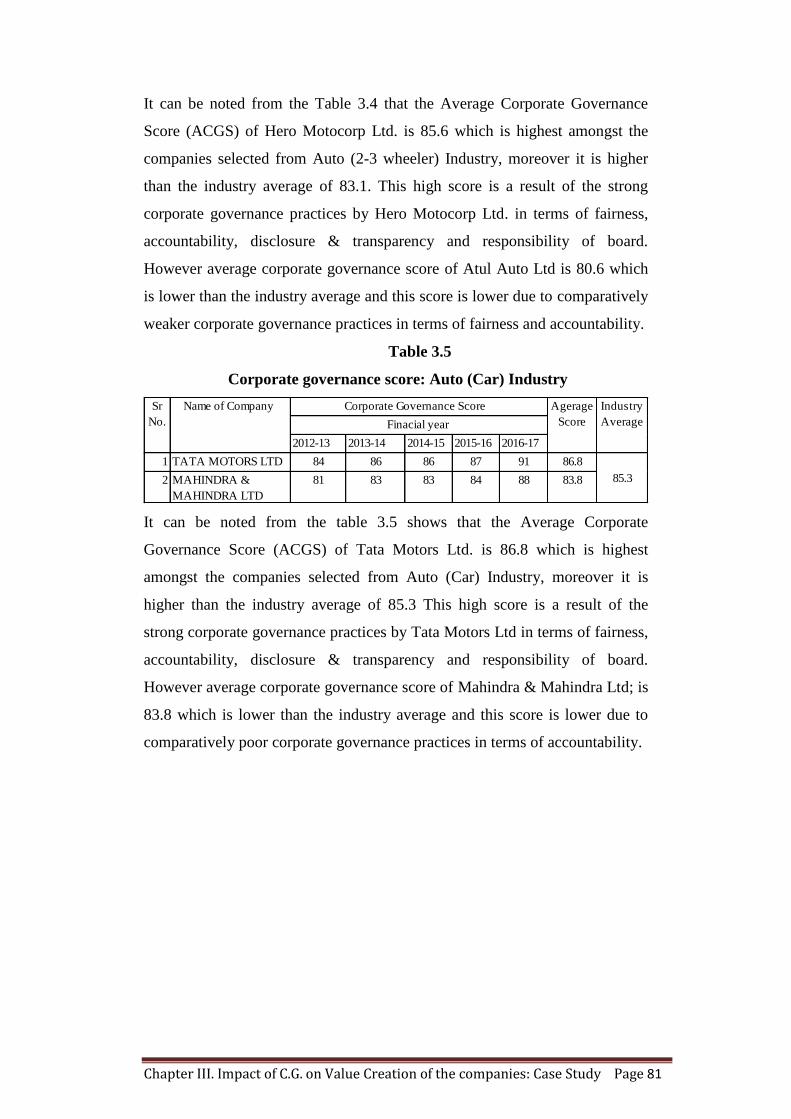
It can be noted from the Table 3.4 that the Average Corporate Governance
Score (ACGS) of Hero Motocorp Ltd. is 85.6 which is highest amongst the
companies selected from Auto (2-3 wheeler) Industry, moreover it is higher
than the industry average of 83.1. This high score is a result of the strong
corporate governance practices by Hero Motocorp Ltd. in terms of fairness,
accountability, disclosure & transparency and responsibility of board.
However average corporate governance score of Atul Auto Ltd is 80.6 which
is lower than the industry average and this score is lower due to comparatively
weaker corporate governance practices in terms of fairness and accountability.
Table 3.5
Corporate governance score: Auto (Car) Industry
It can be noted from the table 3.5 shows that the Average Corporate
Governance Score (ACGS) of Tata Motors Ltd. is 86.8 which is highest
amongst the companies selected from Auto (Car) Industry, moreover it is
higher than the industry average of 85.3 This high score is a result of the
strong corporate governance practices by Tata Motors Ltd in terms of fairness,
accountability, disclosure & transparency and responsibility of board.
However average corporate governance score of Mahindra & Mahindra Ltd; is
83.8 which is lower than the industry average and this score is lower due to
comparatively poor corporate governance practices in terms of accountability.
2012-13 2013-14 2014-15 2015-16 2016-17
1 TATA MOTORS LTD 84 86 86 87 91 86.8
2 MAHINDRA &
MAHINDRA LTD
81 83 83 84 88 83.8
Finacial year
85.3
Sr
No.
Name of Company Corporate Governance Score Agerage
Score
Industry
Average
Chapter III. Impact of C.G. on Value Creation of the companies: Case Study Page 82
Table 3.6
Corporate governance score: Auto Parts & Equipment Industry
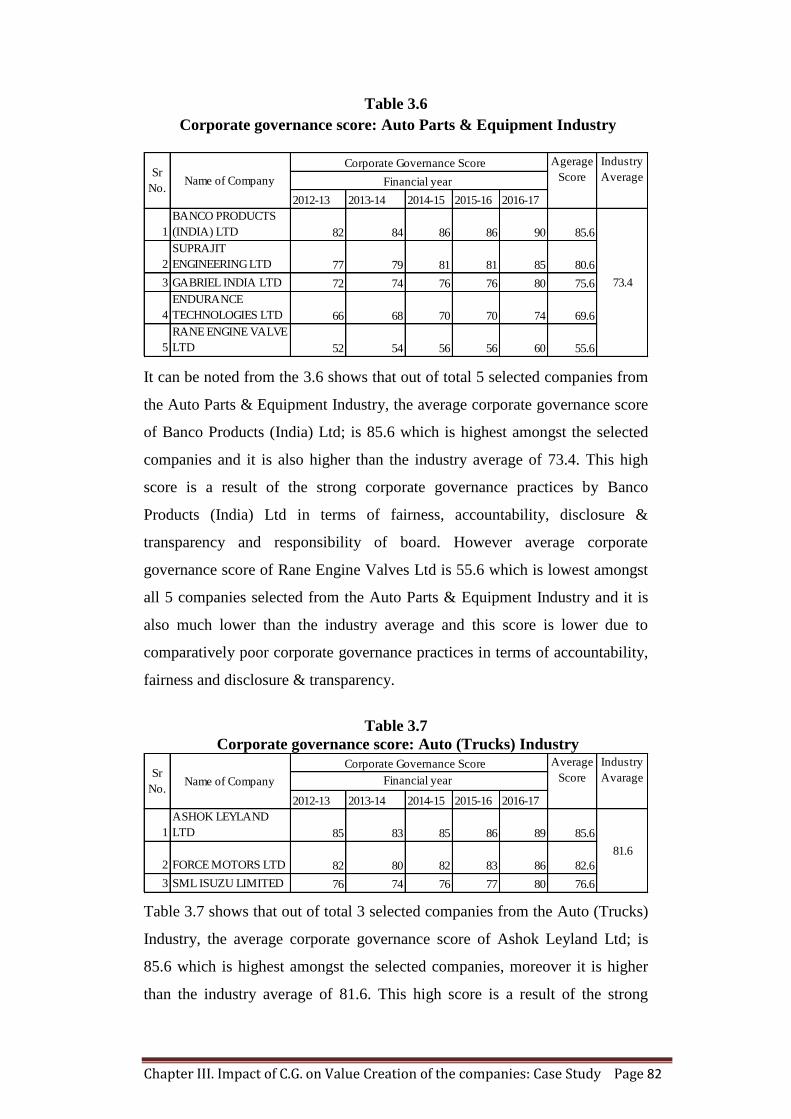
It can be noted from the 3.6 shows that out of total 5 selected companies from
the Auto Parts & Equipment Industry, the average corporate governance score
of Banco Products (India) Ltd; is 85.6 which is highest amongst the selected
companies and it is also higher than the industry average of 73.4. This high
score is a result of the strong corporate governance practices by Banco
Products (India) Ltd in terms of fairness, accountability, disclosure &
transparency and responsibility of board. However average corporate
governance score of Rane Engine Valves Ltd is 55.6 which is lowest amongst
all 5 companies selected from the Auto Parts & Equipment Industry and it is
also much lower than the industry average and this score is lower due to
comparatively poor corporate governance practices in terms of accountability,
fairness and disclosure & transparency.
Table 3.7
Corporate governance score: Auto (Trucks) Industry
Table 3.7 shows that out of total 3 selected companies from the Auto (Trucks)
Industry, the average corporate governance score of Ashok Leyland Ltd; is
85.6 which is highest amongst the selected companies, moreover it is higher
than the industry average of 81.6. This high score is a result of the strong
2012-13 2013-14 2014-15 2015-16 2016-17
1
BANCO PRODUCTS
(INDIA) LTD 82 84 86 86 90 85.6
2
SUPRAJIT
ENGINEERING LTD 77 79 81 81 85 80.6
3 GABRIEL INDIA LTD 72 74 76 76 80 75.6
4
ENDURANCE
TECHNOLOGIES LTD 66 68 70 70 74 69.6
5
RANE ENGINE VALVE
LTD 52 54 56 56 60 55.6
73.4
Agerage
Score
Industry
Average Sr
No.Name of Company
Corporate Governance Score
Financial year
2012-13 2013-14 2014-15 2015-16 2016-17
1
ASHOK LEYLAND
LTD 85 83 85 86 89 85.6
2 FORCE MOTORS LTD 82 80 82 83 86 82.6
3 SML ISUZU LIMITED 76 74 76 77 80 76.6
Average
Score
Industry
Avarage
81.6
Sr
No.Name of Company
Corporate Governance Score
Financial year
Chapter III. Impact of C.G. on Value Creation of the companies: Case Study Page 83
corporate governance practices by Ashok Leyland Ltd in terms of fairness,
accountability, disclosure & transparency and responsibility of board.
However average corporate governance score of SML Isuzu Ltd is 76.6 which
is lowest amongst all 5 companies selected from the Auto (Trucks) Industry
and it is also much lower than the industry average and this score is lower due
to comparatively poor corporate governance practices in terms of
accountability, fairness.
Table 3.8
Corporate governance score: Cement & Cement Products Industry
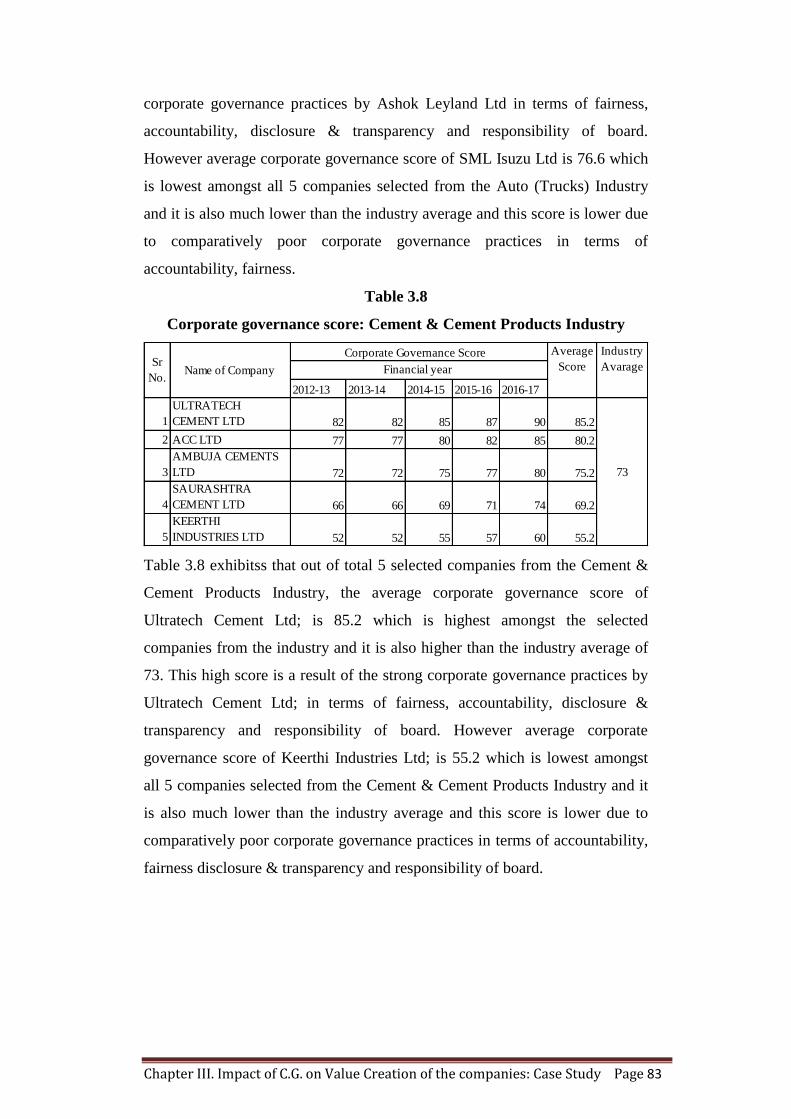
Table 3.8 exhibitss that out of total 5 selected companies from the Cement &
Cement Products Industry, the average corporate governance score of
Ultratech Cement Ltd; is 85.2 which is highest amongst the selected
companies from the industry and it is also higher than the industry average of
73. This high score is a result of the strong corporate governance practices by
Ultratech Cement Ltd; in terms of fairness, accountability, disclosure &
transparency and responsibility of board. However average corporate
governance score of Keerthi Industries Ltd; is 55.2 which is lowest amongst
all 5 companies selected from the Cement & Cement Products Industry and it
is also much lower than the industry average and this score is lower due to
comparatively poor corporate governance practices in terms of accountability,
fairness disclosure & transparency and responsibility of board.
2012-13 2013-14 2014-15 2015-16 2016-17
1
ULTRATECH
CEMENT LTD 82 82 85 87 90 85.2
2 ACC LTD 77 77 80 82 85 80.2
3
AMBUJA CEMENTS
LTD 72 72 75 77 80 75.2
4
SAURASHTRA
CEMENT LTD 66 66 69 71 74 69.2
5
KEERTHI
INDUSTRIES LTD 52 52 55 57 60 55.2
73
Average
Score
Industry
Avarage Sr
No.Name of Company
Corporate Governance Score
Financial year

Chapter III. Impact of C.G. on Value Creation of the companies: Case Study Page 84
Table 3.9
Corporate governance score: Chemicals Industry
It can be noted from the table 3.9 that out of total 5 selected companies from
the Chemicals Industry ,the average corporate governance score of National
Peroxide Ltd; is 88.2 which is highest amongst the selected companies from
the industry and it is also higher than the industry average of 76. This high
score is a result of the strong corporate governance practices by National
Peroxide Ltd in terms of fairness, accountability, disclosure & transparency
and responsibility of board. However average corporate governance score of
Geecee Ventures Limited is 58.2 which is lowest amongst all 5 companies
selected from the Chemicals Industry and it is also much lower than the
industry average and this score is lower due to comparatively poor corporate
governance practices in terms of accountability, fairness and responsibility of
board.
2012-13 2013-14 2014-15 2015-16 2016-17
1
NATIONAL
PEROXIDE LTD 90 87 81 92 91 88.2
2
KANCHI
KARPOORAM LTD 85 82 76 87 86 83.2
3
GALAXY
SURFACTANTS LTD 80 77 71 82 81 78.2
4
GODREJ INDUSTRIES
LTD 74 71 65 76 75 72.2
5
GEECEE VENTURES
LIMITED 60 57 51 62 61 58.2
Sr
No.Name of Company
Corporate Governance Score
Financial year
Average
Score
Industry
Avarage
76
Chapter III. Impact of C.G. on Value Creation of the companies: Case Study Page 85
Table 3.10
Corporate governance score: Fertilizers Industry
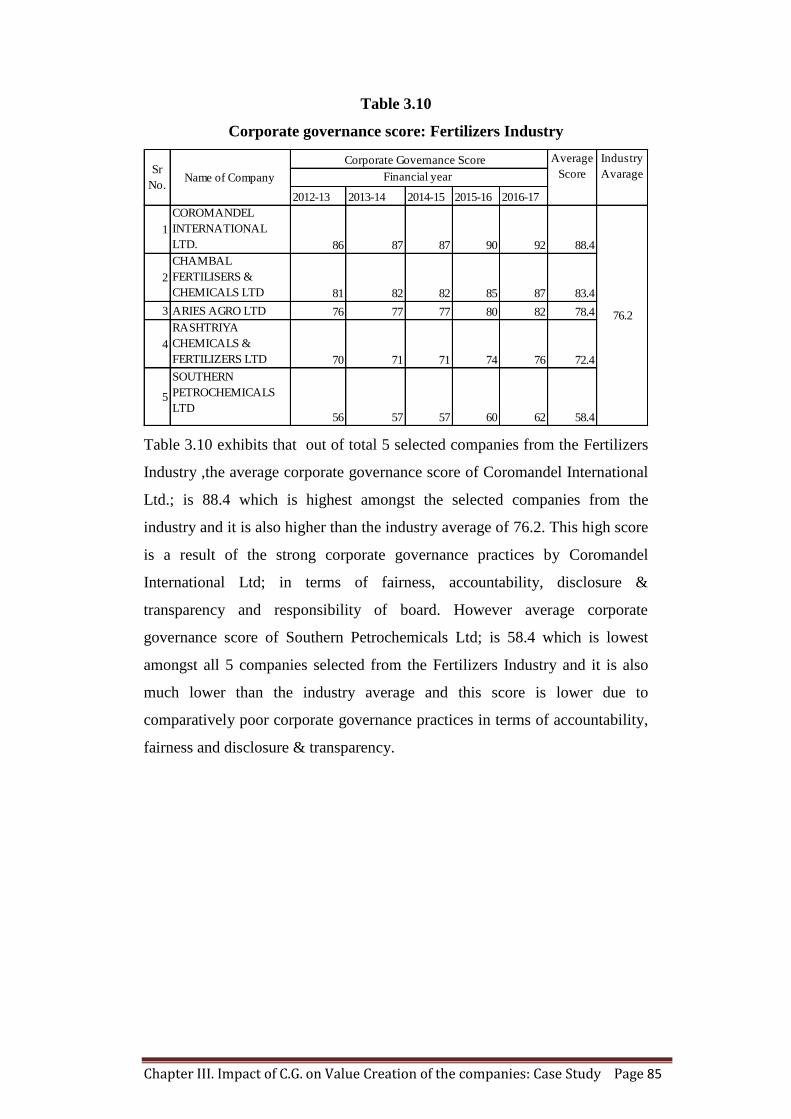
Table 3.10 exhibits that out of total 5 selected companies from the Fertilizers
Industry ,the average corporate governance score of Coromandel International
Ltd.; is 88.4 which is highest amongst the selected companies from the
industry and it is also higher than the industry average of 76.2. This high score
is a result of the strong corporate governance practices by Coromandel
International Ltd; in terms of fairness, accountability, disclosure &
transparency and responsibility of board. However average corporate
governance score of Southern Petrochemicals Ltd; is 58.4 which is lowest
amongst all 5 companies selected from the Fertilizers Industry and it is also
much lower than the industry average and this score is lower due to
comparatively poor corporate governance practices in terms of accountability,
fairness and disclosure & transparency.
2012-13 2013-14 2014-15 2015-16 2016-17
1
COROMANDEL
INTERNATIONAL
LTD. 86 87 87 90 92 88.4
2
CHAMBAL
FERTILISERS &
CHEMICALS LTD 81 82 82 85 87 83.4
3 ARIES AGRO LTD 76 77 77 80 82 78.4
4
RASHTRIYA
CHEMICALS &
FERTILIZERS LTD 70 71 71 74 76 72.4
5
SOUTHERN
PETROCHEMICALS
LTD56 57 57 60 62 58.4
76.2
Average
Score
Industry
Avarage Sr
No.Name of Company
Corporate Governance Score
Financial year
Chapter III. Impact of C.G. on Value Creation of the companies: Case Study Page 86
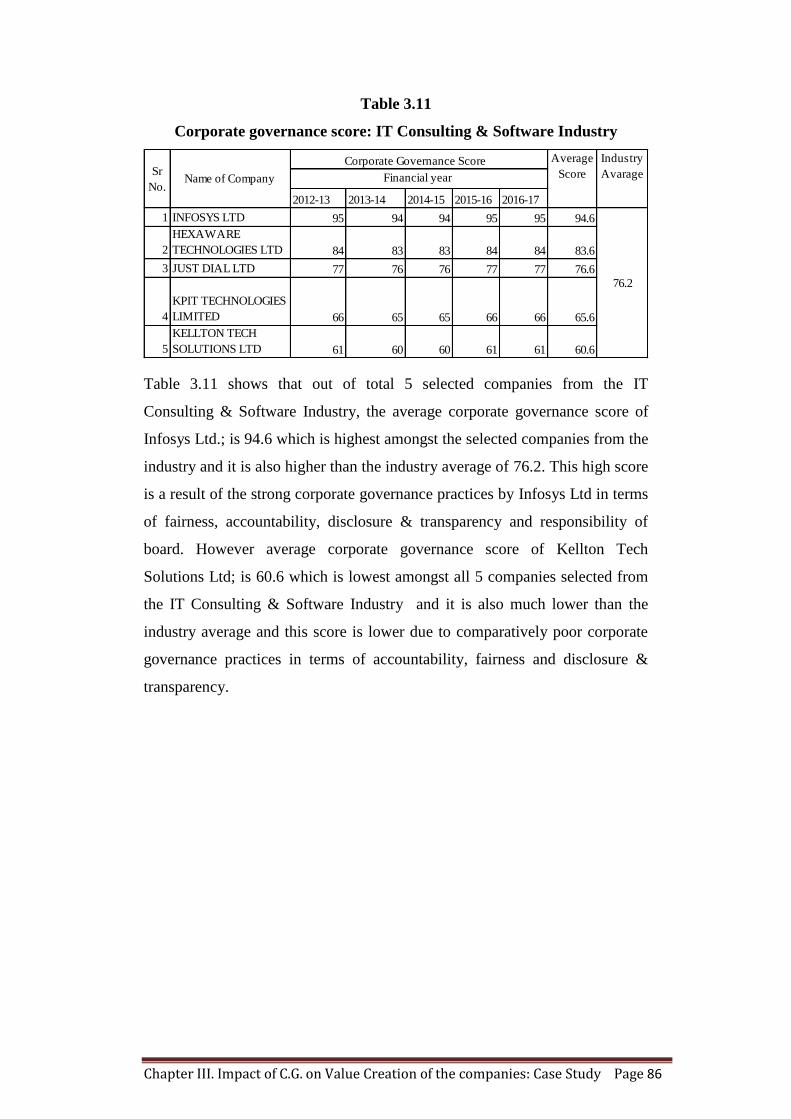
Table 3.11
Corporate governance score: IT Consulting & Software Industry
Table 3.11 shows that out of total 5 selected companies from the IT
Consulting & Software Industry, the average corporate governance score of
Infosys Ltd.; is 94.6 which is highest amongst the selected companies from the
industry and it is also higher than the industry average of 76.2. This high score
is a result of the strong corporate governance practices by Infosys Ltd in terms
of fairness, accountability, disclosure & transparency and responsibility of
board. However average corporate governance score of Kellton Tech
Solutions Ltd; is 60.6 which is lowest amongst all 5 companies selected from
the IT Consulting & Software Industry and it is also much lower than the
industry average and this score is lower due to comparatively poor corporate
governance practices in terms of accountability, fairness and disclosure &
transparency.
2012-13 2013-14 2014-15 2015-16 2016-17
1 INFOSYS LTD 95 94 94 95 95 94.6
2
HEXAWARE
TECHNOLOGIES LTD 84 83 83 84 84 83.6
3 JUST DIAL LTD 77 76 76 77 77 76.6
4
KPIT TECHNOLOGIES
LIMITED 66 65 65 66 66 65.6
5
KELLTON TECH
SOLUTIONS LTD 61 60 60 61 61 60.6
Sr
No.Name of Company
Corporate Governance Score
Financial year
Average
Score
Industry
Avarage
76.2
Chapter III. Impact of C.G. on Value Creation of the companies: Case Study Page 87
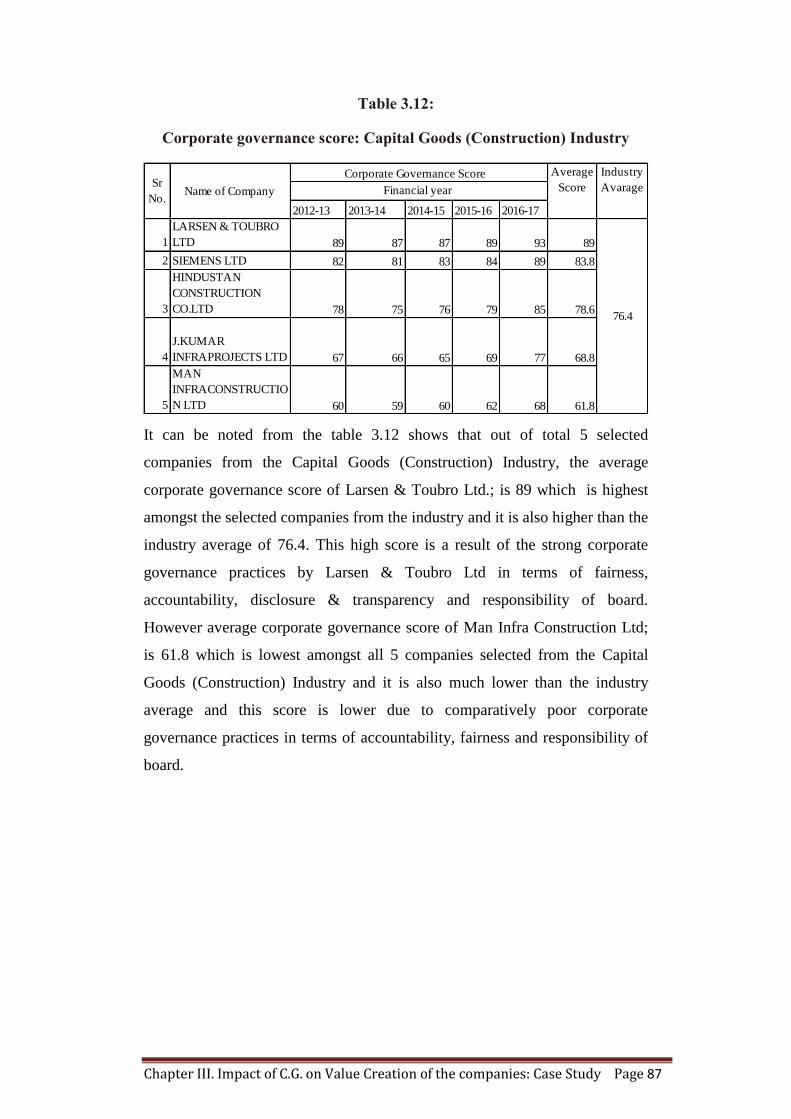
Table 3.12:
Corporate governance score: Capital Goods (Construction) Industry
It can be noted from the table 3.12 shows that out of total 5 selected
companies from the Capital Goods (Construction) Industry, the average
corporate governance score of Larsen & Toubro Ltd.; is 89 which is highest
amongst the selected companies from the industry and it is also higher than the
industry average of 76.4. This high score is a result of the strong corporate
governance practices by Larsen & Toubro Ltd in terms of fairness,
accountability, disclosure & transparency and responsibility of board.
However average corporate governance score of Man Infra Construction Ltd;
is 61.8 which is lowest amongst all 5 companies selected from the Capital
Goods (Construction) Industry and it is also much lower than the industry
average and this score is lower due to comparatively poor corporate
governance practices in terms of accountability, fairness and responsibility of
board.
2012-13 2013-14 2014-15 2015-16 2016-17
1
LARSEN & TOUBRO
LTD 89 87 87 89 93 89
2 SIEMENS LTD 82 81 83 84 89 83.8
3
HINDUSTAN
CONSTRUCTION
CO.LTD 78 75 76 79 85 78.6
4
J.KUMAR
INFRAPROJECTS LTD 67 66 65 69 77 68.8
5
MAN
INFRACONSTRUCTIO
N LTD 60 59 60 62 68 61.8
Sr
No.Name of Company
Corporate Governance Score
Financial year
Average
Score
Industry
Avarage
76.4
Chapter III. Impact of C.G. on Value Creation of the companies: Case Study Page 88
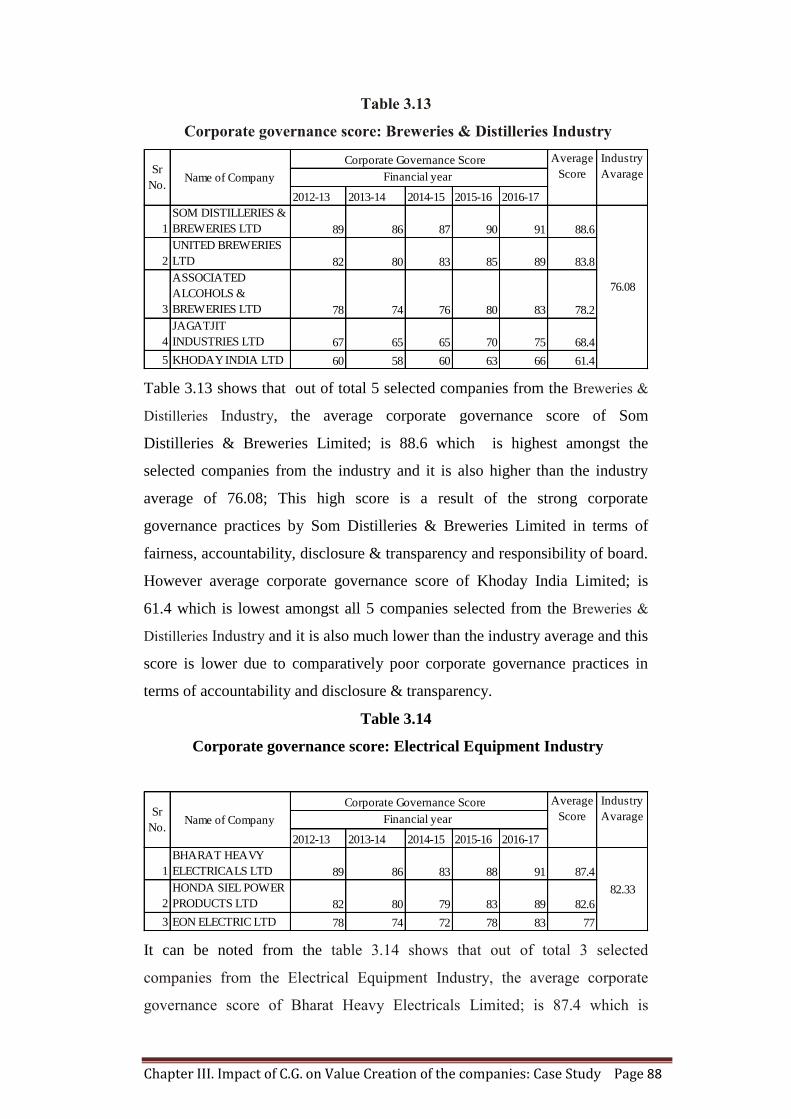
Table 3.13
Corporate governance score: Breweries & Distilleries Industry
Table 3.13 shows that out of total 5 selected companies from the Breweries &
Distilleries Industry, the average corporate governance score of Som
Distilleries & Breweries Limited; is 88.6 which is highest amongst the
selected companies from the industry and it is also higher than the industry
average of 76.08; This high score is a result of the strong corporate
governance practices by Som Distilleries & Breweries Limited in terms of
fairness, accountability, disclosure & transparency and responsibility of board.
However average corporate governance score of Khoday India Limited; is
61.4 which is lowest amongst all 5 companies selected from the Breweries &
Distilleries Industry and it is also much lower than the industry average and this
score is lower due to comparatively poor corporate governance practices in
terms of accountability and disclosure & transparency.
Table 3.14
Corporate governance score: Electrical Equipment Industry
It can be noted from the table 3.14 shows that out of total 3 selected
companies from the Electrical Equipment Industry, the average corporate
governance score of Bharat Heavy Electricals Limited; is 87.4 which is
2012-13 2013-14 2014-15 2015-16 2016-17
1
SOM DISTILLERIES &
BREWERIES LTD 89 86 87 90 91 88.6
2
UNITED BREWERIES
LTD 82 80 83 85 89 83.8
3
ASSOCIATED
ALCOHOLS &
BREWERIES LTD 78 74 76 80 83 78.2
4
JAGATJIT
INDUSTRIES LTD 67 65 65 70 75 68.4
5 KHODAY INDIA LTD 60 58 60 63 66 61.4
Sr
No.Name of Company
Corporate Governance Score
Financial year
Average
Score
Industry
Avarage
76.08
2012-13 2013-14 2014-15 2015-16 2016-17
1
BHARAT HEAVY
ELECTRICALS LTD 89 86 83 88 91 87.4
2
HONDA SIEL POWER
PRODUCTS LTD 82 80 79 83 89 82.6
3 EON ELECTRIC LTD 78 74 72 78 83 77
Sr
No.Name of Company
Corporate Governance Score
Financial year
82.33
Average
Score
Industry
Avarage
Chapter III. Impact of C.G. on Value Creation of the companies: Case Study Page 89
highest amongst the selected companies and it is also higher than the industry
average of 82.33. This high score is a result of the strong corporate
governance practices by Bharat Heavy Electricals Limited in terms of fairness,
accountability, disclosure & transparency and responsibility of board.
However average corporate governance score of Eon Electricals Limited; is
77.4 which is lowest amongst all 3 companies selected from the Electrical
Equipment Industry and it is also much lower than the industry average and
this score is lower due to comparatively poor corporate governance practices
in terms of fairness and disclosure & transparency.
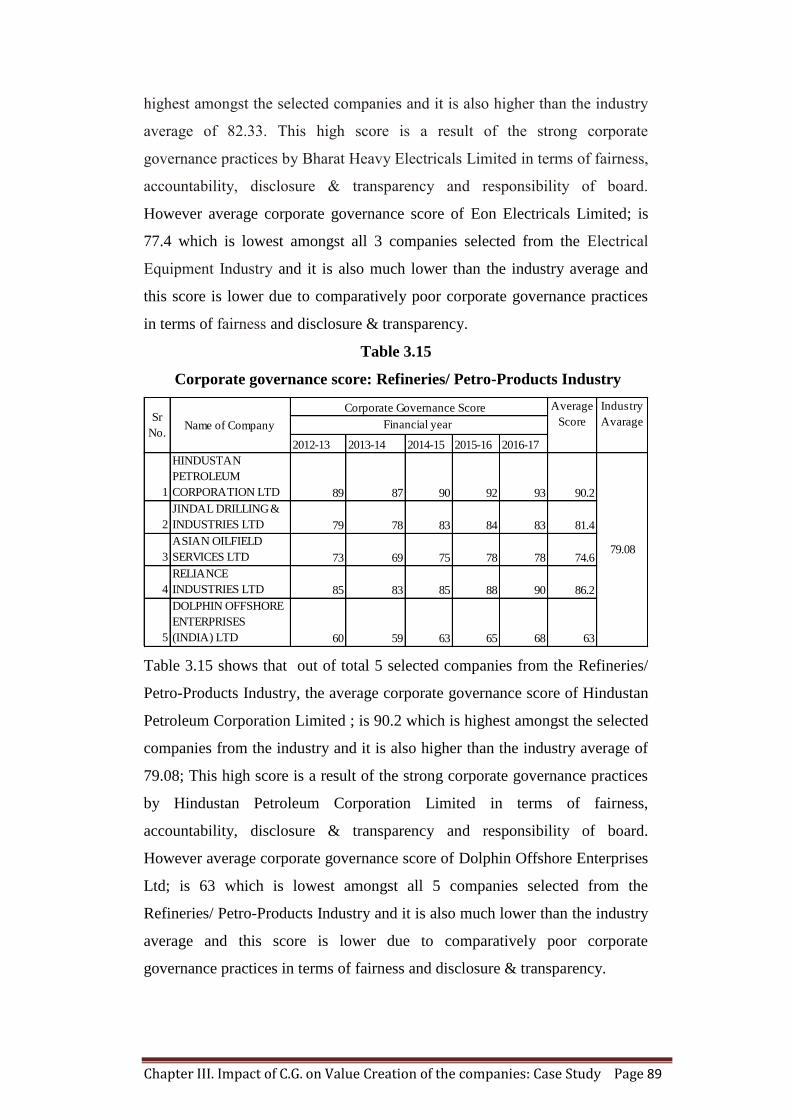
Table 3.15
Corporate governance score: Refineries/ Petro-Products Industry
Table 3.15 shows that out of total 5 selected companies from the Refineries/
Petro-Products Industry, the average corporate governance score of Hindustan
Petroleum Corporation Limited ; is 90.2 which is highest amongst the selected
companies from the industry and it is also higher than the industry average of
79.08; This high score is a result of the strong corporate governance practices
by Hindustan Petroleum Corporation Limited in terms of fairness,
accountability, disclosure & transparency and responsibility of board.
However average corporate governance score of Dolphin Offshore Enterprises
Ltd; is 63 which is lowest amongst all 5 companies selected from the
Refineries/ Petro-Products Industry and it is also much lower than the industry
average and this score is lower due to comparatively poor corporate
governance practices in terms of fairness and disclosure & transparency.
2012-13 2013-14 2014-15 2015-16 2016-17
1
HINDUSTAN
PETROLEUM
CORPORATION LTD 89 87 90 92 93 90.2
2
JINDAL DRILLING &
INDUSTRIES LTD 79 78 83 84 83 81.4
3
ASIAN OILFIELD
SERVICES LTD 73 69 75 78 78 74.6
4
RELIANCE
INDUSTRIES LTD 85 83 85 88 90 86.2
5
DOLPHIN OFFSHORE
ENTERPRISES
(INDIA) LTD 60 59 63 65 68 63
Sr
No.Name of Company
Corporate Governance Score
Financial year
Average
Score
Industry
Avarage
79.08
Chapter III. Impact of C.G. on Value Creation of the companies: Case Study Page 90
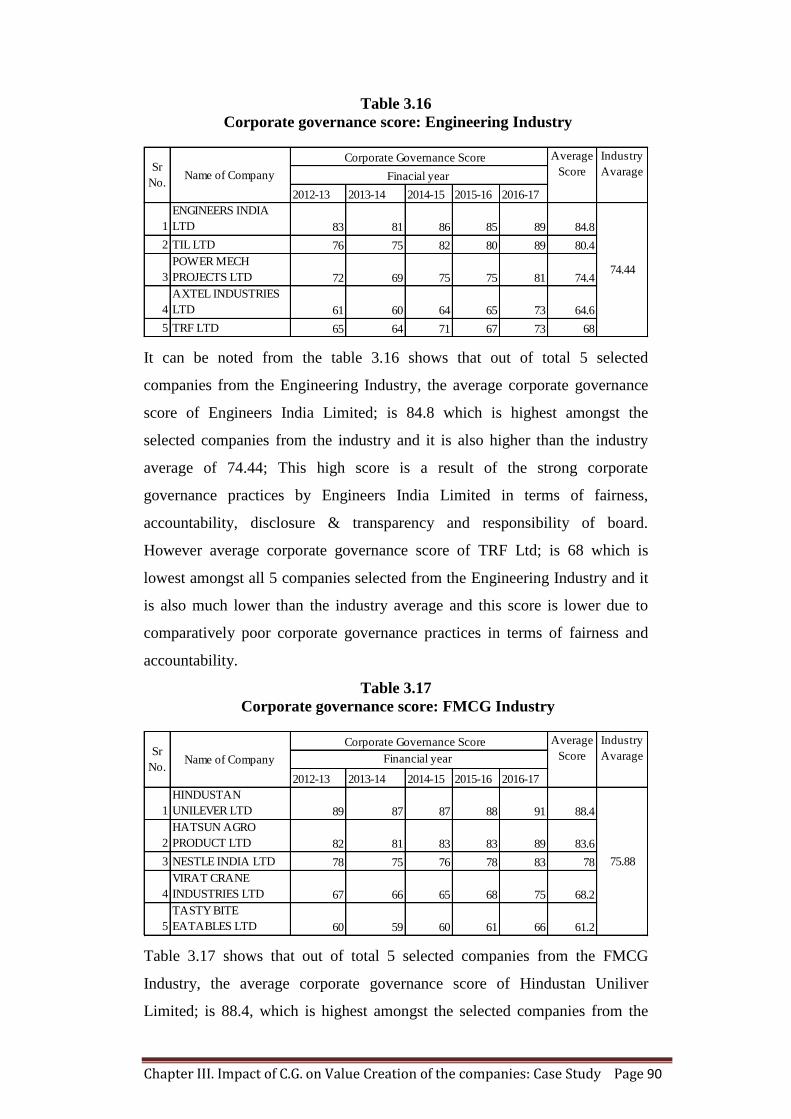
Table 3.16
Corporate governance score: Engineering Industry
It can be noted from the table 3.16 shows that out of total 5 selected
companies from the Engineering Industry, the average corporate governance
score of Engineers India Limited; is 84.8 which is highest amongst the
selected companies from the industry and it is also higher than the industry
average of 74.44; This high score is a result of the strong corporate
governance practices by Engineers India Limited in terms of fairness,
accountability, disclosure & transparency and responsibility of board.
However average corporate governance score of TRF Ltd; is 68 which is
lowest amongst all 5 companies selected from the Engineering Industry and it
is also much lower than the industry average and this score is lower due to
comparatively poor corporate governance practices in terms of fairness and
accountability.
Table 3.17
Corporate governance score: FMCG Industry
Table 3.17 shows that out of total 5 selected companies from the FMCG
Industry, the average corporate governance score of Hindustan Uniliver
Limited; is 88.4, which is highest amongst the selected companies from the
2012-13 2013-14 2014-15 2015-16 2016-17
1
ENGINEERS INDIA
LTD 83 81 86 85 89 84.8
2 TIL LTD 76 75 82 80 89 80.4
3
POWER MECH
PROJECTS LTD 72 69 75 75 81 74.4
4
AXTEL INDUSTRIES
LTD 61 60 64 65 73 64.6
5 TRF LTD 65 64 71 67 73 68
Sr
No.Name of Company
Corporate Governance Score
Finacial year
Average
Score
Industry
Avarage
74.44
2012-13 2013-14 2014-15 2015-16 2016-17
1
HINDUSTAN
UNILEVER LTD 89 87 87 88 91 88.4
2
HATSUN AGRO
PRODUCT LTD 82 81 83 83 89 83.6
3 NESTLE INDIA LTD 78 75 76 78 83 78
4
VIRAT CRANE
INDUSTRIES LTD 67 66 65 68 75 68.2
5
TASTY BITE
EATABLES LTD 60 59 60 61 66 61.2
Sr
No.Name of Company
Corporate Governance Score
Financial year
Average
Score
Industry
Avarage
75.88
Chapter III. Impact of C.G. on Value Creation of the companies: Case Study Page 91
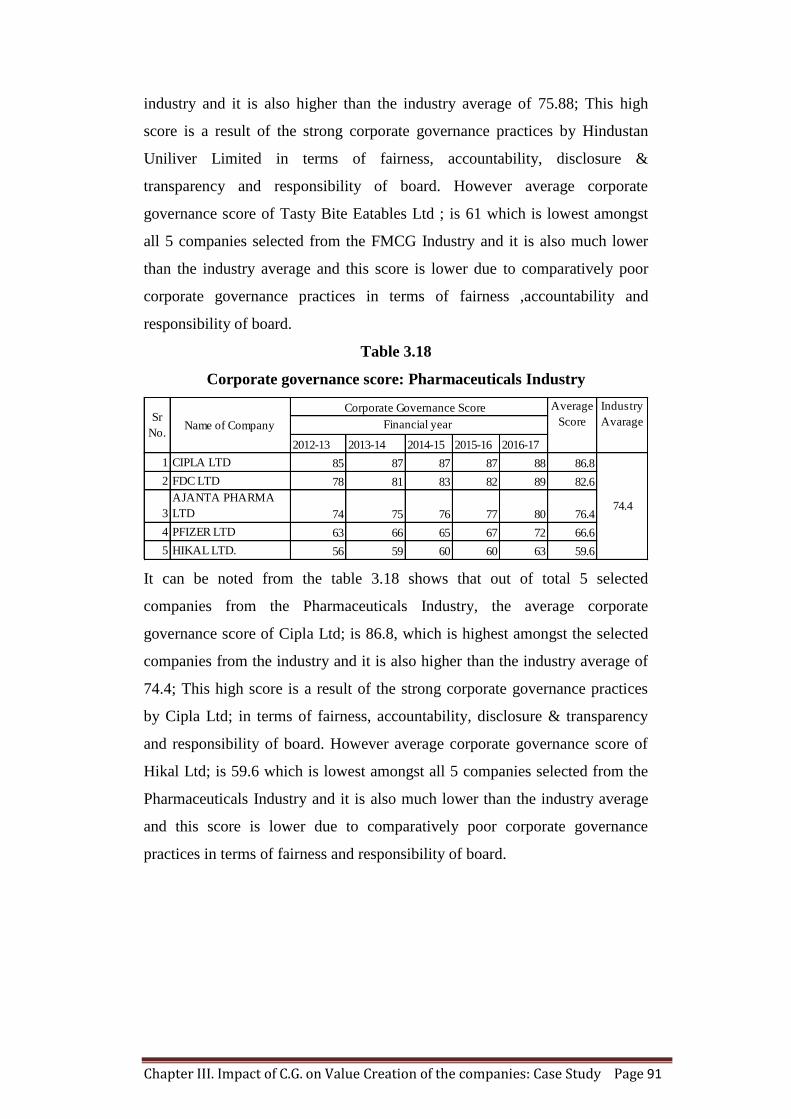
industry and it is also higher than the industry average of 75.88; This high
score is a result of the strong corporate governance practices by Hindustan
Uniliver Limited in terms of fairness, accountability, disclosure &
transparency and responsibility of board. However average corporate
governance score of Tasty Bite Eatables Ltd ; is 61 which is lowest amongst
all 5 companies selected from the FMCG Industry and it is also much lower
than the industry average and this score is lower due to comparatively poor
corporate governance practices in terms of fairness ,accountability and
responsibility of board.
Table 3.18
Corporate governance score: Pharmaceuticals Industry
It can be noted from the table 3.18 shows that out of total 5 selected
companies from the Pharmaceuticals Industry, the average corporate
governance score of Cipla Ltd; is 86.8, which is highest amongst the selected
companies from the industry and it is also higher than the industry average of
74.4; This high score is a result of the strong corporate governance practices
by Cipla Ltd; in terms of fairness, accountability, disclosure & transparency
and responsibility of board. However average corporate governance score of
Hikal Ltd; is 59.6 which is lowest amongst all 5 companies selected from the
Pharmaceuticals Industry and it is also much lower than the industry average
and this score is lower due to comparatively poor corporate governance
practices in terms of fairness and responsibility of board.
2012-13 2013-14 2014-15 2015-16 2016-17
1 CIPLA LTD 85 87 87 87 88 86.8
2 FDC LTD 78 81 83 82 89 82.6
3
AJANTA PHARMA
LTD 74 75 76 77 80 76.4
4 PFIZER LTD 63 66 65 67 72 66.6
5 HIKAL LTD. 56 59 60 60 63 59.6
Sr
No.Name of Company
Corporate Governance Score
Financial year
Industry
Avarage
74.4
Average
Score
Chapter III. Impact of C.G. on Value Creation of the companies: Case Study Page 92
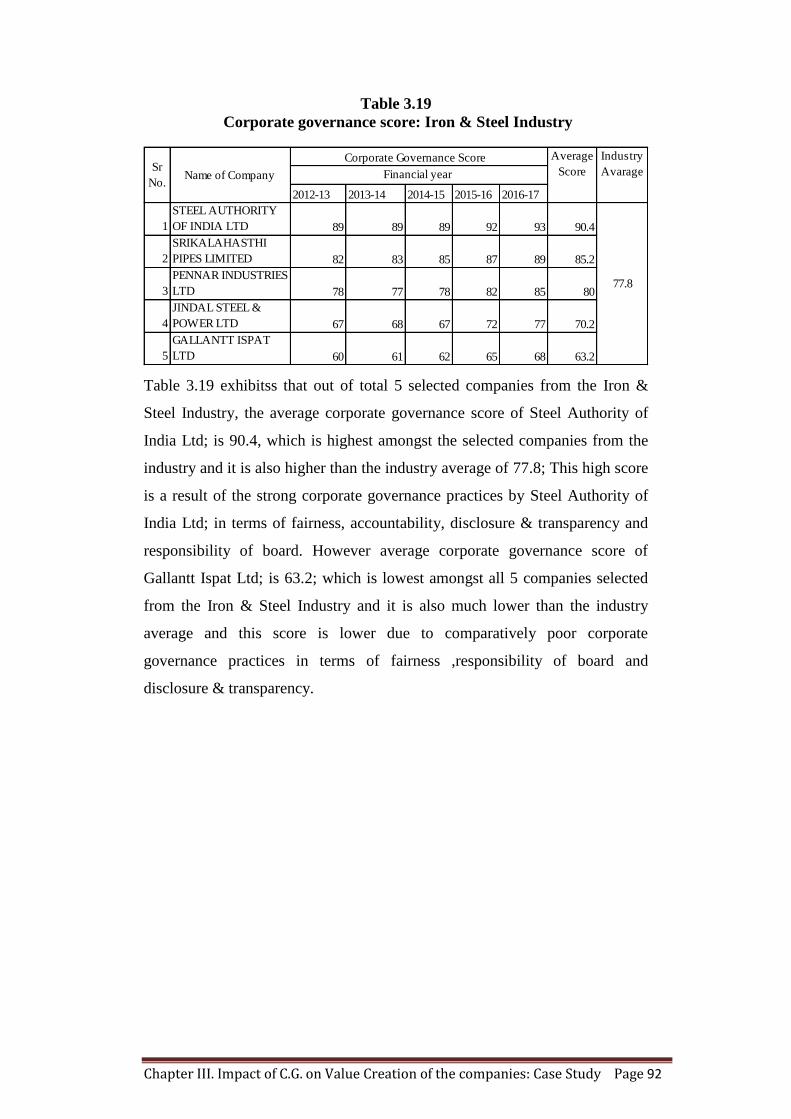
Table 3.19
Corporate governance score: Iron & Steel Industry
Table 3.19 exhibitss that out of total 5 selected companies from the Iron &
Steel Industry, the average corporate governance score of Steel Authority of
India Ltd; is 90.4, which is highest amongst the selected companies from the
industry and it is also higher than the industry average of 77.8; This high score
is a result of the strong corporate governance practices by Steel Authority of
India Ltd; in terms of fairness, accountability, disclosure & transparency and
responsibility of board. However average corporate governance score of
Gallantt Ispat Ltd; is 63.2; which is lowest amongst all 5 companies selected
from the Iron & Steel Industry and it is also much lower than the industry
average and this score is lower due to comparatively poor corporate
governance practices in terms of fairness ,responsibility of board and
disclosure & transparency.
2012-13 2013-14 2014-15 2015-16 2016-17
1
STEEL AUTHORITY
OF INDIA LTD 89 89 89 92 93 90.4
2
SRIKALAHASTHI
PIPES LIMITED 82 83 85 87 89 85.2
3
PENNAR INDUSTRIES
LTD 78 77 78 82 85 80
4
JINDAL STEEL &
POWER LTD 67 68 67 72 77 70.2
5
GALLANTT ISPAT
LTD 60 61 62 65 68 63.2
Sr
No.Name of Company
Corporate Governance Score
Financial year
Average
Score
Industry
Avarage
77.8
Chapter III. Impact of C.G. on Value Creation of the companies: Case Study Page 93
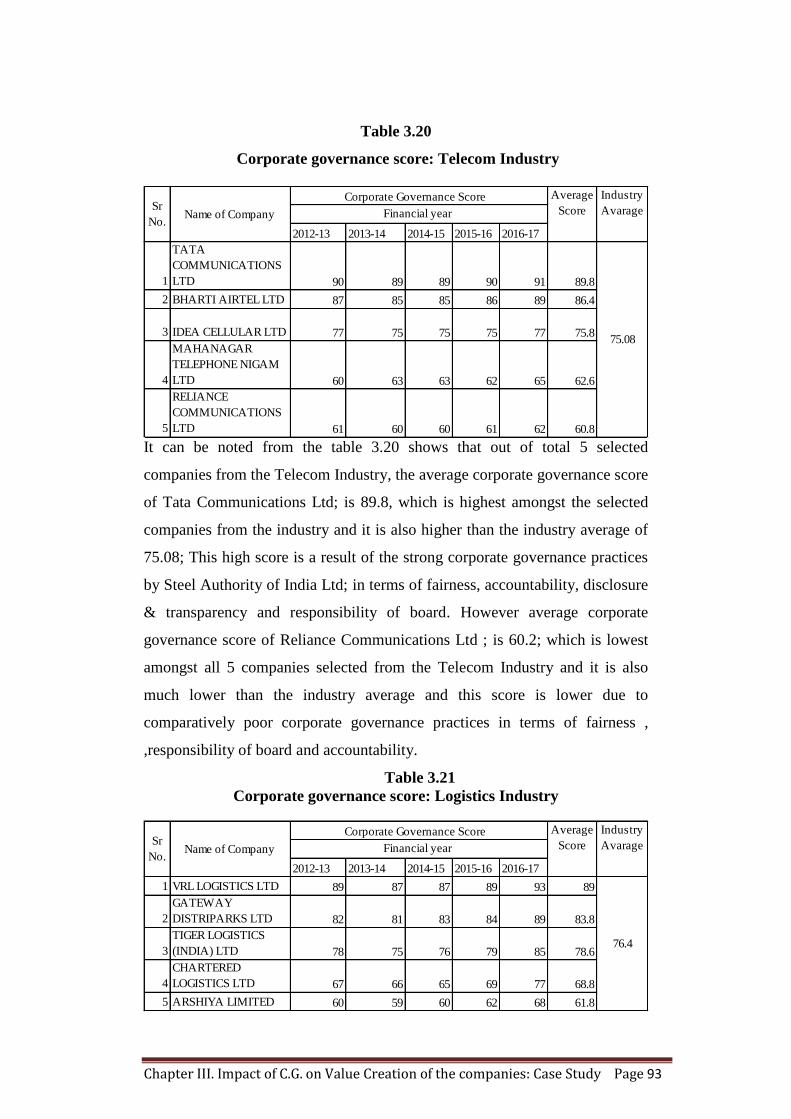
Table 3.20
Corporate governance score: Telecom Industry
It can be noted from the table 3.20 shows that out of total 5 selected
companies from the Telecom Industry, the average corporate governance score
of Tata Communications Ltd; is 89.8, which is highest amongst the selected
companies from the industry and it is also higher than the industry average of
75.08; This high score is a result of the strong corporate governance practices
by Steel Authority of India Ltd; in terms of fairness, accountability, disclosure
& transparency and responsibility of board. However average corporate
governance score of Reliance Communications Ltd ; is 60.2; which is lowest
amongst all 5 companies selected from the Telecom Industry and it is also
much lower than the industry average and this score is lower due to
comparatively poor corporate governance practices in terms of fairness ,
,responsibility of board and accountability.
Table 3.21
Corporate governance score: Logistics Industry
2012-13 2013-14 2014-15 2015-16 2016-17
1
TATA
COMMUNICATIONS
LTD 90 89 89 90 91 89.8
2 BHARTI AIRTEL LTD 87 85 85 86 89 86.4
3 IDEA CELLULAR LTD 77 75 75 75 77 75.8
4
MAHANAGAR
TELEPHONE NIGAM
LTD 60 63 63 62 65 62.6
5
RELIANCE
COMMUNICATIONS
LTD 61 60 60 61 62 60.8
Sr
No.Name of Company
Corporate Governance Score
Financial year
75.08
Average
Score
Industry
Avarage
2012-13 2013-14 2014-15 2015-16 2016-17
1 VRL LOGISTICS LTD 89 87 87 89 93 89
2
GATEWAY
DISTRIPARKS LTD 82 81 83 84 89 83.8
3
TIGER LOGISTICS
(INDIA) LTD 78 75 76 79 85 78.6
4
CHARTERED
LOGISTICS LTD 67 66 65 69 77 68.8
5 ARSHIYA LIMITED 60 59 60 62 68 61.8
Sr
No.Name of Company
Corporate Governance Score
Financial year
Average
Score
Industry
Avarage
76.4
Chapter III. Impact of C.G. on Value Creation of the companies: Case Study Page 94
Table 3.21 shows that out of total 5 selected companies from the Logistics
Industry, the average corporate governance score of VRL Logistics Ltd; is 89,
which is highest amongst the selected companies from the industry, moreover
it is also higher than the industry average of 76.4; This high score is a result of
the strong corporate governance practices by VRL Logistics Ltd; in terms of
fairness, accountability, disclosure & transparency and responsibility of board.
However average corporate governance score of Arshiya Limited; is 61.8;
which is lowest amongst all 5 companies selected from the Logistics Industry
and it is also much lower than the industry average and this score is lower due
to comparatively poor corporate governance practices in terms of fairness,
responsibility of board and accountability.
3.8 Economic Value Added as Measure of Value Creation:
It is revealed from the literature survey, that all most all the studies conducted
to measure the impact of the corporate governance on performance of the
corporates, have taken profitability and traditional profit-based measures like
accounting ratios, earning per share, return on capital return on assets,
shareholders value added (SVA) & Tobin‘s q as a dependent variable and have
measured the impact of the corporate governance on firm performance.
However, no studies have been conducted so far to measure the impact of
corporate governance on the value creation of companies.
In this part of the chapter, an attempt is made to identify the value-based
performance measure of the firm i.e. Economic Value Added (EVA) and the
Economic value added (EVA) has been calculated for 80 sample companies
for the 5 years.
Ample Corporates have struggled in recent years despite some huge
competitive advantages of assets, technology, and functional skills. Corporate
governance has to be accepted as a fiduciary responsibility of the board of
directors. The measurement approach to corporate governance would enable
the board to admit that despite good projects, the company's increase in the
cost of capital, rise in investment requirement per Rupee of output and lower
Chapter III. Impact of C.G. on Value Creation of the companies: Case Study Page 95
margins on output are clear signs of value disintegration due to poor corporate
governance". (Mishra K. C., 1998)
All the businesses in the world have emerged as a result of the entrepreneurial
aptitude of a person willing to take all the risks necessary to make him earn
some profit. Success is justifiable as a reward for profits. Creating wealth is
the main objective of any business. The company which is attaining successful
value creation never meets capital shortage, because, it can make enough
capital internally and attract more capital from the markets.
The real owners and investors in the business working with the agency theory
are the equity shareholders. They take the risk to invest with the motive of not
only profit maximization but also with the reward in the form of wealth
maximization. Profit earning is the primary concern of the shareholders;
however, the scholars have pointed out that long term shareholders value
creation by running the corporate as employee-driven and consumer-driven
organizations will lead a value creation of the company as a whole.
Shareholder value creation is becoming the new corporate goal in India.
Shareholder value is gauged by the returns they have received. The
shareholders require a minimum return on their investment based on the risk in
the investment. The companies cannot run and grow, if it fails to create value
to its shareholders.
In the present scenario, the success of the companies is measured in terms of
shareholders' value creation. Value creation may be short-term or long term
but the real investors (other than speculators) invest in the companies which
create the shareholders‘ value.
There are a number of value-based measures. Shareholder Value Added
(SVA) is one of the values-based performance measures and helps to find out
the value of the shareholders. It focuses mainly on the operating performance
of the company and it combines income statement and balance sheet data to
determine the excess returns available to all shareholders. Economic Value
Chapter III. Impact of C.G. on Value Creation of the companies: Case Study Page 96
Added and Market Value Added also has emerged as the most popular and
efficient tool to measure the performance of the company.
Performance measurement is the current corporate standard in recent years
used to measure shareholder‘s wealth. Traditional financial performance
measures are based upon the companies‘ profitability and ratios only, but for
driving shareholder value these methods were not found suitable while EVA
has revealed its reign on these traditional measures. (Jain, 2016)
The empirical studies highlight that single accounting measures cannot be
used for measuring shareholders' wealth. Financial measures used in
measuring the firm‘s performance must be highly correlated with the wealth of
shareholders. Traditional performance evaluation standard only considers the
quantity of profit; however, in order to specify the real value of a company,
the quality of profit must also be taken into account (Chen and Dodd, 1997)
To eliminate the shortcomings of traditional financial measures, EVA was
introduced by Joule M. Stern and Stewart (1989). Stern Stewart and co-
developed this tool to measure overall financial measures that encourage the
company to concentrate on the delivery of shareholder value EVA enlightens
whether the economic profit is enough to cover the cost of capital or not.
Economic Value Added (EVA) is the difference between operating profit and
the cost of the capital used to attain that. EVA provides significant information
beyond traditional accounting measures of EPS, ROA and ROE (Chen and
Dodd, 1997)
EVA is a better measure than EPS, PAT and ROCE and better goal
congruence than ROI. (Brewer, Peter C; atl.,, 1999)
Economic Value Added (EVA) is an improved measure of checking the
company performance so that the stakeholders can decide that the company is
generating or destroying their wealth. EVA is the latest and modern measure
technique to know the efficiency of the companies whether they are
Chapter III. Impact of C.G. on Value Creation of the companies: Case Study Page 97
maximizing or reducing the value of shareholders' wealth. Therefore this paper
is designed with an attempt to know which companies are the wealth
generators or destroyer for the shareholders. The main objective of the study is
to rank the companies on the basis of EVA. (Dhiman and Pruthi, 2012)
3.8.1. Calculation of EVA:
To achieve the objectives of the study and to evaluate the impact of the
corporate governance on value creation of the company, EVA has been taking
as a measure to calculate the value creation of the companies. The EVA of
each sample company has been calculated for the financial year 2012-13,
2013-14, 2014-15, 2015-16 & 2016-17.
EVA is based on the concept that a company should earn at least its cost of
capital. Firms that earn higher returns than financing costs benefit
shareholders and account for increased shareholder value. In its simplest form,
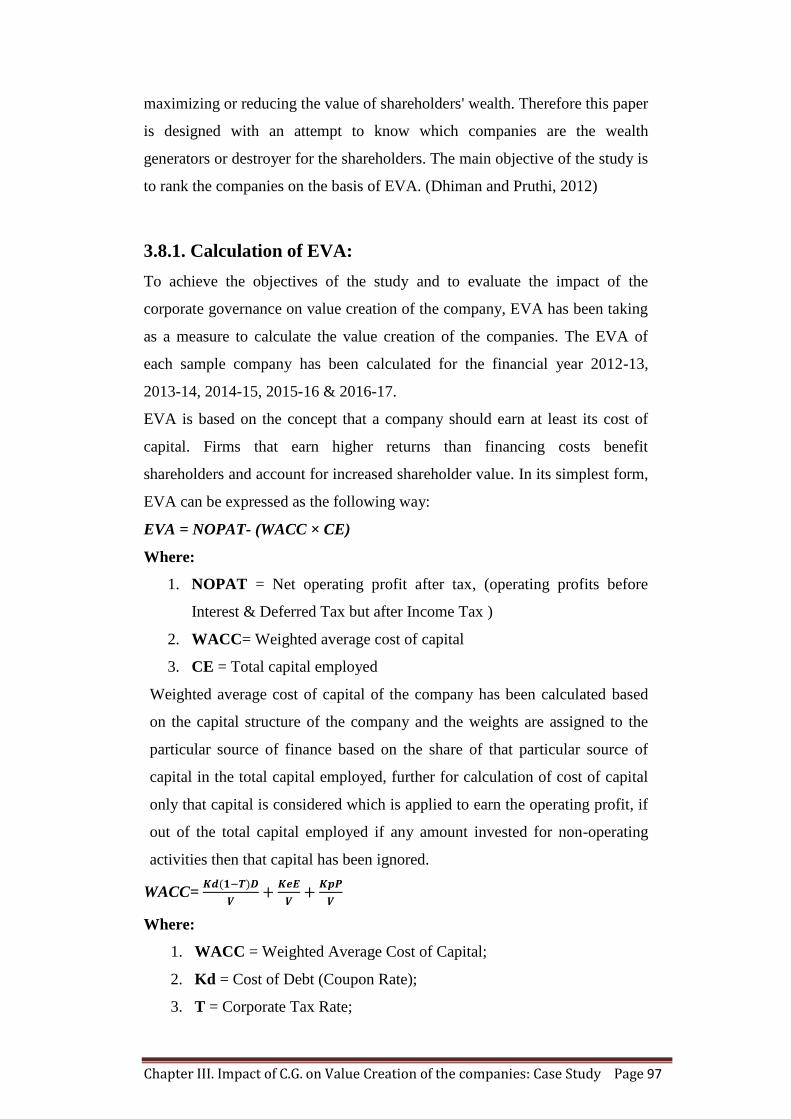
EVA can be expressed as the following way:
EVA = NOPAT- (WACC × CE)
Where:
1. NOPAT = Net operating profit after tax, (operating profits before
Interest & Deferred Tax but after Income Tax )
2. WACC= Weighted average cost of capital
3. CE = Total capital employed
Weighted average cost of capital of the company has been calculated based
on the capital structure of the company and the weights are assigned to the
particular source of finance based on the share of that particular source of
capital in the total capital employed, further for calculation of cost of capital
only that capital is considered which is applied to earn the operating profit, if
out of the total capital employed if any amount invested for non-operating
activities then that capital has been ignored.
WACC=
Where:
1. WACC = Weighted Average Cost of Capital;
2. Kd = Cost of Debt (Coupon Rate);
3. T = Corporate Tax Rate;
Chapter III. Impact of C.G. on Value Creation of the companies: Case Study Page 98
4. V = Total Debt + Total Preference Share Capital + Market Value of
Equity Capital (D+MVE+P);
5. D = Total Debt Capital;
6. Ke = Cost of Equity calculated using CAPM model;
7. E = Market Value of Equity Capital (as on 31st March);
8. Kp= Cost of Preference Capital (Coupon Dividend)
9. P = Preference Capital
The cost of equity is measured on the basis of capital asset pricing method for
calculating and WACC Cost of debt is taken as after-tax cost. Under the
Capital Asset Pricing Model, cost of equity (Ke) is calculated as:
Ke = Rf + β (Rm- Rf)
Where,
4. Ke= Cost of Equity
5. Rf= Risk-Free Rate of Return (using Interest Rate on 90 days T-Bills);
6. Rm = Market Return (Using SENSEX as benchmark index)
7. β = Risk coefficient
EVA is positive if NOPAT exceeds the cost of financing. The authors of EVA
state that, in this case, the company has created shareholder value. On the
other hand, when EVA is negative, the company is destroying the value of the
shareholder. The computed EVA for all the selected companies is annexed
(Annexure-IV). Industry wise comparative analysis of the computed
Economic value added (EVA) is describe as follow:
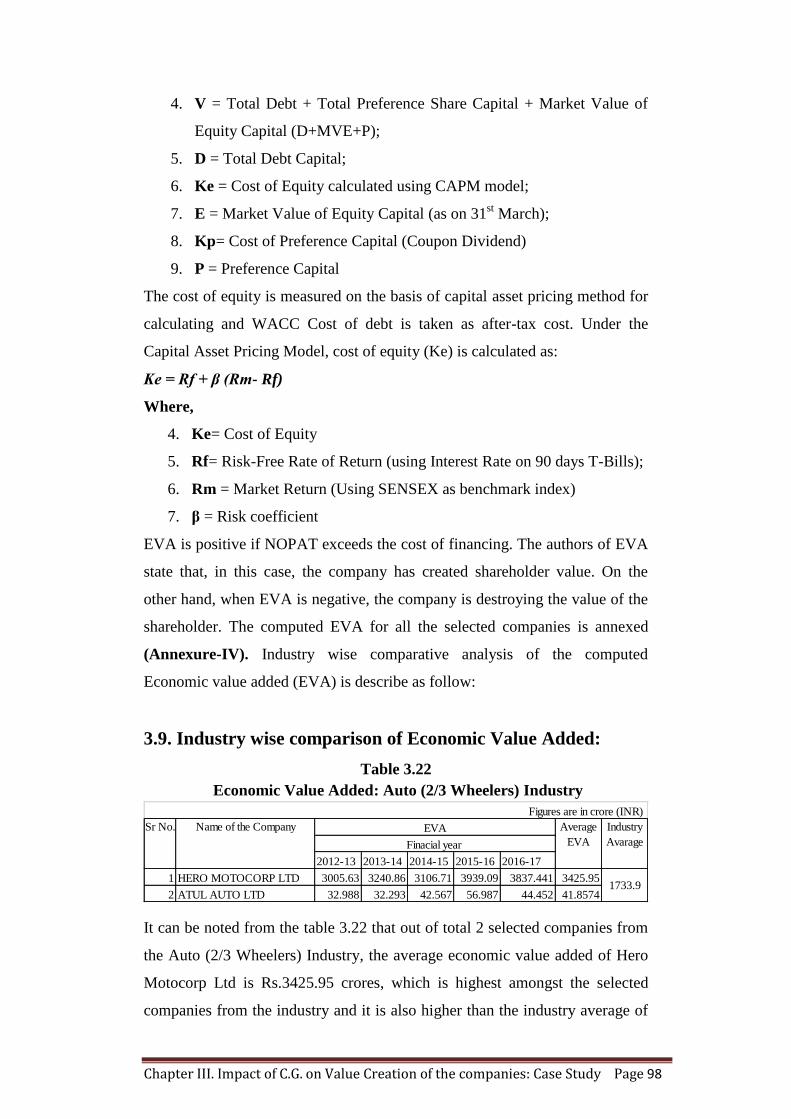
3.9. Industry wise comparison of Economic Value Added:
Table 3.22
Economic Value Added: Auto (2/3 Wheelers) Industry
It can be noted from the table 3.22 that out of total 2 selected companies from
the Auto (2/3 Wheelers) Industry, the average economic value added of Hero
Motocorp Ltd is Rs.3425.95 crores, which is highest amongst the selected
companies from the industry and it is also higher than the industry average of
2012-13 2013-14 2014-15 2015-16 2016-17
1 HERO MOTOCORP LTD 3005.63 3240.86 3106.71 3939.09 3837.441 3425.95
2 ATUL AUTO LTD 32.988 32.293 42.567 56.987 44.452 41.8574
Figures are in crore (INR)
Average
EVA
Industry
Avarage
1733.9
Sr No. Name of the Company EVA
Finacial year
Chapter III. Impact of C.G. on Value Creation of the companies: Case Study Page 99
Rs.1733.9 crores, However average economic value added of Atul Auto Ltd is
Rs.41.85 crores , which is lowest amongst companies selected from the Auto
(2/3 Wheelers) Industry.
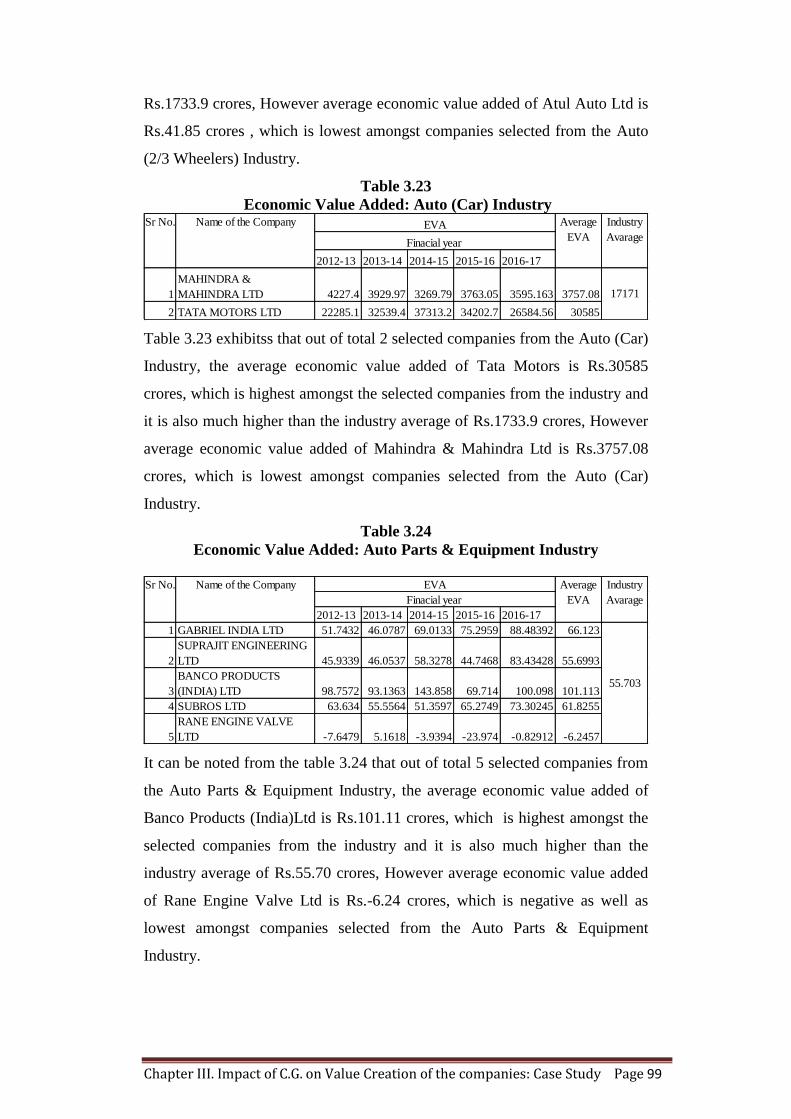
Table 3.23
Economic Value Added: Auto (Car) Industry
Table 3.23 exhibitss that out of total 2 selected companies from the Auto (Car)
Industry, the average economic value added of Tata Motors is Rs.30585
crores, which is highest amongst the selected companies from the industry and
it is also much higher than the industry average of Rs.1733.9 crores, However
average economic value added of Mahindra & Mahindra Ltd is Rs.3757.08
crores, which is lowest amongst companies selected from the Auto (Car)
Industry.
Table 3.24
Economic Value Added: Auto Parts & Equipment Industry
It can be noted from the table 3.24 that out of total 5 selected companies from
the Auto Parts & Equipment Industry, the average economic value added of
Banco Products (India)Ltd is Rs.101.11 crores, which is highest amongst the
selected companies from the industry and it is also much higher than the
industry average of Rs.55.70 crores, However average economic value added
of Rane Engine Valve Ltd is Rs.-6.24 crores, which is negative as well as
lowest amongst companies selected from the Auto Parts & Equipment
Industry.
2012-13 2013-14 2014-15 2015-16 2016-17
1
MAHINDRA &
MAHINDRA LTD 4227.4 3929.97 3269.79 3763.05 3595.163 3757.08
2 TATA MOTORS LTD 22285.1 32539.4 37313.2 34202.7 26584.56 30585
Average
EVA
Industry
Avarage
17171
Sr No. Name of the Company EVA
Finacial year
2012-13 2013-14 2014-15 2015-16 2016-17
1 GABRIEL INDIA LTD 51.7432 46.0787 69.0133 75.2959 88.48392 66.123
2
SUPRAJIT ENGINEERING
LTD 45.9339 46.0537 58.3278 44.7468 83.43428 55.6993
3
BANCO PRODUCTS
(INDIA) LTD 98.7572 93.1363 143.858 69.714 100.098 101.113
4 SUBROS LTD 63.634 55.5564 51.3597 65.2749 73.30245 61.8255
5
RANE ENGINE VALVE
LTD -7.6479 5.1618 -3.9394 -23.974 -0.82912 -6.2457
Average
EVA
Industry
Avarage
55.703
Sr No. Name of the Company EVA
Finacial year
Chapter III. Impact of C.G. on Value Creation of the companies: Case Study Page 100
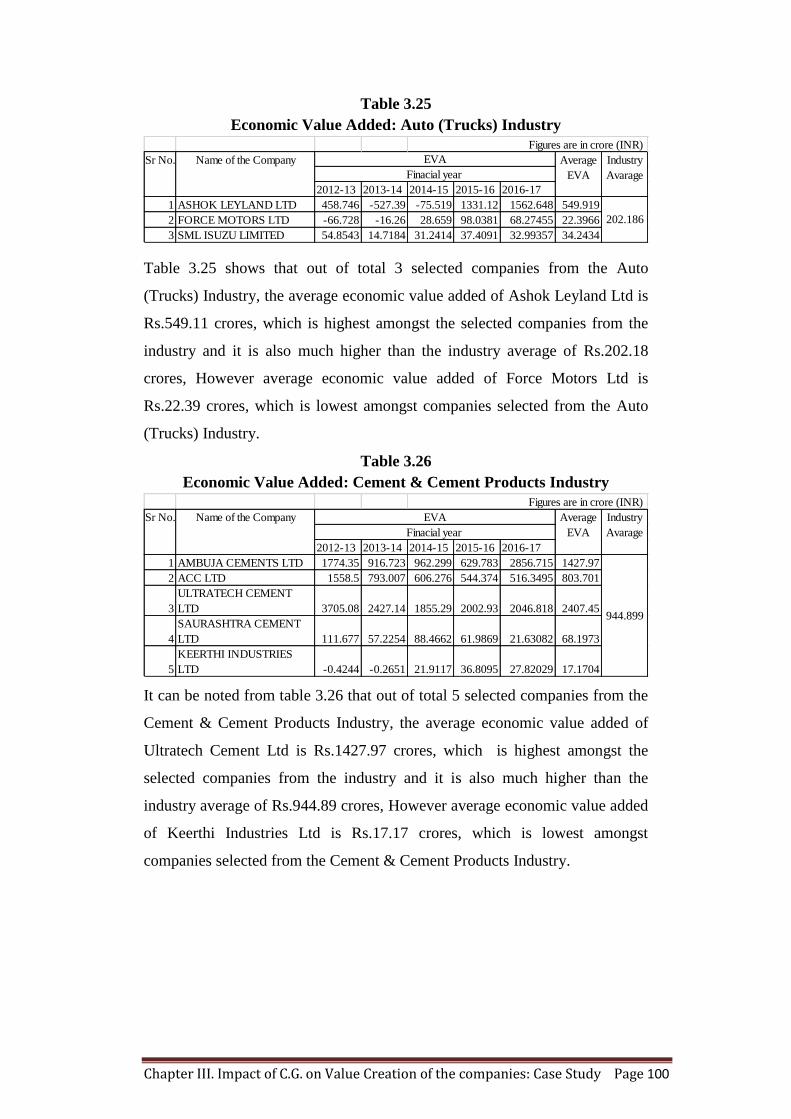
Table 3.25
Economic Value Added: Auto (Trucks) Industry
Table 3.25 shows that out of total 3 selected companies from the Auto
(Trucks) Industry, the average economic value added of Ashok Leyland Ltd is
Rs.549.11 crores, which is highest amongst the selected companies from the
industry and it is also much higher than the industry average of Rs.202.18
crores, However average economic value added of Force Motors Ltd is
Rs.22.39 crores, which is lowest amongst companies selected from the Auto
(Trucks) Industry.
Table 3.26
Economic Value Added: Cement & Cement Products Industry
It can be noted from table 3.26 that out of total 5 selected companies from the
Cement & Cement Products Industry, the average economic value added of
Ultratech Cement Ltd is Rs.1427.97 crores, which is highest amongst the
selected companies from the industry and it is also much higher than the
industry average of Rs.944.89 crores, However average economic value added
of Keerthi Industries Ltd is Rs.17.17 crores, which is lowest amongst
companies selected from the Cement & Cement Products Industry.
2012-13 2013-14 2014-15 2015-16 2016-17
1 ASHOK LEYLAND LTD 458.746 -527.39 -75.519 1331.12 1562.648 549.919
2 FORCE MOTORS LTD -66.728 -16.26 28.659 98.0381 68.27455 22.3966
3 SML ISUZU LIMITED 54.8543 14.7184 31.2414 37.4091 32.99357 34.2434
Figures are in crore (INR)
Average
EVA
Industry
Avarage
202.186
Sr No. Name of the Company EVA
Finacial year
2012-13 2013-14 2014-15 2015-16 2016-17
1 AMBUJA CEMENTS LTD 1774.35 916.723 962.299 629.783 2856.715 1427.97
2 ACC LTD 1558.5 793.007 606.276 544.374 516.3495 803.701
3
ULTRATECH CEMENT
LTD 3705.08 2427.14 1855.29 2002.93 2046.818 2407.45
4
SAURASHTRA CEMENT
LTD 111.677 57.2254 88.4662 61.9869 21.63082 68.1973
5
KEERTHI INDUSTRIES
LTD -0.4244 -0.2651 21.9117 36.8095 27.82029 17.1704
Figures are in crore (INR)
Average
EVA
Industry
Avarage
944.899
Sr No. Name of the Company EVA
Finacial year
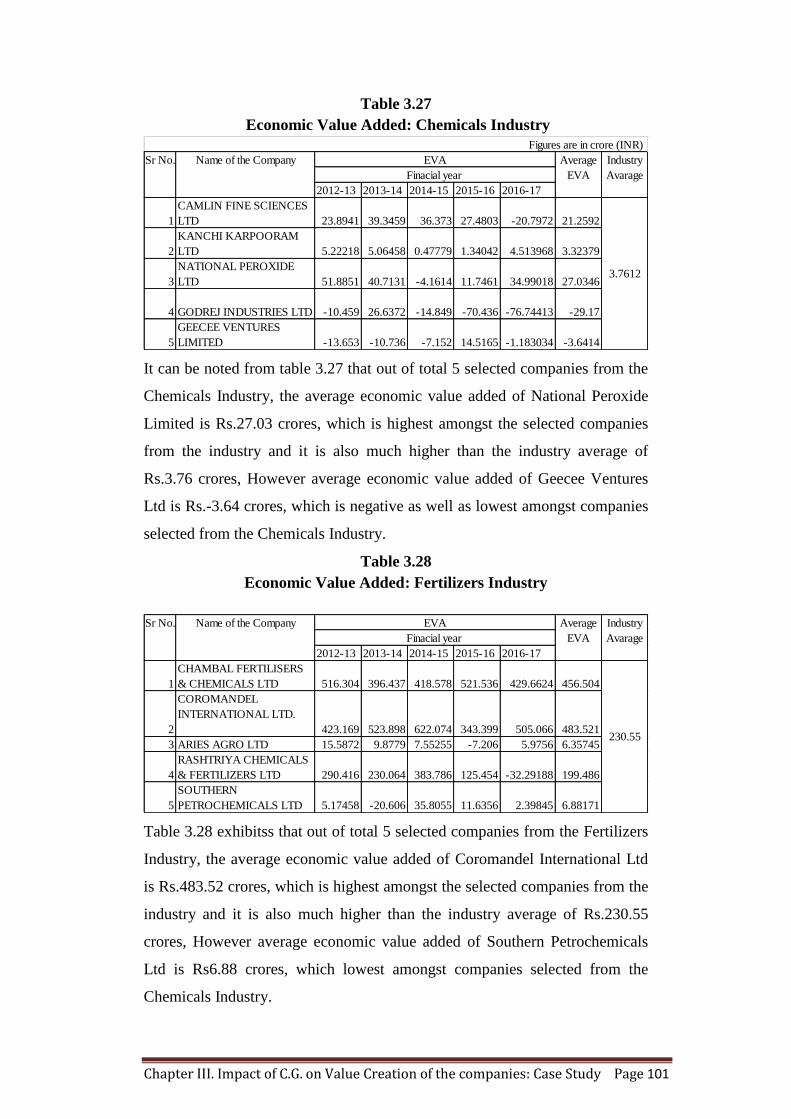
Chapter III. Impact of C.G. on Value Creation of the companies: Case Study Page 101
Table 3.27
Economic Value Added: Chemicals Industry
It can be noted from table 3.27 that out of total 5 selected companies from the
Chemicals Industry, the average economic value added of National Peroxide
Limited is Rs.27.03 crores, which is highest amongst the selected companies
from the industry and it is also much higher than the industry average of
Rs.3.76 crores, However average economic value added of Geecee Ventures
Ltd is Rs.-3.64 crores, which is negative as well as lowest amongst companies
selected from the Chemicals Industry.
Table 3.28
Economic Value Added: Fertilizers Industry
Table 3.28 exhibitss that out of total 5 selected companies from the Fertilizers
Industry, the average economic value added of Coromandel International Ltd
is Rs.483.52 crores, which is highest amongst the selected companies from the
industry and it is also much higher than the industry average of Rs.230.55
crores, However average economic value added of Southern Petrochemicals
Ltd is Rs6.88 crores, which lowest amongst companies selected from the
Chemicals Industry.
2012-13 2013-14 2014-15 2015-16 2016-17
1
CAMLIN FINE SCIENCES
LTD 23.8941 39.3459 36.373 27.4803 -20.7972 21.2592
2
KANCHI KARPOORAM
LTD 5.22218 5.06458 0.47779 1.34042 4.513968 3.32379
3
NATIONAL PEROXIDE
LTD 51.8851 40.7131 -4.1614 11.7461 34.99018 27.0346
4 GODREJ INDUSTRIES LTD -10.459 26.6372 -14.849 -70.436 -76.74413 -29.17
5
GEECEE VENTURES
LIMITED -13.653 -10.736 -7.152 14.5165 -1.183034 -3.6414
Figures are in crore (INR)
3.7612
Average
EVA
Industry
Avarage
Sr No. Name of the Company EVA
Finacial year
2012-13 2013-14 2014-15 2015-16 2016-17
1
CHAMBAL FERTILISERS
& CHEMICALS LTD 516.304 396.437 418.578 521.536 429.6624 456.504
2
COROMANDEL
INTERNATIONAL LTD.
423.169 523.898 622.074 343.399 505.066 483.521
3 ARIES AGRO LTD 15.5872 9.8779 7.55255 -7.206 5.9756 6.35745
4
RASHTRIYA CHEMICALS
& FERTILIZERS LTD 290.416 230.064 383.786 125.454 -32.29188 199.486
5
SOUTHERN
PETROCHEMICALS LTD 5.17458 -20.606 35.8055 11.6356 2.39845 6.88171
Average
EVA
Industry
Avarage
230.55
Sr No. Name of the Company EVA
Finacial year
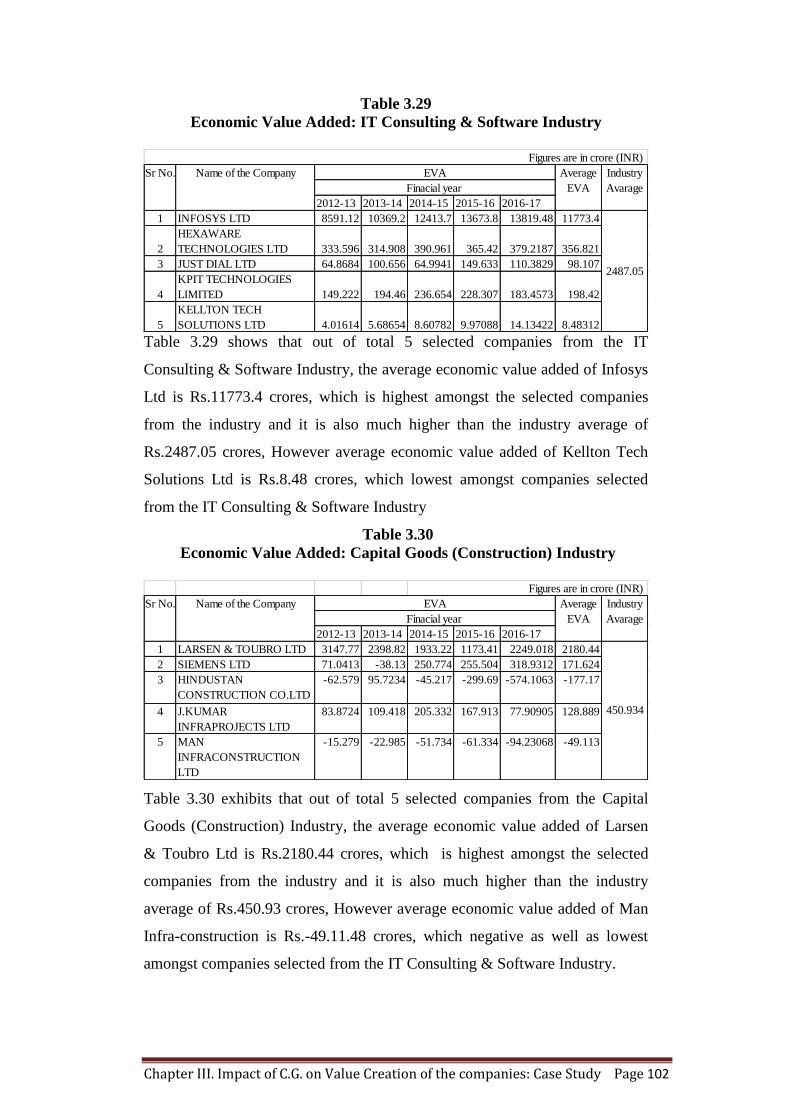
Chapter III. Impact of C.G. on Value Creation of the companies: Case Study Page 102
Table 3.29
Economic Value Added: IT Consulting & Software Industry
Table 3.29 shows that out of total 5 selected companies from the IT
Consulting & Software Industry, the average economic value added of Infosys
Ltd is Rs.11773.4 crores, which is highest amongst the selected companies
from the industry and it is also much higher than the industry average of
Rs.2487.05 crores, However average economic value added of Kellton Tech
Solutions Ltd is Rs.8.48 crores, which lowest amongst companies selected
from the IT Consulting & Software Industry
Table 3.30
Economic Value Added: Capital Goods (Construction) Industry
Table 3.30 exhibits that out of total 5 selected companies from the Capital
Goods (Construction) Industry, the average economic value added of Larsen
& Toubro Ltd is Rs.2180.44 crores, which is highest amongst the selected
companies from the industry and it is also much higher than the industry
average of Rs.450.93 crores, However average economic value added of Man
Infra-construction is Rs.-49.11.48 crores, which negative as well as lowest
amongst companies selected from the IT Consulting & Software Industry.
2012-13 2013-14 2014-15 2015-16 2016-17
1 INFOSYS LTD 8591.12 10369.2 12413.7 13673.8 13819.48 11773.4
2
HEXAWARE
TECHNOLOGIES LTD 333.596 314.908 390.961 365.42 379.2187 356.821
3 JUST DIAL LTD 64.8684 100.656 64.9941 149.633 110.3829 98.107
4
KPIT TECHNOLOGIES
LIMITED 149.222 194.46 236.654 228.307 183.4573 198.42
5
KELLTON TECH
SOLUTIONS LTD 4.01614 5.68654 8.60782 9.97088 14.13422 8.48312
Figures are in crore (INR)
Average
EVA
Industry
Avarage
2487.05
Sr No. Name of the Company EVA
Finacial year
2012-13 2013-14 2014-15 2015-16 2016-17
1 LARSEN & TOUBRO LTD 3147.77 2398.82 1933.22 1173.41 2249.018 2180.44
2 SIEMENS LTD 71.0413 -38.13 250.774 255.504 318.9312 171.624
3 HINDUSTAN
CONSTRUCTION CO.LTD
-62.579 95.7234 -45.217 -299.69 -574.1063 -177.17
4 J.KUMAR
INFRAPROJECTS LTD
83.8724 109.418 205.332 167.913 77.90905 128.889
5 MAN
INFRACONSTRUCTION
LTD
-15.279 -22.985 -51.734 -61.334 -94.23068 -49.113
Figures are in crore (INR)
450.934
Average
EVA
Industry
Avarage
Sr No. Name of the Company EVA
Finacial year
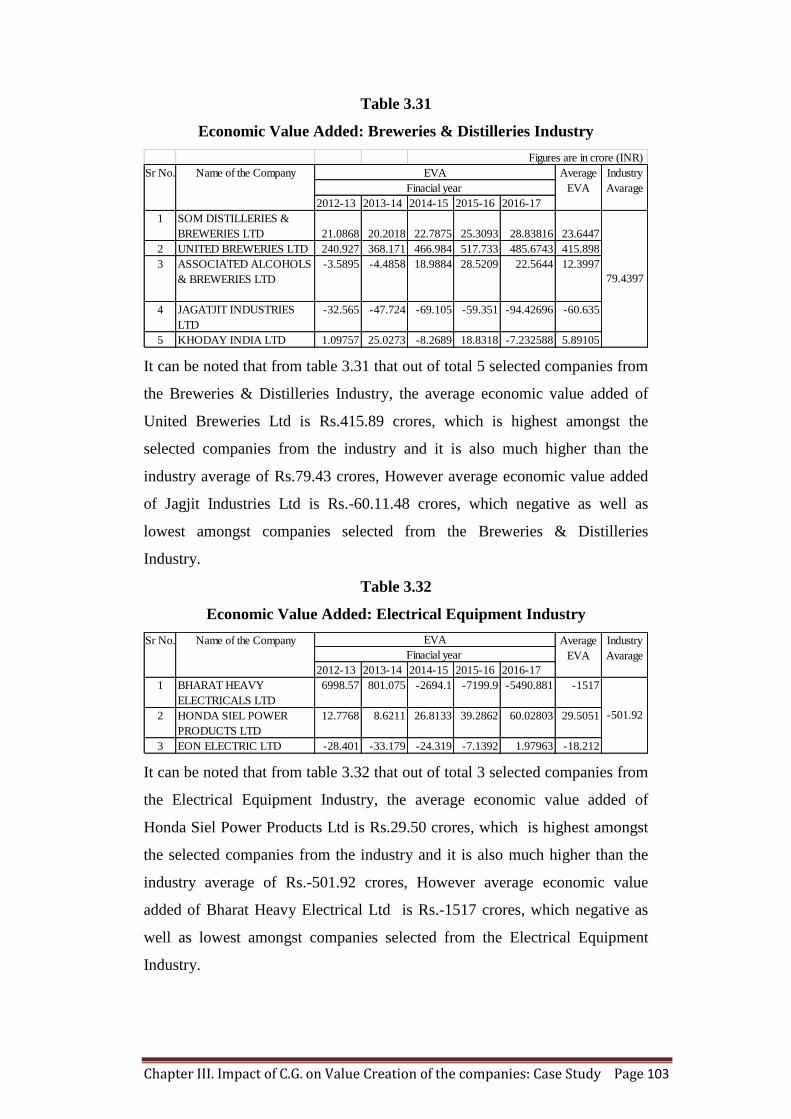
Chapter III. Impact of C.G. on Value Creation of the companies: Case Study Page 103
Table 3.31
Economic Value Added: Breweries & Distilleries Industry
It can be noted that from table 3.31 that out of total 5 selected companies from
the Breweries & Distilleries Industry, the average economic value added of
United Breweries Ltd is Rs.415.89 crores, which is highest amongst the
selected companies from the industry and it is also much higher than the
industry average of Rs.79.43 crores, However average economic value added
of Jagjit Industries Ltd is Rs.-60.11.48 crores, which negative as well as
lowest amongst companies selected from the Breweries & Distilleries
Industry.
Table 3.32
Economic Value Added: Electrical Equipment Industry
It can be noted that from table 3.32 that out of total 3 selected companies from
the Electrical Equipment Industry, the average economic value added of
Honda Siel Power Products Ltd is Rs.29.50 crores, which is highest amongst
the selected companies from the industry and it is also much higher than the
industry average of Rs.-501.92 crores, However average economic value
added of Bharat Heavy Electrical Ltd is Rs.-1517 crores, which negative as
well as lowest amongst companies selected from the Electrical Equipment
Industry.
2012-13 2013-14 2014-15 2015-16 2016-17
1 SOM DISTILLERIES &
BREWERIES LTD 21.0868 20.2018 22.7875 25.3093 28.83816 23.6447
2 UNITED BREWERIES LTD 240.927 368.171 466.984 517.733 485.6743 415.898
3 ASSOCIATED ALCOHOLS
& BREWERIES LTD
-3.5895 -4.4858 18.9884 28.5209 22.5644 12.3997
4 JAGATJIT INDUSTRIES
LTD
-32.565 -47.724 -69.105 -59.351 -94.42696 -60.635
5 KHODAY INDIA LTD 1.09757 25.0273 -8.2689 18.8318 -7.232588 5.89105
Figures are in crore (INR)
Average
EVA
Industry
Avarage
79.4397
Sr No. Name of the Company EVA
Finacial year
2012-13 2013-14 2014-15 2015-16 2016-17
1 BHARAT HEAVY
ELECTRICALS LTD
6998.57 801.075 -2694.1 -7199.9 -5490.881 -1517
2 HONDA SIEL POWER
PRODUCTS LTD
12.7768 8.6211 26.8133 39.2862 60.02803 29.5051
3 EON ELECTRIC LTD -28.401 -33.179 -24.319 -7.1392 1.97963 -18.212
Average
EVA
Industry
Avarage
-501.92
Sr No. Name of the Company EVA
Finacial year
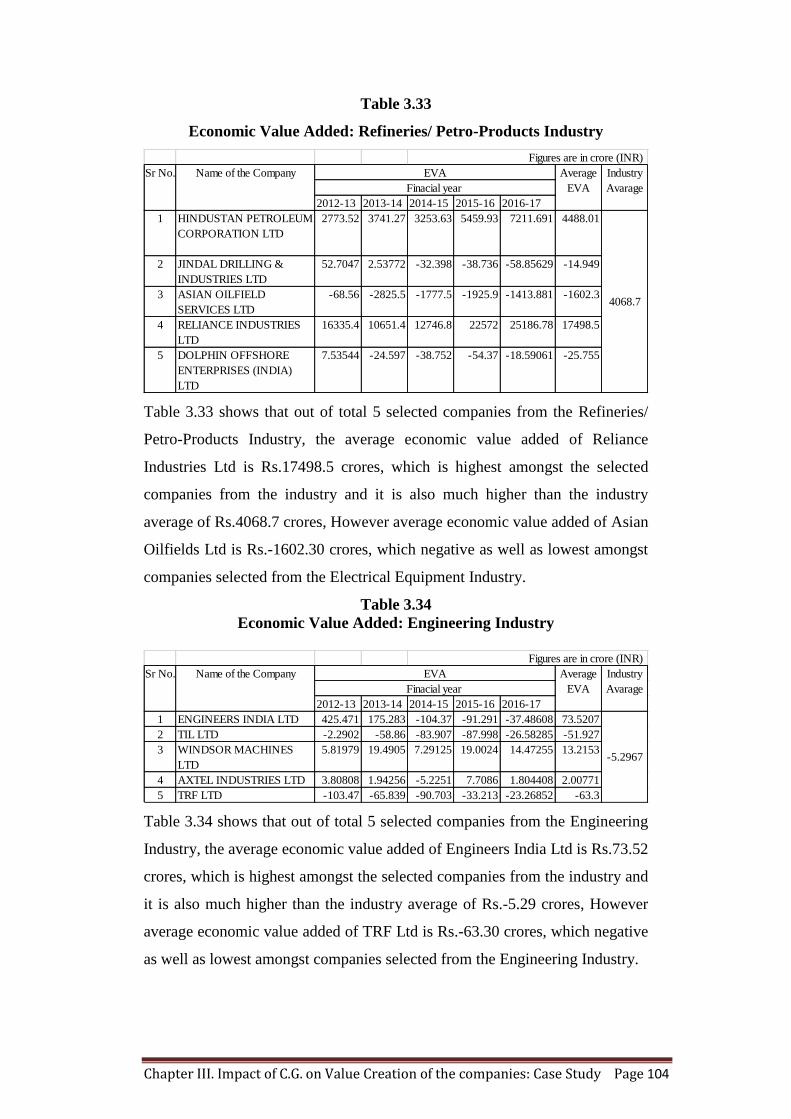
Chapter III. Impact of C.G. on Value Creation of the companies: Case Study Page 104
Table 3.33
Economic Value Added: Refineries/ Petro-Products Industry
Table 3.33 shows that out of total 5 selected companies from the Refineries/
Petro-Products Industry, the average economic value added of Reliance
Industries Ltd is Rs.17498.5 crores, which is highest amongst the selected
companies from the industry and it is also much higher than the industry
average of Rs.4068.7 crores, However average economic value added of Asian
Oilfields Ltd is Rs.-1602.30 crores, which negative as well as lowest amongst
companies selected from the Electrical Equipment Industry.
Table 3.34
Economic Value Added: Engineering Industry
Table 3.34 shows that out of total 5 selected companies from the Engineering
Industry, the average economic value added of Engineers India Ltd is Rs.73.52
crores, which is highest amongst the selected companies from the industry and
it is also much higher than the industry average of Rs.-5.29 crores, However
average economic value added of TRF Ltd is Rs.-63.30 crores, which negative
as well as lowest amongst companies selected from the Engineering Industry.
2012-13 2013-14 2014-15 2015-16 2016-17
1 HINDUSTAN PETROLEUM
CORPORATION LTD
2773.52 3741.27 3253.63 5459.93 7211.691 4488.01
2 JINDAL DRILLING &
INDUSTRIES LTD
52.7047 2.53772 -32.398 -38.736 -58.85629 -14.949
3 ASIAN OILFIELD
SERVICES LTD
-68.56 -2825.5 -1777.5 -1925.9 -1413.881 -1602.3
4 RELIANCE INDUSTRIES
LTD
16335.4 10651.4 12746.8 22572 25186.78 17498.5
5 DOLPHIN OFFSHORE
ENTERPRISES (INDIA)
LTD
7.53544 -24.597 -38.752 -54.37 -18.59061 -25.755
Figures are in crore (INR)
4068.7
Average
EVA
Industry
Avarage
Sr No. Name of the Company EVA
Finacial year
2012-13 2013-14 2014-15 2015-16 2016-17
1 ENGINEERS INDIA LTD 425.471 175.283 -104.37 -91.291 -37.48608 73.5207
2 TIL LTD -2.2902 -58.86 -83.907 -87.998 -26.58285 -51.927
3 WINDSOR MACHINES
LTD
5.81979 19.4905 7.29125 19.0024 14.47255 13.2153
4 AXTEL INDUSTRIES LTD 3.80808 1.94256 -5.2251 7.7086 1.804408 2.00771
5 TRF LTD -103.47 -65.839 -90.703 -33.213 -23.26852 -63.3
Figures are in crore (INR)
Average
EVA
Industry
Avarage
-5.2967
Sr No. Name of the Company EVA
Finacial year
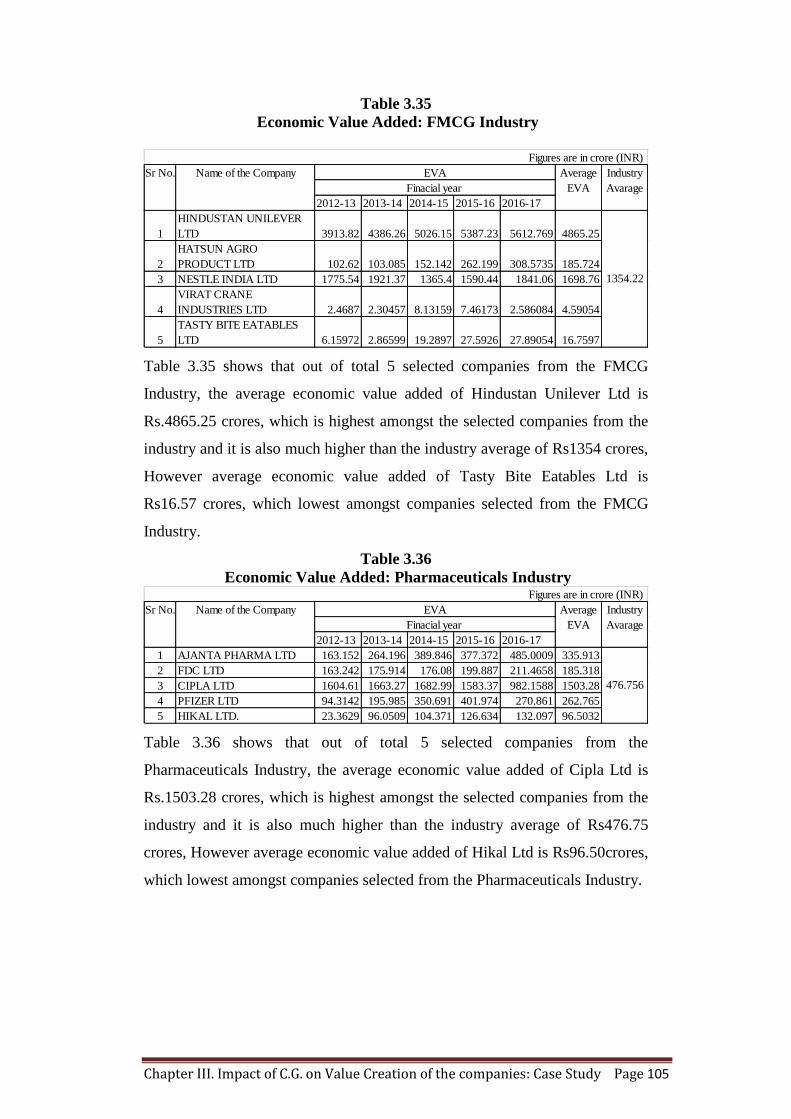
Chapter III. Impact of C.G. on Value Creation of the companies: Case Study Page 105
Table 3.35
Economic Value Added: FMCG Industry
Table 3.35 shows that out of total 5 selected companies from the FMCG
Industry, the average economic value added of Hindustan Unilever Ltd is
Rs.4865.25 crores, which is highest amongst the selected companies from the
industry and it is also much higher than the industry average of Rs1354 crores,
However average economic value added of Tasty Bite Eatables Ltd is
Rs16.57 crores, which lowest amongst companies selected from the FMCG
Industry.
Table 3.36
Economic Value Added: Pharmaceuticals Industry
Table 3.36 shows that out of total 5 selected companies from the
Pharmaceuticals Industry, the average economic value added of Cipla Ltd is
Rs.1503.28 crores, which is highest amongst the selected companies from the
industry and it is also much higher than the industry average of Rs476.75
crores, However average economic value added of Hikal Ltd is Rs96.50crores,
which lowest amongst companies selected from the Pharmaceuticals Industry.
2012-13 2013-14 2014-15 2015-16 2016-17
1
HINDUSTAN UNILEVER
LTD 3913.82 4386.26 5026.15 5387.23 5612.769 4865.25
2
HATSUN AGRO
PRODUCT LTD 102.62 103.085 152.142 262.199 308.5735 185.724
3 NESTLE INDIA LTD 1775.54 1921.37 1365.4 1590.44 1841.06 1698.76
4
VIRAT CRANE
INDUSTRIES LTD 2.4687 2.30457 8.13159 7.46173 2.586084 4.59054
5
TASTY BITE EATABLES
LTD 6.15972 2.86599 19.2897 27.5926 27.89054 16.7597
Figures are in crore (INR)
Average
EVA
Industry
Avarage
1354.22
Sr No. Name of the Company EVA
Finacial year
2012-13 2013-14 2014-15 2015-16 2016-17
1 AJANTA PHARMA LTD 163.152 264.196 389.846 377.372 485.0009 335.913
2 FDC LTD 163.242 175.914 176.08 199.887 211.4658 185.318
3 CIPLA LTD 1604.61 1663.27 1682.99 1583.37 982.1588 1503.28
4 PFIZER LTD 94.3142 195.985 350.691 401.974 270.861 262.765
5 HIKAL LTD. 23.3629 96.0509 104.371 126.634 132.097 96.5032
Figures are in crore (INR)
476.756
Average
EVA
Industry
Avarage
Sr No. Name of the Company EVA
Finacial year
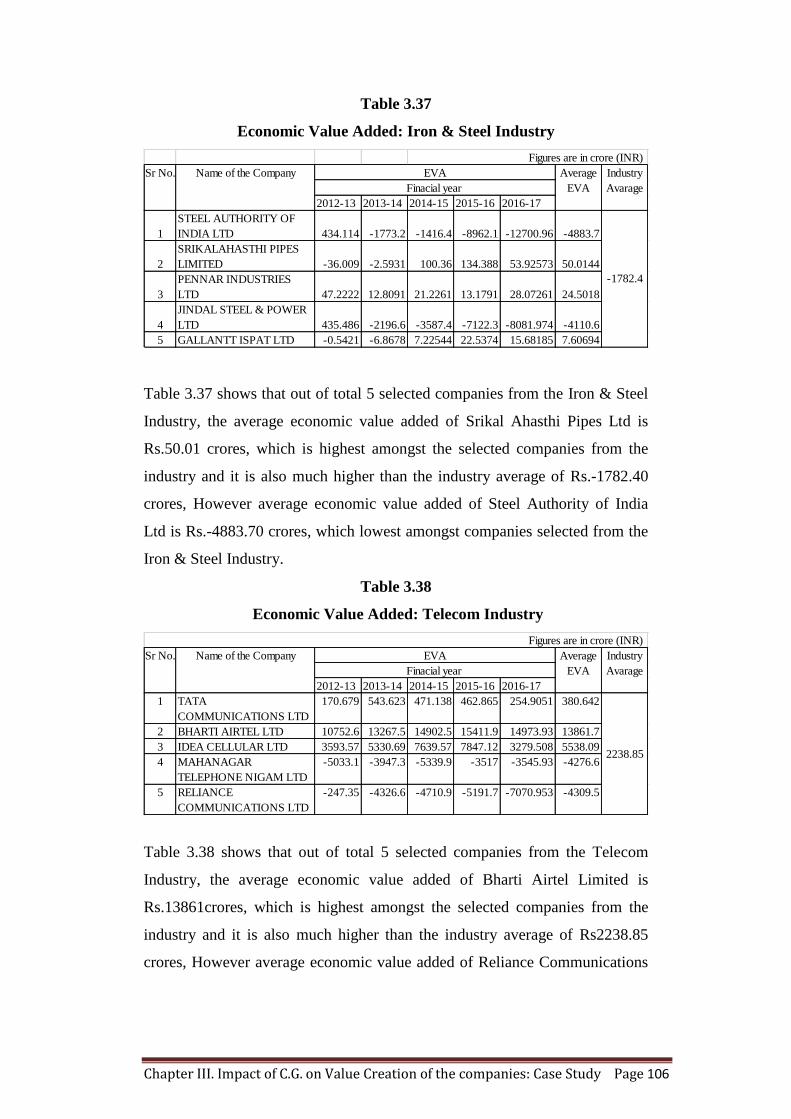
Chapter III. Impact of C.G. on Value Creation of the companies: Case Study Page 106
Table 3.37
Economic Value Added: Iron & Steel Industry
Table 3.37 shows that out of total 5 selected companies from the Iron & Steel
Industry, the average economic value added of Srikal Ahasthi Pipes Ltd is
Rs.50.01 crores, which is highest amongst the selected companies from the
industry and it is also much higher than the industry average of Rs.-1782.40
crores, However average economic value added of Steel Authority of India
Ltd is Rs.-4883.70 crores, which lowest amongst companies selected from the
Iron & Steel Industry.
Table 3.38
Economic Value Added: Telecom Industry
Table 3.38 shows that out of total 5 selected companies from the Telecom
Industry, the average economic value added of Bharti Airtel Limited is
Rs.13861crores, which is highest amongst the selected companies from the
industry and it is also much higher than the industry average of Rs2238.85
crores, However average economic value added of Reliance Communications
2012-13 2013-14 2014-15 2015-16 2016-17
1
STEEL AUTHORITY OF
INDIA LTD 434.114 -1773.2 -1416.4 -8962.1 -12700.96 -4883.7
2
SRIKALAHASTHI PIPES
LIMITED -36.009 -2.5931 100.36 134.388 53.92573 50.0144
3
PENNAR INDUSTRIES
LTD 47.2222 12.8091 21.2261 13.1791 28.07261 24.5018
4
JINDAL STEEL & POWER
LTD 435.486 -2196.6 -3587.4 -7122.3 -8081.974 -4110.6
5 GALLANTT ISPAT LTD -0.5421 -6.8678 7.22544 22.5374 15.68185 7.60694
Figures are in crore (INR)
Average
EVA
Industry
Avarage
-1782.4
Sr No. Name of the Company EVA
Finacial year
2012-13 2013-14 2014-15 2015-16 2016-17
1 TATA
COMMUNICATIONS LTD
170.679 543.623 471.138 462.865 254.9051 380.642
2 BHARTI AIRTEL LTD 10752.6 13267.5 14902.5 15411.9 14973.93 13861.7
3 IDEA CELLULAR LTD 3593.57 5330.69 7639.57 7847.12 3279.508 5538.09
4 MAHANAGAR
TELEPHONE NIGAM LTD
-5033.1 -3947.3 -5339.9 -3517 -3545.93 -4276.6
5 RELIANCE
COMMUNICATIONS LTD
-247.35 -4326.6 -4710.9 -5191.7 -7070.953 -4309.5
Figures are in crore (INR)
Average
EVA
Industry
Avarage
2238.85
Sr No. Name of the Company EVA
Finacial year
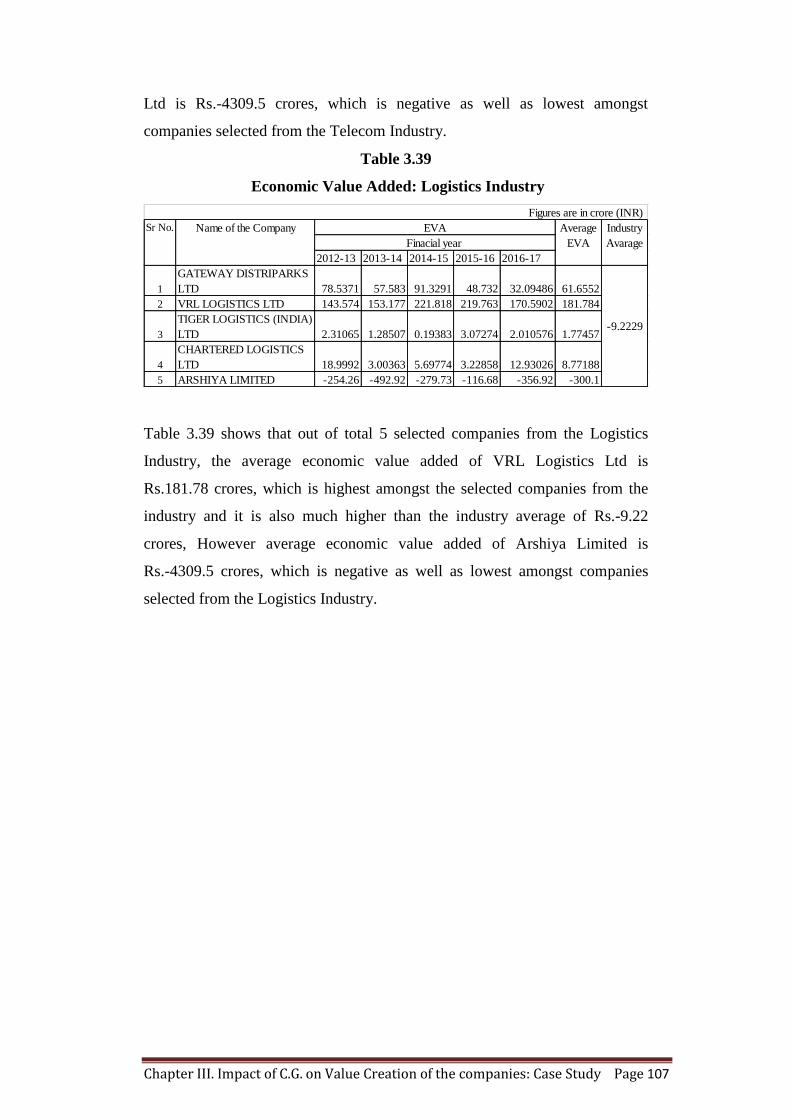
Chapter III. Impact of C.G. on Value Creation of the companies: Case Study Page 107
Ltd is Rs.-4309.5 crores, which is negative as well as lowest amongst
companies selected from the Telecom Industry.
Table 3.39
Economic Value Added: Logistics Industry
Table 3.39 shows that out of total 5 selected companies from the Logistics
Industry, the average economic value added of VRL Logistics Ltd is
Rs.181.78 crores, which is highest amongst the selected companies from the
industry and it is also much higher than the industry average of Rs.-9.22
crores, However average economic value added of Arshiya Limited is
Rs.-4309.5 crores, which is negative as well as lowest amongst companies
selected from the Logistics Industry.
2012-13 2013-14 2014-15 2015-16 2016-17
1
GATEWAY DISTRIPARKS
LTD 78.5371 57.583 91.3291 48.732 32.09486 61.6552
2 VRL LOGISTICS LTD 143.574 153.177 221.818 219.763 170.5902 181.784
3
TIGER LOGISTICS (INDIA)
LTD 2.31065 1.28507 0.19383 3.07274 2.010576 1.77457
4
CHARTERED LOGISTICS
LTD 18.9992 3.00363 5.69774 3.22858 12.93026 8.77188
5 ARSHIYA LIMITED -254.26 -492.92 -279.73 -116.68 -356.92 -300.1
-9.2229
Figures are in crore (INR)
Average
EVA
Industry
Avarage
Sr No. Name of the Company EVA
Finacial year
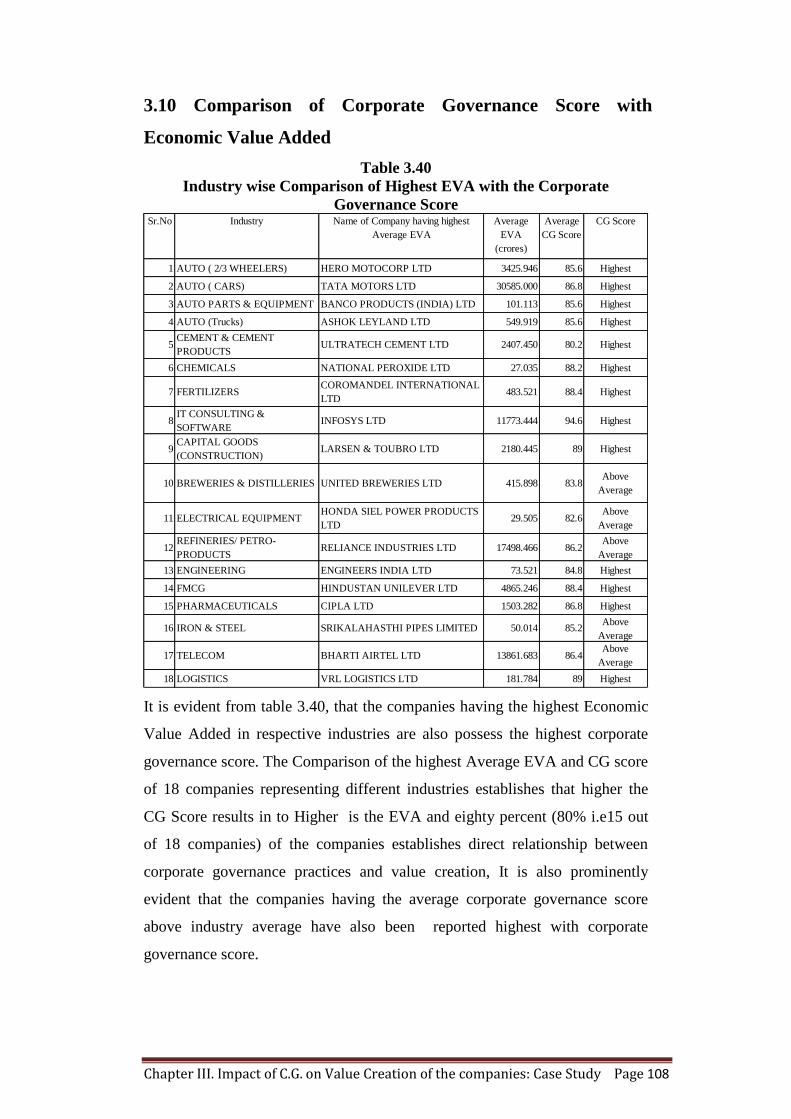
Chapter III. Impact of C.G. on Value Creation of the companies: Case Study Page 108
3.10 Comparison of Corporate Governance Score with
Economic Value Added
Table 3.40
Industry wise Comparison of Highest EVA with the Corporate
Governance Score
It is evident from table 3.40, that the companies having the highest Economic
Value Added in respective industries are also possess the highest corporate
governance score. The Comparison of the highest Average EVA and CG score
of 18 companies representing different industries establishes that higher the
CG Score results in to Higher is the EVA and eighty percent (80% i.e15 out
of 18 companies) of the companies establishes direct relationship between
corporate governance practices and value creation, It is also prominently
evident that the companies having the average corporate governance score
above industry average have also been reported highest with corporate
governance score.
Sr.No Industry Name of Company having highest
Average EVA
Average
EVA
(crores)
Average
CG Score
CG Score
1 AUTO ( 2/3 WHEELERS) HERO MOTOCORP LTD 3425.946 85.6 Highest
2 AUTO ( CARS) TATA MOTORS LTD 30585.000 86.8 Highest
3 AUTO PARTS & EQUIPMENT BANCO PRODUCTS (INDIA) LTD 101.113 85.6 Highest
4 AUTO (Trucks) ASHOK LEYLAND LTD 549.919 85.6 Highest
5CEMENT & CEMENT
PRODUCTSULTRATECH CEMENT LTD 2407.450 80.2 Highest
6 CHEMICALS NATIONAL PEROXIDE LTD 27.035 88.2 Highest
7 FERTILIZERSCOROMANDEL INTERNATIONAL
LTD483.521 88.4 Highest
8IT CONSULTING &
SOFTWAREINFOSYS LTD 11773.444 94.6 Highest
9CAPITAL GOODS
(CONSTRUCTION) LARSEN & TOUBRO LTD 2180.445 89 Highest
10 BREWERIES & DISTILLERIES UNITED BREWERIES LTD 415.898 83.8Above
Average
11 ELECTRICAL EQUIPMENTHONDA SIEL POWER PRODUCTS
LTD29.505 82.6
Above
Average
12REFINERIES/ PETRO-
PRODUCTSRELIANCE INDUSTRIES LTD 17498.466 86.2
Above
Average
13 ENGINEERING ENGINEERS INDIA LTD 73.521 84.8 Highest
14 FMCG HINDUSTAN UNILEVER LTD 4865.246 88.4 Highest
15 PHARMACEUTICALS CIPLA LTD 1503.282 86.8 Highest
16 IRON & STEEL SRIKALAHASTHI PIPES LIMITED 50.014 85.2Above
Average
17 TELECOM BHARTI AIRTEL LTD 13861.683 86.4Above
Average
18 LOGISTICS VRL LOGISTICS LTD 181.784 89 Highest
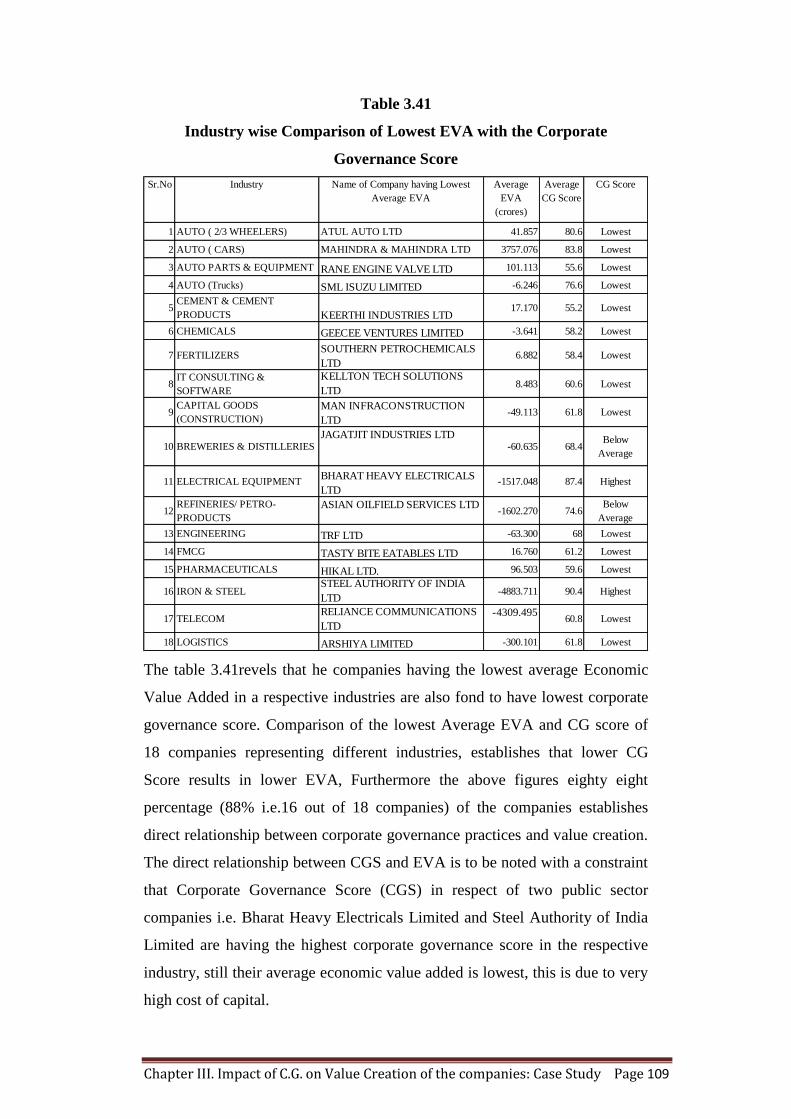
Chapter III. Impact of C.G. on Value Creation of the companies: Case Study Page 109
Table 3.41
Industry wise Comparison of Lowest EVA with the Corporate
Governance Score
The table 3.41revels that he companies having the lowest average Economic
Value Added in a respective industries are also fond to have lowest corporate
governance score. Comparison of the lowest Average EVA and CG score of
18 companies representing different industries, establishes that lower CG
Score results in lower EVA, Furthermore the above figures eighty eight
percentage (88% i.e.16 out of 18 companies) of the companies establishes
direct relationship between corporate governance practices and value creation.
The direct relationship between CGS and EVA is to be noted with a constraint
that Corporate Governance Score (CGS) in respect of two public sector
companies i.e. Bharat Heavy Electricals Limited and Steel Authority of India
Limited are having the highest corporate governance score in the respective
industry, still their average economic value added is lowest, this is due to very
high cost of capital.
Sr.No Industry Name of Company having Lowest
Average EVA
Average
EVA
(crores)
Average
CG Score
CG Score
1 AUTO ( 2/3 WHEELERS) ATUL AUTO LTD 41.857 80.6 Lowest
2 AUTO ( CARS) MAHINDRA & MAHINDRA LTD 3757.076 83.8 Lowest
3 AUTO PARTS & EQUIPMENT RANE ENGINE VALVE LTD 101.113 55.6 Lowest
4 AUTO (Trucks) SML ISUZU LIMITED -6.246 76.6 Lowest
5CEMENT & CEMENT
PRODUCTS KEERTHI INDUSTRIES LTD17.170 55.2 Lowest
6 CHEMICALS GEECEE VENTURES LIMITED -3.641 58.2 Lowest
7 FERTILIZERSSOUTHERN PETROCHEMICALS
LTD6.882 58.4 Lowest
8IT CONSULTING &
SOFTWARE
KELLTON TECH SOLUTIONS
LTD8.483 60.6 Lowest
9CAPITAL GOODS
(CONSTRUCTION)
MAN INFRACONSTRUCTION
LTD-49.113 61.8 Lowest
10 BREWERIES & DISTILLERIESJAGATJIT INDUSTRIES LTD
-60.635 68.4Below
Average
11 ELECTRICAL EQUIPMENTBHARAT HEAVY ELECTRICALS
LTD-1517.048 87.4 Highest
12REFINERIES/ PETRO-
PRODUCTS
ASIAN OILFIELD SERVICES LTD-1602.270 74.6
Below
Average
13 ENGINEERING TRF LTD -63.300 68 Lowest
14 FMCG TASTY BITE EATABLES LTD 16.760 61.2 Lowest
15 PHARMACEUTICALS HIKAL LTD. 96.503 59.6 Lowest
16 IRON & STEELSTEEL AUTHORITY OF INDIA
LTD-4883.711 90.4 Highest
17 TELECOMRELIANCE COMMUNICATIONS
LTD
-4309.49560.8 Lowest
18 LOGISTICS ARSHIYA LIMITED -300.101 61.8 Lowest
Chapter III. Impact of C.G. on Value Creation of the companies: Case Study Page 110
3.11 Market Value Added as Measure of Value Creation:
Most of the accounting-based measures such as Price: Earnings, Book Value,
Returns on Equity, Return on Net worth, etc. fail to provide a clear
understanding of the major variables that drive value, except to some extent
Returns on Invested Capital. These methods are easily influenced by the smart
and perhaps mischievous management through window dressings. They also
do not incorporate the risk or time value of money also and do not help
investors understand the intricate process of value creation. In addition, these
traditional measures use, for the most part, historical data to measure current
performance. Ideally, one would like to measure how current decisions will
affect the firm‘s future performance.
EVA and MVA are the two measures of Value Added in corporate reality. The
modern economy suggests one objective that is Value Added also known as
Economic Profit.
―Value-added (VA) is the difference between the values produced by a
firm/projectand all costs associated with the production of that value,
including all opportunity costs.‖
Thus, a firm that chooses VA as its corporate objective strives to create more
value for its owners (owners of Equity and Debt) than any comparable
investments.
One of the widely used measures for determining the corporate value creation
is the Market Value Added (MVA). Stewart calls that difference between the
company's market value and book value as Market Value Added (MVA).
EVA is an internal measure of performance that determines MVA which is an
external measure of the firm's performance. MVA shows the additional value
added to the book value of the invested capital. If MVA is positive, the firm
has added value. If it is negative, the firm has destroyed value. The amount of
value-added needs to be greater than the firm's investors could have achieved
investing in the market portfolio, adjusted for the leverage (beta coefficient) of
the firm relative to the market. MVA is not a performance metric like EVA,
but instead is a wealth metric; measuring the level of value a company has
accumulated over time. As a company performs well over time, it will retain
earnings. This will improve the book value of the company's shares, and
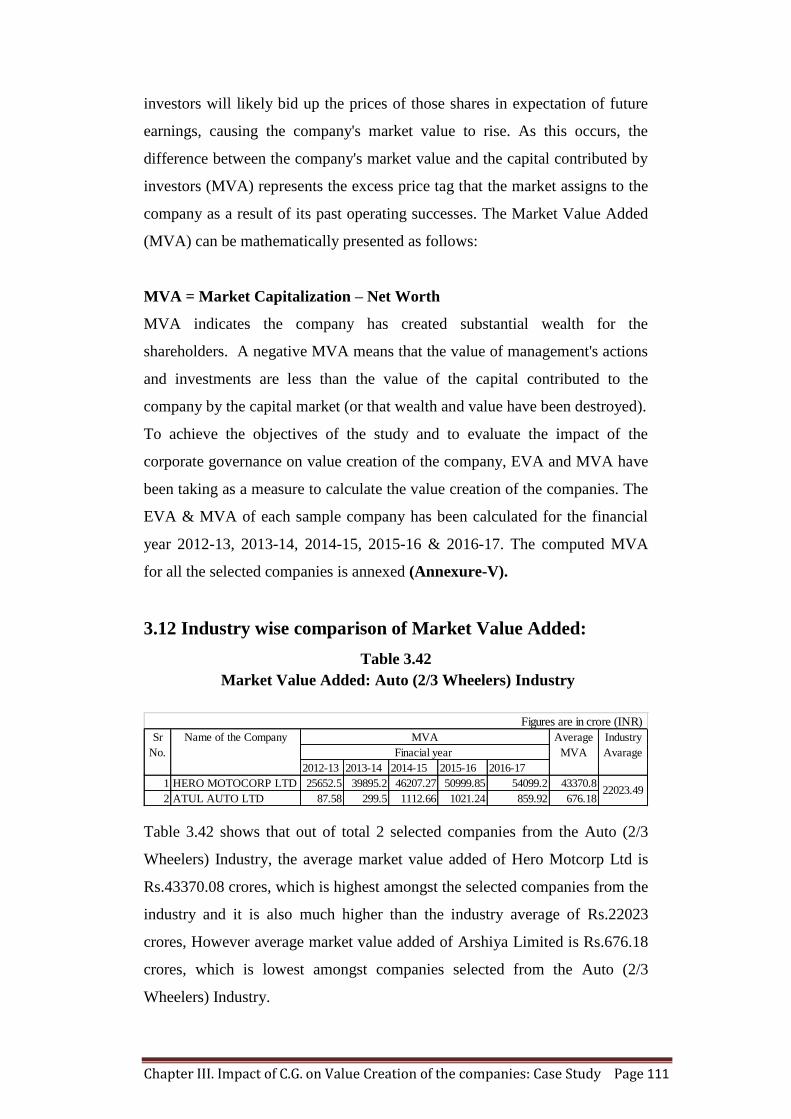
Chapter III. Impact of C.G. on Value Creation of the companies: Case Study Page 111
investors will likely bid up the prices of those shares in expectation of future
earnings, causing the company's market value to rise. As this occurs, the
difference between the company's market value and the capital contributed by
investors (MVA) represents the excess price tag that the market assigns to the
company as a result of its past operating successes. The Market Value Added
(MVA) can be mathematically presented as follows:
MVA = Market Capitalization – Net Worth
MVA indicates the company has created substantial wealth for the
shareholders. A negative MVA means that the value of management's actions
and investments are less than the value of the capital contributed to the
company by the capital market (or that wealth and value have been destroyed).
To achieve the objectives of the study and to evaluate the impact of the
corporate governance on value creation of the company, EVA and MVA have
been taking as a measure to calculate the value creation of the companies. The
EVA & MVA of each sample company has been calculated for the financial
year 2012-13, 2013-14, 2014-15, 2015-16 & 2016-17. The computed MVA
for all the selected companies is annexed (Annexure-V).
3.12 Industry wise comparison of Market Value Added:
Table 3.42
Market Value Added: Auto (2/3 Wheelers) Industry
Table 3.42 shows that out of total 2 selected companies from the Auto (2/3
Wheelers) Industry, the average market value added of Hero Motcorp Ltd is
Rs.43370.08 crores, which is highest amongst the selected companies from the
industry and it is also much higher than the industry average of Rs.22023
crores, However average market value added of Arshiya Limited is Rs.676.18
crores, which is lowest amongst companies selected from the Auto (2/3
Wheelers) Industry.
2012-13 2013-14 2014-15 2015-16 2016-17
1 HERO MOTOCORP LTD 25652.5 39895.2 46207.27 50999.85 54099.2 43370.8
2 ATUL AUTO LTD 87.58 299.5 1112.66 1021.24 859.92 676.18
Average
MVA
Industry
Avarage
22023.49
Sr
No.
Name of the Company MVA
Finacial year
Figures are in crore (INR)
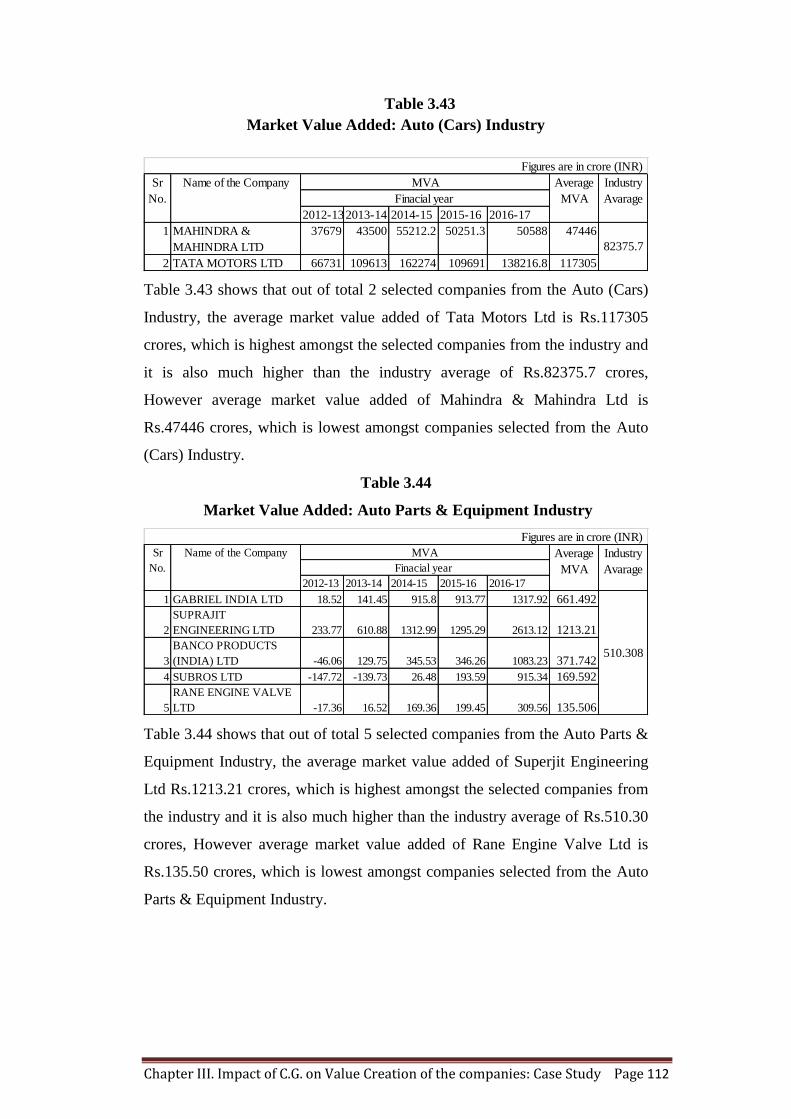
Chapter III. Impact of C.G. on Value Creation of the companies: Case Study Page 112
Table 3.43
Market Value Added: Auto (Cars) Industry
Table 3.43 shows that out of total 2 selected companies from the Auto (Cars)
Industry, the average market value added of Tata Motors Ltd is Rs.117305
crores, which is highest amongst the selected companies from the industry and
it is also much higher than the industry average of Rs.82375.7 crores,
However average market value added of Mahindra & Mahindra Ltd is
Rs.47446 crores, which is lowest amongst companies selected from the Auto
(Cars) Industry.
Table 3.44
Market Value Added: Auto Parts & Equipment Industry
Table 3.44 shows that out of total 5 selected companies from the Auto Parts &
Equipment Industry, the average market value added of Superjit Engineering
Ltd Rs.1213.21 crores, which is highest amongst the selected companies from
the industry and it is also much higher than the industry average of Rs.510.30
crores, However average market value added of Rane Engine Valve Ltd is
Rs.135.50 crores, which is lowest amongst companies selected from the Auto
Parts & Equipment Industry.
2012-13 2013-14 2014-15 2015-16 2016-17
1 MAHINDRA &
MAHINDRA LTD
37679 43500 55212.2 50251.3 50588 47446
2 TATA MOTORS LTD 66731 109613 162274 109691 138216.8 117305
Average
MVA
Industry
Avarage
82375.7
Figures are in crore (INR)
Sr
No.
Name of the Company MVA
Finacial year
2012-13 2013-14 2014-15 2015-16 2016-17
1 GABRIEL INDIA LTD 18.52 141.45 915.8 913.77 1317.92 661.492
2
SUPRAJIT
ENGINEERING LTD 233.77 610.88 1312.99 1295.29 2613.12 1213.21
3
BANCO PRODUCTS
(INDIA) LTD -46.06 129.75 345.53 346.26 1083.23 371.742
4 SUBROS LTD -147.72 -139.73 26.48 193.59 915.34 169.592
5
RANE ENGINE VALVE
LTD -17.36 16.52 169.36 199.45 309.56 135.506
Average
MVA
Industry
Avarage
510.308
Figures are in crore (INR)
Sr
No.
Name of the Company MVA
Finacial year
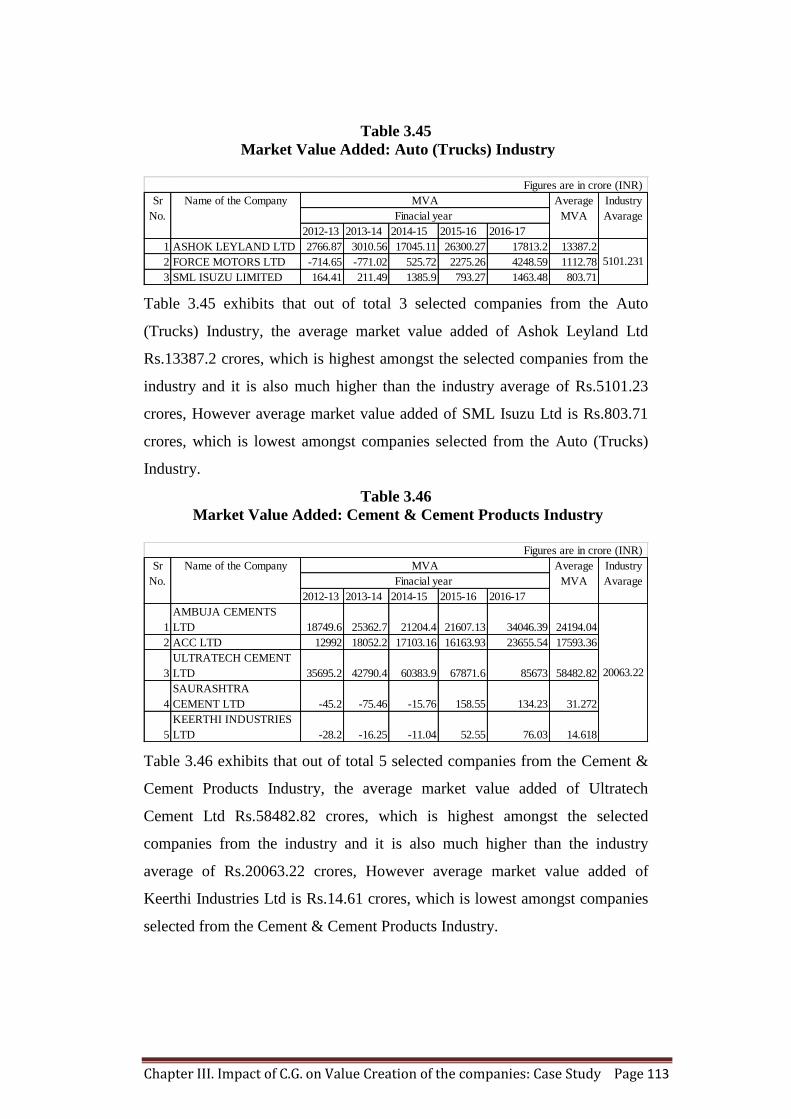
Chapter III. Impact of C.G. on Value Creation of the companies: Case Study Page 113
Table 3.45
Market Value Added: Auto (Trucks) Industry
Table 3.45 exhibits that out of total 3 selected companies from the Auto
(Trucks) Industry, the average market value added of Ashok Leyland Ltd
Rs.13387.2 crores, which is highest amongst the selected companies from the
industry and it is also much higher than the industry average of Rs.5101.23
crores, However average market value added of SML Isuzu Ltd is Rs.803.71
crores, which is lowest amongst companies selected from the Auto (Trucks)
Industry.
Table 3.46
Market Value Added: Cement & Cement Products Industry
Table 3.46 exhibits that out of total 5 selected companies from the Cement &
Cement Products Industry, the average market value added of Ultratech
Cement Ltd Rs.58482.82 crores, which is highest amongst the selected
companies from the industry and it is also much higher than the industry
average of Rs.20063.22 crores, However average market value added of
Keerthi Industries Ltd is Rs.14.61 crores, which is lowest amongst companies
selected from the Cement & Cement Products Industry.
2012-13 2013-14 2014-15 2015-16 2016-17
1 ASHOK LEYLAND LTD 2766.87 3010.56 17045.11 26300.27 17813.2 13387.2
2 FORCE MOTORS LTD -714.65 -771.02 525.72 2275.26 4248.59 1112.78
3 SML ISUZU LIMITED 164.41 211.49 1385.9 793.27 1463.48 803.71
Average
MVA
Industry
Avarage
5101.231
Figures are in crore (INR)
Sr
No.
Name of the Company MVA
Finacial year
2012-13 2013-14 2014-15 2015-16 2016-17
1
AMBUJA CEMENTS
LTD 18749.6 25362.7 21204.4 21607.13 34046.39 24194.04
2 ACC LTD 12992 18052.2 17103.16 16163.93 23655.54 17593.36
3
ULTRATECH CEMENT
LTD 35695.2 42790.4 60383.9 67871.6 85673 58482.82
4
SAURASHTRA
CEMENT LTD -45.2 -75.46 -15.76 158.55 134.23 31.272
5
KEERTHI INDUSTRIES
LTD -28.2 -16.25 -11.04 52.55 76.03 14.618
Average
MVA
Industry
Avarage
20063.22
Figures are in crore (INR)
Sr
No.
Name of the Company MVA
Finacial year
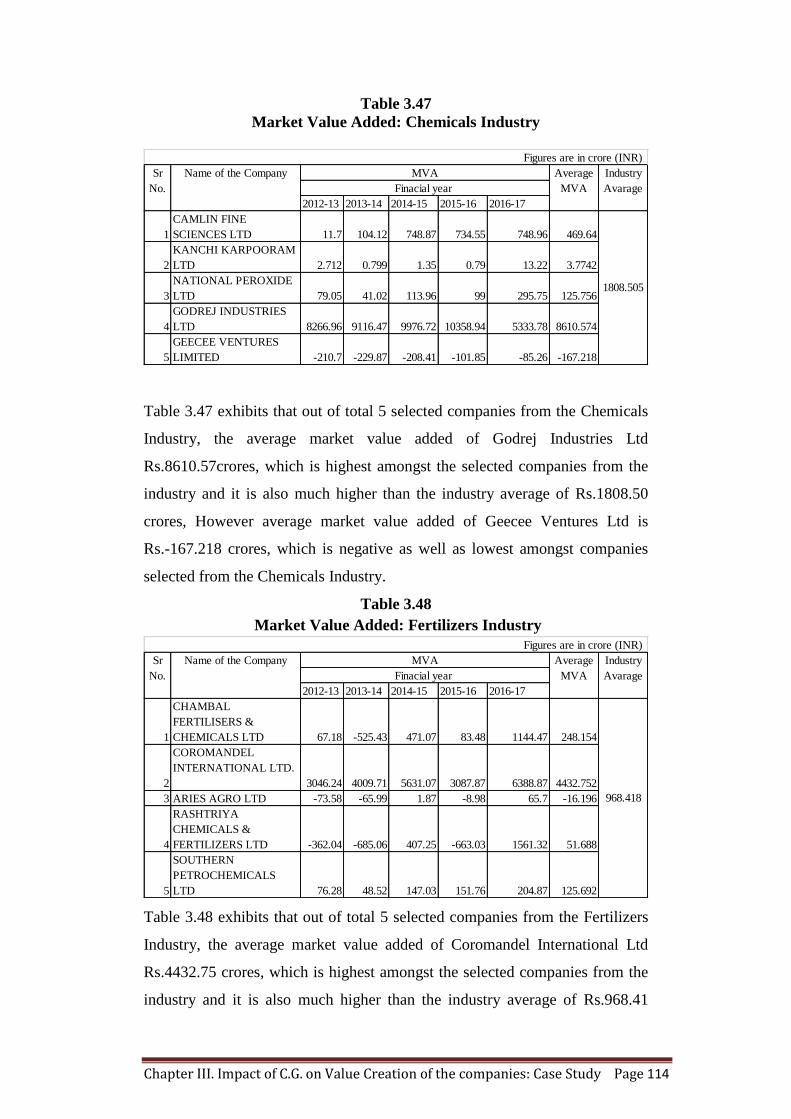
Chapter III. Impact of C.G. on Value Creation of the companies: Case Study Page 114
Table 3.47
Market Value Added: Chemicals Industry
Table 3.47 exhibits that out of total 5 selected companies from the Chemicals
Industry, the average market value added of Godrej Industries Ltd
Rs.8610.57crores, which is highest amongst the selected companies from the
industry and it is also much higher than the industry average of Rs.1808.50
crores, However average market value added of Geecee Ventures Ltd is
Rs.-167.218 crores, which is negative as well as lowest amongst companies
selected from the Chemicals Industry.
Table 3.48
Market Value Added: Fertilizers Industry
Table 3.48 exhibits that out of total 5 selected companies from the Fertilizers
Industry, the average market value added of Coromandel International Ltd
Rs.4432.75 crores, which is highest amongst the selected companies from the
industry and it is also much higher than the industry average of Rs.968.41
2012-13 2013-14 2014-15 2015-16 2016-17
1
CAMLIN FINE
SCIENCES LTD 11.7 104.12 748.87 734.55 748.96 469.64
2
KANCHI KARPOORAM
LTD 2.712 0.799 1.35 0.79 13.22 3.7742
3
NATIONAL PEROXIDE
LTD 79.05 41.02 113.96 99 295.75 125.756
4
GODREJ INDUSTRIES
LTD 8266.96 9116.47 9976.72 10358.94 5333.78 8610.574
5
GEECEE VENTURES
LIMITED -210.7 -229.87 -208.41 -101.85 -85.26 -167.218
Average
MVA
Industry
Avarage
1808.505
Figures are in crore (INR)
Sr
No.
Name of the Company MVA
Finacial year
2012-13 2013-14 2014-15 2015-16 2016-17
1
CHAMBAL
FERTILISERS &
CHEMICALS LTD 67.18 -525.43 471.07 83.48 1144.47 248.154
2
COROMANDEL
INTERNATIONAL LTD.
3046.24 4009.71 5631.07 3087.87 6388.87 4432.752
3 ARIES AGRO LTD -73.58 -65.99 1.87 -8.98 65.7 -16.196
4
RASHTRIYA
CHEMICALS &
FERTILIZERS LTD -362.04 -685.06 407.25 -663.03 1561.32 51.688
5
SOUTHERN
PETROCHEMICALS
LTD 76.28 48.52 147.03 151.76 204.87 125.692
Average
MVA
Industry
Avarage
968.418
Figures are in crore (INR)
Sr
No.
Name of the Company MVA
Finacial year
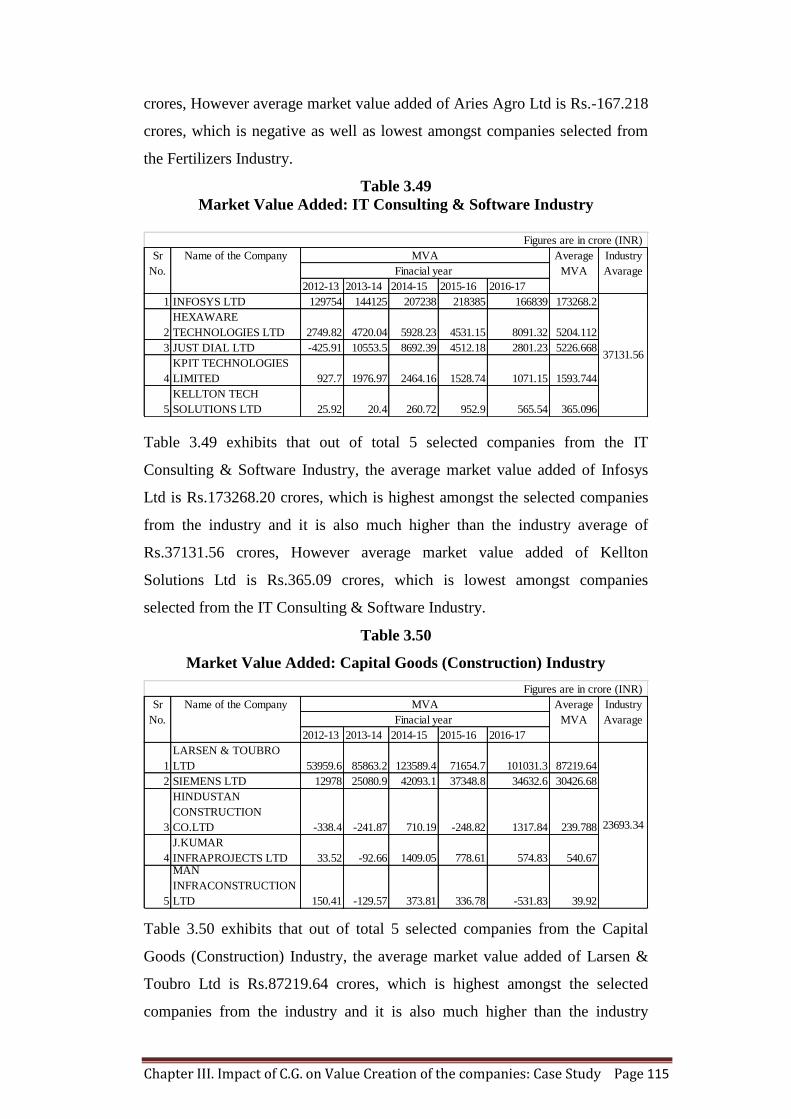
Chapter III. Impact of C.G. on Value Creation of the companies: Case Study Page 115
crores, However average market value added of Aries Agro Ltd is Rs.-167.218
crores, which is negative as well as lowest amongst companies selected from
the Fertilizers Industry.
Table 3.49
Market Value Added: IT Consulting & Software Industry
Table 3.49 exhibits that out of total 5 selected companies from the IT
Consulting & Software Industry, the average market value added of Infosys
Ltd is Rs.173268.20 crores, which is highest amongst the selected companies
from the industry and it is also much higher than the industry average of
Rs.37131.56 crores, However average market value added of Kellton
Solutions Ltd is Rs.365.09 crores, which is lowest amongst companies
selected from the IT Consulting & Software Industry.
Table 3.50
Market Value Added: Capital Goods (Construction) Industry
Table 3.50 exhibits that out of total 5 selected companies from the Capital
Goods (Construction) Industry, the average market value added of Larsen &
Toubro Ltd is Rs.87219.64 crores, which is highest amongst the selected
companies from the industry and it is also much higher than the industry
2012-13 2013-14 2014-15 2015-16 2016-17
1 INFOSYS LTD 129754 144125 207238 218385 166839 173268.2
2
HEXAWARE
TECHNOLOGIES LTD 2749.82 4720.04 5928.23 4531.15 8091.32 5204.112
3 JUST DIAL LTD -425.91 10553.5 8692.39 4512.18 2801.23 5226.668
4
KPIT TECHNOLOGIES
LIMITED 927.7 1976.97 2464.16 1528.74 1071.15 1593.744
5
KELLTON TECH
SOLUTIONS LTD 25.92 20.4 260.72 952.9 565.54 365.096
Average
MVA
Industry
Avarage
37131.56
Figures are in crore (INR)
Sr
No.
Name of the Company MVA
Finacial year
2012-13 2013-14 2014-15 2015-16 2016-17
1
LARSEN & TOUBRO
LTD 53959.6 85863.2 123589.4 71654.7 101031.3 87219.64
2 SIEMENS LTD 12978 25080.9 42093.1 37348.8 34632.6 30426.68
3
HINDUSTAN
CONSTRUCTION
CO.LTD -338.4 -241.87 710.19 -248.82 1317.84 239.788
4
J.KUMAR
INFRAPROJECTS LTD 33.52 -92.66 1409.05 778.61 574.83 540.67
5
MAN
INFRACONSTRUCTION
LTD 150.41 -129.57 373.81 336.78 -531.83 39.92
Average
MVA
Industry
Avarage
23693.34
Figures are in crore (INR)
Sr
No.
Name of the Company MVA
Finacial year
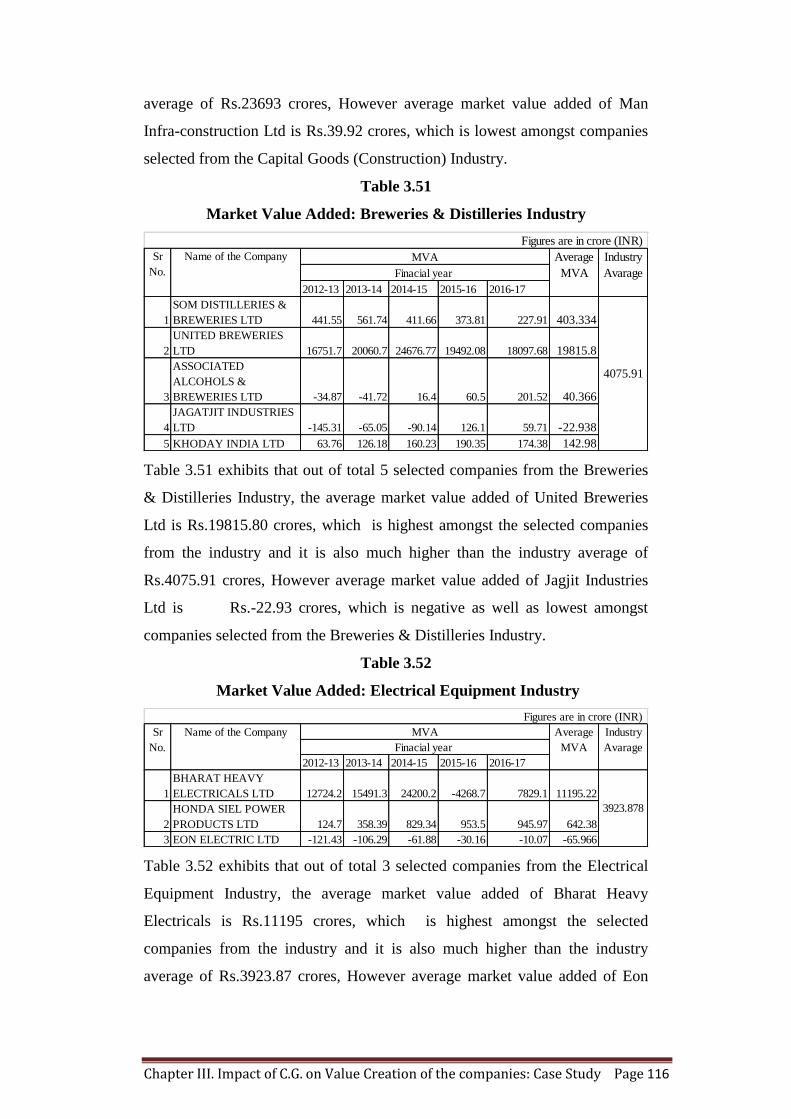
Chapter III. Impact of C.G. on Value Creation of the companies: Case Study Page 116
average of Rs.23693 crores, However average market value added of Man
Infra-construction Ltd is Rs.39.92 crores, which is lowest amongst companies
selected from the Capital Goods (Construction) Industry.
Table 3.51
Market Value Added: Breweries & Distilleries Industry
Table 3.51 exhibits that out of total 5 selected companies from the Breweries
& Distilleries Industry, the average market value added of United Breweries
Ltd is Rs.19815.80 crores, which is highest amongst the selected companies
from the industry and it is also much higher than the industry average of
Rs.4075.91 crores, However average market value added of Jagjit Industries
Ltd is Rs.-22.93 crores, which is negative as well as lowest amongst
companies selected from the Breweries & Distilleries Industry.
Table 3.52
Market Value Added: Electrical Equipment Industry
Table 3.52 exhibits that out of total 3 selected companies from the Electrical
Equipment Industry, the average market value added of Bharat Heavy
Electricals is Rs.11195 crores, which is highest amongst the selected
companies from the industry and it is also much higher than the industry
average of Rs.3923.87 crores, However average market value added of Eon
2012-13 2013-14 2014-15 2015-16 2016-17
1
SOM DISTILLERIES &
BREWERIES LTD 441.55 561.74 411.66 373.81 227.91 403.334
2
UNITED BREWERIES
LTD 16751.7 20060.7 24676.77 19492.08 18097.68 19815.8
3
ASSOCIATED
ALCOHOLS &
BREWERIES LTD -34.87 -41.72 16.4 60.5 201.52 40.366
4
JAGATJIT INDUSTRIES
LTD -145.31 -65.05 -90.14 126.1 59.71 -22.938
5 KHODAY INDIA LTD 63.76 126.18 160.23 190.35 174.38 142.98
Average
MVA
Industry
Avarage
4075.91
Sr
No.
Name of the Company MVA
Finacial year
Figures are in crore (INR)
2012-13 2013-14 2014-15 2015-16 2016-17
1
BHARAT HEAVY
ELECTRICALS LTD 12724.2 15491.3 24200.2 -4268.7 7829.1 11195.22
2
HONDA SIEL POWER
PRODUCTS LTD 124.7 358.39 829.34 953.5 945.97 642.38
3 EON ELECTRIC LTD -121.43 -106.29 -61.88 -30.16 -10.07 -65.966
Average
MVA
Industry
Avarage
3923.878
Figures are in crore (INR)
Sr
No.
Name of the Company MVA
Finacial year
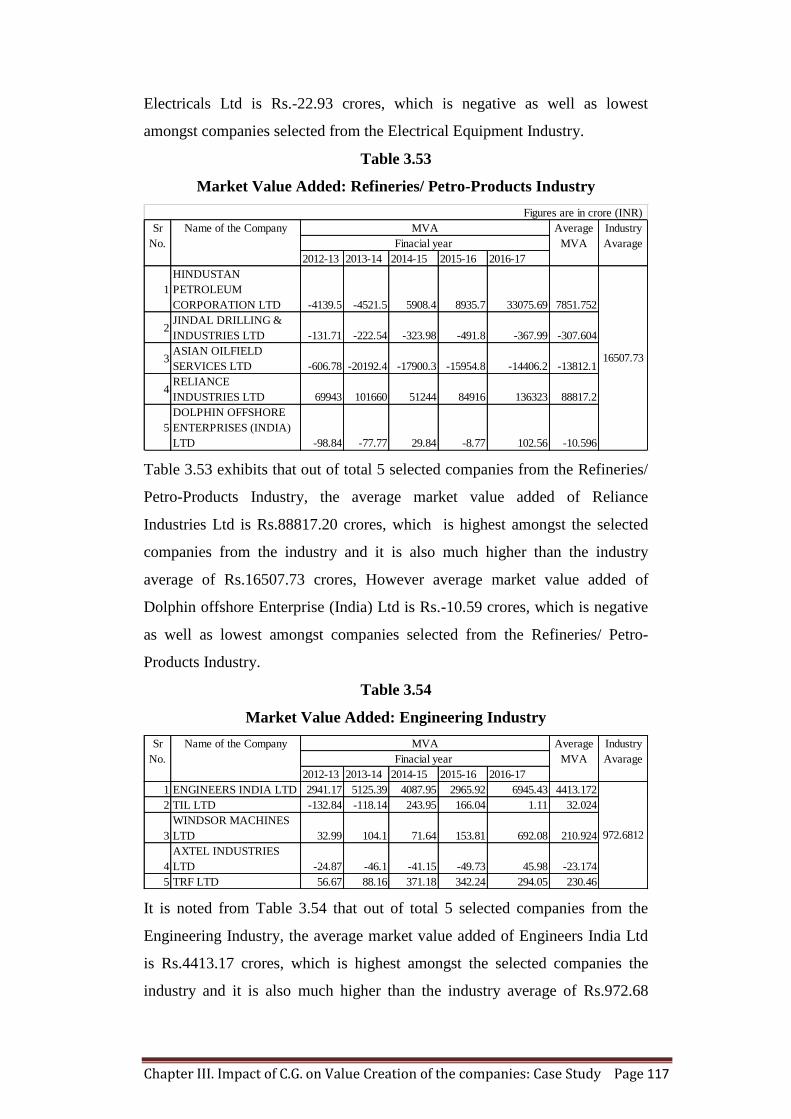
Chapter III. Impact of C.G. on Value Creation of the companies: Case Study Page 117
Electricals Ltd is Rs.-22.93 crores, which is negative as well as lowest
amongst companies selected from the Electrical Equipment Industry.
Table 3.53
Market Value Added: Refineries/ Petro-Products Industry
Table 3.53 exhibits that out of total 5 selected companies from the Refineries/
Petro-Products Industry, the average market value added of Reliance
Industries Ltd is Rs.88817.20 crores, which is highest amongst the selected
companies from the industry and it is also much higher than the industry
average of Rs.16507.73 crores, However average market value added of
Dolphin offshore Enterprise (India) Ltd is Rs.-10.59 crores, which is negative
as well as lowest amongst companies selected from the Refineries/ Petro-
Products Industry.
Table 3.54
Market Value Added: Engineering Industry
It is noted from Table 3.54 that out of total 5 selected companies from the
Engineering Industry, the average market value added of Engineers India Ltd
is Rs.4413.17 crores, which is highest amongst the selected companies the
industry and it is also much higher than the industry average of Rs.972.68
2012-13 2013-14 2014-15 2015-16 2016-17
1
HINDUSTAN
PETROLEUM
CORPORATION LTD -4139.5 -4521.5 5908.4 8935.7 33075.69 7851.752
2JINDAL DRILLING &
INDUSTRIES LTD -131.71 -222.54 -323.98 -491.8 -367.99 -307.604
3ASIAN OILFIELD
SERVICES LTD -606.78 -20192.4 -17900.3 -15954.8 -14406.2 -13812.1
4RELIANCE
INDUSTRIES LTD 69943 101660 51244 84916 136323 88817.2
5
DOLPHIN OFFSHORE
ENTERPRISES (INDIA)
LTD -98.84 -77.77 29.84 -8.77 102.56 -10.596
Average
MVA
Industry
Avarage
16507.73
Figures are in crore (INR)
Sr
No.
Name of the Company MVA
Finacial year
2012-13 2013-14 2014-15 2015-16 2016-17
1 ENGINEERS INDIA LTD 2941.17 5125.39 4087.95 2965.92 6945.43 4413.172
2 TIL LTD -132.84 -118.14 243.95 166.04 1.11 32.024
3
WINDSOR MACHINES
LTD 32.99 104.1 71.64 153.81 692.08 210.924
4
AXTEL INDUSTRIES
LTD -24.87 -46.1 -41.15 -49.73 45.98 -23.174
5 TRF LTD 56.67 88.16 371.18 342.24 294.05 230.46
Average
MVA
Industry
Avarage
972.6812
Sr
No.
Name of the Company MVA
Finacial year
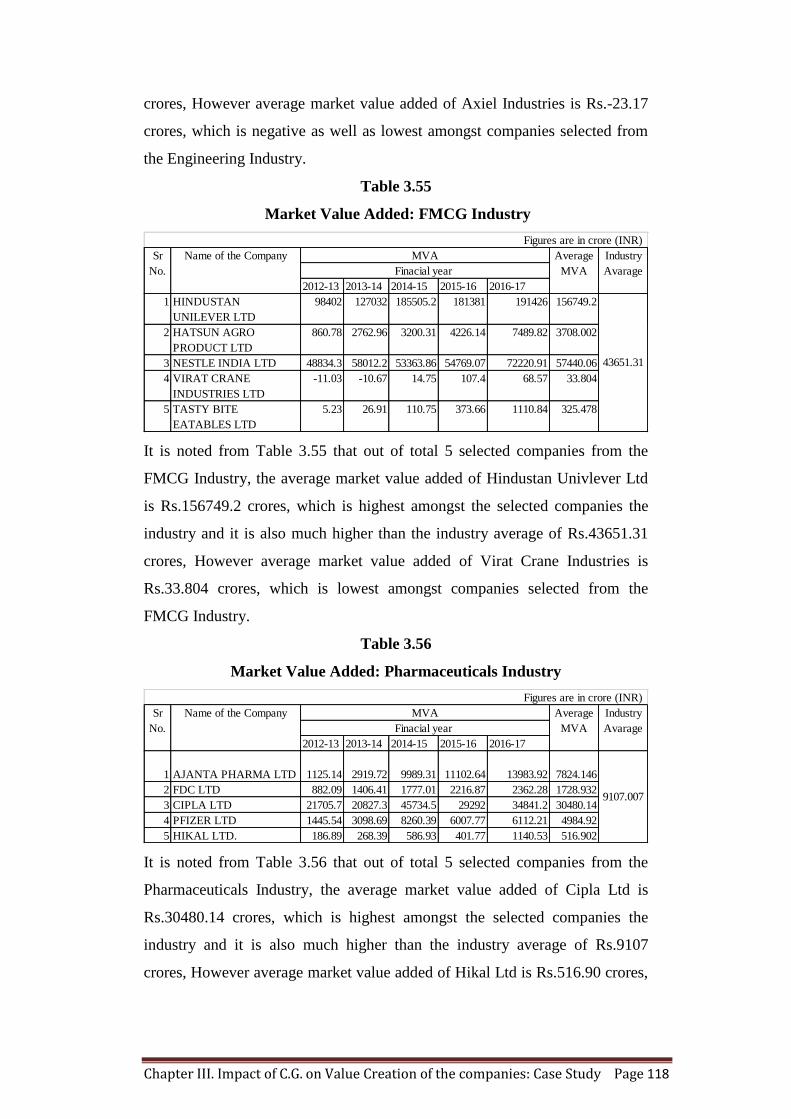
Chapter III. Impact of C.G. on Value Creation of the companies: Case Study Page 118
crores, However average market value added of Axiel Industries is Rs.-23.17
crores, which is negative as well as lowest amongst companies selected from
the Engineering Industry.
Table 3.55
Market Value Added: FMCG Industry
It is noted from Table 3.55 that out of total 5 selected companies from the
FMCG Industry, the average market value added of Hindustan Univlever Ltd
is Rs.156749.2 crores, which is highest amongst the selected companies the
industry and it is also much higher than the industry average of Rs.43651.31
crores, However average market value added of Virat Crane Industries is
Rs.33.804 crores, which is lowest amongst companies selected from the
FMCG Industry.
Table 3.56
Market Value Added: Pharmaceuticals Industry
It is noted from Table 3.56 that out of total 5 selected companies from the
Pharmaceuticals Industry, the average market value added of Cipla Ltd is
Rs.30480.14 crores, which is highest amongst the selected companies the
industry and it is also much higher than the industry average of Rs.9107
crores, However average market value added of Hikal Ltd is Rs.516.90 crores,
2012-13 2013-14 2014-15 2015-16 2016-17
1 HINDUSTAN
UNILEVER LTD
98402 127032 185505.2 181381 191426 156749.2
2 HATSUN AGRO
PRODUCT LTD
860.78 2762.96 3200.31 4226.14 7489.82 3708.002
3 NESTLE INDIA LTD 48834.3 58012.2 53363.86 54769.07 72220.91 57440.06
4 VIRAT CRANE
INDUSTRIES LTD
-11.03 -10.67 14.75 107.4 68.57 33.804
5 TASTY BITE
EATABLES LTD
5.23 26.91 110.75 373.66 1110.84 325.478
Average
MVA
Industry
Avarage
43651.31
Figures are in crore (INR)
Sr
No.
Name of the Company MVA
Finacial year
2012-13 2013-14 2014-15 2015-16 2016-17
1 AJANTA PHARMA LTD 1125.14 2919.72 9989.31 11102.64 13983.92 7824.146
2 FDC LTD 882.09 1406.41 1777.01 2216.87 2362.28 1728.932
3 CIPLA LTD 21705.7 20827.3 45734.5 29292 34841.2 30480.14
4 PFIZER LTD 1445.54 3098.69 8260.39 6007.77 6112.21 4984.92
5 HIKAL LTD. 186.89 268.39 586.93 401.77 1140.53 516.902
Average
MVA
Industry
Avarage
9107.007
Figures are in crore (INR)
Sr
No.
Name of the Company MVA
Finacial year
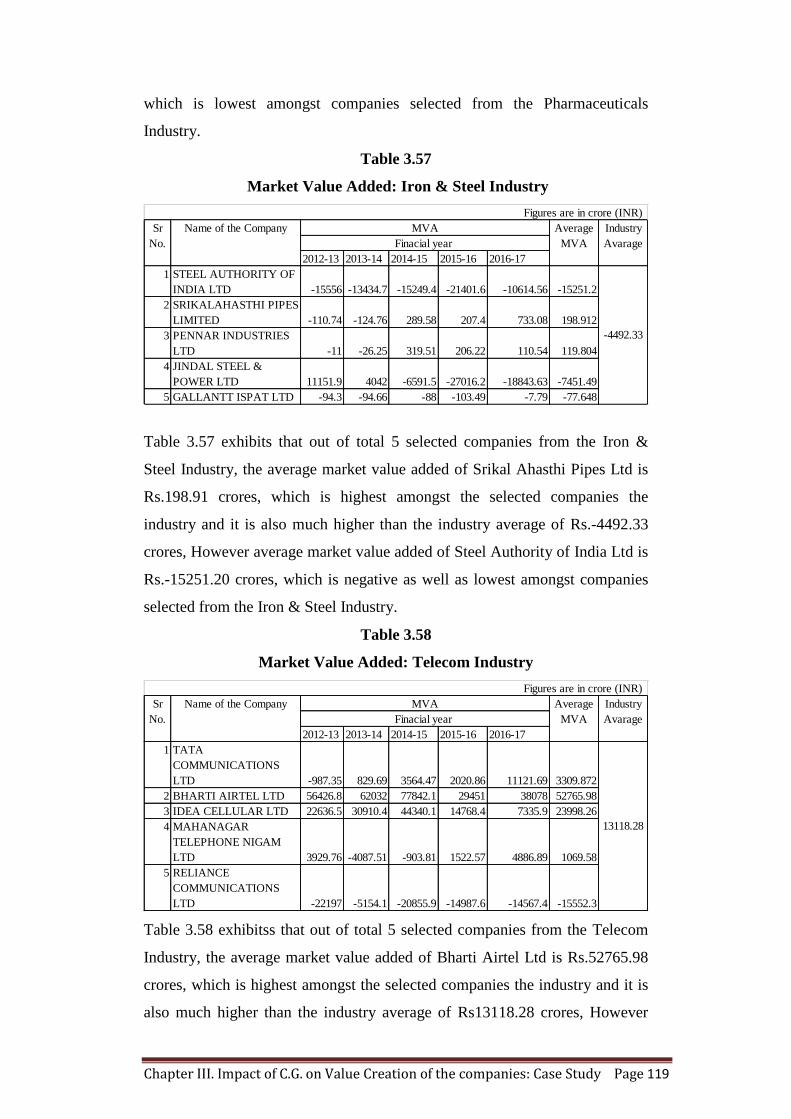
Chapter III. Impact of C.G. on Value Creation of the companies: Case Study Page 119
which is lowest amongst companies selected from the Pharmaceuticals
Industry.
Table 3.57
Market Value Added: Iron & Steel Industry
Table 3.57 exhibits that out of total 5 selected companies from the Iron &
Steel Industry, the average market value added of Srikal Ahasthi Pipes Ltd is
Rs.198.91 crores, which is highest amongst the selected companies the
industry and it is also much higher than the industry average of Rs.-4492.33
crores, However average market value added of Steel Authority of India Ltd is
Rs.-15251.20 crores, which is negative as well as lowest amongst companies
selected from the Iron & Steel Industry.
Table 3.58
Market Value Added: Telecom Industry
Table 3.58 exhibitss that out of total 5 selected companies from the Telecom
Industry, the average market value added of Bharti Airtel Ltd is Rs.52765.98
crores, which is highest amongst the selected companies the industry and it is
also much higher than the industry average of Rs13118.28 crores, However
2012-13 2013-14 2014-15 2015-16 2016-17
1 STEEL AUTHORITY OF
INDIA LTD -15556 -13434.7 -15249.4 -21401.6 -10614.56 -15251.2
2 SRIKALAHASTHI PIPES
LIMITED -110.74 -124.76 289.58 207.4 733.08 198.912
3 PENNAR INDUSTRIES
LTD -11 -26.25 319.51 206.22 110.54 119.804
4 JINDAL STEEL &
POWER LTD 11151.9 4042 -6591.5 -27016.2 -18843.63 -7451.49
5 GALLANTT ISPAT LTD -94.3 -94.66 -88 -103.49 -7.79 -77.648
Average
MVA
Industry
Avarage
-4492.33
Sr
No.
Name of the Company MVA
Finacial year
Figures are in crore (INR)
2012-13 2013-14 2014-15 2015-16 2016-17
1 TATA
COMMUNICATIONS
LTD -987.35 829.69 3564.47 2020.86 11121.69 3309.872
2 BHARTI AIRTEL LTD 56426.8 62032 77842.1 29451 38078 52765.98
3 IDEA CELLULAR LTD 22636.5 30910.4 44340.1 14768.4 7335.9 23998.26
4 MAHANAGAR
TELEPHONE NIGAM
LTD 3929.76 -4087.51 -903.81 1522.57 4886.89 1069.58
5 RELIANCE
COMMUNICATIONS
LTD -22197 -5154.1 -20855.9 -14987.6 -14567.4 -15552.3
Average
MVA
Industry
Avarage
13118.28
Figures are in crore (INR)
Sr
No.
Name of the Company MVA
Finacial year
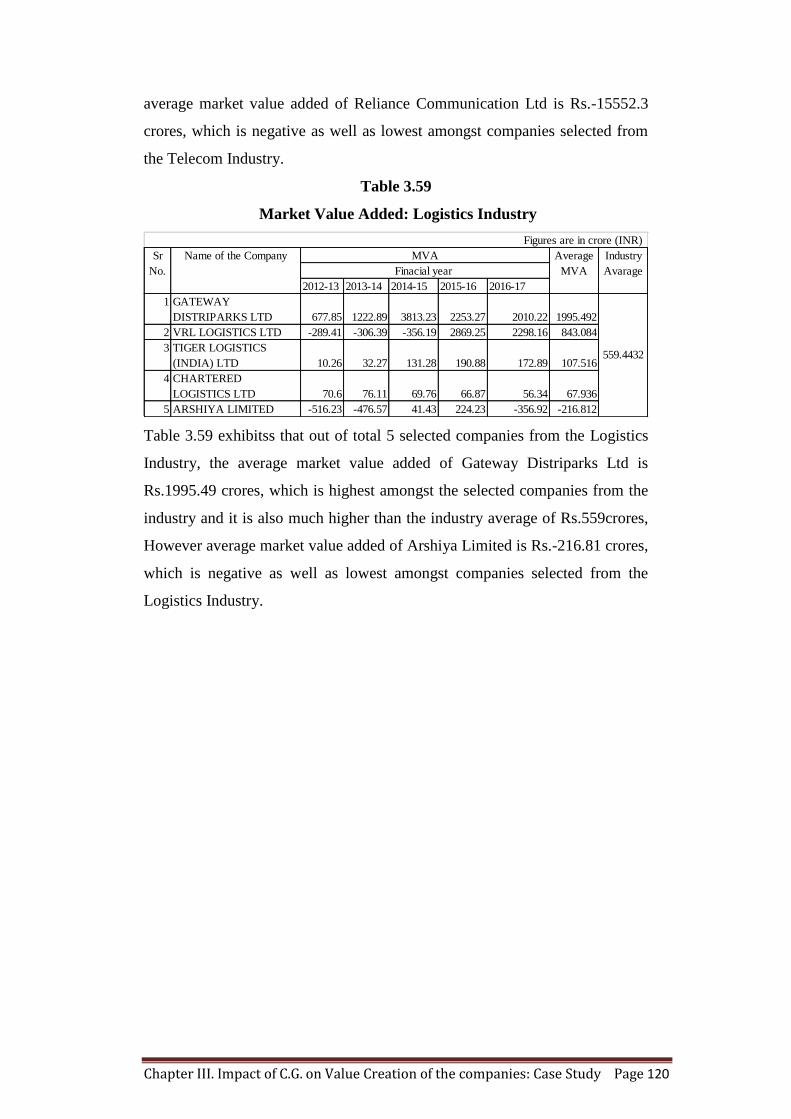
Chapter III. Impact of C.G. on Value Creation of the companies: Case Study Page 120
average market value added of Reliance Communication Ltd is Rs.-15552.3
crores, which is negative as well as lowest amongst companies selected from
the Telecom Industry.
Table 3.59
Market Value Added: Logistics Industry
Table 3.59 exhibitss that out of total 5 selected companies from the Logistics
Industry, the average market value added of Gateway Distriparks Ltd is
Rs.1995.49 crores, which is highest amongst the selected companies from the
industry and it is also much higher than the industry average of Rs.559crores,
However average market value added of Arshiya Limited is Rs.-216.81 crores,
which is negative as well as lowest amongst companies selected from the
Logistics Industry.
2012-13 2013-14 2014-15 2015-16 2016-17
1 GATEWAY
DISTRIPARKS LTD 677.85 1222.89 3813.23 2253.27 2010.22 1995.492
2 VRL LOGISTICS LTD -289.41 -306.39 -356.19 2869.25 2298.16 843.084
3 TIGER LOGISTICS
(INDIA) LTD 10.26 32.27 131.28 190.88 172.89 107.516
4 CHARTERED
LOGISTICS LTD 70.6 76.11 69.76 66.87 56.34 67.936
5 ARSHIYA LIMITED -516.23 -476.57 41.43 224.23 -356.92 -216.812
Average
MVA
Industry
Avarage
559.4432
Figures are in crore (INR)
Sr
No.
Name of the Company MVA
Finacial year
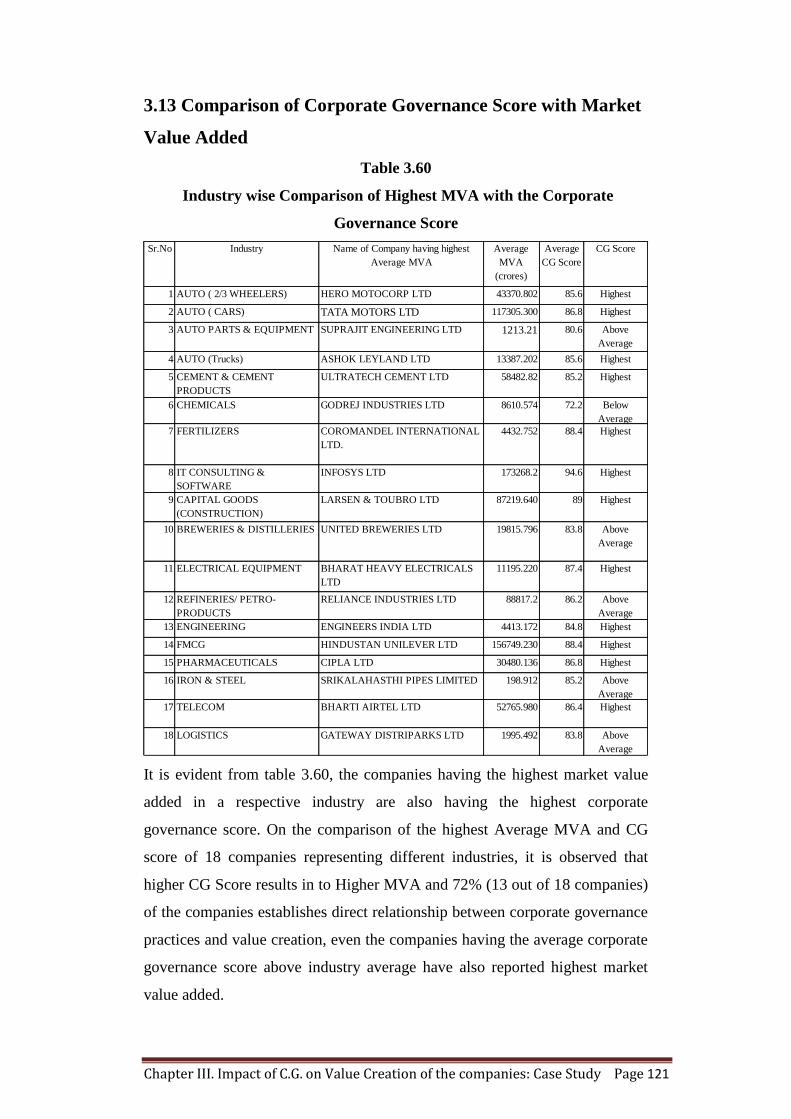
Chapter III. Impact of C.G. on Value Creation of the companies: Case Study Page 121
3.13 Comparison of Corporate Governance Score with Market
Value Added
Table 3.60
Industry wise Comparison of Highest MVA with the Corporate
Governance Score
It is evident from table 3.60, the companies having the highest market value
added in a respective industry are also having the highest corporate
governance score. On the comparison of the highest Average MVA and CG
score of 18 companies representing different industries, it is observed that
higher CG Score results in to Higher MVA and 72% (13 out of 18 companies)
of the companies establishes direct relationship between corporate governance
practices and value creation, even the companies having the average corporate
governance score above industry average have also reported highest market
value added.
Sr.No Industry Name of Company having highest
Average MVA
Average
MVA
(crores)
Average
CG Score
CG Score
1 AUTO ( 2/3 WHEELERS) HERO MOTOCORP LTD 43370.802 85.6 Highest
2 AUTO ( CARS) TATA MOTORS LTD 117305.300 86.8 Highest
3 AUTO PARTS & EQUIPMENT SUPRAJIT ENGINEERING LTD 1213.21 80.6 Above
Average
4 AUTO (Trucks) ASHOK LEYLAND LTD 13387.202 85.6 Highest
5 CEMENT & CEMENT
PRODUCTS
ULTRATECH CEMENT LTD 58482.82 85.2 Highest
6 CHEMICALS GODREJ INDUSTRIES LTD 8610.574 72.2 Below
Average
7 FERTILIZERS COROMANDEL INTERNATIONAL
LTD.
4432.752 88.4 Highest
8 IT CONSULTING &
SOFTWARE
INFOSYS LTD 173268.2 94.6 Highest
9 CAPITAL GOODS
(CONSTRUCTION)
LARSEN & TOUBRO LTD 87219.640 89 Highest
10 BREWERIES & DISTILLERIES UNITED BREWERIES LTD 19815.796 83.8 Above
Average
11 ELECTRICAL EQUIPMENT BHARAT HEAVY ELECTRICALS
LTD
11195.220 87.4 Highest
12 REFINERIES/ PETRO-
PRODUCTS
RELIANCE INDUSTRIES LTD 88817.2 86.2 Above
Average
13 ENGINEERING ENGINEERS INDIA LTD 4413.172 84.8 Highest
14 FMCG HINDUSTAN UNILEVER LTD 156749.230 88.4 Highest
15 PHARMACEUTICALS CIPLA LTD 30480.136 86.8 Highest
16 IRON & STEEL SRIKALAHASTHI PIPES LIMITED 198.912 85.2 Above
Average
17 TELECOM BHARTI AIRTEL LTD 52765.980 86.4 Highest
18 LOGISTICS GATEWAY DISTRIPARKS LTD 1995.492 83.8 Above
Average
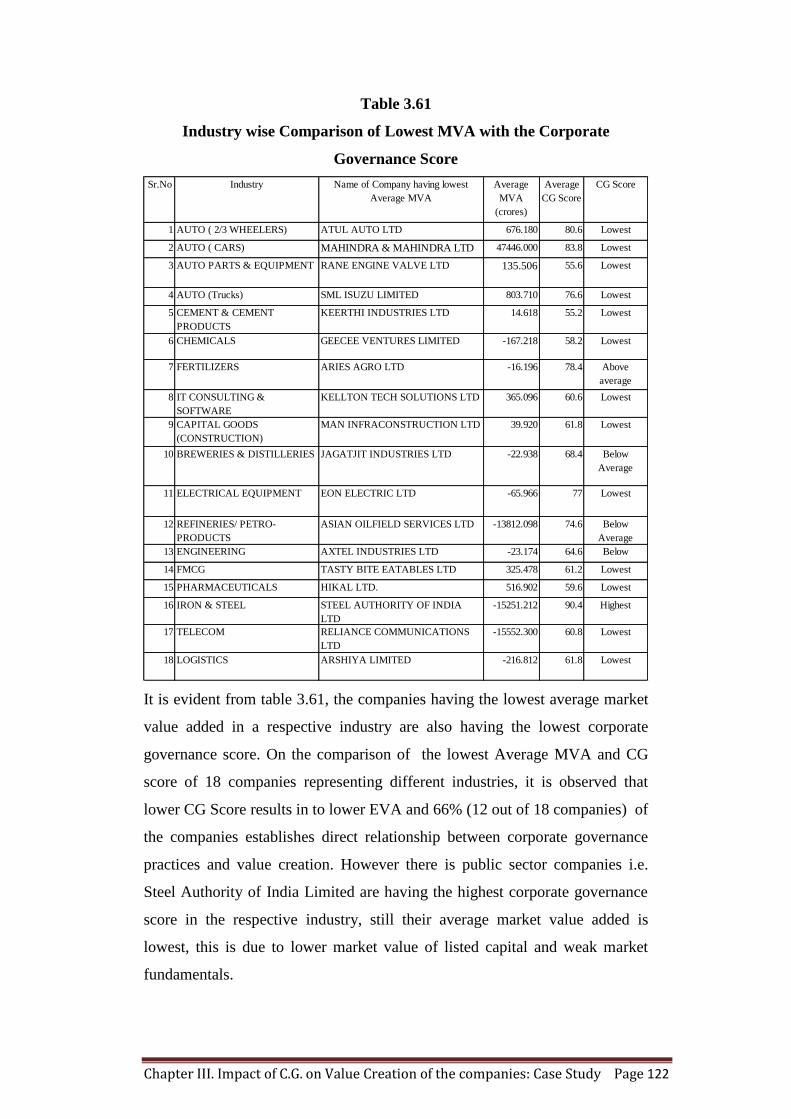
Chapter III. Impact of C.G. on Value Creation of the companies: Case Study Page 122
Table 3.61
Industry wise Comparison of Lowest MVA with the Corporate
Governance Score
It is evident from table 3.61, the companies having the lowest average market
value added in a respective industry are also having the lowest corporate
governance score. On the comparison of the lowest Average MVA and CG
score of 18 companies representing different industries, it is observed that
lower CG Score results in to lower EVA and 66% (12 out of 18 companies) of
the companies establishes direct relationship between corporate governance
practices and value creation. However there is public sector companies i.e.
Steel Authority of India Limited are having the highest corporate governance
score in the respective industry, still their average market value added is
lowest, this is due to lower market value of listed capital and weak market
fundamentals.
Sr.No Industry Name of Company having lowest
Average MVA
Average
MVA
(crores)
Average
CG Score
CG Score
1 AUTO ( 2/3 WHEELERS) ATUL AUTO LTD 676.180 80.6 Lowest
2 AUTO ( CARS) MAHINDRA & MAHINDRA LTD 47446.000 83.8 Lowest
3 AUTO PARTS & EQUIPMENT RANE ENGINE VALVE LTD 135.506 55.6 Lowest
4 AUTO (Trucks) SML ISUZU LIMITED 803.710 76.6 Lowest
5 CEMENT & CEMENT
PRODUCTS
KEERTHI INDUSTRIES LTD 14.618 55.2 Lowest
6 CHEMICALS GEECEE VENTURES LIMITED -167.218 58.2 Lowest
7 FERTILIZERS ARIES AGRO LTD -16.196 78.4 Above
average
8 IT CONSULTING &
SOFTWARE
KELLTON TECH SOLUTIONS LTD 365.096 60.6 Lowest
9 CAPITAL GOODS
(CONSTRUCTION)
MAN INFRACONSTRUCTION LTD 39.920 61.8 Lowest
10 BREWERIES & DISTILLERIES JAGATJIT INDUSTRIES LTD -22.938 68.4 Below
Average
11 ELECTRICAL EQUIPMENT EON ELECTRIC LTD -65.966 77 Lowest
12 REFINERIES/ PETRO-
PRODUCTS
ASIAN OILFIELD SERVICES LTD -13812.098 74.6 Below
Average
13 ENGINEERING AXTEL INDUSTRIES LTD -23.174 64.6 Below
Average14 FMCG TASTY BITE EATABLES LTD 325.478 61.2 Lowest
15 PHARMACEUTICALS HIKAL LTD. 516.902 59.6 Lowest
16 IRON & STEEL STEEL AUTHORITY OF INDIA
LTD
-15251.212 90.4 Highest
17 TELECOM RELIANCE COMMUNICATIONS
LTD
-15552.300 60.8 Lowest
18 LOGISTICS ARSHIYA LIMITED -216.812 61.8 Lowest
Chapter III. Impact of C.G. on Value Creation of the companies: Case Study Page 123
3.14 Research Methodology for Panel Data Analysis
For the empirical examination of the issue concerned with the effect of
corporate governance on the value creation of the Companies proxied by the
EVA and MVA, the panel data econometric techniques have applied. There
are other names of penal pooled data indicating the pooling of time series and
cross-sectional observations, longitudinal data and event history analysis.
Essentially, the penal data analysis involves the study of movement over the
period of time of cross-sectional units.
As it is discussed in section 3.7, 3.8 & 3.9 the data on corporate governance
score, EVA and MVA have been calculated for the 80 companies pertaining to
15 industries for the period from 2012-13 to 2016-17. It is clearly evident that
the data structure involves the combination of both time-series and cross-
sectional phenomena, making the data penal data. It is important to note that
the time period for all the companies remains the same and there is not any
missing entry, so this kind of panel data structure is called balance panel data.
3.14.1. Importance of Panel Data:
a) Since panel data relates to the cross-sectional units over a period of
time, there is bound to heterogeneity in these units. The technique of
penal data estimation can take such heterogeneity into account and
allow the analysis of individual-specific variables.
b) By combining the time series and cross-sectional observations it is
possible to incorporate more information, more variability, less
collinearity amongst the variable and allow more degrees of freedom.
c) Panel data analysis is more suitable when the study involves the
analysis of dynamic change.
d) Panel data can batter detect and measure the effects that simply cannot
be observed in cross-sectional and time series analysis.
Chapter III. Impact of C.G. on Value Creation of the companies: Case Study Page 124
3.14.2. Approach to the Panel Data Analysis:
The panel data regression, estimation, and analysis widely differ from that of
regular time series and cross-section analysis. The general form of panel
regression equation can be represented as follows1:
…….…………………(3.4)
Where i stands for the ith
cross-sectional unit i= 1, 2,….., N, and
t stands for the tth
time period t = 1, 2,….., T
α is an intercept and βs are the slope coefficients of independent
variable Xs.
It is important to note that i denote the cross-section identifier and tthe time
identifier.at the assumption that the maximum of N cross-sectional unitsis
involved having a maximum T time period.
3.14.3. Estimation of Panel Regression:
The identification and estimation of the panel regression depend on the
assumptions made for the intercept, slope coefficient, and the data structure.
For the empirical examination of the study undertaken, the three basic
approaches of the panel data regression analysis have been carried out which
are as follows:
3.14.3.1 Pooled Regression Model:
The conventional and the simplest approach to the panel regression analysis is
the pooled regression. Under this approach, the cross-sectional and time-series
dimensions in the panel data are ignored and all the cross-sectional units are
considered identical.
…….…………………(3.5)
The pooled regression equation (3.5) is a general representation of the pooled
regression, where it is clearly indicated compare to the equation (3.4), the
cross-section (i) and the time dimensions (t) are discarded. The parameters in
the equation (3.5) α and βs can be estimated using the Ordinary Least Square
method of estimation.
1 See Damodar N Gujarati and Sangeeta, Basic Econometrics, Tata McGrew Hill, 4
th Edition ,
2007, Chapter-16 , PP 650
Chapter III. Impact of C.G. on Value Creation of the companies: Case Study Page 125
However, it is important to note that, in reality, all the cross-sectional units are
not identical and heterogynous characteristics. The assumptions of uniformity
under pooled regression is highly restrictive and do not incorporate the
individualistic characteristics of cross-sectional units.
3.14.3.2 Fixed Effect Model:
One way to take into account the individualistic characteristics of the cross-
sectional is to allow the intercept to vary for each cross-sectional unit.
However, there an important assumption regarding this kind of structure is that
the slope coefficients (βs) are constant across cross-sectional units
…….………………… (3.6)
It is important to notice that the subscript i incorporated in the intercept α
indicates that all the cross-sectional units in the panel data are different and the
difference may be due to the special characteristics of the individual cross-
sectional units.
The model (3.6) is known as the Fix Effect Model (FEM). The term fixed
effect indicates that although the intercept may differ, the cross-sectional units
and the individual intercept does not change over the period of time.
Now the important question is how to allow the intercept to vary between the
cross-sectional units? It can easily be done by incorporating dummy variable
techniques. The model (3.6) can further be expressed as:
…….…… (3.7)
In model (3.7) it is assumed that there are three cross-sectional units. To
capture the individual effect in the intercept two dummies are incorporated
(D2 and D3) to avoid the dummy variable trap the dummies to be incorporated
in the fixed effect model would be (i-1). As it is assumed that there are three
cross-sectional units the dummies would be (3-1 =2), where =1 if
observation belongs to Unit -1 and 0 otherwise. =1 if the observation
belongs to Unit-2 and 0 otherwise. As the dummies, the dummies are
incorporated in the model (3.7). In the literature, the model (3.7) is known as
the Least Squares Dummy Variable Model (LSDV)2. The coefficients of the
2 See Damodar N Gujarati and Sangeeta, Basic Econometrics, Tata McGrew Hill, 4
th Edition ,
2007, Chapter-16 , PP 656
Chapter III. Impact of C.G. on Value Creation of the companies: Case Study Page 126
model (3.7) can be estimated using the Generalized Least Square (GLS)
technique.
Though it is easy to use the LSDV approach for the estimation of the fix effect
model there is some problem with the technique.
a) Introducing too many dummy variables in the model will create a
problem of degrees of freedom
b) With so many variables in the model may create a problem of
multicollinearity.
c) The fix effect model is not suitable in the case where there are many
cross-sectional Units and less time-series dimensions.
3.14.3.3 Random Effect Model:
Though it is easy to apply the fix effect model to analysis the panel data
structure there will always be a problem of degrees of freedom if three are
several cross-sectional units. According to Kemnta (1986), ‗An obvious
question in connection with the covariance [i.e. LSDV] model is whether the
inclusion of dummy variables- and the constant loss of the number of degrees
of freedom – is really necessary. The reasoning underlying the covariance
model is that in specifying the regression model we have failed to include
relevant explanatory variables that do not change over time (and possibly
other that do change over time but have the same value for all cross-sectional
units) and that the inclusion of dummy variables is a cover-up of our
ignorance. (Dielman, Jan kmenta, 1986)
If the fixed effect model does not provide sufficient information the Error
Component Model (ECM) or Random Effect Model (REM) can be applied.
The basic idea of REM starts with the model (3.6).
…….………………… (3.8)
Instead of as fixed, it is assumed the intercept is a random variable with the
mean value of, and the intercept value of an individual cross-sectional unit can
be express as
….………………… (3.9)
Where is a random error with a mean value of zero and constant variance.
By substituting equation (3.9) in to (3.8) we obtain
Chapter III. Impact of C.G. on Value Creation of the companies: Case Study Page 127
…….………………… (3.10)
…….………………… (3.11)
Where
…….………………… (3.12)
The usual assumption made for the random effect model is:
)
)
( )
( ) ( )
The random-effects model (3.11) can be estimated using the generalize least
square technique3. The random-effects model, as it is discussed, is more
suitable when the cross-sectional units are considerably large and the time
dimensions are small.
3.14.4. Model Diagnostics and Hypothesis Testing:
The model diagnostic is important to understand and analyze the goodness of
the estimated model. The conventional approaches such as Goodness of Fit, t-
Test, and F-statistics have been applied to check the validity of the fitted
models.
1.4.1 t-Test
The t-test is applied to validate the significance of the estimated coefficients
in the model4. The t value is obtained from the t-test. The t-test is the test of
the significance of It is counted to find out that the value of estimated
is significant or not? In t-test first, the t ratio is calculated as:
―df “ i.e. degrees of freedom find out as:
Where N = number of observations
3 See Damodar N Gujarati and Sangeeta, Basic Econometrics, Tata McGrew Hill, 4
th Edition ,
2007, , PP 405 4 See Damodar N Gujarati and Sangeeta, Basic Econometrics, Tata McGrew Hill, 4
th Edition ,
2007, , PP 257-258
Chapter III. Impact of C.G. on Value Creation of the companies: Case Study Page 128
K = parameters.
Then table value of t at 5% is found out on the basis of ―df“ i.e.
If,
It indicates that if the t statistical value is greater than the tabular value than
the t-test is significant, and if t statistical value is less than tabular value than
the t-test is insignificant. Also, when the t-test is significant we accept the
alternative hypothesis and reject the Null hypothesis when the t-test is
insignificant than we accept the Null and reject the alternative hypothesis.
3.14.4.1 Goodness of Fit – R2:
The coefficient of determination, R2, is the summary measure that tells how
well the sample regression line fits the data.
To compute R2, we proceed as follows:
Or in the deviation form
Squaring on both sides and summing over the sample, we obtain
The quantity R2 thus defined is known as the (sample) coefficient of
determination and is the most commonly used measure of goodness of fit of a
regression line. Verbally, R2 measures the proportion or percentage of the
total variation in Y explained by the regression model.
3.14.4.2 F –TEST:
The usual t-test cannot be used to test the joint hypothesis that the true partial
slope coefficients are zero simultaneously. However, this hypothesis can be tested
by the analysis of variance technique.
Chapter III. Impact of C.G. on Value Creation of the companies: Case Study Page 129
TABLE 3.62.
F- test
3.15. Empirical Analysis
For the empirical examination of the issue related to the impact of corporate
governance on the value creation of the companies, as discussed in the 3.10,
panel data analysis has been carried out. There have been 80 companies
pertaining 15 to different industries (Annexure -II) taken into account and the
time period is 2012-13 to 2016-17. The estimation of and analysis of penal
data models have been carried out using EViews-9.
3.15.1 Estimation of Pooled Regression Model
As it is discussed in section 3.10.3.1, equation No. 3.5 has been estimated for
the following two different approaches to understand the impact of corporate
governance on the value creation of the companies.
a. EVAit = f (CGSit)
b. MVAit = f (CGSit)
Table No: 3.63
Estimation of pooled Regression Model - 1
Dependent Variable: EVA
Method: Panel Least Squares
Sample: 2012-13 2016-17
Periods included: 5
Cross-sections included: 80
Total panel (balanced) observations: 400
Variable Coefficient Std. Error t-Statistic Prob.
C -8213.076 1709.509 -4.804349 0.0000
CGS 121.8461 22.10511 5.512127 0.0000
R-squared 0.170926
F-statistic 30.38354
Prob(F-statistic) 0.000000
Table No. 3.63 indicates the estimation of the function EVAit = f (CGSit). It is
clearly indicated that the CGS is positively affected by the EVA and the
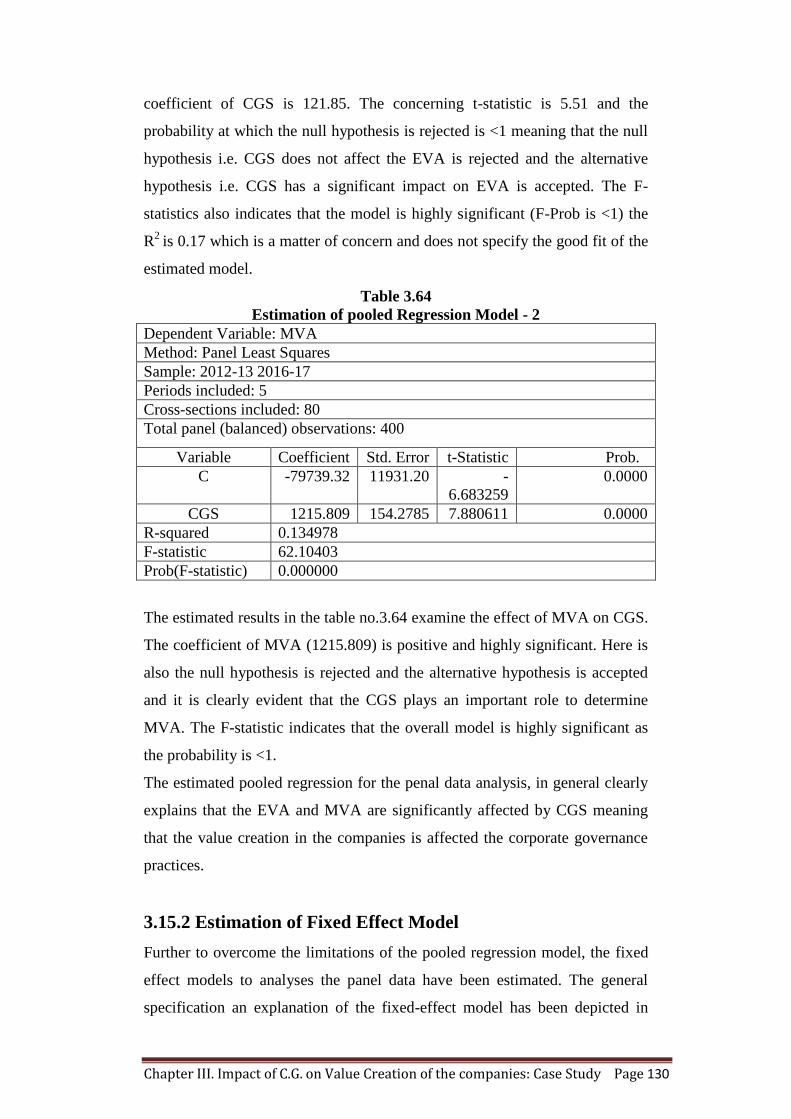
Chapter III. Impact of C.G. on Value Creation of the companies: Case Study Page 130
coefficient of CGS is 121.85. The concerning t-statistic is 5.51 and the
probability at which the null hypothesis is rejected is <1 meaning that the null
hypothesis i.e. CGS does not affect the EVA is rejected and the alternative
hypothesis i.e. CGS has a significant impact on EVA is accepted. The F-
statistics also indicates that the model is highly significant (F-Prob is <1) the
R2
is 0.17 which is a matter of concern and does not specify the good fit of the
estimated model.
Table 3.64
Estimation of pooled Regression Model - 2
Dependent Variable: MVA
Method: Panel Least Squares
Sample: 2012-13 2016-17
Periods included: 5
Cross-sections included: 80
Total panel (balanced) observations: 400
Variable Coefficient Std. Error t-Statistic Prob.
C -79739.32 11931.20 -
6.683259
0.0000
CGS 1215.809 154.2785 7.880611 0.0000
R-squared 0.134978
F-statistic 62.10403
Prob(F-statistic) 0.000000
The estimated results in the table no.3.64 examine the effect of MVA on CGS.
The coefficient of MVA (1215.809) is positive and highly significant. Here is
also the null hypothesis is rejected and the alternative hypothesis is accepted
and it is clearly evident that the CGS plays an important role to determine
MVA. The F-statistic indicates that the overall model is highly significant as
the probability is <1.
The estimated pooled regression for the penal data analysis, in general clearly
explains that the EVA and MVA are significantly affected by CGS meaning
that the value creation in the companies is affected the corporate governance
practices.
3.15.2 Estimation of Fixed Effect Model
Further to overcome the limitations of the pooled regression model, the fixed
effect models to analyses the panel data have been estimated. The general
specification an explanation of the fixed-effect model has been depicted in
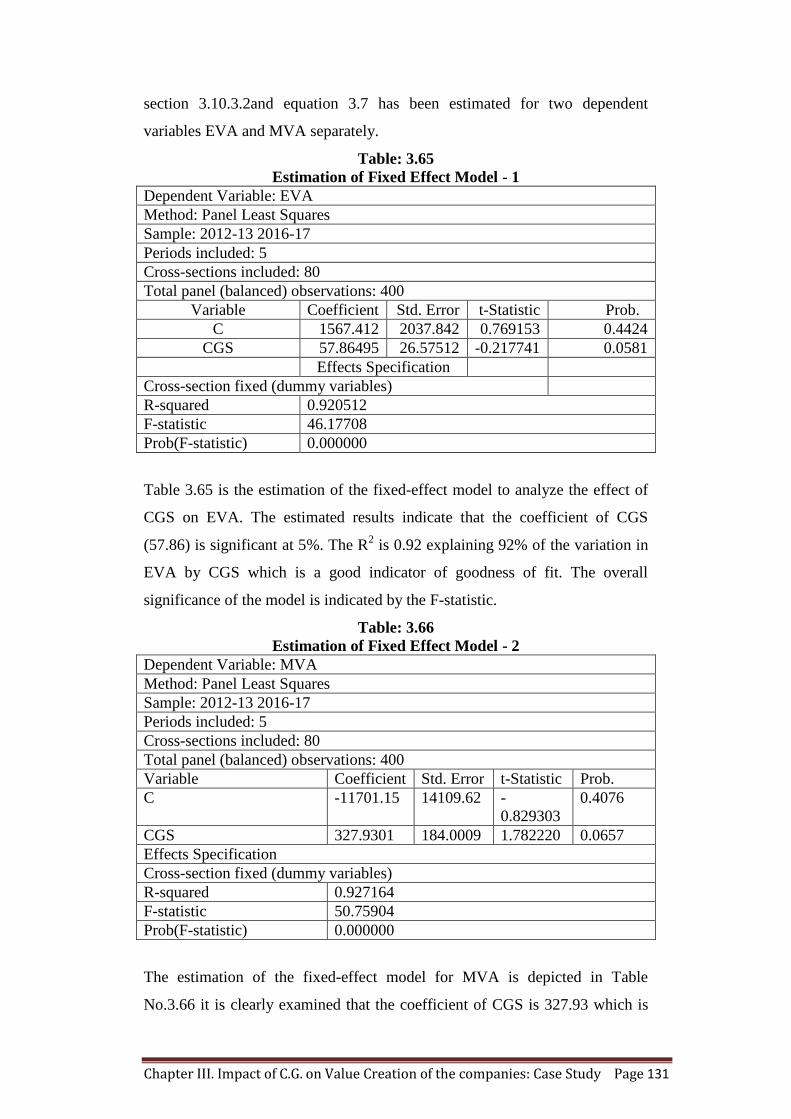
Chapter III. Impact of C.G. on Value Creation of the companies: Case Study Page 131
section 3.10.3.2and equation 3.7 has been estimated for two dependent
variables EVA and MVA separately.
Table: 3.65
Estimation of Fixed Effect Model - 1
Dependent Variable: EVA
Method: Panel Least Squares
Sample: 2012-13 2016-17
Periods included: 5
Cross-sections included: 80
Total panel (balanced) observations: 400
Variable Coefficient Std. Error t-Statistic Prob.
C 1567.412 2037.842 0.769153 0.4424
CGS 57.86495 26.57512 -0.217741 0.0581
Effects Specification
Cross-section fixed (dummy variables)
R-squared 0.920512
F-statistic 46.17708
Prob(F-statistic) 0.000000
Table 3.65 is the estimation of the fixed-effect model to analyze the effect of
CGS on EVA. The estimated results indicate that the coefficient of CGS
(57.86) is significant at 5%. The R2 is 0.92 explaining 92% of the variation in
EVA by CGS which is a good indicator of goodness of fit. The overall
significance of the model is indicated by the F-statistic.
Table: 3.66
Estimation of Fixed Effect Model - 2
Dependent Variable: MVA
Method: Panel Least Squares
Sample: 2012-13 2016-17
Periods included: 5
Cross-sections included: 80
Total panel (balanced) observations: 400
Variable Coefficient Std. Error t-Statistic Prob.
C -11701.15 14109.62 -
0.829303
0.4076
CGS 327.9301 184.0009 1.782220 0.0657
Effects Specification
Cross-section fixed (dummy variables)
R-squared 0.927164
F-statistic 50.75904
Prob(F-statistic) 0.000000
The estimation of the fixed-effect model for MVA is depicted in Table
No.3.66 it is clearly examined that the coefficient of CGS is 327.93 which is
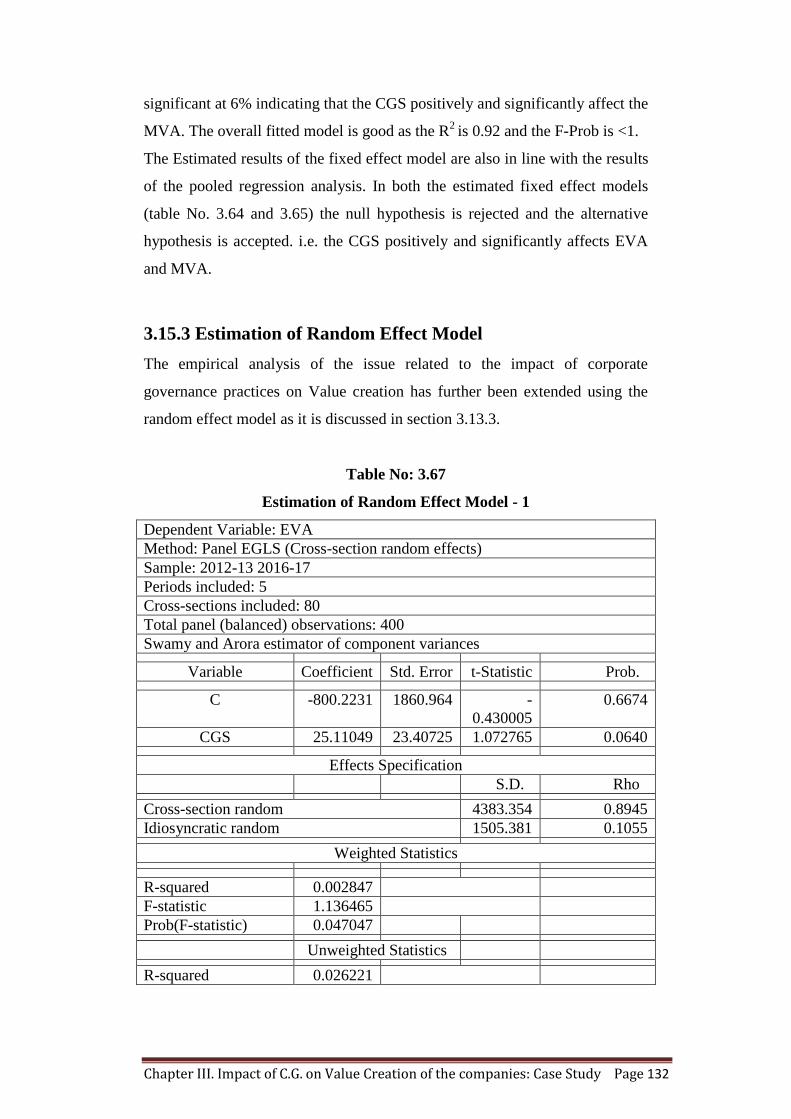
Chapter III. Impact of C.G. on Value Creation of the companies: Case Study Page 132
significant at 6% indicating that the CGS positively and significantly affect the
MVA. The overall fitted model is good as the R2
is 0.92 and the F-Prob is <1.
The Estimated results of the fixed effect model are also in line with the results
of the pooled regression analysis. In both the estimated fixed effect models
(table No. 3.64 and 3.65) the null hypothesis is rejected and the alternative
hypothesis is accepted. i.e. the CGS positively and significantly affects EVA
and MVA.
3.15.3 Estimation of Random Effect Model
The empirical analysis of the issue related to the impact of corporate
governance practices on Value creation has further been extended using the
random effect model as it is discussed in section 3.13.3.
Table No: 3.67
Estimation of Random Effect Model - 1
Dependent Variable: EVA
Method: Panel EGLS (Cross-section random effects)
Sample: 2012-13 2016-17
Periods included: 5
Cross-sections included: 80
Total panel (balanced) observations: 400
Swamy and Arora estimator of component variances
Variable Coefficient Std. Error t-Statistic Prob.
C -800.2231 1860.964 -
0.430005
0.6674
CGS 25.11049 23.40725 1.072765 0.0640
Effects Specification
S.D. Rho
Cross-section random 4383.354 0.8945
Idiosyncratic random 1505.381 0.1055
Weighted Statistics
R-squared 0.002847
F-statistic 1.136465
Prob(F-statistic) 0.047047
Unweighted Statistics
R-squared 0.026221
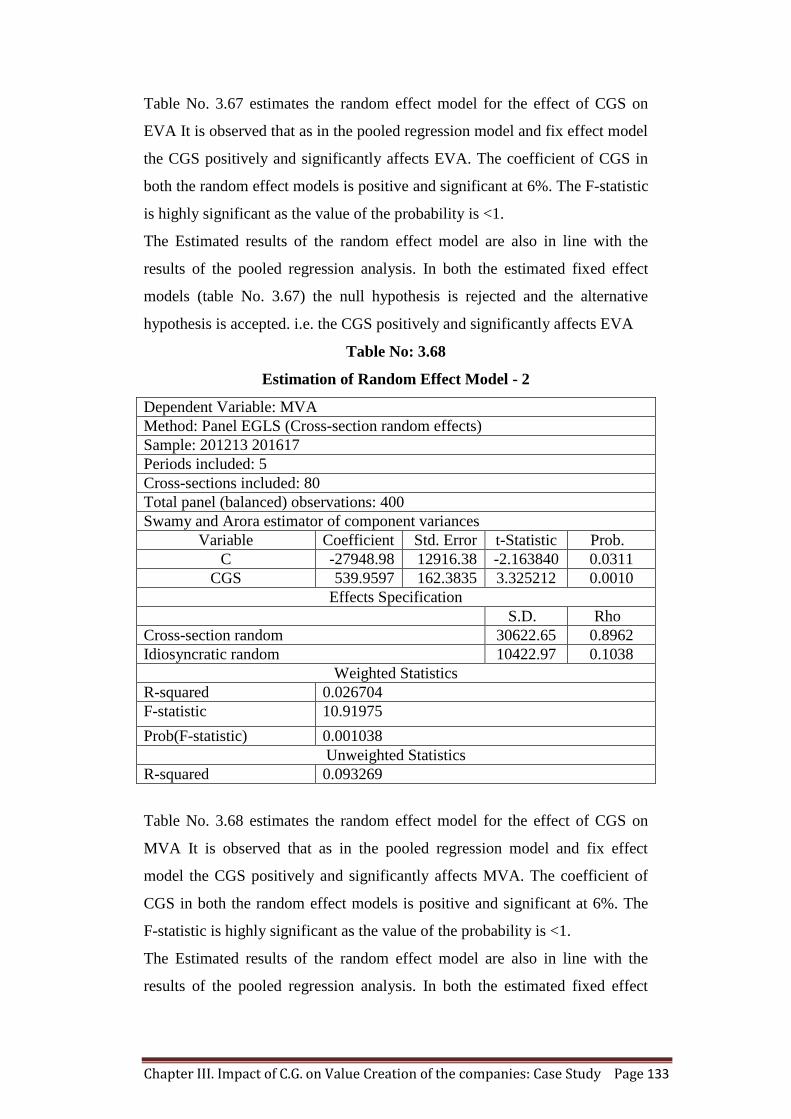
Chapter III. Impact of C.G. on Value Creation of the companies: Case Study Page 133
Table No. 3.67 estimates the random effect model for the effect of CGS on
EVA It is observed that as in the pooled regression model and fix effect model
the CGS positively and significantly affects EVA. The coefficient of CGS in
both the random effect models is positive and significant at 6%. The F-statistic
is highly significant as the value of the probability is <1.
The Estimated results of the random effect model are also in line with the
results of the pooled regression analysis. In both the estimated fixed effect
models (table No. 3.67) the null hypothesis is rejected and the alternative
hypothesis is accepted. i.e. the CGS positively and significantly affects EVA
Table No: 3.68
Estimation of Random Effect Model - 2
Table No. 3.68 estimates the random effect model for the effect of CGS on
MVA It is observed that as in the pooled regression model and fix effect
model the CGS positively and significantly affects MVA. The coefficient of
CGS in both the random effect models is positive and significant at 6%. The
F-statistic is highly significant as the value of the probability is <1.
The Estimated results of the random effect model are also in line with the
results of the pooled regression analysis. In both the estimated fixed effect
Dependent Variable: MVA
Method: Panel EGLS (Cross-section random effects)
Sample: 201213 201617
Periods included: 5
Cross-sections included: 80
Total panel (balanced) observations: 400
Swamy and Arora estimator of component variances
Variable Coefficient Std. Error t-Statistic Prob.
C -27948.98 12916.38 -2.163840 0.0311
CGS 539.9597 162.3835 3.325212 0.0010
Effects Specification
S.D. Rho
Cross-section random 30622.65 0.8962
Idiosyncratic random 10422.97 0.1038
Weighted Statistics
R-squared 0.026704
F-statistic 10.91975
Prob(F-statistic) 0.001038
Unweighted Statistics
R-squared 0.093269
Chapter III. Impact of C.G. on Value Creation of the companies: Case Study Page 134
models (table No. 3.68) the null hypothesis is rejected and the alternative
hypothesis is accepted. i.e. The CGS positively and significantly affects MVA.
3.16 Findings and Conclusions
There are some generally accepted key convictions good governance are: a)
accountability b) transparency c) recognition of stakeholder/shareholder
rights. Some more principles that are generally accepted for the batter
governance are efficiency, stewardship, leadership, integrity and an emphasis
on performance as well as compliance, and stakeholder participation or
inclusiveness. The need for corporate governance has arisen because of the
increasing concern about the non-compliance of standards of financial
reporting and accountability by boards of directors and management of
corporate inflicting heavy losses on investors.
There are a number of norms and laws that have been prevailing around the
globe for the batter governance practices, so it is necessary to check the impact
of such laws on the performance of the companies. Some recent researches
have however answered these questions by showing that companies with good
governance system have actually comparatively more returns for their
shareholders thereby gaining shareholders confidence and improving
economic conditions of a country.
It is revealed from the literature that no studies have been conducted to
measure the association of corporate governance with the value creation of the
companies or a shareholder‘s value creation or shareholders‘ wealth
maximization. So it is necessary to conduct the study to establish and gauge
the relationship between the corporate governance practices followed by the
companies and the long-term motive of the shareholder. This study has been
conducted with the motive to measure the impact of corporate governance
practices in India on the shareholders‘ value creation.
The study has been conducted by selecting 80 companies from the
manufacturing and service sector based on the various criterions and corporate
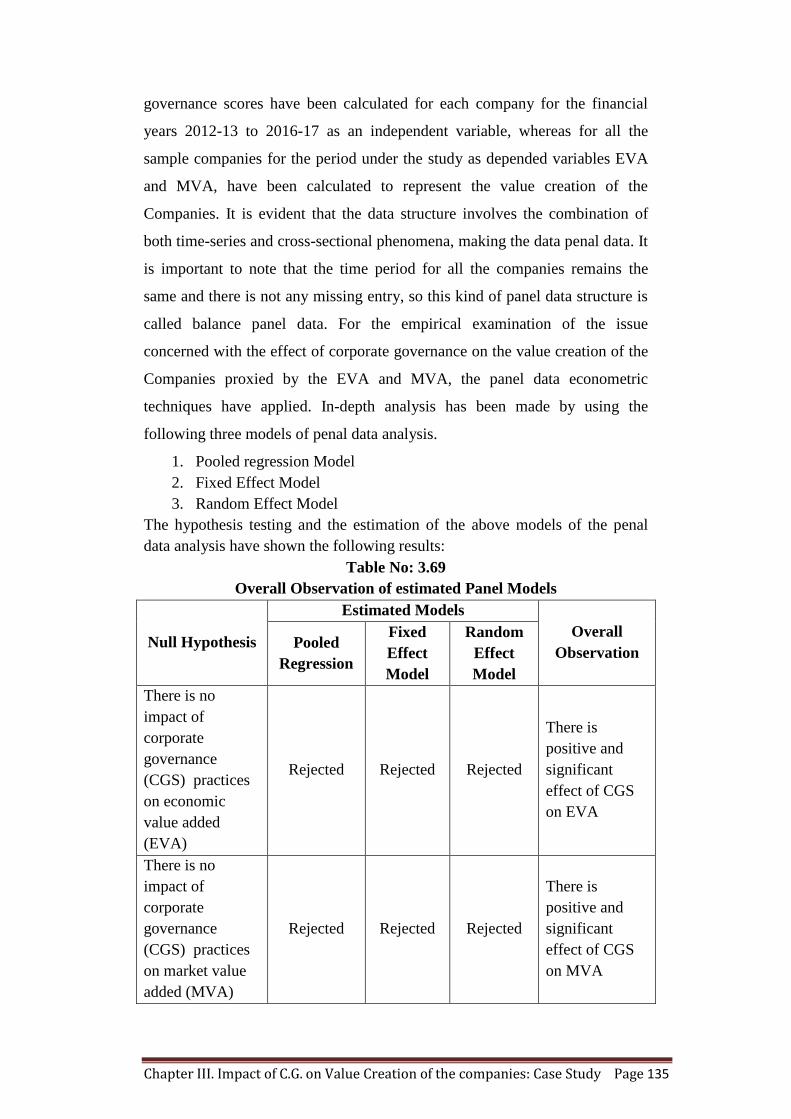
Chapter III. Impact of C.G. on Value Creation of the companies: Case Study Page 135
governance scores have been calculated for each company for the financial
years 2012-13 to 2016-17 as an independent variable, whereas for all the
sample companies for the period under the study as depended variables EVA
and MVA, have been calculated to represent the value creation of the
Companies. It is evident that the data structure involves the combination of
both time-series and cross-sectional phenomena, making the data penal data. It
is important to note that the time period for all the companies remains the
same and there is not any missing entry, so this kind of panel data structure is
called balance panel data. For the empirical examination of the issue
concerned with the effect of corporate governance on the value creation of the
Companies proxied by the EVA and MVA, the panel data econometric
techniques have applied. In-depth analysis has been made by using the
following three models of penal data analysis.
1. Pooled regression Model
2. Fixed Effect Model
3. Random Effect Model
The hypothesis testing and the estimation of the above models of the penal
data analysis have shown the following results:
Table No: 3.69
Overall Observation of estimated Panel Models
Null Hypothesis
Estimated Models
Overall
Observation Pooled
Regression
Fixed
Effect
Model
Random
Effect
Model
There is no
impact of
corporate
governance
(CGS) practices
on economic
value added
(EVA)
Rejected Rejected Rejected
There is
positive and
significant
effect of CGS
on EVA
There is no
impact of
corporate
governance
(CGS) practices
on market value
added (MVA)
Rejected Rejected Rejected
There is
positive and
significant
effect of CGS
on MVA
Chapter III. Impact of C.G. on Value Creation of the companies: Case Study Page 136
The estimated pooled regression for the penal data analysis, in general
clearly explains that the EVA and MVA are significantly affected by CGS
meaning that the value creation in the companies is affected the corporate
governance practices.
The Estimated results of the random effect model are also in line with the
results of the pooled regression analysis. In both the estimated fixed-effect
models, the null hypothesis is rejected and the alternative hypothesis is
accepted. i.e. the CGS positively and significantly affects EVA
The Estimated results of the random effect model are also in line with the
results of the pooled regression analysis. In both the estimated fixed-effect
models, the null hypothesis is rejected and the alternative hypothesis is
accepted. i.e. The CGS positively and significantly affects MVA.
So it is concluded that corporate governance practices highly and significantly
affects the value creation of the companies. The high value of R2
describes that
there is a strong positive relationship between corporate governance practices
and value creation of companies. Further from the corporate governance
scorecard developed for the study, it is also observed that the companies
following internationally accepted practices of corporate governance are
having a very high EVA and MVA, means that companies are creating more
wealth for the shareholders than the companies following the corporate
governance practices merely for the complying the laws and regulations.
Corporate governance practices followed by the companies should be
principle-based and not merely for complying with the laws and regulations
As high standard corporate governance practices result in to high wealth
creation for the shareholders, the corporate governance practices should be
considered by the companies as a tool to enhance the wealth of the
shareholders instead of responsibility towards the regulators.
*****
Chapter III. Impact of C.G. on Value Creation of the companies: Case Study Page 137
References:
Agbaeze, E.K & Ogosi, Chinedu Daniel (2018) Corporate Governance
and Profitability of Nigerian Banks. European Journal of Scientific
Research ISSN 1450-216X / 1450-202X Vol. 148 No 3 February, 2018,
pp. 358-367 http://www. europeanjournalofscientificresearch.com
Bombay Stock exchange. (n.d.). Website.
https://www.bseindia.com/static/about/CorporateGovernanceScorecard.
Abdur Rouf. (2011). Board Composition, Firm Characteristics, and
Voluntary Disclosure: The Case of Jordanian Firms Listed on the Amman
Stock Exchange. International Business Research, pp. 67-82.
Adolf Berle and Gardiner Means. (1932). The Modern Corporation and
Private Property.
Adrian Cadbury. (2010). The National Computing Centre. Cadbury 1992.
Andrei Shleifer Robert W. Vishny. (1997). A Survey of Corporate
Governance.
Anthony kyereboach- Coleman. (2007). The impact of capital structure on
the performance of microfinance institutions. Emerald insight.
Babli Dhiman; Shipra Pruthi. (2012). EVA - A STUDY OF SELECTED
COMPANIES IN INDIA. International Journal of Applied Financial
Management Perspectives.
background training material on corporate governance. Regional
Training Institute, Allahabad.
Barry D. Baysinger and Henry N. Butler. (1985). Corporate Governance
and the Board of Directors: Performance Effects of Changes in Board
Composition. Journal of Law, Economics, & Organization, pp. 101-124.
Belina-Johnson, Anastasia. (2013). A Musician Divided: André
Tchaikowsky in his Own Words.
Black, Bernard S. (2007). Can Corporate Governance Reforms Increase
Firm Market Values? Event Study Evidence from India. ECGI - Finance
Working Paper No. 159/2007.
Bob Tricker . (2013). Corporate Governance. pp. 3-21.
Brewer, Peter C; Chandra, Gyan; Hock, Clayton A. (1999). Economic
value added (EVA): Its uses and limitations. S.A.M. Advanced
Management Journal, pp. 4-11.
Chapter III. Impact of C.G. on Value Creation of the companies: Case Study Page 138
Craig Doidge, G. Andrew Karolyi, and René M. Stulz. (2006). The U.S.
listing gap. Journal of Financial Economics.
Dielman, Jan kmenta. (1986). Elements of Econometrics. 2nd edition,
Mcmillan NewYork, p. 633.
Kaur and Suv Gil. (2008). University Business School, Punjab University,
Chandigarh. The Effects of Ownership Structure on corporate governance
and Performance: An Empirical Assessment in India.
Jain. (2016). EVA BASED PERFORMANCE MEASUREMENT: A
COMPARATIVE STUDY OF WITH PROFITABILITY AND
LEVERAGE OF INDIAN. Prestige International Journal of Management
& IT- Sanchayan, pp. 86-98.
Durgaprashad. (2010). Impact of Corporate Governance on the Stock
Prices of the Nifty 50 Broad Index Listed Companies. International
Research Journal of Finance and Economics, pp. 7-18.
Franklin Yale and Dougles Gale. (2002). Essay review on Franklin Allen
and Douglas Gale: Comparing Financial Systems.
Hart & Grossman . (1982). Corporate Financial Structure and Managerial
Incentives. 107-140.
Henry Mintzberg. (1984). Who Should Control the Corporation?
California management review.
Ibrahim, Q. & Rehman, Ramiz & Raoof, A.. (2010). Role of corporate
governance in firm performance: A comparative study between chemical
and pharmaceutical sectors of pakistan. International Research Journal of
Finance and Economics. 50.pp. 7-16.
Ibrahim, Q. (2010). DETERMINANTS OF CORPORATE
SUSTAINABILITY REPORTING IN SELECTED COMPANIES IN
NIGERIA.
Inta Kotane. (2011). NON-FINANCIAL INDICATORS FOR
EVALUATION OF BUSINESS ACTIVITY. EUROPEAN
INTEGRATION STUDIES, pp. 213-218.
Johnson and Kaplan. (1987). The Rise and Fall of Management
Accounting.
Mishra. (1998 ). Value Measurement Paradigm of Corporate Governance.
ASCI -Journal of Management.
Chapter III. Impact of C.G. on Value Creation of the companies: Case Study Page 139
McClenahen. (1998). applied Organizational Communication: Principles
and Pragmatics for Future.
Milbourn, Garvey. (2000). The search for the best financial performance
measure.
Dadhania (2015). Relationship between corporate governance indicators
and firm value: a study of Indian firms. Shaustra University - thesis.
Ofurum. (2001). INTELLECTUAL CAPITAL REPORTING AND
MEASURES OF FINANCIAL PERFORMANCE OF COMPANIES IN
NIGERIA. International Journal of Advanced Academic Research.
Page, Jean-Paul. (2005). Corporate Governance and Value Creation.
United States of America: The Research Foundation of CFA Institute.
Paolo Fulghieri and Matti Suominen. (2005). Does Bad Corporate
Governance Lead to Too Little Competition? Corporate Governance,
Capital Structure, and Industry Concentration. ECGI - Working Paper No.
74/2005.
Paul Mallette & Jackie Hartman. (1980). Impact of Board Structure and
Stock Ownership on Toxic Releases by U.S. Industrial Manufacturing
Firms.
Randall K. Morck, Lloyd Steir. (2005). The Global History of Corporate
Governance: An Introduction. NBER Working Paper No. 11062.
Rejie George Pallathitta. (2005). Corporate Governance and Firm
Performance: An Analysis of Ownership Structure, Profit Redistribution
and. Cochin University of Science and Technology.
Robert DeMaria, Jr., Heesok Chang, Samantha Zacher. (2013). A
Companion to British Literature. Early Modern Literature.
Ruback, Jensen and. (1983). The Market for Corporate Control: The
Scientific Evidence. Journal of Financial Economics, 5-50.
Sarkar, Jayati, and Subrata Sarkar. (2000). Large Shareholder Activism in
Corporate Governance in Developing Countries: Evidence from India.
International Review of Finance, pp. 161-194.
Shabbir. (2008). THE UK CODE OF CORPORATE
GOVERNANCE:LINK BETWEEN COMPLIANCE AND FIRM
PERFORMANCE. Research Paper Series.
Chapter III. Impact of C.G. on Value Creation of the companies: Case Study Page 140
Shimin Chen and James L. Dodd. (1997). Economic Value Added
(EVA™): An Empirical Examination Of A New Corporate Performance
Measure. Journal of Managerial Issues, pp. 318-333.
Sliger, M., & Broderick, S. (2008). The Software Project Manager's
Bridge to Agility.
Stern, Stewart, and Chew. (1995). Does EVA(R) beat earnings? Evidence
on associations with stock returns and firm values.
Stijn Claessens and B. Burcin Yurtoglu. (2013). Corporate governance in
emerging markets: A survey. Emerging Markets Review, pp. 1-33.
Triker, B. (2013). Corporate Governance, Principles, Policies, and
Practices. Noida: OXFORD University Press.
Webliography
Chandani. (2014). https://www.caclubindia.com.
https://www.pbookshop.com/media/filetype/s/p/1349783197.pdf retrieved
on 12.8.2016
https://slideplayer.com/slide/6430923/ retrieved on 18.8.2016
https://www.civilserviceindia.com/subject/General-
Studies/notes/corporate-governance.html retrieved on 8.10.2016
https://atharmudaththir.wordpress.com/author/atharmudasir269/ retrieved
on 18.11.2016
https://taxguru.in/company-law/enactment-concept-corporate-
governance.html retrieved on 15.12.2016
https://www.researchgate.net/publication/286978848_Role_of_corporate_
governance_in_firm_performance_A_comparative_study_between_chemi
cal_and_pharmaceutical_sectors_of_pakistan
https://www.elkjournals.com/MasterAdmin/UploadFolder/10.%20A%20S
TUDY%20OF%20CORPORATE%20GOVERNANCE/10.%20A%20ST
UDY%20OF%20CORPORATE%20GOVERNANCE.pdf retrieved on
14.8.2014