WG III contribution to the Sixth Assessment Report CHAPTER 16
144
WG III contribution to the Sixth Assessment Report List of corrigenda to be implemented The corrigenda listed below will be implemented in the Chapter during copy-editing. CHAPTER 16 Document (Chapter, Annex, Supp. Material) Page (Based on the final pdf FGD version) Line Detailed information on correction to make Chapter 16 4 35 in-text citation 'Box 16.5' should be Box 16.10 (the box on agriculture) Chapter 16 5 29 add line of sight: {16.6}. Chapter 16 5 38 in-text citation 'Box 16.10' should be Box 16.9 (the box on IPR) Chapter 16 17 10 & 17 replace Aghion et al 2013 with Aghion et al 2016 Chapter 16 22 30 replace Aghion et al 2013 with Aghion et al 2016
-
Upload
khangminh22 -
Category
Documents
-
view
0 -
download
0
Transcript of WG III contribution to the Sixth Assessment Report CHAPTER 16

WG III contribution to the Sixth Assessment Report List of corrigenda to be implemented
The corrigenda listed below will be implemented in the Chapter during copy-editing.
CHAPTER 16
Document (Chapter,
Annex, Supp.
Material)
Page (Based on the final pdf FGD version)
Line Detailed information on correction to make
Chapter 16 4 35 in-text citation 'Box 16.5' should be Box 16.10 (the box on agriculture)
Chapter 16 5 29 add line of sight: {16.6}.
Chapter 16 5 38 in-text citation 'Box 16.10' should be Box 16.9 (the box on IPR)
Chapter 16 17 10 & 17 replace Aghion et al 2013 with Aghion et al 2016
Chapter 16 22 30 replace Aghion et al 2013 with Aghion et al 2016

Chapter 16 74 Figure 16.3 replace the figure 16.3 see end of doc for revised version
Chapter 16 77 18 CCB12 Authors list: Maria Figueroa should read María Josefina Figueroa Meza
Chapter 16 1 13 Joni Juspesta (Indonesia) should read Joni Jupesta (Indonesia/Japan)
Chapter 16 18 25 Joni Juspesta (Indonesia) should read Joni Jupesta (Indonesia/Japan)
Chapter 16 Front 6 Ambuj D. Sagar
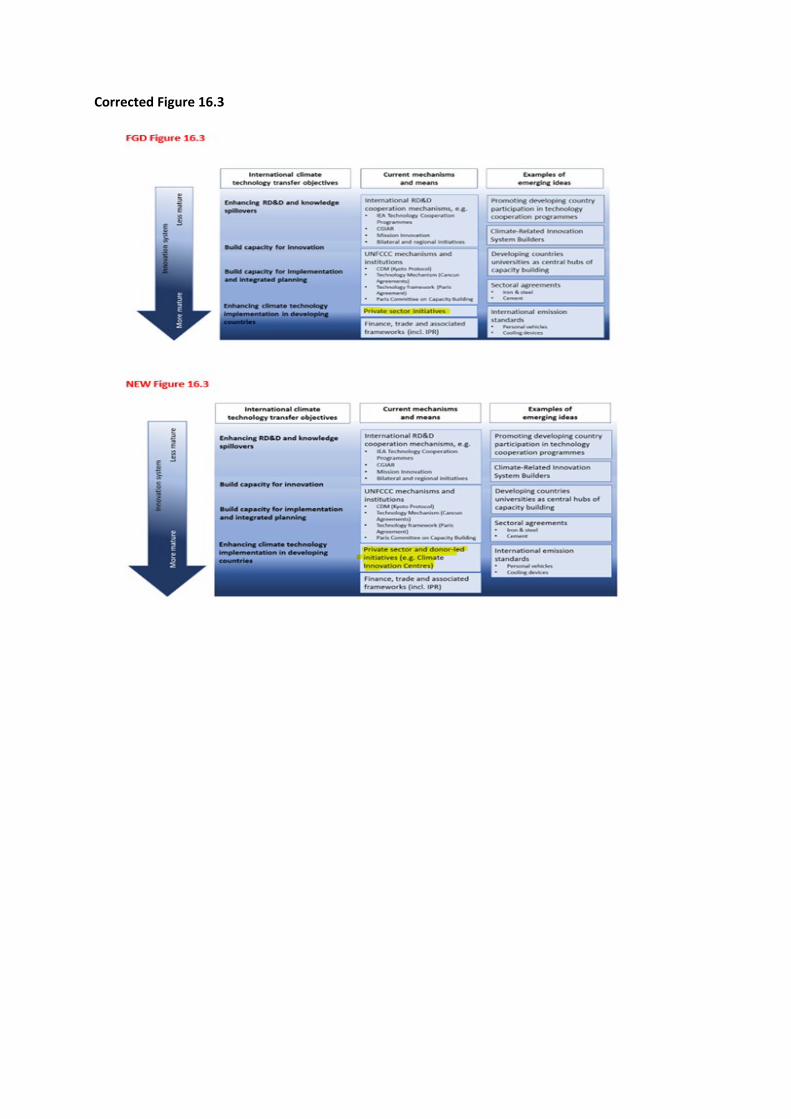
Corrected Figure 16.3

Do Not Cite, Quote or Distribute 16-1 Total pages: 141
Chapter 16: Innovation, technology development and transfer 1
2
Coordinating Lead Authors: Gabriel Blanco (Argentina), Heleen de Coninck (the Netherlands) 3
Lead Authors: Lawrence Agbemabiese (Ghana/the United States of America), El Hadji Mbaye Diagne 4
(Senegal), Laura Diaz Anadon (Spain/United Kingdom), Yun Seng Lim (Malaysia), Walter Alberto 5
Pengue (Argentina), Ambuj Sagar (India), Taishi Sugiyama (Japan), Kenji Tanaka (Japan), Elena 6
Verdolini (Italy), Jan Witajewski-Baltvilks (Poland) 7
Contributing Authors: Lara Aleluia Reis (Portugal), Mustafa Babiker (the Sudan/Saudi Arabia), 8
Xuemei Bai (Australia), Rudi Bekkers (the Netherlands), Paolo Bertoldi (Italy), Sara Burch (Canada), 9
Luisa F. Cabeza (Spain), Clara Caiafa (Brazil/the Netherlands), Brett Cohen (Republic of South Africa), 10
Felix Creutzig (Germany), Maria Josefina Figueroa Meza (Venezuela/Denmark), Clara Galeazzi 11
(Argentina), Frank Geels (United Kingdom/the Netherlands), Michael Grubb (United Kingdom), 12
Kirsten Halsnæs (Denmark), Joni Jupesta (Indonesia), Şiir Kilkiş (Turkey), Michael Koenig (Germany), 13
Jonathan Köhler (Germany), Abhishek Malhotra (India), Eric Masanet (the United States of America), 14
William McDowall (United Kingdom), Nikola Milojevic-Dupont (France), Catherine Mitchell (United 15
Kingdom), Greg Nemet (United States of America), Lars J. Nilsson (Sweden), Anthony Patt 16
(Switzerland), Patricia Perkins (Canada), Joyashree Roy (India/Thailand), Karolina Safarzynska 17
(Poland), Yamina Saheb (France/Algeria), Ayyoob Sharifi (Iran/Japan), Kavita Surana (India), Maarten 18
van Aalst (the Netherlands), Renée van Diemen (the Netherlands/United Kingdom), Harald Winkler 19
(Republic of South Africa) 20
Review Editors: Nagmeldin Mahmoud (the Sudan), Emi Mizuno (Japan) 21
Chapter Scientists: Muneki Adachi (Japan), Clara Caiafa (Brazil/the Netherlands), Daniela Keesler 22
(Argentina), Eriko Kiriyama (Japan) 23
24
Date of Draft: 28/11/2021 25
ACCEPTED VERSION
SUBJECT TO FIN
AL EDITS

Final Government Distribution Chapter 16 IPCC AR6 WGIII
Do Not Cite, Quote or Distribute 16-2 Total pages: 141
Table of Contents 1
Chapter 16: Innovation, technology development and transfer ..................................................... 16-1 2
Executive summary ........................................................................................................................ 16-4 3
16.1 Introduction ........................................................................................................................ 16-8 4
16.2 Elements, drivers and modelling of technology innovation ............................................. 16-11 5
16.2.1 Stages of the innovation process .............................................................................. 16-11 6
16.2.2 Sources of technological change .............................................................................. 16-14 7
Cross-Chapter Box 11: Digitalization: efficiency potentials and governance considerations . 16-18 8
16.2.3 Directing technological change ................................................................................ 16-22 9
16.2.4 Representation of the innovation process in modelled decarbonization pathways .. 16-25 10
16.3 A systemic view of technological innovation processes .................................................. 16-29 11
16.3.1 Frameworks for analysing technological innovation processes ............................... 16-29 12
16.3.2 Identifying systemic failures to innovation in climate-related technologies ............ 16-31 13
16.3.3 Indicators for technological innovation ................................................................... 16-35 14
16.3.4 Emerging policy perspectives on systemic transformations .................................... 16-42 15
16.4 Innovation policies and institutions ................................................................................. 16-45 16
16.4.1 Overview of policy instruments for climate technology innovation ........................ 16-45 17
16.4.2 The drivers and politics of national policies for climate change mitigation and adaptation18
16-47 19
16.4.3 Indicators to assess the innovation, competitiveness and distributional outcomes of 20
policy instruments .................................................................................................................... 16-48 21
16.4.4 Assessment of innovation and other impacts of innovation policy instruments ...... 16-49 22
16.4.5 Trade instruments and their impact on innovation ................................................... 16-61 23
16.4.6 Intellectual property rights, legal framework and the impact on innovation ........... 16-62 24
16.4.7 Sub-national innovation policies and industrial clusters .......................................... 16-64 25
16.4.8 System-oriented policies and instruments ................................................................ 16-65 26
16.5 International technology transfer and cooperation for transformative change................. 16-65 27
16.5.1 International cooperation on technology development and transfer: needs and 28
opportunities ............................................................................................................................ 16-65 29
16.5.2 Objectives and roles of international technology transfer and cooperation efforts .. 16-67 30
16.5.3 International technology transfer and cooperation: recent institutional approaches 16-69 31
16.5.4 Emerging ideas for international technology transfer and cooperation ................... 16-73 32
16.6 Technological change and sustainable development ....................................................... 16-75 33
16.6.1 Linking sustainable development and technological change ................................... 16-75 34
Cross-Chapter Box 12 Transition Dynamics ........................................................................... 16-77 35
16.6.2 Sustainable development and technological innovation: Synergies, trade-offs and 36
governance ............................................................................................................................... 16-81 37
ACCEPTED VERSION
SUBJECT TO FIN
AL EDITS

Final Government Distribution Chapter 16 IPCC AR6 WGIII
Do Not Cite, Quote or Distribute 16-3 Total pages: 141
16.6.3 Actions that maximise synergies and minimise trade-offs between innovation and 1
sustainable development .......................................................................................................... 16-84 2
16.6.4 Climate change, sustainability development and innovation ................................... 16-86 3
16.7 Knowledge gaps ............................................................................................................... 16-87 4
Frequently Asked Questions (FAQs) ........................................................................................... 16-89 5
References .................................................................................................................................... 16-91 6
7
8
ACCEPTED VERSION
SUBJECT TO FIN
AL EDITS

Final Government Distribution Chapter 16 IPCC AR6 WGIII
Do Not Cite, Quote or Distribute 16-4 Total pages: 141
Executive summary 1
Innovation in climate mitigation technologies has seen enormous activity and significant 2
progress in recent years. Innovation has also led to, and exacerbated, trade-offs in 3
relation to sustainable development. (high confidence). Innovation, can leverage action to 4
mitigate climate change by reinforcing other interventions. In conjunction with other enabling 5
conditions innovation can support system transitions to limit warming and help shift 6
development pathways. The currently widespread implementation of solar photovoltaic (solar 7
PV) and LEDs, for instance, could not have happened without technological innovation (high 8
confidence). Technological innovation can also bring about new and improved ways of 9
delivering services that are essential to human well-being. At the same time as delivering 10
benefits, innovation can result in trade-offs that undermine both progress on mitigation and 11
progress towards other sustainable development goals. Trade-offs include negative 12
externalities – for instance greater environmental pollution and social inequalities – rebound 13
effects leading to lower net emission reductions or even increases in emissions, and increased 14
dependency on foreign knowledge and providers (high confidence). Effective governance and 15
policy has the potential to avoid and minimise such misalignments (medium evidence, high 16
agreement). {16.1, 16.2, 16.3, 16.4, 16.5.1, 16.6} 17
A systemic view of innovation to direct and organize the processes has grown over the 18
last decade. This systemic view of innovation takes into account the role of actors, 19
institutions, and their interactions and can inform how innovation systems that vary 20
across technologies, sectors and countries, can be strengthened (high confidence). Where 21
a systemic view of innovation has been taken, it has enabled the development and 22
implementation of indicators that are better able to provide insights in innovation processes. 23
This, in turn, has enabled the analysis and strengthening of innovation systems. Traditional 24
quantitative innovation indicators mainly include R&D investments and patents. Systemic 25
indicators of innovation, however, go well beyond these approaches. They include structural 26
innovation system elements including actors and networks, as well as indicators for how 27
innovation systems function, such as access to finance, employment in relevant sectors, and 28
lobbying activities. For example, in Latin America, monitoring systemic innovation indicators 29
for the effectiveness of agroecological mitigation approaches has provided insights on the 30
appropriateness and social alignment of new technologies and practices. Climate-energy-31
economy models, including integrated assessment models, generally employ a stylised and 32
necessarily incomplete view of innovation, and have yet to incorporate a systemic 33
representation of innovation systems {16.2, 16.2.4, 16.3, 16.3.4, 16.5, Table 16.7, Box 16.1, 34
Box 16.5}. 35
A systemic perspective on technological change can provide insights to policymakers 36
supporting their selection of effective innovation policy instruments (high confidence). A 37
combination of scaled-up innovation investments with demand-pull interventions can achieve 38
faster technology unit cost reductions and more rapid scale-up than either approach in isolation 39
(high confidence). These innovation policy instruments would nonetheless have to be tailored 40
to local development priorities, to the specific context of different countries, and to the 41
technology being supported. The timing of interventions and any trade-offs with sustainable 42
development also need to be addressed. Public R&D funding and support as well as innovation 43
procurement have shown to be valuable for fostering innovation in small to medium cleantech 44
ACCEPTED VERSION
SUBJECT TO FIN
AL EDITS
Final Government Distribution Chapter 16 IPCC AR6 WGIII
Do Not Cite, Quote or Distribute 16-5 Total pages: 141
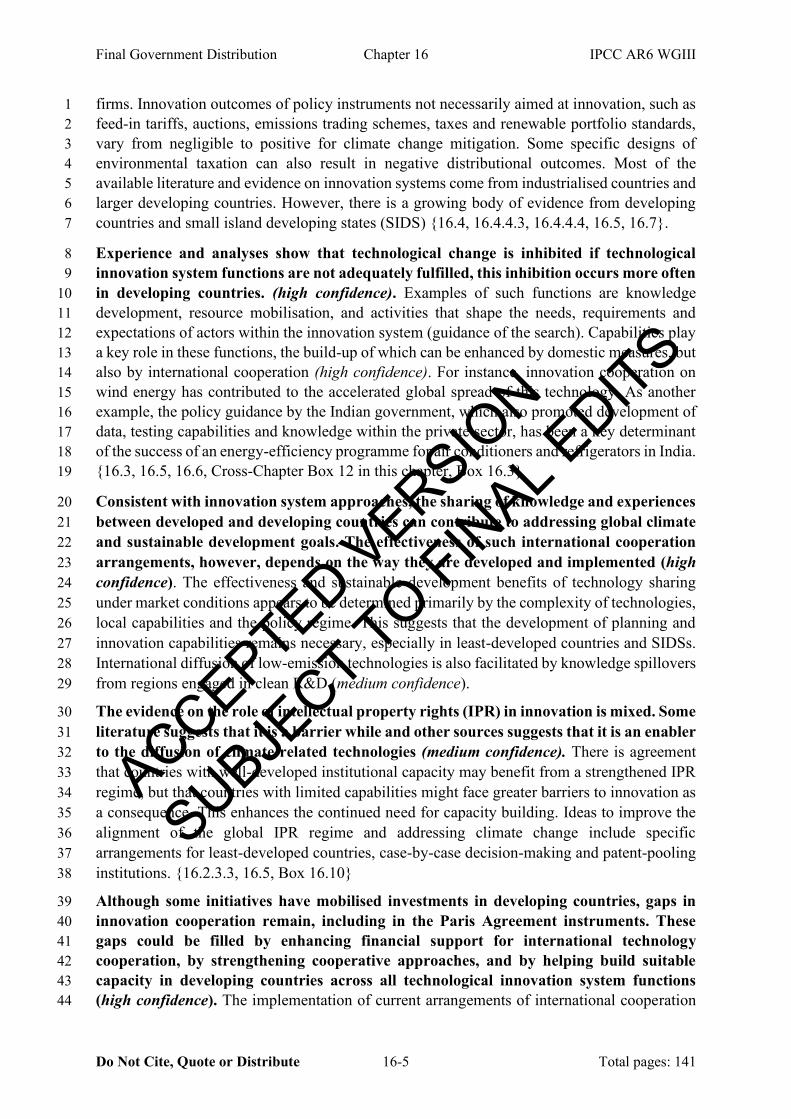
firms. Innovation outcomes of policy instruments not necessarily aimed at innovation, such as 1
feed-in tariffs, auctions, emissions trading schemes, taxes and renewable portfolio standards, 2
vary from negligible to positive for climate change mitigation. Some specific designs of 3
environmental taxation can also result in negative distributional outcomes. Most of the 4
available literature and evidence on innovation systems come from industrialised countries and 5
larger developing countries. However, there is a growing body of evidence from developing 6
countries and small island developing states (SIDS) {16.4, 16.4.4.3, 16.4.4.4, 16.5, 16.7}. 7
Experience and analyses show that technological change is inhibited if technological 8
innovation system functions are not adequately fulfilled, this inhibition occurs more often 9
in developing countries. (high confidence). Examples of such functions are knowledge 10
development, resource mobilisation, and activities that shape the needs, requirements and 11
expectations of actors within the innovation system (guidance of the search). Capabilities play 12
a key role in these functions, the build-up of which can be enhanced by domestic measures, but 13
also by international cooperation (high confidence). For instance, innovation cooperation on 14
wind energy has contributed to the accelerated global spread of this technology. As another 15
example, the policy guidance by the Indian government, which also promoted development of 16
data, testing capabilities and knowledge within the private sector, has been a key determinant 17
of the success of an energy-efficiency programme for air conditioners and refrigerators in India. 18
{16.3, 16.5, 16.6, Cross-Chapter Box 12 in this chapter, Box 16.3} 19
Consistent with innovation system approaches, the sharing of knowledge and experiences 20
between developed and developing countries can contribute to addressing global climate 21
and sustainable development goals. The effectiveness of such international cooperation 22
arrangements, however, depends on the way they are developed and implemented (high 23
confidence). The effectiveness and sustainable development benefits of technology sharing 24
under market conditions appears to be determined primarily by the complexity of technologies, 25
local capabilities and the policy regime. This suggests that the development of planning and 26
innovation capabilities remains necessary, especially in least-developed countries and SIDSs. 27
International diffusion of low-emission technologies is also facilitated by knowledge spillovers 28
from regions engaged in clean R&D (medium confidence). 29
The evidence on the role of intellectual property rights (IPR) in innovation is mixed. Some 30
literature suggests that it is a barrier while and other sources suggests that it is an enabler 31
to the diffusion of climate-related technologies (medium confidence). There is agreement 32
that countries with well-developed institutional capacity may benefit from a strengthened IPR 33
regime, but that countries with limited capabilities might face greater barriers to innovation as 34
a consequence. This enhances the continued need for capacity building. Ideas to improve the 35
alignment of the global IPR regime and addressing climate change include specific 36
arrangements for least-developed countries, case-by-case decision-making and patent-pooling 37
institutions. {16.2.3.3, 16.5, Box 16.10} 38
Although some initiatives have mobilised investments in developing countries, gaps in 39
innovation cooperation remain, including in the Paris Agreement instruments. These 40
gaps could be filled by enhancing financial support for international technology 41
cooperation, by strengthening cooperative approaches, and by helping build suitable 42
capacity in developing countries across all technological innovation system functions 43
(high confidence). The implementation of current arrangements of international cooperation 44
ACCEPTED VERSION
SUBJECT TO FIN
AL EDITS

Final Government Distribution Chapter 16 IPCC AR6 WGIII
Do Not Cite, Quote or Distribute 16-6 Total pages: 141
for technology development and transfer, as well as capacity building, are insufficient to meet 1
climate objectives and contribute to sustainable development. For example, despite building a 2
large market for mitigation technologies in developing countries, the lack of a systemic 3
perspective in the implementation of the Clean Development Mechanism, operational since the 4
mid-2000s, has only led to some technology transfer, especially to larger developing countries, 5
but limited capacity building and minimal technology development (medium confidence). In 6
the current climate regime, a more systemic approach to innovation cooperation could be 7
introduced by linking technology institutions, such as the Technology Mechanism, and 8
financial actors, such as the financial mechanism. {16.5.3} 9
Countries are exposed to sustainable development challenges in parallel with the 10
challenges that relate to climate change. Addressing both sets of challenges 11
simultaneously presents multiple and recurrent obstacles that systemic approaches to 12
technological change could help resolve, provided they are well managed (high 13
confidence). Obstacles include both entrenched power relations dominated by vested interests 14
that control and benefit from existing technologies, and governance structures that continue to 15
reproduce unsustainable patterns of production and consumption (medium confidence). Studies 16
also highlight the potential of cultural factors to strongly influence the pace and direction of 17
technological change. Sustainable solutions require adoption and mainstreaming of locally 18
novel technologies that can meet local needs, and simultaneously address the Sustainable 19
Development Goals (SDGs). Acknowledging the systemic nature of technological innovation, 20
which involve many levels of actors, stages of innovation and scales, can lead to new 21
opportunities to shift development pathways towards sustainability. {16.4, 16.5, 16.6} 22
An area where sustainable development, climate change mitigation and technological 23
change interact is digitalisation. Digital technologies can promote large increases in 24
energy efficiency through coordination and an economic shift to services, but they can 25
also greatly increase energy demand because of the energy used in digital devices. System-26
level rebound effects may also occur. (high confidence) Digital devices, including servers, 27
increase pressure on the environment due to the demand for rare metals and end-of-life 28
disposal. The absence of adequate governance in many countries can lead to harsh working 29
conditions and unregulated disposal of electronic waste. Digitalization also affects firms' 30
competitiveness, the demand for skills, and the distribution of, and access to, resources. The 31
existing digital divide, especially in developing countries, and the lack of appropriate 32
governance of the digital revolution can hamper the role that digitalization could play in 33
supporting the achievement of stringent mitigation targets. At present, the understanding of 34
both the direct and indirect impacts of digitalization on energy use, carbon emissions and 35
potential mitigation, is limited (medium confidence). {Cross-Chapter Box 11 in this chapter, 36
16.2} 37
Strategies for climate change mitigation can be most effective in accelerating 38
transformative change when actions taken to strengthen one set of enabling conditions 39
also reinforce and strengthen the effectiveness of other enabling conditions (medium 40
confidence). Applying transition or system dynamics to decisions can help policymakers take 41
advantage of such high-leverage intervention points, address the specific characteristics of 42
technological stages, and respond to societal dynamics. Inspiration can be drawn from the 43
global unit cost reductions of solar PV, which were accelerated by a combination of factors 44
ACCEPTED VERSION
SUBJECT TO FIN
AL EDITS
Final Government Distribution Chapter 16 IPCC AR6 WGIII
Do Not Cite, Quote or Distribute 16-7 Total pages: 141
interacting in a mutually reinforcing way across a limited group of countries (high confidence). 1
{Box 16.2, Cross-Chapter Box 10 in chapter 14} 2
Better and more comprehensive data on innovation indicators can provide timely insights 3
for policymakers and policy design locally, nationally and internationally, especially for 4
developing countries, where such insights are missing more often. Data needed include on 5
those that can show the strength of technological, sectoral and national innovation systems. It 6
is also necessary to validate current results and generate insights from theoretical frameworks 7
and empirical studies for developing countries contexts. Innovation studies on adaptation and 8
mitigation other than energy and ex-post assessments of the effectiveness of various 9
innovation-related policies and interventions, including R&D, would also provide benefits. 10
Furthermore, methodological developments to improve the ability of Integrated Assessment 11
Models (IAMs) to capture energy innovation system dynamics, and the relevant institutions and 12
policies (including design and implementation), would allow for more realistic assessment. 13
{16.2, 16.3, 16.7} 14
15
ACCEPTED VERSION
SUBJECT TO FIN
AL EDITS

Final Government Distribution Chapter 16 IPCC AR6 WGIII
Do Not Cite, Quote or Distribute 16-8 Total pages: 141
16.1 Introduction 1
Technological change and innovation are considered key drivers of economic growth and social 2
progress (Brandão Santana et al. 2015; Heeks and Stanforth 2015). The economic benefit derived from 3
increased production and consumption of goods as well as services create higher demands for improved 4
technologies (Gossart 2015). Since the Industrial Revolution, however, and notwithstanding the 5
benefits, this production and consumption trend and the technological changes associated to it have also 6
come at the cost of long-term damage to the life support systems of our planet (Alarcón and Vos 2015; 7
Steffen et al. 2015). The significance of the such impacts depends on the technology, but also on the 8
intrinsic characteristics of the country or region analysed (Brandão Santana et al. 2015). 9
Other chapters in this volume have discussed technological change in various ways, including as a 10
framing issue (chapter 1), in the context of specific sectors (chapters 6-11), for specific purposes 11
(chapter 12) and as a matter of policy, international cooperation and finance (chapters 13-15). Chapter 12
2 discusses past trends in technological change and chapters 3 and 4 discuss it in the context of future 13
modelling. In general, implicitly or explicitly, technological change is assigned an important role in 14
climate change mitigation and achieving sustainable development (Thacker et al. 2019), also in past 15
IPCC reports (IPCC 2014, 2018a). Chapter 16 describes how a well-established innovation system at a 16
national level, guided by well-designed policies, can contribute to achieve mitigation and adaptation 17
targets along with broader sustainable development goals avoiding, in the process, undesired 18
consequences of technological changes. 19
The environmental impacts of social and economic activities, including emissions of GHG, are greatly 20
influenced by the rate and direction of technological changes (Jaffe et al. 2000). Technological changes 21
usually designed and used to increase productivity and reduce the use of natural resources can lead to 22
increasing production and consumption of goods and services through different rebound effects that 23
diminish the potential benefits of reducing the pressure on the environment (Grübler 1998; Kemp and 24
Soete 1990; Gossart 2015; Sorrell 2007; Barker et al. 2009). 25
Those environmental impacts depend not only on which technologies are used, but also on how they 26
are used (Grübler et al. 1999a). Technological change is not exogenous to social and economic systems; 27
technologies are not conceived, selected, and applied autonomously (Grubler et al. 2018). Underlying 28
driving forces of the problem, such as more resource intensive lifestyles and larger populations 29
(Hertwich and Peters 2009; UNEP 2014), remain largely unchallenged. Comprehensive knowledge of 30
the direct and indirect effects of technological changes on physical and social systems could improve 31
decision-making, also in those cases where technological change mitigates environmental impacts. 32
A sustainable global future for people and nature requires rapid and transformative societal change by 33
integrating technical, governance (including participation), financial and societal aspects of the 34
solutions to be implemented (Pörtner et al. 2021; Sachs et al. 2019). A growing body of interdisciplinary 35
research from around the world can inform implementation of adaptive solutions that address the 36
benefits and drawbacks of linkages in social-ecological complexity, including externalities and rebound 37
effects from innovation and technological transformation (Pörtner et al. 2021; Balvanera et al. 2017). 38
Technological change and transitional knowledge can reinforce each other. The value of traditional 39
wisdom and its technological practices provide examples of sustainable and adaptive systems that could 40
potentially adapt to and mitigate climate change (Singh et al. 2020; Kuoljok 2019). Peasants and 41
traditional farmers have been able to respond well to climate changes through their wisdom and 42
traditional practices (Nicholls and Alteri 2013). The integration of the traditional wisdom with new 43
technologies can offer new and effective solutions (Galloway McLean 2010). 44
ACCEPTED VERSION
SUBJECT TO FIN
AL EDITS
Final Government Distribution Chapter 16 IPCC AR6 WGIII
Do Not Cite, Quote or Distribute 16-9 Total pages: 141
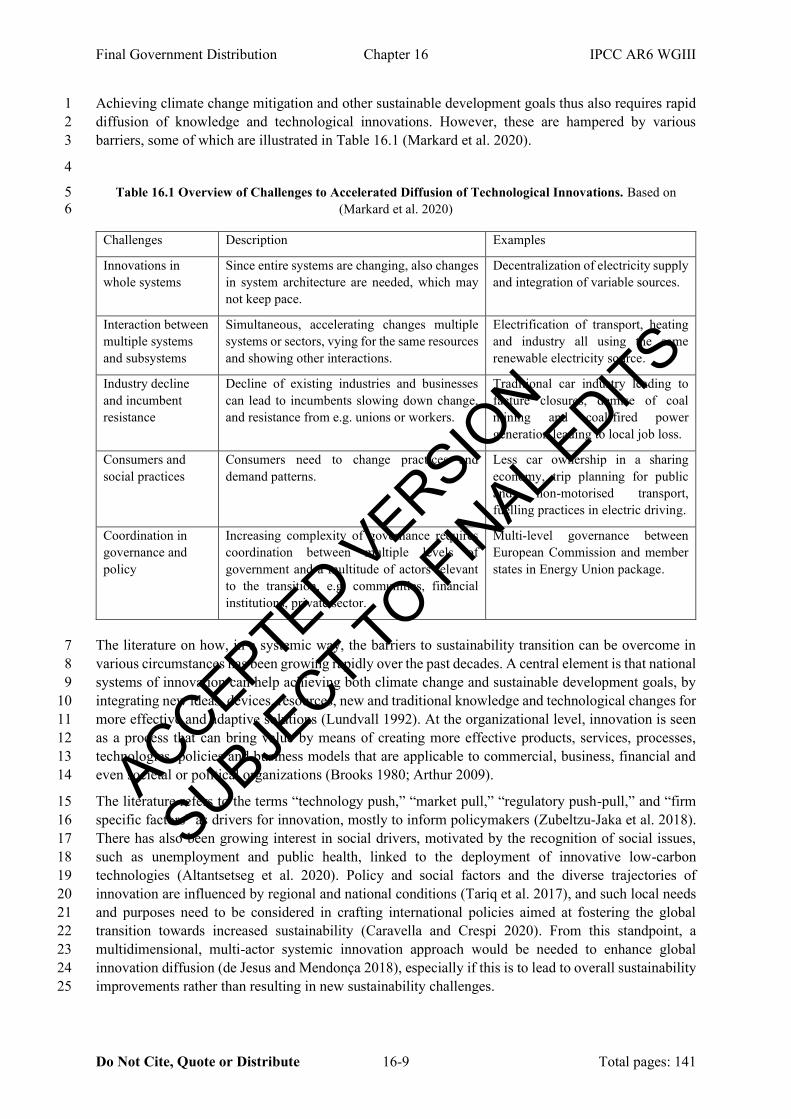
Achieving climate change mitigation and other sustainable development goals thus also requires rapid 1
diffusion of knowledge and technological innovations. However, these are hampered by various 2
barriers, some of which are illustrated in Table 16.1 (Markard et al. 2020). 3
4
Table 16.1 Overview of Challenges to Accelerated Diffusion of Technological Innovations. Based on 5
(Markard et al. 2020) 6
Challenges Description Examples
Innovations in
whole systems
Since entire systems are changing, also changes
in system architecture are needed, which may
not keep pace.
Decentralization of electricity supply
and integration of variable sources.
Interaction between
multiple systems
and subsystems
Simultaneous, accelerating changes multiple
systems or sectors, vying for the same resources
and showing other interactions.
Electrification of transport, heating
and industry all using the same
renewable electricity source.
Industry decline
and incumbent
resistance
Decline of existing industries and businesses
can lead to incumbents slowing down change,
and resistance from e.g. unions or workers.
Traditional car industry leading to
facture closures, demise of coal
mining and coal-fired power
generation leading to local job loss.
Consumers and
social practices
Consumers need to change practices and
demand patterns.
Less car ownership in a sharing
economy, trip planning for public
and non-motorised transport,
fuelling practices in electric driving.
Coordination in
governance and
policy
Increasing complexity of governance requires
coordination between multiple levels of
government and a multitude of actors relevant
to the transition, e.g. communities, financial
institutions, private sector.
Multi-level governance between
European Commission and member
states in Energy Union package.
The literature on how, in a systemic way, the barriers to sustainability transition can be overcome in 7
various circumstances has been growing rapidly over the past decades. A central element is that national 8
systems of innovation can help achieving both climate change and sustainable development goals, by 9
integrating new ideas, devices, resources, new and traditional knowledge and technological changes for 10
more effective and adaptive solutions (Lundvall 1992). At the organizational level, innovation is seen 11
as a process that can bring value by means of creating more effective products, services, processes, 12
technologies, policies and business models that are applicable to commercial, business, financial and 13
even societal or political organizations (Brooks 1980; Arthur 2009). 14
The literature refers to the terms “technology push,” “market pull,” “regulatory push-pull,” and “firm 15
specific factors” as drivers for innovation, mostly to inform policymakers (Zubeltzu-Jaka et al. 2018). 16
There has also been growing interest in social drivers, motivated by the recognition of social issues, 17
such as unemployment and public health, linked to the deployment of innovative low-carbon 18
technologies (Altantsetseg et al. 2020). Policy and social factors and the diverse trajectories of 19
innovation are influenced by regional and national conditions (Tariq et al. 2017), and such local needs 20
and purposes need to be considered in crafting international policies aimed at fostering the global 21
transition towards increased sustainability (Caravella and Crespi 2020). From this standpoint, a 22
multidimensional, multi-actor systemic innovation approach would be needed to enhance global 23
innovation diffusion (de Jesus and Mendonça 2018), especially if this is to lead to overall sustainability 24
improvements rather than resulting in new sustainability challenges. 25
ACCEPTED VERSION
SUBJECT TO FIN
AL EDITS

Final Government Distribution Chapter 16 IPCC AR6 WGIII
Do Not Cite, Quote or Distribute 16-10 Total pages: 141
Policies to mitigate climate change do not always take into account the effects of mitigation 1
technologies on other environmental and social challenges (Arvesen et al. 2011). Policies also often 2
disregard the strong linkages between technological innovation and social innovation; the latter 3
understood as the use of soft technologies that brings about transformation through establishing new 4
institutions, new practices, and new models to create a positive societal impact characterized by 5
collaboration that crosses traditional roles and boundaries, between citizens, civil society, the state, and 6
the private sector (Reynolds et al. 2017). Market forces do not provide sufficient incentives for 7
investment in development or diffusion of technologies, leaving a role for public policy to create the 8
conditions to assure a systemic innovation approach (Popp 2010; Popp and Newell 2012). Moreover, 9
public action is more than just addressing market failure, it is an unalienable element of an innovation 10
system (Mazzucato 2013). 11
Coupling technological innovation with sustainable development and the SDGs would need to address 12
overall social, environmental, and economic consequences, given that public policy is intertwined with 13
innovation, technological changes and other factors in a complex manner. Chapter 16 is organized in 14
the following manner to provide an overview of innovation and technology development and transfer 15
for climate change and sustainable development. 16
Section 16.2 discusses drivers of innovation process, including macro factors that can redirect 17
technological change towards low-carbon options. Representations of these drivers in mathematical and 18
statistical models allow for explaining the past and constructing projections of future technological 19
change. They also integrate the analysis of drivers and consequences of technological change within 20
economic-energy-economy (or integrated assessment) models (see Chapter 3). The section also 21
describes the different phases of innovation and metrics, such as the widely used but also criticized 22
technology readiness levels (TRLs). 23
Section 16.3 discusses innovation as a systemic process based on recent literature. While the innovation 24
process is often stylized as a linear process, innovation is now predominantly seen as a systemic process 25
in that it is a result of actions by, and interactions among, a large set of actors, whose activities are 26
shaped by, and shape, the context in which they operate and the user group with which they are 27
engaging. 28
Section 16.4 presents innovation and technology policy, including technology push (e.g., publicly 29
funded R&D) and demand-pull (e.g., governmental procurement programmes) instruments that 30
addresses potential market failures related to innovation and technology diffusion. The section also 31
assesses the cost-effectiveness and other policy assessment criteria introduced in Chapter 13 of 32
innovation policies. 33
In section 16.5, the chapter assesses the role of international cooperation in technology development 34
and transfer, in particular the mechanisms established under the UNFCCC, but also other international 35
initiatives for technology cooperation. The discussion on international cooperation includes information 36
exchange, research, development and demonstration cooperation, access to financial instruments, 37
intellectual property rights, as well as promotion of domestic capacities and capacity building. 38
Section 16.6 describes the role of technology in sustainable development, including unintended effects 39
of technological changes, and synthesizes the chapter. Finally, section 16.7 discusses gaps in knowledge 40
emerging from this chapter. 41
42
43
ACCEPTED VERSION
SUBJECT TO FIN
AL EDITS

Final Government Distribution Chapter 16 IPCC AR6 WGIII
Do Not Cite, Quote or Distribute 16-11 Total pages: 141
16.2 Elements, drivers and modelling of technology innovation 1
Models of the innovation process, its drivers and incentives provide a tool for technology assessment, 2
constructing projections of technological change and identifying which macro conditions facilitate 3
development of low-carbon technologies. The distinction between stages of innovation process allows 4
to assess technology readiness (Section 16.2.1). Qualitative and quantitative analysis of main elements 5
underpinning innovation - R&D, learning-by-doing, spillovers allow for explanation of past and project 6
future technological change (Section 16.2.2). In addition, general purpose technologies can play a role 7
in climate change mitigation. 8
In the context of mitigation pathways, the feasibility of any emission reduction targets depends on the 9
ability to promote innovation in low- and zero-carbon technologies, as opposed to any other technology. 10
For this reason, the section reviews the literature of the levers influencing the direction of technological 11
change in favour of low- and zero-carbon technologies (Section 16.2.3). Moreover, representation of 12
drivers in mathematical and statistical models from section 16.2.2 allows integrating its analysis with 13
economic and climate effects within IAMs, hence permitting more precise modelling of decarbonisation 14
pathways (Section 16.2.4). 15
In addition to technological innovation, other innovation approaches are relevant in the context of 16
climate mitigation and more broadly sustainable development (Section 16.6). Frugal innovations, i.e. 17
“good enough” innovations that fulfil the needs of non-affluent consumers mostly in developing 18
countries (Hossain 2018), are characterized by low costs, concentration on core functionalities, and 19
optimised performance level (Weyrauch and Herstatt 2016) and are hence often associated with 20
(ecological and social) sustainability (Albert 2019). Grassroots innovations are products, services and 21
processes developed to address specific local challenges and opportunities, and which can generate 22
novel, bottom-up solutions responding to local situations, interests and values. (Dana et al. 2021; 23
Pellicer-Sifres et al. 2018). 24
25
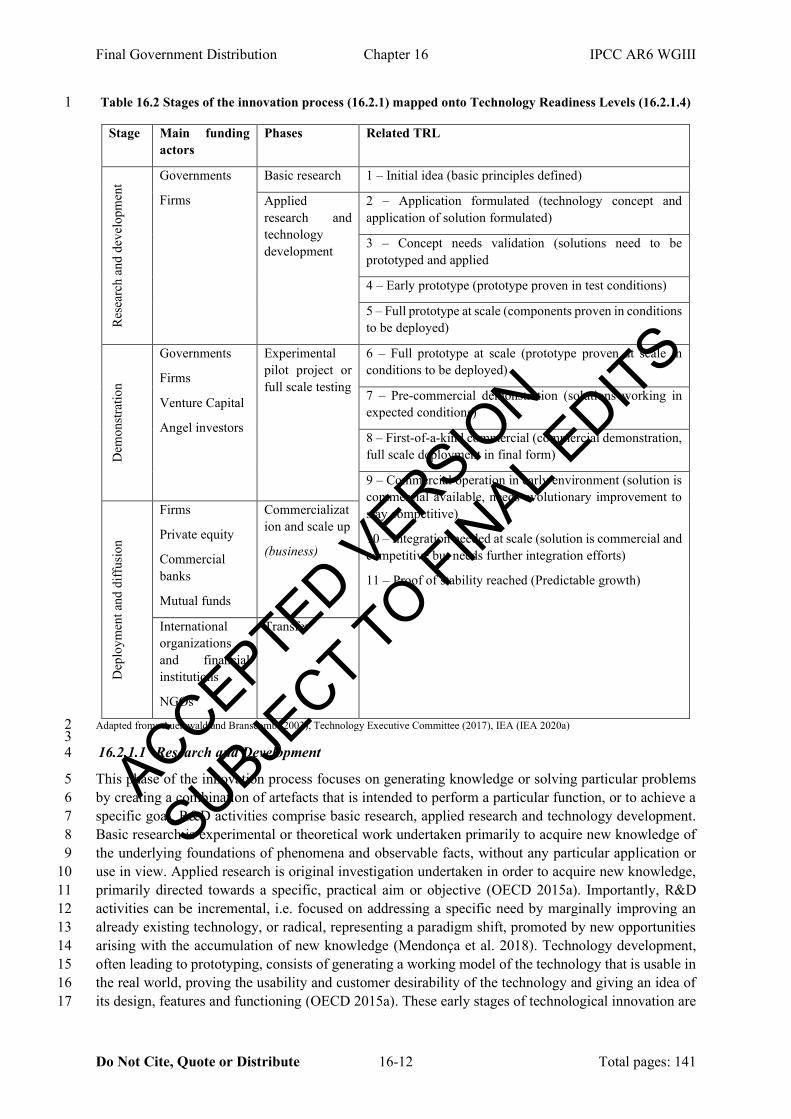
16.2.1 Stages of the innovation process 26
The innovation cycle is commonly thought of as having three distinct innovation phases on the path 27
between basic research and commercial application: Research and Development (R&D), demonstration, 28
and deployment and diffusion (IPCC 2007). Each of these phases differs with respect to the kind of 29
activity carried out, the type of actors involved and their role, financing needs and the associated risks 30
and uncertainties. All phases involve a process of trial and error, and failure is common; the share of 31
innovation that successfully reaches the deployment phase is small. The path occurring between basic 32
research to commercialization is not linear (see also Section 16.3); it often requires a long time and is 33
characterized by significant bottlenecks and roadblocks. Furthermore, technologies may regress 34
backwards in the innovation cycle, rather than move forward (Skea et al. 2019). Successfully passing 35
from each stage to the next one in the innovation cycle requires overcoming “valleys of deaths” 36
(Auerswald and Branscomb 2003; UNFCCC 2017), most notably the demonstration phase (Frank et al. 37
1996; Weyant 2011; Nemet et al. 2018). Over time, new and improved technologies are discovered; 38
this often makes the dominant technology obsolete, but this is not discussed here further. 39
Table 16.2 summarizes the different innovation stages and main funding actors, and maps phases into 40
the technology readiness levels (TRLs) discussed in Section 16.2.1.4. 41
42
ACCEPTED VERSION
SUBJECT TO FIN
AL EDITS
Final Government Distribution Chapter 16 IPCC AR6 WGIII
Do Not Cite, Quote or Distribute 16-12 Total pages: 141
Table 16.2 Stages of the innovation process (16.2.1) mapped onto Technology Readiness Levels (16.2.1.4) 1
Stage Main funding
actors
Phases Related TRL
Res
earc
h a
nd
dev
elop
men
t
Governments
Firms
Basic research 1 – Initial idea (basic principles defined)
Applied
research and
technology
development
2 – Application formulated (technology concept and
application of solution formulated)
3 – Concept needs validation (solutions need to be
prototyped and applied
4 – Early prototype (prototype proven in test conditions)
5 – Full prototype at scale (components proven in conditions
to be deployed)
Dem
on
stra
tio
n
Governments
Firms
Venture Capital
Angel investors
Experimental
pilot project or
full scale testing
6 – Full prototype at scale (prototype proven at scale in
conditions to be deployed)
7 – Pre-commercial demonstration (solutions working in
expected conditions)
8 – First-of-a-kind commercial (commercial demonstration,
full scale deployment in final form)
9 – Commercial operation in early environment (solution is
commercial available, needs evolutionary improvement to
stay competitive)
10 – Integration needed at scale (solution is commercial and
competitive but needs further integration efforts)
11 – Proof of stability reached (Predictable growth)
Dep
loy
men
t an
d d
iffu
sio
n
Firms
Private equity
Commercial
banks
Mutual funds
Commercializat
ion and scale up
(business)
International
organizations
and financial
institutions
NGOs
Transfer
Adapted from: Auerswald and Branscomb (2003), Technology Executive Committee (2017), IEA (IEA 2020a) 2 3 16.2.1.1 Research and Development 4
This phase of the innovation process focuses on generating knowledge or solving particular problems 5
by creating a combination of artefacts that is intended to perform a particular function, or to achieve a 6
specific goal. R&D activities comprise basic research, applied research and technology development. 7
Basic research is experimental or theoretical work undertaken primarily to acquire new knowledge of 8
the underlying foundations of phenomena and observable facts, without any particular application or 9
use in view. Applied research is original investigation undertaken in order to acquire new knowledge, 10
primarily directed towards a specific, practical aim or objective (OECD 2015a). Importantly, R&D 11
activities can be incremental, i.e. focused on addressing a specific need by marginally improving an 12
already existing technology, or radical, representing a paradigm shift, promoted by new opportunities 13
arising with the accumulation of new knowledge (Mendonça et al. 2018). Technology development, 14
often leading to prototyping, consists of generating a working model of the technology that is usable in 15
the real world, proving the usability and customer desirability of the technology and giving an idea of 16
its design, features and functioning (OECD 2015a). These early stages of technological innovation are 17
ACCEPTED VERSION
SUBJECT TO FIN
AL EDITS

Final Government Distribution Chapter 16 IPCC AR6 WGIII
Do Not Cite, Quote or Distribute 16-13 Total pages: 141
referred to as “formative phase”, during which the conditions are shaped for a technology to emerge 1
and become established in the market (Wilson and Grubler 2013) and the constitutive elements of the 2
innovation system emerging around a particular technology are set up (see Section 16.3)(Bento et al. 3
2018; Bento and Wilson 2016). 4
The outcomes of R&D are uncertain: the amount of knowledge that will result from any given research 5
project or investment is unknown ex ante (Rosenberg 1998). This risk to funders (Goldstein and 6
Kearney 2020) translates into underinvestment in R&D due to low appropriability (Sagar and Majumdar 7
2014; Weyant 2011). In the case of climate mitigation technologies, low innovation incentives for the 8
private sector also result from a negative environmental externality (Jaffe et al. 2005). Furthermore, in 9
absence of stringent climate policies and targets, incumbent fossil-based energy technologies are 10
characterized by lower financing risk, are heavily subsidized (Kotchen 2021; Davis 2014) and 11
depreciate slowly (see Section 16.2.3) (Nanda et al. 2016; Semieniuk et al. 2021; Arrow 1962a). In this 12
context public research funding therefore plays a key role in supporting high-risk R&D both in 13
developed and developing economies: it can provide patient and steady funding not tied to short-term 14
investment returns (see Section 16.4) (Anadon et al. 2014; Mazzucato 2015a; Howell 2017; Zhang et 15
al. 2019; Anadón et al. 2017; Chan and Diaz Anadon 2016; Kammen and Nemet 2007). Public policies 16
also play a role increasing private incentives in energy research and development funding (Nemet 2013). 17
R&D statistics are an important indicator of innovation and are collected following the rules of the 18
Frascati Manual (OECD 2015b) (Section 16.3.3, Box 16.3, Table 16.7). 19
16.2.1.2 Demonstration 20
Demonstration is carried out through pilot projects or large-scale testing in the real world. Successfully 21
demonstrating a technology shows its utility and that it is able to achieve its intended purpose and, 22
consequently, that the risk of failure is reduced (i.e. that it has market potential) (Hellsmark et al. 2016). 23
Demonstration project are an important step to promote the deployment of low-carbon energy and 24
industrial technologies in the context of the transition. government funding often plays a large role in 25
energy technology demonstration projects because scaling up hardware energy technologies is 26
expensive and risky (Brown and Hendry 2009; Hellsmark et al. 2016). Governments’ engagement in 27
low-carbon technology demonstration also signals support for business willing to take the investment 28
risk (Mazzucato 2016). Venture capital, traditionally not tailored for energy investment, can play an 29
increasingly important role also thanks to the incentives (e.g. through de-risking) provided by public 30
funding and policies (Gaddy et al. 2017; IEA 2017a). 31
16.2.1.3 Deployment and diffusion 32
Deployment entails producing a technology at large scale and scaling up its adoption use across 33
individual firms or households in a given market, and across different markets (Jaffe 2015). In the 34
context of climate change mitigation and adaptation technologies, the purposeful diffusion to 35
developing countries, is referred to as “technology transfer”. Most recently, the term " innovation 36
cooperation" has been proposed to indicate that technologies needs to be co-developed and adapted to 37
local contexts (Pandey et al. 2021). Innovation cooperation is an important component of stringent 38
mitigation strategies as well as international agreements (see Section 16.5). 39
Diffusion is often sluggish due to lock-in of dominant technologies (Liebowitz and Margolis 1995; 40
Unruh 2000; Ivanova et al. 2018), as well as the time needed to diffuse information about the 41
technologies, heterogeneity among adopters, the incentive to wait until costs fall even further, the 42
presence of behavioural and institutional barriers and the uncertainty surrounding mitigation policies 43
and long-term commitments to climate targets (Corey 2014; Haelg et al. 2018; Gillingham and Sweeney 44
2012; Jaffe 2015). In addition, novel technology has been hindered by the actions of powerful 45
incumbents who accrue economic and political advantages over time, as in the case of renewable 46
energy generation (Unruh 2002; Supran and Oreskes 2017; Hoppmann et al. 2019). 47
ACCEPTED VERSION
SUBJECT TO FIN
AL EDITS
Final Government Distribution Chapter 16 IPCC AR6 WGIII
Do Not Cite, Quote or Distribute 16-14 Total pages: 141
Technologies have been shown to penetrate the market with a gradual non-linear process in a 1
characteristic logistic (S-shaped) curve (Rogers 2003; Grübler 1996). The time needed to reach 2
widespread adoption varies greatly across technologies relevant for adaptation and mitigation (Gross et 3
al. 2018); in the case of energy technologies, the time needed for technologies to get from a 10 to 90% 4
market share of saturation ranges between 5 to over 70 (Wilson 2012). Investment in commercialization 5
of low-emission technology is largely provided by private financiers; however, governments play a key 6
role in ensuring incentives through supportive policies, including R&D expenditures providing signals 7
to private investors (Haelg et al. 2018), pricing carbon dioxide emissions, public procurement, 8
technology standards, information diffusion and the regulation for end-life cycle treatment of products 9
(Cross and Murray 2018) (see Section 16.4). 10
16.2.1.4 Technology Readiness Levels 11
Technology Readiness Levels (TRLs) are a categorization that enables consistent, uniform discussions 12
of technical maturity across different types of technology. They were developed by NASA in the 1970s 13
(Mankins 2009, 1995) and originally used to describe the readiness of components forming part of a 14
technological system. Over time, more classifications of TRLs have been introduced, notably the one 15
used by the EU. Most recently, the IEA extended previous classifications to include the later stages of 16
the innovation process (IEA 2020b) and applied it to compare the market readiness of clean energy 17
technologies and their components (OECD 2015a; IEA 2020b). TRLs are currently widely used by 18
engineers, business people, research funders and investors, often to assess the readiness of whole 19
technologies rather than single components. To determine a TRL for a given technology, a Technology 20
Readiness Assessment (TRA) is carried out to examine programme concepts, technology requirements, 21
and demonstrated technology capabilities. In the most recent version of the IEA (IEA 2020b), TRLs 22
range from 1 to 11, with 11 indicating the most mature (see Table 16.2). 23
The purpose of TRLs is to support decision making. They are applied to avoid the premature application 24
of technologies, which would lead to increased costs and project schedule extension (US Department 25
of Energy 2011). They are used for risk management, and can also be used to make decisions regarding 26
technology funding and to support the management of the R&D process within a given organization or 27
country (De Rose et al. 2017). 28
In practice, the usefulness of TRLs is limited by several factors. These include limited applicability in 29
complex technologies or systems, the fact that they do not define obsolescence, nor account for 30
manufacturability, commercialization or the readiness of organizations to implement innovations 31
(European Association of Research Technology Organisations 2014) and do not consider any type of 32
technology-system mismatch or the relevance of the products’ operation environment to the system 33
under consideration (Mankins 2009). Many of these limitations can be eased by using TRLs in 34
combination with other indicators such as System Readiness Levels and other economic indicators on, 35
for example, investments and returns (IEA 2020b). 36
37
16.2.2 Sources of technological change 38
The speed of technological change could be explained with the key drivers of innovations process: R&D 39
effort, learning-by-doing and spillover effects. In addition, new innovations are sometimes enabled by 40
the development of general purpose technologies, such as digitalization. 41
16.2.2.1 Learning-by-doing and research and development 42
Learning by doing and R&D effort are two factors commonly used by the literature to explain past and 43
project future speed of technological change (Klaassen et al. 2005; Mayer et al. 2012; Bettencourt et al. 44
2013). Learning-by-doing is the interaction of workers with new machines or processes that allows 45
them to use them more efficiently (Arrow 1962b). R&D effort is dedicated to looking for new solutions 46
ACCEPTED VERSION
SUBJECT TO FIN
AL EDITS

Final Government Distribution Chapter 16 IPCC AR6 WGIII
Do Not Cite, Quote or Distribute 16-15 Total pages: 141
(e.g. blueprints) that could increase the efficiency of existing production methods or result in entirely 1
new methods, products or services (see section 16.2.1.1). 2
Learning-by-doing and research and development are interdependent. Young (1993) postulates that 3
learning-by-doing cannot continue forever without R&D because it is bounded by an upper physical 4
productivity limit of an existing technology. Research and development can shift this limit because it 5
allows replacing the existing technology with a new one. On other hand, incentives to invest in R&D 6
depend on future cost of manufacturing, which in turn depend on the scale of learning-by-doing. The 7
empirical evidence for virtuous circle between costs reduction, market growth and R&D were found in 8
the case of PV market ((Watanabe et al. 2000); see also Box 16.4), but could also lead to path 9
dependency and lock-in (Erickson et al. 2015). Section 16.4.4 and Chapter 13 Section 13.7.3.1. discuss 10
how simultaneous use of technology push and pull policies could amplify effects of research and 11
learning. 12
The benefits of R&D and learning-by-doing are larger at the economy level than at the firms level 13
(Romer 1990; Arrow 1962b). As a result, the market, left to its own, tends to generate less investment 14
than socially optimal. For instance, if the cost of a technology is too high before a large amount of 15
learning-by-doing has occurred, there is a risk that it will not be adopted by the market even if it is 16
economically advantageous for the society. Indeed, initially new technologies are often expensive and 17
cannot compete with the incumbent technologies (Cowan 1990). Large numbers of adopters could lower 18
this cost via learning-by-doing to a level sufficient to beat the incumbent technology (Gruebler et al. 19
2012). However, firms could hesitate to be the first adopter and bear the high cost (Isoard and Soria 20
2001). If this disadvantage overwhelms the advantages of being a first mover1 and if adopters are not 21
able to coordinate, it will lead to situation of a lock-in (Gruebler et al. 2012). 22
The failure of markets to deliver the size of R&D investment and learning-by-doing that would be 23
socially optimal is one of the justifications of government intervention. Policies to address these market 24
failures can be categorized as technology push and demand pull policies. The role of these policies is 25
explained in Table 16.3. Section 16.4 discusses individual policy instruments in greater detail. 26
27
Table 16.3 Categories of policies and interventions accelerating technological changes, the factors 28
promoting them and slowing them down, illustrated with examples 29
What it refers to: What promotes
technological
change
What slows down
technological
change
Examples
Technology
Push
Support the
creation of new
knowledge to
make it easier to
invest in
innovation
R&D, funding and
performance of
early
demonstrations
(Brown and Hendry
2009; Hellsmark et
al. 2016)
Inadequate supply
of trained
scientists and
engineers (Popp
and Newell 2012);
gap with demand
pull (Grübler et al.
1999b).
Japan’s Project Sunshine, the
US Project Independence in
the 1970s. Breakthrough
Energy Coalition and Mission
Innovation, respectively
private- and public-sector
international collaborations to
respectively focus energy
innovation and double energy
R&D, both initiated
concurrently with the Paris
Agreement in 2015 (Sanchez
and Sivaram 2017).
FOOTNOTE1 see e.g. (Spence 1981) and (Bhattacharya 1984) for discussion of first-mover advantages
ACCEPTED VERSION
SUBJECT TO FIN
AL EDITS

Final Government Distribution Chapter 16 IPCC AR6 WGIII
Do Not Cite, Quote or Distribute 16-16 Total pages: 141
Demand
Pull
Instruments
creating market
opportunities.
Enlarging potential
markets, increasing
adoption of new
fuels and mitigation
technology.
Digital innovations
Social innovation
and awareness
Willingness of
consumers to
accept new
technology. Policy
and political
volatility can deter
investment.
Subsidies for wind power
California, the German feed-in
tariff for PV, quotas for electric
vehicles in China (Wang et al.
2017a) and Norway
(Pereirinha et al. 2018)
Biofuels (Brazil); Social
innovation with Wind Energy
(Denmark, Germany)
The size of learning-by-doing effect is quantified in literature using learning rates i.e. estimates of 1
negative correlation between costs and size of deployment of technologies. The results from this 2
literature include estimates for energy technologies (McDonald and Schrattenholzer 2001), electricity 3
generation technologies (Rubin et al. 2015; Samadi 2018), for storage (Schmidt 2017), for end-of-pipe 4
control (Kang et al. 2020) and for energy demand and energy supply technologies (Weiss et al. 2010). 5
Meta-analyses find learning rates vary across technologies, within technologies and over time (Wei et 6
al. 2017; Nemet 2009a; Rubin et al. 2015). Moreover, different components of one technology have 7
different learning rates (Elshurafa et al. 2018). Central tendencies are around 20% cost reduction for 8
each doubling of deployment (McDonald and Schrattenholzer 2001). 9
Studies of correlation between cumulative deployment of technologies and costs are not sufficiently 10
precise to disentangle the causal effect of increase in deployment from the causal effects of research 11
and development and other factors (Nemet 2006). Numerous subsequent studies attempted to, amongst 12
others, separate the effect of learning-by-doing and research and development (Klaassen et al. 2005; 13
Mayer et al. 2012; Bettencourt et al. 2013), economies of scale (Arce 2014), and knowledge spillovers 14
(Nemet 2012). Once those other factors are accounted for, some empirical studies find that the role of 15
learning-by-doing in driving down the costs becomes minor (Kavlak et al. 2018; Nemet 2006). In 16
addition the relation could reflect reverse causality: increase in deployment could be an effect (and not 17
a cause) of a drop in price (Witajewski-Baltvilks et al. 2015; Nordhaus 2014). Nevertheless, in some 18
applications, learning curves can be a useful proxy and heuristic (Nagy et al. 2013). 19
The negative relation between costs and experience is a reason to invest in a narrow set of technologies; 20
the uncertainty regarding the parameters of this relation is the reason to invest in wider ranges of 21
technologies (Way et al. 2019; Fleming and Sorenson 2001). Concentrating investment in narrow sets 22
of technologies (specialization) enables fast accumulation of experience for these technologies and large 23
cost reductions. However, when the potency of technology is uncertain, one does not know which 24
technology is truly optimal in the long-run. The narrower the set the higher the risk that the optimal 25
technology will not be supported, and hence will not benefit from learning-by-doing. Widening the set 26
of supported technologies would reduce this risk (Way et al. 2019). Uncertainty is present because noise 27
in historical data hides the true value of learning rates as well as because of unanticipated future shocks 28
to technology costs (Lafond et al. 2018). Ignoring uncertainty in integrated assessment models implies 29
that these model results are biased towards supporting narrow set of technologies neglecting the benefits 30
of decreasing risk trough diversification (Sawulski and Witajewski-Baltvilks 2020). 31
16.2.2.2 Knowledge spillovers 32
Knowledge spillovers drive continuous technological change (Rivera-Batiz and Romer 1991; Romer 33
1990) and are for that reason relevant to climate technologies as well as incumbent, carbon-intensive 34
technologies. Knowledge embedded in innovations by one innovator give an opportunity for others to 35
create new innovations and increase the knowledge stock even further. The constant growth of 36
knowledge stock through spillovers translates into constant growth of productivity and cost reduction. 37
ACCEPTED VERSION
SUBJECT TO FIN
AL EDITS

Final Government Distribution Chapter 16 IPCC AR6 WGIII
Do Not Cite, Quote or Distribute 16-17 Total pages: 141
By allowing for experimenting with existing knowledge and combining different technologies, 1
knowledge spillovers can result in the emergence of novel technological solutions, which has been 2
referred to as recombinant innovation (Weitzman 1998; Olsson and Frey 2002; Tsur and Zemel 2007; 3
Arthur 2009; Fleming and Sorenson 2001). Recombinant innovations speed up technological change 4
by combining different technological solutions, and make things happen that would be impossible with 5
only incremental innovations (Safarzyńska and van den Bergh 2010; van den Bergh 2008; Frenken et 6
al. 2012). It has been shown that 77% of all patents granted between 1790 and 2010 in the US are coded 7
by a combination of at least two technology codes (Youn et al. 2015). Spillovers related to energy and 8
low-carbon technologies has been documented by a number of empirical studies (high confidence) 9
(Popp 2002; Aghion et al. 2013; Witajewski-Baltvilks et al. 2017; Verdolini and Galeotti 2011; Conti 10
et al. 2018). The presence of spillovers can have both positive and negative impacts on climate change 11
mitigation (high confidence). 12
The spillover effect associated with innovation in carbon-intensive technologies may lead to lock-in of 13
fossil-fuel technologies. Continuous technological change of carbon-intensive industry raises the bar 14
for clean technologies: a larger drop in clean technologies’ cost is necessary to become competitive 15
(Acemoglu et al. 2012; Aghion et al. 2013). The implication is that delaying climate policy increases 16
the cost of that policy (Aghion 2019). 17
On the other hand, the spillover effect associated with innovation in low-emission technologies increase 18
the potency of climate policy (Aghion 2019). For instance, a policy that encourages clean innovation 19
leads to accumulation of knowledge in clean industry which, through spillover effect encourages further 20
innovation in clean industries. Once the stock of knowledge is sufficiently large, the value of clean 21
industries will be so high, that technology firms will invest there even without policy incentives. Once 22
this point is reached, the policy intervention can be discontinued (Acemoglu et al. 2012). 23
In addition, the presence of spillovers implies that a unilateral effort to reduce emissions in one region 24
could reduce emissions in other regions (medium confidence) (Gerlagh and Kuik 2014; Golombek and 25
Hoel 2004). For instance, in the presence of spillovers, a carbon tax that incentivises clean technological 26
change increases the competitiveness of clean technologies not only locally, but also abroad. The size 27
of this effect depends on the size of spillovers. If they are sufficiently strong, the reduction of emissions 28
abroad due to clean technological change could be larger than the increase of emissions due to carbon 29
leakage (Gerlagh and Kuik 2014). Different types of carbon leakage are discussed in Chapter 13, 30
Section 13.7.1 and other consequences of spillovers for the design of policy are discussed in Chapter 31
13, Section 13.7.3. 32
16.2.2.3 General purpose technologies and digitalization 33
General purpose technologies (GPTs) provide solutions that could be applied across sectors and 34
industries (Goldfarb 2011) by creating technological platforms for a growing number of interrelated 35
innovations. Examples of GPTs relevant to climate change mitigation are hydrogen and fuel cell 36
technology, which may find applications in transport, industry and distributed generation (Hanley et al. 37
2018), and nanotechnology which played a significant role in advancement of all the different types of 38
renewable energy options (Hussein 2015). Assessing the environmental, social and economic 39
implications of such technologies, including increased emissions through energy use, is challenging 40
(see Chapter 5, Section 5.3.4.1 and Cross-Chapter Box 11 below). 41
Several GPTs relevant for climate mitigation and adaptation emerged as a result digitalization, namely 42
the adoption or increase in use of information and communication technologies (ICTs) by citizens, 43
organizations, industries or countries and the associated restructuring of several domains of social life 44
and of the economy around digital technologies and infrastructures (IEA 2017b; Brennen and Kreiss 45
2016). The digital revolution is underpinned by innovation in key technologies, e.g. ubiquitous 46
connected consumer devices such as mobile phones (Grubler et al. 2018), rapid expansions of global 47
internet infrastructure and access (World Bank 2014), and steep cost reductions and performance 48
ACCEPTED VERSION
SUBJECT TO FIN
AL EDITS
Final Government Distribution Chapter 16 IPCC AR6 WGIII
Do Not Cite, Quote or Distribute 16-18 Total pages: 141
improvements in computing devices, sensors, and digital communication technologies (Verma et al. 1
2020). The increasing the pace at which the physical and digital worlds are converging increase the 2
relevance of disruptive digitalization in the context of climate mitigation and sustainability challenges 3
(European Commission 2020) (see Cross-chapter Box 11 in this chapter and Chapter 4, Section 4.4.1). 4
Digital technologies require energy, but increase efficiency, potentially offering technology-specific 5
GHG emission savings; they also have larger system wide impacts (Kaack et al. 2021). In industrial 6
sectors, robotization, smart manufacturing (SM), internet of things (IoT), artificial intelligence (AI), 7
and additive manufacturing (AM or 3D printing), have the potential to reduce material demand and 8
promote energy management (Chapter 11, Section 11.3.4.2). Smart mobility is changing transport 9
demand and efficiency (Chapter 10, Section 10.2.3). Smart devices in buildings, the deployment of 10
smart grids and the provision of renewable energy increase the role of demand-side management 11
(Serrenho and Bertoldi 2019) (Chapter 9, Sections 9.4 and 9.5), and support the shift away from asset 12
redundancy (Chapter 6, Section 6.4.3). Digital solutions are equally important on the supply side, for 13
example by accelerating innovation with simulations and deep learning (Rolnick et al. 2021) or realizing 14
flexible and decentralized opportunities through energy-as-a-service concepts and particularly with 15
Pay-As-You-Go (Chapter 15, Box 15.8, Table 1). 16
Yet, increased digitalization could give increase energy demand, thus wiping away potential efficiency 17
benefits, unless appropriately governed (IPCC 2018a). Moreover, digital technologies could negatively 18
impact labour demand and increase inequality (Cross-Chapter Box 11 in this chapter). 19
20
START CCB 11 HERE 21
Cross-Chapter Box 11: Digitalization: efficiency potentials and governance considerations 22
Felix Creutzig (Germany), Elena Verdolini (Italy), Paolo Bertoldi (Italy), Luisa F. Cabeza 23
(Spain), María Josefina Figueroa Meza (Venezuela/Denmark), Kirsten Halsnæs (Denmark), Joni 24
Jupesta (Indonesia), Şiir Kilkiş (Turkey), Michael Koenig (Germany), Eric Masanet (the United States 25
of America), Nikola Milojevic-Dupont (France), Joyashree Roy (India/Thailand), Ayyoob Sharifi 26
(Iran/Japan). 27
Digital technologies impact positively and negatively GHG emissions through their own carbon 28
footprint, via technology application for mitigation, and via induced larger social change. Digital 29
technologies also raise broader sustainability concerns due to their use of rare materials and 30
associated waste, and their potential negative impact on inequalities and labour demand. 31
Direct impacts emerge because digital technologies consume large amounts of energy, but also 32
have the potential to steeply increase energy efficiency in all end-use sectors through material 33
input savings and increased coordination (medium evidence, medium agreement) (Horner et al. 34
2016; Jones 2018) (Huang et al. 2016; IEA 2017b). Global energy demand from digital appliances 35
reached 7.14 EJ in 2018 (Chapter 9, Box 9.5), implying higher related carbon emissions. However, a 36
small smart phone offers services previously requiring many different devices (Grubler et al. 2018). 37
Demand for data services is increasing rapidly; quantitative estimates of the growth of associated energy 38
demand range from slow and marginal to rapid and sizeable, depending the efficiency trends of digital 39
technologies (see Chapter 5.3.4.1)(Avgerinou et al. 2017; Stoll et al. 2019; Vranken 2017; Masanet et 40
al. 2020). Renewable energy serves as low-carbon energy provider for the operation of data centre, 41
which in turn can provide waste heat for other purposes. Digital technologies can markedly increase the 42
energy efficiency of mobility and residential and public buildings, especially in the context of systems 43
integration (IEA 2020a). Reduction in energy demand and associated GHG emissions from buildings 44
and industry while maintaining service levels equal is estimated at 5 to 10%, with larger savings 45
possible. Approaches include building energy management systems (BEMS), home energy 46
ACCEPTED VERSION
SUBJECT TO FIN
AL EDITS

Final Government Distribution Chapter 16 IPCC AR6 WGIII
Do Not Cite, Quote or Distribute 16-19 Total pages: 141
management system (HEMS), demand response and smart charging (Cross-Chapter Box 11, Table 1. 1
Data centres can also play a role in energy system management, e.g., by increasing renewable energy 2
generation through predictive control (Dabbagh et al. 2019), and by helping drive the market for battery 3
storage and fuel cells (Riekstin et al. 2014). Temporal and spatial scheduling of electricity demand can 4
provide about 10 GW in demand response in the European electricity system in 2030 (Koronen et al. 5
2020; Wahlroos et al. 2017, 2018; Laine et al. 2020). 6
However, system-wide effects may endanger energy and GHG emission savings (high evidence, 7
high agreement). Economic growth resulting from higher energy and labour productivities can increase 8
energy demand (Lange et al. 2020) and associated GHG emissions. Importantly, digitalization can also 9
benefit carbon-intensive technologies (Victor 2018). Impacts on GHG emissions are varied in smart 10
and shared mobility systems, as ride hailing increases GHG emissions due to deadheading, whereas 11
shared pooled mobility and shared cycling reduce GHG emissions, as occupancy levels and/or weight 12
per person km transported improve (Chapter 5, Section 5.3). Energy and GHG emissions impacts from 13
the ubiquitous deployment of smart sensors and service optimization applications in smart cities through 14
are insufficiently assessed in the literature (Milojevic-Dupont and Creutzig 2021). Systemic effects have 15
wider boundaries of analysis, including broader environmental impacts (e.g. demand for rare materials, 16
disposal of digital devices). These need to be integrated holistically within policy design (Kunkel and 17
Matthess 2020), but they are difficult to quantify and investigate (Bieser and Hilty 2018). Policies and 18
adequate infrastructures and choice architectures can help manage and contain the negative 19
repercussions of systemic effects (Section 5.4, 5.6, 9.9). 20
21
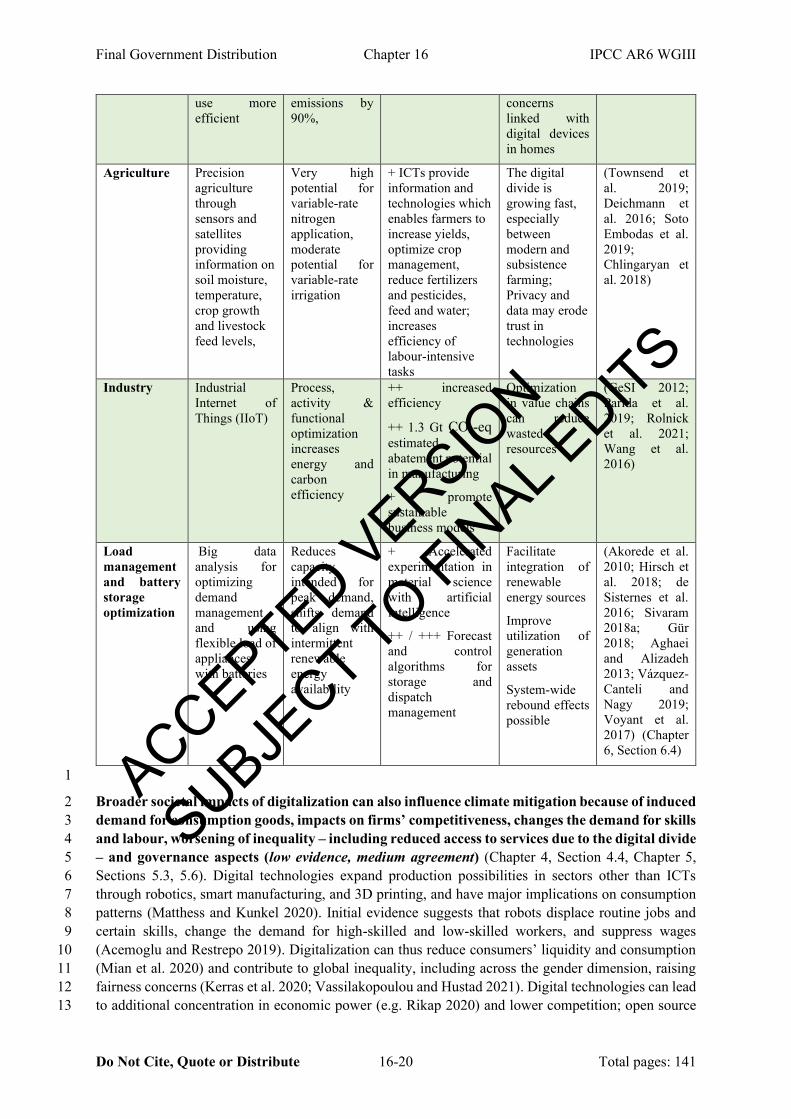
Cross-chapter Box 11, Table 1. Selected sector approaches for reducing GHG emissions that are 22
supported by new digital technologies. Contributions of digitalization include a) supporting role (+), b) 23
necessary role in mix of tools (++), c) necessary unique contribution (+++), but digitalization may also 24
increase emissions (−). See also chapters 5, 8, 9, and 11. 25
Sector Approach Quantitative
evidence
Contribution of
digitalization
Systems
perspective
and broader
societal
impacts
References
Residential
energy use
Nudges
(feedback,
information,
etc.)
2-4% reduction
in global
household
energy use
possible
+
in combination
with monetary
incentives, non-
digital information
New
appliances
increase
consumption
(Buckley 2020;
Zangheri et al.
2019; Khanna
et al. 2021;
Nawaz et al.
2020)
Smart
mobility
Shared
mobility and
digital
feedback
(ecodriving)
Reduction for
shared cycling
and shared
pooled
mobility;
increase for
ride hailing/
ride sourcing;
reduction for
ecodriving
− or ++
Apps together with
big data and
machine learning
algorithm key
precondition for
new shared
mobility
Ride hailing
increases GHG
emissions,
especially due
to deadheading
(OECD and ITF
2020; Zeng et
al. 2017)
Smart cities Using digital
devices and big
data to make
urban transport
and building
Precise data
about roadway
use can reduce
material
intensity and
associated
GHG
++
Big data analysis
necessary for
optimization
Efficiency
gains are often
compensated
by more
driving and
other rebound
effects; privacy
(Milojevic-
Dupont and
Creutzig 2021)
(Chapter 10,
Box 10.1)
ACCEPTED VERSION
SUBJECT TO FIN
AL EDITS
Final Government Distribution Chapter 16 IPCC AR6 WGIII
Do Not Cite, Quote or Distribute 16-20 Total pages: 141
use more
efficient
emissions by
90%,
concerns
linked with
digital devices
in homes
Agriculture Precision
agriculture
through
sensors and
satellites
providing
information on
soil moisture,
temperature,
crop growth
and livestock
feed levels,
Very high
potential for
variable-rate
nitrogen
application,
moderate
potential for
variable-rate
irrigation
+ ICTs provide
information and
technologies which
enables farmers to
increase yields,
optimize crop
management,
reduce fertilizers
and pesticides,
feed and water;
increases
efficiency of
labour-intensive
tasks
The digital
divide is
growing fast,
especially
between
modern and
subsistence
farming;
Privacy and
data may erode
trust in
technologies
(Townsend et
al. 2019;
Deichmann et
al. 2016; Soto
Embodas et al.
2019;
Chlingaryan et
al. 2018)
Industry Industrial
Internet of
Things (IIoT)
Process,
activity &
functional
optimization
increases
energy and
carbon
efficiency
++ increased
efficiency
++ 1.3 Gt CO2-eq estimated
abatement potential
in manufacturing
+ promote
sustainable
business models
Optimization
in value chains
can reduce
wasted
resources
(GeSI 2012;
Parida et al.
2019; Rolnick
et al. 2021;
Wang et al.
2016)
Load
management
and battery
storage
optimization
Big data
analysis for
optimizing
demand
management
and using
flexible load of
appliances
with batteries
Reduces
capacity
intended for
peak demand,
shifts demand
to align with
intermittent
renewable
energy
availability
+ Accelerated
experimentation in
material science
with artificial
intelligence
++ / +++ Forecast
and control
algorithms for
storage and
dispatch
management
Facilitate
integration of
renewable
energy sources
Improve
utilization of
generation
assets
System-wide
rebound effects
possible
(Akorede et al.
2010; Hirsch et
al. 2018; de
Sisternes et al.
2016; Sivaram
2018a; Gür
2018; Aghaei
and Alizadeh
2013; Vázquez-
Canteli and
Nagy 2019;
Voyant et al.
2017) (Chapter
6, Section 6.4)
1
Broader societal impacts of digitalization can also influence climate mitigation because of induced 2
demand for consumption goods, impacts on firms’ competitiveness, changes the demand for skills 3
and labour, worsening of inequality – including reduced access to services due to the digital divide 4
– and governance aspects (low evidence, medium agreement) (Chapter 4, Section 4.4, Chapter 5, 5
Sections 5.3, 5.6). Digital technologies expand production possibilities in sectors other than ICTs 6
through robotics, smart manufacturing, and 3D printing, and have major implications on consumption 7
patterns (Matthess and Kunkel 2020). Initial evidence suggests that robots displace routine jobs and 8
certain skills, change the demand for high-skilled and low-skilled workers, and suppress wages 9
(Acemoglu and Restrepo 2019). Digitalization can thus reduce consumers’ liquidity and consumption 10
(Mian et al. 2020) and contribute to global inequality, including across the gender dimension, raising 11
fairness concerns (Kerras et al. 2020; Vassilakopoulou and Hustad 2021). Digital technologies can lead 12
to additional concentration in economic power (e.g. Rikap 2020) and lower competition; open source 13
ACCEPTED VERSION
SUBJECT TO FIN
AL EDITS

Final Government Distribution Chapter 16 IPCC AR6 WGIII
Do Not Cite, Quote or Distribute 16-21 Total pages: 141
digital technologies can however counter this tendency (e.g. Rotz et al. 2019). Digital technologies play 1
a role in mobilizing citizens for climate and sustainability actions (Westerhoff et al. 2018; Segerberg 2
2017). 3
Whether the digital revolution will be an enabler or a barrier for decarbonization will ultimately 4
depend on the governance of both digital decarbonization pathways and digitalization more in 5
general (medium evidence, high agreement). The understanding of the disruptive potential of the wide 6
range of digital technologies is limited due to their ground-breaking nature, which makes it hard to 7
extrapolate from previous history/experience. Municipal and national entities can make use of digital 8
technologies to manage and govern energy use and GHG emissions in their jurisdiction (Bibri 2019a,b) 9
and break down solution strategies to specific infrastructures, building, and places, relying on remote 10
sensing and mapping data, and contextual (machine-) learning about their use (Milojevic-Dupont and 11
Creutzig 2021). Mobility apps can provide mobility-as-a-service access to cities ensuring due 12
preference to active and healthy modes (see 9.9 for the example of the Finnish city of Lahti). Trusted 13
data governance can promote the implementation of local climate solutions, supported by available big 14
data on infrastructures and environmental quality (Hansen and Porter 2017; Hughes et al. 2020). 15
Governance decisions, such as taxing data, prohibiting surveillance technologies, or releasing data that 16
enable accountability can change digitalization pathways, and thus underlying GHG emission (Hughes 17
et al. 2020). 18
Closing the digital gap in developing countries and rural communities enables an opportunity for 19
leapfrogging (medium evidence, medium agreement). Communication technologies (such as mobile 20
phones) enable participation of rural communities, especially in developing countries, and promote 21
technological leapfrogging, e.g. decentralized renewable energies and smart farming (Ugur and Mitra 22
2017; Foster and Azmeh 2020; Arfanuzzaman 2021). Digital technologies have sector-specific 23
potentials and barriers, and may benefit certain regions/areas/socioeconomic groups more than others. 24
For example, integrated mobility services benefit cities more than rural and peripheral areas (OECD 25
2017). 26
Appropriate mechanisms also need to be designed to govern digitalization as megatrend (medium 27
evidence, high agreement). Digitalization is expected to be a fast process, but this transformation takes 28
place against entrenched individual behaviours, existing infrastructure, the legacy of time frames, 29
vested interest and slow institutional processes and requires trust from consumers, producers and 30
institutions. A core question relates to who controls and manages data created by everyday operations 31
(calls, shopping, weather data, service use, etc.). Regulations that limit or ban the expropriation and 32
exploitation of behavioural data, sourced via smart phones, represent crucial aspects in digitalization 33
pathways, alongside the possibility to create climate movements and political pressure from the civil 34
society. Governance mechanisms need to be developed to ensure that digital technologies such as 35
artificial intelligence take over ethical choices (Craglia et al. 2018; Rahwan et al. 2019). Appropriate 36
governance is necessary for digitalization effectively work in tandem with established mitigation 37
technologies and choice architectures. Consideration of system-wide effects and overall management 38
is essential to avoid run-away effects. Overall governance of digitalization remains a challenge, and 39
will have large-scale repercussions on energy demand and GHG emissions. 40
END CCB 11 HERE 41
16.2.2.4 Explaining past and projecting future technology cost changes 42
Researchers and policymakers alike are interested in using observed empirical patterns of learning to 43
project future reductions in costs of technologies. Studies cutting across a wide range of industrial 44
sectors (not just energy) have tried to relate cost reductions to different functional forms, including cost 45
reductions as a function of time (Moore’s law) and cost reductions as a function of production or 46
ACCEPTED VERSION
SUBJECT TO FIN
AL EDITS

Final Government Distribution Chapter 16 IPCC AR6 WGIII
Do Not Cite, Quote or Distribute 16-22 Total pages: 141
deployment (Wright’s law, also known as Henderson's law), finding that those two forms perform better 1
than alternatives combining different factors, with costs as a function of production (Wright’s law) 2
performing marginally better (Nagy et al. 2013). A comparison of expert elicitation and model-based 3
forecasts of the future cost of technologies for the energy transition indicates that model-based forecast 4
medians were closer to the average realized values in 2019 (Meng et al. 2021). 5
Recent studies attempt to separate the influence of learning-by-doing (which is a basis of Wright’s law) 6
versus other factors in explaining cost reductions specifically in energy technologies. Some studies 7
explain cost reductions with two factors: cumulative deployment (as proxy for experience) and R&D 8
investment (see the “two factor” learning curve (Klaassen et al. 2005). However, reliable information 9
on public energy R&D investments for developing countries is not systematically collected. Available 10
data for OECD countries cannot be precisely assigned to specific industrial sectors or sub-technologies 11
(Verdolini et al. 2018). Some learning-curve studies take into account that historical variation in 12
technology costs could be explained by variation in key materials and fuel costs (for example steel costs 13
for wind turbines (Qiu and Anadon 2012) silicon costs (Kavlak et al. 2018; Nemet 2006) coal and coal 14
plant construction costs (McNerney et al. 2011). Economies of scale played a significant role in the 15
PV cost reductions since the early 2000s (Yu et al. 2011) (See also Box 16.4), which can also be the 16
case in organic PV technologies (Gambhir et al. 2016; Kavlak et al. 2018). 17
18
16.2.3 Directing technological change 19
Technological change is characterized not only by its speed, but also its direction. The early works that 20
considered the role of technology in economic and productivity growth (Solow 1957; Nelson and Phelps 21
1966) assumed that technology can move forward along only one dimension - every improvement led 22
to an increase in efficiency and increased demand for all factors of production. This view however 23
ignores the potency of technological change to alter the otherwise fixed relation between economic 24
growth and the use of resources. 25
Technological change that saves fossil fuels could decouple economic growth and CO2 emissions 26
(Acemoglu et al. 2014; Hémous 2016; Greaker et al. 2018; Acemoglu et al. 2012). Saving of fossils 27
could be obtained with increasing efficiency of producing alternatives to fossils (Acemoglu et al. 2012, 28
2014). This is the case of oil consumption by combustion engine cars which could be substituted with 29
electric cars (Aghion et al. 2013). If there is no close substitute to dirty resource, then its intensity in 30
production could still be reduced by increasing efficiency of the dirty resource relative to efficiency of 31
other inputs (Hassler et al. 2012; André and Smulders 2014; Witajewski-Baltvilks et al. 2017). For 32
instance, energy efficiency improvement leads to drop in relative demand for energy (Hassler et al. 33
2012; Witajewski-Baltvilks et al. 2017). 34
16.2.3.1 Determinants of technological change direction: prices, market size and government 35
Firms change their choice of technology upon change in prices: when one input (e.g. energy) becomes 36
relatively expensive, firms pick technologies which allow them to economize on that input, according 37
to price-induced technological change theory (Reder and Hicks 1965; Samuelson 1965; Sue Wing 38
2006). For example, an increase in oil price will lead to a choice of fuel-saving technologies. Such 39
response of technological change was evident during the oil-price shocks in the 1970s (Hassler et al. 40
2012). Technological change that is induced by an increase in price of a resource can never lead to an 41
increase in use of that resource. In other words, rebound effects associated induced technological change 42
can never offset the saving effect of that technological change (Antosiewicz and Witajewski-Baltvilks 43
2021). 44
The impact of energy prices on the size of low-carbon technological change is supported by large 45
number of empirical studies (Popp 2019; Grubb and Wieners 2020). Studies document that higher 46
ACCEPTED VERSION
SUBJECT TO FIN
AL EDITS

Final Government Distribution Chapter 16 IPCC AR6 WGIII
Do Not Cite, Quote or Distribute 16-23 Total pages: 141
energy prices are associated with higher number of low-carbon energy or energy efficiency patents 1
(Noailly and Smeets 2015; Ley et al. 2016; Lin and Chen 2019; Newell et al. 1999; Popp 2002; 2
Witajewski-Baltvilks et al. 2017; Verdolini and Galeotti 2011). Sue Wing (2008) finds that innovation 3
induced by energy prices had a minor impact on the decline in U.S. energy intensity in the last decades 4
of 20th century and that autonomous technological change played a more important role. Several studies 5
explore the impact of a carbon tax on green innovation (see Section 16.4). However, disentangling the 6
effect of policy tools is complex because presence of some policies could distort the functioning of 7
other policies (Böhringer and Rosendahl 2010; Fischer et al. 2017) and because the impact of policies 8
could be lagged in time (Antosiewicz and Witajewski-Baltvilks 2021). 9
The direction of technological change depends also on the market size for dirty technologies relative to 10
the size of other markets (Acemoglu et al. 2014). Due to this dependence, climate and trade policy 11
choices in a single region can alter the direction of technological change at the global level (see Section 12
16.2.3.3). 13
The value of the market for clean technologies is determined not only by a current but also by firm’s 14
expectations of future stream of profits (Alkemade and Suurs 2012; Greaker et al. 2018; Aghion 2019). 15
One implication is that bolstering the credibility and durability of policies related to low-carbon 16
technology is crucial to accelerating technological change and inducing the private sector investment 17
required (Helm et al. 2003), especially in rapidly growing economies of Asia and Africa who are on the 18
brink of making major decisions about the type of infrastructure they build as they grow, develop, and 19
industrialize (Nemet et al. 2017). 20
If governments commit to climate policies, firms expect that the future size of markets for clean 21
technologies will be large and they are eager to redirect research effort towards development of these 22
technologies today. Furthermore the commitment would also incentivise acquiring skills that could 23
further reduce the costs of those technologies (Aghion 2019). However, historical evidence shows that 24
policies related to energy and climate over the long term have tended to change (Nemet et al. 2013; 25
Taylor 2012; Koch et al. 2016). Still, where enhancing policy durability has proven infeasible, multiple 26
uncorrelated potentially overlapping policies can provide sufficient incentives (Nemet 2010). 27
16.2.3.2 Determinants of direction of technological change: financial markets 28
The challenges of investing in innovation in energy when compared to other important areas, such as 29
IT and medicine are also reflected in the trends in venture capital funding. Research found that early-30
stage investments in clean-tech companies were more likely to fail and returned less capital than 31
comparable investments in software and medical technology (Gaddy et al. 2017), which led to a retreat 32
from investors from hardware technologies required for renewable energy generation and storage to 33
software based technologies and demand-side solutions (Bumpus and Comello 2017). 34
The preference for particular types of investments in renewable energy technologies depends on 35
investors attitude to risk (Mazzucato and Semieniuk 2018). Some investors invest in only one 36
technology, others may spread their investments, or invest predominantly in high-risk technologies. The 37
distribution of different types of investors will affect whether finance goes to support deployment of 38
new high-risk technologies, or diffusion of more mature, less-risky technologies characterized by 39
incremental innovations. The role of finance in directing investment is further discussed in Chapter 15, 40
Section 15.6.2. 41
16.2.3.3 Internationalization of green technological change 42
A unilateral effort to reduce emission (via a combination of climate, industrial and trade policies) in a 43
coalition of regions that are technology leaders will reduce cost of clean technologies, which will induce 44
emission reduction in the countries outside the coalition (Di Maria and Smulders 2005; Di Maria and 45
van der Werf 2008; van den Bijgaart 2017; Golombek and Hoel 2004; Hémous 2016). The literature 46
ACCEPTED VERSION
SUBJECT TO FIN
AL EDITS

Final Government Distribution Chapter 16 IPCC AR6 WGIII
Do Not Cite, Quote or Distribute 16-24 Total pages: 141
suggests various mechanisms leading to this result. Di Maria and van der Werf (2008) argues that the 1
effort to reduce emission in one region reduces global demand for dirty good. This will redirect global 2
innovation towards clean technologies, leading to drop in cost of clean production in every region. 3
The model in Hemous (2016) predict that the coalition could induce acceleration of clean technological 4
change with a mix of carbon tax, clean R&D subsidies and trade policies in that region leading to 5
reduction of cost of clean production inside the coalition. Export of goods produced with clean 6
technologies to a region outside the coalition reduces demand for dirty good in that region. In the model 7
by van den Bijgaart (2017) local advancements of clean technologies by a coalition with strong R&D 8
potential are imitated outside the coalition. Furthermore, advancements of clean technologies will 9
incentivise future clean R&D outside the coalition due to intertemporal knowledge spillovers. In 10
Golombek and Hoel (2004) increase in environmental concern in one region increases abatement R&D 11
in that region. Part of this knowledge spills over to other regions, increasing their incentive to increase 12
abatement too, providing the latter regions did not invest in abatement before. 13
However, this chain breaks if the regions that are behind technological frontier (i.e., technological 14
followers) are not able to absorb the solutions developed by regions at the frontier. New technologies 15
might fail due to deficiencies of political, commercial, industrial, and financial institutions, which we 16
list in table 16.4. For instance, countries might not benefit fully from international knowledge spillover 17
due to insufficient domestic R&D investment, since local knowledge is needed to determine the 18
appropriateness of technologies for the local market, adapting them, installing and using effectively 19
(Gruebler et al. 2012). From the policy perspective this implies that simple transfer of technologies 20
could be insufficient to guarantee adoption of new technologies (Gruebler et al. 2012). 21
22
Table 16.4 Examples of institutional deficiencies preventing deployment of new technologies in countries 23
behind technological frontier. 24
Institutions Examples of deficiencies Literature reference
Industrial Inability to benefit fully from international
knowledge spillover due to insufficient domestic
R&D investment
(Mancusi 2008; Unel 2008; Gruebler
et al. 2012)
Commercial Insufficient experience with the organization and
management of large-scale enterprise
(Abramovitz 1986; Aghion et al.
2005)
Political Vested interests and customary relations among
firms and between employers and employees
(Olson 1982; Abramovitz 1986).
Financial Financial markets incapable of mobilizing capital for
individual firms at large scale
(Abramovitz 1986; Aghion et al.
2005)
25
Research relying on patent citations has indicated that Foreign Direct Investment (FDI) is a mechanism 26
for firms to both contribute to the recipient country’s innovation output as well as benefitting from the 27
recipient country both in industrialized countries (Branstetter 2006) and in developing countries 28
(Newman et al. 2015). However, insights specific for energy or climate change mitigation areas are not 29
available, nor is there much information about how other innovation metrics may react to FDI. 30
Finally, technologies could be not efficient in developing countries even if they are efficient in countries 31
at the technological frontier. For instance, technologies that are highly capital intensive and labour 32
saving will be efficient only in countries where costs of capital are low and costs of labour are high. 33
Similarly, technologies which require large number of skilled labour will be more competitive in a 34
ACCEPTED VERSION
SUBJECT TO FIN
AL EDITS

Final Government Distribution Chapter 16 IPCC AR6 WGIII
Do Not Cite, Quote or Distribute 16-25 Total pages: 141
country where skilled labour is abundant (and hence cheap) than where it is scarce (Basu and Weil 1
1998; Caselli and Coleman 2006). 2
16.2.3.4 Market failures in directing technological change 3
Market forces alone cannot deliver Pareto optimal (i.e. socially efficient) due to at least two types of 4
externalities: GHG emissions that cause climate damage and knowledge spillovers that benefit firms 5
other than the inventor. Nordhaus (2011) argues that these two problems would have to be tackled 6
separately: once the favourable intellectual property right regimes (i.e. the laws or rules or regulation 7
on protection and enforcement) are in place, a price on carbon that corrects the emission externality is 8
sufficient to induce optimal level of green technological change. Acemoglu et al. (2012) demonstrates 9
that subsidizing clean technologies (and not dirty ones) is also necessary to break the lock-in of dirty 10
technological change. Recommendations for technical changes often are based on climate 11
considerations only and neglect secondary externalities and environmental costs of technology choices 12
(such as loss of biodiversity due to inappropriate scale-up of bioenergy use). The scale of adverse side 13
effects and co-benefits varies considerably between low-carbon technologies in the energy sector 14
(Luderer et al. 2019). 15
16
16.2.4 Representation of the innovation process in modelled decarbonization pathways 17
A variety of models are used to generate climate mitigation pathways, compatible with 2°C and well 18
below 2°C targets. These include Integrated Assessment Models (IAMs), energy system models, 19
computable general equilibrium models and agent based models. They range from global (Chapter 3) 20
to national models and include both top-down and bottom-up approaches (Chapter 4). Innovation in 21
energy technologies, which comprises the development and diffusion of low-, zero- and negative-22
carbon energy options, but also investments to increase energy efficiency, is a key driver of emissions 23
reductions in model-based scenarios. 24
16.2.4.1 Technology cost development 25
Assumptions on energy technology cost developments are one of the factors that determine the speed 26
and magnitude of the deployment in climate-energy-economy models. The modelling is informed by 27
the empirical literature estimating rates of cost reductions for energy technologies. A first strand of 28
literature relies on the extrapolation of historical data, assuming that costs decrease either as a power 29
law of cumulative production, exponentially with time (Nagy et al. 2013) or as a function of technical 30
performance metrics (Koh and Magee 2008). Another approach relies on expert estimates of how future 31
costs will evolve, including expert elicitations (Verdolini et al. 2018). 32
In these models, technology costs may evolve exogenously or endogenously (Krey et al. 2019; Mercure 33
et al. 2016). In the first case, technology costs are assumed to vary over time at some predefined rate, 34
generally extrapolated from past observed patterns or based on expert estimates. This formulation of 35
cost dynamics generally underestimates future costs (Meng et al. 2021) as, among other things, it does 36
not capture any policy-induced carbon-saving technological change or any spillover arising from the 37
accumulation of national and international knowledge (Section 16.2.2 and 16.2.3) or positive 38
macroeconomics effects of a transition (Karkatsoulis et al. 2016). The influence of cost and diffusion 39
assumptions may be evaluated through sensitivity analysis. In the second case, costs are a function of 40
a choice variable within the model. For instance, technology costs decrease as a function of either 41
cumulative installed capacity (learning-by-doing) (Seebregts et al. 1998; Kypreos and Bahn 2003) or 42
R&D investments or spillovers from other sectors and countries. 43
One factor in this ‘learning-by-researching’ is applied to a wide range of energy technologies but also 44
to model improvements in the efficiency of energy use (Goulder and Schneider 1999; Popp 2004). More 45
complex formulations include two-factor learning processes (see Section 16.2.2.1) (Criqui et al. 2015; 46
ACCEPTED VERSION
SUBJECT TO FIN
AL EDITS

Final Government Distribution Chapter 16 IPCC AR6 WGIII
Do Not Cite, Quote or Distribute 16-26 Total pages: 141
Emmerling et al. 2016; Paroussos et al. 2020), multi-factor learning curves (Kahouli 2011; Yu et al. 1
2011), or other drivers of cost reductions such as economies of scale and markets (Elia et al. 2021). The 2
application of two-factor learning curves to model energy technology costs is often constrained by the 3
lack of information on public and/or private energy R&D investments in many fast-developing and 4
developing countries (Verdolini et al. 2018). The approach used to model energy technology costs 5
reductions varies across technologies, even within the same model, depending on the availability of 6
data and/or the level of maturity. Less mature technologies generally depend highly on learning-by-7
research, whereas learning-by-doing dominates in more mature technologies (Jamasb 2007). 8
In addition to learning, knowledge spillover effects are also integrated in climate-energy-economy 9
models to reflect the fact that innovation in a given country depends also on knowledge generated 10
elsewhere (Fragkiadakis et al. 2020; Emmerling et al. 2016). Models with a more detailed representation 11
of sectors (Paroussos et al. 2020) can use spillover matrices to include bilateral spillovers and compute 12
learning rates that depend on the human capital stock and the regional and/or sectoral absorption rates 13
(Fragkiadakis et al. 2020). Accounting for knowledge spillovers in the EU for PV, wind turbines, EVs, 14
biofuels, industry materials, batteries and advanced heating and cooking appliances can lead to the 15
following results in a decarbonization scenario over the period 2020–2050 as compared to the reference 16
scenario: an increase of 1.0–1.4% in GDP, 2.1–2.3% in investment, and 0.2–0.4% in employment by 17
clean energy technologies (Paroussos et al. 2017). When comparing two possible EU transition 18
strategies - being a first-mover with strong unilateral emission reduction strategy until 2030 versus 19
postponing action for the period after 2030 - endogenous technical progress in the green technologies 20
sector can alleviates most of the negative effects of pioneering low-carbon transformation associated 21
with loss of competitiveness and carbon leakage (Karkatsoulis et al. 2016). 22
16.2.4.2 Technology deployment and diffusion 23
To simulate possible paths of energy technology diffusion for different decarbonisation targets, models 24
rely on assumptions about the cost of a given technology cost relative to the costs of other technologies 25
and its ability to supply the energy demand under the relevant energy system and physical constraints. 26
These assumptions include, for example, considerations regarding renewable intermittency, inertia on 27
technology lifetime (for instance, under less stringent temperature scenarios early retirement of fossil 28
plants does not take place), distribution, capacity and market growth constraints, as well as the presence 29
of policies. These factors change the relative price of technologies. Furthermore, technological diffusion 30
in one country is also influenced by technology advancements in other regions (Kriegler et al. 2015). 31
Technology diffusion may also be strongly influenced, either positively or negatively, by a number of 32
non-cost, non-technological barriers or enablers regarding behaviours, society and institutions 33
(Knobloch and Mercure 2016)These include network or infrastructure externalities, the co-evolution of 34
technology clusters over time (“path dependence”), the risk-aversion of users, personal preferences and 35
perceptions and lack of adequate institutional framework which may negatively influence the speed of 36
(low-carbon) technological innovation and diffusion, heterogeneous agents with different preferences 37
or expectations, multi-objectives and/or competitiveness advantages and uncertainty around the 38
presence and the level of environmental policies and institutional and administrative barriers (Iyer et al. 39
2015; Baker et al. 2015; Marangoni and Tavoni 2014; van Sluisveld et al. 2020; Napp et al. 2017; 40
Biresselioglu et al. 2020). These types of barriers to technology diffusion are currently not explicitly 41
detailed in most of the climate-energy-economy models. Rather, they are accounted for in models 42
through scenario narratives, such as the ones in the Shared Socioeconomic Pathways (Riahi et al. 2017), 43
in which assumptions about technology adoption are spanned over a plausible range of values. 44
Complementary methods are increasingly used to explore their importance in future scenarios 45
(Turnheim et al. 2015; Gambhir et al. 2019; Trutnevyte et al. 2019; Doukas et al. 2018; Geels et al. 46
2016). It takes a very complex modelling framework to include all aspects affecting technology cost 47
reductions and technology diffusion, such as heterogeneous agents (Lamperti et al. 2020), regional 48
ACCEPTED VERSION
SUBJECT TO FIN
AL EDITS

Final Government Distribution Chapter 16 IPCC AR6 WGIII
Do Not Cite, Quote or Distribute 16-27 Total pages: 141
labour costs (Skelton et al. 2020), materials cost and trade and perfect foresight multi-objective 1
optimization (Aleluia Reis et al. 2021). So far, no model can account for all these interactions 2
simultaneously. 3
Another key aspect of decarbonization regards issues of acceptability and social inclusion in decision-4
making. Participatory processes involving stakeholders can be implemented using several methods to 5
incorporate qualitative elements in model-based scenarios on future change (Doukas and Nikas 2020; 6
van Vliet et al. 2010; Nikas et al. 2017, 2018; van der Voorn et al. 2020). 7
16.2.4.3 Implications for the modelling of technical change in decarbonization pathways 8
Although the debate is still ongoing, preliminary conclusions indicate that integrated assessment 9
models tend to underestimate innovation on energy supply but overestimate the contributions by energy 10
efficiency (IPCC 2018b). Scenarios emerging from cost-optimal climate-energy-economy models are 11
too pessimistic, especially in the case of rapidly changing technologies such as wind and batteries in 12
the past decade Conversely, they tend be too optimistic regarding the timing of action, or the availability 13
of a given technology and its speed of diffusion (Shiraki and Sugiyama 2020). Furthermore, some 14
technological and economic transformations may emerge as technically feasible from IAMs, but are not 15
realistic if taking into account political economy, international politics, human behaviours, and cultural 16
factors (Bosetti 2021). 17
There is a range of projected energy technology supply costs included in the AR6 Scenario Database 18
(Box 16.1). Variations of costs over time and across scenarios are within ranges comparable to those 19
observed in recent years. Conversely, model results show that limiting warming to 2°C or 1.5°C will 20
require faster diffusion of installed capacity of low-carbon energy options and a rapid phase out of 21
fossil-based options. This points to the importance of focusing on overcoming real-life barriers to 22
technology deployment. 23
24
START BOX 16.1 HERE 25
Box 16.1 Comparing observed energy technology costs and deployment rates with projections 26
from AR6 low-carbon pathways 27
Currently observed costs and deployment for electricity supply technologies from a variety of sources 28
are compared with projections from two different sets of scenarios contained in the AR6 Scenario 29
database: 1) reference and current policies including NDCs and 2) 2°C and well-below 2°C (AR6 model 30
database). Global aggregate costs are shown for the following technologies: Coal with CCS, Gas with 31
CCS, Nuclear, Solar PV, Onshore and Offshore Wind. 32
The decrease in forecasted capital costs is not large compared to current capital costs for most 33
technologies, and does not differ much between the two scenarios (Box 16.1, Figure 1a). For Wind 34
offshore some of the models are more optimistic than the current reality (Timilsina 2020). Several 35
sources of current solar PV costs report values that are at the low end of the AR6 model scenario 36
database. By 2050, the median technology cost forecasts decrease by between 5% for nuclear and 45-37
52% for solar (Box 16.1, Figure 1c). 38
Median values of renewables installed capacity increase with respect to 2020 capacity in “current 39
policies” scenarios (Box 16.1, Figure 1b), where energy and climate policies are implemented in line 40
with the current NDCs. More ore stringent targets (2°C) are achieved through a higher deployment of 41
renewable technologies: by 2050 solar (wind) capacity is estimated to increase by a factor of 15 (10) 42
(Box 16.1, Figure 1c). This is accompanied by an almost complete phase out of coal (-87%). The 43
percentage of median changes in installed capacity in the current policies scenarios is within comparable 44
ACCEPTED VERSION
SUBJECT TO FIN
AL EDITS

Final Government Distribution Chapter 16 IPCC AR6 WGIII
Do Not Cite, Quote or Distribute 16-28 Total pages: 141
ranges of that observed in the last decade. In the case of the 2°C and well-below 2°C scenarios, capacity 1
installed is higher for renewable technologies and nuclear, and lower for fossil-based technologies (Box 2
16.1, Figure 1c). 3
The higher deployment in 2°C scenarios cannot be explained solely as a result of technology cost 4
dynamics. In IAMs, technology deployment is also governed by system constraints that characterize 5
both scenarios, e.g. the flexibility of the energy system, the availability of storage technologies. From a 6
modelling point of view, implementing more stringent climate policies to meet the 2°C targets forces 7
models to find solutions, even if costly, to meet those intermittency and flexibility constraints and 8
temperature target constraints. 9
10
Box 16.1, Figure 1: Global Technology cost and deployment in two groups of AR6 scenarios: (1) reference 11
and current policies including NDCs and (2) 2°C and well-below 2°C. 12
Panel a) Current capital costs are sourced from Table 1, (Timilsina 2020); distribution of capital costs in 13
2030 and 2050 (AR6 database). Blue symbols represent the mean. ‘Current’ capital costs for coal and gas 14
plants with CCS are not available; Panel b) Total installed capacity in 2019 (IRENA 2020a; IEA 2020c; 15
IRENA 2020b); distribution of total installed capacity in 2030 and 2050 (AR6 database). Blue symbols 16
represent the mean; Panel c) Percentage of change in capital costs and installed capacity between (2010-17
2020) and percentage of median change (2020-2030 and 2020-2050) (Medianyear-18
ACCEPTED VERSION
SUBJECT TO FIN
AL EDITS

Final Government Distribution Chapter 16 IPCC AR6 WGIII
Do Not Cite, Quote or Distribute 16-29 Total pages: 141
Median2020)/Median2020*100. “M” indicates the number of models, “S” the number of scenarios for which 1
this data is available. Reference and current policies' are C6 and C7 scenario categories and '2C and 2
1.5C' are C1, C2 and C3 scenario categories. Each model may have submitted data for more than one 3
model version. 4
END BOX 16.1 HERE 5
6
16.3 A systemic view of technological innovation processes 7
The innovation process, which consists of a set of sequential phases (Section 16.2.1), is often simplified 8
to a linear process. Yet, it is now well understood that it is also characterised by numerous kinds of 9
interactions and feedbacks between the domains of knowledge generation, knowledge translation and 10
application, and knowledge use (Kline and Rosenberg 1986). Furthermore, it is not just invention that 11
leads to technological change but the cumulative contribution of incremental innovations over time can 12
be very significant (Kline and Rosenberg 1986). Innovations can come not just from formal R&D but 13
also sources such as production engineers and the shop floor (Freeman 1995a; Kline and Rosenberg 14
1986). 15
This section reviews the literature focusing on innovation as a systemic process. This now predominant 16
view enriches the understanding of innovation as presented in section 16.2; it conceptualizes innovation 17
as the result of actions by, and interactions among, a large set of actors, whose activities are shaped by, 18
and shape, the context in which they operate and the user group with which they are engaging. This 19
section aligns with the discussion of socio-technical transitions (see Chapter 1 Section 1.7.3, the 20
Supplementary Material in Chapter 5, and Cross-Chapter Box 12 in this chapter). 21
22
16.3.1 Frameworks for analysing technological innovation processes 23
The resulting overarching framework that is commonly used in the innovation scholarship and even 24
policy analyses is termed as “innovation system”, where the key constituents of the systems are actors, 25
their interactions, and the institutional landscape, including formal rules, such as laws, and informal 26
restraints, such as culture and codes of conduct, that govern the behaviour of the actors (North 1991). 27
One application of this framework is that of national innovation systems (NIS), which highlights the 28
importance of national and regional relationships for determining the technological and industrial 29
capabilities and development of a country (Nelson 1993; Lundvall 1992; Freeman 1995a). Nelson 30
(1993) and Freeman (Freeman 1995a) highlight the role of institutions that determine the innovative 31
performance of national firms as way to understand differences across countries, while Lundvall (1992) 32
focuses on the “elements and relationships which interact in the production, diffusion and use of new, 33
and economically useful, knowledge”, i.e., notions of interactive learning, in which user-producer 34
relationships are particularly important (Lundvall 1988). Building on this, various other applications of 35
the “innovation systems” framework have emerged in the literature. 36
Technological Innovation systems (TIS), with technology or set of technologies (more narrowly or 37
broadly defined in different cases) as the unit of analysis and focus on explaining what accelerates or 38
hinders their development and diffusion. Carlsson and Stankiewicz (1991) define a technological 39
system as “a dynamic network of agents interacting in a specific economic/ industrial area under a 40
particular institutional infrastructure and involved in the generation, diffusion, and utilisation of 41
technology.” More recent work takes a “functional approach” to TIS (Bergek et al. 2008; Hekkert et al. 42
2007), which was later expanded with explanations of how some of the sectoral, geographical and 43
political dimensions intersect with technology innovation systems (Bergek et al. 2015; Quitzow 2015). 44
ACCEPTED VERSION
SUBJECT TO FIN
AL EDITS

Final Government Distribution Chapter 16 IPCC AR6 WGIII
Do Not Cite, Quote or Distribute 16-30 Total pages: 141
Sectoral innovation systems (SIS): based on the understanding that the constellation of relevant actors 1
and institutions will vary across industrial sectors, with each sector operating under a different 2
technological regime and under different competitive or market conditions. A sectoral innovation, thus, 3
can be defined as “that system (group) of firms active in developing and making a sector's products and 4
in generating and utilising a sector's technologies” (Breschi and Malerba 1997). 5
Regional and Global innovation systems (RIS, GIS), recognising that the many innovation processes 6
have a spatial dimension, where the development of system resources such as knowledge, market 7
access, financial investment, and technology legitimacy may well draw on actors, networks, and 8
institutions within a region (Cooke et al. 1997). In other cases, the distribution of many innovation 9
processes are highly internationalised and therefore outside specific territorial boundaries (Binz and 10
Truffer 2017). Importantly, Binz and Truffer (2017) note that the GIS framework “differentiates 11
between an industry’s dominant innovation mode... and the economic system of valuation in which 12
markets for the innovation are constructed.” 13
Mission-oriented innovation systems (MIS), whose relevance comes into focus with the move towards 14
mission-oriented programs as part of the increasing innovation policy efforts to address societal 15
challenges. Accordingly, an MIS is seen as consisting of “networks of agents and sets of institutions 16
that contribute to the development and diffusion of innovative solutions with the aim to define, pursue 17
and complete a societal mission” (Hekkert et al. 2020). 18
Notably the innovation systems approach has been used in a number of climate-relevant areas such as 19
agriculture (Echeverría 1998; Klerkx et al. 2012; Horton and Mackay 2003; Brooks and Loevinsohn 20
2011), energy (Sagar and Holdren 2002; OECD 2006; Gallagher et al. 2012; Wieczorek et al. 2013; 21
Mignon and Bergek 2016; Darmani et al. 2014), industry (Koasidis et al. 2020b) and transport (Koasidis 22
et al. 2020a), and sustainable development (Clark et al. 2016; Bryden and Gezelius 2017; Anadon et al. 23
2016b; Nikas et al. 2020). 24
A number of functions can be used to understand and characterise the performance of technological 25
innovation systems (Hekkert et al. 2007; Bergek et al. 2008). The most common functions are in Table 26
16.5. 27
28
Table 16.5 Functions that the literature identified as key for well-performing technological innovation 29
systems (based on Hekkert et al (2007) and Bergek et al (2008)) 30
Functions Description
Entrepreneurial activities and
experimentation
Entrepreneurial activities and experimentation for translating new
knowledge and/or market opportunities into real-world application
Knowledge development Knowledge development includes both “learning-by-searching”
and “learning-by-doing”
Knowledge diffusion Knowledge diffusion through networks, both among members of a
community (e.g., scientific researchers) and across communities
(e.g., universities, business, policy, and users).
Guidance of search Guidance of search directs the investments in innovation in
consonance with signals from the market, firms or government
Market formation Market formation through customers or government policy is
necessary to allow new technologies to compete with incumbent
technologies
Resource mobilisation Resource mobilisation pertains to the basic inputs – human and
financial capital – to the innovation process
ACCEPTED VERSION
SUBJECT TO FIN
AL EDITS

Final Government Distribution Chapter 16 IPCC AR6 WGIII
Do Not Cite, Quote or Distribute 16-31 Total pages: 141
Creation of legitimacy/counteract
resistance to change
Creation of legitimacy or counteracting resistance to change,
through activities that allow a new technology to become accepted
by users, often despite opposition by incumbent interests
Development of external economies Development of external economies, or the degree to which other
interests benefit from the new technology
1
Evidence from empirical case studies indicates that all the above functions are important and that they 2
interact with one another (Hekkert and Negro 2009). The approach therefore serves as both a rationale 3
for and a guide to innovation policy (Bergek et al. 2010). 4
A much-used, complementary systemic framework is the multilevel perspective (MLP) (Geels 2002), 5
which focuses mainly on the diffusion of technologies in relation to incumbent technologies in their 6
sector and the overall economy. A key point of MLP is that new technologies need to establish 7
themselves in a stable ‘socio-technical regime’ and are therefore generally at a disadvantage, not just 8
because their low technological maturity, but also because of an unwelcoming system. The MLP 9
highlights that the uptake of technologies in society is an evolutionary process, which can be best 10
understood as a combination of “variation, selection and retention” as well as “unfolding and 11
reconfiguration” (Geels 2002). Thus new technologies in their early stages need to be selected and 12
supported at the micro-level by niche markets, possibly through a directed process that has been termed 13
“strategic niche management” (Kemp et al. 1998). As at the macro landscape level pressures on 14
incumbent regimes mount, and those regimes destabilise, the niche technologies get a chance to get 15
established in a new socio-technical regime, which allows these technologies to grow and stabilise, 16
shaping a changed or sometimes radically renewed socio-technical regime. The MLP takes a systematic 17
and comprehensive view about how to nurture and shape technological transitions by understanding 18
them as evolutionary, multi-directional and cumulative socio-technical process playing out at multiple 19
levels over time with a concomitant expansion in the scale and scope of the transition (Elzen et al. 2004; 20
Geels 2005b). There have been numerous studies that draw on the MLP (van Bree et al. 2010; Geels et 21
al. 2017; Geels 2012) to understand different aspects of climate technology innovation and diffusion. 22
Systemic analyses of innovation have predominantly focused on industrialised countries There have 23
been some efforts to use the innovation systems lens for the developing country context (Jacobsson and 24
Bergek 2006; Lundvall et al. 2009; Altenburg 2009; Choi and Zo 2019; Tigabu 2018; Tigabu et al. 25
2015) and specific suggestions on ways for developing countries to strengthening their innovation 26
systems (e.g., by universities taking on a “developmental” role (Arocena et al. 2015) or industry 27
associations acting as intermediaries to build institutional capacities (Watkins et al. 2015; Khan et al. 28
2020), including specifically for addressing climate challenges (Sagar et al. 2009; Ockwell and Byrne 29
2016). But the conditions in developing countries are quite different, leading to suggestions that 30
different theoretical conceptualisations of the innovation systems approach may be needed for these 31
countries (Arocena and Sutz 2020), although a system perspective would still be appropriate (Boodoo 32
et al. 2018). 33
34
16.3.2 Identifying systemic failures to innovation in climate-related technologies 35
Traditional perspectives on innovation policy were mostly science-driven, and focused on strengthening 36
invention and its translation into application in a narrow sense, and a second main traditional perspective 37
on innovation policy was focused on correcting for ‘market failures’ (covered in Section 16.2) (Weber 38
and Truffer 2017). The more recent understanding of, and shift of focus to, the systemic nature on the 39
innovation and diffusion of technologies has implications for innovation policy since innovation 40
outcomes depend not just on inputs such as R&D but much more on the functioning of the overall 41
innovation system (see previous section and Section 16.4). Policies can therefore be directed at 42
ACCEPTED VERSION
SUBJECT TO FIN
AL EDITS

Final Government Distribution Chapter 16 IPCC AR6 WGIII
Do Not Cite, Quote or Distribute 16-32 Total pages: 141
innovation systems components and processes that need the greatest attention or support. This may 1
include, for example, strengthening the capabilities of weak actors and improving interactions between 2
actors (Jacobsson et al. 2017; Weber and Truffer 2017). At the same time, a systemic perspective also 3
brings into sharp relief the notion of ‘system failures’ (Weber and Truffer 2017). 4
Systemic failures include infrastructural failures; hard (e.g., laws, regulation) and soft (e.g., culture, 5
social norms) institutional failures; interaction failures (strong and weak network failures); capability 6
failures relating to firms and other actors; lock-in; and directional, reflexivity, and coordination failures 7
(Klein Woolthuis et al. 2005; Chaminade and Esquist 2010; Weber and Rohracher 2012; Wieczorek 8
and Hekkert 2012; Negro et al. 2012). By far most of the literature that unpacks such failures and 9
explores ways to overcome them is on energy-related innovation policy. For example, Table 16.6 10
summarizes a meta-study (Negro et al. 2012) that examined cases of renewable energy technologies 11
trying to disrupt incumbents across a range of countries to understand the roles, and relative importance, 12
of the ‘systemic problems’ highlighted in Section 16.3.1. 13
14
Table 16.6 Examination of systemic problems preventing renewable energy technologies from reaching 15
their potential, including number of case studies in which the particular ‘systemic problem’ was 16
identified Source: (Negro et al. 2012). 17
Systemic problems Empirical sub-categories No. of cases
Hard institutions
- ‘Stop and go policy’: lack of continuity and long-term
regulations; inconsistent policy and existing laws and regulations
-‘Attention shift’: policy makers only support technologies if they
contribute to the solving of a current problem
-‘Misalignment’ between policies on sector level such as
agriculture, waste, and on governmental levels, i.e. EU, national,
regional level, etc.
-“Valley of Death”: lack of subsidies, feed-in tariffs, tax
exemption, laws, emission regulations, venture capital to move
technology from experimental phase towards commercialisation
phase
51
Market structures - Large-scale criteria
- Incremental/near-to-market innovation
- Incumbent’s dominance
30
Soft institutions - Lack of legitimacy
- Different actors opposing change
28
Capabilities/capacities - Lack of technological knowledge of policy makers and engineers
- Lack of ability of entrepreneurs to pack together, to formulate
clear message, to lobby to the government
- Lack of users to formulate demand
- Lack of skilled staff
19
Knowledge infrastructure - Wrong focus or not specific courses at universities knowledge
institutes
- Gap/Misalignment between knowledge produce at universities
and what needed in practice
16
ACCEPTED VERSION
SUBJECT TO FIN
AL EDITS

Final Government Distribution Chapter 16 IPCC AR6 WGIII
Do Not Cite, Quote or Distribute 16-33 Total pages: 141
Too weak interactions - Individualistic entrepreneurs
- No networks, no platforms
- Lack of knowledge diffusion between actors
- Lack of attention for learning-by-doing
13
Too strong interactions - Strong dependence on government action or dominant partners
(incumbents)
- Networks allows no access to new entrants
8
Physical infrastructure - No access to existing electricity or gas grid for RETs
- No decentralised, small-scale grid
- No refill infrastructure for biofuels, ABG, H2, biogas
2
Depending on the sector, specific technology characteristics, and national and regional context, the 1
relevance of these systemic problems varies (Trianni et al. 2013; Bauer et al. 2017; Wesseling and Van 2
der Vooren 2017; Koasidis et al. 2020b,a), suggesting that the innovation policy mix has to be tailor-3
made to respond to the diversity of systemic failures (Rogge et al. 2017). An illustration of how such 4
systemic failures have been addressed is given in Box 16.2, which shows how the Indian government 5
designed its standards and labelling programme for energy-efficient air conditioners and refrigerators. 6
The success of this program resulted from the careful attention to bring on board and coordinate the 7
relevant actors and resources, the design of the standards, and ensuring effective administration and 8
enforcement of the standards (Malhotra et al. 2021). 9
10
START BOX 16.2 HERE 11
Box 16.2: Standards and Labelling (S&L) for energy efficient refrigerators and air conditioners 12
in India2 13
Energy efficiency is often characterised as a “low-hanging fruit” for reducing energy use. However, 14
systemic failures such as lack of access to capital, hidden costs of implementation, and imperfect 15
information can result in low investments into adoption and innovation in energy efficiency measures 16
(Sorrell et al. 2004). To address such barriers, India’s governmental Bureau of Energy Efficiency (BEE) 17
introduced the Standards and Labelling (S&L) programme for promotion of innovation in energy 18
efficient appliances in 2006 (Sundaramoorthy and Walia 2017). While context-dependent, the 19
programme design, policies and scale-up contain lessons for addressing systemic failures elsewhere too. 20
Program design and addressal of early systemic barriers 21
To design the S&L program, BEE drew on the international experiences and technical expertise of the 22
Collaborative Labelling and Appliance Standards Program (CLASP) – a non-profit organisation that 23
provides technical and policy support to governments in implementing S&L programs. For example, 24
since there was no data on the efficiency of appliances in the Indian market, CLASP assisted with early 25
data collection efforts, resulting in a focus on refrigerators and air conditioners (ACs) (McNeil et al. 26
2008). 27
FOOTNOTE 2 This section draws on “The role of capacity-building in policies for climate change mitigation and
sustainable development: The case of energy efficiency in India” (Malhotra et al. 2021)
ACCEPTED VERSION
SUBJECT TO FIN
AL EDITS

Final Government Distribution Chapter 16 IPCC AR6 WGIII
Do Not Cite, Quote or Distribute 16-34 Total pages: 141
Besides drawing from international knowledge, the involvement of manufacturers, testing laboratories, 1
and customers was crucial for the functioning of the innovation system. 2
To involve manufacturers, BEE employed three strategies to set the standards at an ambitious yet 3
acceptable level. First, BEE enlisted IIT Delhi (a public technical university) to engage with 4
manufacturers and to demonstrate cost-effective designs of energy-efficient appliances. Second, BEE 5
agreed to make the standards voluntary from 2006 to 2010. In return, the manufacturers agreed to 6
mandatory and progressively more stringent standards starting in 2010. Third, BEE established a multi-7
stakeholder committee with representation from BEE, the Bureau of Indian Standards, appliance 8
manufacturers, test laboratories, independent experts, and consumer groups (Jairaj et al. 2016) to ensure 9
that adequately stringent standards are negotiated every two years. 10
At this time, India had virtually no capacity for independent testing of appliances. Here too, BEE used 11
multiple approaches towards creating the actors and resources needed for the innovation system to 12
function. First, BEE funded the Central Power Research Institute (CPRI) – a national laboratory for 13
applied research, testing and certification of electrical equipment – to set up refrigerator and AC testing 14
facilities. Second, they invited bids from private laboratories, thus creating a demand for testing 15
facilities. Third, BEE developed testing protocols in partnership with universities. Australian standards 16
for testing frost-free refrigerators were adopted until local standards were developed. Thus, once the 17
testing laboratories, protocols and benchmark prices for testing were in place, the appliance 18
manufacturers could employ their services. 19
Finally, a customer outreach program was conducted from 2006 to 2008 to inform customers regarding 20
energy efficient appliances, to enable them to interpret the labels correctly, and to understand their 21
purchase decisions and information sources (Joshi et al. 2019; Jain et al. 2018). BEE initiated a capacity 22
building program for retailers to be an information source for costumers. A comprehensive document 23
with details of different models and labels was provided to retailers, together with a condensed booklet 24
to be shared with customers. 25
Adapting policies to technologies and local context 26
While many of India’s standards and testing protocols were based on international standards, they 27
needed to be adapted to the Indian context. For example, because of higher temperatures in India, the 28
reference outside temperature of 32°C for refrigerators was changed to 36°C. 29
AC testing protocols also had to be adapted because of the emergence of inverter-based ACs. Existing 30
testing done only at a single temperature did not value inverter-based ACs’ better average performance 31
as compared to fixed-speed ACs over a range of temperatures. Thus, the Indian Seasonal Energy 32
Efficiency Ratio (ISEER) was developed for Indian temperature conditions in 2015 by studying ISO 33
standards and through consultations with manufacturers (Mukherjee et al. 2020). 34
These measures had multiple effects on technological change. As a result of stringent standards, India 35
has some of the most efficient refrigerators globally. In the case of ACs, the ISEER accelerated 36
technological change by favouring inverter-based ACs over fixed-speed ACs, driving down their costs 37
and increasing their market shares (BEE 2020). 38
Scaling up policies for market transformation 39
As the S&L program was expanded, BEE took measures to standardise, codify and automate it. For 40
example, to process a high volume of applications for labels efficiently, an online application portal 41
with objective and transparent certification criteria was created. This gave certainty to the 42
manufacturers, enabling diversity and faster diffusion of energy-efficient appliances. Thus by 2019, the 43
program expanded to cover thousands of products across 23 appliance types (BEE 2020). 44
ACCEPTED VERSION
SUBJECT TO FIN
AL EDITS

Final Government Distribution Chapter 16 IPCC AR6 WGIII
Do Not Cite, Quote or Distribute 16-35 Total pages: 141
Besides issuing labels, the enforcement of standards also needed to be scaled up efficiently. BEE 1
developed protocols for randomly sampling appliances for testing. Manufacturers were given a fixed 2
period to rectify products that did not meet the standards, failing which they would be penalised and 3
the test results would be made public. 4
END BOX 16.2 HERE 5
6
16.3.3 Indicators for technological innovation 7
Assessing the state of technological innovation helps understanding how current efforts and policies are 8
doing in relation to stated objectives and how we might design policies in order to do better. 9
Traditionally, input measures such as RD&D investments and output measures such as scientific 10
publication and patents were used to characterise innovation activities (Freeman and Soete 2009), partly 11
because of the successes of specialised R&D efforts (Freeman 1995a), the predominant linear model of 12
innovation, and because such measures can (relatively) easily obtained and compared. In the realm of 13
energy-related innovation, RD&D investments remains the single most-used indicator to measure inputs 14
into the innovation process (Box 16.3). Patents counts are a widely used indicator of the outputs of the 15
innovation process, especially because they are detailed enough to provide information on specific 16
adaptation and mitigation technologies. Mitigation and adaptation technologies have their own 17
classification (Y02) with the European Patent Office (EPO) (Veefkind et al. 2012; Angelucci et al. 18
2018), which can be complemented with keyword search and manual inspection (Persoon et al. 2020; 19
Surana et al. 2020b). However, using energy-related patents as indicator of innovative activities is 20
complicated by several issues (Haščič and Migotto 2015; Jaffe and de Rassenfosse 2017; de 21
Rassenfosse et al. 2013), including the fact that the scope of what are to be considered climate mitigation 22
inventions is not always clear or straightforward. 23
Conversely, private energy R&D investments and investments by financing firms cannot be precisely 24
assessed for a number of reasons, including limited reporting and the difficulty of singling out energy-25
related investments. This inability to precisely quantify private investments in energy R&D leads to a 26
patchy understanding of the energy innovation system, and how private energy R&D investments 27
responds to public energy R&D investments. Overall, evidence shows that some of the industrial sectors 28
that are important for meeting climate goals (electricity, agriculture and forestry, mining, oil and gas, 29
and other energy-intensive industrial sectors) are investing relatively small fractions of sales on R&D 30
(medium evidence, high agreement) (European Commission 2015; National Science Board 2018; 31
American Energy Innovation Council 2017; Jasmab and Pollitt 2005; Sanyal and Cohen 2009; Jamasb 32
and Pollitt 2008; Gaddy et al. 2017). 33
Financing firms also play an important role in the energy innovation process, but data availability is 34
also limited. The venture capital (VC) financing model, used to overcome the “valley of death” in the 35
biotech and IT space (Frank et al. 1996), has not been as suitable for hardware start-ups in the energy 36
space: for example, the percentage of exit outcomes in clean-tech start-ups was almost half of that in 37
medical start-ups and less than a third of software investments (Gaddy et al. 2017). The current VC 38
model and other private finance do not sufficiently cover the need to demonstrate energy technologies 39
at scale (Mazzucato 2013; Anadón 2012; Nemet et al. 2018). This greater difficulty in reaching the 40
market compared to other sectors may have contributed to a reduction in private equity and venture 41
capital finance for renewable energy technologies after the boom of the late 2000s (Frankfurt School-42
UNEP Centre/BNEF 2019). 43
START BOX 16.3 HERE 44
Box 16.3 Investments in public energy R&D 45
ACCEPTED VERSION
SUBJECT TO FIN
AL EDITS

Final Government Distribution Chapter 16 IPCC AR6 WGIII
Do Not Cite, Quote or Distribute 16-36 Total pages: 141
Public energy R&D investments are a crucial driver of energy technology innovation (Sections 16.2.1.1, 1
16.4.1). Box 16.3, Figure 1 shows the time profile of energy-related RD&D budgets in OECD countries 2
as well as some key events which coincided with developments of spending (IEA 2019). Such data on 3
other countries, in particular developing countries, are not available, although recent evidence suggests 4
that expenditures are increasing there (IEA 2020c). The IEA collected partial data from China and India 5
in the context of Mission Innovation, but this is available only starting in 2014 and thus not included in 6
the Figure. 7
The figure illustrates two points. First, energy-related RD&D has risen slowly in the last 20 years, and 8
is now reaching levels comparable with the peak of energy RD&D investments following the two oil 9
crises. Second, over time there has been a reorientation of the portfolio of funded energy technologies 10
away from nuclear energy. In 2019, around 80% of all public energy RD&D spending was on low-11
emission technologies – energy efficiency, CCUS, renewables, nuclear, hydrogen, energy storage and 12
cross-cutting issues such as smart grids. A more detailed discussion of the time profile of RD&D 13
spending in IEA countries, including as a share of GDP, are available in (IEA 2020b). 14
15
Box 16.3, Figure 1 Fraction of public energy RD&D spending by technology over time for IEA (largely 16
OECD) countries between 1974 and 2018. 17
Sources: IEA RD&D Database, 2019 (IEA 2019). (extracted on November 11, 2020). 18
END BOX 16.3 HERE 19
Quantitative indicators such as energy-related RD&D spending are insufficient for the assessment of 20
innovation systems (David and Foray 1995): they only provide a partial view into innovation activities, 21
and one that is potentially misleading (Freeman and Soete 2009). Qualitative indicators measuring the 22
more intangible aspects of the innovation process and system are crucial to fully understand the 23
innovation dynamics in a climate or energy technologies or sectors (Gallagher et al. 2006), including in 24
relation to adopting an adaptive learning strategy and supporting learning through demonstration 25
projects (Chan et al. 2017). 26
In Table 16.7, both quantitative and qualitative indicators for systemic innovation are outlined, using 27
clean energy innovation as an illustrative example and drawing on a broad literature base, taking into 28
account both the input-output-outcome classification and its variations (Hu et al. 2018; Freeman and 29
Soete 1997; Sagar and Holdren 2002), combined with the functions of technological innovation systems 30
0
5,000
10,000
15,000
20,000
25,000
1974
1976
1978
1980
1982
1984
1986
1988
1990
1992
1994
1996
1998
2000
2002
2004
2006
2008
2010
2012
2014
2016
2018
USD
(2019 p
rice
s an
d e
xch
ange
rat
es)
Public energy RD&D investments for IEA countries
Unallocated
Other cross-cuttingtechnologies/researchOther power and storagetechnologiesHydrogen and fuel cells
Nuclear
Renewables
Fossil fuels
ACCEPTED VERSION
SUBJECT TO FIN
AL EDITS

Final Government Distribution Chapter 16 IPCC AR6 WGIII
Do Not Cite, Quote or Distribute 16-37 Total pages: 141
(Miremadi et al. 2018), while also being cognizant of the specific role of key actors and institutions 1
(Gallagher et al. 2012). A specific assessment of innovation may focus on part of such a list of 2
indicators, depending on what aspect of innovation is being studied, whether the analysis takes a more 3
or less systemic perspective, and the specific technology and geography considered. Similarly, 4
innovation policies may be designed to specifically boost only some of these aspects, depending 5
whether a given country/region is committed to strengthen a given technology or phase. 6
The systemic approach to innovation and transition dynamics (see also Cross-Chapter Box 12 in this 7
chapter) has advanced our understanding of the complexity of the innovation process, pointing to the 8
importance of assessing the efficiency and effectiveness in producing, diffusing and exploiting 9
knowledge (Lundvall 1992), including how the existing stock of knowledge may be recombined and 10
used for new applications (David and Foray 1995). There remains a crucial need for more relevant and 11
comprehensive approaches of assessing innovation (Freeman and Soete 2009; Dziallas and Blind 2019). 12
In the context of climate mitigation, innovation is a means to an end; therefore, there is the need to 13
consider the processes by which the output of innovation (e.g., patents) are translated into real-world 14
outcomes (e.g., deployment of low-carbon technologies) (Freeman and Soete 1997; Sagar and Holdren 15
2002). Currently, a set of quantitative metrics that, collectively, can help get a picture of innovation in 16
a particular energy technology or set of energy technologies is not available. Also the understanding of 17
how to systematically use qualitative indicators to characterise the more intangible aspects of the energy 18
innovation system and to improve front-end innovation decisions is still lacking (Dziallas and Blind 19
2019). 20
21
ACCEPTED VERSION
SUBJECT TO FIN
AL EDITS

Final Government Draft Chapter 16 IPCC AR6 WGIII
Do Not Cite, Quote or Distribute 16-38 Total pages: 141
Table 16.7 Commonly used quantitative innovation metrics, organized by inputs, outputs and outcomes. Based on (Sagar and Holdren 2002; Gallagher et al. 2006; 1
Hekkert et al. 2007; Gallagher et al. 2012; Miremadi et al. 2018; Hu et al. 2018; Gallagher et al. 2011; Avelino et al. 2019; Gruebler et al. 2012) 2
Function Input indicators Output indicators Outcome indicators Actors Policies
Structural and
systemic
indicators
Knowledge
development
Higher education
investments Scientific publications Number of technologies
developed (proof-of-
concept/prototypes)
Governments Research programs
and strategies Well-defined
processes to
define research
priorities R&D investments Highly-cited publications
Private
corporations IPR policies
Number of researchers Patents Increase in number of
researchers Universities
International
technical norms
(e.g. standards) Stakeholder
involvement in
priority-setting R&D projects over
time
New product
configurations Learning rates
Higher education
policies
Knowledge
diffusion
R&D networks Citations to literature or
patents
Number of licensed
patents Governments
Development of
communication
centres
Accessibility to
exchange
programs Number of research
agreement
Public-private co-
publications
Number of technologies
transferred
Number of research
exchange programs Co-patenting
Knowledge-intensive
services exports
Private
corporations Facilitation of the
development of
networks
Strength of
linkage among
key stakeholders Number of scientific
conferences
Number of co-developed
products
Scientific
societies
International scientific co-
publications
Number of patent
applications by
foreigners
Universities Open-access
publication policies Participation to
framework
agreements IPR policies
Number of workshops
and conferences
Number of researchers
working internationally
International policy:
e.g. treaties, clean
development
mechanism
ICT access
Guidance of
search
Policy action plans
and long-term targets Level of media coverage Budget allocations Governments
Targets set by
government of
industry
Media strength
Shared strategies and
roadmaps
Scenarios and foresight
projects
Mission-oriented
innovation programs Interest groups Innovation policies ACCEPTED VERSION
SUBJECT TO FIN
AL EDITS

Final Government Draft Chapter 16 IPCC AR6 WGIII
Do Not Cite, Quote or Distribute 16-39 Total pages: 141
Articulation of interest
from lead customers
Credible political
support
Expectations of
markets/profits Media
Resource
mobilization
Access to finance
Number of green
projects/technologies
funded Employment in
knowledge-intensive
activities
Governments Financial resources
support
Graduate in STEMS
Share of domestic credit
granted to low-carbon
technology projects
Private firms
Development of
innovative financing
Gross expenditures on
R&D/total
expenditures
Employment in relevant
industries
International
agreements (e.g.
technology
agreements)
Domestic credit to
private sector
Share of domestic credit
granted to projects
developing
complementary
assets/infrastructure
Scale of innovative
activities
Private investors
(angel, venture
capital, private
equity)
Infrastructure
support
Number of researchers
in R&D per capita
Rate of growth of
dedicated investment Banks
Project/program
evaluation
Public energy R&D
expenditures/total
expenditures
Availability of
complementary assets
and infrastructure
Innovation policies
Expenditure on
education
Higher education
policies
Investment in
complementary assets
and/or infrastructure
(e.g. Charging
ACCEPTED VERSION
SUBJECT TO FIN
AL EDITS

Final Government Draft Chapter 16 IPCC AR6 WGIII
Do Not Cite, Quote or Distribute 16-40 Total pages: 141
infrastructure for EVs,
smart grids)
Venture capital on
deals
Entrepreneurial
activities
No. of new entrants SMEs introducing
product or process
innovation
Private firms Ease of starting a
business
% of clean energy
start-ups/incumbents Government Risk-capital policies
access to finance for
clean-tech start up
Market introduction of
new technological
products
Risk-capital
providers
Start-up support
programs
Philanthropies Incubator programs
Start-up support
services
Number of new
businesses
Experimental application
projects
Creative goods exports
Market formation
Public market support
High-tech imports
Market penetration of new
technologies
Increase in installed
capacity
No of niche markets
Number of technologies
commercialized
Environmental
performance
Level of environmental
impact on society
Renewable energy jobs
Renewable energy
production
Trade of energy
technology and
equipment
High-tech exports
Private firms
Governments
institutions
regulating trade,
finance,
investment,
environment,
development,
security, and
health issues
Environmental and
Energy Regulation
Fiscal and financial
incentives
Cleantech-friendly
policy processes
Transparency
Specific tax regimes
Resource
endowments
Attractiveness of
renewable energy
infrastructure
Coordination
across relevant
actors (e.g.,
renewable energy
producers, grid
operators, and
distribution
companies) ACCEPTED VERSION
SUBJECT TO FIN
AL EDITS
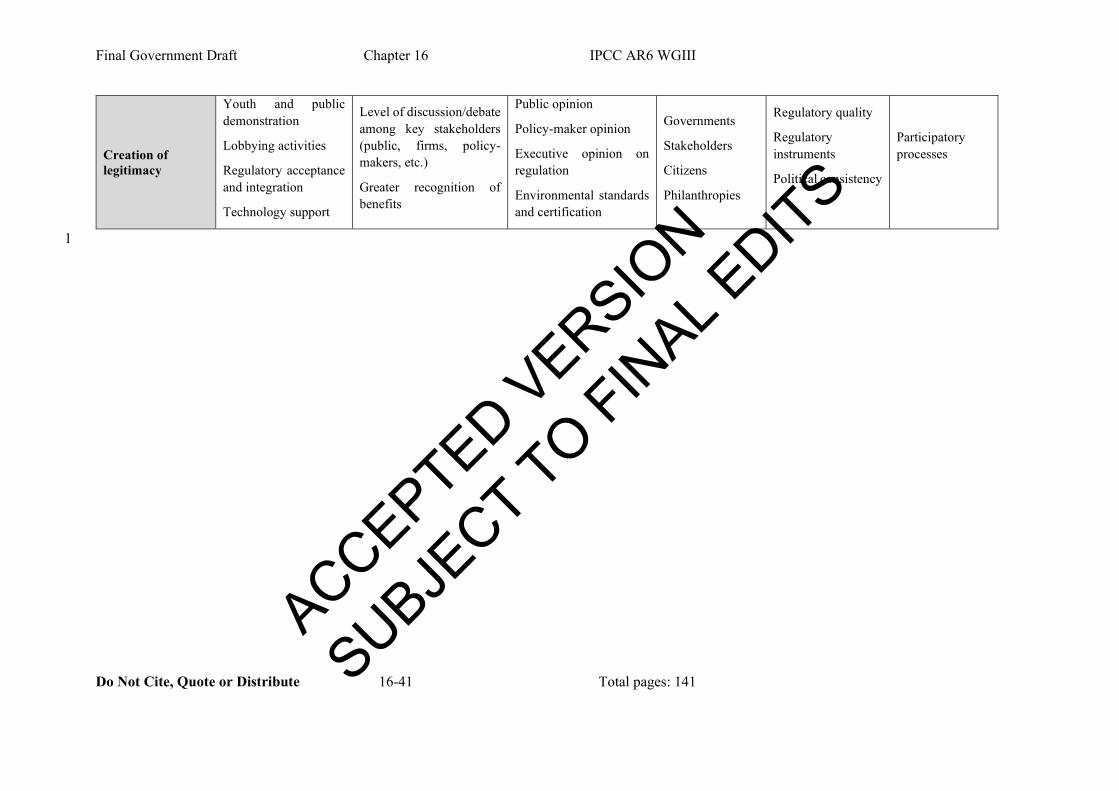
Final Government Draft Chapter 16 IPCC AR6 WGIII
Do Not Cite, Quote or Distribute 16-41 Total pages: 141
Creation of
legitimacy
Youth and public
demonstration
Lobbying activities
Regulatory acceptance
and integration
Technology support
Level of discussion/debate
among key stakeholders
(public, firms, policy-
makers, etc.)
Greater recognition of
benefits
Public opinion
Policy-maker opinion
Executive opinion on
regulation
Environmental standards
and certification
Governments
Stakeholders
Citizens
Philanthropies
Regulatory quality
Regulatory
instruments
Political consistency
Participatory
processes
1
ACCEPTED VERSION
SUBJECT TO FIN
AL EDITS

Final Government Draft Chapter 16 IPCC AR6 WGIII
Do Not Cite, Quote or Distribute 16-42 Total pages: 141
16.3.4 Emerging policy perspectives on systemic transformations 1
Because of the multiple market, government, system, and other failures that are associated with the 2
energy system, a range of policy interventions are usually required to enable the development and 3
introduction of new technologies in the market (Twomey 2012; Jaffe et al. 2005; Bürer and 4
Wüstenhagen 2009; Veugelers 2012; Negro et al. 2012; Weber and Rohracher 2012) and used in what 5
is termed as policy mixes (Rogge and Reichardt 2016; Rogge et al. 2020; Edmondson et al. 2020, 2019) 6
. Empirical research shows that when in the energy and environment space new technologies were 7
developed and introduced in the market, it was usually at least partly as a result of a range of policies 8
that shaped the socio-technical system (Nemet 2019a; Bunn et al. 2014; Rogge and Reichardt 2016; 9
Bergek et al. 2015) (robust evidence, high agreement). An example of this systemic and dynamic nature 10
of policies is the 70-year innovation journey of solar PV, covering multiple countries, which is reviewed 11
in Box 16.4. 12
13
START BOX 16.4 HERE 14
Box 16.4 Sources of cost reductions in solar photovoltaics 15
No single country persisted in developing solar PV. Five countries each made a distinct 16
contribution. Each leader relinquished its lead. The free flow of ideas, people, machines, finance, 17
and products across countries explains the success of solar photovoltaics (PV). Barriers to 18
knowledge flow delay innovation. 19
Solar PV has attracted interest for decades, and until recently was seen as an intriguing novelty, serving 20
a niche, but widely dismissed as a serious answer to climate change and other social problems associated 21
with energy use. Since AR5, PV has become a substantial global industry—a truly disruptive 22
technology that has generated trade disputes among superpowers, threatened the solvency of large 23
energy companies, and prompted reconsideration of electric utility regulation rooted in the 1930s. More 24
favourably, its continually falling costs and rapid adoption are improving air quality and facilitating 25
climate change mitigation. PV is now so inexpensive that it is important in an expanding set of countries. 26
In 2020, 41 countries, in 6 continents, had installed at least 1GW of solar each (IRENA 2020a). 27
The cost of generating electricity from solar PV is now lower in sunny locations than running existing 28
fossil fuel power plants (Chapter 6) (IEA 2020c). Prices in 2020 were below where even the most 29
optimistic experts expected they would be in 2030. 30
The costs of solar PV modules have fallen by more than a factor of 10,000 since they were first 31
commercialised in 1957. This four orders of magnitude cost reduction from the first commercial 32
application in 1958 until 2018 can be summarised as the result of distinct contributions by the US, 33
Japan, Germany, Australia, and China—in that sequence (Green 2019; Nemet 2019c). As shown in Box 34
16.4 Figure 1, PV improved as the result of: 35
1) Scientific contributions in the 1800s and early 1900s, in Europe and the US, that provided a 36
fundamental understanding of the ways that light interacts with molecular structures, leading to the 37
development of the p-n junction to separate electrons and holes (Einstein 1905; Ohl 1941); 38
2) A breakthrough at a corporate laboratory in the US in 1954 that made a commercially available PV 39
device available and led to the first substantial orders, by the US Navy in 1957 (Gertner 2013; Ohl 40
1946); 41
3) A government R&D and public procurement effort in the 1970s in the US, that entrained skilled 42
scientists and engineers into the effort and stimulated the first commercial production lines (Laird 43
2001; Christensen 1985; Blieden 1999); 44
ACCEPTED VERSION
SUBJECT TO FIN
AL EDITS

Final Government Draft Chapter 16 IPCC AR6 WGIII
Do Not Cite, Quote or Distribute 16-43 Total pages: 141
4) Japanese electronic conglomerates, with experience in semiconductors, serving niche markets in the 1
1980s and in 1994 launching the world’s first major rooftop subsidy program, with a declining rebate 2
schedule and demonstrating there was substantial consumer demand for PV (Kimura and Suzuki 3
2006); 4
5) Germany passing a feed-in tariff in 2000 that quadrupled the market for PV catalysing development 5
of PV-specific production equipment that automated and scaled PV manufacturing (RESA 2001; 6
Lauber and Jacobsson 2016); 7
6) Chinese entrepreneurs, almost all trained in Australia and using Australian-invented passivated 8
emitter rear cell technology, building supply chains and factories of gigawatt scale in the 2000s. 9
China became the world’s leading installer of PV from 2013 onward (Helveston and Nahm 2019; 10
Quitzow 2015). 11
7) A cohort of adopters with high willingness to pay, accessing information from neighbours, and 12
installer firms that learned from their installation experience, as well as that of their competitors to 13
lower soft costs (Gillingham et al. 2016; Ardani and Margolis 2015). 14
15
16
Box 16.4, Figure 1 Milestones in the development of low-cost solar photovoltaics (Nemet 2019c) 17
As this evolution makes clear, no individual country persisted in leading the technology and every world 18
leading firm lost its lead within a few years (Green 2019). Solar followed an overlapping but sequential 19
process of technology creation, market creation and cost reductions (comparable to emergence, early 20
adoption, diffusion and stabilisation in Cross-Chapter Box 12 in this chapter). In the technology creation 21
phase examples of central processes include flows of knowledge from one person to another, between 22
firms, and between countries as well as US and Japanese R&D funding in the 1970s and early 1980s. 23
During market creation, PVs modular scale allowed it to serve a variety of niche markets from satellites 24
in the 1950s to toys in the 1980s, when Germany transformed the industry from niche to mass market 25
with its subsidy program that began in 2000 and became important for PV in 2004. The dramatic 26
increase in size combined with its 20-year guaranteed contracts reduced risk for investors and created 27
confidence in PVs long term growth. Supportive policies also emerged outside Germany, in Spain, Italy, 28
California, and China, which spread the risk even as national policy support was more volatile. Rapid 29
and deep cost reductions were made possible by learning-by-doing in the process of operating, 30
optimising, and combining production equipment; investing and improving each manufacturing line to 31
gradually scale up to massive sizes and incremental improvements in the PV devices themselves. 32
Central to PV development has been its modularity, which provided two distinct advantages: access to 33
niche markets, and iterative improvement. Solar has been deployed as a commercial technology across 34
9 orders of magnitude: from a 1W cell in a calculator to a 1GW plant in the Egyptian desert, and almost 35
every scale in between. This modular scale enabled PV to serve a sequence of policy-independent niche 36
markets (such as satellites and telecom applications), which generally increased in size and decreased 37
ACCEPTED VERSION
SUBJECT TO FIN
AL EDITS
Final Government Draft Chapter 16 IPCC AR6 WGIII
Do Not Cite, Quote or Distribute 16-44 Total pages: 141
in willingness to pay, in line with the technology cost reductions. This modular scale also enabled a 1
large number of iterations, such that in 2020 over three billion solar panels have been produced. 2
Compared to, for instance, approximately 1000 nuclear reactors that were ever constructed, a million 3
times more opportunities for learning-by-doing were available to solar PV: to make incremental 4
improvements, to introduce new manufacturing equipment, to optimise that equipment, and to learn 5
from failures. More generally, recent work has point to the benefits of modularity in the speed of 6
adoption (Wilson et al. 2020) and learning rates (Sweerts et al. 2020). 7
While many technologies do not fit into the solar model, some, including micro nuclear reactors and 8
direct air capture, also have modular characteristics that make them suitable for following solar’s path 9
and benefit from solar’s drivers. However, PV took solar 60 years to become cheap, which is too slow 10
for addressing climate change if a technology is now still at the lab scale. A challenge in learning from 11
the solar model is therefore to how to use public policy to speed up innovation over much shorter time 12
frames, e.g. 15 or less years. 13
END BOX 16.4 HERE 14
15
There are many definitions of policy mixes from various disciplines (Rogge et al. 2017), including 16
environmental economics (Lehmann 2012), policy studies (Kern and Howlett 2009) and innovation 17
studies. Generally speaking, a policy mix can be characterised by a combination of building blocks, 18
namely elements, processes and characteristics, which can be specified using different dimensions 19
(Rogge and Reichardt 2016). Elements include (i) the policy strategy with its objectives and principal 20
plans and (ii) the mix of policy instruments, and (iii) instrument design. The content of these elements 21
is the result of policy processes. Both elements and processes can be described by their characteristics 22
in terms of the consistency of the elements, the coherence of the processes, and the credibility and 23
comprehensiveness of the policy mix in different policy, governance, geography and temporal context 24
(Rogge and Reichardt 2016). Other aspects in the evaluation of policy mixes include framework 25
conditions, the type of policy instrument and the lower level of policy granularity, namely design 26
elements or design features (del Río 2014; del Río and Cerdá 2017). In addition, many have argued the 27
need to craft policies that affect different actors in the transition, some supporting and some 28
‘destabilising’ (see e.g. Kivimaa and Kern (2016) and Geels (2002)). 29
Learning from the innovation systems literature, some of the recent policy focus is not only directed on 30
innovation policies that can optimise the innovation system to improve economic competitiveness and 31
growth but also policies that can induce strategic directionality and guide processes of transformative 32
changes towards desired societal objectives (Mitcham 2003; Steneck 2006). Therefore, the aim is to 33
connect innovation policy with societal challenges and transformative changes through engagement 34
with a variety of actors and ideas and incorporating equity, nowadays often referred to as a just transition 35
(Newell and Mulvaney 2013; Swilling et al. 2016; Heffron and McCauley 2018; Jasanoff 2018) (see 36
Chapter 1 and Chapter 17). This new policy paradigm is opening up a new discursive space, shapes 37
policy outcomes, and is giving rise to the emerging idea of transformative innovation policy (Diercks 38
et al. 2019; Fagerberg 2018). 39
Transformative innovation policy has a broader coverage of the innovation process with a much wider 40
participation of actors, activities and modes of innovation. It is often expressed as socio-technical 41
transitions (Elzen et al. 2004; Turnheim and Sovacool 2020) or societal transformations (Scoones 2015; 42
Roberts et al. 2018). Transformative innovation policy encompasses different ideas and concepts that 43
aim to address the societal challenges involving a variety of discussions including social innovation 44
(Mulgan 2012), complex adaptive systems (Gunderson and Holling 2002), eco-innovation (Kemp 2011) 45
and framework for responsible innovation (Stilgoe et al. 2013), value-sensitive design (Friedman and 46
Hendry 2019) and social-technical integration (Fisher et al. 2006). 47
ACCEPTED VERSION
SUBJECT TO FIN
AL EDITS

Final Government Draft Chapter 16 IPCC AR6 WGIII
Do Not Cite, Quote or Distribute 16-45 Total pages: 141
16.4 Innovation policies and institutions 1
Building on the frameworks for identifying market failures (Section 16.2) and systemic failures (Section 2
16.3) in the innovation system for climate-related technologies, Section 16.4 proceeds as follows. First, 3
it considers some of the policy instruments introduced in Chapter 13 that are particularly relevant for 4
the pace and direction of innovation in technologies for climate change mitigation and adaptation. 5
Second, it explains why governments put in place policies to promote innovation in climate related 6
technologies. Third, it takes stock of the overall empirical and theoretical evidence regarding the 7
relationship between policy instruments with a direct and an indirect impact on innovation outcomes 8
(including intellectual property regimes) and also other outcomes (competitiveness and distributional 9
outcomes). Fourth, it assesses the evidence on the impact of trade-related policies and of sub-national 10
policies aiming to develop cleantech industrial clusters. 11
This section focuses on innovation policies and institutions which are implemented at the national level. 12
Whenever relevant, this section highlights examples of policies or initiatives that delve more deeply 13
into the main high-level sectors: power, transport, industry, buildings, and AFOLU. Whenever possible, 14
this section also discusses issues in policy selection, design, and implementation that have been 15
identified as more relevant in developing countries and emerging economies. 16
Overall, this section shows that national and subnational policies and institutions are one of the main 17
factors determining the redirection and acceleration of technological innovation and low-emission 18
technological change (Åhman et al. 2017; Rogge and Reichardt 2016; Anadon et al. 2016b; Anadón et 19
al. 2017; Roberts et al. 2018) (robust evidence, high agreement). Both technology push (e.g., scientific 20
training, R&D) and demand pull (e.g., economic and fiscal support and regulatory policy instruments), 21
as well as instruments promoting knowledge flows and especially research-firm technology transfer, 22
can be part of the mix (robust evidence, medium agreement) (see also Sections 16.2 and 16.3). 23
Public R&D investments in energy and climate-related technologies have a positive impact on 24
innovation outcomes (medium evidence, high agreement). The evidence on procurement is generally 25
positive but limited. The record economic policy instruments that can be classified as market pull 26
instruments when it comes to the competitiveness outcome (at least in the short term) is more mixed. 27
The review of the literature in this section shows that market pull policy instruments had positive but 28
also some negative impacts on outcomes in some instances on some aspects of competitiveness and 29
distributional outcomes (medium evidence, medium agreement) (Peñasco et al. 2021). For several of 30
them, carbon taxes or feed-in tariffs for example, the evidence of a positive impact on innovation is 31
more consistent than the others. Evidence suggests that complementary policies or improved policy 32
design can mitigate such short-term negative distributional impacts. 33
34
16.4.1 Overview of policy instruments for climate technology innovation 35
Government policies can influence changes in technologies, as well as changes to the systems they 36
support (Somanathan et al. 2014) (see Chapter 13 and Sections 16.2 and 16.3). 37
Technology-push policy instruments stimulate innovation by increasing the supply of new knowledge 38
through funding and performing research; increasing the supply of trained scientists and engineers 39
which contribute to knowledge-generation and provide technological opportunities, which private firms 40
can decide to commercialise (Mowery and Rosenberg 1979; Anadon and Holdren 2009; Nemet 2009b; 41
Mazzucato 2013). 42
Governments can also stimulate technological change through demand-pull (or: market-pull) 43
instruments which support market creation or expansion and technology transfer and thus promoting 44
learning by doing, economies of scale, and automation (Section 16.2). Demand-pull policy instruments 45
ACCEPTED VERSION
SUBJECT TO FIN
AL EDITS

Final Government Draft Chapter 16 IPCC AR6 WGIII
Do Not Cite, Quote or Distribute 16-46 Total pages: 141
include regulation, carbon prices, subsidies that reduce the cost of adoption, public procurement, and 1
intellectual property regulation. Typically, technology push is especially important for early-stage 2
technologies, characterised by higher uncertainty and lower appropriability (see Section 16.2); demand-3
pull instruments become more relevant in the later stages of the innovation process (Section 16.2) 4
(Mowery and Rosenberg 1979; Anadon and Holdren 2009; Nemet 2009b). 5
The second column of Table 16.8 summarises the set of policies shaping broader climate outcomes over 6
the past few decades in many countries outlined in Chapter 13 Section 13.6, which groups them into 7
economic and financial, regulatory, and soft instruments. Other policies, such as monetary, banking and 8
trade policies, for instance, can also shape innovation but most government action to shape energy has 9
not focussed on them. As Table 16.8 shows, this section discusses the set of policy instruments on 10
innovation outcomes, or a subset of the ‘Transformative Potential’ criterion presented in Chapter 13, 11
and thus complements the more general discussion presented there. Table 16.8 specifically prioritizes 12
the impact of the subset of policy instruments on innovation outcomes for which evidence is available. 13
This focus is complemented by a discussion of the impact of the same policy instruments on 14
competitiveness (a subcomponent of the economic effectiveness evaluation criterion) and on 15
distributional outcomes. Many of the policy instrument types listed in Table 16.8 have been 16
implemented or proposed to address different types of market or systemic failures or bottlenecks 17
described in Section 16.2 and Section 16.3 (OECD 2011a). 18
19
Table 16.8 Overview of policy instrument types covered in Chapter 13 and their correspondence to the 20
subset of policy instrument types reviewed in Chapter 16 with a focus on innovation outcomes. 21
High- level
categorisation
Lower level policy
instrument type in
Chapter 13
Policy instrument types reviewed in Section 16.5 (for
definitions see Peñasco et al (2021))
Economic or
financial policy
instrument types
R&D investments R&D investments (including demonstration) (see Box 16.4
in Section 16.4)
Subsidies for mitigation Feed in tariffs or premia (set administratively)
Energy auctions
Other public financing options (public investment banks,
loans, loan guarantees)
Emissions trading schemes Emissions trading scheme
Carbon taxes Taxes/tax relief (including carbon taxes, energy taxes and
congestion taxes)
Government provision Government provision (focus on innovation procurement)
Removing fossil fuel
subsidies
Not covered
Border carbon adjustments Not covered
Offsets Not covered
Regulatory policy
instrument types
Performance standards
(including with tradeable
credits)
Renewable obligations with tradeable green certificates
Efficiency obligations with tradeable white certificates
Clean energy or renewable portfolio standards (electricity)
Building codes (building efficiency codes)
Fuel efficiency standards
Appliance efficiency standards
ACCEPTED VERSION
SUBJECT TO FIN
AL EDITS

Final Government Draft Chapter 16 IPCC AR6 WGIII
Do Not Cite, Quote or Distribute 16-47 Total pages: 141
Technology standards Not covered
Soft policy
instruments
Divestment and disclosure Not covered
Voluntary agreements
(public voluntary programs
& negotiated agreements)
Voluntary agreements
Energy labels
Section 16.3 characterized technological innovation as a systemic, non-linear and dynamic process. 1
Figure 16.1 below presents a stylized (and necessarily incomplete view) connecting the innovation 2
process stages presented in Section 16.2, some of the key the mechanisms in technology innovation 3
systems, and some of the decarbonisation policy instruments that have been assessed in terms of their 4
impact on technological innovation outcomes in Section 16.4.4. As noted in the caption and discussed 5
in Section16.4.4, regulatory policy instruments also shape the early stages of technology development. 6
7
8 Figure 16.1 Technology innovation process and the (illustrative) and role of different public 9
policy instruments (on the right-hand side). Adapted from IEA (IEA 2020a). Note that, as 10
shown in section 16.4.4, demand pull instruments in the regulatory instrument category, for 11
instance, can also shape the early stages of the innovation process. Their position on the latter 12
stages is highlighted in this figure just because typically these instruments have been introduced 13
in latter stages of the development of the technology. 14
15
16.4.2 The drivers and politics of national policies for climate change mitigation and 16
adaptation 17
Governments around the world implement innovation policies in the energy and climate space with the 18
aim of simultaneously advancing environmental, industrial policy (or competitiveness), and security 19
goals (Surana and Anadon 2015; Meckling et al. 2017; Matsuo and Schmidt 2019; Anadón 2012; 20
Peñasco et al. 2021) (medium evidence, medium agreement). Co-benefits of policies shaping 21
technological innovation in climate-related technologies, including competitiveness, health, and 22
improved distributional impacts can be drivers of climate mitigation policy in the innovation sphere 23
ACCEPTED VERSION
SUBJECT TO FIN
AL EDITS

Final Government Draft Chapter 16 IPCC AR6 WGIII
Do Not Cite, Quote or Distribute 16-48 Total pages: 141
(Deng et al. 2018a; Stokes and Warshaw 2017; Probst et al. 2020). This was the case for climate and 1
air pollution policies with local content requirements for different types of renewable energy projects, 2
for instance. in places including China (Lewis 2014; Qiu and Anadon 2012), India (Behuria 2020), 3
South Africa (Kuntze and Moerenhout 2012), and Canada (Genest 2014) (robust evidence, medium 4
agreement). 5
The emergence of industries and support groups can lead to more sustained support for innovation 6
policies (Schmid et al. 2020; Stokes and Breetz 2018; Meckling 2019; Meckling and Nahm 2019; 7
Meckling et al. 2015a; Schmidt and Sewerin 2017a). Conversely, policies shaping technology 8
innovation contribute to the creation and evolution of different stakeholder groups (robust evidence, 9
high agreement). Most of the literature on the role of the politics and interest groups has focused on 10
renewable energy technologies although there is some work on heating in buildings (e.g. Wesche et al. 11
2019). 12
As novel technologies become cost-competitive, opposition of incumbents usually grows, as well as the 13
dangers of lock-in that can be posed by the new winner. Addressing this involves adapting policy 14
(robust evidence, high agreement). 15
Three phases of politics in the development of policies to meet climate and industrial objectives can be 16
identified, at the top, the middle and the bottom of the experience curve (Breetz et al. 2018) (see also 17
Figure 16.1 above, and Geels (2002)). In the first phase of ‘niche market diffusion’, the politics of more 18
sustained support for a technology or set of technologies become possible after a group of economic 19
winners and ‘clean energy constituencies’ are created (Meckling et al. 2015a). When technologies grow 20
out of the niche (second phase), they pose a more serious competition to incumbents who may become 21
more vocal opponents of additional support for innovation in the competing technologies (Stokes 2016; 22
Geels 2014a). In a third phase, path-dependence in policymaking and lock-in in institutions need to 23
change to accommodate new infrastructure, the integration of technologies, the emergence of 24
complementary technologies and of new regulatory regimes (Aklin and Urpelainen 2013; Levin et al. 25
2012). 26
27
16.4.3 Indicators to assess the innovation, competitiveness and distributional outcomes 28
of policy instruments 29
If policy instruments are created to (at least partly) shape innovation for systemic transitions to a zero-30
carbon future, they also need to be evaluated on their impact on the whole socio-technical system (Neij 31
and Åstrand 2006) and a wide range of goals, including distributional impacts and competitiveness and 32
jobs (Stern 2007; Peñasco et al. 2021). Given this and the current policy focus on green recovery and 33
green industrial policy, although we primarily focus on innovation outcomes, we assess also impacts 34
on competitiveness and equity. Table 16.9 lists the selected set of indicators used to assess the impact 35
of the policy instrument types covered in right hand side column in Table 16.8. The table does not 36
include technology diffusion or deployment because these are covered in the technological effectiveness 37
evaluation criterion in Chapter 13. As noted in section 16.2, it is very difficult to measure or fully 38
understand innovation with one or even several indicators. In addition, all indicators have strengths and 39
weaknesses and may be more relevant in some countries and sectors than in others. The literature 40
assessing the impact of different policy instruments on innovation often covers just one of the various 41
indicators listed in the second column of Table 16.9. 42
43
Table 16.9 Outcomes (first row) and indicators (second row) to evaluate the impact of policies shaping 44
innovation to foster carbon neutral economies. 45
ACCEPTED VERSION
SUBJECT TO FIN
AL EDITS

Final Government Draft Chapter 16 IPCC AR6 WGIII
Do Not Cite, Quote or Distribute 16-49 Total pages: 141
Sources: Innovation outcomes indicators are sourced from Del Rio and Cerdá (2014), and Peñasco et al (2021) 1
Grubb et al (2021); the indicators under the competitiveness and distributional effects criteria are sourced from 2
Peñasco et al (2021) 3
Policy Instrument
Outcomes
Innovation
(part of Chapter 13
‘Transformative
potential’ evaluation
criterion)
Competitiveness
(part of Chapter 13
‘Economic effectiveness’
evaluation criterion)
Distributional impacts
(defined in the same way
as in Chapter13)
Examples of indicators
used for each outcome
in the literature
R&D investments, cost
improvements, learning
rates, patents,
publications, reductions
in abatement costs,
energy efficiency
improvements, other
performance
characteristics, firms
reporting carbon saving
innovation
Industry creation, net job
creation, export of
renewable energy
technology equipment,
economic growth (GNP,
GDP), productivity,
other investments
Level and incidence of
support costs, change in
spending on electricity
as a % of total household
spending, participation
of different stakeholders,
international equity (e.g.,
tCO2-eq per capita),
unequal access between
large vs. small producers
or firms
4
16.4.4 Assessment of innovation and other impacts of innovation policy instruments 5
While it is very difficult to attribute a causal relationship between a particular policy instrument 6
implementation and different innovation indicators, given the complexity of the innovation system (see 7
Section 16.3) there is a large quantitative and qualitative literature aiming to identify such impact. 8
16.4.4.1 Assessment of the impact on innovation of technology push policy instruments: public 9
RD&D investments, other R&D incentives and public procurement 10
Economic and direct investment policy instrument types are typically associated with a direct focus on 11
technological innovation: R&D grants, R&D tax credits, prizes, national laboratories, technology 12
incubators (including support for business development, plans), novel direct funding instruments (e.g., 13
ARPA-E), and innovation procurement. 14
Public RD&D investments have been found to have a positive impact on different innovation in energy 15
and climate related technologies (robust evidence, high agreement), but the assessment relies almost 16
entirely on evidence from industrialised countries. Out of 17 publications focussing on this assessment, 17
only three found no relationship between R&D funding and innovation metrics (Peñasco et al. 2021; 18
Goldstein et al. 2020; Doblinger et al. 2019). Sixteen out of them used ex post quantitative methods and 19
one relied on theoretical ex ante assessment; only two of them included some non-industrialised 20
countries, with one being the theoretical analysis. The evidence available does not point to public R&D 21
funding for climate-related technologies crowding out private R&D (an important driver of innovation) 22
but instead crowding it in. Box 16.6 summarizes the evidence available of the impact of ARPA-E (a 23
public institution created in the United States in 2009 to allocate public R&D funding in energy) on 24
innovation and competitiveness outcomes. Another institution supporting energy R&D that is the 25
subject of much interest is the Fraunhofer Institute. 26
No evidence regarding the specific impact of R&D tax credits on climate mitigation or adaptation 27
technologies has been found, but it is worth noting that generally speaking, R&D tax credits are found 28
to incentivize innovation in firms in general, with an greater impact on small and medium firms (OECD 29
2020). This is consistent with the fact that most of the evidence on the positive impact of public R&D 30
support schemes covers small and medium firms (Howell 2017; Doblinger et al. 2019; Goldstein et al. 31
2020). Although there is a high level of agreement in the literature regarding the impact of R&D 32
ACCEPTED VERSION
SUBJECT TO FIN
AL EDITS

Final Government Draft Chapter 16 IPCC AR6 WGIII
Do Not Cite, Quote or Distribute 16-50 Total pages: 141
investments on innovation outcomes in climate-related technologies, it is important to note that this 1
evidence comes from industrialised countries. This does not mean that public R&D investments in 2
energy have been found to have no impact on developing countries innovation or competitiveness 3
outcomes, but rather that we were not able to find such studies focussing on developing countries. 4
Overall, public procurement has high potential to incentivise innovation in climate technologies, but 5
the evidence is mixed, particularly in developing countries (limited evidence, medium agreement). 6
Public procurement accounted for 13 % of gross domestic products in OECD in 2013 and much more 7
in some emerging and developing economies (Baron 2016). Its main goal is to acquire products or 8
services to improve public services, infrastructures and facilities and, in some cases, to also incentivize 9
innovation. It is important to implement several steps in the public procurement procedure to improve 10
transparency, minimise waste, fraud and corruption of public fund. These steps range from the 11
assessment of a need, issuance of a tender to the monitoring of delivery of the good or service. Box 16.5 12
outlines a public procurement program that was implemented in The Netherlands in 2005 with a focus 13
on green technologies. In spite of the fact that green procurement policies have been implemented, the 14
literature assessing the innovation impact of public procurement programs is relatively limited and 15
suggests either a positive impact or no impact (Peñasco et al. 2021; Alvarez and Rubio 2015; Fernández-16
Sastre and Montalvo-Quizhpi 2019; Baron 2016). The majority of cases where the impact is positive 17
are analyses of industrialised countries, while no impact emerges in the case of a developing country 18
(Ecuador). More empirical research is needed to understand the impact of public procurement, which 19
has the potential to support the achievement of other societal challenges (Edler and Georghiou 2007; 20
Henderson and Newell 2011; ICLEI 2018; Baron 2016) in both developing and developed countries. 21
22
START BOX 16.5 HERE 23
Box 16.5 Green Public Procurement in The Netherlands 24
In 2005, the Dutch national government acknowledged a move in the House of Representatives to utilise 25
their annual spending power to promote the market for sustainable goods and services as well as to play 26
as a role model. Hence, a policy for environmentally friendly procurement was developed and 27
implemented across the national, local and provincial governments. Subsequently, sustainable public 28
procurement has expanded into a multidimensional policy in the Netherlands, accommodating policies 29
on green public procurement, bio-based public procurement, international social criteria, social return 30
on investment, innovation-oriented public procurement and circular economy. 31
The Green Public Procurement (GPP) policy is targeted at minimising the negative impacts of 32
production and consumption on the nature environment (Melissen and Reinders 2012; Cerutti et al. 33
2016). It includes a wide range of environmental criteria for different product groups that public 34
organisations frequently procure such as office equipment, uniforms, road works and catering. There 35
are 45 product groups (Melissen and Reinders, 2012) and 6 product clusters part of the government’s 36
purchasing in terms of sustainability(PIANOo Expertisecentrum 2020). The six product clusters are: i) 37
Automation & telecommunications, ii) Energy, iii) Ground, road & hydraulic engineering, iv) Office 38
facilities and services, v) Office buildings, and vi) Transport (PIANOo Expertisecentrum 2020).The 39
GPP 2020 Tender Implementation Plan spells out the terms and conditions for making their green public 40
procurement. Some of these are confidential documents and are not shared online. Others are available 41
for download. The tender implementation plan for the Netherlands is available on 42
https://gpp2020.eu/low-carbon-tenders/open-tenders/. One of the important scenarios is that the public 43
procurers need the details of LCA analysis carried out in a tool called DuboCalc which calculates the 44
environmental impacts of the materials and methods of an infrastructural projects. GPP 2020 has 45
reported that three million tonnes of CO2 would be saved in the Netherlands alone if all Dutch public 46
authorities applied the national Sustainable Public Procurement Criteria. 47
ACCEPTED VERSION
SUBJECT TO FIN
AL EDITS

Final Government Draft Chapter 16 IPCC AR6 WGIII
Do Not Cite, Quote or Distribute 16-51 Total pages: 141
Research has been carried out to determine the prime mover for implementing Green Public 1
Procurement. An online survey of was administered among public procurement officers that subscribed 2
to the newsletters of two Dutch associations that provide advice and training to public procurers, 3
yielding a sample size of over 200 (Grandia and Voncken 2019). The first association is called NEVI 4
which is the only organisation in the Netherlands that offers certified procurement training programmes. 5
The second association is called PIANOo which is a public procurement expertise centre paid by the 6
Dutch national government for bringing together relevant information regarding public procurement 7
and providing public procurers with useful tools through their websites, workshops, meetings and 8
annual conferences. The data from the survey was then analysed using structural equations modelling 9
(SEM) and the results show that ability, motivation and opportunities affect the implementation of GPP. 10
Particularly, opportunity was found to affect green public procurement, innovation-oriented public 11
procurement and circular economy but not the other types of public procurement. 12
END BOX 16.5 HERE 13
14
16.4.4.2 Assessment of the impact on competitiveness of technology push policy instruments: public 15
RD&D investments, other R&D incentives and public procurement 16
Public R&D investments in the energy, renewables, environment space are generally associated with 17
positive impacts on industrial development or ‘competitiveness outcome’ (robust evidence, medium 18
agreement). In a number of cases negligible or negative impacts emerge (Peñasco et al. 2021; Goldstein 19
et al. 2020; Doblinger et al. 2019). The majority of these 15 analyses rely on ex post quantitative 20
methods, while only four use ex ante modelling approaches. Also, in this case, the vast majority of the 21
evidence is from industrialised countries. 22
There is limited and mixed evidence regarding the (positive or negative) impact of public procurement 23
for low-carbon or climate technologies and it emerges from developed countries (limited evidence, low 24
agreement). All of the four evaluations identified in the Peñasco et al (2021) review relied on qualitative 25
methods. One found a positive impact, another a negative impact and two others found no impact. All 26
of the studies covered European country experiences. 27
R&D and procurement policies have a positive impact on distributional outcomes (limited evidence, 28
high agreement). Peñasco et al (2021) identify three evaluations of the impact of RD&D funding on 29
distributional outcomes (two using quantitative methods and one ex ante theoretical methods) and one 30
of procurement on distributional outcomes (relying on qualitative analysis). 31
16.4.4.3 Emerging insights on different public R&D and demonstration funding schemes 32
The ability of a given R&D policy instrument to impact innovation and competitiveness depends to 33
some extent on policy design features (limited evidence, high agreement). As discussed in section 34
16.4.4.4, this is not unique to R&D funding. Most of these assessments use a limited number of 35
indicators (e.g., patents and publications and follow-on private financing, firm growth and survival, 36
respectively), focusses on the energy sector and on the US and other industrialised countries. 37
Extrapolating to emerging economies and low-income countries is difficult. There is no evidence on 38
the impact of different ways of allocating public energy R&D investments in the context of developing 39
countries. 40
Block funding, which tends to be more flexible, can lead to research that is more productive or novel, 41
but there are other factors that can affect the extent to which block funding can lead to more or less 42
novel outcomes (limited evidence, medium agreement). Research on national research laboratories, 43
which conduct at least 30% of all research in 68 countries around the world (Anadon et al. 2016a), are 44
a widespread mechanism to carry out public R&D and allocate funds, but assessments of their 45
performance is limited to developed countries. R&D priorities are also guided by institutions, and 46
ACCEPTED VERSION
SUBJECT TO FIN
AL EDITS

Final Government Draft Chapter 16 IPCC AR6 WGIII
Do Not Cite, Quote or Distribute 16-52 Total pages: 141
research focussed on general technology innovation policy finds that institutions often do not embody 1
the goals of the poor or marginalized (Anadon et al. 2016b). 2
In the case of the US Department of Energy, block funding that can be quickly allocated to novel l 3
projects (such as that allocated to National Labs as part of the Laboratory Directed Research and 4
Development—LDRD—funding) has been found to be associated with improved innovation indicators 5
(Anadon et al. 2016a). Research on Japan on R&D funding in general (not for climate-related 6
technologies) however, indicates that R&D funds allocated competitively result in higher novelty for 7
‘high status’ (the term used in the paper to refer to senior male researchers), while block funding was 8
associated with research of higher novelty for lower status researchers (e.g., junior female researchers) 9
(Wang et al. 2018). 10
11
START BOX 16.6 HERE 12
Box 16.6 ARPA-E a novel R&D funding allocation mechanism focussed on an energy mission 13
One approach for allocating public R&D funds in energy involves relying on active program managers 14
and having clear technology development missions that focus on high-risk high-reward areas and 15
projects. This approach can be exemplified by a relatively new energy R&D funding agency in the US, 16
the Advanced Research Projects Agency for Energy (ARPA-E). This agency was created in 2009 and 17
it was modelled on the experience of DARPA (a US government agency funding high risk high reward 18
research in defence-related areas (Bonvillian and Van Atta 2011; Bonvillian 2018; U.S. National 19
Academies of Sciences Engineering and Medicine 2017). DARPA program managers had a lot of 20
discretion for making decisions about funding projects, but since energy R&D funding is usually more 21
politically vulnerable than defence R&D funding, the ARPA-E novel involved program managers 22
requesting external review as an informational input (Azoulay et al. 2019). 23
Like DARPA, ARPA-E program managers use an ‘active management approach that involves 24
empowering program manages to make decisions about funding allocation, milestones and goals. 25
ARPA-E managers also differ from other R&D allocation mechanisms in that ARPA-E staff retained 26
some control on the funded projects after the allocation of the funds. As argued by (Azoulay et al. 2019), 27
even though this relative control over the project can result in a reduction in the flexibility of funded 28
researchers, some ‘exploration’ happens at the program manager level. 29
Research on ARPA-E also sheds light on how program managers make decisions about what projects 30
to fund: about the process of project selection. Program managers do not just follow the rankings of 31
peer reviewers (sometimes projects with very disparate rankings were funded) and in many cases 32
program managers reported using information from review comments instead of the rankings (Goldstein 33
and Kearney 2020). Azoulay et al. (2019) suggest that if expert disagreement is a useful proxy for 34
uncertainty in research, then the use of individual discretion in ARPA-E would result in a portfolio of 35
projects with a higher level of uncertainty, as defined by disagreement among reviewers. Moreover, 36
under the premise that uncertainty is a corollary to novelty, individual discretion is an antidote to novelty 37
bias in peer review. 38
While innovation is notoriously hard to track and, particularly for emerging technologies, it can take a 39
lot time to assess, early analysis has shown that this mission-orientation and more ‘actively managed’ 40
R&D funding program may yield greater innovation patenting outcomes than other US energy R&D 41
funding programs and a greater or similar rate of academic publications when compared to other public 42
funding agencies in energy in the US, ranging from the Office of Science, the more applied Office of 43
Energy Efficiency and Renewable Energy or the small grants office (Goldstein and Narayanamurti 44
2018; U.S. National Academies of Sciences Engineering and Medicine 2017). In addition research 45
analysing the first cohort of cleantech start-ups has found that start-ups supported by ARPA-E had more 46
ACCEPTED VERSION
SUBJECT TO FIN
AL EDITS

Final Government Draft Chapter 16 IPCC AR6 WGIII
Do Not Cite, Quote or Distribute 16-53 Total pages: 141
innovative outcomes when compared to those that had applied but not received funding, with others 1
that had not received any government support, and with others that had received other types of 2
government R&D support (Goldstein et al. 2020). Overall, the mission-oriented ARPA approach has 3
been successful in the United States when it comes to innovation outcomes. The extent to which it can 4
yield the same outcomes in other geographies with different innovation and financing environments 5
remains unknown. (limited evidence, high agreement). 6
END BOX 16.6 HERE 7
8
Public financing for R&D and research collaboration in the energy sector is important for small firms, 9
at least in industrialised countries, and it does not seem to crowd out private investment in R&D 10
(medium evidence, high agreement). Small US and UK firms accrue more patents and financing when 11
provided with cash incentives for R&D in the form of grants (Pless 2019; Howell 2017). US cleantech 12
start-ups which partner with government partners for joint technology development or licensing 13
partnerships accrue more patents and follow on financing (Doblinger et al. 2019). 14
Overall, the body of literature on public R&D funding design in energy and climate related technologies 15
provides some high-level guidance on how to make the most of these direct RD&D investments in 16
energy technologies in the climate change mitigation space, including: giving researchers and technical 17
experts autonomy and influence over funding decisions; incorporating technology transfer in research 18
organisations; focussing demonstration projects on learning; incentivising international collaboration 19
in energy research; adopting an adaptive learning strategy; and making funding stable and predictable 20
(Narayanamurti and Odumosu 2016; Narayanamurti et al. 2009; Chan et al. 2017) (medium evidence, 21
high agreement). 22
Without carefully designed public funding for demonstration efforts, often in a cost shared manner with 23
industry, the experimentation at larger scales needed for more novel technologies needed for climate 24
change mitigation may not take place. (medium evidence, high agreement). Government funding 25
specifically for technology demonstration projects, for RD&D (research, development and 26
demonstration) in energy technologies plays a crucial supporting role (Section 16.2.1). Governments 27
can facilitate knowledge spill-overs between firms, between countries, and between technologies (see 28
Section 16.2, Cohen et al (2002) and Baudry and Bonnet (2019)). 29
16.4.4.4 Assessment of the impact on innovation and on competitiveness and distributional 30
outcomes of market pull policy instruments 31
Demand pull policies such as tradeable green certificates, taxes, or auctions, are essential to support 32
scaling up efforts (Remer and Mattos 2003; Nahm and Steinfeld 2014; Wilson 2012). Just like for R&D 33
investments, research has indicated that effective demand pull needs to be credible, durable, and aligned 34
with other policies (Nemet et al. 2017) and that the effectiveness of different demand pull instruments 35
depends on policy design (del Río and Kiefer 2021). Historical analyses of the relative importance of 36
demand pull and technology push are clear; both are needed to provide robust incentives for investment 37
in innovation. Interactions between them are central as their combination enables innovators to connect 38
a technical opportunity with a market opportunity (Grubler and Wilson 2013; Freeman 1995b; 39
Jacobsson et al. 2004). It is important to note that these market pull policies are often put in place 40
primarily to meet security and/or environmental goals, although innovation and competitiveness are 41
sometimes also pursued explicitly. 42
43
Emission Trading Schemes 44
Overall evidence suggests that the emissions trading schemes, as currently designed, have not 45
significantly contributed to innovation outcomes (medium evidence, medium/high agreement). 46
ACCEPTED VERSION
SUBJECT TO FIN
AL EDITS
Final Government Draft Chapter 16 IPCC AR6 WGIII
Do Not Cite, Quote or Distribute 16-54 Total pages: 141
Penasco et al. (2021) review 20 evaluations: eight identified a positive impact (although in at least two 1
cases the paper indicated the impact was small or negligible), 11 no impact and one was associated with 2
a negative impact on innovation indicators. The studies that found no impact and the studies that found 3
some impact covered all three methods covered (quantitative ex post, qualitative and theoretical and ex 4
ante analysis). Another review focussed only on empirical studies (mainly quantitative but also 5
qualitative), covered a slightly longer period and identified 19 studies (15 using quantitative methods) 6
(Lilliestam et al. 2021). With a narrower set of indicators of innovation, they concluded there was very 7
little empirical evidence linking the emissions trading schemes studied to date and innovation 8
(Lilliestam et al. 2021). This review focussed mainly on papers evaluating the earlier stages of the 9
European Emissions Trading Scheme, which featured relatively low CO2 prices and covered a small set 10
of firms, showing that carbon pricing policy design is an important determinant of innovation outcomes. 11
Combining both reviews, there are a total of 27 individual studies, some of them providing mixed 12
evidence of impact, and 23 of them suggest there was no impact or (in a couple of cases) it was small. 13
It is important to note that some researchers note that, for particular subsectors and actors, emissions 14
trading schemes have had an impact on patenting trends (Calel and Dechezleprêtre 2016). Overall the 15
expectation is that higher prices and coverage would result in higher impacts and that, over time, the 16
impact on innovation would grow. 17
Carbon and environmental taxes 18
The impact of carbon taxes on innovation outcomes is more positive than that for ETS schemes but the 19
evidence is more limited (limited evidence, medium agreement). Assessments of their impact on 20
innovation metrics have been very limited, with only four studies (three quantitative and one ex ante). 21
Three of the studies found a positive impact of carbon taxes on innovation outcomes and one found no 22
impact (Peñasco et al. 2021). 23
Depending on the design (including the value and coverage of the tax), carbon taxes can either have 24
positive, negative or null impact on competitiveness and distributional outcomes (medium evidence, 25
medium agreement). The evidence on the impact of carbon taxes on competitiveness is significant (a 26
total of 27 evaluations) and mixed, with six of them reporting some positive impacts, ten reporting no 27
impact, and 11 reporting negative impacts (so 59% were not associated with negative impacts). Most 28
of the evaluations reporting negative impacts were theoretical assessments, and only three ex post 29
quantitative analysis (Peñasco et al. 2021). 24 evaluations covered distributional impacts of carbon 30
taxes and other environmental taxes and the majority (15) found the existence of some negative 31
distributional impacts, six found positive impacts and three no distributional impacts. Differences in the 32
result of the assessments stem from the design of the taxes (Peñasco et al. 2021). It is important to note 33
that, once again, the evidence comes from industrialized countries and emerging economies. 34
Feed-in-Tariffs 35
Many factors affect the impacts of feed in tariffs on outcomes other than innovation (robust evidence, 36
high agreement). While FITs have been generally associated with positive innovation outcomes, some 37
of the differences found in the literature may arise from differences in the evaluation method (Peñasco 38
et al. 2021) or differences in policy design (e.g., the level and the rate of decrease of the tariff) 39
(Hoppmann et al. 2014), the policy mixes (Rogge et al. 2017), the technologies targeted and their stage 40
of development (Huenteler et al. 2016b), and the geographical and temporal context of where the policy 41
was put in place (Section 16.3). Research has also found that, particularly for less mature technologies, 42
a higher technology specificity in the design of FITs is associated with more innovation (Del Río 2012). 43
Feed-in-tariffs yield better results if they account for the specificities of the country; else, the technology 44
and the policy could result in negative distributional and (to a lesser extent) competitiveness impacts. 45
Meckling et al (2017) indicate that an ‘enduring challenge’ of technology-specific industrial policy such 46
as some feed-in-tariffs is to avoid locking in suboptimal clean technologies—a challenge which, among 47
other options, could be overcome with targeted niche procurement for next generation technologies. 48
ACCEPTED VERSION
SUBJECT TO FIN
AL EDITS

Final Government Draft Chapter 16 IPCC AR6 WGIII
Do Not Cite, Quote or Distribute 16-55 Total pages: 141
Other authors have cautioned that the move from renewable feed-in-tariffs to auctions may favour 1
existing PV (e.g., polysilicon) over more novel solar power technologies (Sivaram 2018b) such as thin-2
film PV, amorphous PV, and perovskites. 3
Policy design, policy mixes, and domestic capacity and infrastructure are important factors determining 4
the extent to which economic policy instruments in industrialised countries and emerging economies 5
can also lead to positive (or at least not negative) competitiveness outcomes and distributional outcomes 6
(medium evidence, medium agreement) (Section 16.3). Prioritising low cost energy generation in the 7
design of FIT schemes can result in a lower focus of innovation efforts on more novel technologies and 8
greater barriers to incumbents in less mature technologies (Hoppmann et al. 2013). Similarly, case study 9
research from Mexico and South Africa indicates that focusing on low-cost renewable energy 10
generation only can result in a greater reliance on existing foreign value chains and capital, and thus in 11
lower or negative impacts on domestic competitiveness—in other words, some approaches can hinder 12
the development of the local capabilities that could result in greater long-term benefits domestically 13
(Matsuo and Schmidt 2019). Evidence for developing countries indicates that local and absorptive 14
capacity also play an important role in particular on the ability of policies to contribute to 15
competitiveness or industrial policy goals (e.g., Binz and Anadon 2018). Research comparing China’s 16
and India’s policies and outcomes on wind also suggest that policy durability and systemic approaches 17
can affect industrial outcomes (Surana and Anadon 2015). 18
Energy auctions 19
The evidence of the impact of renewable energy auctions on innovation outcomes is very small and 20
provides mixed results (limited evidence, low agreement). Out of six evaluations, three of them identify 21
positive impacts, two no impacts, and one negative impacts. All of the evaluations but one were 22
qualitative or theoretical and the quantitative assessment indicated no impact (Peñasco et al. 2021). 23
There is more evidence covering emerging economies analysing the impacts of auctions when 24
compared to other policy instrument types. For example, there is work comparing the approaches to 25
renewable energy auctions in South Africa and Denmark (Toke 2015) finding a positive impact on the 26
latter stages of innovation (mainly deployment), and broader work on auctions covering OECD 27
countries as well as Brazil, South Africa and China not finding a significant impact on innovation 28
(Wigand et al. 2016), and work comparing renewable energy auctions in different countries in South 29
America finding generally a positive impact on innovation outcomes (Mastropietro et al. 2014). The 30
body of evidence on the impact of auctions on competitiveness is also limited (six evaluations) and 31
indicates negative outcomes of renewable auctions of competitiveness (limited evidence, low 32
agreement). As with other policies, the design of the auctions can affect innovation outcomes (del Río 33
and Kiefer 2021). Only two studies investigated distributional outcomes and both were negative. 34
35
Other financial instruments 36
There is no explicit literature on the ability of green public banks, and targeted loans, and loan 37
guarantees to lead to upstream innovation investments and activities, although there is evidence on their 38
role in deployment (see e.g. Geddes et al (2018)). This notwithstanding the key role of these institutions 39
in the innovation system (Sections 16.2.1 and 16.3) (OECD 2015c; Geddes et al. 2018) and the belief 40
that they can de-risk scale-up and the testing of business models (Probst et al. 2021; Geddes et al. 2018) 41
(see Chapter 17). 42
43
Renewable obligations with tradeable green certificates 44
There is mixed evidence of the impact of tradeable green certificates (TGCs) on innovation (limited 45
evidence, low agreement) and competitiveness (limited evidence, low agreement). Out of the 11 46
evaluations in Peñasco et al (2021), six found no impact, two a positive impact, and three a negative 47
impact. All of them used a qualitative research approach. Of the six studies focusing on competitiveness 48
outcomes, three conclude TGCs have had no impact on competitiveness, while two indicate negative 49
ACCEPTED VERSION
SUBJECT TO FIN
AL EDITS

Final Government Draft Chapter 16 IPCC AR6 WGIII
Do Not Cite, Quote or Distribute 16-56 Total pages: 141
impact and one a positive impact. Only one of the studies was quantitative and did not identify an impact 1
on competitiveness. 2
TGC are associated with the existence of negative distributional impacts in most applications (medium 3
evidence, high agreement). Ten out of 12 studies identify the existence of some negative impacts. All 4
but one of these studies (which focussed on India) are based on analysis of policies implemented in 5
industrialised countries. 6
Clean Energy and renewable Portfolio Standards 7
The impact of renewable portfolio standards without tradeable credits on innovation outcomes is 8
negligible or very small (medium evidence, medium agreement). Out of the nine studies, seven reported 9
no impact on innovation outcomes and two a positive impact (Peñasco et al. 2021). Most of these papers 10
focussed on patenting and private R&D innovation indicators and not cost reductions. Impact on 11
competitiveness is found to be negligible or positive (limited evidence, medium agreement). Out of 12
eight evaluations, five report positive impact and three negligible impact; only two are quantitative 13
studies (Peñasco et al. 2021). Negative distributional impacts from renewable portfolio standards can 14
emerge in some cases (limited evidence, low agreement). Out of eight evaluations, four identified 15
positive impacts, and four negative impacts; all of the studies identifying a positive impact were 16
theoretical. There are efforts focussed on clean energy portfolio standards which include technologies 17
beyond renewables. 18
19
Efficiency obligations with tradeable credits 20
The impact of tradeable white certificates in innovation is largely positive, but the evidence is limited 21
(limited evidence, medium/high agreement). Out of four evaluations, only one of which was 22
quantitative, three report positive impact and one no impact (Peñasco et al. 2021). The impact of white 23
certificates on competitiveness is positive (limited evidence, high agreement) while that on 24
distributional outcomes is very mixed (limited evidence, low agreement). Two theoretical studies report 25
positive competitiveness impacts. Out of 11 evaluations of distributional outcomes, eight rely on 26
theoretical ex ante approaches. Seven evaluations reported positive impacts (four of them using 27
theoretical methods), three of them (using theoretical methods) indicated negative impacts and one of 28
them no impact. 29
30
Building codes 31
There is evidence of the impact of building codes on innovation outcomes (Peñasco et al. 2021). Only 32
two studies assessed competitiveness impacts (one identifying positive impacts and one negligible ones) 33
and three studies identifying distributional impacts, all positive. 34
Overall, the evidence on the impact of the market pull policy instruments covered in Section 16.4.4.4 35
when it comes to the competitiveness outcome (at least in the short term) is more mixed. For some of 36
them, the evidence of a positive impact on innovation is more consistent than the others (for carbon 37
taxes or FITs, for example). Peñasco et al (2021) found that the disagreements in the evidence regarding 38
the positive, negative or no impact of a policy on competitiveness or distributional outcomes can often 39
be explained by differences in policy design, differences in geographical or temporal context (since the 40
review included evidence from countries from all over the world), or on how policy mixes may have 41
affected the ability of the research design of the underlying papers to separate the impact of the policy 42
under consideration from the others. 43
44
16.4.4.5 Assessment of the impact on innovation, competitiveness and distributional outcomes of 45
regulatory policy instruments targeting efficiency improvements 46
There is medium evidence that the introduction of flexible, performance-based environmental 47
regulation on energy efficiency in general (e.g., efficiency standards) can stimulate innovative 48
ACCEPTED VERSION
SUBJECT TO FIN
AL EDITS

Final Government Draft Chapter 16 IPCC AR6 WGIII
Do Not Cite, Quote or Distribute 16-57 Total pages: 141
responses in firms (Ambec et al. 2013; Popp 2019) (medium evidence, high agreement). Evidence 1
comes from both observational studies that examine patenting, R&D or technological responses to 2
regulatory interventions, and from surveys and qualitative case studies in which firms report regulatory 3
compliance as a driving force for the introduction of environmentally-beneficial innovations (Grubb et 4
al. 2021). While the literature examining the impact of environmental regulation on innovation is large, 5
there have been fewer studies on the innovation effects of minimum energy or emissions performance 6
regulations specifically relating to climate mitigation. We discuss in turn two types of efficiency 7
regulations: on vehicles, and on appliances. 8
Relationship between automotive efficiency regulations and innovation 9
The announcement, introduction and tightening of vehicle fleet efficiency or GHG emission standards 10
either at the national or sub-national level positively impacts innovation as measured by patents 11
(Barbieri 2015) or vehicle characteristics (Knittel 2011; Kiso 2019) as summarised in a review by 12
Grubb et al (2021). Detailed studies on the innovation effects of national pollutant (rather than energy) 13
regulations on automotive innovation also indicate that introducing or tightening performance standards 14
has driven technological change (Lee et al. 2010). Some studies in the US that examine periods in which 15
little regulatory change took place have found that the effects of performance standards on fuel economy 16
have been small (Knittel 2011) or not significant relative to the innovation effects of prices (Crabb and 17
Johnson 2010). This is at least in part because ongoing efficiency improvements during this period were 18
offset by increases in other product attributes. For example, Knittel (2011) study observed that size and 19
power increased without a corresponding increase in fuel consumption. It has also been observed that 20
regulatory design may introduce distortions that affect automotive innovation choices: in particular, 21
fuel economy standards based on weight classes have been observed to distort light-weighting strategies 22
for fuel efficiency in both China (Hao et al. 2016) and Japan (Ito and Sallee 2018). 23
A number of studies have focused on the impacts of a sub-national technology-forcing policy: the 24
California Zero Emission Vehicle (ZEV) mandate. When it was introduced in 1990, this policy required 25
automotive firms to ensure that 2% of the vehicles they sold in 1998 would be zero emissions. In the 26
years immediately after introduction of the policy, automotive firms reported that it was a significant 27
stimulus to their R&D activity in electric vehicles (Brown et al. 1995). Quantitative evidence examining 28
patents and prototypes has indicated that the stringency of the policy was a significant factor in 29
stimulating innovation, though this was in part dependent on firm strategy (Sierzchula and Nemet 2015). 30
Like in the previous instruments, most of the evidence comes from industrialised countries and 31
additional research on other countries would be beneficial. 32
Relationship between appliance efficiency standards and innovation 33
Regulation-driven deployment of existing technologies can generate innovation in those technologies, 34
through learning-by-doing, induced R&D and other mechanisms, although not in all cases (Grubb et al. 35
2021) (medium evidence, medium agreement). The introduction or tightening of minimum energy 36
performance standards for appliances (and in the case of Noailly (2012) for buildings) have driven 37
innovation responses, using direct measures of product attributes (Newell et al. 1999) and patents 38
(Noailly 2012; Kim and Brown 2019), though not all studies have found a significant relationship 39
(Girod et al. 2017). There is also evidence of a correlation between regulation-driven deployment of 40
energy-efficient products with accelerated learning in those technologies (Van Buskirk et al. 2014; Wei 41
et al. 2017). 42
In addition to observational studies, evidence on the relationship between innovation and regulation 43
comes from surveys in which survey respondents are asked whether they have engaged in innovation 44
leading to energy saving or reduced GHG emissions, and what the motivations were for such innovation. 45
Survey evidence has found that expected or current regulation can drive both R&D investment and 46
decisions to adopt or introduce innovations that reduce energy consumption or CO2 emissions (Horbach 47
et al. 2012; Grubb et al. 2021). Survey-based studies, however, tend not to specify the type of regulation. 48
ACCEPTED VERSION
SUBJECT TO FIN
AL EDITS

Final Government Draft Chapter 16 IPCC AR6 WGIII
Do Not Cite, Quote or Distribute 16-58 Total pages: 141
Competitiveness and distributional impacts associated with vehicles and appliance performance 1
standards 2
Minimum energy performance standards and appliance standards have been known to result in negative 3
distributional impacts (limited evidence, medium/high agreement). Several studies focused on the US 4
have highlighted that minimum energy performance standards for vehicles tend to be regressive, with 5
poorer households disproportionately affected (Levinson 2019; Jacobsen 2013), particularly when 6
second-hand vehicles are taken into account (Davis and Knittel 2019). Similar arguments, though with 7
less evidence, have been made for appliance standards (Sutherland 2006). 8
Overall, the extent to which regulations in energy efficiency result in positive or negative 9
competitiveness impacts in firms is mixed (limited evidence, high disagreement). A meta-analysis of 10
107 studies, of which 13 focused on regulations relating to energy consumption or GHG emissions, 11
found that around half showed that regulations resulted in competitiveness impacts, while half did not 12
(Cohen and Tubb 2018). Cohen and Tubb (2018) also found that studies examining performance-based 13
regulations were less likely to find positive competitiveness impacts than those that examined market-14
based instruments. 15
Insights into causal mechanisms and co-evolutionary dynamics from case studies on efficiency 16
regulations 17
While most of the literature addresses the extent to which regulation can induce innovation, a number 18
of case studies highlight that innovation can also influence regulation, as the costs of imposing 19
regulation are reduced and political interests emerge that seek to exploit competitive advantages 20
conferred by successfully developing energy-efficient or low-carbon technologies (medium evidence, 21
high agreement). Case studies map the causal mechanisms relating regulations and innovation 22
responses in specific firms or industries (Ruby 2015; Wesseling et al. 2015; Kemp 2005; Gann et al. 23
1998). 24
25
16.4.4.6 Assessment of the impact on innovation and on competitiveness and distributional 26
outcomes of soft instruments 27
Energy labels and innovation 28
The literature specifically focusing on the impacts of labels is very limited and indicates positive 29
outcomes (limited evidence, high agreement). Energy labels may accompany a minimum energy 30
performance standard and the outcomes of these policies are often combined in literature (IEA 2015). 31
But again, given the limited evidence more research is needed. Although there are many studies on 32
energy efficiency more broadly and for both standards and labels, only eight studies specifically focus 33
on labels. Furthermore, seven of them report positive outcomes and one negative outcomes. Six of the 34
studies used qualitative methods mentioning the impacts of labelling on the development of new 35
products (Wiel et al. 2006). Research specifically comparing voluntary labels with other mechanisms 36
found a significant and positive relationship between labels and the number of energy-efficient 37
inventions (Girod et al. 2017). More research is needed especially in developing countries that have 38
extensive labelling programs in place, and also with quantitative methods, to develop evidence on the 39
impacts of labelling on innovation. Box 16.7 discusses an example of a combination of policy 40
instruments in China including labelling, bans and financial support. 41
42
START BOX 16.7 HERE 43
Box 16.7 China Energy Labelling Policies, combined with sale bans and financial subsidies 44
From 1970 to 2001, China was able to significantly limit energy demand growth through energy-45
efficiency programs. Energy use per unit of gross domestic product (GDP) declined by approximately 46
5% yr-1 during this period. However, between 2002 and 2005, energy demand per unit of GDP increased 47
ACCEPTED VERSION
SUBJECT TO FIN
AL EDITS
Final Government Draft Chapter 16 IPCC AR6 WGIII
Do Not Cite, Quote or Distribute 16-59 Total pages: 141
on average by 3.8% yr-1. To curb this energy growth, in 2005, the Chinese government announced a 1
mandatory goal of 20% reduction of energy intensity between 2006 and 2010 (Zhou et al. 2010; Lo 2
2014). 3
An Energy Labelling System was passed in 2004. It requires the manufacturers to provide information 4
about the efficiency of their electrical appliances to consumers. From 2004 to 2010, 23 electrical 5
appliances (including refrigerators, air conditioners and flat-screen TVs) being labelled as energy 6
efficient with 5 different grades, with Grade 1 being the most energy efficient and grade 5 the least 7
efficient. Any appliances with an efficiency grade higher than 5 cannot be sold in the market. 8
In addition to providing information to consumers, the National Development Reform Commission, 9
which was in charge of designing the policies, and the Ministry of Finance launched in 2009 the 10
“energy-saving products and civilian-benefiting project” (Zhan et al. 2011). It covered air conditioners, 11
refrigerators, flat panel televisions, washing machines, electrical efficient lighting, energy saving and 12
new energy vehicles with the energy grades at 1 or 2 and it consisted of financial subsidies for 13
enterprises producing these products. The standard design of these financial subsidies involved the 14
government paying for the price difference of energy efficiency products and general products. The 15
manufacturers which produce the energy efficient products can get the financial subsidies directly from 16
the government (Wang et al. 2017b). 17
Before 2008, the market share of grade 1 and grade 2 air conditioners was about 5%, and about 70% of 18
all air conditioners were grade 5 (the most inefficient). Driven by the financial subsidies, the selling 19
price of the highly efficient air conditioners became competitive with that of the general air 20
conditioners. Hence, the sales of energy efficient air conditioners increased substantially, making the 21
market share of air conditioners at grade 1 and 2 to be about 80% in 2010 (Wang et al. 2017b). 22
According to the information from energy efficiency labelling management centre of China National 23
Institute of Standardisation, under the energy label system implemented 5 years ago, more than 1.5 24
hundred billion kWh power was saved by March 2010, equivalent to more than 60 million tons of 25
standard coal, 1.4 billion tons of carbon dioxide emissions, and 60 tons of sulphur dioxide emissions 26
(Zhan et al. 2011), which significantly contributed to energy saving goals of the 11th Five-Year Plan. 27
END BOX 16.7 HERE 28
Voluntary approaches and innovation 29
Voluntary approaches have a largely positive impact on innovation for those that choose to participate 30
(robust evidence, medium agreement). Research on voluntary approaches focuses on firms adopting 31
voluntary environmental management systems that can be certified based on standards of the widely 32
adopted International Standards Organisation (ISO 14001) or the European Union Environmental 33
Management and Auditing Scheme (EMAS), which is partly mandatory today. Out of 16 analyses, 70% 34
report positive innovation outcomes in terms of patents, or product and process innovation. 17% report 35
negligible impacts and 13% report negative impact. Positive innovation outcomes have been linked to 36
firms’ internal resource management practices and were found to be strengthened in firms with mature 37
environmental management systems and in the presence of other environmental regulations (He and 38
Shen 2019; Inoue et al. 2013; Li et al. 2019a). Overall, studies are concentrated in a few countries that 39
do not fully capture where environmental management systems have been actually adopted (Boiral et 40
al. 2018). There is a need for research in analyses of such instruments in emerging economies including 41
China and India, and methodologically in qualitative and longitudinal analyses (Boiral et al. 2018). 42
Competitiveness and distributional outcomes of soft instruments 43
The outcomes for performance or endorsement labels have been associated with positive 44
competitiveness outcomes (medium evidence, medium agreement). Out of 19 studies, 89% report 45
positive impact and 11% negligible impact. Although there are several studies analysing 46
competitiveness related metrics, evidence on most individual metrics is sporadic, except for housing 47
ACCEPTED VERSION
SUBJECT TO FIN
AL EDITS

Final Government Draft Chapter 16 IPCC AR6 WGIII
Do Not Cite, Quote or Distribute 16-60 Total pages: 141
premiums. A large number of studies quantitatively assessing competitiveness find that green labels in 1
buildings are associated with housing price premium in multiple countries and regions (Fuerst and 2
McAllister 2011; Kahn and Kok 2014; Zhang et al. 2017). 32% of the studies were qualitative, 3
associating appliance labelling programs with employment and industry development (European 4
Commission 2018). There is a research gap in analyses of developing countries, and also in 5
quantitatively assessing outcomes beyond housing price premiums. 6
A few studies on the distributional outcomes of voluntary labelling programs point to positive impacts 7
(limited evidence, high agreement). All four studies focusing benefits for consumers and tenants, report 8
positive impacts (Devine and Kok 2015). Although there are benefits for utilities and other stakeholders, 9
more research is needed specifically attribute these benefits to voluntary labels rather than energy 10
efficiency programs in general. 11
Voluntary agreements are associated with positive competitiveness outcomes (medium evidence, 12
medium agreement), 14 out of 19 evaluations identified were associated with positive outcomes while 13
three were associated with negligible outcomes, and two with negative outcomes. Research found an 14
increase in perceived firm financial performance (de Jong et al. 2014; Moon et al. 2014). Studies also 15
show an association with higher exports as more environmentally conscious trade partners increasingly 16
value environmental certifications (Bellesi et al. 2005). More research is needed to develop evidence 17
on metrics of competitiveness besides firms’ financial performance, and especially in developing 18
countries. 19
Voluntary agreements are associated with a positive impact on distributional outcomes (limited 20
evidence, high agreement). Five studies, mainly using qualitative approaches, report a positive 21
association between a firm adopting an environmental management system and impacts on its supply 22
chains. There is a need for more studies with quantitative assessments and geographical diversity. 23
24
16.4.4.7 Summary of the size and direction of the evidence of all policy instrument types on 25
innovation outcomes 26
Positive impacts have been identified more frequently in some policies than in others. There is also a 27
lot of variation in the density of the literature. Developing countries are severely underrepresented in 28
the decarbonisation policy instrument evaluation literature aiming to understand the impact on 29
innovation. (high evidence, high agreement). 30
Figure 16.2 below indicates the extent to which some decarbonisation policy instruments have been 31
more or less investigated in terms of their impact on innovation outcomes as described in Table 16.9 32
above. For example, it indicates the extent to which there has been a greater focus of evaluations of the 33
impact of R&D investments, emissions trading schemes and voluntary approaches on innovation. It 34
also shows a limited amount of evidence on procurement, efficiency obligations with tradeable green 35
certificates (TGCs), building codes and auctions. 36
ACCEPTED VERSION
SUBJECT TO FIN
AL EDITS

Final Government Draft Chapter 16 IPCC AR6 WGIII
Do Not Cite, Quote or Distribute 16-61 Total pages: 141
1
Figure 16.2 Number of evaluations available for each policy instrument type covered regarding their 2
impact on innovation and direction of the assessment. The vertical axis displays the number of 3
evaluations claiming to isolate the impact of each policy instrument type on innovation outcomes as listed 4
in Table 16.9. The colour indicates whether each evaluation identified a positive impact on the innovation 5
outcome (blue), the existence of a negative impact (in orange), and no impact (in grey). It builds on 6
Peñasco et al (2021), Grubb et al (2021), Lilliestam et al (2021) and additional studies identified as part of 7
these reviews. TGC stands for tradeable green certificates. TWC stands for tradeable white certificates. 8
9
16.4.5 Trade instruments and their impact on innovation 10
There has been a long interest on the impact of Foreign Direct Investment (FDI) on domestic capacity 11
on innovation and on environmental outcomes. This section does not cover the much larger body of 12
evidence on the relationship between FDI and economic development and growth. 13
Overall, research indicates that trade can facilitate the entrance of new technologies, but the impact on 14
innovation is less clear (limited evidence, low agreement). A recent study indicates that for countries 15
with high environmental performance FDI has a negligible impact on environmental performance, 16
while on the lower end of the spectrum (countries with a lower environmental performance) may benefit 17
from FDI in terms of their environmental performance (Li et al. 2019b). One analysis on China links 18
FDI not just with improved environmental performance and energy efficiency but also innovation 19
outcomes in general (Gao and Zhang 2013). Other work links FDI with increased productivity across 20
firms (not just those engaged in climate-related technologies) through spill-overs (Newman et al. 2015). 21
In addition, Brandão and Ehrl (2019) indicate that productivity of the electric power industry is more 22
influenced by the transfer of embodied technology from other industries than by investments of the 23
power industry and that countries with high R&D stocks are the main sources of these international 24
technology spillovers and that the source countries may also benefit from the spillover. 25
0
5
10
15
20
25
30
Nu
mb
er
of
eva
luati
on
s
Policy instrument type
Negligible
Negative
Positive
ACCEPTED VERSION
SUBJECT TO FIN
AL EDITS
Final Government Draft Chapter 16 IPCC AR6 WGIII
Do Not Cite, Quote or Distribute 16-62 Total pages: 141
Other emerging work investigates the role of local content requirements on innovation outcomes and 1
suggests that it can lead to increased power costs (negative distributional impacts) and the domestic 2
innovation system benefits, measured by patents or exports are unclear if the policies are not part of a 3
holistic and longer lasting policy framework (Probst et al. 2020). 4
5
16.4.6 Intellectual property rights, legal framework and the impact on innovation 6
Virtually all countries around the world have instituted systems for the protection of creations and 7
inventions, known as Intellectual Property (IP) rights systems (WIPO 2021). While several types of 8
intellectual property exist – patents, copyright, design rights, trademarks, and more –, this section will 9
focus on patents, as the most relevant property right for technological innovations (World Intellectual 10
Property Organization 2008), and hence the most relevant for policy instruments in this context. 11
Patent systems aim to promote innovation and economic growth, by stimulating both the creation of 12
new knowledge and diffusion of that knowledge (high evidence, high agreement). National patent 13
systems, as institutions, play a central role in theories on national innovation systems (high evidence, 14
strong agreement). Patent systems are usually instituted to promote innovation and economic growth 15
(Nelson and Mazzoleni 1996; Machlup and Penrose 1950; Encaoua et al. 2006). Some countries 16
explicitly refer to this purpose in their law or legislation – for instance, the US Constitution states the 17
purpose of the US IP rights system to “promote the progress of science and useful arts”. Patent systems 18
aim to reach their goals by trying to strike a balance between the creation of new knowledge and 19
diffusion of that knowledge (Scotchmer and Green 1990; Devlin 2010; Anadon et al. 2016b). They 20
promote the creation of new knowledge (e.g. technological inventions) by providing a temporary, 21
exclusive right to the holder of the patent, thus providing incentives to develop such new knowledge 22
and helping parties to justify investments in research and development. They promote the diffusion of 23
this new knowledge via the detailed disclosure of the invention in the patent publication, and by 24
enabling a ‘market for knowledge’ via the trading of patents and the issuance of licenses (Arora et al. 25
2004). Although IP protections provide incentives to invest in innovation, they have the double effect 26
of restricting the use of new knowledge by raising prices or blocking follow-on innovation (Stiglitz 27
2008; Wallerstein et al. 1993). National patent systems, as institutions, feature prominently in models 28
and theories of National Innovation Systems (Edquist 1997; Klein Woolthuis et al. 2005). 29
The degree to which patent systems actually promote innovation is subject to debate. Patent protection 30
has been found to have a positive impact on R&D activities in patent-intensive industries, but this effect 31
was found to be conditional on access to finance (Maskus et al. 2019). Patents are believed to be 32
especially important to facilitate innovation in selected areas like pharmaceuticals, where investments 33
in developments and clinical trials are high, imitation costs are low, and there is often a 1:1 relationship 34
between a patent and a product, referred to as a “discrete” product industry (Cohen et al. 2000). At the 35
same time, there is an increasing body of theoretical and empirical literature that suggests that the 36
proliferation of patents also discourages innovation (medium evidence, low agreement). Theoretical 37
contributions note that a too stringent appropriability regime may greatly limit the diffusion of advanced 38
technological knowledge and eventually block the development of differentiated technological 39
capabilities within an industry, in what is called an ‘appropriability trap’ (Edquist 1997; Klein 40
Woolthuis et al. 2005). There has been a long-standing debate on the impact of patents and other IP 41
rights on innovation and economic development (Hall and Helmers 2019; Machlup 1958). Jaffe and 42
Lerner (2004) and Bessen & Meurer (2009) highlight how IP rights also hamper innovation in a variety 43
of ways. Other more specific contributions in the literature focus on specific factors. For example, 44
Shapiro (2001) discusses patent thickets, where overlapping sets of patent rights mean that those 45
seeking to commercialize new technology, need to obtain licenses from multiple patentees. Heller and 46
Eisenberg (1998) argue that a ‘tragedy of the anticommons’ is likely to emerge when too many parties 47
obtain the right to exclude others from using fragmented and overlapping pieces of knowledge, with 48
ACCEPTED VERSION
SUBJECT TO FIN
AL EDITS

Final Government Draft Chapter 16 IPCC AR6 WGIII
Do Not Cite, Quote or Distribute 16-63 Total pages: 141
ultimately no one having the effective privilege of using the results of biomedical research. Reitzig et 1
al. (2007) describe the damaging effects of extreme business strategies employing patents, such as 2
patent trolling. 3
IP protection and enforcement in general may have different impacts on economic growth in different 4
types of countries (limited evidence, high agreement). There has been a significant degree of 5
harmonisation and cooperation between national IP systems over time. The most recent milestone is the 6
1994 WTO agreement on Trade-Related Aspects of Intellectual Property Rights (TRIPS Agreement) , 7
entered into by all members of the World Trade Organisation (WTO), and which sets down minimum 8
standards for the regulation by national governments of many forms of intellectual property as applied 9
to nationals of other WTO member nations (WTO 1994). Developing countries successfully managed 10
to include some flexibilities into TRIPS both in terms of timing of legislative reform and in terms of 11
the content of the reforms. In an attempt to understand the effects of the introduction of TRIPS, Falvey 12
et al. (2006) find that the effect of IP protection on growth is positively and significantly related to 13
growth for low- and high-income countries, but not for middle-income countries. They argue that low-14
income countries benefit from increased technology flows, but middle-income countries may have 15
offsetting losses from the reduced scope for imitation. Note that Falvey et al. (2006) do not break down 16
their results in different technological areas and they do not focus on innovation, but instead growth. It 17
has been argued that the increasingly globalised IP regime through initiatives like the TRIPS agreement 18
will diminish prospects for technology transfer and competition in developing countries, particularly 19
for several important technology areas related to meeting sustainable development needs (Maskus and 20
Reichman 2017). 21
In principle, patent holders are not required to take their protected invention into use, and neither have 22
the obligation to allow (i.e., license) others to use the inventions in question (high evidence, high 23
agreement). Studies have shown that the way patent holders use their patent differs considerably across 24
industrial sectors: in pharmaceutics, patents are typically used to be the only producer of a certain good 25
(and obtain monopoly rents), while in industries like computers, semiconductors, and communications, 26
patents are often used to strengthen positions in cross-licensing negotiations and to generate licensing 27
income (Cohen et al. 2000; Foray 2004). There are also companies that predominantly obtain patents 28
for defensive reasons: they seek freedom to design and manufacture, and by owning a patent portfolio 29
themselves, they hope to prevent that they become the target of litigation by other patent holders (Hall 30
and Ziedonis 2001). Patents are often used strategically to impede the development and diffusion of 31
competing, alternative products, processes or services, by employing strategies known as ‘blanketing’ 32
and ‘fencing’ (Grandstrand 2000), although the research is not specific to the climate space. 33
There are notable but specific exceptions to the general principle that patent holders are not obliged to 34
license their patent to others. These exceptions include the compulsory license, Fair, Reasonable and 35
Non-discriminatory (FRAND) policies, and statement on licences of right (high evidence, high 36
agreement). While patent holders are, as stated above, in principle free to choose not to license their 37
innovation, there are three important exceptions to this. First, most national patent laws have provisions 38
for compulsory licensing, meaning that a government allows someone else to produce a patented 39
product or process without the consent of the patent holder, or plans to use the patent-protected 40
invention itself (WTO 2020). Compulsory licenses may be issued in cases of public interest or events 41
of abuse of the patent (Biadgleng 2009; World Intellectual Property Organization 2008). Compulsory 42
licensing is explicitly allowed in the WTO TRIPS agreement, and its use in context of medicine (for 43
instance to control diseases of public health importance, including HIV, tuberculosis and malaria) is 44
further clarified in the ‘DOHA Declaration’ from 2001 (Reichman 2009; WHO 2020). Second, 45
standard-setting organisations have policies to include patented inventions in their standards only if the 46
patent holder is willing to commit FRAND licensing conditions for those patents (Contreras 2015). 47
While a patent holder can still choose not to make such a commitment, by doing so, its patent is no 48
ACCEPTED VERSION
SUBJECT TO FIN
AL EDITS

Final Government Draft Chapter 16 IPCC AR6 WGIII
Do Not Cite, Quote or Distribute 16-64 Total pages: 141
candidate anymore for inclusion in the standard. In the (many) fields where standards are of key 1
importance, it is very unusual for patent holders not to be willing to enter into FRAND commitments 2
(Bekkers 2017). Third, when a patent holder, at the time of filing at the patent office, opts for the 3
“licence of right” regime, in return for reduced patent fees, it enters into a contractual agreement that 4
obliges to license the patent to those that request it. While not all national patent systems feature this 5
regime, it is a feature present in the new European Community patent (EPO 2017), and may therefore 6
increase in importance. 7
For a discussion on the impact of IPR on international technology diffusion, see Box 16.9 in Section 8
16.5. 9
10
16.4.7 Sub-national innovation policies and industrial clusters 11
Research examining the impacts of sub-national policies on innovation and competitiveness is sporadic 12
– regional variations have been quantitatively assessed in US or China, or with case studies in these and 13
other countries. Research on wind energy in the United States, distributed PV balance of systems in 14
China, and renewable energy technologies in Italy have found that policies that incentivised local 15
demand were associated with inducing innovation, measured with patents (Fu et al. 2018; Gao and Rai 16
2019; Corsatea 2016). Different policies may have different impacts – for example, in the United States 17
state-level tax incentives and subsidies induced innovation within the state; but for renewable portfolio 18
standards policies in other states were associated with innovation, because of impact on demand, but 19
own-state policies were not (Fu et al. 2018). Research has also noted that the outcomes of policy and 20
regulation on innovation are spatially heterogenous, because of differences in local planning authorities 21
and capabilities (Song et al. 2019; Corsatea 2016). 22
Sub-national deployment policies have been associated with different impact on competitiveness 23
metrics (limited evidence, medium agreement). Research on green jobs show positive association 24
between sub-national policies and green jobs or green firms at the metropolitan level as well as the state 25
of provincial level, in both China and the United States (Yi 2013; Yi and Liu 2015; Lee 2017), while 26
others find no impact of renewable portfolio standards on green job growth in the state (Bowen et al. 27
2013). Other examples of competitiveness are in the impact of regional green industrial policy in 28
Brazil’s Rio Grande do Sul region in attracting auctioned contracts for wind energy (Adami et al. 2017) 29
or in the changes in net positive state revenues associated with removing tax incentives for wind 30
producers in Idaho in the US (Black et al. 2014). 31
Sub-national policies also directly support innovation and competitiveness through green incubators 32
and direct grants or R&D funding for local companies working on clean energy, intending to promote 33
local economic development (limited evidence, medium agreement). The literature on the impacts of 34
such policies on innovation and competitiveness is sparse. Some case studies and program evaluation 35
reports, primarily in the United States, have identified the impacts of sub-national policies on 36
competitiveness — for example, job creation from direct R&D funding in North Carolina (Hall and 37
Link 2015), perceptions for local industry development and support for follow-on financing for 38
companies receiving state-funded grants in Colorado (Surana et al. 2020b), and return on investments 39
for the state in research and innovation spending from the New York state’s energy agency (NYSERDA 40
2020). There is a general paucity of metrics on innovation and competitiveness for systematic 41
assessments of such programs in developed countries, and even more so in India and other developing 42
countries where such programs have been increasing (Surana et al. 2020a; Gonsalves and Rogerson 43
2019). 44
Although states and local governments increasingly support clean energy deployment as well as directly 45
support innovation given its link with economic development goals, there is a lack of systematic 46
research on the impacts of these policies at the subnational level. More research—both qualitative and 47
ACCEPTED VERSION
SUBJECT TO FIN
AL EDITS

Final Government Draft Chapter 16 IPCC AR6 WGIII
Do Not Cite, Quote or Distribute 16-65 Total pages: 141
quantitative, and in both developed and developing countries—is needed to systematically develop 1
evidence on these impacts and to understand the reasons behind regional differences in terms of the 2
type of policy as well as the capabilities in the region. 3
4
16.4.8 System-oriented policies and instruments 5
Although previous sections summarised the research disentangling the role of individual policies in 6
advancing or hindering innovation (as well as impacts on other objectives), other research has tried to 7
characterise the impact of a policy mix on a particular outcome. Although the outcome studied was not 8
innovation, but diffusion (technology effectiveness is in the set of criteria outlined above), it seems 9
relevant to discuss overall findings. Reviewing renewable energy policies in nine OECD countries, 10
research concludes that, over time, a broad set of policies characterized by a ‘balance’ metric has been 11
put in place. This research also identifies a significant negative association between the balance of 12
policies in renewable energy and the diffusion of total renewable energy capacity but no significant 13
effect of the overall intensity (coded as the 46 weighted average of six indicators) on renewable capacity 14
(Schmidt and Sewerin 2019), indicating that a neutral conception of balance across all possible policies 15
may not be desirable and that policy mix intensity by itself does not explain technology diffusion. 16
A growing body of research aims to understand how different policies interact and how to characterise 17
policy mixes (del Río and Cerdá 2017; del Río 2010; Howlett and del Rio 2015; Rogge and Reichardt 18
2016). The empirical impact on the innovation outcomes is not yet discussed. A more detailed 19
discussion of this literature is located in Chapter 13. 20
An emerging stream of research in complex systems has suggested that relatively small changes in 21
policy near a possible tipping point in climate impacts in areas including changing strategies related to 22
investments in innovation, could trigger large positive societal feedbacks in the long term (Farmer et 23
al. 2019; Otto et al. 2020a). 24
25
16.5 International technology transfer and cooperation for transformative 26
change 27
This section covers international transfer and cooperation in relation to climate-related technologies, 28
“the flows of know-how, experience and equipment for mitigating and adapting to climate change 29
amongst different stakeholders” (IPCC 2000) as well as innovation to support transformative change 30
compared to the AR5 (IPCC 2014) and the SR1.5 (IPCC 2018a). This complements the discussion on 31
international cooperation on science and technology in Chapter 14. 32
This section first outlines the needs for and opportunities of international transfer and cooperation on 33
low-emission technologies. It then describes the main objectives and roles of these activities, and then 34
reviews recent institutional approaches within and outside the UNFCCC to support international 35
technology transfer and cooperation. Finally, it discusses emerging ideas on international transfer and 36
cooperation on technology, and possible modifications to support the achievement of climate change 37
and sustainable development goals, building up to Section 16.6. 38
39
16.5.1 International cooperation on technology development and transfer: needs and 40
opportunities 41
With the submission of their NDCs as part of the Paris Agreement, most developing countries are now 42
engaged in climate mitigation and adaptation. While technology is seen as one of the ‘means of 43
ACCEPTED VERSION
SUBJECT TO FIN
AL EDITS
Final Government Draft Chapter 16 IPCC AR6 WGIII
Do Not Cite, Quote or Distribute 16-66 Total pages: 141
implementation’ of climate action, developing countries often have relatively limited technology 1
innovation capabilities, which requires them to access technologies developed in higher-income 2
countries with stronger innovation systems (Popp 2011; Binz et al. 2012; Urban 2018). In many cases, 3
these technologies require adaptation for the local context and needs (Sagar 2009; Anadon et al. 2016b), 4
and, once again, innovation capabilities are required to suitably adapt these technologies for local use 5
and also to create new markets and business models that are required for successful deployment 6
(Ockwell et al. 2015; Ockwell and Byrne 2016; Sagar 2009). This can lead to dependencies on foreign 7
knowledge and providers (Ockwell and Byrne 2016), negative impacts in terms of higher costs 8
(Huenteler et al. 2016a), and balance of payments constraints and vulnerability to external shocks 9
(Ebeling 2020). 10
The climate technology transition can also yield other development benefits, for instance better health, 11
increased energy access, poverty alleviation and economic competitiveness (Deng et al. 2018a), 12
including industrial development, job creation and economic growth (Altenburg and Rodrik 2017; 13
Porter and Van der Linde 1995; Lema et al. 2020; Pegels and Altenburg 2020) (See Section 16.6). The 14
growing complexity of technologies and global competition have made the development of a 15
technology into a globalized process involving the flow of knowledge and products across borders 16
(Koengkan et al. 2020; Lehoux et al. 2014). For instance, in production of electronics, Asian economies 17
have captured co-location synergies and dominate production and assembly of product components, 18
whereas American firms have adopted “design-only” strategies (Tassey 2014). In the context of 19
renewable energy technologies, “green global division of labour” has been observed, with countries 20
specialising in investments in R&D, manufacturing or deployment of renewables (Lachapelle et al. 21
2017). In the case of solar PV, for example, while many of the technical innovations emerged from the 22
US, Japan and China emphasized the manufacture of physical modules (Deutch and Steinfeld 2013) 23
(see also Box 16.4). 24
Such globalization of production and supply chains opens up economic development opportunities for 25
developing countries (Lema et al. 2020). At the same time, not all countries benefit from the 26
globalisation of innovation, as barriers remain related to finance, environmental performance, human 27
capabilities and cost (Egli et al. 2018; Weiss and Bonvillian 2013), with developing countries being 28
particularly disadvantaged at leveraging these opportunities. The gap in low-carbon technology 29
innovation between countries appears to have been reducing only amongst OECD countries (Yan et al. 30
2017; Du and Li 2019; Du et al. 2019) and the lower-income countries are not able to benefit as much 31
from low-carbon technologies. For instance, in the case of agriculture, Fuglie (2018) notes out that 32
international R&D spillovers seem to have benefited developed countries more than developing 33
countries. Gross et al (2018)also argue that the development timescales for new energy technologies 34
can extend up to 70 years, even within one country, and recommend that innovation efforts be balanced 35
between on the one hand commercialising already low-emission technologies in the demonstration 36
phase, and diffusing them globally, and on the other hand early-stage R&D spending. 37
Thus international cooperation on technology development and transfer can enable developing 38
countries to achieve their climate goals more effectively, while also addressing other sustainable 39
development goals, taking advantage, where possible, of the globalization of innovation and production 40
(Lema et al. 2020). Earlier assessments in the AR5 and SR1.5 have made it clear that international 41
technology transfer and cooperation could play a role in climate policy at both the international and the 42
domestic policy level (IPCC 2018b; Stavins et al. 2014; Somanathan et al. 2014) and for low-carbon 43
development at the regional level (Agrawala et al. 2014). The Paris Agreement also reflects this view 44
by noting that countries shall strengthen cooperative action on technology development and transfer 45
regarding two main aspects: 1) promoting collaborative approaches to research and development and 46
2) facilitating access to technology to developing country Parties (UNFCCC 2015). Furthermore, both 47
ACCEPTED VERSION
SUBJECT TO FIN
AL EDITS
Final Government Draft Chapter 16 IPCC AR6 WGIII
Do Not Cite, Quote or Distribute 16-67 Total pages: 141
in literature and in UNFCCC deliberations, South-South technology transfer is highlighted (Khosla et 1
al. 2017) as a complement to the transfer of technology and know-how from North to the South. 2
This is consistent with literature that suggests that GHG mitigation in developing countries can be 3
enhanced by (1) technology development and transfer collaboration and a ‘needs-driven’ approach, (2) 4
development of the specific types of capacity required across the entire innovation chain and (3) 5
strengthening of the coordination and agendas across and between governance levels (including 6
domestic and international levels) (Upadhyaya et al. 2020; Zhou 2019; Khosla et al. 2017). 7
8
16.5.2 Objectives and roles of international technology transfer and cooperation efforts 9
International efforts involving technology transfer can have different objectives and roles. These 10
include access to knowledge and financial resources as well as promotion of new industries in both the 11
developed and recipient country (Huh and Kim 2018). Based on an econometric analysis of 12
international technology transfer factors and characteristics of Clean Development Mechanism (CDM) 13
projects, Gandenberger et al (2016) find that complexity and novelty of technologies explain whether 14
CDM project includes hardware technology transfer, and that factors like project size and absorptive 15
capacity of the host country do not seem to be drivers. Halleck Vega and Mandel (2018) argue that 16
‘long-term economic relations’, for instance being part of a customs union, affects technological 17
diffusion between countries for the case of wind energy, and indicate that this has resulted in low-18
income countries being largely overlooked. 19
There is some literature studying whether technology cooperation could complement or replace 20
international cooperation based on emission reductions, such as in the Kyoto Protocol, and whether that 21
would have positive impacts on climate change mitigation and compliance. A handful of papers 22
conducted game-theoretic analysis on technology cooperation, sometimes as an alternative for 23
cooperation on emission reductions, and found partially positive effects (Rubio 2017; Narita and 24
Wagner 2017; Bosetti et al. 2017; Verdolini and Bosetti 2017). However, Sarr and Swanson 25
(2017)model that, due to the rebound effect, technology development and transfer of resource-saving 26
technologies may not lead to envisioned emission reductions. 27
While technology cooperation can be aimed at emission reduction through mitigation projects, as 28
indicated above, not all cooperative actions directly result in mitigation outcomes. Overall, technology 29
transfer broadly has focused on i) enhanced climate technology absorption and deployment in 30
developing countries and ii) enhanced RD&D through cooperation and knowledge spill-overs. 31
16.5.2.1 Enhancing low-emission technology uptake in developing countries 32
Real-world outcomes in terms of low-emission technology deployment in developing countries may 33
vary significantly depending on both the nature of the international engagement and the domestic 34
context. While there have been some success in the enhancement of technology deployment through 35
technology transfer in some developing countries (de la Tour et al. 2011; Zhang and Gallagher 2016), 36
many others, and particularly least-developed countries, are lagging behind (Glachant and 37
Dechezleprêtre 2017). They indicate that this is due to the lack of participation in economic 38
globalisation and that climate negotiations could facilitate technology transfer to those countries 39
through the creation of global demand for low-emission technologies through stronger mitigation 40
targets that will result in lowering of costs and therefore enhanced technology diffusion. A broader 41
perspective presents a host of other factors that govern technology diffusion and commercialization in 42
developing countries, including, investment; social, cultural and behavioural, marketing and market 43
building; macroeconomics; and support policy (Bakhtiar et al. 2020). Ramos Mejía et al (2018) indicate 44
that the governance of low-emission technology transfer and deployment in developing countries is 45
frequently negatively affected by a mixture of well- and ill-functioning institutions, in a context of, for 46
instance, market imperfection, clientelist and social exclusive communities and patrimonial and/or 47
ACCEPTED VERSION
SUBJECT TO FIN
AL EDITS

Final Government Draft Chapter 16 IPCC AR6 WGIII
Do Not Cite, Quote or Distribute 16-68 Total pages: 141
marketized states. Furthermore, existing interests, such as fossil fuel production, may also impede the 1
deployment of low-emission technologies, as highlighted in case studies of Vietnam and Indonesia 2
(Dorband et al. 2020; Ordonez et al. 2021). It is for such reasons that both domestic efforts and 3
international engagement are seen as necessary to facilitate technology transfer as well as deployment 4
in developing countries (Boyd 2012). The same has been seen as true in the case of agriculture where 5
the very successful international research efforts of the CGIAR (with remarkably favourable benefit-6
cost ratios (Alston et al. 2021) were complemented by the national agricultural research systems for 7
effective uptake of high-yielding varieties of crops (Evenson and Gollin 2003). 8
One key area for underpinning effective technology uptake in developing countries relates to 9
capabilities for managing technological change that includes the capabilities to innovate, implement, 10
and undertake integrated planning. There is much research to indicate that the ability of a country’s 11
firms to adopt new technologies is determined by its absorptive capacity, which includes its own R&D 12
activities, human capacity (e.g., technical personnel), government involvement (including institutional 13
capacity), and the infrastructure in the country (Kumar et al. 1999), and that knowledge and capacity 14
are part of the ‘intangible assets’ or the ‘software’ of a firm or a country (Corsi et al. 2020; da Silva et 15
al. 2019; Ockwell et al. 2015). For sustainable development, capacity to plan in an integrated way and 16
implement the SDGs (Elder et al. 2016; Khalili et al. 2015), including using participatory approaches 17
(Disterheft et al. 2015), are conditional means of implementation. It also is argued that, if human capital 18
were at the focus of international climate negotiations as well as national climate policy, it could change 19
the political economy in favour of climate mitigation, which is needed for developing such capabilities 20
in advance to keep up with the required speed of transformation (Hsu 2017; Upadhyaya et al. 2020; 21
Ockwell et al. 2015; IPCC 2018b). Halleck-Vega et al (2018), in a global analysis of wind energy using 22
econometric analysis, lend quantitative credibility to the claim that a technology skill base is a key 23
determinant of technological diffusion. Activities to enhance capabilities include informational 24
contacts, research activities, consulting, education & training and activities related to technical facilities 25
(Huh and Kim 2018; Khan et al. 2020). 26
There are multiple studies drawing on empirical work also support this conclusion. For South-South 27
technology transfer between India and Kenya, not just technical characteristics, but also mutual learning 28
on how to address common problems of electricity access and poverty, was suggested as an important 29
condition for success (Ulsrud et al. 2018). Specifically for Africa, Olawuyi (2018)discusses the 30
capability gap in Africa, despite decades of technology transfer efforts under various mechanisms and 31
programmes of the UNFCCC. The study suggests that barriers need to be resolved by African countries 32
themselves, in particular inadequate access to information about imported climate technologies, lack of 33
domestic capacities to deploy and maintain imported technologies, the weak regulatory environment to 34
stimulate clean technology entrepreneurship, the absence or inadequacy of climate change laws, and 35
weak legal protection for imported technologies. Moreover, Ziervogel et al (2021) indicate that for 36
transformative adaptation, transdisciplinary approaches and capacity building shifting “the co-creation 37
of contextual understandings” instead of top-down transferal of existing knowledge would deliver better 38
results. Despite the understanding of the importance of the capacity issue, significant gaps still remain 39
on this front (Technology Executive Commitee 2019); see also 16.5.4). 40
16.5.2.2 Enhancing RD&D and knowledge spill-overs 41
As mentioned earlier, RD&D can aid both the development of new technologies as well as their 42
adoption for new use contexts. Therefore it is not surprising that international cooperation on RD&D is 43
identified as a mechanism to promote low-carbon innovation (see, for example, Suzuki (2015), 44
Technology Executive Committee (2021), Mission Innovation (2019)). This has resulted in a variety of 45
international initiatives to cooperate on technology in order to create knowledge spill-overs and develop 46
capacity. For example, the UNFCCC Technology Mechanism, amongst other things, aims to facilitate 47
finance for RD&D of climate technologies by helping with readiness activities for developing country 48
ACCEPTED VERSION
SUBJECT TO FIN
AL EDITS

Final Government Draft Chapter 16 IPCC AR6 WGIII
Do Not Cite, Quote or Distribute 16-69 Total pages: 141
actors. In particular preparing early-stage technologies for a smoother transition to deployment and 1
commercialisation has been emphasised in the context of the Technology Executive Committee 2
(Technology Executive Committee 2017). There are numerous programmes, multilateral, bilateral and 3
private, that have facilitated RD&D, biased mostly towards mitigation (as opposed to adaptation) 4
activities, and many programmes that seemed to be about RD&D were in reality dialogues about 5
research coordination (Ockwell et al. 2015). There also are a variety of possible bilateral and multilateral 6
models and approaches for engaging in joint R&D (Mission Innovation 2019). An update by the 7
Technology Executive Committee (2021) reviewing good practices in international cooperation of 8
technology confirmed the conclusions of Ockwell et al(2015), and moreover highlighted that most 9
initiatives are led by the public sector, and that the private sector tended to get involved only in 10
incubation, commercialisation and diffusion phases. It also concluded that, although participation of 11
larger, higher-income developing countries seems to have increased, participation of least-developed 12
countries is still very low. 13
14
16.5.3 International technology transfer and cooperation: recent institutional 15
approaches 16
In the sections below, the literature on various categories of international technology cooperation and 17
transfer is discussed. 18
16.5.3.1 UNFCCC technology and capacity building institutions 19
Technology development and transfer are a part of the UNFCCC since its agreement in 1992 and has 20
undergone discussions and developments in the context of the international climate negotiations ever 21
since, as assessed in AR5 (Stavins et al. 2014). The support on "Technology Needs Assessment" to 22
developing countries was the first major action undertaken by the UNFCCC, and has undergone 23
different cycles of learning (Nygaard and Hansen 2015; Hofman and van der Gaast 2019). Since 2009, 24
the UNFCCC discussions on technology development and transfer have focussed on the Technology 25
Mechanism under the Cancun Agreements of 2010, which can be seen as the global climate governance 26
answer to redistributive claims by developing countries (McGee and Wenta 2014). The Technology 27
Mechanism consists of a Technology Executive Committee (TEC) and a Climate Technology Centre 28
and Network (CTCN). An independent review of CTCN evaluated it on five dimensions – relevance, 29
effectiveness, efficiency, impacts and sustainability – indicated that the organization is achieving its 30
mandate in all these dimensions, although there are some possible areas of improvement. The review 31
also specifically noted that “the lack of predictability and security over financial resources significantly 32
affected the CTCN’s ability to deliver services at the expected level, as did the CTCN’s lack of human 33
and organizational resources and the capacity of NDEs.” (Technology Executive Committee 2017). The 34
CTCN has overcome some of the limitations imposed by resource constraints by acting as a matchmaker 35
from an open-innovation perspective (Lee and Mwebaza 2020). The lack of financial sustainability of 36
the CTCN has been a recurring issue, which may potentially be resolved by deepening the linkage 37
between the CTCN and GCF (Oh 2020). In the meanwhile, the GCF is planning to establish the Climate 38
Innovation Facility to support and accelerate early-stage innovations and climate technologies through 39
the establishment of regional innovation hubs and climate accelerators as well as a climate growth fund 40
(Green Climate Fund 2020). 41
The ‘technology’ discussion has been further strengthened by the Paris Agreement, in which Article 10 42
is fully devoted to technology development and transfer (UNFCCC 2015). However, the political 43
discussions around technology continue to be characterised by viewing technology mostly as hardware 44
(Haselip et al. 2015), and relatively limited in scope (de Coninck and Sagar 2017). The workplans of 45
the Technology Executive Committee (TEC) and the CTCN do, however, indicate a broadening of the 46
perspective on technology (CTCN 2019; Technology Executive Commitee 2019). 47
ACCEPTED VERSION
SUBJECT TO FIN
AL EDITS

Final Government Draft Chapter 16 IPCC AR6 WGIII
Do Not Cite, Quote or Distribute 16-70 Total pages: 141
Since the Kyoto Protocol’s Clean Development Mechanism (CDM) has been operational, studies have 1
assessed its hypothesised contribution to technology transfer, including transfer of knowledge. Though 2
not an explicit objective of the CDM, numerous papers have investigated whether CDM projects 3
contribute to technology transfer (Michaelowa et al. 2019). The literature varies in its assessment. Some 4
find extensive use of domestic technology and hence lower levels of international technology transfer 5
(Doranova et al. 2010), while other indicate that around 40% of projects feature hardware or other types 6
of international transfer of technology (Murphy et al. 2015; Seres et al. 2009), depending on the nature 7
of technology, the host country and region (Cui et al. 2020) and the project type (Karakosta et al. 2012). 8
Although the CDM would generally be positively evaluated on the technology transfer contribution, it 9
was also regarded critically as the market-responsiveness and following of export implies a bias to 10
larger, more advanced economies rather than those countries most in need of technology transfer 11
(Gandenberger et al. 2016), although some countries have managed to correct that by directing the 12
projects, sub-nationally, to provinces with the greatest need (Bayer et al. 2016). Also, the focus on 13
hardware transfer of technology in evaluations of technology transfer under the CDM has been criticised 14
(Michaelowa et al. 2019; Haselip et al. 2015). Indeed, although many studies do go beyond hardware 15
in their evaluations (e.g. Murphy et al (2015)), the degree to which the project leads to a change in the 16
national system of innovation or institutional capacity development is not commonly assessed, or 17
assessed as limited (de Coninck and Puig 2015). 18
There is significantly less literature on capacity building under the UNFCCC, especially as it relates to 19
managing the technology transition. D’Auvergne and Nummelin (2017)(D´Auvergne and Nummelin 20
2017), in a legal analysis, indicate the nature, scope and principles of Article 11 on capacity building of 21
the Paris Agreement as being demand- and country-driven, following a needs approach, fostering 22
national, subnational and local ownership, and being iterative, incorporating the lessons learned, as well 23
as participatory, cross-cutting and gender-response. They also highlight that it is novel that least-24
developed countries and SIDS are called out as the most vulnerable and most in need of capacity 25
building, and that it raises a “legal expectation” that all parties “should” cooperate to enhance the 26
capacity in developing countries to implement the Paris Agreement. These aspects are reflected in the 27
terms of reference of the Paris Committee on Capacity Building (PCCB) that was established in 2015 28
at the 21st Conference of the Parties (UNFCCC 2016; D´Auvergne and Nummelin 2017), which was 29
extended by five years at the 25th Conference of the Parties in 2019 (UNFCCC 2020a,b). In its work 30
plan for 2020-2024, amongst other things, it aims to “identifying capacity gaps and needs, both current 31
and emerging, and recommending ways to address them”. 32
An example of how innovative technologies combined with capacity development and institutional 33
innovation is combined in the context of adaptation to extreme weather in SIDS can be found in Box 34
16.8. 35
36
START BOX 16.8 HERE 37
Box 16.8 Capacity building and innovation for early warning systems in Small Island 38
Developing States 39
One of the areas of international cooperation on capacity building is adaptation, which has been 40
highlighted by both the Technology Executive Committee (Technology Executive Committee 2015; 41
Ockwell et al. 2015) and the Paris Committee on Capacity Building (UNFCCC 2020b) as an area where 42
capacity gaps remain, especially in Small Island Developing States (SIDS). 43
While adaptation was initially conceived primarily in terms of infrastructural adjustments to long-term 44
changes in average conditions (e.g., rising sea levels), a key innovation in recent years has been to 45
couple such long-term risk management to existing efforts to manage disaster risk, specifically 46
including early warning systems enabling early action in the face of climate- and weather-risk at much 47
ACCEPTED VERSION
SUBJECT TO FIN
AL EDITS

Final Government Draft Chapter 16 IPCC AR6 WGIII
Do Not Cite, Quote or Distribute 16-71 Total pages: 141
shorter timescales (e.g., IPCC 2012), with potentially significant rates of return (e.g., Rogers and 1
Tsirkunov 2010; Hallegatte 2012; Global Commission on Adaptation 2019). 2
In recent years, deliberate international climate finance investments have focused on ensuring that 3
developing countries (and especially SIDS and LDCs) have access to improvements in 4
hydrometeorological observations, modelling, and prediction capacity, sometimes with a particular 5
focus on the people intended to benefit from the information produced (e.g., CREWS 2016). For 6
instance, on the Eastern Caribbean SIDS of Dominica, researchers took a community-based approach 7
to identify the mediating factors affecting the challenges to coastal fishing communities in the aftermath 8
of two extreme weather events (in particular hurricane Maria in 2017) (Turner et al. 2020). Adopting 9
an adaptive capacity framework (Cinner et al. 2018), they identified ‘intangible resources’ that people 10
relied on in their post-disaster response as important for starting up fishery, but also went beyond that 11
framework to conclude that the response ability on the part of governmental organisations as well as 12
other actors (e.g. fish vendors) in the supply chain is also a requirement for rebuilding and restarting 13
income-generating activity (Turner et al. 2020). Numerous other studies have highlighted capacity 14
building as adaptation priorities (Williams et al. 2020; Kuhl et al. 2020; Vogel et al. 2020; Basel et al. 15
2020; Sarker et al. 2020). 16
One of several helpful innovations in these efforts is impact-based forecasting (Harrowsmith et al. 17
2020), which provides forecasts targeted at the impact of the hazard rather than simply the 18
meteorological variable, enabling a much easier coupling to early action in response to the information, 19
enabling a more appropriate response afterwards. Automatic responses to warnings have also been 20
adopted in the humanitarian field for anticipatory action ahead (rather than simply in response to) 21
disasters triggered by natural hazards (Coughlan de Perez et al. 2015), resulting in a rapid scale-up of 22
such anticipatory financing mechanisms to tens of countries over the past few years, and emerging 23
evidence of its effectiveness. Still, the response is lacking in coherence and comprehensiveness, 24
resulting in calls for a more systematic evidence agenda for anticipatory action (Weingartner et al. 25
2020). 26
END BOX 16.8 HERE 27
28
From the broader assessment above, despite limitations of available information, it is clear that the 29
number of initiatives and activities on international cooperation and technology transfer and capacity 30
building seem to have been enhanced since both the Cancun Agreements and the Paris Agreement 31
(Technology Executive Committee 2021). However, given the complexity and magnitude of the 32
requirements in terms of coverage of activities, the amount of committed funding, and effectiveness, 33
much more can be done. Some assessments of UNFCCC instruments specifically for technology 34
transfer to developing countries had indicated that functions such as knowledge development, market 35
formation and legitimacy in developing countries’ low-emission technological innovation systems 36
would need much more support to fulfil the Paris goals. (de Coninck and Puig 2015; Ockwell et al. 37
2015); such areas would benefit from continued attention, given their role in the overall climate 38
technology transition. 39
16.5.3.2 International RD&D cooperation and capacity building initiatives 40
Besides the UNFCCC mechanisms, there are numerous other initiatives that promote international 41
cooperation on RD&D as well as capacity building. Some of them are based on the notion of “mission-42
oriented innovation policy” (Mazzucato and Semieniuk 2017; Mazzucato 2018), which shapes markets 43
rather than merely correcting market failures. 44
For instance, “Mission Innovation” (MI) is a global initiative consisting of 23 member countries and 45
the European Commission working together to reinvigorate and accelerate global clean energy 46
innovation with the objective to make clean energy widely affordable with improved reliability and 47
ACCEPTED VERSION
SUBJECT TO FIN
AL EDITS

Final Government Draft Chapter 16 IPCC AR6 WGIII
Do Not Cite, Quote or Distribute 16-72 Total pages: 141
secured supply of energy. The goal is to accelerate clean energy innovation in order to limit the rise in 1
the global temperature to well below 2°C. The members to seek to increase public investments in clean 2
energy R&D with the engagement of private sectors, and foster international collaboration amongst its 3
members. A recent assessment shows that, although expenditures are rising, the aims are not met by 4
2020 (Myslikova and Gallagher 2020). Gross et al (2018)caution against too much focus on R&D 5
efforts for energy technologies to address climate change, including Mission Innovation. They argue 6
that given the timescales of commercialisation, developing new technologies now would mean they 7
would be commercially too late for addressing climate change. Huh and Kim (2018) discuss two 8
‘knowledge and technology transfer’ projects that were eventually not pursued through beyond the 9
feasibility study phase due to cooperation and commitment problems between national and local 10
governments and highlight the need for ownership and engagement of local residents and recipient 11
governments. 12
The intellectual property right regime (see Box 16.9) can be an enabler or a barrier to energy transition. 13
For more background on IPR and impact on innovation, see Section 16.4.6. 14
15
START BOX 16.9 HERE 16
Box 16.9 Intellectual property rights (IPR) regimes and technology transfer 17
In the global context of climate mitigation technologies, it has been noted that technologies have been 18
developed primarily in industrialised countries but are urgently required in fast-growing emerging 19
economies (Dechezleprêtre et al. 2011). International technology transfer of such technologies can 20
primarily take place via three channels: (i) trade in goods, where technology is embedded in products; 21
(ii) direct foreign investments (FDI), where enterprises transfer firm-specific technology to foreign 22
affiliates, and (iii) patent licenses, where third parties obtain the right to use technologies. IPRs are 23
relevant for all these three channels. 24
Not surprisingly, then, the role of IPRs in international technology transfer of climate mitigation 25
technologies has been much discussed but also described as particularly controversial (Abdel-Latif 26
2015). The relationships between IP rights, innovation, international technology transfer and local 27
mitigation and adaptation are complex (Maskus 2010; Li et al. 2020; Abdel-Latif 2015) and there is no 28
clear consensus on what kind of an IPR regime will be most beneficial for promoting technology 29
transfer. 30
Several studies argue that, particularly in developing nations, the global IP regime has resulted in 31
delayed access, reduced competition and higher prices (Littleton 2008; Zhuang 2017) and that climate-32
change-related technology transfer is insufficiently stimulated under the current IPR regime. 33
Compulsory licensing (as already used in medicine) is one of the routes proposed to repair this (Abdel-34
Latif 2015; Littleton 2008). 35
There is little systematic evidence that patents and other IPRs restrict access to environmentally sound 36
technologies, since these technologies mostly are in sectors based on mature technologies where 37
numerous substitutes among global competitors are available (Maskus 2010). This might however 38
change in the future, for instance with new technologies based on plants, via biotechnologies and 39
synthetic fuels (Maskus 2010), for which Correa et al (2020) already find some evidence. 40
There also is literature that suggests weak IPR regimes have a “strong and negative impact on the 41
international diffusion of patented knowledge” (Dechezleprêtre et al. 2013; Glachant and 42
Dechezleprêtre 2017). Also, patents may support market transactions in technology, including 43
international technology transfer, especially to “middle-income” countries and larger developing 44
countries (Maskus 2010; Hall and Helmers 2019) but LDCs may be better served by building capacity 45
to absorb and implement technology (Sanni et al. 2016; Hall and Helmers 2010; Maskus 2010; Glachant 46
ACCEPTED VERSION
SUBJECT TO FIN
AL EDITS

Final Government Draft Chapter 16 IPCC AR6 WGIII
Do Not Cite, Quote or Distribute 16-73 Total pages: 141
and Dechezleprêtre 2017). It is also argued that it is not even clear that the patent system as it exists 1
today is the most appropriate vehicle for encouraging international access (Sanni et al. 2016; Hall and 2
Helmers 2010; Maskus 2010; Glachant and Dechezleprêtre 2017). Given the large variation in 3
perspectives on the role of IPRs in technology transfer, there is a need for more evidence and analysis 4
to better understand if, and under what conditions, IPRs may hinder or promote technology transfer (see 5
also Technology Executive Committee (2012)). 6
In terms of ways forward to meet the challenge of climate change, different suggestions are made in the 7
context of IPRs that can help to further improve international technology transfer of climate mitigation 8
technologies, including through the TRIPS agreement, by making decisions on IPR to developing 9
countries on a case-by-case basis, by developing countries experimenting more with policies on IPR 10
protection, or through brokering or patent-pooling institutions (Littleton 2009; Dussaux et al. 2018; 11
Maskus and Reichman 2017). Others also suggests that distinctions among country groups be made on 12
basis of levels of technological and economic development, with least developed countries getting 13
particular attention (Abbott 2018; Zhuang 2017). 14
END BOX 16.9 HERE 15
16
16.5.4 Emerging ideas for international technology transfer and cooperation 17
As with the broader innovation literature (as highlighted in Section 16.3), and, in fact, drawing on such 18
literature, there has been an emergence of a greater understanding of, and emphasis on, the role of 19
innovation systems (at a national, sectoral, and technological level) as a way to help developing 20
countries with the climate technology transition (Technology Executive Committee 2015; Ockwell and 21
Byrne 2016). This has given rise to several proposals, discussed here and summarised in Figure 16.3. 22
Enhancing deployment and diffusion of climate technologies in developing countries would require a 23
variety of actors with sufficient capabilities (robust evidence, medium agreement) (Ockwell et al. 2018; 24
Kumar et al. 1999; Sagar et al. 2009). This may include strengthening existing actors (Malhotra et al. 25
2021), supporting science, technology, and innovation-based start-ups to meet social goals (Surana et 26
al 2020b), and developing entities and programs that are intended to address specific gaps relating to 27
technology development and deployment (Ockwell et al. 2018; Sagar et al. 2009). 28
There also is an increasing emphasis on the relevance of participative social innovation, local grounding 29
and policy learning as a replacement of the expert-led technological change (Kowarsch et al. 2016; 30
Chaudhary et al. 2012; Disterheft et al. 2015). Others have suggested a shift to international innovation 31
cooperation rather than technology transfer, which implies donor-recipient relationship. The notion of 32
innovation cooperation also makes more explicit the focus on innovation processes and systems 33
(Pandey et al. 2021). A broad transformative agenda therefore proposes that contemporary societal 34
challenges are complex and multi-variegated in scope and will require the actions of a diverse set of 35
actors to both formulate and address the policy, implying social, institutional and behavioural changes 36
next to technological innovations are the possible solutions (Geels 2004) (see also Cross-Chapter Box 37
12 in this chapter). 38
Several authors have proposed new mechanisms for international cooperation on technology. Ockwell 39
and Byrne (2016) argue that a role for the UNFCCC Technology Mechanism could be to support climate 40
relevant innovation-system builders (CRIBs) in developing countries, institutions locally that develop 41
capabilities that “form the bedrock of transformative, climate-compatible, technological change and 42
development”. Khan et al (2020) propose a specific variant with universities in developing countries 43
serving as ‘central hubs’ for capacity building to implement the NDCs as well as other climate policy 44
and planning instruments; they also suggest that developing countries outline their capacity building 45
needs more clearly in their NDCs. 46
ACCEPTED VERSION
SUBJECT TO FIN
AL EDITS

Final Government Draft Chapter 16 IPCC AR6 WGIII
Do Not Cite, Quote or Distribute 16-74 Total pages: 141
Building on an earlier discussion of technology-oriented and sectoral agreements (Meckling and Chung 1
2009) and the potential for international cooperation in energy-intensive industry (Åhman et al. 2017), 2
where deep emission reduction measures require transformative changes (see also Chapter 11), 3
Oberthür et al (2021) propose that the global governance for energy-intensive industry through sub-4
sector ‘clubs’ that include governmental, private and societal actors could be effective way forward 5
(Oberthür et al. 2021). 6
Examples of emerging ideas for international cooperation on climate technology, as well as their 7
relation to the objectives and existing efforts, and in relation to the level of development of the 8
innovation system around a technology (Bergek et al. 2008; Hekkert et al. 2007) or in nations (Lundvall 9
et al. 2009) are summarized in Figure 16.3. 10
11
Figure 16.3 Examples of recent mechanisms and emerging ideas (right column) in relation to level of 12
maturity of the national or technological innovation system, objectives of international climate technology 13
transfer efforts and current mechanisms and means. Sources: (Oberthür et al. 2021; Khan et al. 2020; 14
Ockwell and Byrne 2016; Sagar 2009) 15
16
17 ACCEPTED VERSION
SUBJECT TO FIN
AL EDITS

Final Government Draft Chapter 16 IPCC AR6 WGIII
Do Not Cite, Quote or Distribute 16-75 Total pages: 141
16.6 Technological change and sustainable development 1
This section considers technological innovation in the broader context of sustainable development, 2
recognising that technological change happens within social and economic systems, and therefore 3
technologies are conceived and applied in relation to those systems (Grübler 1998). Simplifications of 4
complex interactions between physical and social systems and incomplete knowledge of technological 5
innovation indirect effects may systematically lead to underestimation of environmental impacts and 6
overestimation of our ability to mitigate climate change (Arvesen et al. 2011; Hertwich and Peters 7
2009). 8
In previous sections, the chapter discussed how a systemic approach, appropriate public policies and 9
international cooperation on innovation can enhance technological innovation. This section provides 10
more details on how innovation and technological change, sustainable development and climate change 11
mitigation intertwine. 12
13
16.6.1 Linking sustainable development and technological change 14
Sustainable development and technological change are deeply related (UNCTAD 2019). Technology 15
has been critical for increasing productivity as the dominant driving force for economic growth but also, 16
the concentration of technology in few hands has boosted consumption of goods and services which are 17
not necessarily aligned with sustainable development goals (Walsh et al. 2020). It has been suggested 18
that, in order to address sustainable development challenges, science and technology actors would have 19
to change their relation to policymakers (Ravetz and Funtowicz 1999) as well as the public (Jasanoff 20
2003). This has been further elaborated for the SDGs. The scale and ambition of the SDGs call for a 21
change in development patterns that require a fundamental shift in both current best practices and 22
guidelines for technological and investment decisions and in the wider socio-institutional systems 23
(UNCTAD 2019; Pegels and Altenburg 2020). This is needed as not all innovation will lead to 24
sustainable development patterns (Altenburg and Pegels 2012; Lema et al. 2015). 25
Current Sustainable Development Goals (SDG) implementation gaps reflect, to some extent, inadequate 26
understanding of the complex relationships among the goals (Skene 2020; Waiswa et al. 2019), as well 27
as their synergies and trade-offs, including how they limit the range of responses available to 28
communities and governments, and potential injustices (Thornton and Comberti 2017). These 29
relationships have been approached by focusing primarily on synergies and trade-offs while lacking the 30
holistic perspective necessary to achieve all the goals (Nilsson et al. 2016; Roy et al. 2018). 31
A more holistic framework could envisage the SDGs as outcomes of stakeholder engagement and 32
learning processes directed at achieving a balance between human development and environmental 33
protection (Gibbons 1999; Jasanoff 2003), to the extent that the two can be separated. From a science, 34
technology and innovation (STI) perspective, Fu et al (2019) distinguish three categories of SDGs. The 35
first category comprises those SDGs representing essential human needs for which inputs that put 36
pressure on sustainable development would need to be minimized. These include food (SDG 2), water 37
(SDG 6) and energy (SDG 7) resources, which continue to rely on production technologies and practices 38
that are eroding ecosystem services, hampering the realization of SDG goals 15 (land) and 14 (oceans) 39
(Díaz et al. 2019). The second are those related to governance and which compete with each other for 40
scarce resources, such as infrastructure (SDG 9) and climate action (SDG 13), which require an 41
interdisciplinary perspective. The third category are those that require maximum realization, include no 42
poverty (SDG 1), quality education (SDG 4) and gender equality (SDG 5) (Fu et al. 2019). 43
Resolving tensions between the SDGs requires adoption and mainstreaming of novel technologies that 44
can meet needs while reducing resource waste and improving resource-use efficiency, and while 45
acknowledging the systemic nature of technological innovation, which involve many levels of actors, 46
ACCEPTED VERSION
SUBJECT TO FIN
AL EDITS

Final Government Draft Chapter 16 IPCC AR6 WGIII
Do Not Cite, Quote or Distribute 16-76 Total pages: 141
stages of innovation and scales (Anadon et al. 2016b). Changes in production technology have been 1
found effective to overcome trade-offs between food and water goals (Gao and Bryan 2017). Innovative 2
technologies at the food, water and energy nexus are transforming production processes in industrialized 3
and developing countries, such as developments in agrivoltaics, which is co-development of land for 4
agriculture and solar with water conservation benefits (Barron-Gafford et al. 2019; Schindele et al. 5
2020; Lytle et al. 2020), and other renewably powered low- to zero-carbon food, water and energy 6
systems (He et al. 2019). Silvestre and Ţîrcă (Silvestre and Ţîrcă 2019) indicate that maximising both 7
social and environmental aims is not possible, but that sustainable innovations include satisfactory 8
solutions for social, environmental and economic pillars (see Figure 16.4). 9
10
11
Figure 16.4: Considerations and typology of innovations for sustainable development (Silvestre and Ţîrcă 12
2019). 13
There is evidence that technological changes can catalyse implementation of the reforms needed to the 14
manner in which goods and services are distributed among people (Fu et al. 2019). A recently developed 15
theoretical framework based on a capability approach (CA) has been used to evaluate the quality of 16
human life and the process of development (Haenssgen and Ariana 2018). Variations of the CA have 17
been applied to exploratory studies of the link between technological change, human development, and 18
economic growth (Mayer 2001; Mormina 2019). This suggests that the transformative potential of 19
technology as an enabling condition is not intrinsic, but is assigned to it by people within a given 20
technological context. A failure to recognize and account for this property of technology is a root cause 21
ACCEPTED VERSION
SUBJECT TO FIN
AL EDITS

Final Government Draft Chapter 16 IPCC AR6 WGIII
Do Not Cite, Quote or Distribute 16-77 Total pages: 141
of many failed attempts at techno-fixing sustainable development projects (Stilgoe et al. 2013; Fazey et 1
al. 2020). 2
The basic rationale for governance of technological change is the creation and maintenance of an 3
enabling environment for climate and SDG-oriented technological change (Avelino et al. 2019). Such 4
an environment poses high demands on governance and policy to coordinate with actors and provide a 5
direction for innovation and technological change. Cross-Chapter Box 12 illustrates how the dynamics 6
of socio-technical transitions and shifting development pathways towards sustainable development 7
offer options for policymakers and other actors to accelerate the system transitions needed for both 8
climate change mitigation and sustainable development. Governance interventions to implement the 9
SDGs will need to be operationalized at sub-national, national and global levels and support integration 10
of resource concerns in policy, planning and implementation (UNEP 2015; Williams et al. 2020). 11
12
START CCB 12 HERE 13
Cross-Chapter Box 12 Transition Dynamics 14
Authors: Anthony Patt (Switzerland), Heleen de Coninck (the Netherlands), Xuemei Bai (Australia), 15
Paolo Bertoldi (Italy), Sarah Burch (Canada), Clara Caiafa (Brazil/the Netherlands), Felix Creutzig 16
(Germany), Renée van Diemen (the Netherlands/United Kingdom), Frank Geels (United Kingdom/the 17
Netherlands), Michael Grubb (United Kingdom), Maria Figueroa (Venezuela/Denmark), Şiir Kilkiş 18
(Turkey), Jonathan Köhler (Germany), Catherine Mitchell (United Kingdom), Lars J. Nilsson 19
(Sweden), Patricia Perkins (Canada), Yamina Saheb (France/Algeria), Harald Winkler (South Africa) 20
Introduction: Numerous studies suggest that transformational changes would be required in many 21
areas of society if climate change is to be limited to 2°C warming or less. Many of these involve shifts 22
to low carbon technologies, such as renewable energy, which typically involve changes in associated 23
regulatory and social systems; others more explicitly concern behavioural shifts, such as towards plant-24
based diets or cleaner cooking fuels, or, at the broadest level, a shift in development pathways. Chapter 25
1 establishes an analytic framework focusing on transitions, which chapters 5, 13, 14, 15 and 16 further 26
develop. In this cross-chapter box, we provide a complementary overview of the dynamics of different 27
kinds of transformational changes for climate mitigation and sustainable development. We first focus 28
on insights from socio-technical transitions approaches, and then expand to broader system transitions. 29
Dynamics of socio-technical transitions: A large literature documents the processes associated with 30
transformational changes in technology and the social systems associated with their production and use 31
(Köhler et al. 2019; Geels 2019). Transformational technological change typically goes hand-in-hand 32
with shifts in knowledge, behaviour, institutions, and markets (Markard et al. 2012, p. 956; Geels and 33
Schot 2010); stickiness in these factors often keeps society “locked-in” to those technologies already in 34
widespread use, rather than shift to new ones, even those that offer benefits (David 1985; Arthur 1994). 35
Exceptions often follow consistent patterns (Unruh 2002; Geels 2002); since AR5 a growing number 36
of scholars have suggested using these insights to design more effective climate policies and actions 37
(Geels et al. 2017). Chapter 1 (see Section 1.7 and Figure 1.6) represents technology diffusion and a 38
corresponding shift in policy emphasis as a continuous process; it is also useful to identify a sequence 39
of distinct stages that typically occur, associating each stage with a distinct set of processes, challenges, 40
and effective policies (Patt and Lilliestam 2018; Victor et al. 2019). Consistent with elsewhere in this 41
report (section 5.5.2 and SM.5.5.3 in Chapter 5, and section 16.3 in Chapter 16), Cross-Chapter Box 12 42
Figure 1 elaborates four distinct stages. Recognizing that even transformative technologies will 43
eventually be replaced with newer ones, the figure portrays these as occurring in a cycle. 44
45
ACCEPTED VERSION
SUBJECT TO FIN
AL EDITS

Final Government Draft Chapter 16 IPCC AR6 WGIII
Do Not Cite, Quote or Distribute 16-78 Total pages: 141
1
Cross-Chapter Box 12, Figure 1 Stages of socio-technical transition processes 2
The emergence stage is marked by experimentation, innovation in the laboratory, and demonstration in 3
the field, to produce technologies and system architectures (Geels 2005a). By its very nature, 4
experimentation includes both successes and failures, and implies high risks. Because of these risks, 5
especially in the case of fundamentally new technologies, government funding for research, 6
development and demonstration (RD&D) projects is crucial to sustaining development (Mazzucato 7
2015b). 8
The second stage is early adoption, during which successful technologies jump from the laboratory to 9
limited commercial application (Pearson and Foxon 2012). Reaching this stage is often described as 10
crossing the “Valley of Death”, because the cost/performance ratio for these new market entrants is too 11
low for them to appear viable to investors (Murphy and Edwards 2003). A key process in the early 12
adoption phase is induced innovation, a result of incremental improvements in both design and 13
production processes, and of mass-production of a growing share of key components (Grubb et al. 2021; 14
Nemet 2006). There is diversity across classes of technologies, and learning tends to occur faster for 15
technologies that are modular (Wilson et al. 2020), such as photovoltaics, and slower for those that 16
require site- or context-specific engineering, such as in the shift to low carbon materials production 17
(Malhotra and Schmidt 2020). Public policies that create a secure return on investment for project 18
developers can lead to learning associated with industry expansion (See Chapter 16, Figure 16.1); 19
typically these are economically and politically viable when they promote growth within a market 20
“niche”, causing little disruption to the mainstream market (Roberts et al. 2018). Direct support 21
mechanisms, including cross-subsidies, such as feed-in tariffs, and market quotas such as renewable 22
portfolio standards, are effective (Patt and Lilliestam 2018; Geels et al. 2017b; see Chapter 9 for 23
assessment of early adoption policies in the building sector). The value of these policies is less in their 24
immediate emissions reductions, but more in generating the conditions for self-sustaining 25
transformational change to take place as technologies later move from niche to mainstream (Hanna and 26
Victor 2021). 27
The third stage, diffusion, is where niche technologies become mainstream, with accelerating diffusion 28
rates (see Chapter 1, Sections 1.7 and 16.4), and is marked by changes to the socio-technical “regime”, 29
including infrastructure networks, value chains, user practices, and institutions. This stage is often the 30
most visible and turbulent, because more widespread adoption of a new technology gives rise to 31
ACCEPTED VERSION
SUBJECT TO FIN
AL EDITS
Final Government Draft Chapter 16 IPCC AR6 WGIII
Do Not Cite, Quote or Distribute 16-79 Total pages: 141
structural changes in institutions and actors’ behaviour (e.g. increased adoption of smart phones to new 1
payment systems and social media), and because when incumbent market actors become threatened, 2
they often contest policies promoting the new technologies (Köhler et al. 2019). In the diffusion stage, 3
policy emphasis is shifted from financial support during the early adoption stage, towards supporting 4
regime-level factors needed to sustain, or cope with, rapid and widespread diffusion (Markard 2018). 5
These factors and policies are context specific. For example, Patt et al. (Patt et al. 2019) document that 6
the policies needed to expand residential charging networks for electric vehicles depend on the local 7
structure of the housing market. 8
The fourth stage is stabilisation, in which the new technologies, systems, and behaviours are both 9
standardized and insulated from rebound effects and backsliding (Andersen and Gulbrandsen 2020). 10
Sectoral bans on further investment in high carbon technologies may become politically feasible at this 11
point (Breetz et al. 2018; Economidou et al. 2020). The decline of previously dominant products or 12
industries can lead to calls for policy-makers to help those negatively affected, enabling a just transition 13
(Newell and Simms 2020; McCauley and Heffron 2018). Political opposition to the system 14
reconfiguration that comes with integration and stabilization can also be overcome by offering 15
incumbent actors an attractive exit strategy (de Gooyert et al. 2016). 16
Because different sectors are at different stages of low-carbon transitions, and because the barriers that 17
policies need to address are stage- and often context-specific, effective policies stimulating socio-18
technical transitions operate primarily at the sectoral level (Victor et al. 2019). This is particularly the 19
case during early adoption, where economic barriers predominate; during diffusion, policies that 20
address regime-level factors often need to deal with cross-sectoral linkages and coupling, such as those 21
between power generation, transportation, and heating (Patt 2015; Bloess 2019; Fridgen et al. 2020). 22
The entire cycle can take multiple decades. However, later stages can go faster by building on the earlier 23
stages’ having taken place elsewhere. For example, early RD&D into wind energy took place primarily 24
in Denmark, was followed by early adoption in Denmark, Germany, and Spain, before other countries, 25
including the United States, India, and China leapfrogged directly to the diffusion stage (Lacal-26
Arántegui 2019; Chaudhary et al. 2015; Dai and Xue 2015). A similar pattern played out for solar power 27
(Nemet 2019b). International cooperation, geared towards technology transfer, capacity and institution-28
building, and finance, can help ensure that developing countries leapfrog to low-carbon technologies 29
that have undergone commercialization elsewhere (Adenle et al. 2015; Fankhauser and Jotzo 2018)(see 30
also Chapter 5, Box 5.9, Chapter 15, Section 15.5 and Section 16.5 in this chapter).. 31
This report contains numerous examples of the positive feedbacks in the centre of Cross-Chapter Box 32
12, Figure 1, predominantly arising during the early adoption and diffusion stages, and leading to rapid 33
or unexpected acceleration of change. Public acceptance of alternatives for meat leads to firms 34
improving the products, increasing political and economic feedbacks (Chapter 5, Section 5.4, Box 5.5). 35
Declining costs in solar and wind cause new investment in the power generation sector being dominated 36
by those technologies, leading to increased political support and further cost reductions (Chapter 6). In 37
buildings (Chapter 9) and personal mobility (Chapter 10), low-carbon heating systems and electric 38
passenger vehicles are gaining public acceptance, leading to improved infrastructure and human 39
resources, more employment in those sectors, and behavioural contagion. Some have argued that 40
technologies cross societal tipping points on account of these feedbacks (Obama 2017; Sharpe and 41
Lenton 2021). 42
Dynamics between enabling conditions for system transitions: Abson et al. (2017) argue that it is 43
possible to make use of “leverage points” inherent in system dynamics in order to accelerate 44
sustainability transitions. Otto et al. (2020b) argue that interventions geared towards the social factors 45
driving change can “activate contagious processes” leading towards the transformative changes 46
required for climate mitigation. These self-reinforcing dynamics involve the interaction of enabling 47
conditions including public policy and governance, institutional and technological innovation capacity, 48
ACCEPTED VERSION
SUBJECT TO FIN
AL EDITS

Final Government Draft Chapter 16 IPCC AR6 WGIII
Do Not Cite, Quote or Distribute 16-80 Total pages: 141
behaviour change, and finance. For example, Mercure et al. (2018) simulated financial flows into fossil-1
fuel extraction, and showed how investors’ taking into account transition risk in combination with 2
technological innovation would lead to the enhancement of investments in low-carbon assets and further 3
enhanced innovation. As another example, behaviour, lifestyle, and policy can also initiate demand-4
side transitions (Chapter 5) (Tziva et al. 2020), such as with food systems (Rust et al. 2020) (Chapter 5
7, section 7.4.5), and can contribute to both resilience and carbon storage (Sendzimir et al. 2011) 6
(Chapter 16, Box 16.5). 7
In the urban context, the concept of sustainability experiments has been used to examine innovative 8
policies and practices adopted by cities that have significant impact on transition towards low-carbon 9
and sustainable futures (Bai et al. 2010; Castán Broto and Bulkeley 2013). Individual innovative 10
practices can potentially be upscaled to achieve low-carbon transition in cities (Peng and Bai 2018), 11
leading to a process of broadening and scaling innovative practices in other cities (Peng et al. 12
2019). Such sustainability experiments give rise to new actor networks, which in some cases may 13
accelerate change, and in others may lead to conflict (Bulkeley et al. 2014). As in the diffusion phase 14
in Cross-Chapter Box 12, Figure 1, contextual factors play a strong role. Examining historical 15
transitions to cycling across European cities, Oldenziel et al. (2016) found contextual factors including 16
specific configurations of actors to lead to very different outcomes. Kraus and Koch (2021) found a 17
short-term social shock – the COVID crisis – to lead to differential increases in cycling behaviour, 18
contingent on other enabling conditions. 19
Linking system dynamics to development pathways and broader societal goals: Transition 20
dynamics insights can be broadened to shifting development pathways. Development paths are 21
characterised by particular sets of interlinking regime rules and behaviours, including inertia and 22
cascading effects over time, and are reinforced at multiple levels, with varied capacities and constraints 23
on local agency occurring at each level (Burch et al. 2014)(See also Cross-Chapter Box 5 in Chapter 24
4). This is also observed by Schot and Kanger (2018), who identify a needed change in a “meta-25
regime”, crossing sectoral lines in linking value-chains or infrastructure and overall development 26
objectives. In the context of the UN climate change regime, international cooperation can bring together 27
such best practices and lessons learnt (Pandey et al. 2021; Adenle et al. 2015). This is especially relevant 28
for developing countries, which often depend on technologies and financial resources from abroad, 29
witnessing their pace and direction influenced by transnational actors (Bhamidipati et al. 2019; 30
Marquardt et al. 2016), and benefiting little in terms of participating in high value-added activities 31
(Whittaker et al. 2020). 32
System transitions differ according to context, such as across industrialized and developing countries 33
(Ramos-Mejía et al. 2018), and within countries. Lower levels of social capital and trust negatively 34
impact niche commercialization (Lepoutre and Oguntoye 2018). In contexts of poverty and inequality, 35
stakeholders’ – including users’ – capabilities for meaningful participation are limited and transition 36
outcomes can end up marginalizing or further excluding social groups (Osongo and Schot 2017; Hansen 37
et al. 2018). Many studies of transitions in developing countries make note of the importance of 38
innovation in the informal sector (Charmes 2016, Box 5.10). Facilitating informal sector access to 39
renewable energy sources, safe and sustainable buildings, and finance can advance low-carbon 40
transitions (McCauley et al. 2019; Masuku and Nzewi 2021). Contrary, disregarding its importance can 41
result in misleading or ineffective innovation and climate strategies (Maharajh and Kraemer-Mbula 42
2010; Mazhar and Ummad 2014; de Beer et al. 2016; Masuku and Nzewi 2021). 43
Policies shifting innovation in climate-compatible directions can also reinforce other development 44
benefits, for instance better health, increased energy access, poverty alleviation and economic 45
competitiveness (Deng et al. 2018b; Karlsson et al. 2020; IPCC 2018a). Development benefits, in turn, 46
can create feedback effects that sustain public support for subsequent policies and hence help to secure 47
effective long-term climate mitigation (Meckling et al. 2015b; Geels 2014b; Schmidt and Sewerin 48
ACCEPTED VERSION
SUBJECT TO FIN
AL EDITS

Final Government Draft Chapter 16 IPCC AR6 WGIII
Do Not Cite, Quote or Distribute 16-81 Total pages: 141
2017b; Breetz et al. 2018), increasing legitimacy of environmental sustainability actions (Hansen et al. 1
2018; van Welie and Romijn 2018; Herslund et al. 2018) and addressing negative socio-economic 2
impacts (Eisenberg 2019; McCauley and Heffron 2018; Henry et al. 2020a; Deng et al. 2018b). 3
Summary and gaps in knowledge: Strategies to accelerate climate mitigation can be most effective at 4
accelerating and achieving transformative change when they are synchronized with transition processes 5
in systems. They address technological stage characteristics, take advantage of high-leverage 6
intervention points, and respond to societal dynamics (Abson et al. 2017; Köhler et al. 2019; Geels et 7
al. 2017). Gaps in knowledge remain on how to tailor policy mixes, the interaction of enabling 8
conditions, the generalizability of socio-technical transition insights to other types of systems, and how 9
to harness these insights to better shift development pathways. 10
END CCB 14 HERE 11
12
16.6.2 Sustainable development and technological innovation: Synergies, trade-offs and 13
governance 14
16.6.2.1 Synergies and trade-offs 15
Policies that shift innovation in climate compatible directions can promote other development benefits, 16
for instance better health, increased energy access, poverty alleviation and economic competitiveness 17
(Deng et al. 2018a, see also Cross-Chapter Box 12). Economic competitiveness co-benefits can emerge 18
as climate mitigation policies trigger innovation that can be leveraged for promoting industrial 19
development, job creation and economic growth, both in terms of localizing low-emission energy 20
technologies value chains as well as of increased energy efficiency and avoided carbon lock-ins (Section 21
16.4). However, without adequate capabilities, co-benefits at the local level would be minimal, and they 22
would probably materialize far from where activities take place (Vasconcellos and Caiado Couto 2021; 23
Ockwell and Byrne 2016). Innovation and technological change can also empower citizens. Grass-roots 24
innovation promotes the participation of grass-roots actors, such as social movements and networks of 25
academics, activists and practitioners, and facilitate experimenting with alternative forms of knowledge 26
creation (UNCTAD 2019; Seyfang and Smith 2007). Examples of ordinary people and entrepreneurs 27
adopting and adapting technologies to local needs to address locally defined needs have been 28
documented in the development literature (van Welie and Romijn 2018) (See also Box 16.10). Digital 29
technologies can empower citizens and communities in decentralized energy systems contributing not 30
only to a more sustainable but also to a more democratic and fairer energy system (Van Summeren et 31
al. 2021) (See also Cross-Chapter Box 11 in this chapter, and Section 5.4 in Chapter 5). 32
Therefore, even though STI is an explicit focus of SDG 9, it is in fact an enabler of most SDGs 33
(UNCTAD 2019). Striving for synergies between innovation and technological change for climate 34
change mitigation with other SDGs can help to secure effective long-term climate mitigation, as 35
development benefits can create feedback effects that sustain public and political support for subsequent 36
climate mitigation policies (Meckling et al. 2015a; Geels 2014a, also Cross-Chapter Box 12). However, 37
innovation is not always geared to sustainable development, for instance, firms tend to know how to 38
innovate when value chains are left intact (Hall and Martin 2005), which tend to not be the case in 39
systemic transitions. 40
A comprehensive study of these effects distinguishes among “…anticipated-intended, anticipated-41
unintended, and unanticipated-unintended consequences” (Tonn and Stiefel 2019). Theoretical and 42
empirical studies have demonstrated that unintended consequences are typical of complex adaptive 43
systems, and while a few are predictable, a much larger number are not (Sadras 2020). Even when 44
unintended consequences are unanticipated, they can be prevented through actor responses, for instance 45
rebound effects following the introduction of energy efficient technologies. Other examples of 46
ACCEPTED VERSION
SUBJECT TO FIN
AL EDITS

Final Government Draft Chapter 16 IPCC AR6 WGIII
Do Not Cite, Quote or Distribute 16-82 Total pages: 141
unintended consequences include worse-than-expected physical damage to infrastructure and resistance 1
from communities in the rapidly growing ocean renewable energy sector (Quirapas and Taeihagh 2020), 2
and gaps between expected and actual performance of building integrated photovoltaic (BIPV) 3
technology (Boyd and Schweber 2018; Gram-Hanssen and Georg 2018). In the agricultural sector, new 4
technologies and associated practices that target the fitness of crop pests have been found to favour 5
resistant variants. Unintended consequences of digitalisation are reported as well (Lynch et al. 2019) 6
(see Cross-Chapter Box 11 in this chapter). 7
Innovation and climate mitigation policies can also have negative socio-economic impacts and not all 8
countries, actors and regions around the world benefit equally from rapid technological change 9
(UNCTAD 2019; Eisenberg 2019; McCauley and Heffron 2018; Henry et al. 2020b; Deng et al. 2018a). 10
In fact, socio-technical transitions often create winners and losers (Roberts et al. 2018). Technological 11
change can reinforce existing divides between women and men, rural and urban populations, and rich 12
and poor communities, as older workers displaced by technological change will not qualify for jobs if 13
they were unable to acquire new skills, weak educational systems may not prepare young people for 14
emerging employment opportunities, and disadvantaged social groups, including women in many 15
countries, often have fewer opportunities for formal education (UNCTAD 2019; McCauley and Heffron 16
2018). That is a risk regarding technological change for climate change mitigation, as emerging 17
evidence suggests that the energy transition can create jobs and productivity opportunities in the 18
renewable energy sector, but will also lead to job losses in fossil fuel and exposed sectors (Le Treut et 19
al. 2021). At the same time these new jobs may use more intensively high-level cognitive and 20
interpersonal skills compared to regular, traditional jobs, requiring higher levels of human capital 21
dimensions such as formal education, work experience and on-the-job training (Consoli et al. 2016). 22
Despite the empowerment potentials of decentralized energy systems, not all societal groups are equally 23
positioned to benefit from energy community policies, with issues of energy justice taking place within 24
initiatives, between initiatives and related actors, as well as beyond initiatives (van Bommel and 25
Höffken 2021; Calzadilla and Mauger 2018). 26
The opportunities and challenges of technological change can also differ within country regions and 27
between countries (e.g. Garcia-Casals et al. 2019). Within countries, Vasconcellos and Caiado Couto 28
(2021) show that, in the absence of policies and capacity building activities which promote local 29
recruiting, a significant part of total benefits of wind projects, especially high-income jobs and high 30
value-added activities, is captured by already higher income regions. Between countries, developing 31
countries usually have lower innovation capabilities, which means they need to import low-emission 32
technology from abroad and are also less able to adapt these technologies to local conditions and create 33
new markets and business models. This can lead to external dependencies and limit opportunities to 34
leverage economic benefits from technology transfer (Section 16.5.1). 35
This means that in countries below the technological frontier, the contribution of technological change 36
to climate change mitigation can happen primarily through the adoption and less through the 37
development of new technologies, which can reduce potential economic and welfare benefits from rapid 38
technological change (UNCTAD 2019). The adoption of consumer ICT technologies (Baller et al. 2016) 39
or renewable energy technologies (Lema et al. 2021) cannot bring least developed economies close to 40
the technological frontier without appropriate technological capabilities in other sectors and an enabling 41
innovation system (UNCTAD 2019; Malhotra et al. 2021; Vasconcellos and Caiado Couto 2021; Sagar 42
and Majumdar 2014; Ockwell and Mallett 2012; Ockwell et al. 2018). It has been argued widely that 43
both hard and soft infrastructure, as well as appropriate policy frameworks and capability building, 44
would facilitate developing countries engagement in long-term technological innovation and 45
sustainable industrial development, and eventually in achieving the SDGs (UNCTAD 2019; Ockwell 46
and Byrne 2016; Altenburg and Rodrik 2017). 47
ACCEPTED VERSION
SUBJECT TO FIN
AL EDITS

Final Government Draft Chapter 16 IPCC AR6 WGIII
Do Not Cite, Quote or Distribute 16-83 Total pages: 141
16.6.2.2 Challenges to governing innovation for sustainable development 1
Dominant economic systems and centralized governance structures continue to reproduce unsustainable 2
patterns of production and consumption, reinforcing many economic and governance structures from 3
local through national and global scales (Johnstone and Newell 2018). Technological change, as an 4
inherently complex process (Funtowicz 2020), poses governance challenges (Bukkens et al. 2020) 5
requiring social innovation (Repo and Matschoss 2019) (See also Section 5.6 in Chapter 5, and Chapter 6
13). 7
Prospects for effectively governing SDG-oriented technological transformations require at a minimum 8
balanced views and new tools for securing the scientific legitimacy and credibility to connect public 9
policy and technological change in our society (Sadras 2020; Jasanoff 2018). Many frameworks of 10
governance have been proposed, such as reflexive governance (Voss et al. 2006), polycentric 11
governance (Ostrom 2010), collaborative governance (Bodin 2017), adaptive governance (Munene et 12
al. 2018) and transformative governance (Rijke et al. 2013; Westley et al. 2013) (see also Chapters 13 13
and 14). 14
A particular class of barriers to the development and adoption of new technologies comprises 15
entrenched power relations dominated by vested interests that control and benefit from existing 16
technologies (Chaffin et al. 2016; Dorband et al. 2020). Such interests can generate balancing feedbacks 17
within multi-level social-technological regimes that are related to technological lock-in, including 18
allocations of investment between fossil and renewable energy technologies (Unruh 2002; Sagar et al. 19
2009; Seto et al. 2016). 20
Weaker coordination and implementation capacity in some developing countries can undermine ability 21
to avoid trade-offs with other development objectives, like reinforced inequalities or excessive 22
indebtedness and increased external dependency, and can limit the potential of leveraging economic 23
benefits from technologies transferred from abroad (Section 16.5, Cross-Chapter Box 12). Van Welie 24
and Romijn (2018) show that in a low-income setting the exclusion of some local stakeholders from the 25
decision-making process may undermine sustainability transitions efforts. Countries with high levels of 26
inequality can be more prone to elite capture, non-transparent political decision making processes, 27
relations based on clientelism and patronage, and no independent judiciary (Jasanoff 2018), although 28
in particular contexts, non-elites manage to exert influence (Moldalieva and Heathershaw 2020). The 29
dominance of incumbents however implies that sustainable technological transitions could be achieved 30
without yielding any social and democratic benefits (Hansen et al. 2018). In the cultural domain, a 31
recurrent policy challenge that has been observed in most countries is the limited public support for 32
development and deployment of low carbon technologies (Bernauer and McGrath 2016). The 33
conventional approach to mobilizing such support has been to portray technological change as a means 34
of minimizing climate change. Empirical studies show that simply reframing climate policy is highly 35
unlikely to build and sustain public support (Bernauer and McGrath 2016). 36
Finally, there is a link between social and technological innovation; any innovation is grounded in 37
complex socio-economic arrangements, to which governance arrangements would need to respond (see 38
Sections 5.5 and 5.6, Chapter 13, and Cross-Chapter Box 12 in this chapter). Social innovation can 39
contribute to maximizing synergies and minimizing trade-offs in relation to technological innovation 40
and other innovative practices, but for this to materialize, national, regional and local circumstances 41
need to be taken into account and, if needed, changed. Even in circumstances of high capabilities, the 42
extent social innovation might help to promote synergies and avoid trade-offs is not easy to evaluate 43
(Grimm et al. 2013). 44
ACCEPTED VERSION
SUBJECT TO FIN
AL EDITS

Final Government Draft Chapter 16 IPCC AR6 WGIII
Do Not Cite, Quote or Distribute 16-84 Total pages: 141
16.6.3 Actions that maximise synergies and minimise trade-offs between innovation and 1
sustainable development 2
Technological innovation may bring significant synergy in pursuing sustainable development goals, but 3
it may also create challenges to the economy, human well-being, and the environment (Thacker et al. 4
2019; Schillo and Robinson 2017; Walsh et al. 2020). The degree of potential synergies and trade-offs 5
among SDG differs from country to country and over time (see section 16.6.1.1). These potentials will 6
depend upon available resources, geographical conditions, development stage and policy measures. 7
Even though synergies and trade-offs related to technological innovation have received the least 8
attention from researchers (Deng et al. 2018a), literature show that higher synergy was found where 9
countries’ policies take into account the linkages between sectors (Mainali et al. 2018). For technology 10
innovation to be effective in enhancing synergies and reducing trade-offs, its role and nature in 11
production and consumption patterns, as well as in value chains and in the wider economy, requires 12
clarification. Technology ownership and control together with its current orientation and focus towards 13
productivity needs to be revised if a meaningful contribution to the implementation of the SDGs in a 14
transformative way is to be achieved (Walsh et al. 2020). Responsible innovation, combining 15
anticipation, reflexivity, inclusion and responsiveness, has been suggested as a framework for 16
conducting innovation (Stilgoe et al. 2013). Also inclusive innovation (Hoffecker 2021) could make 17
sure that unheard voices and interests are included in decision-making, and methods for this have been 18
implemented in practice (Douthwaite and Hoffecker 2017). 19
There are several examples on how to maximize synergies and avoid or minimize trade-offs when 20
bringing technological innovation to the ground. When implementing off-grid solar energy in Rwanda, 21
synergies were found between 80 of the 169 SDG targets, demonstrating how mainstreaming off-grid 22
policies and prioritising investment in the off-grid sector can realise human development and well-23
being, build physical and social infrastructures, and achieve sustainable management of environmental 24
resources (Bisaga et al. 2021). Another example is related to wind power in Northeast of Brazil where 25
the creation of direct and indirect jobs has been demonstrated in areas where capabilities are high, as 26
well as associated improvements in wholesale and retail trade and real estate activities, though this also 27
emphasises the need for capacity development along with international collaboration projects 28
(Vasconcellos and Caiado Couto 2021). Other examples are studies raising awareness on solar energy 29
and women empowerment (Winther et al. 2018) and recycling and waste (Cross and Murray 2018). 30
Other actions with the potential to maximize synergies are those related to community or “grassroot” 31
technological innovation. The importance of the link between technological innovation and community 32
action and its contribution to sustainable development is usually underestimated, and requires further 33
research and, most importantly, its inclusion in the political agenda on sustainable development 34
(Seyfang and Smith 2007). On the other hand, when technological innovation occurs far from where is 35
implemented and participation in the production, and hence training activities of local actors is minimal, 36
co-benefits and synergies among SDGs are limited and usually far below expectations (Vasconcellos 37
and Caiado Couto 2021; Bhamidipati and Hansen 2021). Actions by policymakers that safeguard 38
environmental and social aspects can boost synergies and maximize those co-benefits (Lema et al. 39
2021). Given that technological change impacts countries, regions and social groups differently, just 40
transition policies can be designed to ensure all regions and communities are able to take advantage of 41
the energy and other transitions (Henry et al. 2020b; McCauley and Heffron 2018). 42
Box 16.10 provides insights on how a systemic approach to technological innovation can contribute to 43
reconcile synergies and trade-offs to achieve sustainable development and mitigation goals. 44
45
START BOX 16.10 HERE 46
ACCEPTED VERSION
SUBJECT TO FIN
AL EDITS

Final Government Draft Chapter 16 IPCC AR6 WGIII
Do Not Cite, Quote or Distribute 16-85 Total pages: 141
Box 16.10 Agroecological approaches: the role of local and indigenous knowledge and 1
innovation 2
Major improvements in agricultural productivity have been recorded over recent decades (FAO 2018a). 3
However, progress has also come with social and environmental costs, high levels of greenhouse gas 4
emissions and rising demand for natural resources (UNEP 2017; Bringezu 2019; UNEP 2013; Díaz et 5
al. 2019; FAO 2018a). 6
Trend analysis indicate that, of global demand for land, a large share is projected to be supplied by 7
South America, in particular the Amazon (Lambin and Meyfroidt 2011; TEEB 2018) and Chaco forests 8
(Grau et al. 2015). In developing countries, land use change for satisfying international meat demand is 9
leading to deforestation. In Brazil, the amount of GHG emitted only by the beef cattle sector represents 10
65% of the emissions of the agricultural sector and 15% of the overall emissions of the country (May 11
2019). 12
Agricultural and food systems are complex and diverse; they include traditional food systems, mixed 13
food systems and modern food systems (Pengue et al. 2018). Multiple forms of visible and invisible 14
flows of natural resources exist in global food systems (Pascual et al. 2017; IPBES 2019; TEEB 2018). 15
Technological practices, management and changes in the food chain could help adapt to climate change, 16
reduce emissions and absorb carbon in the soils, thus contributing to carbon dioxide removal (IPCC, 17
2018, 2019). A range of technologies can be implemented, from highly technological options such as 18
transgenic crops resistant to drought (González et al. 2019), salt or pesticides resistance (OECD 2011b; 19
Kim and Kwak 2020) or smart and 4.0 agriculture (Klerkx et al. 2019), to more frugal, low-cost 20
technologies such as agroecological approaches adapted to local circumstances (Francis et al. 2003; 21
FAO 2018b). These agroecological approaches are the subject of this box. 22
For developing countries, agroecological approaches could tackle both climate change challenges and 23
food security (WGII-report, Chapter 5, Box 5.10). In SIDSs, they support livelihoods to develop local 24
food value chains can promote sustainable management of natural resources, preserve biodiversity and 25
help build resilience to climate change impacts and natural disasters (FAO 2019). Other advantages of 26
agroecological practices include their adaptation to different social, economic and ecological 27
environments (Altieri and Nicholls 2017), the fact that they are physical and financial capital-extensive, 28
and are well-integrated with the social and cultural capital of rural territories and local resources 29
(knowledge, natural resources, etc.), without leading to technological dependencies (Côte et al. 2019). 30
Agroecology is a dynamic concept that has gained prominence in scientific, agricultural and political 31
discourses in recent years (Wezel et al. 2020; Anderson et al. 2021) (Chapter 7 - Agroecology (including 32
Regenerative Agriculture); Chapter 5 WGII Box 5.10). There are different agroecological approaches, 33
three of which will be briefly discussed here: agroecological intensification, agroforestry and biochar 34
use in rice paddy fields. 35
Agricultural intensification provides ways to use land, water and energy resources to ensure adequate 36
food supply while also addressing concerns about climate change and biodiversity (Cassman and 37
Grassini 2020). The term ecological intensification (Tittonell 2014) focuses on biological and 38
ecological processes and functions in agroecosystems. In line with the development of the concept of 39
agroecology, agroecological intensification integrates social and cultural perspectives (Wezel et al. 40
2015). Agroecological intensification (Mockshell and Villarino 2019) for sub-Saharan Africa aims to 41
address both employment and food security challenges (Pretty et al. 2011; Altieri et al. 2015). 42
Another example of an agroecological approach is agroforestry. Agroforestry provides examples of 43
positive agroecological feedbacks, such as ‘the regreening of the Sahel’ in Niger. The practice is based 44
on the assisted natural regeneration of trees in cultivated fields, an old method which was slowly dying 45
ACCEPTED VERSION
SUBJECT TO FIN
AL EDITS

Final Government Draft Chapter 16 IPCC AR6 WGIII
Do Not Cite, Quote or Distribute 16-86 Total pages: 141
out but which innovative public policies (the transfer of property rights over trees from the state to 1
farmers) helped restore (Sendzimir et al. 2011). 2
Rice paddy fields are a major source of methane. Climate change impacts and adaptation strategies can 3
affect rice production and net income of rice farmers. Biochar use in rice paddy fields has been 4
advocated as a potential strategy to reduce GHG emissions from soils, enhance soil carbon stocks and 5
nitrogen retention, and improve soil function and crop productivity (Mohammadi et al. 2020). 6
Contributions of indigenous people (Díaz et al. 2019), heritage agriculture (Koohafkan and Altieri 7
2010) and peasants agroecological knowledge (Holt-Giménez 2002) to technological innovation offer 8
a wide array of options for management of land, soils, biodiversity and enhanced food security without 9
depending on modern, foreign agricultural technologies (Denevan 1995). In farming agriculture and 10
food systems, innovation and technology based on nature could help to reduce climate change impacts 11
(Griscom et al. 2017). Evidence suggests that there are benefits to integrating tradition with new 12
technologies in order to design new approaches to farming, and that these are greatest when they are 13
tailored to local circumstances (Nicholls and Altieri 2018). 14
END BOX 16.10 HERE 15
16
16.6.4 Climate change, sustainability development and innovation 17
This section gives a synthesis of this chapter on innovation and technology development and transfer, 18
connecting it to sustainable development. 19
In conjunction with other enabling conditions, technological innovation can support system transitions 20
to limit warming, help shift development pathways, and bring about new and improved ways of 21
delivering goods and services that are essential to human well-being (high confidence). At the same 22
time, however, innovation can result in trade-offs that undermine both progress on mitigation and 23
progress towards other sustainable development goals. Trade-offs include negative externalities such 24
as environmental impacts and social inequalities, rebound effects leading to lower net emission 25
reductions or even increases in emissions, and increased dependency on foreign knowledge and 26
providers (high confidence). Digitalisation, for example, holds both opportunity for emission reduction 27
and emission-saving behaviour change, but at the same time causes significant environmental, social 28
and GHG impacts (high confidence). 29
A systemic view of innovation, that takes into account the roles of actors, institutions, and their 30
interactions, can contribute to both enhanced understanding of processes and outcomes of technological 31
innovation, and to interventions and arrangements that can help innovation. It can also play a role in 32
clarifying the synergies and trade-offs between technological innovation and the SDGs. Effective 33
governance and policy, implemented in an inclusive, responsible and holistic way, could both make 34
innovation policy more effective, and avoid and minimise misalignments between climate change 35
mitigation, technological innovation, and other societal goals (medium evidence, high agreement). 36
A special feature is the dynamics of transitions. Like other enabling conditions, technological 37
innovation plays both a balancing role, by inhibiting change as innovation strengthens incumbent 38
technologies and practices, and a reinforcing role, by allowing new technologies and practices to disrupt 39
the existing socio-technical regimes (high confidence). Appropriate innovation policies can help 40
organise innovation systems better, while other policies (technology push and demand pull) can provide 41
suitable resources and incentives to support and guide these innovation systems towards societally-42
desirable outcomes, ensure the innovations are deployed at scale, and direct these dynamics not just 43
towards system transitions for climate change mitigation, but also towards addressing other SDGs. This 44
means taking into account the full life-cycle or value chain as well as analysis of synergies and trade-45
offs. 46
ACCEPTED VERSION
SUBJECT TO FIN
AL EDITS

Final Government Draft Chapter 16 IPCC AR6 WGIII
Do Not Cite, Quote or Distribute 16-87 Total pages: 141
Against this backdrop, international cooperation on technological innovation is one of the enablers of 1
climate action in developing countries on both mitigation and adaptation (high confidence). Experiences 2
with international cooperation on technology development and deployment suggest that such activities 3
are most effective when approached as “innovation cooperation” that engenders a holistic, systemic 4
view of innovation requirements, is done in equitable partnership between donors and recipients, and 5
develops local innovation capabilities (medium evidence, high agreement). 6
Chapter 17, in particular Section 17.4, connects technological innovation with other enabling 7
conditions, such as behaviour, institutional capacity and multi-level governance, to clarify the actions 8
that could be taken, holistically and in conjunction, to strengthen and accelerate the system transitions 9
required to limit warming to be in line with the Paris Agreement and to place countries in sustainable 10
development pathways. 11
12
16.7 Knowledge gaps 13
Filling gaps in literature availability, data collection, modelling, application of frameworks and further 14
analysis in several sectors will improve knowledge on innovation and technology development and 15
transfer, including R&D to support policy making in climate change mitigation as well as adaptation. 16
These policies and related interventions need to benefit from data and methodologies for the ex-post 17
evaluation of their effectiveness. 18
This section addresses identified knowledge gaps related to what extent developing countries are 19
represented in studies on innovation and technology development and transfer; to national contexts and 20
local innovation capacity; to potential and actual contributions of businesses; to literature emphasis on 21
mitigation; to indicators to assess innovation systems; to non-technical barriers for the feasibility of 22
decarbonisation pathways; to the role of domestic IPR policy; to digitalisation in low-emissions 23
pathways; to the compliance of Paris Agreement in regard to technology and capacity building. 24
One of knowledge gap identified when assessing the literature is on the representation of developing 25
countries in studies on innovation and technology development and transfer. This includes the 26
conceptual core disciplines of the economics of innovation, innovation systems and sustainability 27
transitions. This goes both for studies on developing countries, and for authors originating from, or 28
active in, developing countries contexts. The evidence of the impact of decarbonisation policy 29
instruments applied to developing countries or SIDS is limited. Expanding the knowledge base with 30
studies with a focus on developing countries would not only allow for testing whether the theories 31
(developed by predominantly by developed-country researchers for industrialised countries) hold in 32
developing country contexts, but also yield policy insights that could help both domestic and 33
international policymakers working on climate-related technology cooperation. 34
While a growing literature has shown how technology characteristics and complexity, national context 35
and innovation capacity can influence the capacity of a country's innovation ecosystem as a result of 36
incentive and attraction policies, more research is needed to help prioritise and design policies in 37
different national contexts while filling important knowledge gaps regarding the impact of “green” 38
public procurement, lending, “green” public banking and building code policies on innovation 39
outcomes. 40
There is also a superficial understanding of the potential and actual contributions of businesses, 41
educational institutions and socially responsible programmes, particularly in developing countries, as 42
sources of innovation and early adopters of new technologies, and a notable lack of knowledge about 43
indigenous practices. 44
ACCEPTED VERSION
SUBJECT TO FIN
AL EDITS
Final Government Draft Chapter 16 IPCC AR6 WGIII
Do Not Cite, Quote or Distribute 16-88 Total pages: 141
Besides the strong bias of literature to studies originating from and based on developed countries, 1
innovation and technology literature is also skewed to mitigation, and within mitigation to energy. 2
Literature on technology innovation for adaptation is largely missing. 3
In the area of innovation studies, data are limited on the different indicators used to assess the strength 4
of the innovation system, even for energy, including global figures on R&D and demonstration 5
spending, also for developing countries, and their effectiveness. There is also a lack of a comprehensive 6
framework and detailed data to assess the strengths of low-emission innovation systems, including 7
interactions among actors, innovation policy implementation, and strength of institutions. 8
Another gap in knowledge remains between the results from energy-climate-economy models and those 9
emerging from systems transition and sustainability transition approaches, empirical case studies, and 10
the innovation system literature. If this gap is filled, the understanding of the feasibility of 11
decarbonisation pathways in light of the many non-technical barriers to technology deployment and 12
diffusion could be improved. 13
In the field of policy instruments, existing evaluations provide insufficient evidence to assess the impact 14
of decarbonisation policy instruments on innovation, as these evaluations mainly focus on 15
environmental or technological effects. The potential positive or negative role of domestic IPR policy 16
in technology transfer to least developed countries remains unclear as the literature does not show 17
agreement. Moreover, gaps remain in impact evaluations of sub-national green industrial policies, 18
which are of growing importance. The interaction between subnational and national decarbonisation 19
policies to advance innovation would also benefit from further research, particularly in developing 20
countries. 21
The understanding of the role of digitalisation in decarbonisation pathways is lacking and needs to be 22
studied from several angles. Existing studies do not sufficiently take into account knowledge on the 23
energy impact of digital technologies, in particular the increase in energy demand by digital devices, 24
and the increase in energy efficiency. They would benefit from being technology/sector/country-25
specific. 26
The way in which digitalisation will influence the framework conditions under which decarbonisation 27
will occur, the socio-economic and behavioural barriers influencing the diffusion of technologies in the 28
long-term scenarios and the relationship with society and its effects need to be further explored. 29
Given the implications of the digital revolution for sustainability, a better characterisation of governance 30
aspects would increase understanding of the implications and possibilities of digitalisation and other 31
GPTs for policymakers. 32
Relatedly, research (both theoretical and empirical) on the impacts of imitation, or adaptation of new 33
technological solutions invented in one region and used in other regions, could fill knowledge gaps, in 34
order to accelerate the diffusion of climate-related technologies, while taking care not to reduce the 35
incentive for inventors to invest in the search for new solutions. 36
Lastly, an independent assessment about the compliance of the Paris Agreement with regard to 37
technology and capacity building as means of implementation is starting under the Enhanced 38
Transparency Framework for action and support, where a methodology of monitoring, reporting and 39
verification are being developed. There is also a lack of analysis of the full landscape of international 40
cooperation, of what is needed to meet the objectives of the UNFCCC and the Paris Agreement, and of 41
its effectiveness. 42
43
ACCEPTED VERSION
SUBJECT TO FIN
AL EDITS
Final Government Draft Chapter 16 IPCC AR6 WGIII
Do Not Cite, Quote or Distribute 16-89 Total pages: 141
Frequently Asked Questions (FAQs) 1
FAQ 16.1 Will innovation and technological changes be enough to meet the Paris Agreement 2
objectives? 3
The Paris Agreement stressed the importance of development and transfer of technologies to improve 4
resilience to climate change and to reduce greenhouse gas emissions. However, innovation and even 5
fast technological change will not be enough to achieve Paris Agreement mitigation objectives. Other 6
changes are necessary across the production and consumption system and the society in general, 7
including behavioural changes. 8
Technological changes never happen in a vacuum, they are always accompanied by, for instance, people 9
changing habits, companies changing value chains, or banks changing risk profiles. Therefore, 10
technological changes driven by holistic approaches can contribute to accelerate and spread those 11
changes towards the achievement of climate and sustainable development goals. 12
In innovation studies, such systemic approaches are said to strengthen the functions of technological or 13
national innovation systems, so that climate-friendly technologies can flourish. Innovation policies can 14
help respond to local priorities and prevent unintended and undesirable consequences of technological 15
change, such as unequal access to new technologies across countries and between income groups, 16
environmental degradation and negative effects on employment. 17
18
FAQ 16.2 What can be done to promote innovation for climate change and the widespread 19
diffusion of low-emission and climate-resilient technology? 20
The speed and success of innovation processes could be enhanced with the involvement of a wider 21
range of actors from the industry, research and financial communities working in partnerships at 22
national, regional and international levels. Public policies play a critical role to bring together these 23
different actors and create the necessary enabling conditions, including financial support through 24
different instruments as well as institutional and human capacities. 25
The increasing complexity of technologies requires cooperation if their widespread diffusion is to be 26
achieved. Cooperation includes the necessary knowledge flow between within and between countries 27
and regions. This knowledge flow can take the form of exchanging experiences, ideas, skills, practices, 28
among others. 29
30
FAQ 16.3 What is the role of international technology cooperation in addressing climate change? 31
Technologies that are currently known but not yet widely used need to be spread around the world, and 32
adapted to local preferences and conditions. Innovation capabilities are required not only to adapt new 33
technologies for local use but also to create new markets and business models. International technology 34
cooperation can serve that purpose. 35
In fact, evidence shows that international cooperation on technology development and transfer can help 36
developing countries to achieve their climate goals more effectively, and if this is done properly can 37
also help addressing other sustainable development goals. Many initiatives exist both regionally and 38
globally to help countries in achieving technology development and transfer through partnerships and 39
research collaboration that include developed and developing countries, with a key role for 40
technological institutions and universities. Enhancing current activities would help an effective, long-41
term global response to climate change, while promoting sustainable development. 42
ACCEPTED VERSION
SUBJECT TO FIN
AL EDITS

Final Government Draft Chapter 16 IPCC AR6 WGIII
Do Not Cite, Quote or Distribute 16-90 Total pages: 141
Globalization of production and supply of goods and services, including innovation and new 1
technologies, may open up opportunities for developing countries to advance technology diffusion; 2
however, so far not all countries have benefited from the globalisation of innovation due to different 3
barriers such as access to finance and technical capabilities. These asymmetries between countries in 4
the globalization process can also lead to dependencies on foreign knowledge and providers. 5
Not all technology cooperation directly results in mitigation outcomes. Overall, technology transfer 6
broadly has focused on enhancing climate technology absorption and deployment in developing 7
countries as well as RD&D and knowledge spill-overs. 8
Paris Agreement also reflects this view by noting that countries shall strengthen cooperative action on 9
technology development and transfer regarding two main aspects: 1) promoting collaborative 10
approaches to research and development and 2) facilitating access to technology to developing country 11
Parties. 12
13
ACCEPTED VERSION
SUBJECT TO FIN
AL EDITS

Final Government Draft Chapter 16 IPCC AR6 WGIII
Do Not Cite, Quote or Distribute 16-91 Total pages: 141
References 1
Abbott, F. M., 2018: Intellectual Property Rights and Climate Change: Interpreting the TRIPS 2
Agreement for Environmentally Sound Technologies. By WEI ZHUANG. J. Int. Econ. Law, 3
21(1), 233–236, doi:10.1093/jiel/jgy011. 4
Abdel-Latif, A., 2015: Intellectual property rights and the transfer of climate change technologies: 5
issues, challenges, and way forward. Clim. Policy, 15(1), 103–126, 6
doi:10.1080/14693062.2014.951919. 7
Abramovitz, M., 1986: Catching Up, Forging Ahead, and Falling Behind. J. Econ. Hist., 46(2), 385–8
406, doi:10.1017/S0022050700046209. 9
Abson, D. J. et al., 2017: Leverage points for sustainability transformation. Ambio, 46(1), 30–39, 10
doi:10.1007/s13280-016-0800-y. 11
Acemoglu, D., and P. Restrepo, 2019: Automation and New Tasks: How Technology Displaces and 12
Reinstates Labor. J. Econ. Perspect., 33(2), 3–30, doi:10.1257/jep.33.2.3. 13
Acemoglu, D., P. Aghion, L. Bursztyn, and D. Hemous, 2012: The Environment and Directed Technical 14
Change. Am. Econ. Rev., 102(1), 131–166, doi:10.1257/aer.102.1.131. 15
Acemoglu, D., U. Akcigit, D. Hanley, and W. R. Kerr, 2014: Transition to Clean Technology. SSRN 16
Electron. J., PIER Worki, doi:10.2139/ssrn.2534407. 17
Adami, V. S., J. A. V. Antunes Júnior, and M. A. Sellitto, 2017: Regional industrial policy in the wind 18
energy sector: The case of the State of Rio Grande do Sul, Brazil. Energy Policy, 111, 18–27, 19
doi:10.1016/j.enpol.2017.08.050. 20
Adenle, A. A., H. Azadi, and J. Arbiol, 2015: Global assessment of technological innovation for climate 21
change adaptation and mitigation in developing world. J. Environ. Manage., 161, 261–275, 22
doi:10.1016/j.jenvman.2015.05.040. 23
Aghaei, J., and M.-I. Alizadeh, 2013: Demand response in smart electricity grids equipped with 24
renewable energy sources: A review. Renew. Sustain. Energy Rev., 18, 64–72, 25
doi:10.1016/j.rser.2012.09.019. 26
Aghion, P., 2019: Path dependence, innovation and the economics of climate change. In: Handbook on 27
Green Growth, Edward Elgar Publishing, pp. 67–83. 28
Aghion, P., P. Howitt, and D. Mayer-Foulkes, 2005: The Effect of Financial Development on 29
Convergence: Theory and Evidence. Q. J. Econ., 120(1), 173–222, 30
doi:10.1162/0033553053327515. 31
Aghion, P., A. Dechezleprêtre, D. Hemous, R. Martin, and J. M. Van Reenen, 2013: Carbon Taxes, 32
Path Dependency and Directed Technical Change: Evidence from the Auto Industry. SSRN 33
Electron. J., 124(1), 1–51, doi:10.2139/ssrn.2202047. 34
Agrawala, S. et al., 2014: Regional Development and Cooperation. In: Climate Change 2014: 35
Mitigation of Climate Change. Contribution of Working Group III to the Fifth Assessment Report 36
of the Intergovernmental Panel on Climate Change [Edenhofer, O. et al., (eds.)], Cambridge 37
University Press, Cambridge, UK and New York, US, pp. 1083–1140. 38
Åhman, M., L. J. Nilsson, and B. Johansson, 2017: Global climate policy and deep decarbonization of 39
energy-intensive industries. Clim. Policy, 17(5), 634–649, doi:10.1080/14693062.2016.1167009. 40
Aklin, M., and J. Urpelainen, 2013: Political Competition, Path Dependence, and the Strategy of 41
Sustainable Energy Transitions. Am. J. Pol. Sci., 57(3), 643–658, doi:10.1111/ajps.12002. 42
Akorede, M. F., H. Hizam, and E. Pouresmaeil, 2010: Distributed energy resources and benefits to the 43
environment. Renew. Sustain. Energy Rev., 14(2), 724–734, doi:10.1016/j.rser.2009.10.025. 44
Alarcón, D., and R. Vos, 2015: Introduction: The Imperative of Sustainable Development. In: 45
ACCEPTED VERSION
SUBJECT TO FIN
AL EDITS

Final Government Draft Chapter 16 IPCC AR6 WGIII
Do Not Cite, Quote or Distribute 16-92 Total pages: 141
Technology and Innovation for Sustainable Development, Bloomsbury Collections, London, pp. 1
1–14. 2
Albert, M., 2019: Sustainable frugal innovation - The connection between frugal innovation and 3
sustainability. J. Clean. Prod., 237, 117747, doi:10.1016/j.jclepro.2019.117747. 4
Aleluia Reis, L., L. Drouet, and M. Tavoni, 2021: Economically Integrated Climate and Air Pollution 5
Policies Save Lives. Lancet Planet. Heal.,. 6
Alkemade, F., and R. A. A. Suurs, 2012: Patterns of expectations for emerging sustainable technologies. 7
Technol. Forecast. Soc. Change, 79(3), 448–456, doi:10.1016/j.techfore.2011.08.014. 8
Alston, J. M., P. G. Pardey, and X. Rao, 2021: Payoffs to a half century of CGIAR research. Am. J. 9
Agric. Econ., , doi:https://doi.org/10.1111/ajae.12255. 10
Altantsetseg, P., A. Dadvari, T. Munkhdelger, G.-O. Lkhagvasuren, and M. Moslehpour, 2020: 11
Sustainable Development of Entrepreneurial Orientation through Social Drivers. Sustain. 2020, 12
Vol. 12, Page 8816, 12(21), 8816, doi:10.3390/SU12218816. 13
Altenburg, T., 2009: Building inclusive innovation systems in developing countries: Challenges for IS 14
research. In: Handbook of Innovation Systems and Developing Countries: Building Domestic 15
Capabilities in a Global Setting [Lundvall, B.-Å., K.J. Joseph, C. Chaminade, and J. Vang, (eds.)], 16
Edward Elgar Publishing, London, UK, pp. 33–56. 17
Altenburg, T., and A. Pegels, 2012: Sustainability-oriented innovation systems – managing the green 18
transformation. Innov. Dev., 2(1), 5–22, doi:10.1080/2157930X.2012.664037. 19
Altenburg, T., and D. Rodrik, 2017: Green Industrial Policy: Accelerating Structural Change Towards 20
Wealthy Green Economies. In: Green Industrial Policy. Concept, Policies, Country Experiences 21
[Altenburg, T. and C. Assman, (eds.)], UN Environment; German Development Institute / 22
Deutsches Institut für Entwicklungspolitk (DIE)., Geneva, Bonn, pp. 1–20. 23
Altieri, M. A., and C. I. Nicholls, 2017: The adaptation and mitigation potential of traditional agriculture 24
in a changing climate. Clim. Change, 140(1), 33–45, doi:10.1007/s10584-013-0909-y. 25
Altieri, M. A., C. I. Nicholls, A. Henao, and M. A. Lana, 2015: Agroecology and the design of climate 26
change-resilient farming systems. Agron. Sustain. Dev., 35(3), 869–890, doi:10.1007/s13593-015-27
0285-2. 28
Alvarez, S., and A. Rubio, 2015: Carbon footprint in Green Public Procurement: a case study in the 29
services sector. J. Clean. Prod., 93, 159–166, doi:10.1016/j.jclepro.2015.01.048. 30
Ambec, S., M. A. Cohen, S. Elgie, and P. Lanoie, 2013: The Porter Hypothesis at 20: Can 31
Environmental Regulation Enhance Innovation and Competitiveness? Rev. Environ. Econ. Policy, 32
7(1), 2–22, doi:10.1093/reep/res016. 33
American Energy Innovation Council, 2017: The power of innovation: inventing the Future. , United 34
States, 52 pp. 35
Anadon, L. D., and J. P. Holdren, 2009: Chapter 5: Policy for Energy Technology Innovation. In: Acting 36
in Time on Energy Policy [Gallagher, K.S., (ed.)], Brookings Institution Press, Washington D.C. 37
Anadon, L. D., M. Bunn, and V. Narayanamurti, 2014: Transforming U.S. Energy Innovation. 38
Cambridge University Press, New York,. 39
Anadon, L. D., G. Chan, A. Y. Bin-Nun, and V. Narayanamurti, 2016a: The pressing energy innovation 40
challenge of the US National Laboratories. Nat. Energy, 1(10), 16117, 41
doi:10.1038/nenergy.2016.117. 42
Anadon, L. D. et al., 2016b: Making technological innovation work for sustainable development. Proc. 43
Natl. Acad. Sci., 113(35), 9682–9690, doi:10.1073/pnas.1525004113. 44
Anadón, L. D., 2012: Missions-oriented RD and D institutions in energy between 2000 and 2010: A 45
comparative analysis of China, the United Kingdom, and the United States. Res. Policy, 41(10), 46
ACCEPTED VERSION
SUBJECT TO FIN
AL EDITS
Final Government Draft Chapter 16 IPCC AR6 WGIII
Do Not Cite, Quote or Distribute 16-93 Total pages: 141
1742–1756, doi:10.1016/j.respol.2012.02.015. 1
Anadón, L. D., E. Baker, and V. Bosetti, 2017: Integrating uncertainty into public energy research and 2
development decisions. Nat. Energy, 2(5), 17071, doi:10.1038/nenergy.2017.71. 3
Andersen, A. D., and M. Gulbrandsen, 2020: The innovation and industry dynamics of technology 4
phase-out in sustainability transitions: Insights from diversifying petroleum technology suppliers 5
in Norway. Energy Res. Soc. Sci., 64, 101447, doi:10.1016/J.ERSS.2020.101447. 6
Anderson, K., J. Bruil, J. Chappell, C. Kiss, and M. P. Pimbert, 2021: Agroecology Now!. 7
Transformations towards More Just and Sustainable Food Systems. 8
André, F. J., and S. Smulders, 2014: Fueling growth when oil peaks: Directed technological change and 9
the limits to efficiency. Eur. Econ. Rev., 69, 18–39, doi:10.1016/j.euroecorev.2013.10.007. 10
Angelucci, S., F. J. Hurtado-Albir, and A. Volpe, 2018: Supporting global initiatives on climate change: 11
The EPO’s “Y02-Y04S” tagging scheme. World Pat. Inf., 54, S85–S92, 12
doi:10.1016/j.wpi.2017.04.006. 13
Antosiewicz, M., and J. Witajewski-Baltvilks, 2021: Short- and long-run dynamics of energy demand. 14
Energy Econ., 103, 105525, doi:10.1016/j.eneco.2021.105525. 15
Arce, D., 2014: Experience, Learning and Returns to Scale. South. Econ. J., 80(4), 938–947. 16
Ardani, K., and R. Margolis, 2015: Decreasing Soft Costs for Solar Photovoltaics by Improving the 17
Interconnection Process: A Case Study of Pacific Gas and Electric. National Renewable Energy 18
Laboratory (NREL), Golden, United States, 19 pp. 19
https://www.nrel.gov/docs/fy15osti/65066.pdf. 20
Arfanuzzaman, M., 2021: Big Data for Smart Cities and Inclusive Growth. Palgrave Encycl. Urban 21
Reg. Futur., , 1–5, doi:10.1007/978-3-030-51812-7_92-1. 22
Arocena, R., and J. Sutz, 2020: The need for new theoretical conceptualizations on National Systems 23
of Innovation, based on the experience of Latin America. Econ. Innov. New Technol., 29(7), 814–24
829, doi:10.1080/10438599.2020.1719640. 25
Arocena, R., B. Göransson, and J. Sutz, 2015: Knowledge policies and universities in developing 26
countries: Inclusive development and the “developmental university.” Technol. Soc., 41, 10–20, 27
doi:10.1016/j.techsoc.2014.10.004. 28
Arora, A., A. Fosfuri, and A. Gambardella, 2004: Markets for Technology: The Economics of 29
Innovation and Corporate Strategy. [Arora, A., A. Fosfuri, and A. Gambardella, (eds.)]. MIT 30
Press, Cambridge, MA, United States, 352 pp. 31
Arrow, K. J., 1962a: Economic welfare and the allocation of resources for invention. In: The Rate and 32
Direction of Inventive Activity: Economic and Social Factors [National Bureau of Economic 33
Research, (ed.)], Princeton University Press, pp. 609–626. 34
Arrow, K. J., 1962b: The Economic Implications of Learning by Doing. Rev. Econ. Stud., 29(3), 155, 35
doi:10.2307/2295952. 36
Arthur, W., 2009: The Nature of Technology. First. Free Press, New York City, USA, 246 pp. 37
Arthur, W. B., 1994: Increasing Returns and Path Dependence in the Economy. University of Michigan 38
Press, Anne Arbor, 201 pp. 39
Arvesen, A., R. M. Bright, and E. G. Hertwich, 2011: Considering only first-order effects? How 40
simplifications lead to unrealistic technology optimism in climate change mitigation. Energy 41
Policy, 39(11), 7448–7454, doi:10.1016/j.enpol.2011.09.013. 42
Auerswald, P. E., and L. M. Branscomb, 2003: Valleys of Death and Darwinian Seas: Financing the 43
Invention to Innovation Transition in the United States. J. Technol. Transf., 28, 227–239, 44
doi:https://doi.org/10.1023/A:1024980525678. 45
Avelino, F. et al., 2019: Transformative social innovation and (dis)empowerment. Technol. Forecast. 46
ACCEPTED VERSION
SUBJECT TO FIN
AL EDITS

Final Government Draft Chapter 16 IPCC AR6 WGIII
Do Not Cite, Quote or Distribute 16-94 Total pages: 141
Soc. Change, 145, 195–206, doi:10.1016/j.techfore.2017.05.002. 1
Avgerinou, M., P. Bertoldi, and L. Castellazzi, 2017: Trends in Data Centre Energy Consumption under 2
the European Code of Conduct for Data Centre Energy Efficiency. Energies, 10(10), 1470, 3
doi:10.3390/en10101470. 4
Azoulay, P., E. Fuchs, A. P. Goldstein, and M. Kearney, 2019: Funding Breakthrough Research: 5
Promises and Challenges of the “ARPA Model.” Innov. Policy Econ., 19, 69–96, 6
doi:10.1086/699933. 7
Bai, X., B. Roberts, and J. Chen, 2010: Urban sustainability experiments in Asia: patterns and pathways. 8
Environ. Sci. Policy, 13(4), 312–325, doi:10.1016/J.ENVSCI.2010.03.011. 9
Baker, E., O. Olaleye, and L. Aleluia Reis, 2015: Decision frameworks and the investment in R&D. 10
Energy Policy, 80, 275–285, doi:10.1016/j.enpol.2015.01.027. 11
Bakhtiar, A., A. Aslani, and S. M. Hosseini, 2020: Challenges of diffusion and commercialization of 12
bioenergy in developing countries. Renew. Energy, 145, 1780–1798, 13
doi:10.1016/j.renene.2019.06.126. 14
Baller, S., S. Dutta, and B. Lanvin, 2016: The Global Information Technology Report 2016 Innovating 15
in the Digital Economy. 307 pp. 16
Balvanera, P. et al., 2017: Interconnected place-based social–ecological research can inform global 17
sustainability. Curr. Opin. Environ. Sustain., 29, 1–7, doi:10.1016/J.COSUST.2017.09.005. 18
Barbieri, N., 2015: Investigating the impacts of technological position and European environmental 19
regulation on green automotive patent activity. Ecol. Econ., 117, 140–152, 20
doi:10.1016/j.ecolecon.2015.06.017. 21
Barker, T., A. Dagoumas, and J. Rubin, 2009: The macroeconomic rebound effect and the world 22
economy. Energy Effic., 2(4), 411–427, doi:10.1007/s12053-009-9053-y. 23
Baron, R., 2016: The Role of Public Procurement in Low-carbon Innovation. , Paris, France, 32 pp. 24
https://www.oecd.org/sd-roundtable/papersandpublications/The Role of Public Procurement in 25
Low-carbon Innovation.pdf. 26
Barron-Gafford, G. A. et al., 2019: Agrivoltaics provide mutual benefits across the food–energy–water 27
nexus in drylands. Nat. Sustain., 2(9), 848–855, doi:10.1038/s41893-019-0364-5. 28
Basel, B., G. Goby, and J. Johnson, 2020: Community-based adaptation to climate change in villages 29
of Western Province, Solomon Islands. Mar. Pollut. Bull., 156, 111266, 30
doi:10.1016/j.marpolbul.2020.111266. 31
Basu, S., and D. N. Weil, 1998: Appropriate Technology and Growth. Q. J. Econ., 113(4), 1025–1054, 32
doi:10.1162/003355398555829. 33
Baudry, M., and C. Bonnet, 2019: Demand-Pull Instruments and the Development of Wind Power in 34
Europe: A Counterfactual Analysis. Environ. Resour. Econ., 73(2), 385–429, 35
doi:10.1007/s10640-018-0267-3. 36
Bauer, F., L. Coenen, T. Hansen, K. McCormick, and Y. V. Palgan, 2017: Technological innovation 37
systems for biorefineries: a review of the literature. Biofuels, Bioprod. Biorefining, 11(3), 534–38
548, doi:10.1002/bbb.1767. 39
Bayer, P., J. Urpelainen, and A. Xu, 2016: Explaining differences in sub-national patterns of clean 40
technology transfer to China and India. Int. Environ. Agreements Polit. Law Econ., 16(2), 261–41
283, doi:10.1007/s10784-014-9257-2. 42
BEE, 2020: Impact of Energy Efficiency Measures for the Year 2018-19. , New Dehli, India, 148 pp. 43
https://beeindia.gov.in/sites/default/files/BEE Final Report_1.pdf. 44
Behuria, P., 2020: The politics of late late development in renewable energy sectors: Dependency and 45
contradictory tensions in India’s National Solar Mission. World Dev., 126, 104726, 46
ACCEPTED VERSION
SUBJECT TO FIN
AL EDITS

Final Government Draft Chapter 16 IPCC AR6 WGIII
Do Not Cite, Quote or Distribute 16-95 Total pages: 141
doi:10.1016/j.worlddev.2019.104726. 1
Bekkers, R., 2017: Where patents and standards come together. In: Handbook of Standards and 2
Innovation [Hawkins, R., K. Blind, and R. Page, (eds.)], Edward Elgar, London and New York, 3
pp. 227–251. 4
Bellesi, F., D. Lehrer, and A. Tal, 2005: Comparative Advantage: The Impact of ISO 14001 5
Environmental Certification on Exports. Environ. Sci. Technol., 39(7), 1943–1953, 6
doi:10.1021/es0497983. 7
Bento, N., and C. Wilson, 2016: Measuring the duration of formative phases for energy technologies. 8
Environ. Innov. Soc. Transitions, 21, 95–112, doi:10.1016/j.eist.2016.04.004. 9
Bento, N., C. Wilson, and L. D. Anadon, 2018: Time to get ready: Conceptualizing the temporal and 10
spatial dynamics of formative phases for energy technologies. Energy Policy, 119, 282–293, 11
doi:10.1016/j.enpol.2018.04.015. 12
Bergek, A., S. Jacobsson, B. Carlsson, S. Lindmark, and A. Rickne, 2008: Analyzing the functional 13
dynamics of technological innovation systems: A scheme of analysis. Res. Policy, 37(3), 407–14
429, doi:10.1016/j.respol.2007.12.003. 15
Bergek, A., S. Jacobsson, M. Hekkert, and K. Smith, 2010: Functionality of innovation systems as a 16
rationale for and guide to innovation policy. In: The Theory and Practice of Innovation Policy: 17
An International Research Handbook. 18
Bergek, A. et al., 2015: Technological innovation systems in contexts: Conceptualizing contextual 19
structures and interaction dynamics. Environ. Innov. Soc. Transitions, 16, 51–64, 20
doi:10.1016/j.eist.2015.07.003. 21
Bernauer, T., and L. F. McGrath, 2016: Simple reframing unlikely to boost public support for climate 22
policy. Nat. Clim. Chang., 6(7), 680–683, doi:10.1038/nclimate2948. 23
Bessen, J., and M. J. Meurer, 2009: Patent failure: how judges, bureaucrats, and lawyers put innovators 24
at risk. Choice Rev. Online, 46(06), 46-3523-46–3523, doi:10.5860/CHOICE.46-3523. 25
Bettencourt, L. M. A., J. E. Trancik, and J. Kaur, 2013: Determinants of the Pace of Global Innovation 26
in Energy Technologies. PLoS One, 8(10), e67864, doi:10.1371/journal.pone.0067864. 27
Bhamidipati, P. L., and U. E. Hansen, 2021: Unpacking local agency in China–Africa relations: 28
Frictional encounters and development outcomes of solar power in Kenya. Geoforum, 119, 206–29
217, doi:10.1016/j.geoforum.2020.12.010. 30
Bhamidipati, P. L., U. Elmer Hansen, and J. Haselip, 2019: Agency in transition: The role of 31
transnational actors in the development of the off-grid solar PV regime in Uganda. Environ. Innov. 32
Soc. Transitions, 33, 30–44, doi:10.1016/j.eist.2019.02.001. 33
Bhattacharya, G., 1984: Learning and the Behavior of Potential Entrants. RAND J. Econ., 15(2), 281, 34
doi:10.2307/2555681. 35
Biadgleng, E. T., 2009: Compulsory Licenses & Government Use. UNCTAD, Paris, France,. 36
Bibri, S. E., 2019a: Data-driven smart sustainable urbanism: the intertwined societal factors underlying 37
its materialization, success, expansion, and evolution. Geoj. 2019 861, 86(1), 43–68, 38
doi:10.1007/S10708-019-10061-X. 39
Bibri, S. E., 2019b: The anatomy of the data-driven smart sustainable city: instrumentation, datafication, 40
computerization and related applications. J. Big Data 2019 61, 6(1), 1–43, doi:10.1186/S40537-41
019-0221-4. 42
Bieser, J., and L. Hilty, 2018: Assessing Indirect Environmental Effects of Information and 43
Communication Technology (ICT): A Systematic Literature Review. Sustainability, 10(8), 2662, 44
doi:10.3390/su10082662. 45
Binz, C., and B. Truffer, 2017: Global Innovation Systems—A conceptual framework for innovation 46
ACCEPTED VERSION
SUBJECT TO FIN
AL EDITS
Final Government Draft Chapter 16 IPCC AR6 WGIII
Do Not Cite, Quote or Distribute 16-96 Total pages: 141
dynamics in transnational contexts. Res. Policy, 46(7), 1284–1298, 1
doi:10.1016/j.respol.2017.05.012. 2
Binz, C., and L. D. Anadon, 2018: Unrelated diversification in latecomer contexts: Emergence of the 3
Chinese solar photovoltaics industry. Environ. Innov. Soc. Transitions, 28, 14–34, 4
doi:10.1016/j.eist.2018.03.005. 5
Binz, C., B. Truffer, L. Li, Y. Shi, and Y. Lu, 2012: Conceptualizing leapfrogging with spatially coupled 6
innovation systems: The case of onsite wastewater treatment in China. Technol. Forecast. Soc. 7
Change, 79(1), 155–171, doi:10.1016/j.techfore.2011.08.016. 8
Biresselioglu, M. E., M. H. Demir, M. Demirbag Kaplan, and B. Solak, 2020: Individuals, collectives, 9
and energy transition: Analysing the motivators and barriers of European decarbonisation. Energy 10
Res. Soc. Sci., 66, 101493, doi:10.1016/J.ERSS.2020.101493. 11
Bisaga, I., P. Parikh, J. Tomei, and L. S. To, 2021: Mapping synergies and trade-offs between energy 12
and the sustainable development goals: A case study of off-grid solar energy in Rwanda. Energy 13
Policy, 149, 112028, doi:10.1016/J.ENPOL.2020.112028. 14
Black, G., D. Holley, D. Solan, and M. Bergloff, 2014: Fiscal and economic impacts of state incentives 15
for wind energy development in the Western United States. Renew. Sustain. Energy Rev., 34, 136–16
144, doi:10.1016/j.rser.2014.03.015. 17
Blieden, R., 1999: Cherry hill revisited—a retrospective on the creation of a national plan for 18
photovoltaic conversion of solar energy for terrestrial applications. AIP Conference Proceedings, 19
AIP, 796–799. 20
Bloess, A., 2019: Impacts of heat sector transformation on Germany’s power system through increased 21
use of power-to-heat. Appl. Energy, 239, 560–580, 22
doi:https://doi.org/10.1016/j.apenergy.2019.01.101. 23
Bodin, Ö., 2017: Collaborative environmental governance: Achieving collective action in social-24
ecological systems. Science (80-. )., 357(6352), eaan1114, doi:10.1126/science.aan1114. 25
Böhringer, C., and K. E. Rosendahl, 2010: Green promotes the dirtiest: on the interaction between black 26
and green quotas in energy markets. J. Regul. Econ., 37(3), 316–325, doi:10.1007/s11149-010-27
9116-1. 28
Boiral, O., L. Guillaumie, I. Heras-Saizarbitoria, and C. V. Tayo Tene, 2018: Adoption and Outcomes 29
of ISO 14001: A Systematic Review. Int. J. Manag. Rev., 20(2), 411–432, 30
doi:10.1111/ijmr.12139. 31
Bonvillian, W. B., 2018: DARPA and its ARPA-E and IARPA clones: a unique innovation organization 32
model. Ind. Corp. Chang., 27(5), 897–914, doi:10.1093/icc/dty026. 33
Bonvillian, W. B., and R. Van Atta, 2011: ARPA-E and DARPA: Applying the DARPA model to 34
energy innovation. J. Technol. Transf., 36(5), 469–513, doi:10.1007/s10961-011-9223-x. 35
Boodoo, Z., F. Mersmann, and K. H. Olsen, 2018: The implications of how climate funds conceptualize 36
transformational change in developing countries. Clim. Dev., 10(8), 673–686, 37
doi:10.1080/17565529.2018.1442788. 38
Bosetti, V., 2021: Integrated Assessment Models for Climate Change. In: Oxford Research 39
Encyclopedia of Economics and Finance, Oxford University Press. 40
Bosetti, V., M. Heugues, and A. Tavoni, 2017: Luring others into climate action: coalition formation 41
games with threshold and spillover effects. Oxf. Econ. Pap., 69(2), 410–431, 42
doi:10.1093/oep/gpx017. 43
Bowen, W. M., S. Park, and J. A. Elvery, 2013: Empirical Estimates of the Influence of Renewable 44
Energy Portfolio Standards on the Green Economies of States. Econ. Dev. Q., , 45
doi:10.1177/0891242413491316. 46
Boyd, A., 2012: Informing international UNFCCC technology mechanisms from the ground up: Using 47
ACCEPTED VERSION
SUBJECT TO FIN
AL EDITS

Final Government Draft Chapter 16 IPCC AR6 WGIII
Do Not Cite, Quote or Distribute 16-97 Total pages: 141
biogas technology in South Africa as a case study to evaluate the usefulness of potential elements 1
of an international technology agreement in the UNFCCC negotiations process. Energy Policy, 2
51, 301–311, doi:10.1016/j.enpol.2012.08.020. 3
Boyd, P., and L. Schweber, 2018: Unintended consequences: institutional artefacts, closure mechanisms 4
and the performance gap. Build. Res. Inf., 46(1), 10–22, doi:10.1080/09613218.2017.1331096. 5
Brandão, L. G. L., and P. Ehrl, 2019: International R&D spillovers to the electric power industries. 6
Energy, 182, 424–432, doi:10.1016/j.energy.2019.06.046. 7
Brandão Santana, N., D. A. D. N. Rebelatto, A. E. Périco, H. F. Moralles, and W. Leal Filho, 2015: 8
Technological innovation for sustainable development: an analysis of different types of impacts 9
for countries in the BRICS and G7 groups. Int. J. Sustain. Dev. World Ecol., 22(5), 1–12, 10
doi:10.1080/13504509.2015.1069766. 11
Branstetter, L., 2006: Is foreign direct investment a channel of knowledge spillovers? Evidence from 12
Japan’s FDI in the United States. J. Int. Econ., 68(2), 325–344, doi:10.1016/j.jinteco.2005.06.006. 13
Breetz, H., M. Mildenberger, and L. Stokes, 2018: The political logics of clean energy transitions. Bus. 14
Polit., 20(4), 492–522, doi:10.1017/bap.2018.14. 15
Brennen, J. S., and D. Kreiss, 2016: Digitalization. In: The International Encyclopedia of 16
Communication Theory and Philosophy [Jensen, K.B. and R.. Craig, (eds.)], Wiley, pp. 1–11. 17
Breschi, S., and F. Malerba, 1997: Sectoral Innovation Systems: Technological Regimes, 18
Schumpeterian Dynamics, and Spatial Boundaries. In: Systems of Innovation Technologies, 19
Institutions and Organisations [Edquist, C., (ed.)], Pinter Publishers, London, pp. 41–60. 20
Bringezu, S., 2019: Toward Science-Based and Knowledge-Based Targets for Global Sustainable 21
Resource Use. Resources, 8(3), 140, doi:10.3390/resources8030140. 22
Brooks, H., 1980: Technology, Evolution and Purpose. Daedalus, 109(1), 65–81. 23
Brooks, S., and M. Loevinsohn, 2011: Shaping agricultural innovation systems responsive to food 24
insecurity and climate change. Nat. Resour. Forum, 35(3), 185–200, doi:10.1111/j.1477-25
8947.2011.01396.x. 26
Brown, J., and C. Hendry, 2009: Public demonstration projects and field trials: Accelerating 27
commercialisation of sustainable technology in solar photovoltaics. Energy Policy, 37(7), 2560–28
2573, doi:10.1016/j.enpol.2009.01.040. 29
Brown, M. B., W. Canzler, F. Fischer, and A. Knie, 1995: Technological Innovation through 30
Environmental Policy: California’s Zero-Emission Vehicle Regulation. Public Product. Manag. 31
Rev., 19(1), 77, doi:10.2307/3380822. 32
Bryden, J., and S. S. Gezelius, 2017: Innovation as if people mattered: the ethics of innovation for 33
sustainable development. Innov. Dev., 7(1), 101–118, doi:10.1080/2157930X.2017.1281208. 34
Buckley, P., 2020: Prices, information and nudges for residential electricity conservation: A meta-35
analysis. Ecol. Econ., 172, 106635, doi:10.1016/j.ecolecon.2020.106635. 36
Bukkens, S. et al., 2020: The Nexus Times. [Bukkens, S., T. Dunlop, L.J. Di Felice, Z. Kovacic, I.W. 37
Nilsen, R. Strand, T. Völker, and L. Zamarioli, (eds.)]. Megaloceros Press,. 38
Bulkeley, H., V. C. Broto, and A. Maassen, 2014: Low-carbon Transitions and the Reconfiguration of 39
Urban Infrastructure. Urban Stud., 51(7), 1471–1486, doi:10.1177/0042098013500089. 40
Bumpus, A., and S. Comello, 2017: Emerging clean energy technology investment trends. Nat. Clim. 41
Chang., 7(6), 382–385, doi:10.1038/nclimate3306. 42
Bunn, M., L. D. Anadon, and V. Narayanamurti, 2014: The need to transform U.S. energy innovation. 43
In: Transforming U.S. Energy Innovation [Anadon, L.D., M. Bunn, and V. Narayanamurti, (eds.)], 44
Cambridge University Press, UK, pp. 14–16. 45
Burch, S., A. Shaw, A. Dale, and J. Robinson, 2014: Triggering transformative change: a development 46
ACCEPTED VERSION
SUBJECT TO FIN
AL EDITS

Final Government Draft Chapter 16 IPCC AR6 WGIII
Do Not Cite, Quote or Distribute 16-98 Total pages: 141
path approach to climate change response in communities. 1
http://dx.doi.org/10.1080/14693062.2014.876342, 14(4), 467–487, 2
doi:10.1080/14693062.2014.876342. 3
Bürer, M. J., and R. Wüstenhagen, 2009: Which renewable energy policy is a venture capitalist’s best 4
friend? Empirical evidence from a survey of international cleantech investors. Energy Policy, 5
37(12), 4997–5006, doi:10.1016/j.enpol.2009.06.071. 6
Calel, R., and A. Dechezleprêtre, 2016: Environmental Policy and Directed Technological Change: 7
Evidence from the European Carbon Market. Rev. Econ. Stat., 98(1), 173–191, 8
doi:10.1162/REST_A_00470. 9
Calzadilla, P. V., and R. Mauger, 2018: The UN’s new sustainable development agenda and renewable 10
energy: the challenge to reach SDG7 while achieving energy justice. J. Energy \& Nat. Resour. 11
Law, 36(2), 233–254, doi:10.1080/02646811.2017.1377951. 12
Caravella, S., and F. Crespi, 2020: Unfolding heterogeneity: The different policy drivers of different 13
eco-innovation modes. Environ. Sci. Policy, 114, 182–193, doi:10.1016/j.envsci.2020.08.003. 14
Carlsson, B., and R. Stankiewicz, 1991: On the nature, function and composition of technological 15
systems. J. Evol. Econ., 1(2), 93–118, doi:10.1007/BF01224915. 16
Caselli, F., and W. J. Coleman, 2006: The World Technology Frontier. Am. Econ. Rev., 96(3), 499–17
522, doi:10.1257/aer.96.3.499. 18
Cassman, K. G., and P. Grassini, 2020: A global perspective on sustainable intensification research. 19
Nat. Sustain., 3(4), 262–268, doi:10.1038/s41893-020-0507-8. 20
Castán Broto, V., and H. Bulkeley, 2013: A survey of urban climate change experiments in 100 cities. 21
Glob. Environ. Chang., 23(1), 92–102, doi:10.1016/J.GLOENVCHA.2012.07.005. 22
Cerutti, A. K., S. Contu, F. Ardente, D. Donno, and G. L. Beccaro, 2016: Carbon footprint in green 23
public procurement: Policy evaluation from a case study in the food sector. Food Policy, 58, 82–24
93, doi:10.1016/j.foodpol.2015.12.001. 25
Chaffin, B. C. et al., 2016: Transformative Environmental Governance. Annu. Rev. Environ. Resour., 26
41(1), 399–423, doi:10.1146/annurev-environ-110615-085817. 27
Chaminade, C., and C. Esquist, 2010: Rationales for Public Policy Intervention in the Innovation 28
Process: Systems of Innovation Approach. In: The Theory and Practice of Innovation Policy 29
[Smits, R.E. and P. Shapira, (eds.)], Edward Elgar Publishing, London and New York, p. pp. 20pp. 30
Chan, G., and L. Diaz Anadon, 2016: Improving Decision Making for Public R&D Investment in 31
Energy: Utilizing Expert Elicitation in Parametric Models. , Cambridge, UK, 55 pp. 32
Chan, G., A. P. Goldstein, A. Bin-Nun, L. Diaz Anadon, and V. Narayanamurti, 2017: Six principles 33
for energy innovation. Nature, 552(7683), 25–27, doi:10.1038/d41586-017-07761-0. 34
Charmes, J., 2016: The Informal Economy: Definitions, Size, Contribution and Main Characteristics. 35
In: The Informal Economy in Developing Nations [Kraemer-Mbula, E. and S. Wunsch-Vincent, 36
(eds.)], Cambridge University Press, Cambridge, pp. 13–52. 37
Chaudhary, A., A. D. Sagar, and A. Mathur, 2012: Innovating for energy efficiency: a perspective from 38
India. Innov. Dev., 2(1), 45–66, doi:10.1080/2157930X.2012.667212. 39
Chaudhary, A., C. Krishna, and A. Sagar, 2015: Policy making for renewable energy in India: lessons 40
from wind and solar power sectors. Clim. Policy, 15(1, SI), 58–87, 41
doi:10.1080/14693062.2014.941318. 42
Chlingaryan, A., S. Sukkarieh, and B. Whelan, 2018: Machine learning approaches for crop yield 43
prediction and nitrogen status estimation in precision agriculture: A review. Comput. Electron. 44
Agric., 151, 61–69, doi:10.1016/j.compag.2018.05.012. 45
Choi, H., and H. Zo, 2019: Assessing the efficiency of national innovation systems in developing 46
ACCEPTED VERSION
SUBJECT TO FIN
AL EDITS

Final Government Draft Chapter 16 IPCC AR6 WGIII
Do Not Cite, Quote or Distribute 16-99 Total pages: 141
countries. Sci. Public Policy, 46(4), 530–540, doi:10.1093/scipol/scz005. 1
Christensen, E., 1985: Electricity from photovoltaic solar cells. Flat-Plate Solar Array Project of the 2
US Department of Energy’s National Photovoltaics Program: 10 years of progress. 102 pp. 3
https://ntrs.nasa.gov/citations/19880002806. 4
Cinner, J. E. et al., 2018: Building adaptive capacity to climate change in tropical coastal communities. 5
Nat. Clim. Chang., 8(2), 117–123, doi:10.1038/s41558-017-0065-x. 6
Clark, W. C., L. van Kerkhoff, L. Lebel, and G. C. Gallopin, 2016: Crafting usable knowledge for 7
sustainable development. Proc. Natl. Acad. Sci., 113(17), 4570–4578, 8
doi:10.1073/pnas.1601266113. 9
Cohen, M. A., and A. Tubb, 2018: The Impact of Environmental Regulation on Firm and Country 10
Competitiveness: A Meta-analysis of the Porter Hypothesis. J. Assoc. Environ. Resour. Econ., 11
5(2), 371–399, doi:10.1086/695613. 12
Cohen, W., R. Nelson, and J. Walsh, 2000: Protecting Their Intellectual Assets: Appropriability 13
Conditions and Why U.S. Manufacturing Firms Patent (or Not). , Cambridge, MA, 50 pp. 14
Cohen, W. M., A. Goto, A. Nagata, R. R. Nelson, and J. P. Walsh, 2002: RandD spillovers, patents and 15
the incentives to innovate in Japan and the United States. Res. Policy, , doi:10.1016/S0048-16
7333(02)00068-9. 17
Consoli, D., G. Marin, A. Marzucchi, and F. Vona, 2016: Do green jobs differ from non-green jobs in 18
terms of skills and human capital? Res. Policy, 45(5), 1046–1060, 19
doi:10.1016/j.respol.2016.02.007. 20
Conti, C., M. L. Mancusi, F. Sanna-Randaccio, R. Sestini, and E. Verdolini, 2018: Transition towards 21
a green economy in Europe: Innovation and knowledge integration in the renewable energy sector. 22
Res. Policy, 47(10), 1996–2009, doi:10.1016/j.respol.2018.07.007. 23
Contreras, J. L., 2015: A brief history of frand: Analyzing current debates in standard setting and 24
antitrust through a historical lens. Antitrust Law J., 80(39), 82, doi:10.2139/ssrn.2374983. 25
Cooke, P., M. Gomez Uranga, and G. Etxebarria, 1997: Regional innovation systems: Institutional and 26
organisational dimensions. Res. Policy, 26(4–5), 475–491, doi:10.1016/S0048-7333(97)00025-5. 27
Corey, A., 2014: Diffusion of Green Technology: A Survey. Int. Rev. Environ. Resour. Econ., 7(1), 1–28
33, doi:10.1561/101.00000055. 29
Correa, C. M., J. I. Correa, and B. De Jonge, 2020: The status of patenting plants in the Global South. 30
J. World Intellect. Prop., 23(1–2), 121–146, doi:10.1111/jwip.12143. 31
Corsatea, T. D., 2016: Localised knowledge, local policies and regional innovation activity for 32
renewable energy technologies: Evidence from Italy. Pap. Reg. Sci., 95(3), 443–466, 33
doi:10.1111/pirs.12136. 34
Corsi, A., R. N. Pagani, J. L. Kovaleski, and V. Luiz da Silva, 2020: Technology transfer for sustainable 35
development: Social impacts depicted and some other answers to a few questions. J. Clean. Prod., 36
245, 118522, doi:10.1016/j.jclepro.2019.118522. 37
Côte, F.-X. F.-X. et al., 2019: The agroecological transition of agricultural systems in the Global South. 38
[Côte, F.-X., E. Poirier-Magona, S. Perret, P. Roudier, B. Rapidel, and M.-C. Thirion, (eds.)]. 39
éditions Quae,. 40
Coughlan de Perez, E. et al., 2015: Forecast-based financing: an approach for catalyzing humanitarian 41
action based on extreme weather and climate forecasts. Nat. Hazards Earth Syst. Sci., 15(4), 895–42
904, doi:10.5194/nhess-15-895-2015. 43
Cowan, R., 1990: Nuclear Power Reactors: A Study in Technological Lock-in. J. Econ. Hist., 50(3), 44
541–567, doi:10.1017/S0022050700037153. 45
Crabb, J. M., and D. K. N. Johnson, 2010: Fueling Innovation: The Impact of Oil Prices and CAFE 46
ACCEPTED VERSION
SUBJECT TO FIN
AL EDITS
Final Government Draft Chapter 16 IPCC AR6 WGIII
Do Not Cite, Quote or Distribute 16-100 Total pages: 141
Standards on Energy-Efficient Automotive Technology. Energy J., 31(1), doi:10.5547/ISSN0195-1
6574-EJ-Vol31-No1-9. 2
Craglia, M. et al., 2018: Artificial Intelligence: A European Perspective. Publications Office of the 3
European Union, Brussels,. 4
CREWS, 2016: CREWS Operational Procedures Note No1: Programming and Project Development. , 5
Geneva, 11 pp. https://ane4bf-datap1.s3-eu-west-1.amazonaws.com/wmocrews/s3fs-6
public/ckeditor/files/Revised_Operational_Procedures_Note_No1_Programming_and_Project_7
Development.pdf?OlO3Yfu.Sp1.aIiGNEBPbphkoloVjhnN. 8
Criqui, P., S. Mima, P. Menanteau, and A. Kitous, 2015: Mitigation strategies and energy technology 9
learning: An assessment with the POLES model. Technol. Forecast. Soc. Change, 90, 119–136, 10
doi:10.1016/j.techfore.2014.05.005. 11
Cross, J., and D. Murray, 2018: The afterlives of solar power: Waste and repair off the grid in Kenya. 12
Energy Res. Soc. Sci., 44, 100–109, doi:10.1016/j.erss.2018.04.034. 13
CTCN, 2019: Programme of Work 2019-2022: Climate Technology Centre and Network. 22 pp. 14
https://www.ctc-n.org/sites/www.ctc-n.org/files/ctcn_programme_of_work_2019-2022.pdf 15
(Accessed August 25, 2021). 16
Cui, J., X. Liu, Y. Sun, and H. Yu, 2020: Can CDM projects trigger host countries’ innovation in 17
renewable energy? Evidence of firm-level dataset from China. Energy Policy, 139, 111349, 18
doi:10.1016/j.enpol.2020.111349. 19
D´Auvergne, C., and M. Nummelin, 2017: Capacity-Building (Article 11). In: The Paris Agreement on 20
Climate Change: Analysis and Commentary [Klein, D., M. Pia Carazo, M. Doelle, J. Bulmer, and 21
A. Higham, (eds.)], Oxford University Press, Oxford, U.K. 22
da Silva, V. L., J. L. Kovaleski, and R. N. Pagani, 2019: Technology transfer in the supply chain 23
oriented to industry 4.0: a literature review. Technol. Anal. Strateg. Manag., 31(5), 546–562, 24
doi:10.1080/09537325.2018.1524135. 25
Dabbagh, M., B. Hamdaoui, A. Rayes, and M. Guizani, 2019: Shaving Data Center Power Demand 26
Peaks Through Energy Storage and Workload Shifting Control. IEEE Trans. Cloud Comput., 7, 27
1095–1108. 28
Dai, Y., and L. Xue, 2015: China’s policy initiatives for the development of wind energy technology. 29
Clim. Policy, 15(1), 30–57, doi:10.1080/14693062.2014.863549. 30
Dana, L. P., C. Gurău, F. Hoy, V. Ramadani, and T. Alexander, 2021: Success factors and challenges 31
of grassroots innovations: Learning from failure. Technol. Forecast. Soc. Change, 164, 119600, 32
doi:10.1016/J.TECHFORE.2019.03.009. 33
Darmani, A., N. Arvidsson, A. Hidalgo, and J. Albors, 2014: What drives the development of renewable 34
energy technologies? Toward a typology for the systemic drivers. Renew. Sustain. Energy Rev., 35
38, 834–847, doi:10.1016/j.rser.2014.07.023. 36
David, P., and D. Foray, 1995: Accessing and expanding the science and technology knowledge base. , 37
Paris, France, 13–68 pp. https://www.oecd-ilibrary.org/docserver/sti_rev-v1995-1-38
en.pdf?expires=1636825312&id=id&accname=guest&checksum=8EF2C3D4C4CFDA3532CC739
3D10337415E. 40
David, P. A., 1985: Clio and the Economics of QWERTY. Am. Econ. Rev., 75(2), 332–337, 41
doi:http://dx.doi.org/10.2307/1805621. 42
Davis, L. W., 2014: The Economic Cost of Global Fuel Subsidies. Am. Econ. Rev., 104(5), 581–585, 43
doi:10.1257/aer.104.5.581. 44
Davis, L. W., and C. R. Knittel, 2019: Are Fuel Economy Standards Regressive? J. Assoc. Environ. 45
Resour. Econ., 6(S1), S37–S63, doi:10.1086/701187. 46
de Beer, J., K. Fu, and S. Wunsch-Vincent, 2016: Innovation in the informal economy. In: The informal 47
ACCEPTED VERSION
SUBJECT TO FIN
AL EDITS
Final Government Draft Chapter 16 IPCC AR6 WGIII
Do Not Cite, Quote or Distribute 16-101 Total pages: 141
economy in developing nations: hidden engine of innovation? [Wunsch-Vincent, S. and E. 1
Kraemer-Mbula, (eds.)], Cambridge University Press, p. pp. 439. 2
de Coninck, H., and D. Puig, 2015: Assessing climate change mitigation technology interventions by 3
international institutions. Clim. Change, 131(3), 417–433, doi:10.1007/s10584-015-1344-z. 4
de Coninck, H., and A. Sagar, 2017: Technology Development and Transfer (Article 10). In: The Paris 5
Agreement on Climate Change: Analysis and Commentary [Klein, D., M. Pía Carazo, M. Doelle, 6
J. Bulmer, and A. Higham, (eds.)], Oxford University Press, Oxford, U.K. 7
de Gooyert, V., E. Rouwette, H. van Kranenburg, E. Freeman, and H. van Breen, 2016: Sustainability 8
transition dynamics: Towards overcoming policy resistance. Technol. Forecast. Soc. Change, 111, 9
135–145, doi:10.1016/J.TECHFORE.2016.06.019. 10
de Jesus, A., and S. Mendonça, 2018: Lost in Transition? Drivers and Barriers in the Eco-innovation 11
Road to the Circular Economy. Ecol. Econ., 145, 75–89, 12
doi:10.1016/J.ECOLECON.2017.08.001. 13
de Jong, P., A. Paulraj, and C. Blome, 2014: The Financial Impact of ISO 14001 Certification: Top-14
Line, Bottom-Line, or Both? J. Bus. Ethics, 119(1), 131–149, doi:10.1007/s10551-012-1604-z. 15
de la Tour, A., M. Glachant, and Y. Ménière, 2011: Innovation and international technology transfer: 16
The case of the Chinese photovoltaic industry. Energy Policy, 39(2), 761–770, 17
doi:10.1016/J.ENPOL.2010.10.050. 18
de Rassenfosse, G., H. Dernis, D. Guellec, L. Picci, and B. van Pottelsberghe de la Potterie, 2013: The 19
worldwide count of priority patents: A new indicator of inventive activity. Res. Policy, 42(3), 720–20
737, doi:10.1016/j.respol.2012.11.002. 21
De Rose, A. et al., 2017: Technology Readiness Level : Guidance Principles for Renewable Energy 22
technologies. European Commission, Brussels, 48 pp. 23
de Sisternes, F. J., J. D. Jenkins, and A. Botterud, 2016: The value of energy storage in decarbonizing 24
the electricity sector. Appl. Energy, 175, 368–379, 25
doi:https://doi.org/10.1016/j.apenergy.2016.05.014. 26
Dechezleprêtre, A., M. Glachant, I. Haščič, N. Johnstone, and Y. Ménière, 2011: Invention and Transfer 27
of Climate Change–Mitigation Technologies: A Global Analysis. Rev. Environ. Econ. Policy, 28
5(1), 109–130, doi:10.1093/reep/req023. 29
Dechezleprêtre, A., M. Glachant, and Y. Ménière, 2013: What Drives the International Transfer of 30
Climate Change Mitigation Technologies? Empirical Evidence from Patent Data. Environ. 31
Resour. Econ., 54(2), 161–178, doi:10.1007/s10640-012-9592-0. 32
Deichmann, U., A. Goyal, and D. Mishra, 2016: Will Digital Technologies Transform Agriculture in 33
Developing Countries? World Bank, Washington, DC, 30 pp. 34
del Río, P., 2010: Analysing the interactions between renewable energy promotion and energy 35
efficiency support schemes: The impact of different instruments and design elements. Energy 36
Policy, 38(9), 4978–4989, doi:10.1016/j.enpol.2010.04.003. 37
del Río, P., 2014: On evaluating success in complex policy mixes: the case of renewable energy support 38
schemes. Policy Sci., 47(3), 267–287, doi:10.1007/s11077-013-9189-7. 39
del Río, P., and E. Cerdá, 2014: The policy implications of the different interpretations of the cost-40
effectiveness of renewable electricity support. Energy Policy, 64, 364–372, 41
doi:10.1016/j.enpol.2013.08.096. 42
del Río, P., and E. Cerdá, 2017: The missing link: The influence of instruments and design features on 43
the interactions between climate and renewable electricity policies. Energy Res. Soc. Sci., 33, 49–44
58, doi:10.1016/j.erss.2017.09.010. 45
del Río, P., and C. Kiefer, 2021: Analysing the effects of auctions on technological innovation: Report 46
D4.3 of AURES II project. 99 pp. http://aures2project.eu/wp-47
ACCEPTED VERSION
SUBJECT TO FIN
AL EDITS

Final Government Draft Chapter 16 IPCC AR6 WGIII
Do Not Cite, Quote or Distribute 16-102 Total pages: 141
content/uploads/2021/04/AURES_II_D4_3_technological_innovation.pdf (Accessed July 22, 1
2021). 2
Del Río, P., 2012: The dynamic efficiency of feed-in tariffs: The impact of different design elements. 3
Energy Policy, 41, 139–151, doi:10.1016/J.ENPOL.2011.08.029. 4
Denevan, W. M., 1995: 2 Prehistoric agricultural methods as models for sustainability. pp. 21–43. 5
Deng, H.-M., Q.-M. Liang, L.-J. Liu, and L. D. Anadon, 2018a: Co-benefits of greenhouse gas 6
mitigation: a review and classification by type, mitigation sector, and geography. Environ. Res. 7
Lett., 12(12), 123001, doi:10.1088/1748-9326/aa98d2. 8
Deng, H. M., Q. M. Liang, L. J. Liu, and L. D. Anadon, 2018b: Co-benefits of greenhouse gas 9
mitigation: A review and classification by type, mitigation sector, and geography. Environ. Res. 10
Lett., 12(12), 123001, doi:10.1088/1748-9326/aa98d2. 11
Deutch, J., and E. Steinfeld, 2013: A Duel in the Sun: The Solar Photovoltaics Technology Conflict 12
between China and the United States. 32 pp. http://mitei.mit.edu/futureofsolar (Accessed August 13
30, 2021). 14
Devine, A., and N. Kok, 2015: Green Certification and Building Performance: Implications for 15
Tangibles and Intangibles. J. Portf. Manag., 41(6), 151–163, doi:10.3905/jpm.2015.41.6.151. 16
Devlin, A., 2010: The Misunderstood Function of Disclosure in Patent Law. Harvard Journa Technol. 17
Law, 23, 401. 18
Di Maria, C., and S. A. Smulders, 2005: Trade Pessimists vs Technology Optimists: Induced Technical 19
Change and Pollution Havens. Adv. Econ. Anal. Policy, 3(2), doi:10.2202/1538-0637.1344. 20
Di Maria, C., and E. van der Werf, 2008: Carbon leakage revisited: unilateral climate policy with 21
directed technical change. Environ. Resour. Econ., 39(2), 55–74, doi:10.1007/s10640-007-9091-22
x. 23
Díaz, S. et al., 2019: Pervasive human-driven decline of life on Earth points to the need for 24
transformative change. Science (80-. )., , doi:10.1126/science.aax3100. 25
Diercks, G., H. Larsen, and F. Steward, 2019: Transformative innovation policy: Addressing variety in 26
an emerging policy paradigm. Res. Policy, 48(4), 880–894, doi:10.1016/j.respol.2018.10.028. 27
Disterheft, A., S. Caeiro, U. M. Azeiteiro, and W. L. Filho, 2015: Sustainable universities – a study of 28
critical success factors for participatory approaches. J. Clean. Prod., 106, 11–21, 29
doi:10.1016/j.jclepro.2014.01.030. 30
Doblinger, C., K. Surana, and L. D. Anadon, 2019: Governments as partners: The role of alliances in 31
U.S. cleantech startup innovation. Res. Policy, 48(6), 1458–1475, 32
doi:10.1016/j.respol.2019.02.006. 33
Doranova, A., I. Costa, and G. Duysters, 2010: Knowledge base determinants of technology sourcing 34
in clean development mechanism projects. Energy Policy, 38(10), 5550–5559, 35
doi:10.1016/j.enpol.2010.04.055. 36
Dorband, I. I., M. Jakob, and J. C. Steckel, 2020: Unraveling the political economy of coal: Insights 37
from Vietnam. Energy Policy, 147, 111860, doi:10.1016/j.enpol.2020.111860. 38
Doukas, H., and A. Nikas, 2020: Decision support models in climate policy. Eur. J. Oper. Res., 280(1), 39
1–24, doi:10.1016/j.ejor.2019.01.017. 40
Doukas, H., A. Nikas, M. González-Eguino, I. Arto, and A. Anger-Kraavi, 2018: From Integrated to 41
Integrative: Delivering on the Paris Agreement. Sustainability, 10(7), 2299, 42
doi:10.3390/su10072299. 43
Douthwaite, B., and E. Hoffecker, 2017: Towards a complexity-aware theory of change for 44
participatory research programs working within agricultural innovation systems. Agric. Syst., 155, 45
88–102, doi:https://doi.org/10.1016/j.agsy.2017.04.002. 46
ACCEPTED VERSION
SUBJECT TO FIN
AL EDITS
Final Government Draft Chapter 16 IPCC AR6 WGIII
Do Not Cite, Quote or Distribute 16-103 Total pages: 141
Du, K., and J. Li, 2019: Towards a green world: How do green technology innovations affect total-1
factor carbon productivity. Energy Policy, 131, 240–250, doi:10.1016/j.enpol.2019.04.033. 2
Du, K., P. Li, and Z. Yan, 2019: Do green technology innovations contribute to carbon dioxide emission 3
reduction? Empirical evidence from patent data. Technol. Forecast. Soc. Change, 146, 297–303, 4
doi:10.1016/j.techfore.2019.06.010. 5
Dussaux, D., A. Dechezleprêtre, and M. Glachant, 2018: Intellectual property rights protection and the 6
international transfer of low-carbon technologies. , Paris, France, 63 pp. 7
https://personal.lse.ac.uk/dechezle/Working-Paper-288-Dussaux-et-al.pdf. 8
Dziallas, M., and K. Blind, 2019: Innovation indicators throughout the innovation process: An extensive 9
literature analysis. Technovation, 80–81, 3–29, doi:10.1016/j.technovation.2018.05.005. 10
Ebeling, F., 2020: Assessing the macroeconomic effects of sustainable energy transitions in Costa Rica 11
and Chile: a multisectoral balance-of-payments-constrained growth approach. In: The Regulation 12
and Policy of Latin American Energy Transitions [Guimaraes, L.N., (ed.)], Elsevier, pp. 39–58. 13
Echeverría, R. G., 1998: Agricultural research policy issues in Latin America: An Overview. World 14
Dev., 26(6), 1103–1111, doi:10.1016/S0305-750X(98)00036-9. 15
Economidou, M. et al., 2020: Review of 50 years of EU energy efficiency policies for buildings. Energy 16
Build., 225, 110322, doi:https://doi.org/10.1016/j.enbuild.2020.110322. 17
Edler, J., and L. Georghiou, 2007: Public procurement and innovation—Resurrecting the demand side. 18
Res. Policy, 36(7), 949–963, doi:10.1016/j.respol.2007.03.003. 19
Edmondson, D. L., F. Kern, and K. S. Rogge, 2019: The co-evolution of policy mixes and socio-20
technical systems: Towards a conceptual framework of policy mix feedback in sustainability 21
transitions. Res. Policy, 48(10), 103555, doi:10.1016/j.respol.2018.03.010. 22
Edmondson, D. L., K. S. Rogge, and F. Kern, 2020: Zero carbon homes in the UK? Analysing the co-23
evolution of policy mix and socio-technical system. Environ. Innov. Soc. Transitions, 35, 135–24
161, doi:10.1016/j.eist.2020.02.005. 25
Edquist, C., 1997: Systems of Innovation: Technologies, Institutions and Organizations. [Edquist, C., 26
(ed.)]. Pinter Publishers/Cassell Academic, London, 432 pp. 27
Egli, F., B. Steffen, and T. S. Schmidt, 2018: A dynamic analysis of financing conditions for renewable 28
energy technologies. Nat. Energy, 3(12), 1084–1092, doi:10.1038/s41560-018-0277-y. 29
Einstein, A., 1905: Über einen die Erzeugung und Verwandlung des Lichtes betreffenden heuristischen 30
Gesichtspunkt. Ann. Phys., 322(6), 132–148, doi:10.1002/andp.19053220607. 31
Eisenberg, A. M., 2019: Just transitions. South. Calif. Law Rev., 92(2), 273–330. 32
Elder, M., M. Bengtsson, and L. Akenji, 2016: An Optimistic Analysis of the Means of Implementation 33
for Sustainable Development Goals: Thinking about Goals as Means. Sustainability, 8(9), 962, 34
doi:10.3390/su8090962. 35
Elia, A., M. Kamidelivand, F. Rogan, and B. Ó Gallachóir, 2021: Impacts of innovation on renewable 36
energy technology cost reductions. Renew. Sustain. Energy Rev., 138, 110488, 37
doi:10.1016/j.rser.2020.110488. 38
Elshurafa, A. M., S. R. Albardi, S. Bigerna, and C. A. Bollino, 2018: Estimating the learning curve of 39
solar PV balance–of–system for over 20 countries: Implications and policy recommendations. J. 40
Clean. Prod., 196, 122–134, doi:10.1016/J.JCLEPRO.2018.06.016. 41
Elzen, B., F. Geels, and K. Green, 2004: System Innovation and the Transition to Sustainability: Theory, 42
evidence and policy. 1st ed. [Elzen, B., F. Geels, and K. Green, (eds.)]. Edward Elgar Publishing, 43
London and New York, 336 pp. 44
Emmerling, J. et al., 2016: The WITCH 2016 Model - Documentation and Implementation of the Shared 45
Socioeconomic Pathways. 63 pp. 46
ACCEPTED VERSION
SUBJECT TO FIN
AL EDITS
Final Government Draft Chapter 16 IPCC AR6 WGIII
Do Not Cite, Quote or Distribute 16-104 Total pages: 141
Encaoua, D., D. Guellec, and C. Martínez, 2006: Patent systems for encouraging innovation: Lessons 1
from economic analysis. Res. Policy, 35(9), 1423–1440, doi:10.1016/j.respol.2006.07.004. 2
EPO, 2017: Unitary Patent Guide. European Patent Office, Munich,. 3
Erickson, P., S. Kartha, M. Lazarus, and K. Tempest, 2015: Assessing carbon lock-in. Environ. Res. 4
Lett., 10(8), 084023, doi:10.1088/1748-9326/10/8/084023. 5
European Association of Research Technology Organisations, 2014: The TRL Scale as a Research & 6
Innovation Policy Tool. http://www.earto.eu/fileadmin/content/03_Publications/ 7
The_TRL_Scale_as_a_R_I_Policy_Tool_-_EARTO_Recommendations_-_ Final.pdf. 8
European Commission, 2015: EU R and D Survey: The 2015 EU Survey on Industrial R and D 9
Investment Trends. , Seville, Spain, 54 pp. 10
European Commission, 2018: Ecodesign Impacts Accounting, Status October 2018. 11
https://ec.europa.eu/energy/sites/ener/files/documents/eia_status_report_2017_-_v20171222.pdf. 12
European Commission, 2020: An SME Strategy for a sustainable and digital Europe. , 19. 13
Evenson, R. E., and D. Gollin, 2003: Assessing the Impact of the Green Revolution, 1960 to 2000. 14
Science (80-. )., 300(5620), 758–762, doi:10.1126/science.1078710. 15
Fagerberg, J., 2018: Mobilizing innovation for sustainability transitions: A comment on transformative 16
innovation policy. Res. Policy, 47(9), 1568–1576, doi:10.1016/j.respol.2018.08.012. 17
Falvey, R., N. Foster, and D. Greenaway, 2006: Intellectual Property Rights and Economic Growth. 18
Rev. Dev. Econ., 10(4), 700–719, doi:10.1111/j.1467-9361.2006.00343.x. 19
Fankhauser, S., and F. Jotzo, 2018: Economic growth and development with low‐carbon energy. WIREs 20
Clim. Chang., 9(1), e495, doi:10.1002/wcc.495. 21
FAO, 2018a: Transforming Food and Agriculture to Achieve the SDGs: 20 interconnected actions to 22
guide decision-makers. , Rome, 132 pp. 23
FAO, 2018b: Los 10 Elementos De La Agroecología Guía para la Transición Hacia Sistemas 24
Alimentarios y Agrícolas Sostenibles. 25
FAO, 2019: FAO activities in SIDS. http://www.fao.org/sids/activities-in-sids/en/. 26
Farmer, J. D. et al., 2019: Sensitive intervention points in the post-carbon transition. Science (80-. )., 27
364(6436), 132–134, doi:10.1126/science.aaw7287. 28
Fazey, I. et al., 2020: Transforming knowledge systems for life on Earth: Visions of future systems and 29
how to get there. Energy Res. Soc. Sci., 70, 101724, 30
doi:https://doi.org/10.1016/j.erss.2020.101724. 31
Fernández-Sastre, J., and F. Montalvo-Quizhpi, 2019: The effect of developing countries’ innovation 32
policies on firms’ decisions to invest in R&D. Technol. Forecast. Soc. Change, 143(February), 33
214–223, doi:10.1016/j.techfore.2019.02.006. 34
Fischer, C., L. Preonas, and R. G. Newell, 2017: Environmental and Technology Policy Options in the 35
Electricity Sector: Are We Deploying Too Many? J. Assoc. Environ. Resour. Econ., 4(4), 959–36
984, doi:10.1086/692507. 37
Fisher, E., R. L. Mahajan, and C. Mitcham, 2006: Midstream Modulation of Technology: Governance 38
From Within. Bull. Sci. Technol. Soc., 26(6), 485–496, doi:10.1177/0270467606295402. 39
Fleming, L., and O. Sorenson, 2001: Technology as a complex adaptive system: evidence from patent 40
data. Res. Policy, 30(7), 1019–1039, doi:10.1016/S0048-7333(00)00135-9. 41
Foray, D., 2004: The patent system and the dynamics of innovation in Europe. Sci. Public Policy, 31(6), 42
449–456, doi:10.3152/147154304781779732. 43
Foster, C., and S. Azmeh, 2020: Latecomer Economies and National Digital Policy: An Industrial 44
Policy Perspective. J. Dev. Stud., 56(7), 1247–1262, doi:10.1080/00220388.2019.1677886. 45
ACCEPTED VERSION
SUBJECT TO FIN
AL EDITS

Final Government Draft Chapter 16 IPCC AR6 WGIII
Do Not Cite, Quote or Distribute 16-105 Total pages: 141
Fragkiadakis, K., P. Fragkos, and L. Paroussos, 2020: Low-Carbon R&D Can Boost EU Growth 1
and Competitiveness. Energies, 13(19), 5236, doi:10.3390/en13195236. 2
Francis, C. et al., 2003: Agroecology: The Ecology of Food Systems. J. Sustain. Agric., 22(3), 99–118, 3
doi:10.1300/J064v22n03_10. 4
Frank, C., C. Sink, L. Mynatt, R. Rogers, and A. Rappazzo, 1996: Surviving the “valley of death”: A 5
comparative analysis. J. Technol. Transf., 21(1–2), 61–69, doi:10.1007/BF02220308. 6
Frankfurt School-UNEP Centre/BNEF, 2019: Global Trends in Renewable Energy Investment 2020. , 7
Frankfurt, Germany, 76 pp. 8
https://wedocs.unep.org/bitstream/handle/20.500.11822/29752/GTR2019.pdf?sequence=1&isAll9
owed=y. 10
Freeman, C., 1995a: The ‘National System of Innovation’ in historical perspective. Cambridge J. Econ., 11
19(1), 5–14, doi:10.1093/oxfordjournals.cje.a035309. 12
Freeman, C., 1995b: The “national system of innovation” in historical perspective. Cambridge J. Econ., 13
19(1), 5–24, doi:10.1093/oxfordjournals.cje.a035309. 14
Freeman, C., and L. Soete, 1997: The Economics of Industrial Innovation. 3rd ed. [Freeman, C. and L. 15
Soete, (eds.)]. Routledge, Taylor & Francis Group, London, UK, 480 pp. 16
Freeman, C., and L. Soete, 2009: Developing science, technology and innovation indicators: What we 17
can learn from the past. Res. Policy, 38(4), 583–589, doi:10.1016/j.respol.2009.01.018. 18
Frenken, K., L. R. Izquierdo, and P. Zeppini, 2012: Branching innovation, recombinant innovation, and 19
endogenous technological transitions. Environ. Innov. Soc. Transitions, 4, 25–35, 20
doi:10.1016/j.eist.2012.06.001. 21
Fridgen, G., R. Keller, M.-F. Körner, and M. Schöpf, 2020: A holistic view on sector coupling. Energy 22
Policy, 147, 111913, doi:https://doi.org/10.1016/j.enpol.2020.111913. 23
Friedman, B., and D. G. Hendry, 2019: Value Sensitive Design. The MIT Press, Cambridge, MA, United 24
States, 17–23 pp. 25
Fu, B., S. Wang, J. Zhang, Z. Hou, and J. Li, 2019: Unravelling the complexity in achieving the 17 26
sustainable-development goals. Natl. Sci. Rev., 6(3), 386–388, doi:10.1093/nsr/nwz038. 27
Fu, W., C. Li, J. Ondrich, and D. Popp, 2018: Technological Spillover Effects of State Renewable 28
Energy Policy: Evidence from Patent Counts. , Cambridge, MA, 41 pp. 29
Fuerst, F., and P. McAllister, 2011: Eco-labeling in commercial office markets: Do LEED and Energy 30
Star offices obtain multiple premiums? Ecol. Econ., 70(6), 1220–1230, 31
doi:10.1016/j.ecolecon.2011.01.026. 32
Fuglie, K., 2018: R & D Capital, R & D spillovers, and productivity growth in world 33
agriculture. Appl. Econ. Perspect. Policy, 40(3), 421–444, doi:10.1093/AEPP/PPX045. 34
Funtowicz, S., 2020: From risk calculations to narratives of danger. Clim. Risk Manag., 27, 100212, 35
doi:10.1016/j.crm.2020.100212. 36
Gaddy, B. E., V. Sivaram, T. B. Jones, and L. Wayman, 2017: Venture Capital and Cleantech: The 37
wrong model for energy innovation. Energy Policy, 102(July), 385–395, 38
doi:10.1016/j.enpol.2016.12.035. 39
Gallagher, K. S., J. P. Holdren, and A. D. Sagar, 2006: Energy-Technology Innovation. Annu. Rev. 40
Environ. Resour., 31(1), 193–237, doi:10.1146/annurev.energy.30.050504.144321. 41
Gallagher, K. S., L. D. Anadon, R. Kempener, and C. Wilson, 2011: Trends in investments in global 42
energy research, development, and demonstration. Wiley Interdiscip. Rev. Clim. Chang., 2(3), 43
373–396, doi:10.1002/wcc.112. 44
Gallagher, K. S., A. Grübler, L. Kuhl, G. Nemet, and C. Wilson, 2012: The Energy Technology 45
Innovation System. Annu. Rev. Environ. Resour., 37(1), 137–162, doi:10.1146/annurev-environ-46
ACCEPTED VERSION
SUBJECT TO FIN
AL EDITS

Final Government Draft Chapter 16 IPCC AR6 WGIII
Do Not Cite, Quote or Distribute 16-106 Total pages: 141
060311-133915. 1
Galloway McLean, K., 2010: Advance Guard: Climate Change Impacts, Adaptation, Mitigation and 2
Indigenous Peoples – A Compendium of Case Studies. , Darwin, Australia, 128 pp. 3
http://www.unutki.org/ (Accessed July 22, 2021). 4
Gambhir, A., P. Sandwell, and J. Nelson, 2016: The future costs of OPV – A bottom-up model of 5
material and manufacturing costs with uncertainty analysis. Sol. Energy Mater. Sol. Cells, 156, 6
49–58, doi:10.1016/j.solmat.2016.05.056. 7
Gambhir, A., I. Butnar, P.-H. Li, P. Smith, and N. Strachan, 2019: A Review of Criticisms of Integrated 8
Assessment Models and Proposed Approaches to Address These, through the Lens of BECCS. 9
Energies, 12(9), 1747, doi:10.3390/en12091747. 10
Gandenberger, C., M. Bodenheimer, J. Schleich, R. Orzanna, and L. Macht, 2016: Factors driving 11
international technology transfer: empirical insights from a CDM project survey. Clim. Policy, 12
16(8), 1065–1084, doi:10.1080/14693062.2015.1069176. 13
Gann, D. M., Y. Wang, and R. Hawkins, 1998: Do regulations encourage innovation? - the case of 14
energy efficiency in housing. Build. Res. Inf., 26(5), 280–296, doi:10.1080/096132198369760. 15
Gao, L., and B. A. Bryan, 2017: Finding pathways to national-scale land-sector sustainability. Nature, 16
544(7649), 217–222, doi:10.1038/nature21694. 17
Gao, X., and W. Zhang, 2013: Foreign investment, innovation capacity and environmental efficiency 18
in China. Math. Comput. Model., 58(5–6), 1040–1046, doi:10.1016/j.mcm.2012.08.012. 19
Gao, X., and V. Rai, 2019: Local demand-pull policy and energy innovation: Evidence from the solar 20
photovoltaic market in China. Energy Policy, 128(February 2018), 364–376, 21
doi:10.1016/j.enpol.2018.12.056. 22
Garcia-Casals, X., R. Ferroukhi, and B. Parajuli, 2019: Measuring the socio-economic footprint of the 23
energy transition. Energy Transitions, 3(1–2), 105–118, doi:10.1007/s41825-019-00018-6. 24
Geddes, A., T. S. Schmidt, and B. Steffen, 2018: The multiple roles of state investment banks in low-25
carbon energy finance: An analysis of Australia, the UK and Germany. Energy Policy, 115, 158–26
170, doi:10.1016/j.enpol.2018.01.009. 27
Geels, F., 2005a: Technological transition and system innovations: a co-evolutionary and socio-28
technical analysis. Edward Elgar, Cheltenham, UK, 328 pp. 29
Geels, F., and J. Schot, 2010: The Dynamics of Transitions: A Socio-Technical Perspective. 30
Geels, F. W., 2002: Technological transitions as evolutionary reconfiguration processes: A multi-level 31
perspective and a case-study. Res. Policy, 31(8–9), 1257–1274, doi:10.1016/S0048-32
7333(02)00062-8. 33
Geels, F. W., 2004: From sectoral systems of innovation to socio-technical systems. Res. Policy, 33(6–34
7), 897–920, doi:10.1016/j.respol.2004.01.015. 35
Geels, F. W., 2005b: Technological Transitions and System Innovations. Edward Elgar Publishing, 3–36
4 pp. 37
Geels, F. W., 2012: A socio-technical analysis of low-carbon transitions: introducing the multi-level 38
perspective into transport studies. J. Transp. Geogr., 24, 471–482, 39
doi:10.1016/j.jtrangeo.2012.01.021. 40
Geels, F. W., 2014a: Regime Resistance against Low-Carbon Transitions: Introducing Politics and 41
Power into the Multi-Level Perspective. Theory, Cult. Soc., 31(5), 21–40, 42
doi:10.1177/0263276414531627. 43
Geels, F. W., 2014b: Regime Resistance against Low-Carbon Transitions: Introducing Politics and 44
Power into the Multi-Level Perspective. Theory, Cult. Soc., 31(5), 21–40, 45
doi:10.1177/0263276414531627. 46
ACCEPTED VERSION
SUBJECT TO FIN
AL EDITS

Final Government Draft Chapter 16 IPCC AR6 WGIII
Do Not Cite, Quote or Distribute 16-107 Total pages: 141
Geels, F. W., 2019: Socio-technical transitions to sustainability: a review of criticisms and elaborations 1
of the Multi-Level Perspective. Curr. Opin. Environ. Sustain., 39, 187–201, 2
doi:10.1016/J.COSUST.2019.06.009. 3
Geels, F. W., F. Berkhout, and D. P. van Vuuren, 2016: Bridging analytical approaches for low-carbon 4
transitions. Nat. Clim. Chang., 6(6), 576–583, doi:10.1038/nclimate2980. 5
Geels, F. W., B. K. Sovacool, T. Schwanen, and S. Sorrell, 2017: The Socio-Technical Dynamics of 6
Low-Carbon Transitions. Joule, 1(3), 463–479, doi:10.1016/j.joule.2017.09.018. 7
Genest, A., 2014: The Canada-FIT case and the WTO subsidies agreement: failed fact-finding, needless 8
complexity, and missed judicial economy. McGill J. Sustain. Dev. Law Policy, 10(2), 239–257. 9
Gerlagh, R., and O. Kuik, 2014: Spill or leak? Carbon leakage with international technology spillovers: 10
A CGE analysis. Energy Econ., 45, 381–388, doi:10.1016/j.eneco.2014.07.017. 11
Gertner, J., 2013: The idea factory: Bell Labs and the great age of American innovation. Penguim 12
Books, 422 pp. 13
GeSI, 2012: GeSI SMARTer 2020: The Role of ICT in Driving a Sustainable Future. 14
https://gesi.org/research/gesi-smarter2020-the-role-of-ict-in-driving-a-sustainable-15
future#:~:text=GeSI’s SMARTer2020 report demonstrates how,study conducted four years ago. 16
Gibbons, M., 1999: Science’s new social contract with society. Nature, 402(6761), C81–C84, 17
doi:10.1038/35011576. 18
Gillingham, K. et al., 2016: Deconstructing solar photovoltaic pricing: The role of market structure, 19
technology, and policy. Energy J., , doi:10.5547/01956574.37.3.kgil. 20
Gillingham, K. T., and J. Sweeney, 2012: Barries to implementing low-carbon technologies. Clim. 21
Chang. Econ., 03(04), 1250019, doi:10.1142/S2010007812500194. 22
Girod, B., T. Stucki, and M. Woerter, 2017: How do policies for efficient energy use in the household 23
sector induce energy-efficiency innovation? An evaluation of European countries. Energy Policy, 24
103, 223–237, doi:10.1016/j.enpol.2016.12.054. 25
Glachant, M., and A. Dechezleprêtre, 2017: What role for climate negotiations on technology transfer? 26
Clim. Policy, 17(8), 962–981, doi:10.1080/14693062.2016.1222257. 27
Global Commission on Adaptation, 2019: Adapt now. A global call for leadership on climate resilience. 28
, Rotterdam and Washington, 81 pp. https://cdn.gca.org/assets/2019-29
09/GlobalCommission_Report_FINAL.pdf. 30
Goldfarb, B., 2011: Economic Transformations: General Purpose Technologies and Long-Term 31
Economic Growth. By Richard G. Lipsey, Kenneth I. Carlaw, and Clifford T. Bekar. Oxford: 32
Oxford University Press, 2005., $55.00, hardback. J. Econ. Hist., 71(3), 820–823, 33
doi:10.1017/S0022050711002099. 34
Goldstein, A., C. Doblinger, E. Baker, and L. D. Anadón, 2020: Patenting and business outcomes for 35
cleantech startups funded by the Advanced Research Projects Agency-Energy. Nat. Energy, 5(10), 36
803–810, doi:10.1038/s41560-020-00683-8. 37
Goldstein, A. P., and V. Narayanamurti, 2018: Simultaneous pursuit of discovery and invention in the 38
US Department of Energy. Res. Policy, 47(8), 1505–1512, doi:10.1016/j.respol.2018.05.005. 39
Goldstein, A. P., and M. Kearney, 2020: Know when to fold ‘em: An empirical description of risk 40
management in public research funding. Res. Policy, 49(1), 103873, 41
doi:10.1016/j.respol.2019.103873. 42
Golombek, R., and M. Hoel, 2004: Unilateral Emission Reductions and Cross-Country Technology 43
Spillovers. Adv. Econ. Anal. Policy, 3(2), 57–83, doi:10.2202/1538-0637.1318. 44
Gonsalves, M., and J. M. Rogerson, 2019: Business incubators and green technology: The Gauteng 45
Climate Innovation Centre, South Africa. 30, 212–224, doi:10.5379/urbani-izziv-en-2019-30-46
ACCEPTED VERSION
SUBJECT TO FIN
AL EDITS

Final Government Draft Chapter 16 IPCC AR6 WGIII
Do Not Cite, Quote or Distribute 16-108 Total pages: 141
supplement-014. 1
González, F. G. et al., 2019: Field-grown transgenic wheat expressing the sunflower gene HaHB4 2
significantly outyields the wild type. J. Exp. Bot., 70(5), 1669–1681, doi:10.1093/jxb/erz037. 3
Gossart, C., 2015: ICT Innovations for Sustainability. [Hilty, L.M. and B. Aebischer, (eds.)]. Springer 4
International Publishing, Cham, 435–448 pp. 5
Goulder, L. H., and S. H. Schneider, 1999: Induced technological change and the attractiveness of CO2 6
abatement policies. Resour. Energy Econ., 21(3–4), 211–253, doi:10.1016/S0928-7
7655(99)00004-4. 8
Gram-Hanssen, K., and S. Georg, 2018: Energy performance gaps: promises, people, practices. Build. 9
Res. Inf., 46(1), 1–9, doi:10.1080/09613218.2017.1356127. 10
Grandia, J., and D. Voncken, 2019: Sustainable Public Procurement: The Impact of Ability, Motivation, 11
and Opportunity on the Implementation of Different Types of Sustainable Public Procurement. 12
Sustainability, 11(19), 5215, doi:10.3390/su11195215. 13
Grandstrand, O., 2000: The Economics and Management of Intellectual Property: Towards Intellectual 14
Capitalism. [Granstrand, O., (ed.)]. Edward Elgar, 480 pp. 15
Grau, H. R. et al., 2015: Natural grasslands in the Chaco. A neglected ecosystem under threat by 16
agriculture expansion and forest-oriented conservation policies. J. Arid Environ., 123, 40–46, 17
doi:10.1016/j.jaridenv.2014.12.006. 18
Greaker, M., T. Heggedal, and K. E. Rosendahl, 2018: Environmental Policy and the Direction of 19
Technical Change. Scand. J. Econ., 120(4), 1100–1138, doi:10.1111/sjoe.12254. 20
Green Climate Fund, 2020: GCF Support to Climate Technologies: 16th Meeting of the Advisory Board 21
of the CTCN. 19 pp. https://www.ctc-n.org/sites/www.ctc-n.org/files/Agenda 4.3_Green Climate 22
Fund.pdf (Accessed August 25, 2021). 23
Green, M. A., 2019: How Did Solar Cells Get So Cheap? Joule, 3(3), 631–633, 24
doi:10.1016/j.joule.2019.02.010. 25
Grimm, R., C. Fox, S. Baines, and K. Albertson, 2013: Social innovation, an answer to contemporary 26
societal challenges? Locating the concept in theory and practice. 27
http://dx.doi.org/10.1080/13511610.2013.848163, 26(4), 436–455, 28
doi:10.1080/13511610.2013.848163. 29
Griscom, B. W. et al., 2017: Natural climate solutions. Proc. Natl. Acad. Sci., 114(44), 11645–11650, 30
doi:10.1073/pnas.1710465114. 31
Gross, R., R. Hanna, A. Gambhir, P. Heptonstall, and J. Speirs, 2018: How long does innovation and 32
commercialisation in the energy sectors take? Historical case studies of the timescale from 33
invention to widespread commercialisation in energy supply and end use technology. Energy 34
Policy, 123, 682–699, doi:10.1016/j.enpol.2018.08.061. 35
Grubb, M., and C. Wieners, 2020: Modeling Myths: On the Need for Dynamic Realism in DICE and 36
other Equilibrium Models of Global Climate Mitigation. Inst. New Econ. Think. Work. Pap. Ser., 37
, 1–29, doi:10.36687/inetwp112. 38
Grubb, M. et al., 2021: Induced innovation in energy technologies and systems: a review of evidence 39
and potential implications for CO 2 mitigation. Environ. Res. Lett., 16(4), 043007, 40
doi:10.1088/1748-9326/abde07. 41
Grubler, A., and C. Wilson, 2013: Energy technology innovation: Learning from historical successes 42
and failures. Cambridge University Press, Cambridge, 1–387 pp. 43
Grubler, A. et al., 2018: A low energy demand scenario for meeting the 1.5 °C target and sustainable 44
development goals without negative emission technologies. Nat. Energy, 3(6), 515–527, 45
doi:10.1038/s41560-018-0172-6. 46
ACCEPTED VERSION
SUBJECT TO FIN
AL EDITS

Final Government Draft Chapter 16 IPCC AR6 WGIII
Do Not Cite, Quote or Distribute 16-109 Total pages: 141
Grübler, A., 1996: Time for a change: On the patterns of diffusion of innovation. Daedalus, 125(3), 19–1
42. 2
Grübler, A., 1998: Technology and Global Change. Cambridge University Press, Cambridge, 452 pp. 3
Grübler, A., N. Nakićenović, and D. G. Victor, 1999a: Modeling technological change: Implications 4
for the global environment. Annu. Rev. Energy Environ., 24(1), 545–569, 5
doi:10.1146/annurev.energy.24.1.545. 6
Grübler, A., N. Nakićenović, and D. G. Victor, 1999b: Dynamics of energy technologies and global 7
change. Energy Policy, 27(5), 247–280, doi:10.1016/S0301-4215(98)00067-6. 8
Gruebler, A. et al., 2012: Energy technology innovation systems. In: The Global Energy Assessment 9
[Nakicenovic, N. et al., (ed.)], Cambridge University Press, Cambridge, UK. 10
Gunderson, L. H., and C. S. Holling, 2002: Understanding Transformations in Human and Natural 11
Systems. Island Press, Washington D.C, 509 pp. 12
Gür, T. M., 2018: Review of electrical energy storage technologies, materials and systems: challenges 13
and prospects for large-scale grid storage. Energy Environ. Sci., 11(10), 2696–2767, 14
doi:10.1039/C8EE01419A. 15
Haelg, L., M. Waelchli, and T. S. Schmidt, 2018: Supporting energy technology deployment while 16
avoiding unintended technological lock-in: a policy design perspective. Environ. Res. Lett., 17
13(10), 104011, doi:10.1088/1748-9326/aae161. 18
Haenssgen, M. J., and P. Ariana, 2018: The place of technology in the Capability Approach. Oxford 19
Dev. Stud., 46(1), 98–112, doi:10.1080/13600818.2017.1325456. 20
Hall, B., and C. Helmers, 2010: The role of patent protection in (clean/green) technology transfer. , 21
Maastricht, the Netherlands, 39 pp. http://www.nber.org/papers/w16323.pdf. 22
Hall, B. H., and R. H. Ziedonis, 2001: The Patent Paradox Revisited: An Empirical Study of Patenting 23
in the U.S. Semiconductor Industry, 1979-1995. RAND J. Econ., , doi:10.2307/2696400. 24
Hall, B. H., and C. Helmers, 2019: The impact of international patent systems: Evidence from accession 25
to the European Patent Convention. Res. Policy, 48(9), 103810, 26
doi:10.1016/j.respol.2019.103810. 27
Hall, J. K. K., and M. J. C. J. C. Martin, 2005: Disruptive technologies, stakeholders and the innovation 28
value-added chain: a framework for evaluating radical technology development. R\&D Manag., 29
35(3), 273–284, doi:https://doi.org/10.1111/j.1467-9310.2005.00389.x. 30
Hall, M. J., and A. N. Link, 2015: Technology-based state growth policies: the case of North Carolina’s 31
Green Business Fund. Ann. Reg. Sci., 54(2), 437–449, doi:10.1007/s00168-015-0661-5. 32
Halleck-Vega, S., A. Mandel, and K. Millock, 2018: Accelerating diffusion of climate-friendly 33
technologies: A network perspective. Ecol. Econ., 152(June), 235–245, 34
doi:10.1016/j.ecolecon.2018.05.007. 35
Halleck Vega, S., and A. Mandel, 2018: Technology Diffusion and Climate Policy: A Network 36
Approach and its Application to Wind Energy. Ecol. Econ., 145(December 2017), 461–471, 37
doi:10.1016/j.ecolecon.2017.11.023. 38
Hallegatte, S., 2012: A cost effective solution to reduce disaster losses in developing countries – hydro- 39
meterological services, early warning and evacuation. , Washington, 22 pp. 40
http://hdl.handle.net/10986/9359. 41
Hanley, E. S., J. Deane, and B. Ó. Gallachóir, 2018: The role of hydrogen in low carbon energy futures–42
A review of existing perspectives. Renew. Sustain. Energy Rev., 82, 3027–3045, 43
doi:10.1016/j.rser.2017.10.034. 44
Hanna, R., and D. G. Victor, 2021: Marking the decarbonization revolutions. Nat. Energy, 6(6), 568–45
571, doi:10.1038/s41560-021-00854-1. 46
ACCEPTED VERSION
SUBJECT TO FIN
AL EDITS

Final Government Draft Chapter 16 IPCC AR6 WGIII
Do Not Cite, Quote or Distribute 16-110 Total pages: 141
Hansen, H. K., and T. Porter, 2017: What Do Big Data Do in Global Governance? Glob. Gov. A Rev. 1
Multilater. Int. Organ., 23(1), 31–42, doi:https://doi.org/10.1163/19426720-02301004. 2
Hansen, U. E. et al., 2018: Sustainability transitions in developing countries: Stocktaking, new 3
contributions and a research agenda. Environ. Sci. Policy, 84, 198–203, 4
doi:10.1016/j.envsci.2017.11.009. 5
Hao, H., S. Wang, Z. Liu, and F. Zhao, 2016: The impact of stepped fuel economy targets on 6
automaker’s light-weighting strategy: The China case. Energy, 94, 755–765, 7
doi:10.1016/j.energy.2015.11.051. 8
Harrowsmith, M. et al., 2020: The future of forecasts: Impact-based forecasting for early action. , 9
Geneva, 81 pp. https://www.forecast-based-financing.org/wp-content/uploads/2020/09/Impact-10
based-forecasting-guide-2020.pdf. 11
Haščič, I., and M. Migotto, 2015: Measuring environmental innovation using patent data. OECD 12
Environ. Work. Pap., 89, 58, doi:https://doi.org/10.1787/19970900. 13
Haselip, J. et al., 2015: Governance, enabling frameworks and policies for the transfer and diffusion of 14
low carbon and climate adaptation technologies in developing countries. Clim. Change, 131(3), 15
363–370, doi:10.1007/s10584-015-1440-0. 16
Hassler, J., P. Krusell, and C. Olovsson, 2012: Energy-Saving Technical Change. NBER Work. Pap. 17
Ser., 18456, 41, doi:10.3386/w18456. 18
He, W., and R. Shen, 2019: ISO 14001 Certification and Corporate Technological Innovation: Evidence 19
from Chinese Firms. J. Bus. Ethics, 158(1), 97–117, doi:10.1007/s10551-017-3712-2. 20
He, X. et al., 2019: Solar and wind energy enhances drought resilience and groundwater sustainability. 21
Nat. Commun., 10(1), 4893, doi:10.1038/s41467-019-12810-5. 22
Heeks, R., and C. Stanforth, 2015: Technological change in developing countries: opening the black 23
box of process using actor–network theory. Dev. Stud. Res., 2(1), 33–50, 24
doi:10.1080/21665095.2015.1026610. 25
Heffron, R. J., and D. McCauley, 2018: What is the ‘Just Transition’? Geoforum, 88, 74–77, 26
doi:10.1016/J.GEOFORUM.2017.11.016. 27
Hekkert, M., R. Suurs, S. Negro, S. Kuhlmann, and R. Smits, 2007: Functions of innovation systems: 28
A new approach for analysing technological change. Technol. Forecast. Soc. Change, 74(4), 413–29
432. 30
Hekkert, M. P., and S. O. Negro, 2009: Functions of innovation systems as a framework to understand 31
sustainable technological change: Empirical evidence for earlier claims. Technol. Forecast. Soc. 32
Change, 76(4), 584–594, doi:10.1016/j.techfore.2008.04.013. 33
Hekkert, M. P., M. J. Janssen, J. H. Wesseling, and S. O. Negro, 2020: Mission-oriented innovation 34
systems. Environ. Innov. Soc. Transitions, 34, 76–79, doi:10.1016/j.eist.2019.11.011. 35
Heller, M. A., and R. S. Eisenberg, 1998: Can Patents Deter Innovation? The Anticommons in 36
Biomedical Research. Science (80-. )., 280(5364), 698–701, doi:10.1126/science.280.5364.698. 37
Hellsmark, H., J. Frishammar, P. Söderholm, and H. Ylinenpää, 2016: The role of pilot and 38
demonstration plants in technology development and innovation policy. Res. Policy, 45(9), 1743–39
1761, doi:10.1016/j.respol.2016.05.005. 40
Helm, D., C. Hepburn, and R. Mash, 2003: Credible carbon policy. Oxford Rev. Econ. Policy, 19(3), 41
438–450. 42
Helveston, J., and J. Nahm, 2019: China’s key role in scaling low-carbon energy technologies. Science 43
(80-. )., 366(6467), 794–796, doi:10.1126/science.aaz1014. 44
Hémous, D., 2016: The dynamic impact of unilateral environmental policies. J. Int. Econ., 103(C), 80–45
95, doi:10.1016/j.jinteco.2016.09.001. 46
ACCEPTED VERSION
SUBJECT TO FIN
AL EDITS
Final Government Draft Chapter 16 IPCC AR6 WGIII
Do Not Cite, Quote or Distribute 16-111 Total pages: 141
Henderson, R., and R. Newell, 2011: Introduction. In: Accelerating Energy Innovation [Henderson, R. 1
and R. Newell, (eds.)], Chicago University Press, Chicago, p. pp. 288. 2
Henry, M. S., M. D. Bazilian, and C. Markuson, 2020a: Just transitions: Histories and futures in a post-3
COVID world. Energy Res. Soc. Sci., 68, 101668, doi:10.1016/j.erss.2020.101668. 4
Henry, M. S., M. D. Bazilian, and C. Markuson, 2020b: Just transitions: Histories and futures in a post-5
COVID world. Energy Res. Soc. Sci., 68, 101668, doi:10.1016/j.erss.2020.101668. 6
Herslund, L. et al., 2018: Conditions and opportunities for green infrastructure -- Aiming for green, 7
water-resilient cities in Addis Ababa and Dar es Salaam. Landsc. Urban Plan., 180, 319–327, 8
doi:10.1016/j.landurbplan.2016.10.008. 9
Hertwich, E. G., and G. P. Peters, 2009: Carbon Footprint of Nations: A Global, Trade-Linked Analysis. 10
Environ. Sci. Technol., 43(16), 6414–6420, doi:10.1021/es803496a. 11
Hirsch, A., Y. Parag, and J. Guerrero, 2018: Microgrids: A review of technologies, key drivers, and 12
outstanding issues. Renew. Sustain. Energy Rev., 90, 402–411, 13
doi:https://doi.org/10.1016/j.rser.2018.03.040. 14
Hoffecker, E., 2021: Understanding inclusive innovation processes in agricultural systems: A middle-15
range conceptual model. World Dev., 140, 105382, 16
doi:https://doi.org/10.1016/j.worlddev.2020.105382. 17
Hofman, E., and W. van der Gaast, 2019: Enhancing ambition levels in nationally determined 18
contributions—Learning from Technology Needs Assessments. Wiley Interdiscip. Rev. Energy 19
Environ., 8(1), e311, doi:10.1002/wene.311. 20
Holt-Giménez, E., 2002: Measuring farmers’ agroecological resistance after Hurricane Mitch in 21
Nicaragua: A case study in participatory, sustainable land management impact monitoring. Agric. 22
Ecosyst. Environ., , doi:10.1016/S0167-8809(02)00006-3. 23
Hoppmann, J., M. Peters, M. Schneider, and V. H. Hoffmann, 2013: The two faces of market support—24
How deployment policies affect technological exploration and exploitation in the solar 25
photovoltaic industry. Res. Policy, 42(4), 989–1003, doi:10.1016/j.respol.2013.01.002. 26
Hoppmann, J., J. Huenteler, and B. Girod, 2014: Compulsive policy-making—The evolution of the 27
German feed-in tariff system for solar photovoltaic power. Res. Policy, 43(8), 1422–1441, 28
doi:10.1016/j.respol.2014.01.014. 29
Hoppmann, J., F. Naegele, and B. Girod, 2019: Boards as a Source of Inertia: Examining the Internal 30
Challenges and Dynamics of Boards of Directors in Times of Environmental Discontinuities. 31
Acad. Manag. J., 62(2), 437–468, doi:10.5465/amj.2016.1091. 32
Horbach, J., C. Rammer, and K. Rennings, 2012: Determinants of eco-innovations by type of 33
environmental impact — The role of regulatory push/pull, technology push and market pull. Ecol. 34
Econ., 78, 112–122, doi:10.1016/j.ecolecon.2012.04.005. 35
Horner, N. C., A. Shehabi, and I. L. Azevedo, 2016: Known unknowns: indirect energy effects of 36
information and communication technology. Environ. Res. Lett., 11(10), 103001, 37
doi:10.1088/1748-9326/11/10/103001. 38
Horton, D., and R. Mackay, 2003: Using evaluation to enhance institutional learning and change: recent 39
experiences with agricultural research and development. Agric. Syst., 78(2), 127–142, 40
doi:10.1016/S0308-521X(03)00123-9. 41
Hossain, M., 2018: Frugal innovation: A review and research agenda. J. Clean. Prod., 182, 926–936, 42
doi:10.1016/J.JCLEPRO.2018.02.091. 43
Howell, S. T., 2017: Financing Innovation: Evidence from R&D Grants. Am. Econ. Rev., 107(4), 44
1136–1164, doi:10.1257/aer.20150808. 45
Howlett, M., and P. del Rio, 2015: The parameters of policy portfolios: verticality and horizontality in 46
design spaces and their consequences for policy mix formulation. Environ. Plan. C Gov. Policy, 47
ACCEPTED VERSION
SUBJECT TO FIN
AL EDITS

Final Government Draft Chapter 16 IPCC AR6 WGIII
Do Not Cite, Quote or Distribute 16-112 Total pages: 141
33(5), 1233–1245, doi:10.1177/0263774X15610059. 1
Hsu, S.-L., 2017: Capital Transitioning: An International Human Capital Strategy for Climate 2
Innovation. Transnatl. Environ. Law, 6(1), 153–176, doi:10.1017/S2047102516000169. 3
Hu, R., J. Skea, and M. J. Hannon, 2018: Measuring the energy innovation process: An indicator 4
framework and a case study of wind energy in China. Technol. Forecast. Soc. Change, 127, 227–5
244, doi:10.1016/j.techfore.2017.09.025. 6
Huang, R. et al., 2016: Energy and emissions saving potential of additive manufacturing: the case of 7
lightweight aircraft components. J. Clean. Prod., 135, 1559–1570, 8
doi:10.1016/j.jclepro.2015.04.109. 9
Huenteler, J., C. Niebuhr, and T. S. Schmidt, 2016a: The effect of local and global learning on the cost 10
of renewable energy in developing countries. J. Clean. Prod., 128, 6–21, 11
doi:10.1016/j.jclepro.2014.06.056. 12
Huenteler, J., T. S. Schmidt, J. Ossenbrink, and V. H. Hoffmann, 2016b: Technology life-cycles in the 13
energy sector — Technological characteristics and the role of deployment for innovation. Technol. 14
Forecast. Soc. Change, 104, 102–121, doi:10.1016/j.techfore.2015.09.022. 15
Hughes, S., S. Giest, and L. Tozer, 2020: Accountability and data-driven urban climate governance. 16
Nat. Clim. Chang., 10(12), 1085–1090, doi:10.1038/s41558-020-00953-z. 17
Huh, T., and H.-J. Kim, 2018: Korean Experimentation of Knowledge and Technology Transfer to 18
Address Climate Change in Developing Countries. Sustainability, 10(4), 1263, 19
doi:10.3390/su10041263. 20
Hussein, A. K., 2015: Applications of nanotechnology in renewable energies—A comprehensive 21
overview and understanding. Renew. Sustain. Energy Rev., 42, 460–476, 22
doi:10.1016/j.rser.2014.10.027. 23
ICLEI, 2018: Energy Innovation Procurement: A guide for city authorities. , Freiburg, Germany, 48 pp. 24
IEA, 2015: 4E: Achievements of Appliance Energy Efficiency Standards and Labelling Programs. , 25
Paris, https://www.iea.org/reports/achievements-of-appliance-energy-efficiency-standards-and-26
labelling-programs. 27
IEA, 2017a: Early-Stage Venture Capital for Energy Innovation. , Paris, France, 28
https://www.iea.org/reports/early-stage-venture-capital-for-energy-innovation (Accessed 29
December 18, 2020). 30
IEA, 2017b: Digitalisation and Energy. 31
IEA, 2019: Energy technology RD&D – Data services. https://www.iea.org/subscribe-to-data-32
services/energy-technology-rdd (Accessed December 12, 2020). 33
IEA, 2020a: Energy Technology Perspectives 2020. IEA, Paris, France, 400 pp. 34
https://www.iea.org/reports/energy-technology-perspectives-2020 (Accessed July 21, 2021). 35
IEA, 2020b: Energy Technology Perspectives: Special report on Clean Energy Innovation. IEA, Paris, 36
France, 185 pp. https://iea.blob.core.windows.net/assets/04dc5d08-4e45-447d-a0c1-37
d76b5ac43987/Energy_Technology_Perspectives_2020_-38
_Special_Report_on_Clean_Energy_Innovation.pdf. 39
IEA, 2020c: World Enery Outlook. , Paris,. 40
Inoue, E., T. H. Arimura, and M. Nakano, 2013: A new insight into environmental innovation: Does 41
the maturity of environmental management systems matter? Ecol. Econ., 94, 156–163, 42
doi:10.1016/j.ecolecon.2013.07.014. 43
IPBES, 2019: Summary for policymakers of the global assessment report on biodiversity and ecosystem 44
services of the Intergovernmental Science-Policy Platform on Biodiversity and Ecosystem 45
Services. , Bonn, Germany,. 46
ACCEPTED VERSION
SUBJECT TO FIN
AL EDITS

Final Government Draft Chapter 16 IPCC AR6 WGIII
Do Not Cite, Quote or Distribute 16-113 Total pages: 141
IPCC, 2000: Methodological and Technological Issues in Technology Transfer. [Metz, B., D. 1
Ogunlade, J.-W. Martens, S. Van Rooijen, and L. Van Wie Mcgrory, (eds.)]. Cambridge 2
University Press, Cambridge, 432 pp. 3
IPCC, 2007: Climate Change 2007: Contribution of Working Group III to the Fourth Assessment 4
Report of the Intergovernmental Panel on Climate Change, 2007. [Metz, B., O.R. Davidson, P.R. 5
Bosch, R. Dave, and L.A. Meyer, (eds.)]. Cambridge University Press, Cambridge, UK and New 6
York, US,. 7
IPCC, 2012: Managing the Risks of Extreme Events and Disasters to Advance Climate Change 8
Adaptation. A Special Report of Working Groups I and II of the Intergovernmental Panel on 9
Climate Change. [Field, C.B. et al., (eds.)]. Cambridge University Press, Cambridge, UK and New 10
York, US, 582 pp. 11
IPCC, 2014: Climate Change 2014 Mitigation of Climate Change. Cambridge University Press, 12
Cambridge,. 13
IPCC, 2018a: Global Warming of 1.5 °C an IPCC special report on the impacts of global warming of 14
1.5 °C above pre-industrial levels and related global greenhouse gas emission pathways, in the 15
context of strengthening the global response to the threat of climate change. 16
IPCC, 2018b: Summary for Policymakers. In: Global Warming of 1.5 °C an IPCC special report on the 17
impacts of global warming of 1.5 °C above pre-industrial levels and related global greenhouse 18
gas emission pathways, in the context of strengthening the global response to the threat of climate 19
change. 20
IRENA, 2020a: Renewable energy statistics. , Abu Dhabi, 408 pp. 21
https://www.irena.org/publications/2020/Jul/Renewable-energy-statistics-2020. 22
IRENA, 2020b: Renewable Power Generation Costs in 2019. , Abu Dhabi, 144 pp. 23
https://www.irena.org/publications/2020/Jun/Renewable-Power-Costs-in-2019 (Accessed 24
October 30, 2021). 25
Isoard, S., and A. Soria, 2001: Technical change dynamics: evidence from the emerging renewable 26
energy technologies. Energy Econ., 23(6), 619–636, doi:10.1016/S0140-9883(01)00072-X. 27
Ito, K., and J. M. Sallee, 2018: The Economics of Attribute-Based Regulation: Theory and Evidence 28
from Fuel Economy Standards. Rev. Econ. Stat., 100(2), 319–336, doi:10.1162/REST_a_00704. 29
Ivanova, D. et al., 2018: Carbon mitigation in domains of high consumer lock-in. Glob. Environ. 30
Chang., 52, 117–130, doi:10.1016/j.gloenvcha.2018.06.006. 31
Iyer, G. et al., 2015: Diffusion of low-carbon technologies and the feasibility of long-term climate 32
targets. Technol. Forecast. Soc. Change, 90(PA), 103–118, doi:10.1016/j.techfore.2013.08.025. 33
Jacobsen, M. R., 2013: Evaluating US Fuel Economy Standards in a Model with Producer and 34
Household Heterogeneity. Am. Econ. J. Econ. Policy, 5(2), 148–187, doi:10.1257/pol.5.2.148. 35
Jacobsson, S., and A. Bergek, 2006: A Framework for Guiding Policy-makers Intervening in Emerging 36
Innovation Systems in ‘Catching-Up’ Countries. Eur. J. Dev. Res., 18(4), 687–707, 37
doi:10.1080/09578810601094902. 38
Jacobsson, S., B. Sandén, and L. Bångens, 2004: Transforming the Energy System — the Evolution of 39
the German Technological System for Solar Cells. Technol. Anal. Strateg. Manag., 16(1), 3–30, 40
doi:10.1080/0953732032000199061. 41
Jacobsson, S., A. Bergek, and B. Sandén, 2017: Improving the European Commission’s analytical base 42
for designing instrument mixes in the energy sector: Market failures versus system weaknesses. 43
Energy Res. Soc. Sci., 33, 11–20, doi:10.1016/j.erss.2017.09.009. 44
Jaffe, A., and J. Lerner, 2004: Innovation and its discontents: How our broken patent system is 45
endangering innovation and progress, and what to do about it. Princeton University Press, 46
Princeton, New Jersey, United States, 256 pp. 47
ACCEPTED VERSION
SUBJECT TO FIN
AL EDITS

Final Government Draft Chapter 16 IPCC AR6 WGIII
Do Not Cite, Quote or Distribute 16-114 Total pages: 141
Jaffe, A. B., 2015: Technology diffusion. In: Emerging Trends in the Social and Behavioral Sciences 1
[Scott, R. and Kosslyn, (eds.)], John Wiley and Sons Inc., Hoboken, New Jersey, US. 2
Jaffe, A. B., and G. de Rassenfosse, 2017: Patent citation data in social science research: Overview and 3
best practices. J. Assoc. Inf. Sci. Technol., 68(6), 1360–1374, doi:10.1002/asi.23731. 4
Jaffe, A. B., R. G. Newell, and R. N. Stavins, 2000: Technological Change and the Environment. SSRN 5
Electron. J., 1, doi:10.2139/ssrn.252927. 6
Jaffe, A. B., R. G. Newell, and R. N. Stavins, 2005: A tale of two market failures: Technology and 7
environmental policy. Ecol. Econ., 54(2–3), 164–174, doi:10.1016/j.ecolecon.2004.12.027. 8
Jain, M., A. B. Rao, and A. Patwardhan, 2018: Appliance labeling and consumer heterogeneity: A 9
discrete choice experiment in India. Appl. Energy, 226, 213–224, 10
doi:10.1016/j.apenergy.2018.05.089. 11
Jairaj, B., A. Agarwal, T. Parthasarathy, and S. Martin, 2016: Strengthening Governance of India’s 12
Appliance Efficiency Standards and Labeling Program. , New Delhi, India, 28 pp. 13
Jamasb, T., 2007: Technical Change Theory and Learning Curves: Patterns of Progress in Energy 14
Technologies. Energy J., 28(3), 51–72, doi:10.2307/41323109. 15
Jamasb, T., and M. Pollitt, 2008: Liberalisation and R&D in network industries: The case of the 16
electricity industry. Res. Policy, 37(6–7), 995–1008, doi:10.1016/j.respol.2008.04.010. 17
Jasanoff, S., 2003: Technologies of Humility: Citizen Participation in Governing Science. Minerva, 18
41(3), 223–244, doi:10.1023/A:1025557512320. 19
Jasanoff, S., 2018: Just transitions: A humble approach to global energy futures. Energy Res. Soc. Sci., 20
35, 11–14, doi:10.1016/j.erss.2017.11.025. 21
Jasmab, T., and M. Pollitt, 2005: Deregulation and R & D in Network Industries : The Case of the 22
Electricity Industry. , Cambridge, UK,. 23
Johnstone, P., and P. Newell, 2018: Sustainability transitions and the state. Environ. Innov. Soc. 24
Transitions, 27, 72–82, doi:10.1016/j.eist.2017.10.006. 25
Jones, N., 2018: How to stop data centres from gobbling up the world’s electricity. Nature, 561(7722), 26
163–166, doi:10.1038/d41586-018-06610-y. 27
Joshi, G. Y., P. A. Sheorey, and A. V. Gandhi, 2019: Analyzing the barriers to purchase intentions of 28
energy efficient appliances from consumer perspective. Benchmarking An Int. J., 26(5), 1565–29
1580, doi:10.1108/BIJ-03-2018-0082. 30
Kaack, L. et al., 2021: Aligning artificial intelligence with climate change mitigation. 20 pp. 31
Kahn, M. E., and N. Kok, 2014: The capitalization of green labels in the California housing market. 32
Reg. Sci. Urban Econ., 47, 25–34, doi:10.1016/j.regsciurbeco.2013.07.001. 33
Kahouli, S., 2011: Effects of technological learning and uranium price on nuclear cost: Preliminary 34
insights from a multiple factors learning curve and uranium market modeling. Energy Econ., 35
33(5), 840–852, doi:10.1016/J.ENECO.2011.02.016. 36
Kammen, D. M., and G. F. Nemet, 2007: Energy Myth Eleven – Energy R&D Investment Takes 37
Decades to Reach the Market. In: Energy and American Society – Thirteen Myths [Sovacool, B.K. 38
and M.A. Brown, (eds.)], Springer Netherlands, Dordrecht, pp. 289–309. 39
Kang, J.-N. et al., 2020: The Prospects of Carbon Capture and Storage in China’s Power Sector under 40
the 2 °C Target: A Component-based Learning Curve Approach. Int. J. Greenh. Gas Control, 101, 41
103149, doi:10.1016/j.ijggc.2020.103149. 42
Karakosta, C., H. Doukas, and J. Psarras, 2012: Carbon market and technology transfer: Statistical 43
analysis for exploring implications. Int. J. Sustain. Dev. World Ecol., 19(4), 311–320, 44
doi:10.1080/13504509.2011.644638. 45
ACCEPTED VERSION
SUBJECT TO FIN
AL EDITS

Final Government Draft Chapter 16 IPCC AR6 WGIII
Do Not Cite, Quote or Distribute 16-115 Total pages: 141
Karkatsoulis, P., P. Capros, P. Fragkos, L. Paroussos, and S. Tsani, 2016: First-mover advantages of 1
the European Union’s climate change mitigation strategy. Int. J. Energy Res., 40(6), 814–830, 2
doi:10.1002/er.3487. 3
Karlsson, M., E. Alfredsson, and N. Westling, 2020: Climate policy co-benefits: a review. Clim. Policy, 4
20(3), 292–316, doi:10.1080/14693062.2020.1724070. 5
Kavlak, G., J. McNerney, and J. E. Trancik, 2018: Evaluating the causes of cost reduction in 6
photovoltaic modules. Energy Policy, 123, 700–710, doi:10.1016/j.enpol.2018.08.015. 7
Kemp, R., 2005: Zero emission vehicle mandate in California: misguided policy or example of 8
enlightened leadership. In: Time Strategies, Innovation and Environmental Policy [Sartorius, C. 9
and S. Zundel, (eds.)], Edward Elgar, Cheltenham, UK and Northhampton, MA, USA, pp. 169–10
191. 11
Kemp, R., 2011: Ten themes for eco-innovation policies in Europe. Sapiens, 4(2), 1–20. 12
Kemp, R., and L. Soete, 1990: Inside the “green box”: on the economics of technological change and 13
the environment. New Explor. Econ. Technol. Chang., , 244–257. 14
Kemp, R., J. Schot, and R. Hoogma, 1998: Regime shifts to sustainability through processes of niche 15
formation: The approach of strategic niche management. Technol. Anal. Strateg. Manag., 10(2), 16
175–198, doi:10.1080/09537329808524310. 17
Kern, F., and M. Howlett, 2009: Implementing transition management as policy reforms: a case study 18
of the Dutch energy sector. Policy Sci., 42(4), 391–408, doi:10.1007/s11077-009-9099-x. 19
Kerras, H., J. L. Sánchez-Navarro, E. I. López-Becerra, and M. D. de-M. Gómez, 2020: The Impact of 20
the Gender Digital Divide on Sustainable Development: Comparative Analysis between the 21
European Union and the Maghreb. Sustain. 2020, Vol. 12, Page 3347, 12(8), 3347, 22
doi:10.3390/SU12083347. 23
Khalili, N. R., S. Duecker, W. Ashton, and F. Chavez, 2015: From cleaner production to sustainable 24
development: the role of academia. J. Clean. Prod., 96, 30–43, doi:10.1016/j.jclepro.2014.01.099. 25
Khan, M., D. Mfitumukiza, and S. Huq, 2020: Capacity building for implementation of nationally 26
determined contributions under the Paris Agreement. Clim. Policy, 20(4), 499–510, 27
doi:10.1080/14693062.2019.1675577. 28
Khanna, T. M. et al., 2021: A multi-country meta-analysis on the role of behavioural change in reducing 29
energy consumption and CO2 emissions in residential buildings. Nat. Energy, 6(9), 925–932, 30
doi:10.1038/s41560-021-00866-x. 31
Khosla, R., A. Sagar, and A. Mathur, 2017: Deploying Low-carbon Technologies in Developing 32
Countries: A view from India’s buildings sector. Environ. Policy Gov., 27(2), 149–162, 33
doi:10.1002/eet.1750. 34
Kim, H. S., and S.-S. Kwak, 2020: Crop biotechnology for sustainable agriculture in the face of climate 35
crisis. Plant Biotechnol. Rep., 14(2), 139–141, doi:10.1007/s11816-020-00619-4. 36
Kim, Y. J., and M. Brown, 2019: Impact of domestic energy-efficiency policies on foreign innovation: 37
The case of lighting technologies. Energy Policy, 128(January), 539–552, 38
doi:10.1016/j.enpol.2019.01.032. 39
Kimura, O., and T. Suzuki, 2006: 30 years of solar energy development in Japan : co-evolution process 40
of technology , policies , and the market. Power, , 17–18. 41
Kiso, T., 2019: Environmental Policy and Induced Technological Change: Evidence from Automobile 42
Fuel Economy Regulations. Environ. Resour. Econ., 74(2), 785–810, doi:10.1007/s10640-019-43
00347-6. 44
Kivimaa, P., and F. Kern, 2016: Creative destruction or mere niche support? Innovation policy mixes 45
for sustainability transitions. Res. Policy, 45(1), 205–217, doi:10.1016/j.respol.2015.09.008. 46
ACCEPTED VERSION
SUBJECT TO FIN
AL EDITS

Final Government Draft Chapter 16 IPCC AR6 WGIII
Do Not Cite, Quote or Distribute 16-116 Total pages: 141
Klaassen, G., A. Miketa, K. Larsen, and T. Sundqvist, 2005: The impact of R&D on innovation 1
for wind energy in Denmark, Germany and the United Kingdom. Ecol. Econ., 54(2–3), 227–240, 2
doi:10.1016/j.ecolecon.2005.01.008. 3
Klein Woolthuis, R., M. Lankhuizen, and V. Gilsing, 2005: A system failure framework for innovation 4
policy design. Technovation, 25(6), 609–619, doi:10.1016/j.technovation.2003.11.002. 5
Klerkx, L., B. van Mierlo, and C. Leeuwis, 2012: Evolution of systems approaches to agricultural 6
innovation: concepts, analysis and interventions. In: Farming Systems Research into the 21st 7
Century: The New Dynamic [Darnhofer, I., D. Gibbon, and B. Dedieu, (eds.)], Springer 8
Netherlands, Dordrecht, pp. 457–483. 9
Klerkx, L., E. Jakku, and P. Labarthe, 2019: A review of social science on digital agriculture, smart 10
farming and agriculture 4.0: New contributions and a future research agenda. NJAS - Wageningen 11
J. Life Sci., 90–91, 100315, doi:10.1016/j.njas.2019.100315. 12
Kline, S., and N. Rosenberg, 1986: An overview of innovation. In: The Positive Sum Strategy: 13
Harnessing Technology for Economic Growth [Landau, R. and N. Rosenberg, (eds.)], The 14
National Academies Press, Washington D.C., United States, pp. 275–306. 15
Knittel, C. R., 2011: Automobiles on Steroids: Product Attribute Trade-Offs and Technological 16
Progress in the Automobile Sector. Am. Econ. Rev., 101(7), 3368–3399, 17
doi:10.1257/aer.101.7.3368. 18
Knobloch, F., and J.-F. Mercure, 2016: The behavioural aspect of green technology investments: A 19
general positive model in the context of heterogeneous agents. Environ. Innov. Soc. Transitions, 20
21, 39–55, doi:10.1016/j.eist.2016.03.002. 21
Koasidis, K. et al., 2020a: Many Miles to Paris: A Sectoral Innovation System Analysis of the Transport 22
Sector in Norway and Canada in Light of the Paris Agreement. Sustainability, 12(14), 5832, 23
doi:10.3390/su12145832. 24
Koasidis, K. et al., 2020b: The UK and German Low-Carbon Industry Transitions from a Sectoral 25
Innovation and System Failures Perspective. Energies, 13(19), 4994, doi:10.3390/en13194994. 26
Koch, N., G. Grosjean, S. Fuss, and O. Edenhofer, 2016: Politics matters: Regulatory events as catalysts 27
for price formation under cap-and-trade. J. Environ. Econ. Manage., 78, 121–139, 28
doi:10.1016/j.jeem.2016.03.004. 29
Koengkan, M., Y. E. Poveda, and J. A. Fuinhas, 2020: Globalisation as a motor of renewable energy 30
development in Latin America countries. GeoJournal, 85(6), 1591–1602, doi:10.1007/s10708-31
019-10042-0. 32
Koh, H., and C. L. Magee, 2008: A functional approach for studying technological progress: Extension 33
to energy technology. Technol. Forecast. Soc. Change, 75(6), 735–758, 34
doi:10.1016/j.techfore.2007.05.007. 35
Köhler, J. et al., 2019: An agenda for sustainability transitions research: State of the art and future 36
directions. Environ. Innov. Soc. Transitions, 31, 1–32, doi:10.1016/j.eist.2019.01.004. 37
Koohafkan, P., and M. Altieri, 2010: Globally important agricultural heritage systems: a legacy for the 38
future. , Rome,. 39
Koronen, C., M. Åhman, and L. J. Nilsson, 2020: Data centres in future European energy systems—40
energy efficiency, integration and policy. Energy Effic., 13(1), 129–144, doi:10.1007/s12053-019-41
09833-8. 42
Kotchen, M. J., 2021: The producer benefits of implicit fossil fuel subsidies in the United States. Proc. 43
Natl. Acad. Sci., 118(14), e2011969118, doi:10.1073/pnas.2011969118. 44
Kowarsch, M. et al., 2016: Scientific assessments to facilitate deliberative policy learning. Palgrave 45
Commun., 2(1), 16092, doi:10.1057/palcomms.2016.92. 46
Kraus, S., and N. Koch, 2021: Provisional COVID-19 infrastructure induces large, rapid increases in 47
ACCEPTED VERSION
SUBJECT TO FIN
AL EDITS

Final Government Draft Chapter 16 IPCC AR6 WGIII
Do Not Cite, Quote or Distribute 16-117 Total pages: 141
cycling. Proc. Natl. Acad. Sci. U. S. A., 118(15), doi:10.1073/pnas.2024399118. 1
Krey, V. et al., 2019: Looking under the hood: A comparison of techno-economic assumptions across 2
national and global integrated assessment models. Energy, 172, 1254–1267, 3
doi:10.1016/j.energy.2018.12.131. 4
Kriegler, E. et al., 2015: Making or breaking climate targets: The AMPERE study on staged accession 5
scenarios for climate policy. Technol. Forecast. Soc. Change, 90, 24–44, 6
doi:10.1016/j.techfore.2013.09.021. 7
Kuhl, L., K. Van Maanen, and S. Scyphers, 2020: An analysis of UNFCCC-financed coastal adaptation 8
projects: Assessing patterns of project design and contributions to adaptive capacity. World Dev., 9
127, 104748, doi:10.1016/j.worlddev.2019.104748. 10
Kumar, V., U. Kumar, and A. Persaud, 1999: Building Technological Capability Through Importing 11
Technology: The Case of Indonesian Manufacturing Industry. J. Technol. Transf., 24(1), 81–96, 12
doi:10.1023/A:1007728921126. 13
Kunkel, S., and M. Matthess, 2020: Digital transformation and environmental sustainability in industry: 14
Putting expectations in Asian and African policies into perspective. Environ. Sci. Policy, 112, 15
318–329, doi:https://doi.org/10.1016/j.envsci.2020.06.022. 16
Kuntze, J.-C., and T. Moerenhout, 2012: Local Content Requirements and the Renewable Energy 17
Industry - A Good Match? SSRN Electron. J., , 19, doi:10.2139/ssrn.2188607. 18
Kuoljok, K., 2019: Without land we are lost: traditional knowledge, digital technology and power 19
relations. Altern. An Int. J. Indig. Peoples, 15(4), 349–358, doi:10.1177/1177180119890134. 20
Kypreos, S., and O. Bahn, 2003: A MERGE Model with Endogenous Technological Progress. Environ. 21
Model. Assess., 8, 249–259, doi:https://doi.org/10.1023/A:1025551408939. 22
Lacal-Arántegui, R., 2019: Globalization in the wind energy industry: contribution and economic 23
impact of European companies. Renew. Energy, 134, 612–628, 24
doi:10.1016/J.RENENE.2018.10.087. 25
Lachapelle, E., R. MacNeil, and M. Paterson, 2017: The political economy of decarbonisation: from 26
green energy ‘race’ to green ‘division of labour.’ New Polit. Econ., 22(3), 311–327, 27
doi:10.1080/13563467.2017.1240669. 28
Lafond, F. et al., 2018: How well do experience curves predict technological progress? A method for 29
making distributional forecasts. Technol. Forecast. Soc. Change, 128, 104–117, 30
doi:10.1016/j.techfore.2017.11.001. 31
Laine, J., K. Kontu, J. Heinonen, and S. Junnila, 2020: Uncertain greenhouse gas implication in waste 32
heat utilization – A case study with a data center. J. Sustain. Dev. Energy, Water Environ. Syst., 33
8(2), 360–372, doi:10.13044/j.sdewes.d7.0301. 34
Laird, F. N., 2001: Solar Energy, Technology Policy, and Institutional Values. Cambridge University 35
Press, Cambridge, 248 pp. 36
Lambin, E. F., and P. Meyfroidt, 2011: Global land use change, economic globalization, and the 37
looming land scarcity. Proc. Natl. Acad. Sci., 108(9), 3465–3472, doi:10.1073/pnas.1100480108. 38
Lamperti, F., G. Dosi, M. Napoletano, A. Roventini, and A. Sapio, 2020: Climate change and green 39
transitions in an agent-based integrated assessment model. Technol. Forecast. Soc. Change, 153, 40
119806, doi:10.1016/j.techfore.2019.119806. 41
Lange, S., J. Pohl, and T. Santarius, 2020: Digitalization and energy consumption. Does ICT reduce 42
energy demand? Ecol. Econ., 176, 106760, doi:10.1016/j.ecolecon.2020.106760. 43
Lauber, V., and S. Jacobsson, 2016: The politics and economics of constructing, contesting and 44
restricting socio-political space for renewables – The German Renewable Energy Act. Environ. 45
Innov. Soc. Transitions, 18, 147–163, doi:10.1016/j.eist.2015.06.005. 46
ACCEPTED VERSION
SUBJECT TO FIN
AL EDITS

Final Government Draft Chapter 16 IPCC AR6 WGIII
Do Not Cite, Quote or Distribute 16-118 Total pages: 141
Le Treut, G., J. Lefèvre, F. Lallana, and G. Bravo, 2021: The multi-level economic impacts of deep 1
decarbonization strategies for the energy system. Energy Policy, 156, 112423, 2
doi:10.1016/j.enpol.2021.112423. 3
Lee, J., F. M. Veloso, D. A. Hounshell, and E. S. Rubin, 2010: Forcing technological change: A case 4
of automobile emissions control technology development in the US. Technovation, 30(4), 249–5
264, doi:10.1016/j.technovation.2009.12.003. 6
Lee, T., 2017: The effect of clean energy regulations and incentives on green jobs: panel analysis of the 7
United States, 1998-2007. Nat. Resour. Forum, 41(3), 145–155, doi:10.1111/1477-8947.12125. 8
Lee, W. J., and R. Mwebaza, 2020: The Role of the Climate Technology Centre and Network as a 9
Climate Technology and Innovation Matchmaker for Developing Countries. Sustainability, 10
12(19), 7956, doi:10.3390/su12197956. 11
Lehmann, P., 2012: Justifying a policy mix for pollution control: A review of economic literature. J. 12
Econ. Surv., 26(1), 71–97, doi:10.1111/j.1467-6419.2010.00628.x. 13
Lehoux, N., S. D’Amours, and A. Langevin, 2014: Inter-firm collaborations and supply chain 14
coordination: review of key elements and case study. Prod. Plan. Control, 25(10), 858–872, 15
doi:10.1080/09537287.2013.771413. 16
Lema, R., M. Iizuka, and R. Walz, 2015: Introduction to low-carbon innovation and development: 17
insights and future challenges for research. Innov. Dev., 5(2), 173–187, 18
doi:10.1080/2157930X.2015.1065096. 19
Lema, R., X. Fu, and R. Rabellotti, 2020: Green windows of opportunity: Latecomer development in 20
the age of transformation toward sustainability. Ind. Corp. Chang., 29(5), 1193–1209, 21
doi:10.1093/icc/dtaa044. 22
Lema, R., P. L. Bhamidipati, C. Gregersen, U. E. Hansen, and J. Kirchherr, 2021: China’s investments 23
in renewable energy in Africa: Creating co-benefits or just cashing-in? World Dev., 141, 105365, 24
doi:10.1016/j.worlddev.2020.105365. 25
Lepoutre, J., and A. Oguntoye, 2018: The (non-)emergence of mobile money systems in Sub-Saharan 26
Africa: A comparative multilevel perspective of Kenya and Nigeria. Technol. Forecast. Soc. 27
Change, 131, 262–275, doi:10.1016/j.techfore.2017.11.010. 28
Levin, K., B. Cashore, S. Berstein, and G. Auld, 2012: Overcoming the tragedy of super wicked 29
problems. Policy Sci., 45(2), 123–152. 30
Levinson, A., 2019: Energy Efficiency Standards Are More Regressive Than Energy Taxes: Theory 31
and Evidence. J. Assoc. Environ. Resour. Econ., 6(S1), S7–S36, doi:10.1086/701186. 32
Lewis, J. I., 2014: Industrial policy, politics and competition: Assessing the post-crisis wind power 33
industry. Bus. Polit., 16(4), 511–547, doi:10.1515/bap-2014-0012. 34
Ley, M., T. Stucki, and M. Woerter, 2016: The Impact of Energy Prices on Green Innovation. Energy 35
J., 37(1), doi:10.5547/01956574.37.1.mley. 36
Li, D., F. Tang, and J. Jiang, 2019a: Does environmental management system foster corporate green 37
innovation? The moderating effect of environmental regulation. Technol. Anal. Strateg. Manag., 38
31(10), 1242–1256, doi:10.1080/09537325.2019.1602259. 39
Li, J. et al., 2020: Does intellectual property rights protection constitute a barrier to renewable energy? 40
An econometric analysis. Natl. Inst. Econ. Rev., 251, R37–R46, doi:10.1017/nie.2020.5. 41
Li, Z., H. Dong, Z. Huang, and P. Failler, 2019b: Impact of Foreign Direct Investment on Environmental 42
Performance. Sustainability, 11(13), 3538, doi:10.3390/su11133538. 43
Liebowitz, S. J., and S. E. Margolis, 1995: Path Dependence, Lock-In, and History. SSRN Electron. J., 44
11(1), 205–226, doi:10.2139/ssrn.1706450. 45
Lilliestam, J., A. Patt, and G. Bersalli, 2021: The effect of carbon pricing on technological change for 46
ACCEPTED VERSION
SUBJECT TO FIN
AL EDITS

Final Government Draft Chapter 16 IPCC AR6 WGIII
Do Not Cite, Quote or Distribute 16-119 Total pages: 141
full energy decarbonization: A review of empirical ex‐post evidence. WIREs Clim. Chang., 12(1), 1
doi:10.1002/wcc.681. 2
Lin, B., and Y. Chen, 2019: Does electricity price matter for innovation in renewable energy 3
technologies in China? Energy Econ., 78, 259–266, doi:10.1016/j.eneco.2018.11.014. 4
Littleton, M., 2008: The TRIPS Agreement and Transfer of Climate- Change-Related Technologies to 5
Developing Countries. , New York, NY, USA, 48 pp. 6
Littleton, M., 2009: The TRIPS Agreement and transfer of climate-change-related technologies to 7
developing countries. Nat. Resour. Forum, 33(3), 233–244, doi:10.1111/j.1477-8
8947.2009.01228.x. 9
Lo, K., 2014: A critical review of China’s rapidly developing renewable energy and energy efficiency 10
policies. Renew. Sustain. Energy Rev., 29, 508–516, doi:10.1016/j.rser.2013.09.006. 11
Luderer, G. et al., 2019: Environmental co-benefits and adverse side-effects of alternative power sector 12
decarbonization strategies. Nat. Commun., 10(1), 5229, doi:10.1038/s41467-019-13067-8. 13
Lundvall, B.-Å., 1988: Innovation as an interactive process: from user-producer interaction to the 14
national system of innovation. In: Technical Change and Economic Theory [Dosi, G., C. Freeman, 15
R. Nelson, G. Silverberg, and L. Soete, (eds.)], Pinter Publishers, London and New York. 16
Lundvall, B.-Å., 1992: National Systems of Innovation: Toward a Theory of Innovation and Interactive 17
Learning. [Lundvall, B.-A., (ed.)]. Pinter Publishers, London, 342 pp. 18
Lundvall, B.-Å., K. Joseph, C. Chaminade, and J. Vang, 2009: Handbook of Innovation Systems and 19
Developing Countries. [Lundvall, B.-Å., K. Joseph, C. Chaminade, and J. Vang, (eds.)]. Edward 20
Elgar Publishing, London and New York, 416 pp. 21
Lynch, J. K., J. Glasby, and S. Robinson, 2019: If telecare is the answer, what was the question? 22
Storylines, tensions and the unintended consequences of technology-supported care. Crit. Soc. 23
Policy, 39(1), 44–65, doi:10.1177/0261018318762737. 24
Lytle, W. et al., 2020: Conceptual Design and Rationale for a New Agrivoltaics Concept: Pasture-25
Raised Rabbits and Solar Farming. J. Clean. Prod., , 124476, doi:10.1016/j.jclepro.2020.124476. 26
Machlup, F., 1958: An economic review of the patent system, Subcommittee on Patents, Trademarks & 27
Copyrights of the Senate Committee on the Judiciary, 85th Cong., 2d Sess, study number15. 28
United States Government Printing Office, Washington D.C, 94 pp. 29
Machlup, F., and E. Penrose, 1950: The Patent Controversy in the Nineteenth Century. J. Econ. Hist., 30
10(1), 1–29, doi:10.1017/S0022050700055893. 31
Maharajh, R., and E. Kraemer-Mbula, 2010: Innovation strategies in developing countries. In: 32
Innovation and the Development Agenda, OECD Publishing, Paris, pp. 133–151. 33
Mainali, B., J. Luukkanen, S. Silveira, and J. Kaivo-oja, 2018: Evaluating Synergies and Trade-Offs 34
among Sustainable Development Goals (SDGs): Explorative Analyses of Development Paths in 35
South Asia and Sub-Saharan Africa. Sustain. 2018, Vol. 10, Page 815, 10(3), 815, 36
doi:10.3390/SU10030815. 37
Malhotra, A., and T. S. Schmidt, 2020: Accelerating Low-Carbon Innovation. Joule, 4(11), 2259–2267, 38
doi:https://doi.org/10.1016/j.joule.2020.09.004. 39
Malhotra, A., A. Mathur, S. Diddi, and A. D. Sagar, 2021: Building institutional capacity for addressing 40
climate and sustainable development goals: achieving energy efficiency in India. Clim. Policy, , 41
1–19, doi:10.1080/14693062.2021.1984195. 42
Mancusi, M. L., 2008: International spillovers and absorptive capacity: A cross-country cross-sector 43
analysis based on patents and citations. J. Int. Econ., 76(2), 155–165, 44
doi:10.1016/j.jinteco.2008.06.007. 45
Mankins, J., 1995: Technology Readiness Level – A White Paper. 6 pp. 46
ACCEPTED VERSION
SUBJECT TO FIN
AL EDITS

Final Government Draft Chapter 16 IPCC AR6 WGIII
Do Not Cite, Quote or Distribute 16-120 Total pages: 141
Mankins, J. C., 2009: Technology readiness assessments: A retrospective. Acta Astronaut., 65(9–10), 1
1216–1223, doi:10.1016/j.actaastro.2009.03.058. 2
Marangoni, G., and M. Tavoni, 2014: The clean energy strategy for 2°C. Clim. Chang. Econ., 05(01), 3
1440003, doi:10.1142/S201000781440003X. 4
Markard, J., 2018: The next phase of the energy transition and its implications for research and policy. 5
Nat. Energy, 3(8), 628–633, doi:10.1038/s41560-018-0171-7. 6
Markard, J., R. Raven, and B. Truffer, 2012: Sustainability transitions: An emerging field of research 7
and its prospects. Res. Policy, 41(6), 955–967, doi:10.1016/j.respol.2012.02.013. 8
Markard, J., F. W. Geels, and R. Raven, 2020: Challenges in the acceleration of sustainability 9
transitions. Environ. Res. Lett., 15(8), 081001, doi:10.1088/1748-9326/AB9468. 10
Marquardt, J., K. Steinbacher, and M. Schreurs, 2016: Driving force or forced transition? J. Clean. 11
Prod., 128, 22–33, doi:10.1016/j.jclepro.2015.06.080. 12
Masanet, E., A. Shehabi, N. Lei, S. Smith, and J. Koomey, 2020: Recalibrating global data center 13
energy-use estimates. Science (80-. )., 367(6481), 984–986, doi:10.1126/science.aba3758. 14
Maskus, K., 2010: Differentiated Intellectual Property Regimes for Environmental and Climate 15
Technologies. OECD Environ. Work. Pap., (17), doi:10.1787/5kmfwjvc83vk-en. 16
Maskus, K. E., and J. H. Reichman, 2017: The globalization of private knowledge goods and the 17
privatization of global public goods. In: Globalization and Intellectual Property, Vol. 7 of, 18
Routledge, London, pp. 335–377. 19
Maskus, K. E., S. Milani, and R. Neumann, 2019: The impact of patent protection and financial 20
development on industrial R&D. Res. Policy, 48(1), 355–370, doi:10.1016/j.respol.2018.09.005. 21
Mastropietro, P., C. Batlle, L. A. Barroso, and P. Rodilla, 2014: Electricity auctions in South America: 22
Towards convergence of system adequacy and RES-E support. Renew. Sustain. Energy Rev., 40, 23
375–385, doi:10.1016/j.rser.2014.07.074. 24
Masuku, B., and O. Nzewi, 2021: The South African informal sector’s socio-economic exclusion from 25
basic service provisions: A critique of Buffalo City Metropolitan Municipality’s approach to the 26
informal sector. J. Energy South. Africa, 32(2), 59–71, doi:10.17159/2413-27
3051/2021/v32i2a5856. 28
Matsuo, T., and T. S. Schmidt, 2019: Managing tradeoffs in green industrial policies: The role of 29
renewable energy policy design. World Dev., 122, 11–26, doi:10.1016/j.worlddev.2019.05.005. 30
Matthess, M., and S. Kunkel, 2020: Structural change and digitalization in developing countries: 31
Conceptually linking the two transformations. Technol. Soc., 63, 101428, 32
doi:https://doi.org/10.1016/j.techsoc.2020.101428. 33
May, P., 2019: Valuing externalities of cattle and soy-maize systems in the Brazilian amazon: A Test 34
of the TEEBAgriFood Framework. TEEB Agric.,. 35
Mayer, J., 2001: Technology Diffusion, Human Capital and Economic Growth in Developing Countries. 36
47 pp. https://unctad.org/system/files/official-document/dp_154.en.pdf. 37
Mayer, T., D. Kreyenberg, J. Wind, and F. Braun, 2012: Feasibility study of 2020 target costs for PEM 38
fuel cells and lithium-ion batteries: A two-factor experience curve approach. Int. J. Hydrogen 39
Energy, 37(19), 14463–14474, doi:10.1016/j.ijhydene.2012.07.022. 40
Mazhar, and Ummad, 2014: Environmental Regulation and the Informal Sector: Empirical Evidence - 41
Legislazione ambientale ed economia sommersa: evidenze empiriche. Econ. Internazionale / Int. 42
Econ., 67(4), 471–491. 43
Mazzucato, M., 2013: The Entrepreneurial State. Anthem Press, London, 288 pp. 44
Mazzucato, M., 2015a: 6. Innovation, the State and Patient Capital. Polit. Q., 86, 98–118, 45
doi:10.1111/1467-923X.12235. 46
ACCEPTED VERSION
SUBJECT TO FIN
AL EDITS
Final Government Draft Chapter 16 IPCC AR6 WGIII
Do Not Cite, Quote or Distribute 16-121 Total pages: 141
Mazzucato, M., 2015b: The entrepreneurial state. Anthem Press, London,. 1
Mazzucato, M., 2016: From market fixing to market-creating: a new framework for innovation policy. 2
Ind. Innov., 23(2), 140–156, doi:10.1080/13662716.2016.1146124. 3
Mazzucato, M., 2018: Mission-Oriented Research & Innovation in the European Union: A problem-4
solving approach to fuel innovation-led growth. [Directorate-General for Research and Innovation 5
Directorate A – Policy Development and Coordination, (ed.)]. European Union, Brussels, 36 pp. 6
Mazzucato, M., and G. Semieniuk, 2017: Public financing of innovation: new questions. Oxford Rev. 7
Econ. Policy, 33(1), 24–48, doi:10.1093/oxrep/grw036. 8
Mazzucato, M., and G. Semieniuk, 2018: Financing renewable energy: Who is financing what and why 9
it matters. Technol. Forecast. Soc. Change, 127, 8–22, doi:10.1016/j.techfore.2017.05.021. 10
McCauley, D., and R. Heffron, 2018: Just transition: Integrating climate, energy and environmental 11
justice. Energy Policy, 119, 1–7, doi:10.1016/j.enpol.2018.04.014. 12
McCauley, D. et al., 2019: Energy justice in the transition to low carbon energy systems: Exploring key 13
themes in interdisciplinary research. Appl. Energy, 233–234, 916–921, 14
doi:10.1016/j.apenergy.2018.10.005. 15
McDonald, A., and L. Schrattenholzer, 2001: Learning rates for energy technologies. Energy Policy, 16
29(4), 255–261, doi:10.1016/S0301-4215(00)00122-1. 17
McGee, J., and J. Wenta, 2014: Technology Transfer Institutions in Global Climate Governance: The 18
Tension between Equity Principles and Market Allocation. Rev. Eur. Comp. Int. Environ. Law, 19
23(3), 367–381, doi:10.1111/reel.12075. 20
McNeil, M. A., M. Iyer, S. Meyers, V. E. Letschert, and J. E. McMahon, 2008: Potential benefits from 21
improved energy efficiency of key electrical products: The case of India. Energy Policy, 36(9), 22
3467–3476, doi:10.1016/j.enpol.2008.05.020. 23
McNerney, J., J. Doyne Farmer, and J. E. Trancik, 2011: Historical costs of coal-fired electricity and 24
implications for the future. Energy Policy, 39(6), 3042–3054, doi:10.1016/j.enpol.2011.01.037. 25
Meckling, J., 2019: A New Path for U.S. Climate Politics: Choosing Policies That Mobilize Business 26
for Decarbonization. Ann. Am. Acad. Pol. Soc. Sci., 685(1), 82–95, 27
doi:10.1177/0002716219862515. 28
Meckling, J., and J. Nahm, 2019: The politics of technology bans: Industrial policy competition and 29
green goals for the auto industry. Energy Policy, 126, 470–479, doi:10.1016/j.enpol.2018.11.031. 30
Meckling, J., N. Kelsey, E. Biber, and J. Zysman, 2015a: Winning coalitions for climate policy. Science 31
(80-. )., 349(6253), 1170–1171, doi:10.1126/science.aab1336. 32
Meckling, J., N. Kelsey, E. Biber, and J. Zysman, 2015b: Winning Coalitions for Climate Policy How 33
Industrial Policy Builds Support for Carbon Regulation. Science (80-. ).,. 34
Meckling, J., T. Sterner, and G. Wagner, 2017: Policy sequencing toward decarbonization. Nat. Energy, 35
2(12), 918–922, doi:10.1038/s41560-017-0025-8. 36
Meckling, J. O., and G. Y. Chung, 2009: Sectoral approaches for a post-2012 climate regime: a 37
taxonomy. Clim. Policy, 9(6), 652–668, doi:10.3763/cpol.2009.0629. 38
Melissen, F., and H. Reinders, 2012: A reflection on the Dutch Sustainable Public Procurement 39
Programme. J. Integr. Environ. Sci., 9(1), 27–36, doi:10.1080/1943815X.2012.658815. 40
Mendonça, H. L., T. D. L. van Aduard de Macedo-Soares, and M. V. de A. Fonseca, 2018: Working 41
towards a framework based on mission-oriented practices for assessing renewable energy 42
innovation policies. J. Clean. Prod., 193, 709–719, doi:10.1016/j.jclepro.2018.05.064. 43
Meng, J., R. Way, E. Verdolini, L. Diaz Anadon, and L. Anadon, 2021: Comparing expert elicitation 44
and model-based probabilistic technology cost forecasts for the energy transition. Proc. Natl. 45
Acad. Sci., 118(27), e1917165118, doi:10.1073/pnas.1917165118. 46
ACCEPTED VERSION
SUBJECT TO FIN
AL EDITS
Final Government Draft Chapter 16 IPCC AR6 WGIII
Do Not Cite, Quote or Distribute 16-122 Total pages: 141
Mercure, J.-F. et al., 2018: Macroeconomic impact of stranded fossil fuel assets. Nat. Clim. Chang., 1
8(7), 588–593, doi:10.1038/s41558-018-0182-1. 2
Mercure, J. F. et al., 2016: Policy-induced energy technological innovation and finance for low-carbon 3
economic growth: Deliverable D2 study on the macroeconomics of energy and climate policies. 4
European Union, 78 pp. 5
Mian, A., L. Straub, and A. Sufi, 2020: Indebted Demand. National Bureau of Economic Research, 6
Cambridge, MA, 70 pp. 7
Michaelowa, A., I. Shishlov, and D. Brescia, 2019: Evolution of international carbon markets: lessons 8
for the Paris Agreement. Wiley Interdiscip. Rev. Clim. Chang., 10(6), doi:10.1002/wcc.613. 9
Mignon, I., and A. Bergek, 2016: System-and actor-level challenges for diffusion of renewable 10
electricity technologies: an international comparison. J. Clean. Prod., 128, 105–115. 11
Milojevic-Dupont, N., and F. Creutzig, 2021: Machine learning for geographically differentiated 12
climate change mitigation in urban areas. Sustain. Cities Soc., 64, 102526, 13
doi:10.1016/j.scs.2020.102526. 14
Miremadi, I., Y. Saboohi, and S. Jacobsson, 2018: Assessing the performance of energy innovation 15
systems: Towards an established set of indicators. Energy Res. Soc. Sci., 40, 159–176, 16
doi:10.1016/j.erss.2018.01.002. 17
Mission Innovation, 2019: COLLABORATIVE MODELS FOR INTERNATIONAL CO-OPERATION IN 18
CLEAN-ENERGY RESEARCH AND INNOVATION. 19
Mitcham, C., 2003: Co-responsibility for research integrity. Sci. Eng. Ethics, 9(2), 273–290, 20
doi:10.1007/s11948-003-0014-0. 21
Mockshell, J., and M. E. J. Villarino, 2019: Agroecological Intensification: Potential and Limitations 22
to Achieving Food Security and Sustainability. In: Encyclopedia of Food Security and 23
Sustainability, Elsevier, pp. 64–70. 24
Mohammadi, A., B. Khoshnevisan, G. Venkatesh, and S. Eskandari, 2020: A critical review on 25
advancement and challenges of biochar application in Paddy fields: Environmental and life cycle 26
cost analysis. Processes, , doi:10.3390/pr8101275. 27
Moldalieva, J., and J. Heathershaw, 2020: Playing the “Game” of Transparency and Accountability: 28
Non-elite Politics in Kyrgyzstan’s Natural Resource Governance. Post-Soviet Aff., 36(2), 171–29
187, doi:10.1080/1060586X.2020.1721213. 30
Moon, S. G., S. Bae, and M.-G. G. Jeong, 2014: Corporate Sustainability and Economic Performance: 31
an Empirical Analysis of a Voluntary Environmental Program in the USA. Bus. Strateg. Environ., 32
23(8), 534–546, doi:10.1002/bse.1800. 33
Mormina, M., 2019: Science, Technology and Innovation as Social Goods for Development: Rethinking 34
Research Capacity Building from Sen’s Capabilities Approach. Sci. Eng. Ethics, 25(3), 671–692, 35
doi:10.1007/s11948-018-0037-1. 36
Mowery, D., and N. Rosenberg, 1979: The influence of market demand upon innovation: a critical 37
review of some recent empirical studies. Res. Policy, 8(2), 102–153, doi:10.1016/0048-38
7333(79)90019-2. 39
Mukherjee, P. K., E. Gibbs, A. Walia, and C. Taylor, 2020: Staying cool: The development of India’s 40
pioneering energy efficiency policy for chillers. WIREs Energy Environ., 9(4), 41
doi:10.1002/wene.372. 42
Mulgan, G., 2012: The Theoretical Foundations of Social Innovation. In: Social Innovation [Nicholls, 43
A. and A. Murdock, (eds.)], Palgrave Macmillan UK, London, pp. 33–65. 44
Munene, M. B., Å. G. Swartling, and F. Thomalla, 2018: Adaptive governance as a catalyst for 45
transforming the relationship between development and disaster risk through the Sendai 46
Framework? Int. J. Disaster Risk Reduct., 28, 653–663, doi:10.1016/j.ijdrr.2018.01.021. 47
ACCEPTED VERSION
SUBJECT TO FIN
AL EDITS

Final Government Draft Chapter 16 IPCC AR6 WGIII
Do Not Cite, Quote or Distribute 16-123 Total pages: 141
Murphy, K., G. A. Kirkman, S. Seres, and E. Haites, 2015: Technology transfer in the CDM: an updated 1
analysis. Clim. Policy, 15(1), 127–145, doi:10.1080/14693062.2013.812719. 2
Murphy, L. M., and P. L. Edwards, 2003: Bridging the Valley of Death: Transitioning from Public to 3
Private Sector Financing. , Golden, CO, 58 pp. 4
Myslikova, Z., and K. S. Gallagher, 2020: Mission Innovation is mission critical. Nat. Energy, 5(10), 5
732–734, doi:10.1038/s41560-020-00694-5. 6
Nagy, B., J. D. Farmer, Q. M. Bui, and J. E. Trancik, 2013: Statistical Basis for Predicting Technological 7
Progress. PLoS One, 8(2), e52669, doi:10.1371/journal.pone.0052669. 8
Nahm, J., and E. S. Steinfeld, 2014: Scale-up Nation: China’s Specialization in Innovative 9
Manufacturing. World Dev., , doi:10.1016/j.worlddev.2013.09.003. 10
Nanda, R., K. Younge, and L. Fleming, 2016: Economic Value Creation in Mobile Applications. In: 11
The Changing Frontier [Jaffe, A.B. and B.F. Jones, (eds.)], University of Chicago Press, pp. 233–12
286. 13
Napp, T. et al., 2017: Exploring the Feasibility of Low-Carbon Scenarios Using Historical Energy 14
Transitions Analysis. Energies, 10(1), 116, doi:10.3390/en10010116. 15
Narayanamurti, V., and T. Odumosu, 2016: Cycles of Invention and Discovery: rethinking the endless 16
frontier. [Narayanamurti, V. and T. Odumosu, (eds.)]. Harvard University Press, Cambridge, MA, 17
USA, 176 pp. 18
Narayanamurti, V., L. D. Anadon, and A. D. Sagar, 2009: Transforming Energy Innovation. Issues Sci. 19
Technol., XXIV(1), doi:https://issues.org/narayanamurti/. 20
Narita, D., and U. J. Wagner, 2017: Strategic uncertainty, indeterminacy, and the formation of 21
international environmental agreements. Oxf. Econ. Pap., 69(2), 432–452, 22
doi:10.1093/oep/gpx001. 23
National Science Board, 2018: Research and Development - Research Trends and Comparisons. , 24
United States, 108 pp. https://www.nsf.gov/statistics/2018/nsb20181/assets/1038/research-and-25
development-u-s-trends-and-international-comparisons.pdf. 26
Nawaz, A. et al., 2020: An Intelligent Integrated Approach for Efficient Demand Side Management 27
With Forecaster and Advanced Metering Infrastructure Frameworks in Smart Grid. IEEE Access, 28
8, 132551–132581, doi:10.1109/ACCESS.2020.3007095. 29
Negro, S. O., F. Alkemade, and M. P. Hekkert, 2012: Why does renewable energy diffuse so slowly? 30
A review of innovation system problems. Renew. Sustain. Energy Rev., 16(6), 3836–3846, 31
doi:10.1016/j.rser.2012.03.043. 32
Neij, L., and K. Åstrand, 2006: Outcome indicators for the evaluation of energy policy instruments and 33
technical change. Energy Policy, 34(17), 2662–2676, doi:10.1016/j.enpol.2005.03.012. 34
Nelson, R., 1993: National Innovation Systems: A Comparative Analysis. Oxford University Press, 552 35
pp. 36
Nelson, R., and E. Phelps, 1966: Investment in Humans, Technology Diffusion and Economic Growth. 37
Am. Econ. Rev., 56(1/2), 69–75. 38
Nelson, R., and R. Mazzoleni, 1996: Economic Theories About the Costs and Benefits of Patents. In: 39
National Research Council, Intellectual Property Rights and Research Tools in Molecular 40
Biology [National Research Council, (ed.)], The National Academies Press, Washington D.C, pp. 41
17–27. 42
Nemet, G. F., 2006: Beyond the learning curve: factors influencing cost reductions in photovoltaics. 43
Energy Policy, 34(17), 3218–3232, doi:10.1016/j.enpol.2005.06.020. 44
Nemet, G. F., 2009a: Interim monitoring of cost dynamics for publicly supported energy technologies. 45
Energy Policy, 37(3), 825–835, doi:10.1016/j.enpol.2008.10.031. 46
ACCEPTED VERSION
SUBJECT TO FIN
AL EDITS

Final Government Draft Chapter 16 IPCC AR6 WGIII
Do Not Cite, Quote or Distribute 16-124 Total pages: 141
Nemet, G. F., 2009b: Demand-pull, technology-push, and government-led incentives for non-1
incremental technical change. Res. Policy, 38(5), 700–709, doi:10.1016/j.respol.2009.01.004. 2
Nemet, G. F., 2010: Robust incentives and the design of a climate change governance regime. Energy 3
Policy, 38(11), 7216–7225, doi:10.1016/j.enpol.2010.07.052. 4
Nemet, G. F., 2012: Inter-technology knowledge spillovers for energy technologies. Energy Econ., , 5
doi:10.1016/j.eneco.2012.06.002. 6
Nemet, G. F., 2013: Technological change and climate change policy. In: Encyclopedia of Energy, 7
Natural Resource and Environmental Economics [Shogren, J., (ed.)], Elsevier, Amsterdam, pp. 8
107–116. 9
Nemet, G. F., 2019a: How solar became cheap. Routledge, London and New York, 14–18 pp. 10
Nemet, G. F., 2019b: How Solar Energy Became Cheap. Routledge, Abingdon, Oxon; New York, NY : 11
Routledge, 2019.,. 12
Nemet, G. F., P. Braden, and E. Cubero, 2013: Credibility, ambition, and discretion in long-term U.S. 13
energy policy targets from 1973 to 2011. University of Wisconsin-Madison La Follette School of 14
Public Affairs, Working Paper 2013-007, Madison, WI,. 15
Nemet, G. F., M. Jakob, J. C. Steckel, and O. Edenhofer, 2017: Addressing policy credibility problems 16
for low-carbon investment. Glob. Environ. Chang., 42, 47–57, 17
doi:10.1016/j.gloenvcha.2016.12.004. 18
Nemet, G. F., V. Zipperer, and M. Kraus, 2018: The valley of death, the technology pork barrel, and 19
public support for large demonstration projects. Energy Policy, 119, 154–167, 20
doi:10.1016/j.enpol.2018.04.008. 21
Nemet, G. G. F., 2019c: How solar became cheap: A model for low-carbon innovation. Earthscan 22
Routledge, New York City, USA, 223 pp. 23
Newell, P., and D. Mulvaney, 2013: The political economy of the ‘just transition.’ Geogr. J., 179(2), 24
132–140, doi:10.1111/geoj.12008. 25
Newell, P., and A. Simms, 2020: How Did We Do That? Histories and Political Economies of Rapid 26
and Just Transitions. New Polit. Econ., , 1–16, doi:10.1080/13563467.2020.1810216. 27
Newell, R. G., A. B. Jaffe, and R. N. Stavins, 1999: The Induced Innovation Hypothesis and Energy-28
Saving Technological Change. Q. J. Econ., 114(3), 941–975, doi:10.1162/003355399556188. 29
Newman, C., J. Rand, T. Talbot, and F. Tarp, 2015: Technology transfers, foreign investment and 30
productivity spillovers. Eur. Econ. Rev., 76, 168–187, doi:10.1016/j.euroecorev.2015.02.005. 31
Nicholls, C. I., and A. Alteri, 2013: Agroecología y Cambio Climático Metodologías para evaluar la 32
resiliencia socio-ecológica en comunidades rurales. , 99. 33
Nicholls, C. I., and M. A. Altieri, 2018: Pathways for the amplification of agroecology. Agroecol. 34
Sustain. Food Syst., 42(10), 1170–1193, doi:10.1080/21683565.2018.1499578. 35
Nikas, A. et al., 2017: Managing stakeholder knowledge for the evaluation of innovation systems in the 36
face of climate change. J. Knowl. Manag., 21(5), 1013–1034, doi:10.1108/JKM-01-2017-0006. 37
Nikas, A., H. Doukas, and L. Martínez López, 2018: A group decision making tool for assessing climate 38
policy risks against multiple criteria. Heliyon, 4(3), e00588, doi:10.1016/j.heliyon.2018.e00588. 39
Nikas, A., H. Neofytou, A. Karamaneas, K. Koasidis, and J. Psarras, 2020: Sustainable and socially just 40
transition to a post-lignite era in Greece: a multi-level perspective. 41
https://doi.org/10.1080/15567249.2020.1769773, 15(10–12), 513–544, 42
doi:10.1080/15567249.2020.1769773. 43
Nilsson, M., D. Griggs, and M. Visbeck, 2016: Policy: Map the interactions between Sustainable 44
Development Goals. Nature, 534(7607), 320–322, doi:10.1038/534320a. 45
ACCEPTED VERSION
SUBJECT TO FIN
AL EDITS

Final Government Draft Chapter 16 IPCC AR6 WGIII
Do Not Cite, Quote or Distribute 16-125 Total pages: 141
Noailly, J., 2012: Improving the energy efficiency of buildings: The impact of environmental policy on 1
technological innovation. Energy Econ., 34(3), 795–806, doi:10.1016/j.eneco.2011.07.015. 2
Noailly, J., and R. Smeets, 2015: Directing technical change from fossil-fuel to renewable energy 3
innovation: An application using firm-level patent data. J. Environ. Econ. Manage., 72, 15–37, 4
doi:10.1016/j.jeem.2015.03.004. 5
Nordhaus, W., 2011: Designing a friendly space for technological change to slow global warming. 6
Energy Econ., 33(4), 665–673, doi:10.1016/j.eneco.2010.08.005. 7
Nordhaus, W. D., 2014: The Perils of the Learning Model for Modeling Endogenous Technological 8
Change. Energy J., 35(1), doi:10.5547/01956574.35.1.1. 9
North, D. C., 1991: Institutions. J. Econ. Perspect., 5(1), 97–112. 10
Nygaard, I., and U. E. Hansen, 2015: The conceptual and practical challenges to technology 11
categorisation in the preparation of technology needs assessments. Clim. Change, 131(3), 371–12
385, doi:10.1007/s10584-015-1367-5. 13
NYSERDA, 2020: Innovation & Research Demonstration Project Impact Evaluation. , Albany, NY, 14
https://www.nyserda.ny.gov/-/media/Files/Publications/PPSER/Program-Evaluation/2020-15
Innovation-Research-Impact-Evaluation-Final-Report.pdf. 16
Obama, B., 2017: The irreversible momentum of clean energy. Science (80-. )., 355(6321), 126–129, 17
doi:10.1126/science.aam6284. 18
Oberthür, S., G. Khandekar, and T. Wyns, 2021: Global governance for the decarbonization of energy-19
intensive industries: Great potential underexploited. Earth Syst. Gov., 8, 100072, 20
doi:10.1016/j.esg.2020.100072. 21
Ockwell, D., and R. Byrne, 2016: Improving technology transfer through national systems of 22
innovation: climate relevant innovation-system builders (CRIBs). Clim. Policy, 16(7), 836–854, 23
doi:10.1080/14693062.2015.1052958. 24
Ockwell, D., A. Sagar, and H. de Coninck, 2015: Collaborative research and development (R&D) for 25
climate technology transfer and uptake in developing countries: towards a needs driven approach. 26
Clim. Change, 131(3), 401–415, doi:10.1007/s10584-014-1123-2. 27
Ockwell, D., R. Byrne, U. E. Hansen, J. Haselip, and I. Nygaard, 2018: The uptake and diffusion of 28
solar power in Africa: Socio-cultural and political insights on a rapidly emerging socio-technical 29
transition. Energy Res. Soc. Sci., 44, 122–129, doi:10.1016/j.erss.2018.04.033. 30
Ockwell, D. G., and A. Mallett, 2012: Low-carbon technology transfer. [Ockwell, D.G. and A. Mallett, 31
(eds.)]. Routledge, London; New York NY, 403 pp. 32
OECD, 2006: Innovation in energy technology: Comparing national innovation systems at sectoral 33
level. , Paris,. 34
OECD, 2011a: Tools for delivering green growth. , Paris, France, 35
https://www.oecd.org/greengrowth/48012326.pdf. 36
OECD, 2011b: Industrial Biotechnology and Climate Change: Opportunities and Challenges. , Paris, 37
http://www.oecd.org/science/emerging-tech/49024032.pdf. 38
OECD, 2015a: Frascati Manual 2015: Guidelines for Collecting and Reporting Data on Research and 39
Experimental Development. OECD, Paris, France, 400 pp. 40
OECD, 2015b: Frascati Manual 2015: Guidelines for Collecting and Reporting Data on Research and 41
Experimental Development. OECD, Paris, 400 pp. 42
OECD, 2015c: Green Investment Banks. 1–20 pp. 43
OECD, 2017: OECD Digital Economy Outlook 2017. OECD, Paris,. 44
OECD, 2020: The effects of R&D tax incentives and their role in the innovation policy mix. , Paris, 45
ACCEPTED VERSION
SUBJECT TO FIN
AL EDITS

Final Government Draft Chapter 16 IPCC AR6 WGIII
Do Not Cite, Quote or Distribute 16-126 Total pages: 141
France, 96 pp. 1
OECD, and ITF, 2020: Good to go? Assessing the environmental performance of new mobility. 87 pp. 2
https://www.itf-oecd.org/sites/default/files/docs/environmental-performance-new-mobility.pdf. 3
Oh, C., 2020: Contestations over the financial linkages between the UNFCCC’s Technology and 4
Financial Mechanism: using the lens of institutional interaction. Int. Environ. Agreements Polit. 5
Law Econ., 20(3), 559–575, doi:10.1007/s10784-020-09474-8. 6
Ohl, R. S., 1941: Light-sensitive electric device. United States Pat. Off. 2402662,. 7
Ohl, R. S., 1946: Light-sensitive electric device. United States Pat. Off. 2402662, , 1–14. 8
Olawuyi, D. S., 2018: From technology transfer to technology absorption: addressing climate 9
technology gaps in Africa. J. Energy Nat. Resour. Law, 36(1), 61–84, 10
doi:10.1080/02646811.2017.1379667. 11
Oldenziel, R., M. Emanuel, A. A. Albert de la Bruheze, and F. Veraart, 2016: Cycling Cities: The 12
European Experience: Hundred Years of Policy and Practice. Foundation for the History of 13
Technology,. 14
Olson, M., 1982: The Rise and Decline of Nations: Economic Growth, Stagflation and Social Rigidities. 15
Yale University Press,. 16
Olsson, O., and B. S. Frey, 2002: Entrepreneurship as recombinant growth. Small Bus. Econ., 19, 69–17
80, doi:10.1023/A:1016261420372. 18
Ordonez, J. A., M. Jakob, J. C. Steckel, and A. Fünfgeld, 2021: Coal, power and coal-powered politics 19
in Indonesia. Environ. Sci. Policy, 123, 44–57, doi:10.1016/j.envsci.2021.05.007. 20
Osongo, E., and J. Schot, 2017: Inclusive Innovation and Rapid Sociotechnical Transitions: The Case 21
of Mobile Money in Kenya. SPRU Work. Pap. Ser., March. 22
Ostrom, E., 2010: Beyond Markets and States: Polycentric Governance of Complex Economic Systems. 23
Am. Econ. Rev., 100(3), 641–672, doi:10.1257/aer.100.3.641. 24
Otto, I. M. et al., 2020a: Social tipping dynamics for stabilizing Earth’s climate by 2050. Proc. Natl. 25
Acad. Sci., 117(5), 2354–2365, doi:10.1073/pnas.1900577117. 26
Otto, I. M. et al., 2020b: Social tipping dynamics for stabilizing Earth{\textquoteright}s climate by 27
2050. Proc. Natl. Acad. Sci., 117(5), 2354–2365, doi:10.1073/pnas.1900577117. 28
Pandey, N., H. de Coninck, and A. D. Sagar, 2021: Beyond technology transfer: Innovation cooperation 29
to advance sustainable development in developing countries. WIREs Energy Environ., , 30
doi:10.1002/wene.422. 31
Parida, V., D. Sjödin, and W. Reim, 2019: Reviewing Literature on Digitalization, Business Model 32
Innovation, and Sustainable Industry: Past Achievements and Future Promises. Sustainability, 33
11(2), 391, doi:10.3390/su11020391. 34
Paroussos, L., F. Panagiotis, V. Zoi, and F. Kostas, 2017: A technical case study on R&D and 35
technology spillovers of clean energy technologies. , European Union, 87 pp. 36
https://ec.europa.eu/energy/sites/ener/files/documents/case_study_3_technical_analysis_spillove37
rs.pdf. 38
Paroussos, L., K. Fragkiadakis, and P. Fragkos, 2020: Macro-economic analysis of green growth 39
policies: the role of finance and technical progress in Italian green growth. Clim. Change, 160(4), 40
591–608, doi:10.1007/s10584-019-02543-1. 41
Pascual, U. et al., 2017: Valuing nature’s contributions to people: the IPBES approach. Curr. Opin. 42
Environ. Sustain., 26–27, 7–16, doi:10.1016/j.cosust.2016.12.006. 43
Patt, A., 2015: Transforming energy: solving climate change with technology policy. Cambridge 44
University Press, New York,. 45
ACCEPTED VERSION
SUBJECT TO FIN
AL EDITS
Final Government Draft Chapter 16 IPCC AR6 WGIII
Do Not Cite, Quote or Distribute 16-127 Total pages: 141
Patt, A., and J. Lilliestam, 2018: The Case against Carbon Prices. Joule, 2(12), 1
doi:10.1016/j.joule.2018.11.018. 2
Patt, A., D. Aplyn, P. Weyrich, and O. van Vliet, 2019: Availability of private charging infrastructure 3
influences readiness to buy electric cars. Transp. Res. Part A Policy Pract., 125, 1–7, 4
doi:10.1016/J.TRA.2019.05.004. 5
Pearson, P. J. G., and T. J. Foxon, 2012: A low carbon industrial revolution? Insights and challenges 6
from past technological and economic transformations. Energy Policy, 50, 117–127, 7
doi:10.1016/J.ENPOL.2012.07.061. 8
Pegels, A., and T. Altenburg, 2020: Latecomer development in a “greening” world: Introduction to the 9
Special Issue. World Dev., 135, 105084, doi:10.1016/j.worlddev.2020.105084. 10
Pellicer-Sifres, V., S. Belda-Miquel, I. Cuesta-Fernandez, and A. Boni, 2018: Learning, transformative 11
action, and grassroots innovation: Insights from the Spanish energy cooperative Som Energia. 12
Energy Res. Soc. Sci., 42, 100–111, doi:10.1016/J.ERSS.2018.03.001. 13
Peñasco, C., L. D. Anadón, and E. Verdolini, 2021: Systematic review of the outcomes and trade-offs 14
of ten types of decarbonization policy instruments. Nat. Clim. Chang., 11(3), 274–274, 15
doi:10.1038/s41558-021-00992-0. 16
Peng, Y., and X. Bai, 2018: Experimenting towards a low-carbon city: Policy evolution and nested 17
structure of innovation. J. Clean. Prod., 174, 201–212, doi:10.1016/J.JCLEPRO.2017.10.116. 18
Peng, Y., Y. Wei, and X. Bai, 2019: Scaling urban sustainability experiments: Contextualization as an 19
innovation. J. Clean. Prod., 227, 302–312, doi:10.1016/J.JCLEPRO.2019.04.061. 20
Pengue, W. et al., 2018: ‘Eco-agri-food systems’: today’s realities and tomorrow’s challenges. In: TEEB 21
for Agriculture & Food: Scientific and Economic Foundations, UN Environment, Geneva, pp. 22
57–109. 23
Pereirinha, P. G. et al., 2018: Main Trends and Challenges in Road Transportation Electrification. 24
Transp. Res. Procedia, 33, 235–242, doi:10.1016/j.trpro.2018.10.096. 25
Persoon, P. G. J., R. N. A. Bekkers, and F. Alkemade, 2020: The science base of renewables. Technol. 26
Forecast. Soc. Change, 158, 120121, doi:10.1016/j.techfore.2020.120121. 27
PIANOo Expertisecentrum, 2020: Biobased Inkopen. Dutch Minist. Econ. Aff. Clim. Policy,. 28
https://www.pianoo.nl/nl. 29
Pless, J., 2019: Are “Complementary Policies” Substitutes? Evidence from R&D Subsidies 30
in the UK. SSRN Electron. J., , 57, doi:10.2139/ssrn.3379256. 31
Popp, D., 2002: Induced Innovation and Energy Prices. Am. Econ. Rev., 92(1), 160–180, 32
doi:10.1257/000282802760015658. 33
Popp, D., 2004: ENTICE: endogenous technological change in the DICE model of global warming. J. 34
Environ. Econ. Manage., 48(1), 742–768, doi:10.1016/j.jeem.2003.09.002. 35
Popp, D., 2010: Innovation and climate policy. Annu. Rev. Resour. Econ., , 36
doi:10.1146/annurev.resource.012809.103929. 37
Popp, D., 2011: International Technology Transfer, Climate Change, and the Clean Development 38
Mechanism. Rev. Environ. Econ. Policy, 5(1), 131–152, doi:10.1093/reep/req018. 39
Popp, D., 2019: Environmental Policy and Innovation: A Decade of Research. Int. Rev. Environ. 40
Resour. Econ., 13(3–4), 265–337, doi:10.1561/101.00000111. 41
Popp, D., and R. Newell, 2012: Where does energy R&D come from? Examining crowding out from 42
energy R&D. Energy Econ., 34(4), 980–991, doi:10.1016/j.eneco.2011.07.001. 43
Porter, M., and C. Van der Linde, 1995: Green and competitive: ending the stalemate. Dyn. eco-efficient 44
Econ. Environ. Regul. Compet. Advant., 33. 45
ACCEPTED VERSION
SUBJECT TO FIN
AL EDITS

Final Government Draft Chapter 16 IPCC AR6 WGIII
Do Not Cite, Quote or Distribute 16-128 Total pages: 141
Pörtner, H. O. et al., 2021: Scientific outcome of the IPBES-IPCC co-sponsored workshop on 1
biodiversity and climate change. , Bonn, Germany,. 2
Pretty, J., C. Toulmin, and S. Williams, 2011: Sustainable intensification in African agriculture. Int. J. 3
Agric. Sustain., , doi:10.3763/ijas.2010.0583. 4
Probst, B., V. Anatolitis, A. Kontoleon, and L. D. Anadón, 2020: The short-term costs of local content 5
requirements in the Indian solar auctions. Nat. Energy, 5(11), 842–850, doi:10.1038/s41560-020-6
0677-7. 7
Probst, B., L. Westermann, L. D. Anadón, and A. Kontoleon, 2021: Leveraging private investment to 8
expand renewable power generation: Evidence on financial additionality and productivity gains 9
from Uganda. World Dev., 140, 105347, doi:10.1016/j.worlddev.2020.105347. 10
Qiu, Y., and L. D. Anadon, 2012: The price of wind power in China during its expansion: Technology 11
adoption, learning-by-doing, economies of scale, and manufacturing localization. Energy Econ., 12
34(3), 772–785, doi:10.1016/j.eneco.2011.06.008. 13
Quirapas, M. A. J. R., and A. Taeihagh, 2020: Ocean renewable energy development in Southeast Asia: 14
Opportunities, risks and unintended consequences. Renew. Sustain. Energy Rev., , 110403, 15
doi:10.1016/j.rser.2020.110403. 16
Quitzow, R., 2015: Dynamics of a policy-driven market: The co-evolution of technological innovation 17
systems for solar photovoltaics in China and Germany. Environ. Innov. Soc. Transitions, 17, 126–18
148, doi:10.1016/j.eist.2014.12.002. 19
Rahwan, I. et al., 2019: Machine behaviour. Nature, 568(7753), 477–486, doi:10.1038/s41586-019-20
1138-y. 21
Ramos-Mejía, M., M.-L. Franco-Garcia, and J. M. Jauregui-Becker, 2018: Sustainability transitions in 22
the developing world: Challenges of socio-technical transformations unfolding in contexts of 23
poverty. Environ. Sci. Policy, 84, 217–223, doi:10.1016/j.envsci.2017.03.010. 24
Ravetz, J., and S. Funtowicz, 1999: Editorial. Futures, 31(7), 641–646, 25
doi:https://doi.org/10.1016/S0016-3287(99)00023-3. 26
Reder, M. W., and J. R. Hicks, 1965: The Theory of Wages. Economica, 32(125), 88, 27
doi:10.2307/2552450. 28
Reichman, J., 2009: Compulsory Licensing of Patented Pharmaceutical Inventions: Evaluating the 29
Options. J. Law, Med. Ethics, 37(2), 247–263. 30
Reitzig, M., J. Henkel, and C. Heath, 2007: On sharks, trolls, and their patent prey—Unrealistic damage 31
awards and firms’ strategies of “being infringed.” Res. Policy, 36(1), 134–154, 32
doi:10.1016/j.respol.2006.10.003. 33
Remer, D. S., and F. B. Mattos, 2003: Cost and scale-up factors, international inflation indexes and 34
location factors. Int. J. Prod. Econ., 84(1), 1–16, doi:10.1016/S0925-5273(02)00374-2. 35
Repo, P., and K. Matschoss, 2019: Social Innovation for Sustainability Challenges. Sustainability, 36
12(1), 319, doi:10.3390/su12010319. 37
RESA, 2001: Act on Granting Priority to Renewable Energy Sources (Renewable Energy Sources Act, 38
Germany, 2000). Sol. Energy, 70(6), 489–504, doi:10.1016/S0038-092X(00)00144-4. 39
Reynolds, S., M. Gabriel, and C. Heales, 2017: Social innovation policy in Europe: where next? 37 pp. 40
https://www.siceurope.eu/sites/default/files/field/attachment/social_innovation_policy_in_europ41
e_-_where_next.pdf (Accessed July 22, 2021). 42
Riahi, K. et al., 2017: The Shared Socioeconomic Pathways and their energy, land use, and greenhouse 43
gas emissions implications: An overview. Glob. Environ. Chang., 42, 153–168, 44
doi:10.1016/j.gloenvcha.2016.05.009. 45
Riekstin, A. C., S. James, A. Kansal, J. Liu, and E. Peterson, 2014: No More Electrical Infrastructure: 46
ACCEPTED VERSION
SUBJECT TO FIN
AL EDITS

Final Government Draft Chapter 16 IPCC AR6 WGIII
Do Not Cite, Quote or Distribute 16-129 Total pages: 141
Towards Fuel Cell Powered Data Centers. SIGOPS Oper. Syst. Rev., 48(1), 39–43, 1
doi:10.1145/2626401.2626410. 2
Rijke, J., M. Farrelly, R. Brown, and C. Zevenbergen, 2013: Configuring transformative governance to 3
enhance resilient urban water systems. Environ. Sci. Policy, 25, 62–72, 4
doi:10.1016/j.envsci.2012.09.012. 5
Rikap, C., 2020: Amazon: A story of accumulation through intellectual rentiership and predation. 6
Compet. Chang., June 2020, doi:10.1177/1024529420932418. 7
Rivera-Batiz, L. A., and P. M. Romer, 1991: Economic Integration and Endogenous Growth. Q. J. 8
Econ., 106(2), 531, doi:10.2307/2937946. 9
Roberts, C. et al., 2018: The politics of accelerating low-carbon transitions: Towards a new research 10
agenda. Energy Res. Soc. Sci., 44(February), 304–311, doi:10.1016/j.erss.2018.06.001. 11
Rogers, D., and V. Tsirkunov, 2010: Costs and benefits of Early Warning Systems. In: Global 12
Assessment Report on Disaster Risk Reduction, International Stragey for Disaster Reduction 13
(ISDR) - The World Bank, Geneva, pp. 1–17. 14
Rogers, E. M., 2003: Diffusion of innovations. 5th ed. Free Press, New York,. 15
Rogge, K. S., and K. Reichardt, 2016: Policy mixes for sustainability transitions: An extended concept 16
and framework for analysis. Res. Policy, 45(8), 1620–1635, doi:10.1016/j.respol.2016.04.004. 17
Rogge, K. S., F. Kern, and M. Howlett, 2017: Conceptual and empirical advances in analysing policy 18
mixes for energy transitions. Energy Res. Soc. Sci., 33, 1–10, doi:10.1016/j.erss.2017.09.025. 19
Rogge, K. S., B. Pfluger, and F. W. Geels, 2020: Transformative policy mixes in socio-technical 20
scenarios: The case of the low-carbon transition of the German electricity system (2010–2050). 21
Technol. Forecast. Soc. Change, 151, 119259, doi:10.1016/J.TECHFORE.2018.04.002. 22
Rolnick, D. et al., 2021: Tackling Climate Change with Machine Learning. ACM Cumput. Surv., 1(1), 23
95. 24
Romer, P. M., 1990: Endogenous Technological Change. J. Polit. Econ., 98(5, Part 2), S71–S102, 25
doi:10.1086/261725. 26
Rosenberg, N., 1998: Uncertainty and Technological Change. In: The Economic Impact of Knowledge 27
[Neef, D., G.. Siesfeld, and J. Cefola, (eds.)], Butterworth-Heinemann, Woburn, MA, pp. 17–34. 28
Rotz, S. et al., 2019: The Politics of Digital Agricultural Technologies: A Preliminary Review. Sociol. 29
Ruralis, 59(2), 203–229, doi:10.1111/SORU.12233. 30
Roy, J. et al., 2018: Sustainable Development , Poverty Eradication and Reducing Inequalities. In: 31
Global Warming of 1.5 °C an IPCC special report on the impacts of global warming of 1.5 °C 32
above pre-industrial levels and related global greenhouse gas emission pathways, in the context 33
of strengthening the global response to the threat of climate change. 34
Rubin, E. S., I. M. L. Azevedo, P. Jaramillo, and S. Yeh, 2015: A review of learning rates for electricity 35
supply technologies. Energy Policy, 86, 198–218, doi:10.1016/j.enpol.2015.06.011. 36
Rubio, S. J., 2017: Sharing R&D investments in breakthrough technologies to control climate change. 37
OXFORD Econ. Pap. Ser., 69(2, SI), 496–521, doi:10.1093/oep/gpw067. 38
Ruby, T. M., 2015: Innovation-enabling policy and regime transformation towards increased energy 39
efficiency: the case of the circulator pump industry in Europe. J. Clean. Prod., 103, 574–585, 40
doi:10.1016/j.jclepro.2015.02.017. 41
Rust, N. A. et al., 2020: How to transition to reduced-meat diets that benefit people and the planet. Sci. 42
Total Environ., 718, 137208, doi:10.1016/j.scitotenv.2020.137208. 43
Sachs, J. D. et al., 2019: Six Transformations to achieve the Sustainable Development Goals. Nat. 44
Sustain. 2019 29, 2(9), 805–814, doi:10.1038/s41893-019-0352-9. 45
ACCEPTED VERSION
SUBJECT TO FIN
AL EDITS

Final Government Draft Chapter 16 IPCC AR6 WGIII
Do Not Cite, Quote or Distribute 16-130 Total pages: 141
Sadras, V. O., 2020: Agricultural technology is unavoidable, directional, combinatory, disruptive, 1
unpredictable and has unintended consequences. Outlook Agric., 49(4), 293–297, 2
doi:10.1177/0030727020960493. 3
Safarzyńska, K., and J. C. J. M. van den Bergh, 2010: Evolutionary models in economics: a survey of 4
methods and building blocks. J. Evol. Econ., 20(3), 329–373, doi:10.1007/s00191-009-0153-9. 5
Sagar, A., 2009: Technology development and transfer to meet climate and developmental challenges. 6
Backgr. note UNDESA Backgr. Pap. Delhi High Lev. Conf. New Delhi, India, 22–23 Oct. 2009,. 7
Sagar, A., and A. Majumdar, 2014: Facilitating a sustainability transition in developing countries: 8
proposal for a global Advanced Research Project Agency for Sustainable Development. 30 pp. 9
https://sustainabledevelopment.un.org/content/documents/1498Sagar Majumdar.pdf. 10
Sagar, A. D., and J. P. Holdren, 2002: Assessing the global energy innovation system: some key issues. 11
Energy Policy, 30(6), 465–469, doi:10.1016/S0301-4215(01)00117-3. 12
Sagar, A. D., C. Bremner, and M. Grubb, 2009: Climate Innovation Centres: A partnership approach to 13
meeting energy and climate challenges. Nat. Resour. Forum, 33(4), 274–284, doi:10.1111/j.1477-14
8947.2009.001252.x. 15
Samadi, S., 2018: The experience curve theory and its application in the field of electricity generation 16
technologies – A literature review. Renew. Sustain. Energy Rev., 82, 2346–2364, 17
doi:10.1016/j.rser.2017.08.077. 18
Samuelson, P. A., 1965: A Theory of Induced Innovation along Kennedy-Weisacker Lines. Rev. Econ. 19
Stat., 47(4), 343, doi:10.2307/1927763. 20
Sanchez, D. L., and V. Sivaram, 2017: Saving innovative climate and energy research: Four 21
recommendations for Mission Innovation. Energy Res. Soc. Sci., 29, 123–126, 22
doi:10.1016/j.erss.2017.05.022. 23
Sanni, M. et al., 2016: Climate change and intellectual property rights in Africa: Environmental 24
necessity-economic opportunity. African J. Sci. Technol. Innov. Dev., 8(5–6), 377–385, 25
doi:10.1080/20421338.2016.1219482. 26
Sanyal, P., and L. R. Cohen, 2009: Powering Progress: Restructuring, Competition, and R&D in the 27
U.S. Electric Utility Industry. Energy J., 30(2), 41–79. 28
Sarker, M. N. I., M. Wu, G. M. Alam, and R. C. Shouse, 2020: Livelihood resilience of riverine island 29
dwellers in the face of natural disasters: Empirical evidence from Bangladesh. Land use policy, 30
95, 104599, doi:10.1016/j.landusepol.2020.104599. 31
Sarr, M., and T. Swanson, 2017: Will Technological Change Save the World? The Rebound Effect in 32
International Transfers of Technology. Environ. Resour. Econ., 66(3), 577–604, 33
doi:10.1007/s10640-016-0093-4. 34
Sawulski, J., and J. Witajewski-Baltvilks, 2020: Optimal Diversity in Auctions for Renewable Energy 35
Sources under Technological Uncertainty. Int. Rev. Environ. Resour. Econ., 14(2–3), 299–347, 36
doi:10.1561/101.00000118. 37
Schillo, R. S. S., and R. M. M. Robinson, 2017: Inclusive Innovation in Developed Countries: The 38
Who, What, Why, and How. Technol. Innov. Manag. Rev., 7, 34–46, 39
doi:http://doi.org/10.22215/timreview/1089. 40
Schindele, S. et al., 2020: Implementation of agrophotovoltaics: Techno-economic analysis of the price-41
performance ratio and its policy implications. Appl. Energy, 265, 114737, 42
doi:10.1016/j.apenergy.2020.114737. 43
Schmid, N., S. Sewerin, and T. S. Schmidt, 2020: Explaining Advocacy Coalition Change with Policy 44
Feedback. Policy Stud. J., 48(4), 1109–1134, doi:10.1111/psj.12365. 45
Schmidt, O. et al., 2017: Future cost and performance of water electrolysis: An expert elicitation study. 46
Int. J. Hydrog. Energ, 42, 30470–30492. 47
ACCEPTED VERSION
SUBJECT TO FIN
AL EDITS

Final Government Draft Chapter 16 IPCC AR6 WGIII
Do Not Cite, Quote or Distribute 16-131 Total pages: 141
Schmidt, T. S., and S. Sewerin, 2017a: Technology as a driver of climate and energy politics. Nat. 1
Energy, 2(6), 17084, doi:10.1038/nenergy.2017.84. 2
Schmidt, T. S., and S. Sewerin, 2017b: Technology as a driver of climate and energy politics. Nat. 3
Energy, , doi:10.1038/nenergy.2017.84. 4
Schmidt, T. S., and S. Sewerin, 2019: Measuring the temporal dynamics of policy mixes – An empirical 5
analysis of renewable energy policy mixes’ balance and design features in nine countries. Res. 6
Policy, 48(10), 103557, doi:10.1016/j.respol.2018.03.012. 7
Schot, J., and L. Kanger, 2018: Deep transitions: Emergence, acceleration, stabilization and 8
directionality. Res. Policy, 47(6), 1045–1059, doi:10.1016/j.respol.2018.03.009. 9
Scoones, I., 2015: The Politics of Green Transformations. 1st Editio. Routledge, London, 238 pp. 10
Scotchmer, S., and J. Green, 1990: Novelty and Disclosure in Patent Law. RAND J. Econ., 21(1), 131, 11
doi:10.2307/2555499. 12
Seebregts, A. et al., 1998: Endogenous Technological Change in Energy Systems Models: Synthesis of 13
Experience with ERIS, MARKAL, and MESSAGE. Paul Scherrer Institute, IIASA , Villigen, 14
Switz. IIASA, Laxenburg, Austria, , doi:ECN-C-99-025. 15
Segerberg, A., 2017: Online and Social Media Campaigns For Climate Change Engagement. Oxford 16
Res. Encycl. Clim. Sci., , doi:10.1093/acrefore/9780190228620.013.398. 17
Semieniuk, G., E. Campiglio, J.-F. Mercure, U. Volz, and N. R. Edwards, 2021: Low‐carbon transition 18
risks for finance. WIREs Clim. Chang., 12(1), doi:10.1002/wcc.678. 19
Sendzimir, J., C. P. Reij, and P. Magnuszewski, 2011: Rebuilding Resilience in the Sahel: Regreening 20
in the Maradi and Zinder Regions of Niger. Ecol. Soc., , doi:10.5751/ES-04198-160301. 21
Seres, S., E. Haites, and K. Murphy, 2009: Analysis of technology transfer in CDM projects: An update. 22
Energy Policy, 37(11), 4919–4926, doi:10.1016/j.enpol.2009.06.052. 23
Serrenho, T., and P. Bertoldi, 2019: Smart home and appliances: State of the art. 1st ed. [European 24
Commission Joint Research Center, (ed.)]. Publications Office of the European Union, 25
Luxembourg, 1–59 pp. 26
Seto, K. C. et al., 2016: Carbon Lock-In: Types, Causes, and Policy Implications. Annu. Rev. Environ. 27
Resour., 41(1), 425–452, doi:10.1146/annurev-environ-110615-085934. 28
Seyfang, D. G., and D. A. Smith, 2007: Grassroots innovations for sustainable development: Towards 29
a new research and policy agenda. https://doi.org/10.1080/09644010701419121, 16(4), 584–603, 30
doi:10.1080/09644010701419121. 31
Shapiro, C., 2001: Navigating the Patent Thicket: Cross Licences, Patent Pools and Standard Setting. 32
Innov. Policy Econ., 1, 119–150. 33
Sharpe, S., and T. M. Lenton, 2021: Upward-scaling tipping cascades to meet climate goals: plausible 34
grounds for hope. Clim. Policy, 21(4), 421–433, doi:10.1080/14693062.2020.1870097. 35
Shiraki, H., and M. Sugiyama, 2020: Back to the basic: toward improvement of technoeconomic 36
representation in integrated assessment models. Clim. Change, 162(1), 13–24, 37
doi:10.1007/s10584-020-02731-4. 38
Sierzchula, W., and G. Nemet, 2015: Using patents and prototypes for preliminary evaluation of 39
technology-forcing policies: Lessons from California’s Zero Emission Vehicle regulations. 40
Technol. Forecast. Soc. Change, 100, 213–224, doi:10.1016/j.techfore.2015.07.003. 41
Silvestre, B. S. S., and D. M. M. Ţîrcă, 2019: Innovations for sustainable development: Moving toward 42
a sustainable future. J. Clean. Prod., 208, 325–332, 43
doi:https://doi.org/10.1016/j.jclepro.2018.09.244. 44
Singh, N. P. et al., 2020: Dynamics of socio-economic factors affecting climate vulnerability and 45
technology adoption: Evidence from Jodhpur district of Rajasthan. INDIAN J. Tradit. Knowl., 46
ACCEPTED VERSION
SUBJECT TO FIN
AL EDITS

Final Government Draft Chapter 16 IPCC AR6 WGIII
Do Not Cite, Quote or Distribute 16-132 Total pages: 141
19(1), 192–196. 1
Sivaram, V., 2018a: Digital Decarbonization. Promoting Digital Innovations to Advance Clean Energy 2
Systems. , New York, USA, 138 pp. https://www.cfr.org/report/digital-decarbonization. 3
Sivaram, V., 2018b: Taming the Sun: Innovations to Harness Solar Energy and Power the Planet. MIT 4
Press, Cambridge, MA, United States, 50–52 pp. 5
Skea, J., R. . van Diemen, M. . Hannon, E. . Gazis, and A. . Rhodes, 2019: Energy Innovation for the 6
Twenty-First century: Accelerating the Energy Revolution. 1st ed. [Skea, J., R. Van Diemen, M.J. 7
Hannon, E. Gazis, and A. Rhodes, (eds.)]. Edward Elgar, 464 pp. 8
Skelton, A. C. H., L. Paroussos, and J. M. Allwood, 2020: Comparing energy and material efficiency 9
rebound effects: an exploration of scenarios in the GEM-E3 macroeconomic model. Ecol. Econ., 10
173, 106544, doi:10.1016/j.ecolecon.2019.106544. 11
Skene, K. R., 2020: No goal is an island: the implications of systems theory for the Sustainable 12
Development Goals. Environ. Dev. Sustain., , doi:10.1007/s10668-020-01043-y. 13
Solow, R. M., 1957: Technical change and the aggregate production function. Rev. Econ. Stat., 39(3), 14
312–320. 15
Somanathan, E. et al., 2014: National and Sub-national Policies and Institutions. In: Climate Change 16
2014: Mitigation of Climate Change. Contribution of Working Group III to the Fifth Assessment 17
Report of the Intergovernmental Panel on Climate Change [Edenhofer, O. et al., (eds.)], 18
Cambridge University Press, Cambridge, Uk and New York, US, pp. 1141–1205. 19
Song, Y., T. Yang, and M. Zhang, 2019: Research on the impact of environmental regulation on 20
enterprise technology innovation—an empirical analysis based on Chinese provincial panel data. 21
Environ. Sci. Pollut. Res., 26(21), 21835–21848, doi:10.1007/s11356-019-05532-0. 22
Sorrell, S., 2007: The Rebound Effect: an assessment of the evidence for economy-wide energy savings 23
from improved energy efficiency. 169 pp. 24
Sorrell, S. et al., 2004: The Economics of Energy Efficiency. Edward Elgar Publishing, 360 pp. 25
Soto Embodas, I. et al., 2019: The contribution of precision agriculture technologies to farm 26
productivity and the mitigation of greenhouse gas emissions in the EU. Joint Research Centre of 27
the European Commission, Luxembourg, 447 pp. 28
Spence, A. M., 1981: The Learning Curve and Competition. Bell J. Econ., 12(1), 49, 29
doi:10.2307/3003508. 30
Stavins, R. et al., 2014: International Cooperation: Agreements and Instruments. In: Climate Change 31
2014: Mitigation of Climate Change. Contribution of Working Group III to the Fifth Assessment 32
Report of the Intergovernmental Panel on Climate Change [Edenhofer, O. et al., (eds.)], 33
Cambridge University Press, Cambridge, UK and New York, US, pp. 1001–1082. 34
Steffen, W. et al., 2015: Planetary boundaries: Guiding human development on a changing planet. 35
Science (80-. )., 347(6223), doi:10.1126/SCIENCE.1259855. 36
Steneck, N. H., 2006: Fostering integrity in research: Definitions, current knowledge, and future 37
directions. Science and Engineering Ethics, Vol. 12 of, 53–74. 38
Stern, N., 2007: The Economics of Climate Change. Cambridge University Press, Cambridge, 692 pp. 39
Stiglitz, J. E., 2008: Economic foundations of intellectual property rights. Duke Law J., 57(6), 1693–40
1724. 41
Stilgoe, J., R. Owen, and P. Macnaghten, 2013: Developing a framework for responsible innovation. 42
Res. Policy, 42(9), 1568–1580, doi:10.1016/j.respol.2013.05.008. 43
Stokes, L. C., 2016: Electoral Backlash against Climate Policy: A Natural Experiment on Retrospective 44
Voting and Local Resistance to Public Policy. Am. J. Pol. Sci., 60(4), 958–974, 45
doi:10.1111/ajps.12220. 46
ACCEPTED VERSION
SUBJECT TO FIN
AL EDITS
Final Government Draft Chapter 16 IPCC AR6 WGIII
Do Not Cite, Quote or Distribute 16-133 Total pages: 141
Stokes, L. C., and C. Warshaw, 2017: Renewable energy policy design and framing influence public 1
support in the United States. Nat. Energy, 2(8), 17107, doi:10.1038/nenergy.2017.107. 2
Stokes, L. C., and H. L. Breetz, 2018: Politics in the U.S. energy transition: Case studies of solar, wind, 3
biofuels and electric vehicles policy. Energy Policy, , doi:10.1016/j.enpol.2017.10.057. 4
Stoll, C., L. Klaaßen, and U. Gallersdörfer, 2019: The Carbon Footprint of Bitcoin. Joule, 3(7), 1647–5
1661, doi:10.1016/j.joule.2019.05.012. 6
Sue Wing, I., 2006: Representing induced technological change in models for climate policy analysis. 7
Energy Econ., 28(5–6), 539–562, doi:10.1016/j.eneco.2006.05.009. 8
Sue Wing, I., 2008: Explaining the declining energy intensity of the U.S. economy. Resour. Energy 9
Econ., 30(1), 21–49, doi:10.1016/j.reseneeco.2007.03.001. 10
Sundaramoorthy, S., and A. Walia, 2017: India’s experience in implementing strategic schemes to 11
enhance appliance energy efficiency & futuristic integrated policy approaches to adopt most 12
efficient technologies. ECEEE 2017 Summer Study – Consum. Effic. Limits,. 13
Supran, G., and N. Oreskes, 2017: Assessing ExxonMobil’s climate change communications (1977–14
2014). Environ. Res. Lett., 12(8), 084019, doi:10.1088/1748-9326/aa815f. 15
Surana, K., and L. D. Anadon, 2015: Public policy and financial resource mobilization for wind energy 16
in developing countries: A comparison of approaches and outcomes in China and India. Glob. 17
Environ. Chang., 35, 340–359, doi:10.1016/j.gloenvcha.2015.10.001. 18
Surana, K., A. Singh, and A. D. Sagar, 2020a: Strengthening science, technology, and innovation-based 19
incubators to help achieve Sustainable Development Goals: Lessons from India. Technol. 20
Forecast. Soc. Change, 157, 120057, doi:10.1016/j.techfore.2020.120057. 21
Surana, K. et al., 2020b: Regional Clean Energy Innovation. Energy Futures Initiative with University 22
of Maryland Global Sustainability Initiative., 122 pp. 23
Sutherland, R. J., 2006: The Distributional Effects of Direct Regulation: A Case Study of Energy 24
Efficiency Appliance Standards. In: The Distributional Effects of Environmental Policy [Serret; 25
and P. Johnstone, (eds.)], Edward Elgar Publishing. 26
Suzuki, M., 2015: Identifying roles of international institutions in clean energy technology innovation 27
and diffusion in the developing countries: Matching barriers with roles of the institutions. J. Clean. 28
Prod., 98, 229–240, doi:10.1016/j.jclepro.2014.08.070. 29
Sweerts, B., R. J. Detz, and B. van der Zwaan, 2020: Evaluating the Role of Unit Size in Learning-by-30
Doing of Energy Technologies. Joule, 4(5), 967–970, doi:10.1016/j.joule.2020.03.010. 31
Swilling, M., J. Musango, and J. Wakeford, 2016: Developmental States and Sustainability Transitions: 32
Prospects of a Just Transition in South Africa. J. Environ. Policy Plan., 18(5), 650–672, 33
doi:10.1080/1523908X.2015.1107716. 34
Tariq, A., Y. F. Badir, W. Tariq, and U. S. Bhutta, 2017: Drivers and consequences of green product 35
and process innovation: A systematic review, conceptual framework, and future outlook. Technol. 36
Soc., 51, 8–23, doi:10.1016/J.TECHSOC.2017.06.002. 37
Tassey, G., 2014: Competing in Advanced Manufacturing: The Need for Improved Growth Models and 38
Policies. J. Econ. Perspect., 28(1), 27–48, doi:10.1257/jep.28.1.27. 39
Taylor, M. R., 2012: Innovation under cap-and-trade programs. Proc. Natl. Acad. Sci., 109(13), 4804–40
4809, doi:10.1073/pnas.1113462109. 41
TEC, 2012: Report on activities and performance of the Technology Executive Committee for 2012. , 42
Doha, 13 pp. https://unfccc.int/resource/docs/2012/sb/eng/02.pdf. 43
Technology Executive Commitee, 2019: Rolling workplan of the Technology Executive Committee for 44
2019–2022. , Bonn, Germany, 45
https://unfccc.int/ttclear/misc_/StaticFiles/gnwoerk_static/TEC_Members_doc/9ca11435f3d94446
ACCEPTED VERSION
SUBJECT TO FIN
AL EDITS

Final Government Draft Chapter 16 IPCC AR6 WGIII
Do Not Cite, Quote or Distribute 16-134 Total pages: 141
46a917a01a5d52a64a/20deb28a9b454a978b17299aa0bbf64c.pdf (Accessed August 25, 2021). 1
Technology Executive Committee, 2015: TEC Brief #7: Strengthening National Systems of 2
Innovationto Enhance Action on Climate Change. , Bonn, Germany, 12 pp. 3
https://unfccc.int/ttclear/misc_/StaticFiles/gnwoerk_static/TEC_documents/5be1bf880cc34d52a4
4315206d54a711b/60d1580f741a4bc783da5a00cf64a879.pdf. 5
Technology Executive Committee, 2017: Enhancing financing for the research, development and 6
demonstration of climate technologies. , Bonn, Germany, Germany, 26 pp. 7
Technology Executive Committee, 2021: Compilation of Good practices and lessons learned on 8
international collaborative research, development and demonstration initiatives of climate 9
technology. UNFCCC, Bonn, Germany, 68 pp. 10
TEEB, 2018: TEEB for Agriculture & Food: Scientific and Economic Foundations. UN Environment, 11
Geneva,. 12
Thacker, S. et al., 2019: Infrastructure for sustainable development. Nat. Sustain. 2019 24, 2(4), 324–13
331, doi:10.1038/s41893-019-0256-8. 14
Thornton, T. F., and C. Comberti, 2017: Synergies and trade-offs between adaptation, mitigation and 15
development. Clim. Change, 140(1), 5–18, doi:10.1007/s10584-013-0884-3. 16
Tigabu, A. D., 2018: Analysing the diffusion and adoption of renewable energy technologies in Africa: 17
The functions of innovation systems perspective. African J. Sci. Technol. Innov. Dev., 10(5), 615–18
624, doi:10.1080/20421338.2017.1366130. 19
Tigabu, A. D., F. Berkhout, and P. van Beukering, 2015: Functional evolution and accumulation of 20
technological innovation systems: The case of renewable energy in East Africa. Sci. Public Policy, 21
42(5), 614–631, doi:10.1093/scipol/scu073. 22
Timilsina, R., 2020: Demystifying the Costs of Electricity Generation Technologies. World Bank, 23
Washington, 39 pp. 24
Tittonell, P., 2014: Ecological intensification of agriculture—sustainable by nature. Curr. Opin. 25
Environ. Sustain., 8, 53–61, doi:10.1016/j.cosust.2014.08.006. 26
Toke, D., 2015: Renewable Energy Auctions and Tenders: How good are they? Int. J. Sustain. Energy 27
Plan. Manag., 8, 43–56, doi:https://doi.org/10.5278/ijsepm.2015.8.5. 28
Tonn, B. E., and D. Stiefel, 2019: Anticipating the Unanticipated-Unintended Consequences of 29
Scientific and Technological Purposive Actions. World Futur. Rev., 11(1), 19–50, 30
doi:10.1177/1946756718789413. 31
Townsend, R. et al., 2019: Future of Food : Harnessing Digital Technologies to Improve Food System 32
Outcomes. International Bank for Reconstruction and Development / The World Bank, 33
Washington D.C, 44 pp. 34
Trianni, A., E. Cagno, and E. Worrell, 2013: Innovation and adoption of energy efficient technologies: 35
An exploratory analysis of Italian primary metal manufacturing SMEs. Energy Policy, 61, 430–36
440, doi:10.1016/j.enpol.2013.06.034. 37
Trutnevyte, E. et al., 2019: Societal Transformations in Models for Energy and Climate Policy: The 38
Ambitious Next Step. One Earth, 1(4), 423–433, doi:10.1016/j.oneear.2019.12.002. 39
Tsur, Y., and A. Zemel, 2007: Towards endogenous recombinant growth. J. Econ. Dyn. Control, 31(11), 40
3459–3477, doi:10.1016/j.jedc.2006.12.002. 41
Turner, R., P. McConney, and I. Monnereau, 2020: Climate Change Adaptation and Extreme Weather 42
in the Small-Scale Fisheries of Dominica. Coast. Manag., 48(5), 436–455, 43
doi:10.1080/08920753.2020.1795970. 44
Turnheim, B., and B. K. Sovacool, 2020: Exploring the role of failure in socio-technical transitions 45
research. Environ. Innov. Soc. Transitions, 37, 267–289, doi:10.1016/J.EIST.2020.09.005. 46
ACCEPTED VERSION
SUBJECT TO FIN
AL EDITS

Final Government Draft Chapter 16 IPCC AR6 WGIII
Do Not Cite, Quote or Distribute 16-135 Total pages: 141
Turnheim, B. et al., 2015: Evaluating sustainability transitions pathways: Bridging analytical 1
approaches to address governance challenges. Glob. Environ. Chang., 35, 239–253, 2
doi:10.1016/j.gloenvcha.2015.08.010. 3
Twomey, P., 2012: Rationales for Additional Climate Policy Instruments under a Carbon Price. Econ. 4
Labour Relations Rev., 23(1), 7–31, doi:10.1177/103530461202300102. 5
Tziva, M., S. O. Negro, A. Kalfagianni, and M. P. Hekkert, 2020: Understanding the protein transition: 6
The rise of plant-based meat substitutes. Environ. Innov. Soc. Transitions, 35, 217–231, 7
doi:10.1016/J.EIST.2019.09.004. 8
U.S. National Academies of Sciences Engineering and Medicine, 2017: An Assessment of ARPA-E. 9
https://www.nap.edu/catalog/24778/an-assessment-of-arpa-e https://doi.org/10.17226/24778. 10
Ugur, M., and A. Mitra, 2017: Technology Adoption and Employment in Less Developed Countries: A 11
Mixed-Method Systematic Review. World Dev., 96, 1–18, doi:10.1016/j.worlddev.2017.03.015. 12
Ulsrud, K., H. Rohracher, and C. Muchunku, 2018: Spatial transfer of innovations: South-South 13
learning on village-scale solar power supply between India and Kenya. Energy Policy, 114, 89–14
97, doi:10.1016/j.enpol.2017.11.064. 15
UNCTAD, 2019: The Impact of Rapid Technological Change on Sustainable Development. United 16
Nations Publications, New York, 46 pp. 17
Unel, B., 2008: R&D spillovers through trade in a panel of OECD industries. J. Int. Trade Econ. Dev., 18
17(1), 105–133, doi:10.1080/09638190701728024. 19
UNEP, 2013: Assessing Global Land Use: Balancing Consumption with Sustainable Supply. A Report 20
of the Working Group on Land and Soils of the International Resource Panel. [Bringezu, S. et al., 21
(eds.)]. UN Environment, 46 pp. 22
UNEP, 2014: Decoupling 2: technologies, opportunities and policy options. A Report of the Working 23
Group on Decoupling to the International Resource Panel. [Von Weizsäcker, E.U., J. De Larderel, 24
K. Hargroves, C. Hudson, M. Smith, and M. Rodrigues, (eds.)]. UNEP,. 25
UNEP, 2015: Policy Coherence of the Sustainable Development Goals A Natural Resource Perspective. 26
UNEP, Paris, 29 pp. 27
UNEP, 2017: Assessing global resource use: A systems approach to resource efficiency and pollution 28
reduction. [Bringezu, S. et al., (eds.)]. United Nations Environment Programme, Nairobi, Kenya,. 29
UNFCCC, 2015: Paris Agreement. United Nations, 16 pp. 30
UNFCCC, 2016: Report of the Conference of the Parties on its twenty-first session, held in Paris from 31
30 November to 13 December 2015. FCCC/CP/2015/10/Add.1. United Nations Framework 32
Convention on Climate Change (UNFCCC),. 33
UNFCCC, 2017: Enhancing financing for the research, development and demonstration of climate 34
technologies. , Bonn, Germany, 26 pp. 35
UNFCCC, 2020a: Paris Committee on Capacity-building Review report on the status and progress of 36
work under the Strategic Plan for Stakeholder Engagement, Communications and Resource 37
Mobilization (June 2019–June 2020). United Nations Framework Convention on Climate Change 38
(UNFCCC), Bonn, Germany, 13 pp. 39
UNFCCC, 2020b: Workplan of the Paris Committee on Capacity-building for 2021–2024. 40
Unruh, G. C., 2000: Understanding carbon lock-in. Energy Policy, 28(12), 817–830, 41
doi:10.1016/S0301-4215(00)00070-7. 42
Unruh, G. C., 2002: Escaping carbon lock-in. Energy Policy, 30(4), 317–325, doi:10.1016/S0301-43
4215(01)00098-2. 44
Upadhyaya, P., M. K. Shrivastava, G. Gorti, and S. Fakir, 2020: Capacity building for proportionate 45
climate policy: Lessons from India and South Africa. Int. Polit. Sci. Rev., 0(0), 019251212096388, 46
ACCEPTED VERSION
SUBJECT TO FIN
AL EDITS

Final Government Draft Chapter 16 IPCC AR6 WGIII
Do Not Cite, Quote or Distribute 16-136 Total pages: 141
doi:10.1177/0192512120963883. 1
Urban, F., 2018: China’s rise: Challenging the North-South technology transfer paradigm for climate 2
change mitigation and low carbon energy. Energy Policy, 113(November 2017), 320–330, 3
doi:10.1016/j.enpol.2017.11.007. 4
US Department of Energy, 2011: DOE G 413.3-4A, Technology Readiness Assessment Guide. , 5
Washington D.C, 73 pp. https://www.directives.doe.gov/directives-documents/400-series/0413.3-6
EGuide-04a. 7
van Bommel, N., and J. I. Höffken, 2021: Energy justice within, between and beyond European 8
community energy initiatives: A review. Energy Res. Soc. Sci., 79, 102157, 9
doi:10.1016/j.erss.2021.102157. 10
van Bree, B., G. P. J. Verbong, and G. J. Kramer, 2010: A multi-level perspective on the introduction 11
of hydrogen and battery-electric vehicles. Technol. Forecast. Soc. Change, 77(4), 529–540, 12
doi:10.1016/j.techfore.2009.12.005. 13
Van Buskirk, R. D., C. L. S. Kantner, B. F. Gerke, and S. Chu, 2014: A retrospective investigation of 14
energy efficiency standards: policies may have accelerated long term declines in appliance costs. 15
Environ. Res. Lett., 9(11), 114010, doi:10.1088/1748-9326/9/11/114010. 16
van den Bergh, J. C. J. M., 2008: Optimal diversity: Increasing returns versus recombinant innovation. 17
J. Econ. Behav. Organ., 68(3–4), 565–580, doi:10.1016/j.jebo.2008.09.003. 18
van den Bijgaart, I., 2017: The unilateral implementation of a sustainable growth path with directed 19
technical change. Eur. Econ. Rev., 91, 305–327, doi:10.1016/j.euroecorev.2016.10.005. 20
van der Voorn, T., Å. Svenfelt, K. E. Björnberg, E. Fauré, and R. Milestad, 2020: Envisioning carbon-21
free land use futures for Sweden: a scenario study on conflicts and synergies between 22
environmental policy goals. Reg. Environ. Chang., 20(2), 35, doi:10.1007/s10113-020-01618-5. 23
van Sluisveld, M. A. E. et al., 2020: Aligning integrated assessment modelling with socio-technical 24
transition insights: An application to low-carbon energy scenario analysis in Europe. Technol. 25
Forecast. Soc. Change, 151(October 2017), 119177, doi:10.1016/j.techfore.2017.10.024. 26
Van Summeren, L. F. M., A. J. Wieczorek, and G. P. J. Verbong, 2021: The merits of becoming smart: 27
How Flemish and Dutch energy communities mobilise digital technology to enhance their agency 28
in the energy transition. Energy Res. Soc. Sci., 79, 102160, doi:10.1016/j.erss.2021.102160. 29
van Vliet, M., K. Kok, and T. Veldkamp, 2010: Linking stakeholders and modellers in scenario studies: 30
The use of Fuzzy Cognitive Maps as a communication and learning tool. Futures, 42(1), 1–14, 31
doi:10.1016/j.futures.2009.08.005. 32
van Welie, M. J., and H. A. Romijn, 2018: NGOs fostering transitions towards sustainable urban 33
sanitation in low-income countries: Insights from Transition Management and Development 34
Studies. Environ. Sci. Policy, 84, 250–260, doi:10.1016/j.envsci.2017.08.011. 35
Vasconcellos, H. A. S., and L. Caiado Couto, 2021: Estimation of socioeconomic impacts of wind 36
power projects in Brazil’s Northeast region using Interregional Input-Output Analysis. Renew. 37
Sustain. Energy Rev., 149, 111376, doi:10.1016/j.rser.2021.111376. 38
Vassilakopoulou, P., and E. Hustad, 2021: Bridging Digital Divides: a Literature Review and Research 39
Agenda for Information Systems Research. Inf. Syst. Front., , 1–15, doi:10.1007/s10796-020-40
10096-3. 41
Vázquez-Canteli, J. R., and Z. Nagy, 2019: Reinforcement learning for demand response: A review of 42
algorithms and modeling techniques. Appl. Energy, 235, 1072–1089, 43
doi:10.1016/j.apenergy.2018.11.002. 44
Veefkind, V., J. Hurtado-Albir, S. Angelucci, K. Karachalios, and N. Thumm, 2012: A new EPO 45
classification scheme for climate change mitigation technologies. World Pat. Inf., 34(2), 106–111, 46
doi:10.1016/j.wpi.2011.12.004. 47
ACCEPTED VERSION
SUBJECT TO FIN
AL EDITS

Final Government Draft Chapter 16 IPCC AR6 WGIII
Do Not Cite, Quote or Distribute 16-137 Total pages: 141
Verdolini, E., and M. Galeotti, 2011: At home and abroad: An empirical analysis of innovation and 1
diffusion in energy technologies. J. Environ. Econ. Manage., 61(2), 119–134, 2
doi:10.1016/j.jeem.2010.08.004. 3
Verdolini, E., and V. Bosetti, 2017: Environmental Policy and the International Diffusion of Cleaner 4
Energy Technologies. Environ. Resour. Econ., 66(3), 497–536, doi:10.1007/s10640-016-0090-7. 5
Verdolini, E., L. D. Anadón, E. Baker, V. Bosetti, and L. Aleluia Reis, 2018: The Future Prospects of 6
Energy Technologies: Insights from Expert Elicitations. Rev. Environ. Econ. Policy, 12(1), 133–7
153, doi:10.1093/reep/rex028. 8
Verma, P. et al., 2020: Digitalization: enabling the new phase of energy efficiency. Group of Experts 9
on Energy Efficiency Seventh session Geneva, 22 and 25 September 2020 Item 5 of the Annotated 10
provisional agenda Regulatory and policy dialogue addressing barriers to improve energy 11
efficiency (GEEE-7/2020/INF.3), Geneva, Group of Experts on Energy Efficiency 7th Session, 16 12
https://unece.org/sites/default/files/2020-12/GEEE-7.2020.INF_.3.pdf. 13
Veugelers, R., 2012: Which policy instruments to induce clean innovating? Res. Policy, 41(10), 1770–14
1778, doi:10.1016/j.respol.2012.06.012. 15
Victor, D. G., 2018: Digitalization: An Equal Opportunity Wave of Energy Innovation. In: Digital 16
Decarbonization Promoting Digital Innovations to Advance Clean Energy Systems [Sivaram, V., 17
(ed.)], Council on Foreign Relations Press, pp. 25–32. 18
Victor, D. G., F. W. Geels, and S. Sharpe, 2019: Accelerating the Low Carbon Transition: The Case 19
for Stronger, More Targeted and Coordinated International Action. Commissioned by the UK 20
Department for Business, Energy & Industrial Strategy; Supported by the Energy Transitions 21
Commission. 22
Vogel, B., D. Henstra, and G. McBean, 2020: Sub-national government efforts to activate and motivate 23
local climate change adaptation: Nova Scotia, Canada. Environ. Dev. Sustain., 22(2), 1633–1653, 24
doi:10.1007/s10668-018-0242-8. 25
Voss, J.-P., D. Bauknecht, and R. Kemp, 2006: Reflexive governance for sustainable development. 26
Edward Elgar, 457 pp. 27
Voyant, C. et al., 2017: Machine learning methods for solar radiation forecasting: A review. Renew. 28
Energy, 105, 569–582, doi:10.1016/j.renene.2016.12.095. 29
Vranken, H., 2017: Sustainability of bitcoin and blockchains. Curr. Opin. Environ. Sustain., 28, 1–9, 30
doi:10.1016/j.cosust.2017.04.011. 31
Wahlroos, M., M. Pärssinen, J. Manner, and S. Syri, 2017: Utilizing data center waste heat in district 32
heating – Impacts on energy efficiency and prospects for low-temperature district heating 33
networks. Energy, 140, 1228–1238, doi:10.1016/j.energy.2017.08.078. 34
Wahlroos, M., M. Pärssinen, S. Rinne, S. Syri, and J. Manner, 2018: Future views on waste heat 35
utilization – Case of data centers in Northern Europe. Renew. Sustain. Energy Rev., 82, 1749–36
1764, doi:10.1016/j.rser.2017.10.058. 37
Waiswa, P. et al., 2019: Using research priority-setting to guide bridging the implementation gap in 38
countries – a case study of the Uganda newborn research priorities in the SDG era. Heal. Res. 39
Policy Syst., 17(1), 54, doi:10.1186/s12961-019-0459-5. 40
Wallerstein, M., M. Mogee, R. Schoen, and P. David, 1993: Intellectual property institutions and the 41
panda’s thumb: Patents, copyrights, and trade secrets in economic theory and history. In: Global 42
Dimensions of Intellectual Property Rights in Science and Technology [Wallerstein, M., M. 43
Mogee, and R. Schoen, (eds.)], National Academies Press, Washington DC, pp. 19–62. 44
Walsh, P. P. P., E. Murphy, and D. Horan, 2020: The role of science, technology and innovation in the 45
UN 2030 agenda. Technol. Forecast. Soc. Change, 154, 119957, 46
doi:10.1016/J.TECHFORE.2020.119957. 47
ACCEPTED VERSION
SUBJECT TO FIN
AL EDITS

Final Government Draft Chapter 16 IPCC AR6 WGIII
Do Not Cite, Quote or Distribute 16-138 Total pages: 141
Wang, F., J. Yu, P. Yang, L. Miao, and B. Ye, 2017a: Analysis of the Barriers to Widespread Adoption 1
of Electric Vehicles in Shenzhen China. Sustainability, 9(4), 522, doi:10.3390/su9040522. 2
Wang, J., Y.-N. Lee, and J. P. Walsh, 2018: Funding model and creativity in science: Competitive 3
versus block funding and status contingency effects. Res. Policy, 47(6), 1070–1083, 4
doi:10.1016/j.respol.2018.03.014. 5
Wang, X., H. Cai, and H. K. Florig, 2016: Energy-saving implications from supply chain improvement: 6
An exploratory study on China’s consumer goods retail system. Energy Policy, 95, 411–420, 7
doi:https://doi.org/10.1016/j.enpol.2016.04.044. 8
Wang, Z., X. Wang, and D. Guo, 2017b: Policy implications of the purchasing intentions towards 9
energy-efficient appliances among China’s urban residents: Do subsidies work? Energy Policy, 10
102, 430–439, doi:10.1016/j.enpol.2016.12.049. 11
Watanabe, C., K. Wakabayashi, and T. Miyazawa, 2000: Industrial dynamism and the creation of a 12
“virtuous cycle” between R&D, market growth and price reduction. Technovation, 20(6), 299–13
312, doi:10.1016/S0166-4972(99)00146-7. 14
Watkins, A., T. Papaioannou, J. Mugwagwa, and D. Kale, 2015: National innovation systems and the 15
intermediary role of industry associations in building institutional capacities for innovation in 16
developing countries: A critical review of the literature. Res. Policy, 44(8), 1407–1418, 17
doi:10.1016/j.respol.2015.05.004. 18
Way, R., F. Lafond, F. Lillo, V. Panchenko, and J. D. Farmer, 2019: Wright meets Markowitz: How 19
standard portfolio theory changes when assets are technologies following experience curves. J. 20
Econ. Dyn. Control, 101, 211–238, doi:10.1016/j.jedc.2018.10.006. 21
Weber, K. M., and H. Rohracher, 2012: Legitimizing research, technology and innovation policies for 22
transformative change. Res. Policy, 41(6), 1037–1047, doi:10.1016/j.respol.2011.10.015. 23
Weber, K. M., and B. Truffer, 2017: Moving innovation systems research to the next level: towards an 24
integrative agenda. Oxford Rev. Econ. Policy, 33(1), 101–121, doi:10.1093/oxrep/grx002. 25
Wei, M., S. J. Smith, and M. D. Sohn, 2017: Non-constant learning rates in retrospective experience 26
curve analyses and their correlation to deployment programs. Energy Policy, 107, 356–369, 27
doi:10.1016/j.enpol.2017.04.035. 28
Weingartner, L., T. Pforr, and E. Wilkinson, 2020: The evidence base on anticipatory action. , Rome, 29
48 pp. https://docs.wfp.org/api/documents/WFP-30
0000110236/download/?_ga=2.229554197.803426786.1608743449-439861983.1608743449. 31
Weiss, C., and W. B. Bonvillian, 2013: Legacy sectors: barriers to global innovation in agriculture and 32
energy. Technol. Anal. Strateg. Manag., 25(10), 1189–1208, 33
doi:10.1080/09537325.2013.843658. 34
Weiss, M., M. Junginger, M. K. Patel, and K. Blok, 2010: A review of experience curve analyses for 35
energy demand technologies. Technol. Forecast. Soc. Change, 77(3), 411–428, 36
doi:10.1016/j.techfore.2009.10.009. 37
Weitzman, M. L., 1998: Recombinant Growth. Q. J. Econ., 113(2), 331–360, 38
doi:10.1162/003355398555595. 39
Wesche, J. P., S. O. Negro, E. Dütschke, R. P. J. M. Raven, and M. P. Hekkert, 2019: Configurational 40
innovation systems – Explaining the slow German heat transition. Energy Res. Soc. Sci., 52, 99–41
113, doi:10.1016/j.erss.2018.12.015. 42
Wesseling, J. H., and A. Van der Vooren, 2017: Lock-in of mature innovation systems: the 43
transformation toward clean concrete in the Netherlands. J. Clean. Prod., 155, 114–124, 44
doi:https://doi.org/10.1016/j.jclepro.2016.08.115. 45
Wesseling, J. H., J. C. M. Farla, and M. P. Hekkert, 2015: Exploring car manufacturers’ responses to 46
technology-forcing regulation: The case of California’s ZEV mandate. Environ. Innov. Soc. 47
ACCEPTED VERSION
SUBJECT TO FIN
AL EDITS

Final Government Draft Chapter 16 IPCC AR6 WGIII
Do Not Cite, Quote or Distribute 16-139 Total pages: 141
Transitions, 16, 87–105, doi:10.1016/j.eist.2015.03.001. 1
Westerhoff, L., S. R. J. Sheppard, D. Mathew Iype, S. Cote, and J. Salter, 2018: Social mobilization on 2
climate change and energy: An evaluation of research projects in British Columbia, Canada. 3
Energy Res. Soc. Sci., 46, 368–380, doi:10.1016/J.ERSS.2018.07.022. 4
Westley, F. R. et al., 2013: A Theory of Transformative Agency in Linked Social-Ecological Systems. 5
Ecol. Soc., 18(3), art27, doi:10.5751/ES-05072-180327. 6
Weyant, J. P., 2011: Accelerating the development and diffusion of new energy technologies: Beyond 7
the “valley of death.” Energy Econ., 33(4), 674–682, doi:10.1016/j.eneco.2010.08.008. 8
Weyrauch, T., and C. Herstatt, 2016: What is frugal innovation? Three defining criteria. J. Frugal Innov. 9
2016 21, 2(1), 1–17, doi:10.1186/S40669-016-0005-Y. 10
Wezel, A., G. Soboksa, S. McClelland, F. Delespesse, and A. Boissau, 2015: The blurred boundaries 11
of ecological, sustainable, and agroecological intensification: a review. Agron. Sustain. Dev., 12
35(4), 1283–1295, doi:10.1007/s13593-015-0333-y. 13
Wezel, A. et al., 2020: Agroecological principles and elements and their implications for transitioning 14
to sustainable food systems. A review. Agron. Sustain. Dev., 40(6), 40, doi:10.1007/s13593-020-15
00646-z. 16
Whittaker, D. H., T. Sturgeon, T. Okita, and T. Zhu, 2020: Compressed Development. Oxford 17
University Press, Oxford,. 18
WHO, 2020: The DOHA declaration on the trips agreement and public health. 19
https://www.who.int/medicines/areas/policy/doha_declaration/en/. 20
Wieczorek, A. J., and M. P. Hekkert, 2012: Systemic instruments for systemic innovation problems: A 21
framework for policy makers and innovation scholars. Sci. Public Policy, 39(1), 74–87, 22
doi:10.1093/scipol/scr008. 23
Wieczorek, A. J. et al., 2013: A review of the European offshore wind innovation system. Renew. 24
Sustain. Energy Rev., 26, 294–306, doi:10.1016/j.rser.2013.05.045. 25
Wiel, S., C. Egan, and M. delta Cava, 2006: Energy efficiency standards and labels provide a solid 26
foundation for economic growth, climate change mitigation, and regional trade. Energy Sustain. 27
Dev., 10(3), 54–63, doi:10.1016/S0973-0826(08)60544-X. 28
Wigand, F. et al., 2016: Auctions for Renewable Energy Support: effective use and efficient 29
implementation options. 1–46 pp. https://cordis.europa.eu/project/id/646172. 30
Williams, D. S., S. Rosendo, O. Sadasing, and L. Celliers, 2020: Identifying local governance capacity 31
needs for implementing climate change adaptation in Mauritius. Clim. Policy, 20(5), 548–562, 32
doi:10.1080/14693062.2020.1745743. 33
Wilson, C., 2012: Up-scaling, formative phases, and learning in the historical diffusion of energy 34
technologies. Energy Policy, 50, 81–94, doi:10.1016/j.enpol.2012.04.077. 35
Wilson, C., and A. Grubler, 2013: Energy Technology Innovation. In: Energy Technology Innovation: 36
Learning from Historical Successes and Failures [Grubler, A. and C. Wilson, (eds.)], Cambridge 37
University Press, Cambridge, pp. 3–10. 38
Wilson, C. et al., 2020: Granular technologies to accelerate decarbonization. Science (80-. )., 368(6486), 39
36–39, doi:10.1126/science.aaz8060. 40
Winther, T., K. Ulsrud, and A. Saini, 2018: Solar powered electricity access: Implications for women’s 41
empowerment in rural Kenya. Energy Res. Soc. Sci., 44, 61–74, 42
doi:https://doi.org/10.1016/j.erss.2018.04.017. 43
WIPO, 2021: WIPO Member States. https://www.wipo.int/members/en/ (Accessed November 1, 2021). 44
Witajewski-Baltvilks, J., E. Verdolini, and M. Tavoni, 2015: Bending the learning curve. Energy Econ., 45
52, S86–S99, doi:10.1016/j.eneco.2015.09.007. 46
ACCEPTED VERSION
SUBJECT TO FIN
AL EDITS

Final Government Draft Chapter 16 IPCC AR6 WGIII
Do Not Cite, Quote or Distribute 16-140 Total pages: 141
Witajewski-Baltvilks, J., E. Verdolini, and M. Tavoni, 2017: Induced technological change and energy 1
efficiency improvements. Energy Econ., 68, 17–32, doi:10.1016/j.eneco.2017.10.032. 2
World Bank, 2014: World Development Indicators 2014. The World Bank, Washington, D.C,. 3
World Intellectual Property Organization, 2008: WIPO Intellectual Property Handbook: Policy, Law 4
and Use. 2nd ed. WIPO publications, 488 pp. 5
WTO, 1994: Trade-Related Aspects of Intellectual Property Rights, Annex 1C of the Marrakesh 6
Agreement Establishing the World Trade Organization. World Trade Organisation, Marrakesh, 7
Morocco,. 8
WTO, 2020: Compulsory licensing of pharmaceuticals and TRIPS. 9
https://www.wto.org/english/tratop_e/trips_e/public_health_faq_e.htm. 10
Yan, Z., K. Du, Z. Yang, and M. Deng, 2017: Convergence or divergence? Understanding the global 11
development trend of low-carbon technologies. Energy Policy, 109, 499–509, 12
doi:10.1016/j.enpol.2017.07.024. 13
Yi, H., 2013: Clean energy policies and green jobs: An evaluation of green jobs in U.S. metropolitan 14
areas. Energy Policy, 56, 644–652, doi:10.1016/j.enpol.2013.01.034. 15
Yi, H., and Y. Liu, 2015: Green economy in China: Regional variations and policy drivers. Glob. 16
Environ. Chang., 31, 11–19, doi:10.1016/j.gloenvcha.2014.12.001. 17
Youn, H., D. Strumsky, L. M. A. Bettencourt, and J. Lobo, 2015: Invention as a combinatorial process: 18
evidence from US patents. J. R. Soc. Interface, 12(106), 20150272, doi:10.1098/rsif.2015.0272. 19
Young, A., 1993: Invention and Bounded Learning by Doing. J. Polit. Econ., 101(3), 443–472, 20
doi:10.1086/261882. 21
Yu, C. F., W. G. J. H. M. van Sark, and E. A. Alsema, 2011: Unraveling the photovoltaic technology 22
learning curve by incorporation of input price changes and scale effects. Renew. Sustain. Energy 23
Rev., 15(1), 324–337, doi:10.1016/j.rser.2010.09.001. 24
Zangheri, Serrenho, and Bertoldi, 2019: Energy Savings from Feedback Systems: A Meta-Studies’ 25
Review. Energies, 12(19), 3788, doi:10.3390/en12193788. 26
Zeng, W., T. Miwa, and T. Morikawa, 2017: Application of the support vector machine and heuristic 27
k-shortest path algorithm to determine the most eco-friendly path with a travel time constraint. 28
Transp. Res. Part D Transp. Environ., 57, 458–473, doi:10.1016/j.trd.2017.10.001. 29
Zhan, L., M. Ju, and J. Liu, 2011: Improvement of China Energy Label System to Promote Sustainable 30
Energy Consumption. Energy Procedia, 5, 2308–2315, doi:10.1016/j.egypro.2011.03.397. 31
Zhang, F., and K. S. Gallagher, 2016: Innovation and technology transfer through global value chains: 32
Evidence from China’s PV industry. Energy Policy, 94, 191–203, 33
doi:10.1016/J.ENPOL.2016.04.014. 34
Zhang, L., H. Liu, and J. Wu, 2017: The price premium for green-labelled housing: Evidence from 35
China. Urban Stud., 54(15), 3524–3541, doi:10.1177/0042098016668288. 36
Zhang, N., Y. Choi, and W. Wang, 2019: Does energy research funding work? Evidence from the 37
Natural Science Foundation of China using TEI@I method. Technol. Forecast. Soc. Change, 144, 38
369–380, doi:10.1016/j.techfore.2018.02.001. 39
Zhou, C., 2019: Enabling Law and Policy Environment for Climate Technology Transfer: From 40
Perspectives of Host Countries. J. East Asia Int. Law, 12(1), 45–70, 41
doi:10.14330/jeail.2019.12.1.03. 42
Zhou, N., M. D. Levine, and L. Price, 2010: Overview of current energy-efficiency policies in China. 43
Energy Policy, 38(11), 6439–6452, doi:10.1016/j.enpol.2009.08.015. 44
Zhuang, W., 2017: Intellectual Property Rights and Climate Change. Cambridge University Press, 45
Cambridge, UK, 428 pp. 46
ACCEPTED VERSION
SUBJECT TO FIN
AL EDITS
Final Government Draft Chapter 16 IPCC AR6 WGIII
Do Not Cite, Quote or Distribute 16-141 Total pages: 141
Ziervogel, G., J. Enqvist, L. Metelerkamp, and J. van Breda, 2021: Supporting transformative climate 1
adaptation: community-level capacity building and knowledge co-creation in South Africa. Clim. 2
Policy, , 1–16, doi:10.1080/14693062.2020.1863180. 3
Zubeltzu-Jaka, E., A. Erauskin-Tolosa, and I. Heras-Saizarbitoria, 2018: Shedding light on the 4
determinants of eco-innovation: A meta-analytic study. Bus. Strateg. Environ., 27(7), 1093–1103, 5
doi:10.1002/BSE.2054. 6
7
ACCEPTED VERSION
SUBJECT TO FIN
AL EDITS