Persistent Organic Pollutants (POPs) in Eastern and Western South American Countries

Developments in Environmental Science, Volume 7
A. Li, S. Tanabe, G. Jiang, J.P. Giesy and P.K.S. Lam (Editors)
Copyright r 2007 Elsevier Ltd. All rights reserved.
31
ISSN: 1474-8177/DOI:10.1016/S1474-8177(07)07002-7
Chapter 2
Emission, Contamination and Exposure, Fate and Transport,
and National Management Strategy of Persistent Organic
Pollutants in South Korea
Seung-Kyu Kim�, Jong Seong Khim, Kyu-Tae Lee, John P. Giesy,
Kurunthachalam Kannan, Dong-Soo Lee and Chul-Hwan Koh
Abstract
Public concern over persistent organic pollutants (POPs) re-emergedin the 1990s due to studies describing endocrine disrupting effects ofsome POPs. While monitoring data suggested that concentrations ofcontaminants were less in South Korea than in more industrializedcountries, the public perception was that there were significant risksposed by POPs. This perception may have resulted from inaccurateand insufficient information about the status of POPs in South Ko-rea. The South Korean government, as a signatory authority of theStockholm Convention, is obliged to submit a national implementa-tion plan to ban or minimize POPs emissions. To date, little has beenknown regarding the overall POPs status including inventories, usagepatterns, sources, emission, fate, and distribution in South Korea. Toassess the status of four emerging POPs as well as the 12 existingclassical POPs in South Korea we have compiled and reviewed all theavailable literature published since the mid-1990s on POPs in SouthKorea. We present and discuss: (1) emission inventories of individualPOPs; (2) concentrations of the various POPs in various compart-ments of the environment; (3) conducted ecosystem and human ex-posure assessments; (4) report a case study of fate and multi-mediatransport of POPs; and finally (5) propose an appropriate strategy tominimize the risks of POPs in South Korea. In brief, concentrationsof POPs were found to be relatively small, compared to most otherindustrialized countries. In fact, concentrations of many of the clas-sical POPs were less than the environmental quality criteria suggestedby government agencies, except for a few ‘hot spots’. However, due toa lack of sufficient information, the status and trends of PCDDs/DFs,
�Corresponding author: E-mail: [email protected]

Seung-Kyu Kim et al.32
DDTs, PBDEs and PFAs could not be assessed. Additional infor-mation from monitoring studies would be needed for certain loca-tions. For instance, the emission of dioxin-like compounds, expressedon a per area basis, was estimated to be one of the greatest in theworld, even though the recent governmental efforts to reduce theemission have resulted in decreased releases of several classes ofPOPs. Concentrations of some perfluoroalkylated compounds(PFAs), in some freshwater locations were found to be some of thegreatest in the world. Identification of hot spots followed by reme-diation (for classical POPs) and nationwide monitoring surveys (foremerging POPs) would be strongly needed.
2.1. Introduction
The ‘dirty dozen’ or the 12 legacy organochlorine substances, consist oftwo byproducts (polychlorinated dibenzo-p-dioxins and polychlorinateddibenzofurans (PCDDs/DFs)), one industrial product (polychlorinatedbiphenyls (PCBs)), and nine pesticides (DDTs, chlordanes, heptachlor,aldrin, endrin, dieldrin, toxaphene, mirex, and hexachlorobenzene(HCB)) (Stockholm Convention on Persistent Organic Pollutants,2001). PCBs and HCB are also emitted as byproduct or impurities (UN-ECE/EMEP, 2002; Breivik et al., 2004). These dirty dozen persistentorganic pollutants (POPs) were prioritized for global action by theStockholm Convention on POPs, developed under the auspices of theUnited Nations Environment Program (UNEP). The criteria for prior-itization included persistence, bioaccumulation potential, and toxic po-tency (PBT) in addition to their potential for long-range transport (LRT).
Since 1998, the United Nations/Economic Commission for Europe(UN/ECE, 1998) has included, in addition to the dirty dozen POPs, hex-achlorocyclohexanes (HCHs), polycyclic aromatic hydrocarbons (PAHs),chlorodecone, and hexabromobiphenyl. The New Protocol on PersistentOrganic Pollutants to the Convention on Long-Range Trans-boundaryAir Pollutant (CLRT protocol) has served as the basis for these criteria.Besides the 12 existing POPs, the emerging POPs such as polybrominateddiphenyl ethers (PBDEs) (Palm et al., 2002; Tanabe, 2004) and per-fluoroalkyl acids (PFAs) (Giesy and Kannan, 2001; Renner, 2001a,b;Prevedouros et al., 2006) are also of increasing concern due to their ex-tensive worldwide usage as well as possible PBT and LRT characteristics.Alkylphenols (APs) such as nonylphenol (NP) and octylphenol (OP) withendocrine disrupting properties are also stable in the environment with ahalf-life of approximately two months in water and in the order of yearsin sediments (Mackay et al., 2000; Ying et al., 2002).

Organic Pollutants in South Korea 33
National concern regarding POPs in South Korea was amplified in themid-1990s when dioxins, carcinogenic, and endocrine disrupting com-pounds (EDCs), were reported to be emitted primarily from waste in-cinerators throughout South Korea. The total number of incinerators inSouth Korea reached a maximum of 16,000 in 1998. During the sameperiod, it was reported that some of the POPs, including dioxins, couldcause effects, such as breast cancer and reduced semen quality and po-tentially be ‘environmental hormones’. The South Korean governmentclassified them as priority pollutants for regulatory actions in South Ko-rea. Based on a survey conducted in 2003, 91.4% of South Koreansresponded that they had heard the term ‘environmental hormone’ at leastonce in their life (Kim, 2003). A survey of risk communication and per-ception in environmental problems (Kim et al., 2002a), found that over82% of 574 people surveyed thought that the South Korean environmentwas polluted. Nevertheless, little was known in the public surveyed (i.e.,o2.5 points of total 13 points) about the causes, pathways, toxic effects,and there was no personal action plan to decrease exposure to dioxinsand other POPs. Most of the people responded that their knowledgeregarding POPs was acquired from the mass media rather than from thescientific research papers. Recent nationwide monitoring studies havefound that concentrations of POPs such as PCBs and organochlorinepesticides (OCPs) in the environment, are less than those in other indus-trialized countries such as the USA and Japan, and generally less than theestablished criteria, except for some hot spots (Kim et al., 2002b; Hong etal., 2006). Thus, in addition to having only limited information on thestatus and trends of contaminants and their potential toxic effects withwhich to conduct risk assessments and implement risk management, therewas also a gap in risk communication. Thus, the public could not assessthe real risks that POPs may pose to the health of the South Koreanpopulation and ecosystem.
In addition to public concern, international conventions to reduce oreliminate emissions of POPs in South Korea took effect in May 2004. TheSouth Korean Government, as a signatory participant of the StockholmConvention on POPs, plans to ratify the convention. Then the govern-ment is obliged to submit a National Implementation Plant (NIP) tominimize POPs emission and update the plan and provide a status reportevery two years from the time of ratification (Stockholm Convention onPersistent Organic Pollutants, 2001). Therefore, it is inevitable that ascientific assessment and review of the domestic status and history of thePOPs pollution including emissions, contamination levels (or distribu-tion), exposures, and risks will be needed. This information will be dis-seminated to the public and also used to develop efficient control

Seung-Kyu Kim et al.34
strategies to minimize exposure of humans and the wildlife to the POPs.Here, we facilitate this process by bringing together in one place, for thefirst time, a comprehensive compendium of information available onPOPs in Korea.
Studies of POPs in South Korea can be arbitrarily categorized into 3periods: from the 1960s to mid-1990s, mid-1990s to 2000, and 2001 andlater. The first study of POPs in South Korea to appear in the literaturewas about OCPs residues in South Korean foodstuffs performed by the‘Rural Development Administration’ in 1967 before the beginning of re-striction of the use of OCPs in South Korea (Lee, 1982). Until the mid-1990s, most studies of POPs in South Korea had been conducted on OCPresidues in agricultural products such as vegetables (Park and Yoo, 1972;Park et al., 1974; Kim et al., 1981), foods (Kim and Lee, 1980; Lee, 1982;Ryu et al., 1986), agricultural soils (Park and Ma, 1982; Choi et al., 1987),and marine food/sediment (Lee et al., 1976, 1977; You and Park, 1984;Suh et al., 1986). The most extensive collection of data during the 1960sto mid-1990s appeared on OCPs and specifically for calculation of dailyintake rates (Lee, 1982) and on the investigation of OCP residues in 236agricultural soils (Park and Ma, 1982). Due to these initiatives and somepioneering efforts, the uses of POPs have been restricted in South Koreasince late 1960s. Because early analytical techniques involving packed GCcolumns were less accurate and sensitive than more modern methods, theaccuracy of the historical analyses of OCPs is questionable. Since themid-1990s, several studies by academic institutions applied state-of-the-art analytical techniques to quantify POPs. During this period, in 1996,standard analytical methods were established for quantifying dioxins inair. The development of sensitive and standard analytical techniques im-proved the accuracy of POPs quantification, which made internationalcomparisons of concentrations possible. These data were available forrobust meta-analyses. Governmental efforts began only in the last decadefor through investigation and effective management of POPs. Since 1999,the South Korean government and the Ministry of Environment(KMOE) began nationwide monitoring of POPs in the environmentand in humans. Since 2001, comprehensive projects have been undertakento establish the national emission inventory of some priority POPs (di-oxins in particular).
While comprehensive research and surveys were delayed, or lacking, nosignificant effort had been put toward the overview of the existing data ofemissions, sources, distribution, exposure, and fate of POPs. Lee and Kim(1999) collected published data on concentrations of EDCs for almost allenvironmental media and human tissues and performed a meta-analysisto examine the relationship between the sperm quality of South Korean

Organic Pollutants in South Korea 35
males and exposure to EDCs. Environmental concentrations and rates ofemission of POPs, such as PCBs and OCPs, have been reviewed byKMOE (KMOE, 2004a). These preliminary studies were limited to thecollection of data on concentrations in various environmental compart-ments.
In an attempt to provide an overview and assessment of the POPs inSouth Korea, we have conducted a comprehensive literature search andcompiled the existing POPs data (including the emerging POPs) fromsurveys conducted since the mid-1990s in South Korea. This chapterpresents: (1) emission inventories of individual POPs; (2) concentrationsin various environmental including humans; (3) exposure assessment inthe ecosystem and humans; (4) a case study of fate and multi-mediatransport of POPs; and finally, (5) a proposal for a strategy to minimizereleases and ultimately eliminate POPs in South Korea.
2.2. Methodology: Literature survey and target POPs
For this chapter, we searched the peer-reviewed, open, scientific literatureby using the Science Citation Index (SCI) and ‘ScienceDirect’, ‘SCIRUS’,and ‘SpringerLink’. Domestic articles that would not be listed in thesecitation services were collected using online websites of 33 South Koreanscience societies and ‘Korean studies Information Service System (KISS)’of Korean Studies Information Corporation. Literature collected in-cludes: (1) 91 articles published in SCI journals; (2) 57 domestic articles;(3) 40 research reports performed or funded by governmental agencies;and (4) 4 dissertations (Fig. 2.1). Reports quoted consisted of 25 regularnationwide monitoring studies (6 by National Institute of EnvironmentResearch (NIER), 16 by the South Korea Food and Drug Administration(KFDA), and 3 by the Ministry of Maritime Affairs and Fishery (MO-MAF)), 12 emission inventories, and 3 exposures and meta-analyses.Most inventories of emissions were either performed or funded by theKMOE or NIER.
In the present study, 17 compounds including dirty dozen POPs (OCPs,PCDDs/DFs, PCBs), two emerging POPs (PBDEs and PFAs), and twopotential POPs (APs and PAHs) in the South Korean environment werereviewed (Table 2.1 and 2.2). Among the 17 POPs, the most studiedpollutant was determined to be chlorinated dioxins and dioxin-like com-pounds such as PCDDs/DFs and dioxin-like PCBs for which occurrence,distribution, contamination level, fate, exposure, and control techniqueshave been fairly thoroughly investigated. The literature on dioxin re-search included 42 SCI articles and 57 domestic articles. Because most of

PCDDs/DFs
PCBsOCPs
PAHsAPs
PBDEsPFAs
Num
ber
of li
tera
ture
(n)
0
20
40
60
80
100
120
140131
33
22 17 15
5 5
IJDJ Report Dissertation
Fig. 2.1. Korean literatures collected for meta-analysis of target POPs substances: SCI
article (IJ), Domestic article (DJ), Research report (Report), and PhD dissertation.
Seung-Kyu Kim et al.36
the data originated from 13 laboratories certified for dioxin analysis, thedomestic articles were also included in this survey. Although 80 domesticarticles were reviewed, information from only 33 SCI articles were usedfor the meta-analysis of PCBs, OCPs, and PAHs because they were con-sidered to provide sufficient information to allow us to describe distri-bution and concentrations in the environment. Most of these articlesreported concentrations in the environment as well as possible sources. Inaddition to legacy POPs, we also reviewed information on emergingcontaminants of concern. Data on alkylphenols were extracted from 11SCI articles and 4 reports; PBDEs from 2 SCI articles, 1 domestic article,and 2 reports; PFAs from 5 SCI articles. The number and volume of theliterature indicates that the South Korean POP studies have primarilyfocused on legacy POPs (i.e., dioxins, PCBs, and OCPs) while little at-tention is given to emerging POPs (i.e., PBDEs and PFAs).
The physico-chemical properties of these POPs are illustrated inFig. 2.2. APs and PFAs (hydrophilic substances) are relatively more wa-ter soluble than the legacy POPs, which suggests that these pollutantscould easily reside in water column and then can be carried to remoteareas by hydrospheric movement (Yamashita et al., 2005).
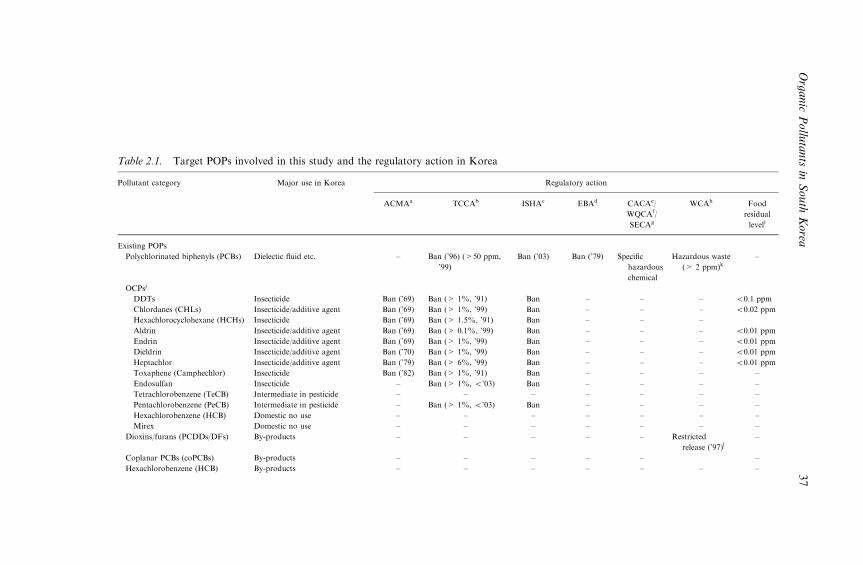
Table 2.1. Target POPs involved in this study and the regulatory action in Korea
Pollutant category Major use in Korea Regulatory action
ACMAa TCCAb ISHAc EBAd CACAe/
WQCAf/
SECAg
WCAh Food
residual
leveli
Existing POPs
Polychlorinated biphenyls (PCBs) Dielectic fluid etc. – Ban (’96) (>50 ppm,
’99)
Ban (’03) Ban (’79) Specific
hazardous
chemical
Hazardous waste
(> 2 ppm)k–
OCPsj
DDTs Insecticide Ban (’69) Ban (> 1%, ’91) Ban – – – o0.1 ppm
Chlordanes (CHLs) Insecticide/additive agent Ban (’69) Ban (> 1%, ’99) Ban – – – o0.02 ppm
Hexachlorocyclohexane (HCHs) Insecticide Ban (’69) Ban (> 1.5%, ’91) Ban – – –
Aldrin Insecticide/additive agent Ban (’69) Ban (> 0.1%, ’99) Ban – – – o0.01 ppm
Endrin Insecticide/additive agent Ban (’69) Ban (> 1%, ’99) Ban – – – o0.01 ppm
Dieldrin Insecticide/additive agent Ban (’70) Ban (> 1%, ’99) Ban – – – o0.01 ppm
Heptachlor Insecticide/additive agent Ban (’79) Ban (> 6%, ’99) Ban – – – o0.01 ppm
Toxaphene (Camphechlor) Insecticide Ban (’82) Ban (> 1%, ’91) Ban – – – –
Endosulfan Insecticide – Ban (> 1%, o’03) Ban – – – –
Tetrachlorobenzene (TeCB) Intermediate in pesticide – – – – – – –
Pentachlorobenzene (PeCB) Intermediate in pesticide – Ban (> 1%, o’03) Ban – – – –
Hexachlorobenzene (HCB) Domestic no use – – – – – – –
Mirex Domestic no use – – – – – – –
Dioxins/furans (PCDDs/DFs) By-products – – – – – Restricted
release (’97)l–
Coplanar PCBs (coPCBs) By-products – – – – – –
Hexachlorobenzene (HCB) By-products – – – – – – –
Organic
Pollu
tants
inSouth
Korea
37

Table 2.1. (Continued )
Pollutant category Major use in Korea Regulatory action
ACMAa TCCAb ISHAc EBAd CACAe/
WQCAf/
SECAg
WCAh Food
residual
leveli
Emerging POPs
Polybrominated diphenyl ethers
(PBDEs)
Flame retardant – – – – – –
Perfluoroalkyl acids (PFAs) Acids of fluoropolymer, rust/oil/
water retardant
Others
Alkylphenols (APs) – – – – – – –
Polycyclic aromatic hydrocarbons
(PAHs)
– – – – – – –
aACMA (Agrochemical Management Act); the ban of registration of pesticides, indicating implicitly the ban of import, manufacture, and selling.bTCCA (Toxic Chemical Control Act); the restricted use (until ’90) and the ban (from ’91) of manufacture, import, and use of non -food additive
agent.cISHA (Industrial Safety and Health Act); the same legal action as TCCA was enacted in 2003.dEBA (Electricity Business Act); the ban of use for electric heater of facilities used PCB -containing dielectic fluid.eCACA (Clean Air Conservation Act); the specific air hazardous chemical.fWQCA (Water Quality Conservation Act); the water quality criteria of PCBs as specific water hazardous chemicals.gSECA (Soil Environment Conservation Act); the air quality criteria of PCBs as specific water hazardous chemicals.hWCA (Waste Control Act); the restriction of waste treatment.iGuideline of Korean Food and Drug Administration (KMOE, 2004).jOCPs (Organochlorine Pesticides).kPCBs as specific hazardous waste should be treated in separated and specific method and reported and confirmed by KMOE administrator.lRelease guideline of waste incinerators (see Table 3).
Seung-K
yuKim
etal.
38

Table 2.2. Target compounds of persistent organic pollutants (POPs) reviewed; PCDDs/
DFs, PCBs, OCPs, PAHs, APs, PDBEs, and PFAs, respectively
Abbreviation Full name
PCDDs/DFs Polychlorinated dibenzo-p-dioxins/-dibenzofurans
TCDD/DF Tetrachlorinated dibenzo-p-dioxin/-dibenzofuran
PeCDD/DF Pentachlorinated dibenzo-p-dioxin/-dibenzofuran
HxCDD/DF Hexachlorinated dibenzo-p-dioxin/-dibenzofuran
HpCDD/DF Heptachlorinated dibenzo-p-dioxin/-dibenzofuran
OCDD/DF Octachlorinated dibenzo-p-dioxin/-dibenzofuran
PCBs Polychlorinated biphenyls
di-CB Dichlorinated biphenyl
tri-CB Trichlorinated biphenyl
tetra-CB Tetrachlorinated biphenyl
penta-CB Pentachlorinated biphenyl
hexa-CB Hexachlorinated biphenyl
hepta-CB Heptachlorinated biphenyl
octa-CB Octachlorinated biphenyl
nona-CB Nonachlorinated biphenyl
deca-CB Decachlorinated biphenyl
OCPs Organochlorine pesticides
CBs Chlorobenzenes
1,2,3,4-TCBZ 1,2,3,4-Tetrachlorobenzene
1,2,4,5-TCBZ 1,2,4,5-Tetrachlorobenzene
PCBZ Pentachlorobenzene
HCB Hexachlorobenzene
HCHs a-, b-, g-, d-Hexachlorocyclohexane
a-HCH a-Hexachlorocyclohexane
b-HCH b-Hexachlorocyclohexane
g-HCH g-Hexachlorocyclohexane (lindane)
d-HCH d-Hexachlorocyclohexane
CHLs Chlordanes
PentaCA Pentachloroanisole
HeptaC Heptachlor
HeptaCE Heptachlor epoxide
OxyCHL Oxychlordane
g-CHL g-Chlordane (trans-Chlordane)
a-CHL a-Chlordane (cis-Chlordane)
cis-nonaC cis-Nonachlor
trans-nonaC trans-Nonachlor
Drins Drins (Aldrin, Dieldrin, Eldrin, Endrin sulfate)
Endosulfan Endosulfan I, II, Endosulfan sulfate
DDTs Dichlorodiphenyl trichloroethanes
o,p0-DDE o,p0-Dichlorodiphenyl dichloroethane
p,p0-DDE p,p0-Dichlorodiphenyl dichloroethane
o,p0-DDD o,p0-Dichlorodiphenyl dichloroethylne
p,p0-DDD p,p0-Dichlorodiphenyl dichloroethylne
o,p0-DDT o,p0-Dichlorodiphenyl trichloroethane
p,p0-DDT p,p0-Dichlorodiphenyl trichloroethane
Organic Pollutants in South Korea 39

Table 2.2. (Continued )
Abbreviation Full name
PAHs Polycyclic aromatic hydrocarbons
NAP Naphthalene
2-MNAP 2-Methylnaphthalene
1-MNAP 1-Methylnaphthalene
BiP Biphenyl
2,6-DiMNAP 2,6-Dimethylnaphthalene
ACY Acenaphthylene
ACE Acenaphthene
2,3,5-TriMNAP 2,3,5-Trimethylnaphthalene
FLU Fluorene
PHE Phenanthrene
ANT Anthracene
1-MPHE 1-Methylphenanthrene
FLT Fluoranthene
PYR Pyrene
BaA Benzo[a]anthracene
CHR Chrysene
BbF Benzo[b]fluoranthene
BkF Benzo[k]fluoranthene
BeP Benzo[e]pyrene
BaP Benzo[a]pyrene
PER Perylene
I123cdP Indeno[1,2,3-cd]pyrene
DahA Dibenzo[a,h]anthracene
BghiP Benzo[ghi]perylene
APs Alkylphenols
NP Nonylphenol
OP Octylphenol
BP Butylphenol
BPA Bisphenol A
PBDEs Polybrominated diphenyl ethers
penta-BDE pentabromodiphenyl ether
octa-BDE octabromodiphenyl ether
deca-BDE decabromodiphenyl ether
PFAs Perfluorinated alkyl compounds
PFOS Perfluorooctanesulfonate
PFHxS Perfluorohexanesulfonate
PFBS Perfluorobutanesulfonate
PFOSA Perfluorooctanesulfonamide
PFDA Perfluorodecanoate
PFNA Perfluorononanoic acid
PFOA Perfluorooctanoate
PFHpA Perfluoroheptanoate
PFHxA Perfluorohexanoate
Seung-Kyu Kim et al.40

Table 2.2. (Continued )
Abbreviation Full name
Dioxin-like compounds
PCDDs 2378-TCDD, 12378-PeCDD, 123478-HxCDD, 123678-
HxCDD, 123789-HxCDD, 1234678-HpCDD, OCDD
PCDFs 2378-TCDF, 12378-PeCDF, 23478-PeCDF, 123478-
HxCDF, 123678-HxCDF, 123789-HxCDF, 234678-
HxCDF, 1234678-HpCDF, 1234789-HpCDF, OCDF
coPCBs non-ortho PCBs (PCB 77, 81, 126, 169), mono-ortho PCBs
(PCB 105, 114, 118, 123, 156, 157, 167, 189)
Organic Pollutants in South Korea 41
2.3. POPs issues and control strategy in South Korea
Although numerous books and research articles describing the geogra-phy, climate, weather, population, and other national statistics of SouthKorea have been published, we provide a brief overview of these geo-graphical and demographic characteristics of South Korea because thisinformation is pertinent to understand the POPs issue in South Korea.Furthermore, we have provided a historical overview of governmentpolicies and regulations regarding POPs in South Korea. This overviewcovers the history of POPs issue, national strategy for POPs control, andnational surveillance and monitoring in South Korea.
2.3.1. Description of South Korea
2.3.1.1. Geography
The Korean Peninsula is located in the northeastern part of Asia, whichlies between 331N and 431N parallels, 1241E and 1321E meridians bor-dered on the north by China and Russia. South Korea is about 1100 kmlong and 300 km wide with total land area of �222,000 km2, almost thesame size as the United Kingdom. The geomorphology of South Korea ischaracterized by mountains and hills. Such hilly terrain, while occurringmostly in the eastern part of the Korean peninsula accounts for about70% of its territory (Fig. 2.3). More than 3200 islands are scattered alongor near the southern and southwestern coastlines. Due to the many is-lands that make up parts of Korea, the coastal length of the islands(�8600 km) is almost equal to that of main peninsula (�8700 km). Mostof the rivers flow into the Yellow Sea and the South Sea after draining thewestern and southern slopes of the peninsula. POPs study as well as otherregular monitoring programs have covered the far eastern island (i.e.,Dok-do) in the East Sea and the southern Jeju Island.

PCD
Ds/
DFs
PCB
s
OC
Ps
PBD
Es
PAH
s
APs
PFA
s
PCD
Ds/
DFs
PCB
s
OC
Ps
PBD
Es
PAH
s
APs
PFA
s
PCD
Ds/
DFs
PCB
s
OC
Ps
PBD
Es
PAH
s
APs
PFA
s
PCD
Ds/
DFs
PCB
s
OC
Ps
PBD
Es
PAH
s
APs
PFA
s
Hen
ry's
law
con
stan
t (Pa
m3 m
ol-1
)
10-6
10-5
10-4
10-3
10-2
10-1
100
101
102
103
104
Vap
or p
ress
ure
(Pa)
10-8
10-7
10-6
10-5
10-4
10-3
10-2
10-1
100
101
102
103
Solu
bilit
y (m
ol L
-1)
10-12
10-1110-1010-910-810-710-610-510-410-3
10-210-1100101102103104105106
Log
Kow
1
2
3
4
5
6
7
8
9
no d
ata
no d
ata
no d
ata
BPA
Fig. 2.2. Physicochemical properties (at 251C) in literatures of target POPs for the present
study; Mackay et al., 2000; Cetin and Odabasi, 2005; Lau et al., 2006; Bruner et al., 1990;
Park et al., 2002a; Bamford et al., 1999; Paasivirta et al., 1999; Wong et al., 2001; Falconer
and Bidleman, 1994; Braekevelt et al., 2003; Hawker and Connell, 1988.
Seung-Kyu Kim et al.42

Fig. 2.3. Maps of Asia (a) and Korean peninsula: landscape (b) and digital elevation map
(DEM, (c)): Major eight cities with bold character have population over one million. Iron
steel mills located at Pohang, Gwangyang and Incheon, and big industrial complexes at
Incheon, Ulsan, and Masan. Fiber industry complex has been developed in Daegu since
1950. Major rivers are magnified; Han River (1), Kum River (2), Youngsan River (3),
Seomjin River (4), and Nakdong River (5).
Organic Pollutants in South Korea 43

Seung-Kyu Kim et al.44
2.3.1.2. Climate
The climate of South Korea is temperate monsoon, in general, but ge-ographically and seasonally varied. The western coast open to continentalAsia is vulnerable to the influence of the winter monsoon. In contrast, theeastern coast is sheltered from the winter monsoon by the Taebaeksanrange, the backbone mountain of the Korean Peninsula. Winter is dryand cold (�6–71C in January) and is influenced primarily by the Siberianair mass. Summer is hot and humid with temperatures ranging from 23 to271C. The climate is the result of the maritime Pacific high-pressure ridge.Temperatures in all seasons are somewhat less than those that occur atcorresponding latitudes in other continents, such as North America orWestern Europe. Annual precipitation is about 1500mm in the centralregion. More than a half of the total rainfall is concentrated in summer,while precipitation of winter is less than 10% of the total.
2.3.1.3. Population
South Korea, the southern half of the Korean Peninsula, is composed ofSeoul, seven major cities, and nine provinces with a total population ofca. 48 million (2005 Census). Seoul, the capital city of South Korea, isdensly populated (11 million), accounting for about a quarter to the totalpopulation in South Korea. Other seven major cities with population ofgreater than 1 million are Busan, Daegu, Incheon, Gwangju, Daejeon,Ulsan, and Suwon. Since the early 1960s, South Korea has achieved arapid economic growth, which has been termed the ‘Miracle on the HanRiver’. Recently, the size of the economy of South Korea has grown up tobe the 10th largest in the world, and the 3rd largest in Asia, next only toChina and Japan.
Substantial urbanization has followed economic growth. South Koreais one of the countries where available area per capita is the least in theworld (population density of South Korea is 473 km�2). Futher, theconcentration of population density and industries within its urban re-gions (viz. Seoul and seven major cities) has reached serious proportions,accounting for approximately 50% of the total population in only 5.5%of the land area and approximately 55% of the manufacturing industriesin only 11.8% of the land area. In recent years, the government hassought to minimize the urbanization in the capital region, but the trend ofurbanization continues to increase. Urbanization rate, the ratio of pop-ulation in urban area to total population, has increased dramatically,from 28.3% in 1960 to 89.2% in 2004 (KMOE, 2005b). This impliesthat pollution is likely to be localized in urban and industrial areas.

Organic Pollutants in South Korea 45
Furthermore, urbanization means a significant increase in the surfaceswithout vegetation such as asphalt and building cover. Surface conditionscould substantially influence the residence time and fate of POPs in asystem. Agricultural activities, of which the dominant activity is rice cul-tivation, occur primarily in the western and southern areas of the SouthKorean peninsula. Thus, the water quality of the inland rivers is asso-ciated with OCP use history and agricultural products contamination inSouth Korea.
2.3.1.4. Economy and potential hot spots
Heavy industrialization together with urbanization brought by rapideconomic growth has resulted in serious environmental problems in someareas. Now, more than 570 Industrial Complexes (ICs) (30 national ICs,more than 210 regional ICs, and more than 330 agricultural ICs) are inoperation nationwide (http://www.kicox.or.kr). Majority of large scaleICs are located near large coastal cities such as Incheon, Busan, Ulsan,Masan, and Pohang. Since many of the ICs are situated near the largercities, large amounts of industrial wastes together with municipal wastesfrom inland areas are discharged into the coastal regions. Organic con-taminants could also be transported into nearby coastal areas by riversand/or streams. Thus, greater environmental pollution with POPs andEDCs would be expected to occur along the coastal areas of highly in-dustrialized regions.
2.3.2. POPs issues in South Korea
2.3.2.1. History of POPs issues
There have been accidental releases of pollutants that have cause effectson humans and wildlife, such as Yucheng in Taiwan, Yusho in Japan(Ikeda, 1996), PCB contamination of poultry in Belgium (Bernard et al.,1999), Seveso in Italy (Mocarelli, 2001), and dioxin contamination byredistribution and burial of contaminated soils at Love Canal in the USA(Vianna, 1983). However, despite intensive and rapid industrializationand urbanization, such massive POPs related cases have not occurred inSouth Korea. Since the 1990s, monitoring South Korea has rarely foundPOP concentrations as great as parts per million (ppm).
Public concern over POPs (or EDC) was initiated by the dioxin issue,evoked by environmental groups and mass media in the mid-1990s, onwaste incinerators. The public concern was further heightened followingthe reports of adverse effects of tributyl tin (TBT) on mollusks in South

Seung-Kyu Kim et al.46
Korean coastal waters (Shim et al., 2000). The issue of human healtheffects from exposure to POPs, was first investigated relative to releases ofdioxins from incinerators to neighboring residents who claimed to haveexperienced great rates of cancer compared to the control population(CIES, 2002). Whether the ‘increased rate of cancer’ in Pyeongtak areahas truly occurred was not clear in the following and more comprehensivestudy (Pyoungtak City, 2003). Even though there was no clear relation-ship between exposure and adverse outcomes, such as cancer and con-centrations of PCDDs/DFs in blood, there was a relationship betweenproximity to incinerators and the concentrations and patterns ofPCDDs/DFs in soils and blood. Elevated CYP 1B1 enzyme activitywas observed in individuals living near incinerators. In contrast to acuteinhalation exposure, due to the increased consumption rate of fatty foodsuch as fishes and meat in South Korea, another recent concern has beenchronic exposure to POPs through consumption of contaminated food.According to a recent food consumption survey, fish/shellfish and meatconstitute 13% of the total daily intake of food, which is 1280 g d�1
person�1. Particularly, the fish/shellfish consumption rate contributes asmuch as 7% (KREI, 2004) of the total diet. Intake of fish/shellfish andmeat in 1980 represented only 1% and 4%, respectively (Lee, 1982).Cereal intake has decreased, while animal food consumption has in-creased; in which, seafood intake is gradually increasing. Consumption offish/shellfish is thought to be a dominant factor in human exposure toPOPs in South Korea.
2.3.2.2. National strategy for POPs control
Regulatory controls of POPs-containing raw materials or wastes in SouthKorea are based on eight individual acts (Table 2.1). In 2005, one POPsspecific ordinance was presented for registration to effectively enact theuse, distribution, emission/discharge, environmental residual levels, andtreatment and management over the whole life cycle.
The early regulation was focused on classical POPs, namely, the OCPs(Table 2.1). Like many other developed countries, almost all OCPs werebanned from use in South Korea, during the early stages of POPs controlin the late 1960s. The AgroChemical Management Act (ACMA) bannedthe registration of OCPs in 1969, which implies the ban of import, man-ufacture, and sale. After the ban of other OCPs, heptachlor and toxap-hene were widely used as alternatives (see later Fig. 2.9). However, in1980, these two pesticides were also banned from use in South Korea.HCB and mirex were neither imported nor produced in South Koreaas pesticide. Endosulfan, known to affect the central nervous system

Organic Pollutants in South Korea 47
(Paul and Subramaniam, 1997; Roberts et al., 2004), has not been bannedand is still being used. It is know that OCPs were imported and usedillegally for a few years even after the ban. Furthermore, some OCPs areknown to have been used as a non-food additive agent. For example,chlordane was used as an adhesive for plywood and DDTs as an inter-mediate in the production of dicofol. It was not until the 1990s thatregulation of OCPs in South Korea was mandated by the Toxic ChemicalControl Act (TCCA).
PCBs were imported from abroad and their use was legally regulatedfor the first time in 1979. The Electricity Business Act (EBA) prohibitedthe use of electric heaters with PCB-containing dielectic fluids. However,existing PCB-containing articles were allowed to be used for other pur-poses until 1996 when production, import, and use of articles containingconcentrations of PCBs greater than 50 ppm were banned by the TCCA.Waste containing concentrations of PCBs greater than 2 ppm was clas-sified as specific hazardous wastes was treated by special methods listed inthe law, and should be reported to and confirmed by the KMOE.
According to the Stockholm Convention, PCB-containing equipmentssuch as capacitors, condensers, and transformers should be forbiddenfrom use by 2025 and are recommended to be treated by environmentallysound methods by 2028 (Stockholm Convention on Persistent OrganicPollutants, 2001). The South Korea Ministry of Environment (KMOE),South Korea Electric Power Corporation (KEPCO) and six electricpower companies, and three non-governmental organizations (NGO)reached a cooperative and administrative agreement in 2004 for the re-moval of PCBs in South Korea by 2015 (KMOE website). An investi-gation of the domestic status of PCB-containing articles is currently beingconducted.
In spite of the regulations, government actions on POPs began prac-tically only after a public concern on the dioxin release in waste incin-erators in 1997. Since then, the emission of PCDDs/DFs was included inregulations. Recently, in response to the Stockholm Convention, periodicmonitoring has been conducted in South Korea.
The total amount of waste generated in South Korea in 2003 was300,000 ton day�1. Construction waste, a dominant waste-type in SouthKorea, has increased from 16% in 1966 to 49% of the total amount of thewaste currently. Almost 90% of this waste is recycled and just 1.5% isincinerated. Thus, the proportion of solid waste that is incinerated (6%) israther small, relative to other countries in Asia (Fig. 2.4). However, theproportion of municipal and industrial waste that contributes to 17% and34% of the waste that is incinerated has increased continuously. In 1993,the ratio of municipal solid waste (MSW) that was incinerated in South

Year
1992
1993
1994
1995
1996
1997
1998
1999
2000
2001
2002
2003
Num
ber
of in
cine
rato
rs
0
2000
4000
6000
8000
10000
12000
14000
16000
18000W
aste amounts (10
6 ton/yr -1)
0
20
40
60
80
100
120
140LandfillIncinerationRecycleOthersTotal
53
Fig. 2.4. Annual trend of number of all the incinerators in operation (bar plots from Kim
et al., 2002d) and waste amounts treated by each method (symbol-line plots from KMOE &
NIER, 1997, 1998, 1999, 2000, 2001, 2002, 2003) in Korea.
Seung-Kyu Kim et al.48
Korea was about 2.4%, which increased to 14.5% in 2003 (KMOE,2005b). The proportion of industrial waste that is incinerated has in-creased from 1.9% to 7.8% during the same period. The proportion ofwaste that is incinerated is expected to increase in the future as landbecomes more and more developed and lesser land is available for landfill.
Waste incineration is a known source of dioxins and other dioxin-likecompounds. As a part of change in waste management policy since theearly 1990s, many incinerators have been constructed. The number ofincinerators in South Korea reached a maximum of about 16,000 in 1998(from only 100 in 1993). However, it has decreased noticeably to �5000 in2003 since an introduction of stringent dioxin emission regulations for theincinerators in 1997 (Fig. 2.4). The majority of these incinerators (morethan 90%) are small-scale facilities with a capacity of less than 0.2 tonhr�1. Although the number of large-scale incinerators with capacities ofgreater than 4 ton hr�1 is only 0.2% of the total incinerators, the quantityof wastes treated by these large-scale incinerators is over 70% of the totalincernation (Table 2.3). Thus in 1997, the government has started torequire emission control of newly installed municipal incinerators withincineration capacities equal to or greater than 50 ton day�1 (Table 2.4).Since that time, large-scale incinerators have been required to restrictemission of dioxins to less than 0.1 ng I-TEQ Nm�3. Subsequently,

Table 2.3. Temporal trend of the number of incinerators (unit; n) and waste amounts
incinerated (unit; 103 ton yr�1)
Incinerator size References
Year Small Medium Large Total
Incinerator facility (n)a 2000 11,841 394 103 12,338 KMOE, 2001
2001 7697 362 114 8173 KMOE, 2002a
2002 5733 309 126 6168 KMOE website
Incineration amount 2000 328 646 2335 3309 KMOE, 2001
2001 257 848 3481 4586 KMOE, 2002a
2002 322 751 3899 4972 KMOE website
aData were collected in June every year. Final values are less than these.
Organic Pollutants in South Korea 49
medium- and small-scaled incinerators have been included in these reg-ulations (Table 2.4). Now, all the incinerators are required to reduceemissions of dioxins to less than 0.1–10 ng I-TEQ m�3. Under the WasteControl Act (WCA), facilities that incinerate less than 0.025 ton hr�1 areno longer allowed (Kim, 2001). Another provision of the WCA is that allincinerators are obliged to conduct regular monitoring for dioxin-likecompounds: semiannually, annually, and biannually for large, medium,and small scale, respectively. Since these regulations went into effect, thebest available technologies (BAT) such as spray absorber/bag filter (SDA/BF) with lime and activated carbon mixture sprayed into the SDA havebeen applied to incinerators (Kim et al., 2001a) and the number ofsmaller, less economically feasible incinerators has greatly decreased.
In addition to regulations on waste incineration, discharge/emissionguidelines for dioxins released from industrial sources, such as metallur-gical plants, are expected to be established in 2006 (KMOE website). In2005, an administrative agreement on reduction of dioxin emissionthrough industrial processes was adopted by among KMOE, NGOs, andfour industries, including the iron & non-iron metal industry, cementindustry, and chemical industry. The groups agreed to reduce dioxinemission to 70% of that estimated for 2001 by 2008 and 50% by 2010. Toachieve this goal best environmental practice (BEP) in addition to BATwill be adopted.
Establishment of emission and/or discharge guidelines for each sourceand environmental quality criteria for each compartment are legal reg-ulations that have been established to reduce environmental exposure toPOPs. South Korean guidelines and quality criteria are applied to dioxinsfrom municipal waste incinerators, and waste and environmental qualityguideline for PCBs (Table 2.1). The extensive guidelines will be appliedfollowing a ministerial ordinance entitled ‘Specific Act on Management of

Table 2.4. Guideline of dioxins release from waste incinerators (ng I-TEQ m�3)
Waste type Incinerator size Guideline and application date
New incinerator Existing incinerator
Municipal solid waste Category Capacity/application From Jul./97 To Jun./99 To Jun./03 From Jul./03
Large > 50 ton/day 0.1 0.5 0.5 0.1
Other all wastes Category Capacity/application From Jan./01 To Dec./02 To Dec./05 From Jan./06
Large Z4 ton/hr 0.1 20 20 1
2–4 ton/hr 1 40 40 5
Medium/small 0.025–2 ton/hr 5 40 40 10
Hospital/medical waste Category Capacity/application From Aug./04 To Dec./05 To Jun./06 From Jul./07
Large Z4 ton/hr 0.1 0.1a (20)b 0.1 (1) 0.1 (1)
2–4 ton/hr 1 1 (40) 1 (5) 1 (5)
Medium 1–2 ton/hr 1 5 (40) 5 (10) 1 (5)
0.2–1 ton/hr 5 5 (40) 5 (10) 5 (5)
Small 0.025–0.2 ton/hr 5 – 10 (10) 10 (10)
aFor hospital/medical waste incinerators installed between Jan./01 and Jul./04.bFor hospital/medical waste incinerators installed before Jan./01.
Seung-K
yuKim
etal.
50
Organic Pollutants in South Korea 51
Persistent Organic Pollutants including Dioxins (Specific Act for POPscontrol)’ that was recently promulgated (KMOE website). This ordinanceinvolves regulation and activities to reduce exposure to POPs including:(1) prohibition and restriction of production, distribution, and use ofPOPs; (2) establishment of environmental quality guidelines (EQGs) ineach compartment, human tolerable daily intake (TDI), standard oper-ation procedure (SOP), and regular monitoring system; (3) emission con-trol including establishment of emission guidelines and emissioninventories; (4) management of POPs containing waste; and 5) protec-tion of POPs contamination of soils and restoration of POPs-contami-nated soils.
2.3.2.3. National surveillance and monitoring
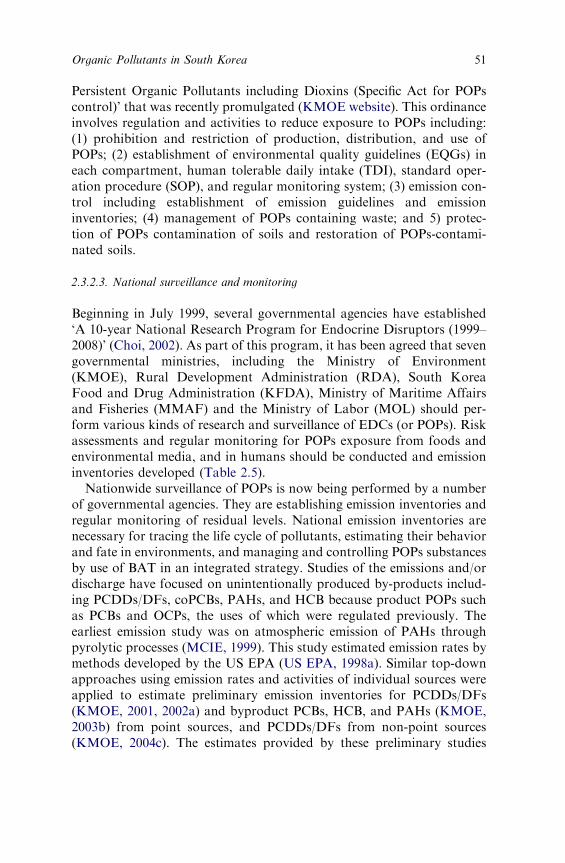
Beginning in July 1999, several governmental agencies have established‘A 10-year National Research Program for Endocrine Disruptors (1999–2008)’ (Choi, 2002). As part of this program, it has been agreed that sevengovernmental ministries, including the Ministry of Environment(KMOE), Rural Development Administration (RDA), South KoreaFood and Drug Administration (KFDA), Ministry of Maritime Affairsand Fisheries (MMAF) and the Ministry of Labor (MOL) should per-form various kinds of research and surveillance of EDCs (or POPs). Riskassessments and regular monitoring for POPs exposure from foods andenvironmental media, and in humans should be conducted and emissioninventories developed (Table 2.5).
Nationwide surveillance of POPs is now being performed by a numberof governmental agencies. They are establishing emission inventories andregular monitoring of residual levels. National emission inventories arenecessary for tracing the life cycle of pollutants, estimating their behaviorand fate in environments, and managing and controlling POPs substancesby use of BAT in an integrated strategy. Studies of the emissions and/ordischarge have focused on unintentionally produced by-products includ-ing PCDDs/DFs, coPCBs, PAHs, and HCB because product POPs suchas PCBs and OCPs, the uses of which were regulated previously. Theearliest emission study was on atmospheric emission of PAHs throughpyrolytic processes (MCIE, 1999). This study estimated emission rates bymethods developed by the US EPA (US EPA, 1998a). Similar top-downapproaches using emission rates and activities of individual sources wereapplied to estimate preliminary emission inventories for PCDDs/DFs(KMOE, 2001, 2002a) and byproduct PCBs, HCB, and PAHs (KMOE,2003b) from point sources, and PCDDs/DFs from non-point sources(KMOE, 2004c). The estimates provided by these preliminary studies

Table 2.5. Governmental investigation projects for POPs in Korea (modified from KMOE website (http://www.me.go.kr/dev/board/)
Target medium Investigation contents Target POPsa Yearb Governmental
institution
References
Emission inventory
Point source Waste incinerators
(n ¼ 1800), metallurgical/
chemical/energy/mineral
production industries
(n ¼ 288)
PCDDs/DFs,
coPCBs
2001–2005 KMOEc KMOE website; NIER, 2000b;
KMOE, 2001, 2002a, b, 2003a,
2004b, 2005a
Non-point
source
Transport, uncontrolled/
residential fuel
combustion, fires etc.
PCDDs/DFs,
coPCBs, HCB
2004– KMOE KMOE, 2004c, 2005a
Products PCBs product and waste, and
OCPs
PCBs, OCPs 2003–2005 KMOE KMOE, 2004a
By-products Unintentional PCBs and
HCB, and PAHs in point
and non-point sources
PCBs, HCB, PAHs 2004–2006 KMOE MCIE, 1999; KMOE, 2003b;
KMOE, 2005a
Monitoring
Environmental
media
Air, freshwater, river/lake
sediment, soil, and fresh
fishes
67 EDCs 1999– NIERd/KMOE NIER, 2000a; 2001; 2002; 2003;
2004; 2005a; KMOE website
Coastal water, sediment, and
sentinel organism (i.e.,
mussel-watch program)
PCDDs/DFs,
coPCBs, PCBs,
OCPs, PAHs etc.
1999– MOMAFe Kim et al., 2002b; Oh et al., 2003;
Hong et al., 2006
Agricultural farm land PCDDs/DFs – RDAf –
Seung-K
yuKim
etal.
52
Multi-media nearby
incinerator (stack gas/
ambient air, discharged/
ambient water, soil,
sediment etc.)
PCDDs/DFs 2003–2008 NIER KMOE website, NIER, 2005b,
Kim et al., 2005b
Food Food items and tolerable
daily intake (TDI)
PCDDs/DFs, PCBs,
PAHs, PBDEs etc.
2000– KFDAg KFDA website
Stock farm products PCDDs/DFs – NVRQSh –
Seafood PCDDs/DFs,
coPCBs, PCBs,
OCPs, PAHs etc.
2001– MOMAF Oh et al., 2005a, Yim et al., 2005,
Moon and Ok, 2006
Seafood for export PCDDs/DFs, PCBs
etc.
2005– NFRQISi MOMAF website
Agricultural farm products PCDDs/DFs – RDA –
Human Human blood and milk PCDDs/DFs 2000– KFDA/NITRj KFDA website
Resident blood nearby waste
incinerators
PCDDs/DFs Intermittently –
aPCDDs/DFs (Dioxins and Furans), coPCBs (coplanar PCBs), PCBs (polychlorinated biphenyls), HCB (hexachlorobenzene), OCPs (organochlorine
pesticides; DDTs, Chlordanes, Dieldrin, Aldrin, Endrin, Heptachlor, Toxaphen, Hexachlorocyclohexane, endosulfan etc.), EDC (Endocrine Dis-
rupting Compounds).bThe duration indicates the duration of measurement performances for emission and monitoring.cKMOE (Korea Ministry of Environment).dNIER (National Institute of Environmental Research).eMOMAF (Ministry of Maritime Affairs and Fisheries).fRDA (Rural Development Administration).gKFDA (Korea Food and Drug Administration).hNVRQS (National Veterinary Research Quarantine Service).iNFRQIS (National Fisheries Products Quality Inspection Service).jNITR (National Institute of Toxicological Research).
Organic
Pollu
tants
inSouth
Korea
53

Seung-Kyu Kim et al.54
may have large uncertainties due to use of emission factors developedabroad. Since 2001, extensive measurements have been made to establishactual inventories of PCDDs/DFs, coPCBs, HCB, by-product PCBs, andPAHs (i.e., benzo[a]pyrene) for both point and non-point sources (Ta-ble 2.5). In 2005, the KMOE announced the first emission inventorieswith a reference year of 2001 for dioxin-like compounds (KMOE web-site). Domestic status on usage and waste management of product POPssuch as PCBs and OCPs have also been investigated since 2003 (KMOE,2004a). In particular, during 2003–2004, the NIER investigated the PCBcontents of 1237 capacitors. They are now contemplating surveying anadditional 3000 capacitors (KMOE website). KMOE plans to investigatePCB-containing capacitors of 130,000 electrical plants between 2005 and2007 (KMOE website).
Several agencies are responsible for the nationwide monitoring of POPs.Long-term monitoring for environmental media includes inland, marine,and agricultural regions (Table 2.5). In this large-scale monitoring pro-gram, the NIER began with the investigation of 37 EDC substances in theinland environment including 43 water sampling stations, 11 river/lakesediment stations, 24 air sites, and 35 soil sites in 1999, The samplingcampaign is continuing and the number of target substances and sites hasbeen expanded every year. For example, since 2000, fishes and amphibianswere included at 31 sites in five main rivers (Jeong et al., 2001a, b; Kim etal., 2004a). The regular monitoring involves PCDDs/DFs, PCBs, OCPs,and alkylphenols. Marine environments are also monitored annually byMOMAF for sea water, sediment, and bivalves along the coastal area, asmussel watch program (Kim et al., 2002b; Oh et al., 2003; Hong et al.,2006). Fishes from coastal environment and/or markets were also inves-tigated for dioxin-like compounds (Oh et al., 2005a; Moon and Ok, 2006)and organochlorines including PCBs and OCPs (Yim et al., 2005). Inaddition to the long-term environmental monitoring described above,more targeted, site-specific monitoring is performed for dioxin-like com-pounds in multi-media (i.e., stack gas, discharged wastewater, and am-bient air/water/soil) around 34 waste incinerators from 2003 to 2008. Inaddition to environmental monitoring, since 2000 foodstuff and humantissues have also been monitored by each responsible governmental in-stitution for stock farm products, seafood, and agricultural farm products.For instance, the KFDA monitors PCDDs/DFs, PCBs, and PAHs infoodstuffs and PCDDs/DFs, PCBs, OCPs, bisphenol A, and PBDEs inhuman tissues (KFDA website). According to the ‘Specific Act for POPscontrol’ the monitoring data from these studies are expected to be inte-grated into assessments of environmental and human risk, and establishenvironmental quality criteria and tolerable daily intake on the basis of

Organic Pollutants in South Korea 55
contamination status and trends in South Korea. While extensive mon-itoring is being performed by governmental agencies, the reported detec-tion limits are insufficient. Improvements in analytical methods applied insome of the monitoring programs will be necessary to provide informationfor meaningful risk and fate assessments.
2.4. POPs emission in South Korea
2.4.1. By-product POPs
POPs are generated as waste itself, or during waste treatment, and fromsynthesis and production of products. Measurements of by-product POPemission began with PCDDs/DFs for waste incinerators in the late 1990sand from 2001 to 2005 have been performed annually at many industrialsources and non-point sources. Other by-product POPs including HCB,BaP, and PCBs were added to these investigations in 2005. The SouthKorean government is planning to perform long-term measurement for‘emission inventories of by-product POPs including PCDDs/DFs, coP-CBs, and HCB’ from 2006 and to report the result biennially.
2.4.1.1. Dioxin-like compounds (PCDDs/DFs and coPCBs)
The emission inventory of dioxin-like compounds in South Korea wasdetermined during two preliminary studies (KMOE, 2001, 2002a). Foremission factors, the preliminary study (KMOE, 2001) adopted measuredvalues for waste incinerators and the values of UNEP chemicals Toolkit(UNEP Chemicals, 2001) for the other sources. Estimated PCDDs/DFsemission in 1999 ranged from 1163 to 1595 g I-TEQ yr�1 due to uncer-tainties in emission factors and activities (Table 2.6). Besides the prelim-inary estimate, since the late 1990s extensive measurements of PCDDs/DFs have been performed at waste incinerators and the emission data by2004 had been compiled for 1800 incinerators. Moreover, nationwideindustrial sources have been investigated every year since 2001; 34 fer-rous/non-ferrous metal production factories in 2001, 114 non-ferrousmetal and mineral production factories in 2002, 73 chemical/energy/landfill factories and crematories in 2003, and 63 municipal wastewatertreatment plants and 9 types of vehicles in 2004. By 2005, measurementsof total dioxin emissions had been made on 288 industrial sources. Basedon these measurements, KMOE made the first official estimate ofPCDDs/DFs emission in South Korea. It has been estimated that thetotal PCDDs/DFs emission was 1021 g I-TEQ yr�1 in 2001 (KMOEwebsite) (Table 2.6). This emission was approximately 62% of that

Table 2.6. Summary of annual inventories of PCDDs/Fs emission in Korea (g I-TEQ yr�1)
Source categorya 1998b 1999c 2001d Conc.e
Waste incineration
Municipal waste (Large, L) 1.47 0.355 163.5 0.02
Municipal waste (Medium, M &
Small, S)
105 327 7.15
Industrial furnace 733 429 728.2 25.3
Construction waste 152
Hazardous waste 126 129–310 6.66
Medical/hospital waste 2.99–7.18 –
Sludge – 0.398–3.98 – –
Total (average) 965.5 1040–1230 891.6 –
Ferrous and non-ferrous metal production
Iron ore sintering – 9.37–125 96.4 0.043
Coke production – 2.86
Iron and steel production plants – 53.8–173
Foundries – 0.049–1.62
Copper production – 0.034 15.0 4.234
Aluminum production (all
secondary)
– – 0.25
Lead production – 0.025–4.00 0.15
Zinc production – – 0.036
Brass production – – –
Magnesium production – – –
Thermal non-ferrous metal
production
– – –
Shredders – – –
Thermal wire reclamation – – –
Total – 66.1–307 111.4 –
Power generation and heating
Fossil fuel power plants – 17.2 9.8 0.019
Biomass power plants – – –
Landfill and biogas combustion – – –
Household heating and cooking
(biomass)
– – – –
Domestic heating (fossil fuels) – 8.39 – 0.074
Total – 25.6 9.8 –
Production of mineral products
Cement kilns – 7.29 3.1 0.095
Lime – 0.196 0.050
Glass – 0.023 0.018
Ceramics – – 0.223
Asphalt mixing – 0.190 –
Total – 7.70 3.1 –
Transport
4-Stroke engines – – (0.057)f 0.138
2-Stroke engines – – (0.187)f
Diesel engines – 0.591 (0.756)f 0.559
Seung-Kyu Kim et al.56

Table 2.6. (Continued )
Source categorya 1998b 1999c 2001d Conc.e
Heavy oil fired engines – 15.2 (13.5)f –
Total – 15.8 (14.5)f –
Uncontrolled combustion processes
Fires/burnings (biomass) – 0.114 – –
Landfill/industrial fires, waste
burning
– 7.32 – –
Total – 7.43 – –
Production of chemicals or consumer goods
Pulp and paper mills (boilers) – 0.046 0.6 0.002
Chemical industry – – 1.538
Total – 0.046 0.6 –
Miscellaneous
Drying of biomass – – – –
Crematory – 0.002–0.403 4.1 0.127
Smoke houses – 0.070–0.704 – –
Dry cleaning residues – – – –
Tobacco smoking (pg item�1) – 0.009 – –
Total – 0.081–1.12 4.1 –
Total – 1163–1595 1021 (1036)f –
aUNEP Chemicals (2001).bModified from NIER (2000b) by considering gas amount emitted per unit ton for different
incinerator type and size.cKMOE (2001); Emission estimated from top-down approach. Ranges are estimated when
varying incinerators’ activities (i.e., emission gas amount per ton) or emission factor.dWebsite of MOE (www.me.go.kr/dev/board/); First emission calculated from measure-
ments for point sources (i.e., up to 2001 for waste incinerator and up to 2005 for others).eAverage concentration of stack gas measured at each source since 2000 (ng I-TEQ m�3);
Municipal waste (L) from KMOE (2004a), other waste incinerators from KMOE website,
ferrous and nonferrous metal industry from Yu et al. (2006), transport from KMOE (2005a),
and others from KMOE (2004b).fKMOE (2004c); Results of PCDDs/DFs for non-point sources. Total value in parenthesis
includes the non-point emission.
Organic Pollutants in South Korea 57
reported for 2001 in Japan, a country that has one of the largest releasesworldwide (JMOE website).
A major contributor of PCDDs/DFs release to environments is wasteincinerators (77–89% in preliminary study and 86% in follow-up studies)followed by 6–19% from ferrous/non-ferrous metal industry and o5%from others including power generation and heating, mineral production,chemical industry, and non-point sources. Non-point sources like trans-portation and uncontrolled burning processes showed a minimal contri-bution of o2%.
All studies found that more than 70% of PCDDs/DFs released fromwaste incinerations were from industrial waste incinerations including

Seung-Kyu Kim et al.58
industrial waste furnace, construction waste incineration, hazardous andmedical/hospital waste incineration. In particular, small- and/or medium-sized municipal waste incinerators (�30%) were one of the major con-tributors with industrial waste furnaces contributing approximately 35–40% of total dioxin emission. In 2002, the number of small incineratorscomprised 93% of the total number of incinerators, although the amountof waste treated by smaller incinerators was only 6.5% (Table 2.3). Rel-atively great amounts of dioxins were emitted from small- and medium-sized incinerators and industrial incinerators, despite the lesser amount ofwaste treated. This could be due to poor operating conditions, lack ofemission control equipments, and ill management practice. The UNEPestimated the emission of gas per unit ton of waste incinerated to be5000Nm3 ton�1 when BAT, including activated carbon addition andSCR/DeNOx were applied, while the value was estimated to be 10000Nm3
ton�1 for incinerators with poor operating conditions (UNEP Chemicals,2001). In 1999, the amounts of stack gas emissions from domestic incin-erators was 3758–8401 (average ¼ 5230Nm3 ton�1) for large waste incin-erators, 4400–15000 (average ¼ 12000 Nm3 ton�1) for small/medium-incinerators, and 4400–15000 (average ¼ 12000Nm3 ton�1) for industrialfurnaces (KMOE, 2001). Thus, improvements in operating conditions forindustrial furnaces and small/medium-sized incinerators will be necessaryto achieve further reductions in emissions of PCDDs/DFs. In 1998, theEnvironmental Management Corporation measured dioxins and furansreleased from selected incinerators, including various types of incineratorsand reported an estimate of national emission as 446.5 g I-TEQ yr�1. Thisvalue is certainly an underestimated one because of the use of such as-sumptions as best operating conditions for all incinerators (i.e., 5000Nm3
ton�1) (NIER, 2000b). This actual emission rate, based on real operatingconditions as in 1999, would be expected to be 965.5 g I-TEQ yr�1
(KMOE, 2001). Predicted contributions of individual incinerator types todioxin emission were similar with that determined by other studies. Over-all, the studies indicated that PCDDs/DFs emission from waste inciner-ators in South Korea was approximately 1000 g I-TEQ yr�1 (891.6–1230 gI-TEQ yr�1) between the late 1990s and early 2000s (Table 2.6).
Because of the relatively great contribution of waste incineration todioxin emission, since 1997 the South Korean government has regulatedreleases of dioxins from waste incinerators (Table 2.4). Almost all largemunicipal waste incinerators with BAT reduced the dioxin release to ratesthat are less than the emission guideline of 0.1 ng I-TEQ Nm�3 (Ta-ble 2.6). Guidelines have now been established for all types of inciner-ators. Furthermore, incineration in facilities with capacities below0.025 ton hr�1 is prohibited. As a result of this regulation, the number
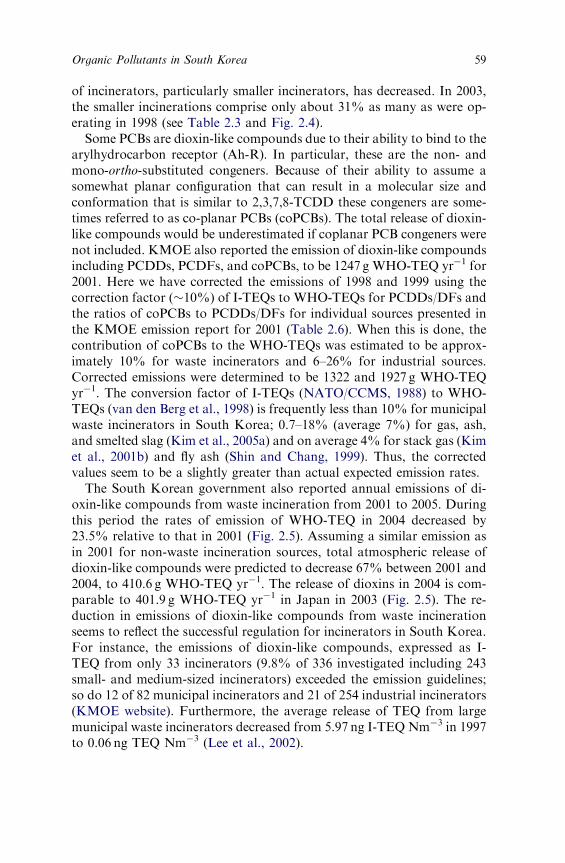
Organic Pollutants in South Korea 59
of incinerators, particularly smaller incinerators, has decreased. In 2003,the smaller incinerations comprise only about 31% as many as were op-erating in 1998 (see Table 2.3 and Fig. 2.4).
Some PCBs are dioxin-like compounds due to their ability to bind to thearylhydrocarbon receptor (Ah-R). In particular, these are the non- andmono-ortho-substituted congeners. Because of their ability to assume asomewhat planar configuration that can result in a molecular size andconformation that is similar to 2,3,7,8-TCDD these congeners are some-times referred to as co-planar PCBs (coPCBs). The total release of dioxin-like compounds would be underestimated if coplanar PCB congeners werenot included. KMOE also reported the emission of dioxin-like compoundsincluding PCDDs, PCDFs, and coPCBs, to be 1247 g WHO-TEQ yr�1 for2001. Here we have corrected the emissions of 1998 and 1999 using thecorrection factor (�10%) of I-TEQs to WHO-TEQs for PCDDs/DFs andthe ratios of coPCBs to PCDDs/DFs for individual sources presented inthe KMOE emission report for 2001 (Table 2.6). When this is done, thecontribution of coPCBs to the WHO-TEQs was estimated to be approx-imately 10% for waste incinerators and 6–26% for industrial sources.Corrected emissions were determined to be 1322 and 1927 g WHO-TEQyr�1. The conversion factor of I-TEQs (NATO/CCMS, 1988) to WHO-TEQs (van den Berg et al., 1998) is frequently less than 10% for municipalwaste incinerators in South Korea; 0.7–18% (average 7%) for gas, ash,and smelted slag (Kim et al., 2005a) and on average 4% for stack gas (Kimet al., 2001b) and fly ash (Shin and Chang, 1999). Thus, the correctedvalues seem to be a slightly greater than actual expected emission rates.
The South Korean government also reported annual emissions of di-oxin-like compounds from waste incineration from 2001 to 2005. Duringthis period the rates of emission of WHO-TEQ in 2004 decreased by23.5% relative to that in 2001 (Fig. 2.5). Assuming a similar emission asin 2001 for non-waste incineration sources, total atmospheric release ofdioxin-like compounds were predicted to decrease 67% between 2001 and2004, to 410.6 g WHO-TEQ yr�1. The release of dioxins in 2004 is com-parable to 401.9 g WHO-TEQ yr�1 in Japan in 2003 (Fig. 2.5). The re-duction in emissions of dioxin-like compounds from waste incinerationseems to reflect the successful regulation for incinerators in South Korea.For instance, the emissions of dioxin-like compounds, expressed as I-TEQ from only 33 incinerators (9.8% of 336 investigated including 243small- and medium-sized incinerators) exceeded the emission guidelines;so do 12 of 82 municipal incinerators and 21 of 254 industrial incinerators(KMOE website). Furthermore, the average release of TEQ from largemunicipal waste incinerators decreased from 5.97 ng I-TEQ Nm�3 in 1997to 0.06 ng TEQ Nm�3 (Lee et al., 2002).

g TEQ yr-1
050
010
0015
0020
0025
0030
00
TurkeySlovenia
Slovak RepublicRomania
PolandMalta
LithuaniaLatvia
HugaryEstonia
Czech RepublicCyprus
BulgariaEU, avg
UKFinlandSwedenPortugal
The NetherlandsNorway
LuxemburgIreland
ItalyGreeceFranceSpain
DenmarkGermany
SwitzerlandBelgium
AustriaJapan (2003)Japan (2000)Korea (2004)Korea (2001) *
µg TEQ yr-1 capita-1
0 10 30 40 50
Japan, 2004Germany
The NetherlandsSpain
EstoniaAustriaSweden
UKEU
LatviaIrelandCyprus
S.Korea, 2004USA
SwitzerlandNorway
MaltaGreece
PortugalDenmark
ItalyHugary
LithuaniaTurkeyFinlandFrance
Japan, 2001Slovenia
PolandLuxemburg
RomaniaBelgium
S.Korea, 2001Czech RepublicSlovak Republic
Bulgaria
mg TEQ yr-1 km-2
0 2 4 6 8 10 12
NorwaySwedenEstoniaFinlandLatvia
USASpain
IrelandAustriaCyprus
LithuaniaGreece
EUGermany
Japan,2004PortugalTurkeyHugary
DenmarkFrance
SwitzerlandThe Netherlands
SloveniaUK
RomaniaItaly
PolandBulgaria
Slovak RepublicLuxemburg
Czech RepublicS.Korea, 2004
Japan, 2001Belgium
MaltaS.Korea, 2001
(a)
(b) (c) (d)
1998
1999
2001
2002
2003
2004
g T
EQ
yr-1
0
1000
2000
3000
4000
1998
1999
2000
2001
2002
2003
1995
Waste IncinerationMetallurgical ProcessesOthers
1995
2000
2005
South Korea Japan USA EU
*
*
*
*
*
1420
Fig. 2.5. Nationwide annual emission inventories to air of dioxin-like compounds in
worldwide countries; (a) Average of emissions of EU countries were used for EU: Korea
1998 and 1999 (recalculated from NIER, 2000b and KMOE, 2001, respectively), Korea
2001–2004 (from KMOE website), Japan (1998–2003) (from (JMOE website), USA 1995
(from US EPA, 1998b), EU 1995 (UNEP, 1999), EU 2000 and 2005 (estimated for 2000 and
projected for 2005 from Quab et al., 2000), (b) emission inventories of 2000 for EU (Quab et
al., 2000) and central European countries (Pulles et al., 2005), (c) and (d) calculated from
values of (b). The emission of South Korea (S. Korea) and Japan is on basis of WHO-TEQ
including PCDDs/DFs and coPCBs, while those of other countries based on I-TEQ of
PCDDs/DFs alone. Population and area of each country were quoted from Wikipedia
website.
Seung-Kyu Kim et al.60

Organic Pollutants in South Korea 61
Despite this decrease, in 2004 the emission rates were greater than thatof some European countries (Fig. 2.5a, b). Particularly, when emissionsof TEQ were normalized by expressing them on a per capita or unit areawhich was 25.7 mg WHO-TEQ capita�1 yr�1 and 12.7mg WHO-TEQkm�2 yr�1 in 2001 (Fig. 2.5c, d). These values are 1.6 and 2.4 timesgreater, respectively, than those of Japan in 2001. The emission per unitarea remains the greatest in the world, even though the value in 2004decreased to 4.2 mg WHO-TEQ km�2 yr�1 (Fig. 2.5d). The relatively greatemission rate suggests that the exposure level at least during recent yearsof South Korean environments and humans has been greater than thatfor other countries.
In spite of the new introduction of emission regulations, waste incin-eration is still a major contributor to dioxin emission (greater than 60%of the total emission) in South Korea. In Europe, however, iron oresintering is the predominant emission source followed by the previous‘No. 1’, municipal waste incineration (Quab et al., 2004). The SouthKorean government also plans to regulate the release from industrialsources. For instance, government, NGO and industries have agreed toreduce the release of TEQ from industrial sources to 70% of the 2001 by2008 and further to 50% by 2010 by establishing release guidelines for theindustrial sources. Banning of small-scale incinerators and enforcing therelease guideline of 0.1 ng Nm�3 for all the waste incinerators is expectedto result in a considerable reduction of the emission. According to theemission reduction scenarios (KMOE, 2001), 92% and 68–83% of theemissions are expected to be reduced from waste incineration and from allsources, respectively. With further application of this release guideline toiron ore sinters and steel electric furnaces, total dioxin emission in SouthKorea are predicted to decrease between 91% and 94%.
Non-point sources are minor contributors (�4% of total emission for2001, 33.96 g I-TEQ yr�1) (KMOE, 2004c). Among non-point sources, ithas been estimated that large ships, using heavy oils, contribute 45% ofthe total emissions from non-point sources. Major harbors could thus beaffected by this source (Cooper, 2005). The releases from landfill leachate,municipal wastewater, and paper/pulp wastewater contribute 2.254 gWHO-TEQ yr�1 (KMOE, 2004c). This is comparable to Japanese emis-sion for 2003 (http://www.env.go.jp/en/press/2004/).
2.4.1.2. PCBs
By-product PCB emission from all potential sources was estimated by the‘top–down’ approach (KMOE, 2003b). This estimate was made for 2000by using emission factors from UK National Atmospheric Emissions

Seung-Kyu Kim et al.62
Inventory (UK NAEI website) and the Co-operative Program for Mon-itoring and Evaluation of the Long Range Transmission of Air pollutantsin Europe (EMEP) workshop (MSC-E, 2002) and an activity database ofindividual sources in South Korea. Estimated emission of by-productPCBs was 1085 kg yr�1 and is likely to be greater than that for manyEuropean countries in 2000 (Fig. 2.6). Considering the greater PCDDs/DFs emission in South Korea than that in European countries, and thesimilar emission sources of both PCDDs/DFs and PCBs, relativelygreater PCBs emission might be reasonable, although the emission esti-mates are associated with large uncertainties. Among the sources, theferrous metal industry was a major contributor, 93% (i.e., �1000 kg yr�1)to the total emissions, followed by fuel combustion (5.9%, 64.2 kg yr�1),waste incineration (1.3%, 14.23 kg yr�1), and others including non-fer-rous/mineral production (o0.01 kg yr�1). A total of 872 kg PCB yr�1 isestimated to be released from electric furnaces producing iron from scrap.This is different from the source profile of Europe where the fuel com-bustion is a major source. All ferrous steel mills are located in coastalareas in South Korea (see Fig. 2.3), suggesting the possibility of con-tamination of localized marine environments with by-product PCBs.
2.4.1.3. HCB
HCB was neither imported nor manufactured in South Korea. Domesticemission, therefore, should originate from process such as combustion oforganic matters combined with chlorine and from impurities in the pro-duction of chemicals and pesticides. HCB emission for 2000 in SouthKorea was estimated in a preliminary study of emission inventory using‘top-down approach’ (KMOE, 2003b). Emissions from some sources in2005 were determined by measuring concentrations in archived samplesoriginally collected for analysis of PCDDs/DFs in 2001–2003 (KMOE,2005a).
Domestic HCB emissions have been estimated to be 245 kg yr�1 for2000, which falls approximately in the mid-range of the values reportedfor EU countries (Fig. 2.6). However, the direct intercomparisons amongthe countries may be misleading due to the varying uncertainties in emis-sion inventories of these countries. According to the preliminary study(KMOE, 2003b), the source contribution of HCB emission is as follows:waste incineration (62%, 152 kg yr�1)4iron ore sinter (19%, 50 kgyr�1)4fuel combustion (14%, 35 kg yr�1)4non-ferrous metal/mineralproduction (3.6%, 8.7 kg yr�1)4transport (1%, 2.4 kg yr�1). Emission ofthe electric furnace for scrap iron was not included in the preliminarystudy. Thus, the contribution of the ferrous metal manufacturing would

PAHs
Emission (ton/yr−1)0 100 200 300 400 500 600
Korea (1995)Korea (2000)
AustriaBulgaria
Czech RepublicFinlandFrance
LituaniaNorwayPoland
SlovakiaSpain
UK
PCBs
Emission (kg/yr−1)
0 500 1000 1500 2000 2500
Korea (2000)
Bulgaria
Czech Republic
France
Lithuania
Monaco
Poland
Slovakia
Slovenia
786HCB
Emission (kg/yr−1)
0 50 100 150 200 250 300 1000 2000 3000 4000 5000 6000
Korea (2000)
Korea (2001)
Austria
Bulgaria
France
Poland
Russia
Spain
UK
waste incinerations product processfuel combustionothers
Fig. 2.6. Annual emission of by-product POPs (PCBs, HCB, and PAHs); Korea 1995
(from MCIE, 1999), Korea 2000 (from KMOE, 2003b); Korea 2001 (from KMOE, 2005a);
Other countries 2000 (from UNECE/EMEP, 2002). PAHs emissions were based on 7 PAHs
for Korea and 6 PAHs for other countries.
Organic Pollutants in South Korea 63

Seung-Kyu Kim et al.64
be greater if released from electric furnaces are included. KMOE (2005a)measured HCB emission in archived samples from ferrous/non-ferrousmetal production, mineral production, chemical and energy productionplants from 2001 to 2003, and some additional metal production facto-ries, wastewater treatment plants, and non-point sources such as boilerand uncontrolled incineration in 2005. The measured emission rate was185 kg yr�1 for 2001 as a reference year (Fig. 2.6). In contrast to thepreliminary estimate, the individual source categories showed fairly evenemission rates; that is, 34% from ferrous/non-ferrous metal production(63 kg yr�1), 28% from fuel combustion (52 kg yr�1), 36% from trans-portation (68 kg yr�1). Iron ore sinter released four times less HCB thanthe estimated value for 2000, while the electric furnaces emitted 30 kgyr�1. This discrepancy indicates that the uncertainty of preliminary es-timates is still great and warrants further emission measurements. Thelater study of actual measurements did not include emission from wasteincineration. Thus, the total HCB emission observed in 2001 would begreater if waste incineration were included as a source. For instance, totalHCB emission would be 337 kg yr�1 if estimates of the preliminary study(ca. 152 kg yr�1) are simply added. Based on an assembled list of potentialsources for HCB, it was estimated that approximately 23000 kg HCB yr�1
(with a range of 12000–92000 kg yr�1) was released in global environ-ments during the mid-1990s (Bailey, 2001). No single major source ofHCB was identified. Uniform contribution from pesticide application(28%), manufacturing (41%), and combustion (30%) were estimated.The contribution of South Korea to global HCB emissions was estimatedto be approximately 1.3%.
2.4.1.4. PAHs
PAHs are not included in the list of ‘dirty dozens POPs’ of the StockholmConvention. However, in addition to 12 existing POPs, UN/ECE (UnitedUnions Economic Commission for Europe) considers PAHs, HCHs,chlorodecone, and hexabromobiphenyl as potential POPs to be restrictedbased on ‘The New Protocol on Persistent Organic Pollutants to theConvention on Long-range Trans-boundary Air Pollution’ adopted in1998. PAHs may be listed as POP in the future Stockholm Convention.
PAHs are released to the environment from a number of sources: py-rogenic sources including fossil fuel combustion and pyrolytic processesof organic matter such as incineration and petrogenic sources such as oilsspills. Direct oil spilled from stationary sources and accidents cause con-tamination of land. Oil spills at US Army bases in South Korea is re-ported as a source of soil and groundwater contamination to nearby area

Organic Pollutants in South Korea 65
and it has been suggested that remediation of these sites is required. Oilspills from ship accidents could be a major source of PAH to the marineenvironment. For example, the supertanker Sea Prince was stranded nearSori Island off the South Coast of South Korea. This accident alonereleased 4160 tons of crude oil and 880 tons of fuel oil into the marineenvironment (Yim et al., 2002).
Two preliminary studies of atmospheric releases of PAHs in SouthKorea have been conducted. The top–down approach was adopted toestimate the emission rate of each source by multiplying the emissionfactor reported by the US EPA (1998a) and the statistics of activities ofthe each source in South Korea (MCIE, 1999; KMOE, 2003b).
The total emissions of seven PAHs including BaA, CHR, BbF, BkF,BaP, DahA, I123cdP (see Table 2.2 for full names), identified by theInternational Agency for Research on Cancer (IARC) as animal carcin-ogens, were 63.4 ton yr�1 for 1995 and 55.3 ton yr�1 for 2000 (Fig. 2.6). Adominant contributor to PAH emissions was found to be coke ovenprocess for the steel manufacturing, emitting over 60% of the totalquantity. Chemical production processes and fuel combustion contrib-uted approximately 10% and 5%, respectively. The total mass of the 16priority or ‘indicator’ PAHs suggested by the US EPA, emitted in SouthKorea during 1995 was estimated to be 768 ton (MCIE, 1999) and 857 tonduring 2000 (KMOE, 2003b). In the two preliminary studies, becausemany sources could not be included due to the lack of information, thetotal emissions were likely to be underestimated. In contrast to SouthKorea, fuel combustion was the predominant source of PAHs in EUcountries. The discrepancy of national PAH emission profile amongcountries depends significantly on its industry patterns. One of the im-portant reasons for the large contribution of coke oven process in Koreais the huge scale production of steel in Korea as compared to most Eu-ropean countries. The steel industry is not only a large emitter of an arrayof pollutants but an energy intensive one, and as a result, it is notblooming in most developed countries. This can be one reason that theinherent emission measurement based on its industrial pattern is requiredfor each country.
2.4.1.5. Comparison of by-product POPs emission inventories
Measurements of emissions of by-product POPs, such as dioxin-likecompounds and HCB have been performed and preliminary estimationsexist for other POPs. However, due to uncertainty in estimations, com-parisons among POPs should be made with caution. Most by-productPOPs are likely to be produced from similar sources, principally pyrolytic

Seung-Kyu Kim et al.66
processes. According to the emission estimates, more than 60% of dioxin-like compounds and HCB were estimated to be emitted from waste in-cinerators, while substantial portions of PCBs and PAHs were releasedfrom metallurgical processes, including electrical furnaces and coke ov-ens, respectively (Fig. 2.7). These waste incineration and the metal pro-duction processes contributed over 80% to the total emission for each of
Percentage, %0 20 40 60 80 100
HCB 16-PAHPCBsDioxins
waste incineration
metallurgical production
non-metal mineral production
chemical industry
fuel combustion
others
Fig. 2.7. Contribution of each emission source to total emission of by-product POPs in
Korea. ‘Dioxins’ includes PCDDs, PCDFs and coPCBs measured in 2001 (see Table 2.6),
and ‘16-PAHs’ means the total emission of EPA priority 16 PAHs. PCBs, HCB, and PAHs
emissions were quoted from the preliminary estimation study (KMOE, 2003b).
Organic Pollutants in South Korea 67
by-product POPs except for PAHs. For PAHs, the secondary contrib-utors were fuel combustion (19%) and oil refineries (15%). This indicatesthat the release of by-product POPs in South Korea can be reducedefficiently by focusing the regulation of these two source categories ofwaste incineration and metallurgical processes.
2.4.2. Product POPs
The governmental works on the emission inventories of product POPs(i.e., PCBs, OCPs, and PBDEs) began only in 2003 as one of the strategieson Stockholm Convention. Preliminary studies (KMOE, 2003b; KMOE,2004a) and investigation campaigns to determine the domestic status ofPCB-containing facilities (KMOE website) are underway. The history ofproduction and use of OCP products and intermediates was recently re-viewed (KMOE, 2004a). Domestic use of PBDEs has been reviewed in areport on the use and import of brominated flame retardants (KMOE,2005c). Distribution and emission of NP as one of APs has been inves-tigated annually by KMOE. However, there is no information on theproduction and or use of PFAs in South Korea.
2.4.2.1. PCBs
The Stockholm Convention stipulates that, use of PCBs-containing ar-ticles should be forbidden after 2025, and it is recommended that PCBstocks (articles and wastes) be destroyed by 2028 by use of environmen-tally sound methods, and that national efforts for removal of PCBsshould be submitted by signatory nations (Stockholm Convention onPersistent Organic Pollutants, 2001). Under an agreement amongKMOE, electric power companies, and three NGO for removal of prod-uct PCBs in South Korea, the domestic use of PCB-containing trans-formers is being investigated nationwide and methods of establishingappropriate collection, storage, and treatment implemented.
A governmental investigation on PCB use is in process in South Korea.However, as no report is available yet, we reviewed the estimation ofBreivik et al. (2002a), which provided the estimates of consumption of 22major PCB congeners for 113 individual countries. These estimates arebased on reports from PCB manufacturers and information on imports,exports, and consumption as well as restriction on production and im-ports, and the population and economic status. The total, historical globalproduction of PCBs has been estimated to be approximately 1.3 milliontons and Monsanto, the manufacturer of the Aroclors, producedabout 50% of the total global production. The estimated cumulative

Seung-Kyu Kim et al.68
consumption of the 22 predominant PCB congeners in South Korearanges from 3000 to 6500 tons (default consumption ¼ 4300 tons), whichranks 16th out of 113 countries for which information is available(Fig. 2.8). This quantity is 2% and 20% of the consumption of the USAand Japan, respectively. Products containing PCBs such as Aroclor,
Fig. 2.8. Consumption (total PCBs’s consumption modified 22 congener’s consumption of
Breivik et al., 2002a; see the text) and emission (sum of 22 congeners from Breivik et al.,
2002b) of PCBs. Two bars in emission plot are the sum of emissions from 1945 to 2000 from
Breivik et al., 2002b (white) and KMOE, 2003b (dark gray). Horizontal lines in the plots
mean the first legal restriction point in Korea, 1979 (EBA; see Table 2.1). Total consumption
of each country (far-right plot) was the sum of annual total PCBs consumption of each
country (modified from the default 22 congeners’ consumption of Breivik et al., 2002a).
Organic Pollutants in South Korea 69
Kaneclor, and Chlophen contain a wide range of congeners. Based onstudies of sources of PCB contamination, the South Korean environmentappears to be contaminated by a mixture of various products. The pre-dominant product was found to be Aroclor 1254 in Incheon, Aroclor 1242in Masan, Aroclor 1260 (or Kanechlor-600) in Ulsan, and Aroclor 1242 inthe Han River (Kim et al., 2000a, 2002b; Kim, 2004; Hong et al., 2006).Breivik et al.’s 22 congeners comprise of only �50% in Aroclor mixture(1242:1254:1260=1:1:1). Using the fact, we could estimate the total PCBsconsumption in South Korea by multiplying a factor of 2 with the in-ventory for 22 congeners. Based on this estimation, total PCBs consump-tion in South Korea was estimated to be 6000–14000 tons (default,9000 tons). When this 2-fold assumption was applied to other countries,the estimated total PCBs consumption was 462000–552000 (default,500000 tons) for the USA and 30600–62200 (default, 47000 tons) for Ja-pan. Assuming a total production of approximately 680000 tons in theUSA (http://www.epa.gov/opptintr/pcb/) with essentially all of the pro-duction used domestically, our estimate matched well with the reportedvalue. Furthermore, historical total consumption in Japan was reported tobe 54000 tons (JEMCAA, 1997). This value is similar to the consumptionestimated in the present study.
Emission of 22 PCB congeners, originating from unintentional useof PCBs-containing product such as accidental releases and disposalsincluding landfill, open burning, waste incinerations, and destruction,has also been estimated (Breivik et al., 2002b). According to theirestimation, the historical release of PCBs to the South Korea hasbeen estimated, based on the 22 indicator congeners, to be 2.5–742 tons(default 53 tons). KMOE (2003b) also estimated the total release ofproduct PCBs to the South Korean environment between 1945 and 2000to be 235 tons by using an emission factor of 0.13 g capita�1 yr�1 aspresented in EMEP/CORINAIR guidebook (EMEP/CORINAIR, 2000).
The primary use of PCBs, over 50%, was in dielectic fluids for trans-former and capacitors (UNEP Chemicals, 1999). Moreover, leakage fromtransformers and capacitors is the major contributor of PCB to the en-vironment (EMEP/CORINAIR, 2000). The South Korean governmentinvestigates PCBs-containing transformers nationwide and providesfunds for development of PCBs waste treatment technologies. The SouthKorea Electric Power Corporation (KEPCO), practically the only elec-tricity company in South Korea, has 1.7 million transformers and 540capacitors (KMOE website). Recent voluntary investigations of electric-ity companies for 1237 transformers revealed that 22% (i.e., 272 trans-formers) contained PCBs at concentrations of greater than 2 ppm,which is the threshold to be categorized as a specific waste by the WCA

Seung-Kyu Kim et al.70
(KMOE website). The number of transformers containing more than50 ppm PCBs, which is the guideline for the prohibition of use set by theTCCA, was 19 (i.e., 1.5%). In another study of 90 transformers (KMOE,2004a), similar results were obtained. That is, 2.2% of transformers con-tained more than 50 ppm PCBs while 22% contained more than 2 ppmPCBs, while 78% of the transformers contained less than 2 ppm PCBs.The KEPCO reports that 13,610 kl of waste dielectic fluids and 394,529 waste transformers occurred in South Korea and 643 tons of PCBs-containing waste was exported between 2000 and 2005.
2.4.2.2. OCPs
The classical OCPs have been restricted from use in South Korea sincethe late 1960s (Table 2.1). OCPs residues currently in the environment areunlikely to have originated from their recent use, they are rather residualsfrom historical applications. Historical production, distribution, andconsumption of seven individual OCPs including DDTs, CHLs, he-ptachlor, aldrin, endrin, dieldrin, and toxaphene for pesticides and ad-ditive agents have been reviewed (KMOE, 2004a). Here, we havecompiled the consumption data reported by KMOE for the OCPs andthose of other studies for HCHs and Endosulfan (Lee, 1982; Jeong et al.,2001c). There is a large uncertainty in the database for OCPs usage inSouth Korea. DDTs and toxaphene consumption estimates from indi-vidual studies varied by a factor of 2 but those for aldrin and heptachlorestimated varied widely. For instance, heptachlor consumption was re-ported to be approximately 600 tons in one study (Lee, 1982), which isonly 4% of the estimate of KMOE.
Total historical consumption of OCPs in South Korea was 31,000 tonswith the following relative proportions: heptachlor (53%)4endosulfan(16%)4aldrin (10%)4DDTs (9%)4HCHs (6%) (Fig. 2.9). DDT, wasthe first OCP applied in South Korea and was widely used from the late1940s to the early 1970s. This pesticide was replaced by other OCPs afterthe toxicity of DDTs to wildlife was known. Use of most OCPs wasbanned in the late 1960s, but less persistent compounds such as he-ptachlor and toxaphene were still used until the early 1980s. Endosulfan isstill used in large quantities in many parts of the world. Endosulfan hasbeen in use for more than three decades. It was introduced as a replace-ment for other more persistent OCPs when they were banned. For ex-ample, about 1000 tons were consumed in South Korea over five-yearperiods from 1971 to 1999 (Jeong et al. (2001c). According to KMOE’sannual report for distribution and emission of industrial hazardouschemicals, 1144 kg of endosulfan was released to atmospheric from

Fig. 2.9. Historical usage amounts of each organochlorine pesticides: DDTs, CHLs, Al-
drin, Endrin, Toxaphene, and Heptachlor from KMOE (2004c), HCHs from Lee (1982), and
Endosulfan from Lee (1982) by 1980 and modified from Jeong et al. (2001c) since 1981.
Total endosulfan use of five years (from Jeong et al. (2001c)) was converted to annual
average amount.
Organic Pollutants in South Korea 71
chemical processes and/or chemical manufacturing processes in SouthKorea. But, the amount released varies among years. For instance, 4 kgwas estimated to be released in 1999 while 819 kg was estimated to havebeen released in 2003. These estimates are associated with great uncer-tainties. Furthermore, it is not certain whether the KMOE report includesreleases of endosulfan from agricultural applications.
The order of contributions of OCPs to the total mass of OCPs meas-ured in bivalves (Kim et al., 2002b) and sediment (Hong et al., 2006), wasDDTs (63%)4HCHs (21%)4CHLs (11%)4dieldrin (1%). A possibleexplanation for this observation is the difference in chemical properties

Seung-Kyu Kim et al.72
among pesticides. The half-lives of DDTs, g-HCH, and CHLs in soil andsediment are 3–10 times longer than those of heptachlor, aldrin, andendosulfan (Mackay et al., 2000; Ghadiri and Rose, 2001). Furthermore,the vapor pressures of heptachlor and aldrin are 10- to 1000-fold greaterthan that of DDT, chlordane, and b-HCH. Since the pesticides wereapplied on land, they may have been volatilized. More volatile pesticideshave shorter residence times in soil and aquatic systems. DDTs andCHLs were used as additive agents even after the ban in use as pesticide.For instance, it has been reported that CHLs were used as an adhesivefor plywood until 1995 (KMOE, 2004a). DDTs were formed as animpurity during the manufacturing of a pesticide, dicofol. Based onthe consumption of dicofol from 1972 to 2002 with the DDT content of0.1% in dicofol, additional releases of DDTs to the environment duringthe three decades was estimated to be 578 kg (KMOE, 2004a). Thisquantity is substantially smaller (0.02%) than its consumption as apesticide until the early 1970s and does not affect the overall estimates ofreleases.
HCB is frequently detected in South Korean environments at concen-trations that are less than DDTs4HCHs4CHLs. HCB was neither im-ported nor produced as a pesticide, but is known to be released into theenvironment at minimal concentrations as a trace contaminant in chlo-rothalonil. Estimated emission on the basis of HCB content (ca.,0.0219%) in chlorothalonil has been, on average, 77 kg yr�1 between1970 and 2004 (KMOE, 2004a). This amount corresponds to between20% and 30% of the emission as a by-product.
In the global estimation the usage of HCH in South Korea has beenestimated to have been between 10,000 and 100,000 tons (Li, 1999).The great estimate was based on an assumption of very great appli-cation rates of 10–40 tons kha�1. However, these estimates appearto be overestimated compared with approximately 2000 tons reportedin other studies (Lee, 1982; Jeong et al., 2001c). This inconsistencycould be due to false information of usage. Indeed, the concentrationsof HCHs in South Korean environments were comparable or lessthan in many other countries. For instance, residual concentrationsin coastal bivalves and sediment ranged from 0.2 to 6.6(median ¼ 0.1 ng g�1 wet wt.) and ND to 5.5 (median ¼ 0.32 ng g�1
dry wt.), respectively.The consumption of OCPs in South Korea can be compared with that
of China, which is one of the largest consumers of pesticides in the world.China has used 200,000 ton yr�1 of total OCPs every year between 1970sand 1980s (Wang et al., 2005). Three major OCPs including HCHs,DDTs, and toxaphene, collectively accounted for 80.1% of total pesticide

Organic Pollutants in South Korea 73
use in 1970. The usage of HCHs and DDTs in 1980 corresponded to 70%and 5%, respectively, of gross pesticide usage.
2.4.2.3. APs
APs mainly originate from the degradation of alkylphenol polyethoxy-lates (APEOs), which are used as nonionic surfactants or detergents inindustries and household products for over 40 years (Shang et al., 1999).APEOs are contained in cleaning products, paints, herbicides, and pes-ticides, and are used to facilitate processes in pulp and paper productionand textile manufacturing (Field and Reed, 1996). APs, including NP andbisphenol A (BPA), have endocrine disrupting activity. In the past 40years, APEOs production was estimated at 4300� 103 ton yr�1 world-wide (White et al., 1994). Primary degradation of APEOs in wastewatertreatment plants or in the environment generates more persistent andtoxic shorter-chain APEOs and APs such as NP, OP, and butylphenol(BP) and AP mono- to triethoxylates than the parent substances (Gigeret al., 1984).
Nonylphenol is a degradation product of nonylphenol polyethoxy-lates (NPEOs), which have been the most widely produced APEOs.NPEOs have a worldwide production of �700� 103 tons annually withwide applications such as industrial and institutional (30%) or house-hold (15%) cleaning agents (Ying et al., 2002; Knepper and Berna,2003; Jonkers et al., 2005), and many other industrial applications in-cluding wetting agents, dispersants, emulsifiers, solublizers, foamingagents, and polymer stabilizers. NPEOs have been discharged into sur-face waters, mostly in wastewater or sewage. Many countries havebanned the usage of APEOs surfactants: for instance, the EuropeanUnion restricted the use of NP and APEOs (Cox and Drys, 2003).Neither inventory efforts nor regulatory action has been taken in SouthKorea.
BPA is used as an intermediate in the manufacture of epoxy resins andpolycarbonate plastics. Global use of BPA is estimated to be more than amillion tons per year with 347� 103 tons yr�1 of estimated use in WesternEurope in 1993 (BUA, 1997). Although BPA is expected to be releasedmainly via sewage and industrial wastewater system (Furhacker et al.,2000), the significant emission is also estimated from combustion sourcessuch as uncontrolled domestic waste burning with �75� 103 kg yr�1 inthe USA (Sidhu et al., 2005). KMOE reports the emission of hazardouschemicals including BPA annually. According to the report, atmosphericemission of BPA was 4446 kg yr�1 in 2002 and 1923 kg yr�1 in 2003(KMOE website).

America
s (19
99)
Europ
e (19
99)
Asia (1
999)
Global
(total
)
Japa
n (19
99)
Japa
n (20
01)
Korea
(200
3)
Con
sum
ptio
n (t
onne
s)
0.0
5.0e+4
1.0e+5
1.5e+5
2.0e+5
2.5e+5TBBLPApenta-BDEsocta-BDEsdeca-BDEs others
Fig. 2.10. Worldwide Brominated Flame Retardants (BFRs) consumption: Americas, Eu-
rope, Asia and Global consumption in 1999 (www.bsef.com), Japan in 1999 and 2001
(Watanabe and Sakai, 2003), and Korea in 2003 (KMOE, 2005c). Korea’s values are not
consumed but imported amounts. However, the consumption amount is estimated to be
similar with this pattern (see the text).
Seung-Kyu Kim et al.74
2.4.2.4. PBDEs
The main types of brominated flame retardants (BFRs) are polybromin-ated biphenyls (PBBs), PBDEs, and tetrabromobisphenol A (TBBPA).PBDEs have replaced PBBs, which are the first brominated organiccompounds to be used as flame retardants and were phased out becauseof environmental issues, but are now being replaced by TBBPA (Renner,2000). The global consumption of BFRs is estimated to be 203425 tons in1999 with PBDEs accounting for 33% (Fig. 2.10). Deca-BDEs, 82% oftotal PBDEs, are the most widely used product. Domestic BFR con-sumption in South Korea in 2002 was 49050 tons, of which 25% (i.e.,12408 tons) was PBDEs with deca-BDE accounting for 12324 tons andpenta- and octa-BDEs accounting for 84 tons (KMOE, 2005c). Importedamounts of each product in 2003 showed a similar distribution to theconsumption estimated in 2002 (Fig. 2.10). In BFR market of WesternEurope, consumption of PBDEs has declined from 26% in 1996 to 11%in 1998 (DEPA, 1999). Penta-BDEs product has been restricted for overone decade and is now banned within Europe. Furthermore, there has

Organic Pollutants in South Korea 75
been a trend to substitute PBDEs with other flame retardants in northernEurope since 1996 (Renner, 2000). However, the market of BFRs inSouth Korea, sharing �56% of flame retardant market, has increasedannually by 13.5% on the average (KMOE, 2005c). In South Korea,PBDEs are regulated under the ‘EcoLabelling policy’.
Possible major sources of BFRs are wastewater effluent and fluegases from BFR factories and other facilities processing BFRs (Watanabeand Sakai, 2003). Additives such as PBDEs may leach from the surfaceof products treated with these compounds, in contrast to TBBPA thatare reactive and chemically bound within the material matrices (deWit, 2002). Based on a model estimate, Danish EPA concluded thatPBDE source is evaporation from products in use (DEPA, 1999). Thus,indirect releases from products should also be considered in emissioninventories.
PBDEs, one of the major types of brominated flame-retardants, areused as additives in polymetric materials such as polystyrenes, plastics,paints, textiles, machines and household electric appliances such as com-puter and television, upholstery, and building materials. CommercialPBDE products consist predominantly of penta-BDEs, octa-BDEs, anddeca-BDEs products. Each product is composed of several congeners.PBDEs is known to cause various adverse effects including neurobehavi-oral development (Darnerud, 2003), thyroid system (deBoer et al., 1999),and, some congeners elicit carcinogenicity (McDonald, 2002). Concen-trations of PBDEs in environments have been rising in contrast to clas-sical POPs whose levels have been declining markedly during the last 20years (de Wit, 2002).
2.4.2.5. PFAs
Concern about per- and poly-fluoroalkyl acids (PFAs) including perflu-orocarboxylates (PFCA) and perfluoroalkylsulfonates (PFAS) is increas-ing due to their persistence, bioaccumulation potential and potentiallytoxicity (i.e., PBT). Due to the presence of the high-energy carbon–flu-orine bond, these compounds are resistant to hydrolysis, photolysis, mi-crobial degradation, and metabolism by vertebrates. The PFAs are alsobioaccumulated and biomagnified through food chains (Kannan et al.,2005; Sinclair et al., 2006). These anthropogenic compounds reportedlyexert various toxic effects, including peroxisome proliferation and po-tential carcinogenicity (Renner, 2001a), accumulation of triglycerides inliver. These compounds have been routinely and globally measuredin environmental matrices; water, wildlife, and human populations(Giesy and Kannan, 2001, Kannan et al., 2004; Yamashita et al., 2005).

Seung-Kyu Kim et al.76
The concentrations of PFAs in environments have increased sharply overtime (Holmstrom et al., 2005). The sorption/accumulation and fate ofPFAs differ from classical chlorinated and brominated POPs in thatperfluorinated molecules have surfactant characteristics (i.e., having polarand nonpolar domains) and oleophobic properties. Thus, PFAs is likelyto bind to serum protein rather than lipid in tissues (Jones et al., 2003).
Because of their chemical stability, surface tension lowering properties,and ability to create stable foams, PFAs are used in a wide variety ofindustrial and commercial applications and processes; metal plating andcleaning, coating formulations, fire-fighting foams, polyurethane produc-tion, inks, varnishes, vinyl polymerization, lubricants, pesticides, surfact-ants, gasoline and oil, and water repellents for leather, paper, and textiles(Holzapfel, 1966). Recent studies report that levels of PFAs precursors,degraded to more toxic and persistent metabolites, are greater in indoorthan outdoor air due to their application to upholstery and carpets(Shoeib et al., 2004, 2005). The global distribution of PFAs has beenhypothesized to be due to volatile neutral precursors of PFCA and PFASthat are distributed via atmosphere, and undergo long-range transport toremote areas, and degrade to yield the free acids (Martin et al., 2002;Renner, 2001b).
Due to their potential PBT properties, the major producer of poly-fluorinated sulfonamidoalcohols in the USA and the only major companyto use the electrochemical fluorination process, 3M, announced a phasingout of these products beginning in 2001. However, many companies in-cluding DuPont (USA), Clariant (Germany), Atofina (France), AsahiGlass (Japan), Daikin (Japan) still produce PFAs such as PFCAs and theproducts are still in use, worldwide.
The global historical industry-wide emissions of total PFCAs since1950 are estimated to be 3200–7300 tons from direct (manufacture, use,consumer products) and indirect (PFCA impurities and/or precursors)sources with the majority (�80%) of fluoropolymer manufacture and use(Prevedouros et al., 2006). Total global production of sulfonated PFA isnot known but global production by the major manufacturer as a rawmaterial in 2002 was approximately 3700 tons (3M Company, 2000).
Little domestic emission inventory of PFAs has been estimated or in-vestigated. However, according to the personal communication with 3M,total PFAs market in South Korea reached a maximum in 2000 since thestead introduction in the mid-1980s and dropped off recently. Most PFAswere imported from 3M, DuPont, Asahi Glass, Daikin, and others, ofwhich over 90% was used as a water repellant for fiber and leather in-dustries. However, the South Korean 3M stopped import of PFAs after2004 following the official phase-out announcement of 3M in 2001.

Organic Pollutants in South Korea 77
PFCAs produced by telomerization process are likely to be the mainPFAs consumed in South Korea. Since the 1950s, a number of textilefactories have operated in Daegu and neighboring Kyeongsangbukdo.The 60–80% of PFAs imported is known to be consumed in these areas.Studies are needed for emission inventory and monitoring of PFAs inenvironments.
2.5. Levels, distribution, and exposure to POPs
2.5.1. Dioxin-like compounds (PCDDs, PCDFs, and coPCBs)
2.5.1.1. Environmental concentrations
Most studies of PCDDs/DFs conducted in South Korea have been fo-cused on air quality (ca. 31%) or human exposure (ca. 28%; residues inhuman body tissues or food items). Concentrations of dioxin-like com-pounds in various environmental media are summarized in Table 2.7. Weprovide information stratified based on location as a source site, back-ground site, or a nationwide indicator site. Concentrations of air rangedfrom ND to 9.946 pg I-TEQ m�3 with median value of 0.124 pg I-TEQm�3. The levels were in the order of nearby site of waste incinerator4in-dustrial area4urban4 rural. Compared with rural air (ND�0.235, me-dian ¼ 0.025 pg I-TEQ m�3), concentrations in air at urban and sourcesites were, on average, 5 and 10 times greater, respectively. Larger citiestend to show greater contamination (Park and Kim, 2002). For example,in two larger cities with populations of over one million the concentrationlevel was from 0.236 to 0.882 pg WHO-TEQ m�3 (n ¼ 6, median ¼ 0.882pg WHO-TEQ m�3) while that of a medium-sized city was 0.103–0.573 pgWHO-TEQ m�3 (median ¼ 0.196 pg WHO-TEQ m�3; n ¼ 8). For threesmall-sized cities with populations of less than 0.3 million, the concen-tration level ranged from 0.017 to 0.18 pg WHO-TEQ m�3 (n ¼ 7, me-dian ¼ 0.072 pg WHO-TEQ m�3). Greater contaminations were alsoobserved in pine needles from larger cities, where concentrations ofPCDDs/DFs were 10-fold greater in the second largest city in SouthKorea, Busan, than that of Jeju, a remote island (Ok et al., 2002). Air ofindustrial cities (n ¼ 102) was more contaminated (twice on average),relative to ambient air of eight major cities with a population over onemillion but with less industrialization (n ¼ 235) (NIER, 2000a, 2001,2002, 2003, 2004, 2005a). For instance concentrations of 0.006–8.450 pg I-TEQ m�3 (median ¼ 0.255) were reported for more industrial cities whilea range of 0.008–2.478 pg I-TEQ m�3 (median ¼ 0.121) for cities with

Table 2.7. Concentrations of PCDDs/DFs in various ambient environmental media in Korea
Sampling Total PCDDs/DFs Referencesa
Sample type Year n Min Max Mean Median
Air pg I-TEQ m�3
Near incinerators (or in industrial complex) 1999–2004 50 nd 9.95 0.56 0.29 (1), (2)
Urban area 1999–2004 408 nd 8.45 0.31 0.13 (3)–(8)
Rural area 1999–2004 42 nd 0.24 0.04 0.03 (2)
Nationwide (NIER) 1999–2004 386 nd 8.45 0.30 0.12 (2)
Soil pg I-TEQ g�1, dw
Near incinerators (o500m) 2000–2004 162 0.01 130 13.6 5.37 (2), (9)–(12)
Near incinerators (>500m) 2000–2004 119 nd 56.45 3.72 1.48 (2), (9)–(12)
Industrial area 1999–2000 18 1.52 120 18.0 9.14 (8)
Nationwide (NIER) 1999–2004 251 nd 65.4 1.08 0.02 (7)
Water pg I-TEQ L�1
Land-fill leachate 1998–2003 33 nd 175 18.4 4.02 (13)–(17)
Industrial/municipal wastewater 1999–2004 78 nd 50.5 1.60 0.006 (2), (18)–(20)
Liver/lake water 1998–2004 298 nd 3.35 0.066 0.007 (7), (15)
Coastal water 2002 5 0.127 0.996 0.377 0.207 (21)
Sediment pg I-TEQ g�1, dw
Freshwater sediment
Outlet of incinerator 2002–2004 9 nd 410 46.8 0.008 (2), (22)
River and lake 1998–2004 94 nd 15.1 0.222 0.009 (23), (24)
Marine sediment
Masan bay 1992 11 0.554 73.7 11.1 2.92 (25)
Pohang bay 2000–2002 20 2.09 15.5 7.89 7.44 (26)
Ulsan bay 2000–2002 22 1.63 5.50 3.45 3.41 (26)
Busan bay 2000–2002 41 1.50 22.1 6.57 5.04 (26)
Jinhae bay 2000–2002 26 1.21 39.6 7.08 3.93 (26)
Seung-K
yuKim
etal.
78

Gwangwang bay 2000–2002 35 0.569 2.12 1.37 1.38 (26)
Pohang bay (coPCBs) 2000–2002 20 0.324 2.67 0.615 0.463 (26)
Ulsan bay (coPCBs) 2000–2002 22 0.667 27.7 6.77 3.55 (26)
Busan bay (coPCBs) 2000–2002 41 0.273 24.0 2.99 1.71 (26)
Jinhae bay (coPCBs) 2000–2002 26 0.139 1.718 0.453 0.299 (26)
Gwangwang bay (coPCBs) 2000–2002 35 0.069 0.278 0.145 0.139 (26)
Organism pg I-TEQ g�1, ww
Freshwater fishes
Han River 1998–2001 20 nd 0.740 0.255 0.205 (15), (27)
Nakdong River 1998–2001 21 0.018 4.10 0.814 0.475 (15), (27)
Kum River 1998–2001 13 nd 0.740 0.152 0.100 (15), (27)
Youngsan River 1998–2001 15 nd 0.430 0.122 0.079 (15), (27)
Other river/stream/wetland 1998–2001 44 nd 3.405 0.514 0.283 (15), (23), (27)
Freshwater frog
Han River 2001 6 0.150 0.615 0.327 0.273 (27)
Nakdong River 2001 6 0.180 1.26 0.682 0.705 (27)
Kum River 2001 4 0.030 0.375 0.201 0.200 (27)
Youngsan River 2001 3 0.220 0.760 0.427 0.300 (27)
Other river/stream/wetland 2001 8 0.010 0.680 0.279 0.205 (27)
Saltwater fish
Masan Bay and Shihwa lake 1991–2000 8 0.027 0.637 0.302 0.348 (4), (28)
Saltwater Bivalvia
Total coast 1996–2002 79 0.019 2.74 0.330 0.217 (26), (29), (30)
West coast 1999 9 0.043 0.760 0.175 0.077 (30)
South coast 1999 9 0.052 1.37 0.295 0.115 (30)
East coast 1999 9 0.026 2.74 0.648 0.239 (30)
Water birds pg I-TEQ g�1, fat
Nakdong River estuary 1992–1994 42 15.8 899 – – (31)
a(1) Oh et al., 2001, (2) NIER, 2005b, (3) Eem et al., 2003, (4) Im et al., 2004, (5) Park & Kim, 2002, (6) Kim et al., 2001a, (7) NIER, 2000a; 2001,
2002, 2003, 2004, 2005a, (8) Oh, 2001, (9) Kim et al., 2002c, (10) Park et al., 2004, (11) Kim et al., 2005b, (12) Kim et al., 2005d, (13) Lee et al., 2000,
(14) Kim et al., 2001d, (15) Jeong et al., 2001a, (16) Choi et al., 2004, (17) KMOE, 2003a, (18) Shin & Jang, 2001, (19) Chung et al., 2001, (20)
KMOE, 2005a, (21) MOMAF, 2003, (22) Pyoungtak City, 2003, (23) Kim & Hong, 2000, (24) Ryoo et al., 2005, (25) Im et al., 2002b, (26) Moon,
2003, (27) Kim et al., 2004a, (28) MOMAF, 2001, (29) Hashimoto et al., 1998, (30) Oh et al., 2003, (31) Choi et al., 2001a.
Organic
Pollu
tants
inSouth
Korea
79

Seung-Kyu Kim et al.80
larger populations, but less industrialized. The population of South Ko-rea tends to be concentrated in urban areas, with 90% of the people livingin cities. Fifty percent of the total national population lives in eight majorcities that occupy only 5.5% of the land area. That results in a populationdensity of approximately 1875 people km�2 for these cities. The popu-lation density and industry of these largest cities generates a patchy dis-tribution of contamination. Thus, human and ecological exposure may bemore serious in these areas.
A concentration in soil, 3720 pg I-TEQ g�1 dw, was found in 1994 nearan open burning site of industrial waste in the Masan Industrial area (Imet al., 2002a). Concentrations of PCDDs/DFs in 569 ambient soils meas-ured since 1999 ranged from less than the limit of quantification to130.4 pg I-TEQ g�1 (average ¼ 5.84 and median ¼ 0.61 pg I-TEQ g�1).Recent monitoring of soils around waste incinerators has revealed that astrong source signature appeared only within a few hundred meters ofincinerators when based on spatial distribution of the concentration(Park et al., 2004; Kim et al., 2005b; NIER, 2005b). Soils from 149 siteswithin 500m from incinerators had concentrations of TEQ that were 5-fold and 14-fold greater than concentrations in soils from more distantlocations; in that study, 124 soils from far sites between 500m and 5 kmfrom incinerators and 281 soils from random sites of non-incineratormeasured nationwide were compared with those close to incinerators,respectively (Table 2.7). When concentrations in the areas near to incin-erators were excluded, the eight major cities (0.045 pg I-TEQ g�1) con-tained in soils average 4-fold greater concentration of PCDDs/DFs thanother cities (median ¼ 0.018 pg I-TEQ g�1). The impact of incineratorson PCDDs/DFs soil contamination will be described in more detail (seepart Section 2.6.1).
As mentioned earlier, direct release of PCDDs/DFs into aquatic sys-tems (2.3 g WHO-TEQ yr�1) is 0.6% of atmospheric release of 401.9 gWHO-TEQ yr�1 in 2004. The release of PCDDs/DFs into water occursvia landfill leachate or discharge of industrial and/or municipal waste-water, particularly paper-mill wastewater. PCDDs/DFs investigated in413 samples ranged from ND to 175 pg I-TEQ L�1. Although concen-trations in some wastewaters discharged from paper-mills or waste in-cinerators exceeded 10 pg I-TEQ L�1 (Japanese standard for effluents),generally wastewaters discharged from incinerators or industrial and/ormunicipal waste treatment plants did not contain concentrations ofPCDDs/DFs that were significantly greater than those of ambient water(two-tailed t-test, p ¼ 0.07). Alternatively, leachates of waste landfill,contained significantly greater concentrations of PCDDs/DFs, relative towastewater and ambient water (one-tailed t-test, po0.01). Particularly,

Organic Pollutants in South Korea 81
leachates contained concentrations of PCDDs/DFs that were more than100-fold greater (median ¼ 4.02 pg I-TEQ L�1, n ¼ 33) than those inambient water (median ¼ 0.007 pg I-TEQ L�1, n ¼ 295). This observa-tion indicates that more studies should focus on the landfill leachates. Nostatistically significant difference was found among five major river sys-tems (ANOVA, p ¼ 0.40). However, it is important to note that thegreatest concentrations were measured in the Han River and the Nak-dong River, two of the longest rivers in South Korea. The river and seawater sampled at the Nakdong River estuary in 2003 contained thegreatest concentrations measured in ambient waters (i.e., �0.3 and0.996 pg I-TEQ L�1, respectively) (MOMAF, 2003). Additionally, sam-ples collected at 31 national monitoring sites for freshwater showed arelative greater concentration in the Han River (median ¼ 0.34 pg I-TEQg�1 ww) and the Nakdong River (median ¼ 0.43 pg I-TEQ g�1 ww) thanother river (median ¼ 0.19 pg I-TEQ g�1 ww) (Kim et al., 2004a).
Concentrations of PCDDs/DFs in sediments have been measured inthree areas, including sediment at the wastewater discharge from wasteincinerators, ambient freshwater sediments, and seawater sediments alongthe coast (Table 2.7). Sediments at the incinerators’ wastewater dischargeexhibited the greatest range of concentrations with concentrations rangingfrom below the limit of quantification to a maximum of 409.6 pg I-TEQg�1 dw. Due to the small number of samples (n ¼ 9), it is impossible todetermine whether the concentrations were significantly greater in sedi-ment at incinerator wastewater discharge. Approximately 77% of theconcentrations of PCDDs/DFs in freshwater sediments (n ¼ 80) were lessthan 0.1 pg I-TEQ g�1. Relatively great concentrations were measured ininland sediment from waterways, into which wastewater from industrialareas is discharged. In particular, a few hundreds of pg I-TEQ g�1 weremeasured in sediment from the Hyungsan River in the vicinity of POSCOI.C. in Pohang city (Koh et al., 2004). This is the largest steel productionfacility in South Korea. Concentrations of PCDDs/DFs in marine sedim-ents from major bays (Pohang, Ulsan, Busan, Jinhae, and Gwangyang)were greater than 1 pg I-TEQ g�1 (Moon, 2003). Concentrations ofPCDDs/DFs in sediments from these five bays were: Pohang (7.24 pg I-TEQ g�1)4Busan (6.55 pg I-TEQ g�1)4Masan (3.88 pg I-TEQ g�1)4Ul-san (3.18 pg I-TEQ g�1)4Gwangyang (1.33 pg I-TEQ g�1) on basis ofmedian value (Moon, 2003). However, contamination of sediments fromUlsan Bay is as serious as Pohang and Busan with median concentrationsof 7–8pg I-TEQ g�1, if coPCBs are included (Table 2.7). Co-planar PCBsaccounted for about 55% and 27% of the total TEQs in surface sedimentsfrom Ulsan and Busan Bays, respectively. These relatively greater con-tributions of coPCBs, compared with o10% for the other bays, indicate

Seung-Kyu Kim et al.82
that PCDDs/DFs contamination may be caused by commercial PCBsformulations at these two bays. The average contamination level for ma-rine sediment along the entire coastal area is likely to be lower because thefive bays are sort of hot spots of POPs contamination in Korea.
coPCBs contributed 490% to total TEQs of dioxin-like compounds inmost PCBs products such as Aroclor, Kanechlor, and Clophen (Waki-moto et al., 1988). Major ‘hot spots’ of PCDDs/DFs in coastal areas suchas big harbor can be influenced by releases of PCBs products. This con-clusion is based on the relative contribution of coPCBs to total TEQs orPCDDs/DFs pattern relative concentrations of congeners measured inthe costal areas samples. Homologue compositions of PCDFs in the morecontaminated sediments, such as those from Masan Bay were similar tothat of commercial PCB products, KC-300 or KC-400 (Im et al., 2002b).Additionally, according to the results of the mussel watch programs from1987 to 1999 (Oh et al., 2003), bivalves collected along the entire coastalarea showed a clear difference in coPCB contribution to total TEQs be-tween 1987–1990 and 1996–1999, and between the larger harbor areasand others. On average 82% of the TEQ was contributed by coPCBs inthe earlier years’ samples (n ¼ 13) but only 32% in more recently col-lected sediments (n ¼ 38). This indicates that concentrations of PCBshave decreased in these areas, instead of concentrations of PCDDs/DFsincreasing over time. In more recently deposited sediments there is agreater contribution from coPCBs relative to PCDDs/DFs in larger har-bors, such as Incheon, Ulsan, Masan, and Busan (see the map in Fig. 2.3).In contrast, mussels from the vicinity near the POSCO facility containedrelatively less contribution (7%) by coPCBs to total TEQs. It has beensuggested that PCB contamination in larger harbors could be ascribed tocommercial formulations used in ship-painting (Hong et al. 2005). Con-sequently, contamination of larger harbors with dioxin-like compoundscould be caused by commercial PCBs products, whereas impact of com-bustion sources seem to be greater in other areas.
There are relatively few reports of concentrations of PCDDs/DFs inwildlife from South Korea. The few available studies are comprised ofmonitoring for: (1) fishes and amphibian in inland rivers and lakes; (2)shellfishes and fishes in coastal region; and (3) birds and pine needles(Table 2.7). Little difference in concentrations of PCDDs/DFs was ob-served between inland fishes and marine shellfishes (two-tailed t-test,p ¼ 0.99). Nevertheless, coastal environments are expected to be moreheavily contaminated considering the possibility that fishes at highertropic levels can bioaccumulate these residues to a greater extent. Forinstance, concentrations of PCBs in shellfishes for 1999 (Kim et al.,2002b) and fishes for 1997 (Yim et al., 2005) sampled along the entire

Organic Pollutants in South Korea 83
coastal area can be compared. Concentrations in fishes were, on average,two-fold greater than those in shellfishes, even though PCBs in fishes weremeasured for major 22 congeners while 104 congeners were analyzed inshellfishes. That is, 4.5–96 ng g�1 ww (average ¼ 23 ng g�1 ww) for fishesvs. 0.27–84.6 ng g�1 ww (average ¼ 12.6 ng g�1 ww) for shellfishes.Among coastal regions, concentrations of PCDDs/DFs greater than0.5 pg I-TEQ g�1 ww was found in bivalves around larger industrialcomplexes such as Incheon, Yeochun, Ulsan, and Pohang (Oh et al.,2003). Together with these areas, bivalves from Masan and Busan ex-ceeded 1 pg WHO-TEQ g�1 ww when including coPCBs TEQs (Oh et al.,2003). Concentrations of TEQs (i.e., PCDDs/DFs TEQs+coPCBsTEQs) in the other coastal regions were less than 0.5 pg WHO-TEQg�1 ww in bivalves (Oh et al., 2003).
Monitoring of residues in fish and amphibians has been performed bythe NIER at 31 sites along major Rivers (Jeong et al., 2001a; Kim et al.,2004a). In two extensive monitoring programs, concentrations of PCDDs/DFs were generally greater in rivers flowing through larger cities andindustrial areas. The order of decreasing concentrations is: NakdongRiver4Han River4other rivers and wetlands. Mountain frogs from theNakdodng River contained the greatest concentrations among amphib-ians from rivers and wetlands investigated (Kim et al., 2004a). Further-more, in the period from 1992 to 1994, concentrations of PCDDs/DFs asgreat as 100pg WHO-TEQ g�1 fat were measured in the subcutaneous fatof water birds from Nakdong River estuary (Choi et al., 2001a).
There was little correlation between PCDDs/DFs (Jeong et al., 2001a)and total PCBs (Jeong et al., 2001b) in the fish samples from 31 inlandsites. Based on the composition of coplanar PCBs congeners, it was pro-posed that contamination of the atmosphere with PCBs could be causedby waste incinerators (Kim et al., 2003b; Kim et al., 2005c). However, thecontribution of waste incinerators to environmental release of byproductPCBs is trivial. Net gaseous exchange of PCBs occurs from water to airand PCB profiles in river sediments resemble that of commercial PCBsproducts (Kim, 2004). Moreover, concentrations of PCB in South Ko-rean air vary with temperature (Yeo et al., 2004a). Based on these ob-servations, concentrations of PCB in South Korean air are unlikely to becontrolled by atmospheric emission (see the part Section 2.6.2.1 for morediscussion). Consequently, concentrations of PCBs in aquatic environ-ments are less dependent on atmospheric concentrations, but more likelydue to direct releases into water. In contrast to PCBs, the major source ofPCDDs/DFs in South Korea is airborne releases, particularly from wasteincinerators. Therefore, the discrepancy between PCBs and PCDDs/DFsresidues in inland fishes could be due to the difference in their sources.
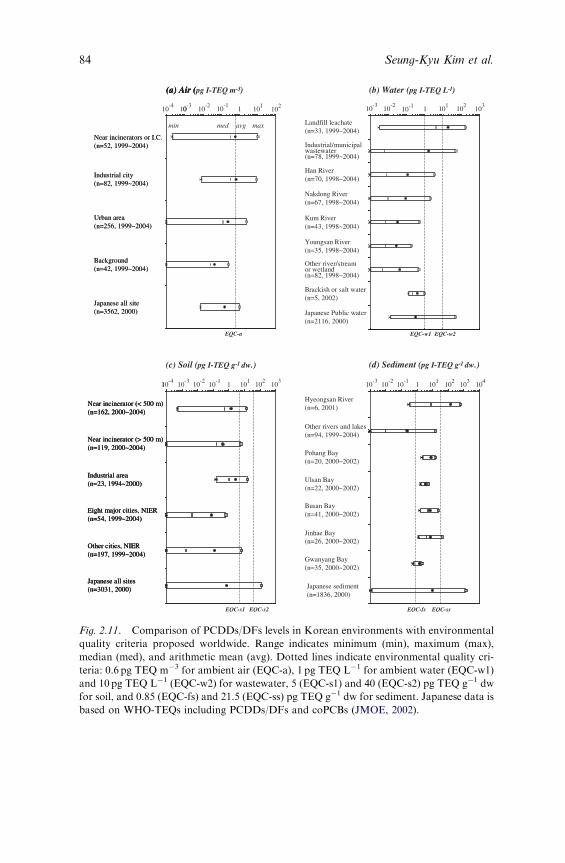
(a) Air (pg I-TEQ m-3)
Near incinerators or I.C.(n=52, 1999~2004)
Industrial city(n=82, 1999~2004)
1
Urban area(n=256, 1999~2004)
Background(n=42, 1999~2004)
min med avg max
EQC-a
Japanese all site(n=3562, 2000)
1
(b) Water (pg I-TEQ L-1)
Landfill leachate(n=33, 1999~2004)
Industrial/municipalwastewater(n=78, 1999~2004)
Han River(n=70, 1998~2004)
Youngsan River(n=35, 1998~2004)
Other river/streamor wetland(n=82, 1998~2004)
Nakdong River(n=67, 1998~2004)
Kum River(n=43, 1998~2004)
Brackish or salt water(n=5, 2002)
EQC-w1 EQC-w2
Japanese Public water(n=2116, 2000)
1 1 101
10-3
10-2
10-1
102
(c) Soil (pg I-TEQ g
Near incinerator (< 500 m)(n=162, 2000~2004)
Near incinerator (> 500 m)(n=119, 2000~2004)
Industrial area(n=23, 1994~2000)
Eight major cities, NIER(n=54, 1999~2004)
Other cities, NIER(n=197, 1999~2004)
EQC-s1 EQC-s2
103
Japanese all sites(n=3031, 2000)
10-3
101 10210-2
10-1
1 103
(d) Sediment (pg I-TEQ g-1 dw.)
Hyeongsan River(n=6, 2001)
Other rivers and lakes(n=94, 1999~2004)
Pohang Bay(n=20, 2000~2002)
Ulsan Bay(n=22, 2000~2002)
Busan Bay(n=41, 2000~2002)
Jinhae Bay(n=26, 2000~2002)
Gwanyang Bay(n=35, 2000~2002)
EQC-fs EQC-ss
104
10-3
101 10210-2
10-1 103
10-3
10110210
-210
-110
-4
Japanese sediment(n=1836, 2000)
(a) Air (
Near incinerators or I.C.(n=52, 1999~2004)
Industrial city(n=82, 1999~2004)
Urban area(n=256, 1999~2004)
Background(n=42, 1999~2004)
min med avg max
Japanese all site(n=3562, 2000)
(a) Air (
0
min med avg max
Near incinerator (< 500 m)(n=162, 2000~2004)
Near incinerator (> 500 m)(n=119, 2000~2004)
Industrial area(n=23, 1994~2000)
Eight major cities, NIER(n=54, 1999~2004)
Other cities, NIER(n=197, 1999~2004)
Japanese all sites(n=3031, 2000)
10-4
Near incinerator (< 500 m)(n=162, 2000~2004)
Near incinerator (> 500 m)(n=119, 2000~2004)
Industrial area(n=23, 1994~2000)
Eight major cities, NIER(n=54, 1999~2004)
Other cities, NIER(n=197, 1999~2004)
Japanese all sites(n=3031, 2000)
-1 dw.)
Fig. 2.11. Comparison of PCDDs/DFs levels in Korean environments with environmental
quality criteria proposed worldwide. Range indicates minimum (min), maximum (max),
median (med), and arithmetic mean (avg). Dotted lines indicate environmental quality cri-
teria: 0.6 pg TEQ m�3 for ambient air (EQC-a), 1 pg TEQ L�1 for ambient water (EQC-w1)
and 10 pg TEQ L�1 (EQC-w2) for wastewater, 5 (EQC-s1) and 40 (EQC-s2) pg TEQ g�1 dw
for soil, and 0.85 (EQC-fs) and 21.5 (EQC-ss) pg TEQ g�1 dw for sediment. Japanese data is
based on WHO-TEQs including PCDDs/DFs and coPCBs (JMOE, 2002).
Seung-Kyu Kim et al.84

Organic Pollutants in South Korea 85
2.5.1.2. Comparison of environmental levels with EQCs
Since the early 1990s, the Japanese government has conducted extensivesurveys of both sources and environmental concentrations of dioxin-likecompounds nationwide (JMOE, 2002). Comparison of concentrationsof residues between South Korea and Japan suggests that concentrationsin air are greater in South Korea than in Japan (Fig. 2.11). However, forother media, concentrations are similar or less in South Korea than inJapan. Intake rates of PCDDs/DFs, expressed as TEQ, by people inSouth Korea is similar to or less than those of people in other countries(see Section 2.5.1.5). As presented earlier, environmental emissions ofdioxin-like compounds per unit area is greater in South Korea than othercountries. Thus, relatively lesser concentrations in the South Korean en-vironment except air seem to be inconsistent with emissions. One possibleexplanation for the inconsistency may be associated with the short historyof waste incineration. The mass balance of PCDDs/DFs has not yet beenthoroughly evaluated. However, according to multi-media modeling, it isevaluated that it takes more than a decade for POPs to reach steady statein soil or sediment (Lee et al., 2004). Waste incineration in South Koreabecame significant only after mid-1990s (Fig. 2.4). Furthermore, since1997, releases from waste incinerators have been regulated. This suggeststhat their levels in soil or sediment may increase with time in the futureunless emission level decreases significantly. Another reason could orig-inate from the possibility that the number and location of the monitoringsites may not be representative.
In South Korea, no environmental quality criteria (EQCs) have beenproposed to protect human health and wildlife from dioxin-like com-pounds. Thus, we compared concentrations of TEQ measured in indi-vidual media with EQCs or benchmarks for PCDDs/DFs proposed byother governments worldwide (Fig. 2.11). Japan proposes EQCs for am-bient air and water of 0.6 pg WHO-TEQ m�3 for air, 1 pg WHO-TEQL�1 for public water and 10 pg WHO-TEQ L�1 for wastewater (JMOE,2002). Since 1999, concentrations of TEQ measured in air from within1 km of waste incinerators and/or industrial area and sites in industrialcities, have exceeded the EQCs established by Japan (0.6 pg WHO-TEQm-3) 22% and 29%, respectively. Alternatively, only 7% of air samplesfrom urban and background sites exceeded the EQCs (Fig. 2.11a). Thisindicates that air quality is poorer in South Korea than in Japan whereonly 1.1% of 920 air samples collected in Japan during 2000 exceededEQC (Shibata, 2002). The EQC values are applied differently, dependingon the objective. Generally, landfill leachates exceeded the EQC (10 pgWHO-TEQ L�1) more frequently (30%) than the wastewaters discharged

Seung-Kyu Kim et al.86
from treatment plants or industrial areas (3.8%). Only two samples of302 fresh and salt waters measured contained concentrations of TEQ thatexceeded the 1 pg WHO-TEQ L�1, which is less than 3.9% of 2116 sitesfor Japanese waters were over the EQC. However, it should be noted thatTEQs contributed by coPCBs were included for Japanese TEQ values butnot for those from South Korea.
EQCs for soils vary among countries from 4 to 1000 pg TEQ g�1 dw.For instance, 1000 pg TEQ g�1 was suggested as the limit for residentialsoils in Japan and the USA but 500 pg TEQ g�1 has been proposed as thecriterion in Finland, 10 pg TEQ g�1 in Sweden, and 4 pg TEQ g�1 inCanada (Schulz, 1993; JMOE, 2002; CCME website). Of the countries,Germany adopts specialized soil EQCs to protect the human health andthe environment for different soil uses (Schulz, 1993). According to theEQCs, no restrictions are placed on use of soils containing less than 5 pgTEQ g�1 dw, precautious use and identification of PCDDs/DFs con-tamination source are required for soils containing between 5 and 40 pgTEQ g�1, and, for soils containing more than 40 pg TEQ g�1, use forcultivation of fruits, legumes, or forage plants is prohibited. Furthermore,soils containing more than 100 pg TEQ g�1 should be removed in play-grounds and, for soils over 1000 pg TEQ g�1, measure should be taken toreduce contact with soil. Since 1999, 10 (ca. 4%) of 251 samples measuredin non-source areas of South Korea exceeded the 5 pg TEQ g�1 criterion.Only two concentrations exceeded 40 pg TEQ g�1. On the contrary, soilsin the vicinity of sources like incinerators or industrial complex frequentlyexceeded 5 pg TEQ g�1 and, to a less degree, exceeded 40 pg TEQ g�1.For instance, 49.4% of soils within 500m of incinerators, 21% of soilsmore than 500m from incinerators, and 69.6% of soils in industrial areas(as in Masan/Changwon I.C. in 1994 and Gwangyang/Yeocheon I.C. in1999 and 2000) were greater than 5 pg TEQ g�1. Soils with greater than40 pg TEQ g�1 over which cultivation is prohibited account for 11.7% forwithin-500m of waste incinerators and 13% for industrial origin as com-pared to only 0.8% of the soils beyond 500m from the incinerators. Twosamples were found to exceed 100 pg TEQ g�1 for both near-incineratorand industrial area. Only one sample near incinerator was measured to be3720 pg TEQ g�1 in 1994. Based on this observation, ambient soils innon-source areas require no restrictions on use. For soils in the vicinity ofsources such as waste incinerators and in industrial complexes, howeverfurther investigation and regulations are needed.
Various sediment quality guidelines (SQGs) and benchmark valueshave been proposed by several states and federal agencies in the USA andother countries. However, none of these benchmarks have been adoptedfor widespread regulatory applications. Concentrations of TEQ in

Organic Pollutants in South Korea 87
sediments of South Korea measured since 1999 were compared withSQGs for PCDDs/DFs proposed by Canadian Council of Ministers ofthe Environment (CCME) to protect human health and wildlife (CCME,1999). CCME proposed 0.85 pg TEQ g�1 dw as an interim guideline and21.5 pg TEQ g�1 as probable effect level for both freshwater and saltwatersediment. Except for sediment from the Hyeongsan River (Koh et al.,2004), none of the concentrations of TEQ in 94 freshwater sedimentsexceeded the probable effect level, over which an incidence of adversebiological effects of 46% would be predicted. Concentrations of TEQ inonly three samples were in the range of 0.85–21.5 pg TEQ g�1, indicating24% incidence of adverse biological effects. Most of the 144 marine se-diments from industrialized or urbanized bays contained concentrationsof TEQ that ranged from 0.85 to 21.5 pg TEQ g�1. The proportion ofTEQ contributed by coplanar PCB was not included for sedimentaryTEQ values in the present study. While concentrations of PCDDs/DFs inSouth Korean environments are generally less than proposed quality cri-teria for ambient environments, but more control is needed for environ-ments in the immediate vicinity of sources.
2.5.1.3. Source identification of PCDDs/DFs in environmental media
For appropriate and cautious use of soils, sources of PCDDs/DFs con-tamination and their impacts should be evaluated. One way to differen-tiate source from ambient sample is the fraction of total PCDDs aregreater in ambient samples than in the source. The ratios of PCDDs areon average 0.59(70.20) and 0.80(70.19) for landfill leachate and ambientwater, respectively. The ratios are 0.53 and 0.81(70.36) for sediment atincinerator wastewater discharge and ambient river/lake sediments, re-spectively. This trend was also observed for soils. The proportion of thePCDDs fraction of TEQ increases with increasing distance from incin-erators with the following proportions: 0.58(70.16) for ashes;0.58(70.17) for soils within 500m from incinerator; 0.74(70.15) forsoils beyond 500m from incinerator; and 0.91(70.18) for ambient soils.The dramatic increase in the proportion of the TEQ attributed to PCDDin the ambient environment results from the phase out of PCDF con-geners and persistence of OCDD (Fig. 2.12). For all environmental me-dia, lesser chlorinated PCDDs/DF congeners are uniformly detected insource samples. However, the less chlorinated congeners are distinctlydepleted in ambient samples while OCDD is enriched. The transition ofthe relative proportions of PCDDs/DFs from the initial source to remoteareas will be discussed in detail (see Section 2.6.1).

frac
tio
n
0.1
0.2
0.3
frac
tio
n
0.0
(a-1) stack gas of incinerator (n=68)
0.1
0.2
0.3
0.0
(a-2) ambient air (n=401)
(b-1) ashes of incinerator (n=25)
0.1
0.3
0.5
0.7
0.9
frac
tio
n
(b-2) ambient soil (n=153)
(c-1) landfill leachate (n=11)
0.1
0.3
0.5
0.7
frac
tio
n
(c-2) ambient water (n=205)
(d-1) incinerator outlet sediment (n=1)
0.1
0.3
0.5
0.7
frac
tio
n
(d-2) ambient inland sediment (n=32)
vs.Source Ambient
(b-1) ashes of incinerator (n=25)(b-1) ashes of incinerator (n=25)(b-1) ashes of incinerator (n=25)
(c-1) landfill leachate (n=11)(c-1) landfill leachate (n=11)(c-1) landfill leachate (n=11)
(d-1) incinerator outlet sediment (n=1)
0.10.1
0.3
0.5
0.7
frac
tio
n
0.1
0.1
0.3
0.5
0.7
frac
tio
n
0.1
0.1
0.3
0.5
0.7
0.9
frac
tio
n
(d-1) incinerator outlet sediment (n=1)(d-1) incinerator outlet sediment (n=1)
Fig. 2.12. Comparison of average fraction profiles in individual media between source and
ambient environments; Data were collected from references in Table 2.7.
Seung-Kyu Kim et al.88
2.5.1.4. Temporal distribution
The decrease in concentrations of PCBs in coastal bivalves, between1987–1990 and 1996–1999 was observed more clearly than that ofPCDDs/DFs (Oh et al., 2003). However, it is not possible to assess tem-poral trend of PCDDs/DFs, because there is little information aboutPCDDs/DFs contamination level for environmental media before the late1990s.
Emission of dioxin-like compounds has decreased progressively sincethe regulation with a 67% decrease between 2001 and 2004 (see Fig. 2.5).

Organic Pollutants in South Korea 89
Thus, it is important to assess whether the decline of emission has resultedin decreases in concentrations in the various environmental compart-ments. The NIER, a principal research organization for environmentalresidue monitoring of POPs in South Korea, has been annually conduct-ing a regular monitoring at 130 sites for ambient media including air,water, sediment, and soil since 1999 (NIER, 2000a, 2001, 2002, 2003,2004, 2005a). There is little available concentration data for temperalvariation of other POPs (i.e., ‘not detected’ for lots of measurementsreported or ‘detected’ in only a specific media) because the detectionlimits were relatively great. Meanwhile, enough monitoring data has beenreported for PCDDs/DFs due to the use of standard operation procedure(SOP) with the state-of-the art analysis technique such as HRGC/HRMSand administrative notification for the Certified Laboratory for PCDDs/DFs analysis since the late 1990s.
In general, concentrations of PCDDs/DFs have decreased in allmedia (Fig. 2.13). Decrease in ambient air was significant with annualincremental decreases observed. For instance, the declines in all ofarithmetic mean, median, and maximum concentrations were signifi-cantly correlated with those in annual emission of individual yearspresented in Fig. 2.5a (r40.7, po0.05). An eight-fold decrease wasobserved over a period of 6 yr. This decline in concentrations of PCDDs/DFs is related to regulation of emissions in South Korea. Becausemost of environmental release occurs primarily into air, residues inother media would also be expected to follow the same declining trendobserved in air.
It seems, however, less clear if decreases in concentrations of PCDDs/DFs have occurred in soils or water. The responding point at which theconcentration in soil begins to decrease is known to be delayed by a fewyears (typically �3–5 years) depending on the emission scenario. Ac-cording to the model performance (Lee, 2005), concentrations in soilscontinues to increase gradually even after regulation, then reaches amaximum in 3rd year after regulation and thereafter decreases. This maybe because of overall atmospheric input (i.e., dry/wet deposition andsorption) to soil is still greater than total output from soil includingvolatilization, run-off, and degradation. It is not until the reversal phaseoccurs between input and output that residue in soil is expected to de-crease. This means that atmospheric concentrations should be reduced upto the level that can result in a decrease in concentrations in the soil.Furthermore, it has been determined that concentrations in soil decreaseslowly due to its strong sorption capacity. Thus, it takes decades forconcentrations to decrease to the half of the original steady state level inrealistic emission reduction conditions (Lee, 2005). It should also be

air
Year
1999 (n=26)
2000 (n=89)
2001(n=104)
2002 (n=132)
2003 (n=35)
2004 (n=35)
1999 (n=43)
2000 (n=86)
2001(n=86)
2002 (n=43)
2003 (n=38)
2004 (n=41)
1999 (n=11)
2000 (n=22)
2001(n=22)
2002 (n=11)
2003 (n=15)
2004 (n=15)
Year
1999 (n=35)
2000 (n=70)
2001(n=70)
2002 (n=35)
2003 (n=33)
2004 (n=38)
0
2
4
6
8
10soil
0
2
4
6
8
10
water
Year
pg I
-TE
Q L
-1
pg I
-TE
Q g
-1
pg I
-TE
Q m
-3
0.0
0.2
0.4
0.6
0.8
1.0sediment
Year
pg I
-TE
Q g
-1 d
w.
0.0
0.2
0.4
0.6
0.8
1.0
1.2
Fig. 2.13. Temporal trend of PCDDs/DFs concentration in individual environmental am-
bient media (NIER, 2000a, 2001, 2002, 2003, 2004, 2005a). The boundary of the box in-
dicates the 25th and 75th percentile, and a line within the box marks the median. Whiskers
above and below the box indicate the 90th and 10th percentiles. Dotted lines and points are
the arithmetic mean and outlying points, respectively. Values in the parenthesis are the
number of samples. Two points and a dotted line of individual media for 2003 indicate
maximum (upper) and minimum (below), and arithmetic mean, respectively. Outliers in
early years (i.e., four for water (1–4 pg I-TEQ L�1) and five for soil (20–70pg I-TEQ g�1))
were excluded.
Seung-Kyu Kim et al.90
noticed that concentrations of PCDDs/DFs in air cannot decrease dra-matically, even after regulation because soil plays a secondary source forair contamination after regulation. Therefore, residues in both soiland air need to be monitored continuously. In brief, considering thetemporal trend of the residues in the media, the distribution and fate of

Organic Pollutants in South Korea 91
PCDDs/DFs in South Korean environments seems to be strongly influ-enced by emissions to the atmosphere (see Section 2.6.2.1).
2.5.1.5. Human exposure
Concentrations of PCDDs/DFs in human blood, adipose and breast milkhave been monitored in the South Korean population. Concentrations ofPCDDs/DFs in tissues of the South Korean population ranged from 0.1to 105 pg I-TEQ g�1 lipid. In spite of the great variation, the averageexposure was 10–20 pg I-TEQ g�1 lipid (Fig. 2.14). This level is within theaverage human background range, 10–30 pg I-TEQ g�1, as suggested byWHO in 1998 (WHO, 1998). The difference in the average exposure be-tween workers and residents living near waste incinerators seems not clearin many cases (Fig. 2.14). However, the exposure may vary with the natureof the work within an incinerator. According to the study of Kim et al.(2005d), the body level was over 60 pg I-TEQ g�1 lipid for incineratorworkers, handling fly ash, or operating and maintaining the incineratorsfor more than 6 years whereas that of new employee or office worker wasabout 10 pg I-TEQ g�1 lipid. This suggests that exposure via inhalationcould be significant for incinerator workers. The residents in urban andindustrial cities showed the body level 2–5 times higher than that of theresidents in remote areas (�4 pg I-TEQ g�1 lipid) (Fig. 2.14). TEQ con-tributed by dioxin-like PCBs (coPCBs) in human blood accounted for�70% of PCDDs/DFs TEQs for both workers and the general popu-lation (Kim et al., 2005e). Thus, when coPCBs are included, the totalTEQ concentration could be approximately two-fold greater.
When excluding accidental or occupational exposure, over 90% ofhuman background exposure to dioxin-like compounds is estimated tooccur through the diet, with food of animal origin being the predomi-nance source (US EPA, 2004). Residues of dioxin-like compounds invarious food items collected from South Korean markets are summarizedin Table 2.8. Fishes and shellfishes bore the greatest concentrations ofTEQ, followed by meat/poultry4dairy product4other non-animal food-items. Considering the gradual increase in animal food consumption from7% of the diet in the late 1970s to 20% in the 2000s, exposure of humansto these toxic compounds would be expected to be greater in more recentyears. In contrast to those in other food-items, contribution of coPCBs tototal TEQ in seafood appeared to be substantial, accounting for 71726%(average7standard deviation). Thus, coPCBs need to be included to as-sess human exposure of dioxin-like compounds.
Average Daily Intake (ADI) via dietary exposure to dioxin-like com-pounds was estimated by multiplying residue concentrations and

42.54
19.09
24.45
10.39
12.32
11.80
57.18
10.39
13.71
12.04
11.14
45.76
15.68
17.19
18.73
16.68
24.02
8.57
12.39
8.10
7.14
5.56
10.85
0 20 40 60 80 100 120
pgI-TEQ g-1 lipid
Human Blood 1) Shihwa-WI worker (n=10), 1999
1) Shihwa-WI residents (n=10), 1999
2) Incheon-citizen, male (n=14), 2000
3) Seoul-MWI worker (n=13), 2001
3) Seoul-MWI resident, male (n=10), 2001
3) Seoul-MWI resident, female (n=12), 2001
4) Pyongtak-LIWI residents (n=10), 2001
5) Seoul-MWI worker (n=13), 2002
5) Seoul-MWI resident (n=16), 2002
6) Pyongtak-LIWI resident, < 5 km (n=40), 2002
6) Pyongtak-LIWI resident, > 5 km (n=20), 2002
6) Ansung-remote resident (n=5), 2002
7) LIWI worker (n=5), 2003
8) Seoul-citizen (n=17), 1994~1995
Adipose Tissue
8) Masan-citizen (n=10), 1995~1996
9) Jinju-citizen, male (n=18), 1994~1995
10) Seoul-citizen (primipara (n=8), 1998
9) Jinju-citizen, female (n=14), 1994~1995
10) Seoul-citizen (multipara) (n=7), 1998
2) Seoul-citizen (n=31), 2000
2) Jeonbuk-citizen (n=35), 2000
11) Seoul-citizen (n=10), 2002
11) Ansan-citizen (n=10), 2002
11) Jeju-citizen (n=10), 2002
Breast Milk
*
*
a
a
aa
bb
max min avg
4.12
Fig. 2.14. PCDDs/DFs residues in Korean human body. The upper- and down-side of bars
indicates minimum and maximum, respectively, and black circles in the center of bars in-
dicate arithmetic means. Exceptionally, the upper- and down-side in ‘a’ bars indicate ‘arith-
metic mean71 standard deviation’ and the arithmetic means alone were presented for ‘b’. ‘*’
means the significant difference PCDDs/DFs residues in between residents around waste
incinerator and incinerator workers (paired t-test, po0.01). Two dotted lines indicate av-
erage human background level suggested by WHO. (1) Yang et al. (2001), (2) Kim et al.
(2000b), (3) Kim et al. (2005e), (4) CIES (2002), (5) Leem et al. (2003), (6) Pyoungtak City,
2003, (7) Kim et al. (2005d), (8) Kang et al. (2002), (9) Kang et al. (1997), (10) Yang et al.
(2002), (11) Kang et al. (2003).
Seung-Kyu Kim et al.92

Table 2.8. Residual levels of dioxin-like compounds in various food-items from South Korea since 1999
Food itemsSample number
(n)
PCDDs/DFs (pg WHO-
TEQ g�1, ww)
coPCBs (pg WHO-TEQ
g�1, ww)
Total TEQs (pg WHO-
TEQ g�1, ww)Referencesa
Cereals 74 ND–0.358b ND–0.005 ND–0.358 (4)–(6), (9)–(11)
(0.0123, 0.0005)c (0.0005, 0) (0.0141, 0.0025)
Vegetables 23 ND–0.046 ND–0.004 ND–0.006 (6), (9)
(0.0037, 0.0010) (0.0007, 0) (0.0020, 0.0010)
Fruits 15 ND–0.008 ND–0.002 ND–0.008 (6), (9)
(0.0042, 0.0048) (0.0004, 0) (0.0045, 0.0048)
Meat/poultry 147 ND–0.454 ND–1.065 ND–1.519 (2)–(11)
(0.0375, 0.0060) (0.0325, 0.0035) (0.0696, 0.0155)
Fish/shellfish 276 ND–7.235 ND–19.037 ND–19.441 (1)–(6), (8)–(12)
(0.2300, 0.0350) (0.7888, 0.2199) (0.9757, 0.2902)
Dairy products 55 ND–0.080 ND–0.195 ND–0.239 (2), (4)–(6), (8)–(11)
(0.0142, 0.0050) (0.0280, 0.0070) (0.0351, 0.0120)
a(1) Oh et al. (2005a), (2) Choi et al. (2002), (3) Kim et al. (2001e), (4) Chae et al. (2004), (5) Kim et al. (2004b), (6) Kim et al. (1999a), (7) Choi et al.
(2001b), (8) Won et al. (2000), (9) Won et al. (2001), (10) Hong et al. (2002), (11) Hong et al. (2003a), (12) Moon and Ok (2006).bRange (minimum–maximum).cAverage value (arithmetic mean, median).
Organic
Pollu
tants
inSouth
Korea
93

Table 2.9. Average daily intakes (ADIs) investigated for market food-items
Food group assessed Collected
year
Percentage of food-
items assessed (%)aADI (pg WHO-TEQ kg(bw)�1 day�1) References
Of
total
Of fish/
shellfish
PCDDs/
DFs
coPCBs Total TEQs
31 Items in 6 food-groups (cereals,
vegetables, fruits, meat/poultry,
dairy products, fishes/
shellfishes)
1999 72.7 26.1 0.63b –c –c Kim et al., 2000c
13 Items in 3 food-groups (cereals,
meat/poultry, fishes/shellfishes)
1999d 28 20 0.26 0.39 0.64 Won et al., 2000
23 Items in 6 food-groups (cereals,
vegetables, fruits, meat/poultry,
dairy products, fishes/
shellfishes)
2000d 52 23.4 0.08 0.23 0.31 Won et al., 2001
23 Items in 3 food-groups (meat/
poultry, dairy products, fishes/
shellfishes)
2001d 34 37.3 0.14 0.78 0.92 Hong et al., 2002
17 Items in 4 food-groups (cereals,
meat/poultry, dairy products,
fishes/shellfishes)
2002d 30 15.3 0.06 0.13 0.19 Hong et al., 2003a
Seung-K
yuKim
etal.
94

40 Fishes/shellfishes 2002–2003 3.6 54.1 0.28 0.4 0.68 Moon & Ok, 2006
32 fishes/shellfishes 2003 5.2 76.7 0.26 0.67 0.93 Lee et al., 2007
14 Items in 4 imported food-
groups (cereals, meat/poultry,
dairy products, fishes/
shellfishes)
2003d 25.3 10 0.04 –c –c Chae et al., 2004
17 Items in 4 food-groups (cereals,
meat/poultry, dairy products,
fishes/shellfishes)
2003d 29 20.2 0.12 0.29 0.41 Kim et al., 2004b
Average food-items (cereals,
vegetables, fruits, meat/poultry,
dairy products, fishes/
shellfishes)
1999–2003 82.1 100 0.08–10.95
(0.42)
0.26–22.6
(0.96)
0.39–25.7
(1.32)
This studye
aAverage daily consumption rate of total food and fishes/shellfishes are 1280 and 86 g capita�1 day�1.bpg I-TEQ kg(bw)�1 day�1.cNot analyzed.dEstimated year from ‘published date minus one year’ because of not presented.eMinimum–maximum (arithmetic mean) which were estimated by assuming as representative residues of individual food groups median, maximum,
and arithmetic mean, respectively, of residual levels in individual food groups presented in Table 2.7.
Organic
Pollu
tants
inSouth
Korea
95

Seung-Kyu Kim et al.96
consumption rate of individual food items. The estimated ADI for SouthKorean people since 1999 ranged from 0.19 to 0.93 pg WHO-TEQ kgbw�1 day�1 (Table 2.9). There existed great uncertainties in these esti-mates because the assessments did not include all food items that SouthKoreans consume daily or did not represent average composition of in-dividual items in food consumption. Most studies involved �30%(�400 g capita�1 day�1) of average daily food consumption rate, ca.1280 g capita�1 day�1. Fishes/shellfishes, containing the greatest concen-trations of dioxin-like compounds among food-groups, were assessed for20% (�17 g capita�1 day�1) of average daily consumption rate, ca. 86 gcapita�1 day�1, in most studies (Table 2.9). Thus, true ADI is likely to begreater than previous estimates. For instance, Lee et al. (2007) estimatedthat ADI was 0.93 pg WHO-TEQ kg(bw)�1 day�1 from fishes/shellfishesalone in which 77% of daily fishes/shellfishes consumption rate was in-cluded. This corresponds to 1.2 pg WHO-TEQ kg(bw)�1 day�1 for allfood items. We also estimated ADI using median, maximum, and arith-metic mean values observed for individual food groups. Assuming that aSouth Korean is exposed to the observed maximum levels for all indi-vidual food groups, ADI would be 25.7 pg WHO-TEQ kg(bw)�1 day�1.Although this exposure rate seems unrealistically great since it mightrepresent a worst-case scenario. If it is assumed that individuals are ex-posed to the arithmetic mean concentration of each residue for all in-dividual food groups, the ADI is estimated to be 1.32 pg WHO-TEQkg(bw)�1 day�1. Since values less than the limit of quantification wereincluded in the database as ‘zero’, ADI calculated using median residueswould underestimate the actual ADI.
Fishes/shellfishes contributed 82% of the ADI, followed by cereals(6.2%), meat/poultry (6.1%), dairy products (3.9%), fruits (1.1%), andvegetables (0.7%). Again, coPCBs accounted for 70% of the total TEQs,implying the significant contribution by seafood. A similar contributionfrom fishes/shellfishes (470% of total TEQs) and coPCBs (460% oftotal TEQs) was also observed in ADI assessments of the Japanese pop-ulation (Tsutsumi et al., 2001; Sasamoto et al., 2006). The contribution ofseafood to total TEQs worldwide varies from a value of less than 6% forthe USA (Charnley and Doull, 2005) and Egypt (Loutfy et al., 2006) tomore than 70% for South Korea, Finland (Kiviranta et al., 2004), andJapan. Major contributors are determined depending on specific con-sumption style in individual nations. For instance, meats and dairy prod-ucts are a major contributor in the diet of people in the USA and Egypt.In South Korea, it is notable that fishes/shellfishes, account for only 6.7%of daily food ingestion, but account for about 80% of total TEQs.Dried anchovy alone accounted for 0.62 pg WHO-TEQ capita�1 day�1

Organic Pollutants in South Korea 97
(Lee et al., 2007). To reduce exposure to dioxin-like compounds, there-fore a change in food consumption pattern may be helpful, together withcontrol of environmental release. In some previous studies (Kim et al.,2000b; Yang et al., 2001; Lee, 2002), the role of fishes/shellfishes wasunderestimated as 37–55% of total TEQs. This is because the co-planarPCBs were excluded from the analysis and many kinds of fishes/shell-fishes were not included from their estimation.
Besides dietary exposure, the daily dioxins intake rate can be also pre-dicted on the basis of its level in breast milk, blood, and adipose tissue asshown in Eq. (1) (WHO, 1998; US EPA, 2000).
EDI ¼Ctissue � 0:693� f 2
h12 � f 1(1)
In this calculation the EDI is an average daily intake estimated (pgTEQ kg(bw)�1 day�1), h1/2 is the half-life of dioxins in human body (day),f1 is the fraction of dioxins absorbed (dimensionless), and f2 is the pro-portion of body fat to weight (dimensionless). These constants were as-sumed to be 7 yrs, 0.9, and 0.3 for h1/2, f1, and f2, respectively. Weestimated EDIs from body residues presented in Fig. 2.14. These EDIs forthe general population except incinerator workers were less than 4 pgWHO-TEQ kg(bw)�1 day�1 (Fig. 2.15). In particular, average EDIs forindividuals of general population ranged from 0.37 pg TEQ kg(bw)�1
day�1 to 2.21 pg TEQ kg(bw)�1 day�1 with a mean of 1.21 pg TEQkg(bw)�1 day�1. These EDIs were predicted using PCDDs/DFs residuesalone and I-TEQ basis. Considering that coPCB can contribute as muchas 70% of the concentration of PCDDs/DFs observed in South Koreanhuman tissues, average EDI is expected to be about 2 pg WHO-TEQkg(bw)�1 day�1. This is greater than the average ADI (i.e., 1.32 pg WHO-TEQ kg(bw)�1 day�1) of dietary intake that had been estimated previ-ously. However, if longer half-lives (h1/2) are applied in the Eq. (1), theaverage EDI including coPCBs will would be less than 2 pg WHO-TEQkg(bw)�1 day�1. Half-life of the TCDD (ca., 7 yr) was used in the presentstudy but those of other congeners are generally 2- to 100-fold longerthan TCDD (Geyer et al., 2002). Based on the ADIs and EDIs estimatedhere, the general South Korean population with an average body weightof 60 kg is expected to ingest dioxin-like compounds of between 60 and120 pg WHO-TEQ per day which is equivalent to the WHO limit of1–2 pg WHO-TEQ kg(bw)�1 day�1. This exposure rate is within the rangeof other countries (Fig. 2.15).
Although the contribution of coPCBs to the ADI was greater than ofthat of PCDDs/DFs, concentrations in humans were relatively small. Thelikely reasons for this include relatively rapid excretion of coPCBs and

0 1 2 3 4 5 6 7 8 9 10
pg TEQ kg (bw)-1 day-1
Human Blood 1) Shihwa-WI worker (n=10), 1999 1) Shihwa-WI residents (n=10), 1999
2) Incheon-citizen, male (n=14), 2000
3) Seoul-MWI worker (n=13), 2001 3) Seoul-MWI resident, male (n=10), 2001 3) Seoul-MWI resident, female (n=12), 2001
4) Pyongtak-LIWI residents (n=10), 2001
5) Seoul-MWI worker (n=13), 2002 5) Seoul-MWI resident (n=16), 2002
6) Pyongtak-LIWI resident, < 5 km (n=40), 2002 6) Pyongtak-LIWI resident, > 5 km (n=20), 2002 6) Ansung-remote resident (n=5), 2002
7) LIWI worker (n=5), 2003
8) Seoul-citizen (n=17), 1994~1995 Adipose Tissue
8) Masan-citizen (n=10), 1995~1996 9) Jinju-citizen, male (n=18), 1994~1995
10) Seoul-citizen (primipara (n=8), 1998
9) Jinju-citizen, female (n=14), 1994~1995
10) Seoul-citizen (multipara) (n=7), 1998
2) Seoul-citizen (n=31), 2000 2) Jeonbuk-citizen (n=35), 2000
11) Seoul-citizen (n=10), 2002
11) Ansan-citizen (n=10), 2002 11) Jeju-citizen (n=10), 2002
Breast Milk
12) USA, 1999-2002 13) Spain, 2001-2003 14) The Netherlands, 1998-1999 15) Sweden, 1999 16) Korea, 1999-2003
18) Japan (Tokyo), 2004 17) Finland, 1997-1998
ADI from food consumption
EDI from body residues
19) Belgium, 2000-2001 20) Japan, 1999-2000 21) Egypt, 2002-2003
avg max min
Fig. 2.15. EDI (Estimated Daily Intake) predicted from human body residues in Fig. 2.14
and ADI (Average Daily Intake) reported worldwide. ADI for Korean was predicted from
average residues of individual food-groups in Table 2.7: (1)–(11) in Fig. 2.14, (12) Charnley
and Doull (2005), (13) Bocio and Domingo (2005), (14) Baars et al. (2004), (15) Darnerud et
al. (2006), (16) this study, (17) Kiviranta et al. (2004), (18) Sasamoto et al. (2006), (19)
Focant et al. (2002), (20) Tsutsumi et al. (2001), (21) Loutfy et al. (2006). Two dotted lines
indicate tolerable daily intake (TDI) guidelines of WHO.
Seung-Kyu Kim et al.98

Organic Pollutants in South Korea 99
change of chemical status during cooking. In 1997 the KFDA established4 pg I-TEQ kg(bw)�1 day�1 as a guideline for the TDI. In 2005, thecommittee for dioxin risk assessment, joined by five governmental min-istries (Ministry of Environment, Ministry of Agriculture and Forestry,Ministry of Maritime Affairs and Fishery, Rural Development Admin-istration, and South Korea Food and Drug Administration), set a plan toestablish EQGs for individual environmental compartment and a newTDI on the basis of domestic contamination and exposure levels.Through this plan, uncertainties in exposure assessment are expected todecrease.
2.5.2. PCBs
Among the POPs reviewed, the PCBs were found to be one of the mostintensively studied compounds following PCDDs/DFs. PCBs are one ofthe classical POPs and have been detected in various environmental me-dia for over the last 30 years worldwide. In South Korea, despite the banin 1970s on the use of PCBs, these compounds were detected in variousenvironmental samples including air, sediment, and aquatic organisms(Table 2.10). In the earlier stages (viz. mid-1990s) of POPs study, effortshad been focused on the coastal contamination (mainly coastal sedim-ents) (Khim et al., 1999b; Lee et al., 2001a). However, later studies havemonitored air, water, freshwater-, brackish-, marine-sediments, andaquatic organisms.
2.5.2.1. Environmental levels
Compared to sediment and aquatic organisms, little is known aboutconcentrations of PCBs in the atmosphere of South Korea. Concentra-tions of total PCBs (gas+particle phase) in the air of Ansung City rangedfrom 0.02 to 0.26 ng m�3, with a mean of 0.07 ng m�3. Gas phase PCBsaccounted for approximately 90% of the total concentration of PCBs,showing that atmospheric PCBs predominantly existed in the gas phase.
As for sediment, various sites from the inland rivers, lakes, and bayshave been investigated since the mid-1990s (Table 2.10). Total PCBsconcentrations measured in freshwater sediments (n ¼ 64) ranged fromless than 1.0 to 141 ng g�1 dw, with a mean range of between 10.5 and38.5 ng g�1 dw for individual regions. Brackish sediment collected fromLake Shihwa contained detectable concentration of PCBs in the survey of1996 (mean ¼ 12.5 ng g�1, dw; n ¼ 4) and 1998 (mean ¼ 4.37 ng g�1, dw;n ¼ 11). Lake Shihwa is an artificial lake created by the construction of12.7 km of sea dike in 1994. In contrast to the limited reports on PCBs in

Table 2.10. Concentrations of total PCBs in the various environmental media in South Korea
Sampling No. of isomers Total PCBs References
Samples From Year n Min Max Mean
Air ng m�3
Gas/particles
Inland (gas) Ansung (rural) 2001–2002 28 24 0.02 0.23 0.06 Yeo et al., 2003
Inland (particle) Ansung (rural) 2001–2002 28 24 0.0004 0.03 0.01 Yeo et al., 2003
Soil ng g�1, dw
Urban soil Seoul 2001 6 20 6.5 12.4 9.8 Kim, 2004
Water ng L�1
Freshwater Han River, Seoul 2001–2003 15 105 0.427 3.27 1.353 Kim, 2004
Wastewater, Incheon 1998 1 105 – – 27.18 Kim et al., 2000a
Saltwater, Incheon 1998 3 105 0.89 11.11 6.16 Kim et al., 2000a
Sediment ng g�1, dw
Freshwater sediment
Westward 2 Rivers, Shihwa 2000 8 98 9.00 122 30.3 Koh et al., 2005
1 River, Han river 2001–2002 25 104 1.76 68 17.3 Kim, 2004
Southward 3 Rivers, Masan 2000 8 98 8.49 92.0 38.5 Koh et al., 2005
1 River, Busan 1999 18 43 1.10 141 18.7 Jeong et al., 2001d
Eastward 2 Rivers, Onsan 1999 8 98 1.00 56.2 15.2 Koh et al., 2002
3 Rivers, Ulsan 1999 14 98 0.56 52.2 10.5 Khim et al., 2001
1 River, Pohang 2000 8 98 1.00 141 31.7 Koh et al., 2004
Brackish sediment
West coast Shihwa lake 1996 4 101 2.71 27.9 12.5 Lee et al., 2001a
Shihwa lake 1998 11 98 1.00 12.3 4.37 Khim et al., 1999a
Seung-K
yuKim
etal.
100
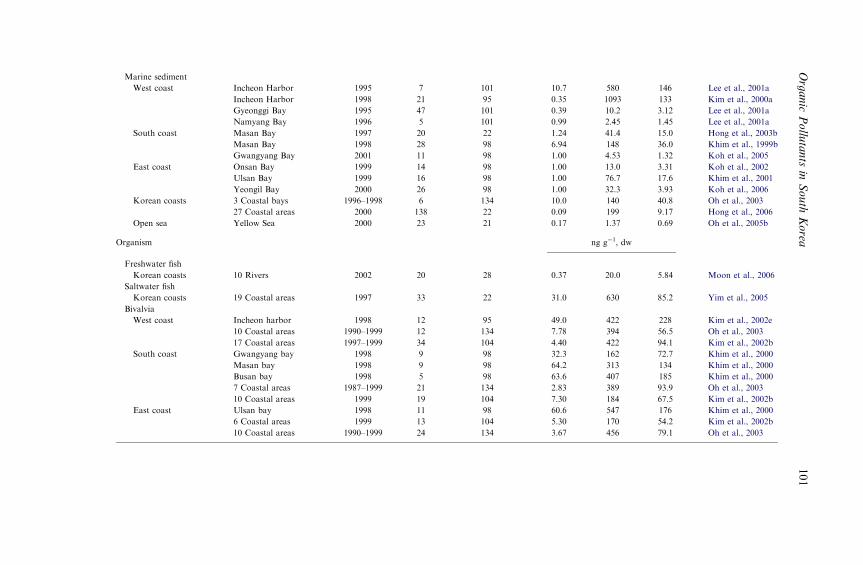
Marine sediment
West coast Incheon Harbor 1995 7 101 10.7 580 146 Lee et al., 2001a
Incheon Harbor 1998 21 95 0.35 1093 133 Kim et al., 2000a
Gyeonggi Bay 1995 47 101 0.39 10.2 3.12 Lee et al., 2001a
Namyang Bay 1996 5 101 0.99 2.45 1.45 Lee et al., 2001a
South coast Masan Bay 1997 20 22 1.24 41.4 15.0 Hong et al., 2003b
Masan Bay 1998 28 98 6.94 148 36.0 Khim et al., 1999b
Gwangyang Bay 2001 11 98 1.00 4.53 1.32 Koh et al., 2005
East coast Onsan Bay 1999 14 98 1.00 13.0 3.31 Koh et al., 2002
Ulsan Bay 1999 16 98 1.00 76.7 17.6 Khim et al., 2001
Yeongil Bay 2000 26 98 1.00 32.3 3.93 Koh et al., 2006
Korean coasts 3 Coastal bays 1996–1998 6 134 10.0 140 40.8 Oh et al., 2003
27 Coastal areas 2000 138 22 0.09 199 9.17 Hong et al., 2006
Open sea Yellow Sea 2000 23 21 0.17 1.37 0.69 Oh et al., 2005b
Organism ng g�1, dw
Freshwater fish
Korean coasts 10 Rivers 2002 20 28 0.37 20.0 5.84 Moon et al., 2006
Saltwater fish
Korean coasts 19 Coastal areas 1997 33 22 31.0 630 85.2 Yim et al., 2005
Bivalvia
West coast Incheon harbor 1998 12 95 49.0 422 228 Kim et al., 2002e
10 Coastal areas 1990–1999 12 134 7.78 394 56.5 Oh et al., 2003
17 Coastal areas 1997–1999 34 104 4.40 422 94.1 Kim et al., 2002b
South coast Gwangyang bay 1998 9 98 32.3 162 72.7 Khim et al., 2000
Masan bay 1998 9 98 64.2 313 134 Khim et al., 2000
Busan bay 1998 5 98 63.6 407 185 Khim et al., 2000
7 Coastal areas 1987–1999 21 134 2.83 389 93.9 Oh et al., 2003
10 Coastal areas 1999 19 104 7.30 184 67.5 Kim et al., 2002b
East coast Ulsan bay 1998 11 98 60.6 547 176 Khim et al., 2000
6 Coastal areas 1999 13 104 5.30 170 54.2 Kim et al., 2002b
10 Coastal areas 1990–1999 24 134 3.67 456 79.1 Oh et al., 2003
Organic
Pollu
tants
inSouth
Korea
101

Seung-Kyu Kim et al.102
freshwater (n ¼ 64) and brackish sediments (n ¼ 15), a relatively largenumber of samples of coastal marine sediment (n ¼ 362) have beenanalyzed. The maximum concentration of total PCBs in marine sedimentwas detected in Incheon Harbor, which had a concentration of 1090 ngg�1 dw in 1998 (Kim et al., 2000a). A recent study by Hong et al. (2006)reported total PCBs concentrations at 138 sites along the South Koreancoasts to range from 0.09 to 199 ng g�1 dw (mean ¼ 9.17). Overall, meanconcentrations of total PCBs in coastal marine sediments in South Korearanged from several to several tens of ng g�1 dw. Considering the de-tectable concentrations of total PCBs (0.17–1.37 ng g�1 dw) at the off-shore sites in the Yellow Sea, widespread contamination is evident even inopen seas.
Several studies have reported concentrations of PCBs in aquatic or-ganisms such as freshwater fish (n ¼ 20), saltwater fish (n ¼ 33), andbivalves (n ¼ 169) (Table 2.10). Total PCBs concentrations in aquaticorganisms were generally within the range of those in sediments, with amean of 5.84–228 ng g�1 dw. Among the biota samples analyzed fromvarious sites, Incheon Harbor contained the greatest total PCBs (228ngg�1 dw), where a highest level of PCBs was also detected in the sedimentin 1998 (Kim et al., 2000a). Overall, total PCBs concentrations in aquaticorganisms in South Korea were comparable to or greater than those(mostly several ng g�1 dw levels) reported for developing countries inAsia (Monirith et al., 2003).
2.5.2.2. Sources and distribution
The homologue pattern of PCBs found in sediment from the various sitesin South Korea suggests the source is technical mixtures such as Aroclors1016, 1242, 1254, and 1260 or corresponding Kanechlor products. Lesserchlorinated CBs such as tri-, tetra-, and penta-CBs were the major PCBcongeners found in freshwater sediments (n ¼ 64) accounting for about21%, 24%, and 20% of total PCBs, on average, respectively (Fig. 2.16).The predominant CBs shifted to more chlorinated congeners in marinesediments (n ¼ 195); 27% penta-, 22% tetra- and 20% hexa-CBs(Fig. 2.16). This indicates that different sources could influence freshwa-ter and marine environments. Based on a study of sources of PCBs, thatthe South Korean environment is contaminated by mixtures of productswith various chlorine contents dominated by Aroclor 1254 in Incheon,Aroclor 1242 in Masan, Aroclor 1260 (or Kanechlor-600) in Ulsan, andAroclor 1242 in the Han River (Kim et al., 2000a, 2002b; Kim, 2004;Hong et al., 2006). Thus, the type of PCBs that contaminated the marineenvironments is likely to depend on specific activities in the individual

Com
posi
tion
(%
)
Cl Number
0
10
20
30
40
50
0
10
20
30
40
50
0
10
20
30
40
50
2 3 4 5 6 8 10
A) Freshwater sediment (n=64)
B) Marine sediment (n=195)
C) Organism (n=132)
7 9
Fig. 2.16. Homolog composition (mean%) of polychlorinated biphenyls (PCBs) in (A)
freshwater sediment (n ¼ 64), (B) marine sediment (n ¼ 195), and (C) organism (n ¼ 132),
from South Korea.
Organic Pollutants in South Korea 103
coastal area. CBs homologue of biota samples showed very strong cor-relation (r2 ¼ 0.96, po0.05) with that of sediment, reflecting bioaccumu-lation of sedimentary PCBs into aquatic organisms (Fig. 2.16).
Among 21 published reports of concentrations of PCBs in sediments(Table 2.10), Masan inland (mean ¼ 38.5 ng g�1 dw, n ¼ 8, 2000) andIncheon Harbor (mean ¼ 146 ng g�1 dw, n ¼ 7, 1995) were identified asthe most contaminated areas for freshwater and marine sediments, re-spectively. PCBs in freshwater sediments from six areas exceeded ERL fortotal PCBs (22.7 ng g�1, dw). However, the concentrations of sediment

Seung-Kyu Kim et al.104
PCBs from any of the stations (n ¼ 65) did not exceed the ERM (180 ngg�1, dw). PCBs were reported to be mostly less than ERL for total PCBsin the brackish sediments from the Shihwa lake in 1996 (n ¼ 4) and 1998(n ¼ 11). PCBs in marine sediments reported from the South Koreancoasts showed relatively great variations in terms of concentration andcongener distribution (Fig. 2.17). Along the South Korean coasts, severalhot spots were found in which concentrations were greater than the ERMfor total PCBs. This was particularly true in Incheon Harbor, near thecapital city of Seoul. However, the contamination level in several baysincluding the Onsan, Gyeonggi, Gwangyang, Namyang bays, and YellowSea did not contained concentrations that exceeded ERL for total PCBs.Overall, the concentrations of sedimentary PCBs in the inland rivers andbay areas were comparable. Their spatial distribution indicated the pres-ence of the localized zones of extremely great concentrations (hot spots).
2.5.3. OC pesticides
During the past several decades, contamination of the environment byOCPs has been of great concern worldwide, due to their persistent, ubiq-uitous, and biologically harmful properties. Although their productionand use had mostly been banned since the 1970s (Fig. 2.9), OCPs are stillfound in various environmental samples and widely distributed along thecoasts of South Korea (Table 2.11). Studies investigating the environ-mental concentrations and distribution of OCPs have increased in the last10 years, for both inland areas and coastal environment. In these studies,the environmental concentrations of OCPs (HCB, HCHs, CHLs, andDDTs) were reported for various environmental samples including air(n ¼ 36), soil (n ¼ 10), sediment (n ¼ 397), and aquatic organism(n ¼ 133) in South Korea.
2.5.3.1. Environmental concentrations
Little is known about concentrations of OCPs in the atmosphere overSouth Korea. Two studies reported concentrations of HCHs, CHLs, andDDTs in air over the cities of Seoul (n ¼ 19) and Ansung (n ¼ 17) in1990–2000 (Yeo et al., 2004b). The mean concentration of total OCPs inair from Ansung (2.00 ng m�3) was approximately three times greaterthan that in Seoul (0.71 ng m�3). Among the atmospheric OCPs, HCHswere the greatest level, accounting for 480% of the total OCPs.
Total OCPs detected in soil (n ¼ 10) from Jeonbuk province rangedfrom 1.57 to 52.9 ng g�1 dw, with a mean concentration of 27.8 ng g�1 dw(Kim and Smith, 2001). OCPs in sediments were reported for various sites
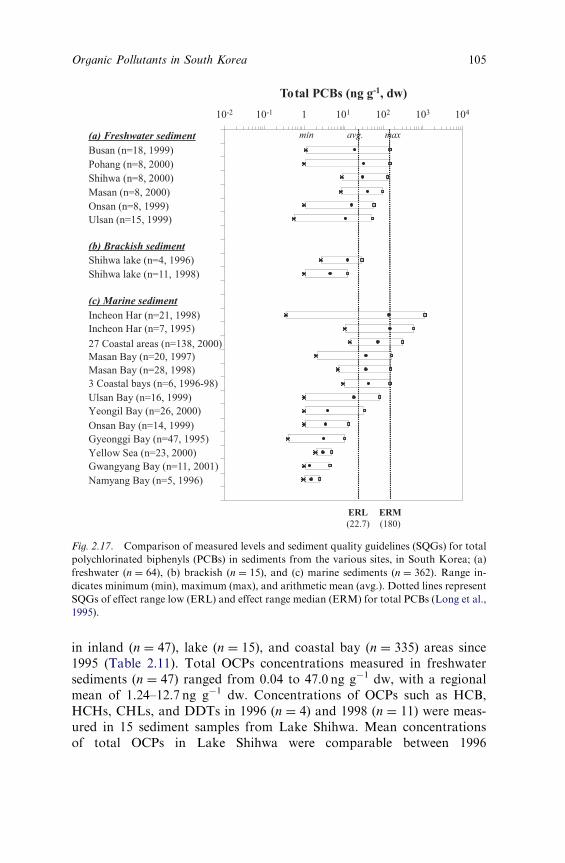
Total PCBs (ng g-1, dw)
Namyang Bay (n=5, 1996)
Gwangyang Bay (n=11, 2001)
Yellow Sea (n=23, 2000)
Gyeonggi Bay (n=47, 1995)
Onsan Bay (n=14, 1999)
Yeongil Bay (n=26, 2000)
Ulsan Bay (n=16, 1999)
3 Coastal bays (n=6, 1996-98)
Masan Bay (n=28, 1998)
Masan Bay (n=20, 1997)
27 Coastal areas (n=138, 2000)
Incheon Har (n=7, 1995)
Incheon Har (n=21, 1998)
(c) Marine sediment
Shihwa lake (n=11, 1998)
Shihwa lake (n=4, 1996)
(b) Brackish sediment
Ulsan (n=15, 1999)
Onsan (n=8, 1999)
Masan (n=8, 2000)
Shihwa (n=8, 2000)
Pohang (n=8, 2000)
Busan (n=18, 1999)
(a) Freshwater sediment min avg. max
10-2
ERM
(180)
ERL
(22.7)
10-1 1 101 102 103 104
Fig. 2.17. Comparison of measured levels and sediment quality guidelines (SQGs) for total
polychlorinated biphenyls (PCBs) in sediments from the various sites, in South Korea; (a)
freshwater (n ¼ 64), (b) brackish (n ¼ 15), and (c) marine sediments (n ¼ 362). Range in-
dicates minimum (min), maximum (max), and arithmetic mean (avg.). Dotted lines represent
SQGs of effect range low (ERL) and effect range median (ERM) for total PCBs (Long et al.,
1995).
Organic Pollutants in South Korea 105
in inland (n ¼ 47), lake (n ¼ 15), and coastal bay (n ¼ 335) areas since1995 (Table 2.11). Total OCPs concentrations measured in freshwatersediments (n ¼ 47) ranged from 0.04 to 47.0 ng g�1 dw, with a regionalmean of 1.24–12.7 ng g�1 dw. Concentrations of OCPs such as HCB,HCHs, CHLs, and DDTs in 1996 (n ¼ 4) and 1998 (n ¼ 11) were meas-ured in 15 sediment samples from Lake Shihwa. Mean concentrationsof total OCPs in Lake Shihwa were comparable between 1996
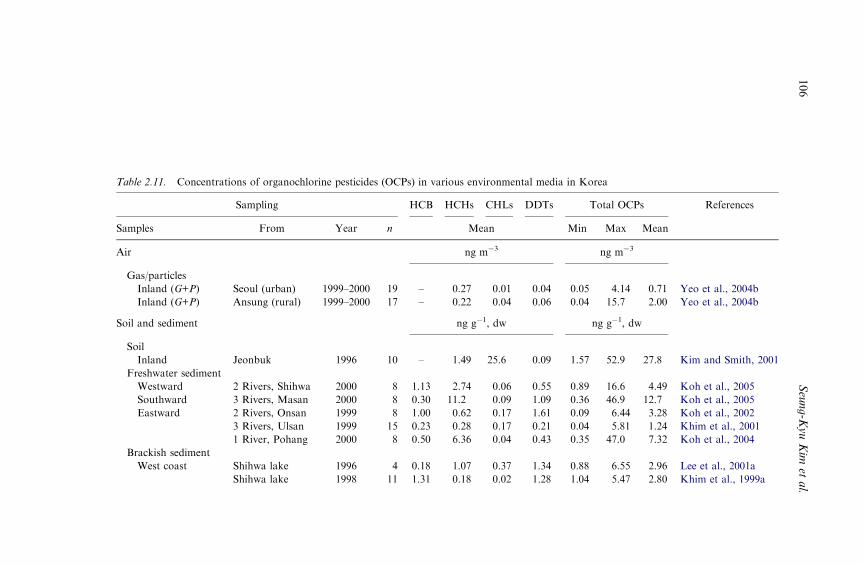
Table 2.11. Concentrations of organochlorine pesticides (OCPs) in various environmental media in Korea
Sampling HCB HCHs CHLs DDTs Total OCPs References
Samples From Year n Mean Min Max Mean
Air ng m�3 ng m�3
Gas/particles
Inland (G+P) Seoul (urban) 1999–2000 19 – 0.27 0.01 0.04 0.05 4.14 0.71 Yeo et al., 2004b
Inland (G+P) Ansung (rural) 1999–2000 17 – 0.22 0.04 0.06 0.04 15.7 2.00 Yeo et al., 2004b
Soil and sediment ng g�1, dw ng g�1, dw
Soil
Inland Jeonbuk 1996 10 – 1.49 25.6 0.09 1.57 52.9 27.8 Kim and Smith, 2001
Freshwater sediment
Westward 2 Rivers, Shihwa 2000 8 1.13 2.74 0.06 0.55 0.89 16.6 4.49 Koh et al., 2005
Southward 3 Rivers, Masan 2000 8 0.30 11.2 0.09 1.09 0.36 46.9 12.7 Koh et al., 2005
Eastward 2 Rivers, Onsan 1999 8 1.00 0.62 0.17 1.61 0.09 6.44 3.28 Koh et al., 2002
3 Rivers, Ulsan 1999 15 0.23 0.28 0.17 0.21 0.04 5.81 1.24 Khim et al., 2001
1 River, Pohang 2000 8 0.50 6.36 0.04 0.43 0.35 47.0 7.32 Koh et al., 2004
Brackish sediment
West coast Shihwa lake 1996 4 0.18 1.07 0.37 1.34 0.88 6.55 2.96 Lee et al., 2001a
Shihwa lake 1998 11 1.31 0.18 0.02 1.28 1.04 5.47 2.80 Khim et al., 1999a
Seung-K
yuKim
etal.
106

Marine sediment
West coast Incheon harbor 1995 7 1.52 0.67 29.6 12.4 3.68 167 44.2 Lee et al., 2001b
Gyeonggi bay 1995 47 0.05 0.44 0.25 0.82 0.10 6.75 1.56 Lee et al., 2001b
Namyang bay 1996 5 0.02 0.46 0.25 0.34 0.14 1.72 1.07 Lee et al., 2001b
South coast Gwangyang bay 2001 11 0.08 0.25 0.01 0.07 0.10 0.99 0.42 Koh et al., 2005
Masan bay 1997 20 0.13 0.26 0.65 16.0 0.84 97.9 18.1 Hong et al., 2003b
Masan bay 1998 28 0.62 0.30 0.09 3.45 1.14 14.6 4.46 Khim et al., 1999b
East coast Onsan bay 1999 14 0.15 0.21 0.02 0.43 0.07 2.81 0.78 Koh et al., 2002
Ulsan bay 1999 16 0.05 0.35 0.08 2.99 0.14 20.2 4.21 Khim et al., 2001
Yeongil bay 2000 26 0.03 1.07 0.08 0.52 0.05 13.8 1.70 Koh et al., 2006
Korean coasts 27 Coastal areas 2000 138 0.14 0.65 0.37 6.64 0.06 161 8.31 Hong et al., 2006
Open sea Yellow Sea 2000 23 0.16 1.17 0.06 0.48 0.38 7.75 1.97 Oh et al., 2005
Organism ng g�1, dw ng g�1, dw
Saltwater fish
Korean coasts 19 Coastal areas 1997–2001 33 1.19 3.48 4.07 33.2 6.96 129 41.9 Yim et al., 2005
Bivalvia
West coast 17 Coastal areas 1997–1999 34 – 7.09 8.49 33.0 9.59 128 48.6 Kim et al., 2002b
South coast Yeosu 1998 9 0.46 1.80 0.31 23.5 10.0 64.3 26.0 Khim et al., 2000
Masan 1998 9 1.44 1.99 1.69 46.0 16.7 114 51.1 Khim et al., 2000
Pusan 1998 5 0.77 2.71 1.91 59.4 26.9 112 64.8 Khim et al., 2000
10 Coastal areas 1999 19 – 5.29 2.52 19.1 8.81 61.8 26.9 Kim et al., 2002b
East coast Ulsan 1998 11 3.28 2.83 1.69 23.5 12.0 101 31.4 Khim et al., 2000
6 Coastal areas 1999 13 – 5.56 5.70 29.3 12.8 97.4 40.6 Kim et al., 2002b
Organic
Pollu
tants
inSouth
Korea
107

Seung-Kyu Kim et al.108
(2.96 ng g�1 dw) and 1998 (2.80 ng g�1 dw), suggesting persistence ofOCPs in environments. In contrast to the small number of reports onOCPs in inland and lake areas (n ¼ 62), since 1995 there has been a largenumber of sites that have been investigated for concentrations of OCPs insediments of bays (n ¼ 335) along the South Korean coasts as well as theopen sea. Concentrations of total OCPs varied greatly among locations,depending on sampling stations and/or areas ranging from 0.42 to 44.2 ngg�1 dw of regional mean concentrations. Total OCPs concentrations inmarine sediments were comparable to those detected in freshwater andbrackish sediments, however, the composition of HCB, HCHs, CHLs,and DDTs to total OCPs varied greatly among samples.
Several studies have reported OCPs concentrations in aquatic organ-isms such as saltwater fishes (n ¼ 33) and bivalves (n ¼ 100) along theSouth Korean coasts since 1997 (Table 2.11). Total OCPs concentrationsin aquatic organisms were found to range from 26.0 to 64.8 ng g�1 dw,and the mean concentrations of OCPs were generally 10-fold greater thanthose in sediments. In sediments, DDTs represented the greatest portion(52%) of the total OCPs in sediment. Similarly, in aquatic organisms theDDTs were the prevalent measured. Overall, total OCPs detected inaquatic organisms in South Korea were within the range of OCPs re-ported from the developing countries in Asia (Monirith et al., 2003).
2.5.3.2. Sources and distribution
The contribution of individual OCPs to the total OCPs varied amongenvironmental media (air, soil, sediment, and organism) (Fig. 2.18). Therelative abundance of OCPs in air samples was found to be in the order ofendosulfan (77%)4HCHs (18%)4DDTs (3.7%)4CHLs (1.6%). Thelarge abundance of endosulfan in air samples could be explained by itsusage, duration used in the past and chemical properties (Yeo et al.,2004b). The composition of OCPs in soil, freshwater, and coastal marinesediment samples were predominated by CHLs (92%), HCHs (72%), andDDTs (450%), respectively. The OCPs composition of soil was signif-icantly different from that of sediment. The disparity indicates that OCPscontamination in marine environments is likely to be contaminated bypotential coastal sources themselves rather than by transport of contam-inants from inland sources. It should be noted that the relative compo-sition of OCPs in aquatic organisms was similar to that found in marinesediment, which indicates the accumulation of contaminants in the bodyof organisms and sediment from water column via similar mechanisms(Fig. 2.18).

0 20 40 60 80 100
Air(n=36)
Soil(n=10)
Freshwater sediment(n=47)
Brackish sediment(n=15)
Organism(n=100)
Marine sediment(n=174)
Composition (%)
HCB HCHs CHLsDrins Endosulfan DDTs
Fig. 2.18. Composition (mean%) of individual organochlorine pesticides (OCPs; HCB,
HCHs, CHLs, Drins, Endosulfan, and DDTs) relative to total OCPs, detected in the various
environmental media (air, soil, freshwater, brackish, marine sediments, and organism; no. of
samples are in parenthesis) from the South Korea.
Organic Pollutants in South Korea 109
Inland soil collected from Jeonbuk province showed the OCPs con-centrations as great as 52.9 ng g�1, with a mean of 27.8 ng g�1. The meanconcentration was significantly greater than that in sediment (6.76 ngg�1). Among 18 datasets concentrations of OCPs in sediments of SouthKorea (Table 2.11), Masan inland (mean ¼ 12.7 ng g�1 dw, n ¼ 8, 2000)and Incheon Harbor (mean ¼ 44.2 ng g�1 dw, n ¼ 7, 1995) were identifiedas the most contaminated areas with total OCPs for freshwater and ma-rine sediments, respectively. These areas were found to be the most con-taminated areas by PCBs as well, indicating a close relationship betweenPCBs and OCPs sources in Masan and Incheon areas. A correlation ofthe spatial distribution was frequently observed between the concentra-tions of PCBs and major OCPs such as DDTs and CHLs (Kim et al.,2002b; Hong et al., 2006). Intensive industrial and municipal activitiesnear the cities of Masan and Incheon would cause the level of contam-ination by classical POPs such as PCBs and OCPs. Relatively low OCPscontamination has been found in the areas of Gwangyang (steel man-ufacturing, mean ¼ 0.42 ng g�1, n ¼ 11, 2001) and Onsan Bay (non-fer-rous metal manufacturing, mean ¼ 0.78 ng g�1, n ¼ 14, 1999). The degree

Total DDTs (ng g-1, dw)
Gwangyang Bay (n=11, 2001)Namyang Bay (n=5, 1996)Yellow Sea (n=23, 2000)Onsan Bay (n=14, 1999)Gyeonggi Bay (n=47, 1995)Yeongil Bay (n=26, 2000)Masan Bay (n=28, 1998)Ulsan Bay (n=16, 1999)Incheon Har (n=7, 1995)Masan Bay (n=20, 1997)27 Coastal areas (n=138, 2000)(d) Marine sediment
Shihwa lake (n=11, 1998)Shihwa lake (n=4, 1996)(c) Brackish sediment
Ulsan (n=15, 1999)Pohang (n=8, 2000)Shihwa (n=8, 2000) Onsan (n=8, 1999)Masan (n=8, 2000)(b) Freshwater sediment
Jeonbuk (n=10, 1996)(a) Soil min avg. max
10-3
ERM(46.1)
ERL(1.58)
10-2 10-1 1 10 102 103
Fig. 2.19. Comparison of measured levels and sediment quality guidelines (SQGs) for total
DDTs in soil and sediments from the various sites, in South Korea; (a) soil (n ¼ 10), (b)
freshwater (n ¼ 47), (c) brackish (n ¼ 15), and (d) marine sediments (n ¼ 335). Range in-
dicates minimum (min), maximum (max), and arithmetic mean (avg.). Dotted lines represent
SQGs of effect range low (ERL) and effect range median (ERM) for total DDTs (Long et
al., 1995).
Seung-Kyu Kim et al.110
of contamination of the South Korean coastal environment showed anexistence of the clear but localized sources and distribution.
Among the OCPs, DDTs, CHLs, and g-HCH (lindane) were found tobe the most contaminated OCPs present in Korean sediments (Fig. 2.19).Out of 18 datasets examined (n ¼ 407), 13, 10, and 9 of the total sitescontained the concentration that exceeded the corresponding thresholdeffect concentrations such as ERL or TEL for total DDTs, total CHLs,

Organic Pollutants in South Korea 111
and g-HCH, respectively. DDTs were found to be widespread OCPscontaminants across the inland and coastal-marine areas, accounting for450% of the total OCPs both in sediment and aquatic organisms. Inlandsoils and sediments contained relatively low total DDTs over ERL(1.58 ng g�1) at some stations but mostly below ERM (46.1 ng g�1).Contrarily, in most coastal bay areas (8 out of 11 areas), the contam-ination level exceeded the ERL for total DDTs and even the ERM wasexceeded at some sites. In spite of lower level than DDTs, CHLs showedthe similar distribution spatially with DDTs. By contrast, g-HCH was themost contaminated OCPs in the inland areas and distributed relativelyevenly in marine areas. None of the site exceeded the SQGs of low ap-parent effects threshold (22 ng/g, dw) for HCB. Overall, the concentrationand distribution of OCPs in Korean sediments reflected the widespreaddistribution with some localized hot spots of considerably great concen-trations.
2.5.4. PAHs
Many of PAHs are known to be mutagenic and/or carcinogenic (Neff,1979). Coke production, combustion of fossil fuels, chemical production,and oil spills are the potential sources of PAHs. In recent studies onPAHs, these compounds were found to be one of the prevalent organiccontaminants in South Korean sediments (Kim et al., 1999b; Koh et al.,2002). However, compared to the reports on the classical POPs such asPCBs and OCPs, little is known about the degree of PAHs contaminationin the South Korean environment, except for soil and sediments(Table 2.12). A total of 28 datasets reporting total concentrations ofPAHs in South Korean samples, by sampling area, were found in theliterature where total PAHs in air (n ¼ 70), soil (n ¼ 232), water (n ¼ 25),and sediment (n ¼ 281) were reported.
2.5.4.1. Environmental levels
A few studies reported total PAHs (gas+particle phase) in air in SeoulCity during 1999–2002 and found concentrations between 9.10 and 350 ngm�3, with a regional mean of 35.6–89.3 ng m�3 (Park et al., 2002b; Kim,2004). Relatively great concentrations of atmospheric PAHs during win-ter were ascribed to increased fuel consumption, the lower mixing heightand low air temperature.
A comprehensive study on total PAHs in soil from inland areas havebeen reported by Nam et al. (2003) through a survey of 226 sites in SouthKorea. Mean concentrations of total PAHs in soil from 6-areas were

Table 2.12. Concentrations of total PAHs detected in the various environmental media in South Korea
Sampling No. of PAHs Total PAHs References
Samples From Year n Min Max Mean
Air ng m�3
Gas/particles
Inland (G+P) Seoul (urban) 1999 24 12 11.3 350 89.3 Park et al., 2002b
Inland (G+P) Seoul (urban) 2001–02 5 24 11.4 81.0 44.3 Kim, 2004
Inland (G+P) Seoul (suburban) 2001–02 5 24 9.10 70.3 35.6 Kim, 2004
Inland (P alone) Seoul 1992–94 36 20 7.74 265 61.1 Panther et al., 1999
Water ng g�1, dw
Freshwater
Inland Han River, Seoul 2001–03 15 15 13.44 75.73 43.03 Kim, 2004
Soil and sediment ng g�1, dw
Soil
Inland Seoul (urban) 2001 3 24 791 1729 1175 Kim, 2004
Seoul (suburban) 2001 3 24 874 1073 999 Kim, 2004
Seoul-Gyeonggi o2002 61 16 32.0 1057 257 Nam et al., 2003
Seung-K
yuKim
etal.
112

Gwangwon o2002 50 16 43.0 1852 271 Nam et al., 2003
Gyeongbuk o2002 24 16 43.0 623 199 Nam et al., 2003
Gyeongnam o2002 31 16 41.0 336 171 Nam et al., 2003
Jeolla o2002 45 16 23.0 303 118 Nam et al., 2003
Pohang o2002 15 16 105 2833 578 Nam et al., 2003
Freshwater sediment
Westward 2 Rivers, Shihwa 2000 8 16 8.61 643 224 Koh et al., 2005
1 River, Seoul 2001–02 25 24 173 1721 858 Kim, 2004
Southward 3 Rivers, Masan 2000 8 16 16.3 481 212 Koh et al., 2005
Eastward 2 Rivers, Onsan 1999 8 16 1.00 573 128 Koh et al., 2002
3 Rivers, Ulsan 1999 14 16 9.46 1373 265 Khim et al., 2001
1 River, Pohang 2000 8 16 5.88 7685 1282 Koh et al., 2004
Brackish sediment
West coast Shihwa lake 1998 11 16 o1.00 31.4 11.4 Khim et al., 1999a
Marine sediment
West coast Han River mouth 1995 16 24 28.8 229 86.5 Kim et al., 1999b
Incheon Harbor 1995 19 24 13.1 1430 272 Kim et al., 1999b
Gyeonggi Bay 1995 31 24 9.54 167 53.1 Kim et al., 1999b
South coast Gwangyang Bay 2001 11 16 10.5 105 36.8 Koh et al., 2005
Masan Bay 1998 28 16 41.5 1102 353 Khim et al., 1999b
East coast Onsan Bay 1999 12 16 1.00 50.6 21.6 Koh et al., 2002
Ulsan Bay 1999 16 16 19.7 3095 409 Khim et al., 2001
Yeongil Bay 2000 26 16 1.00 1872 227 Koh et al., 2006
Organic
Pollu
tants
inSouth
Korea
113

Seung-Kyu Kim et al.114
found to be 257 (Seoul-Gyeonggi, n ¼ 61), 271 (Gwangwon, n ¼ 50), 199(Gyeongbuk, n ¼ 24), 171 (Gyeongnam, n ¼ 31), 118 (Jeolla, n ¼ 45),and 578 ng g�1 dw (Pohang, n ¼ 15), respectively. The greatest concen-tration (2833 ng g�1 dw) of total PAHs in soil was found in the Pohangarea near a large scale steel manufacturing plant. This spatial distributionis consistent with information of emission sources of PAHs describedearlier that a major source of PAHs is coke oven from metal industries.The distribution of total PAHs found in soil samples were primarily ofpyrogenic origins such as heavy industry emission and motor vehicleexhaust in South Korea.
Since 1995, concentrations of PAHs have been reported for varioussites along the South Korean coasts. Concentrations of total PAHsmeasured in freshwater sediment (n ¼ 71) varied greatly with samplingstation, ranging from 1.00 to 7685 ng g�1 dw, with regional meansof 128–1282 ng g�1 dw at the sites. Relatively small concentrationshave been found in Lake Shihwa sediment with a mean of 11 ng g�1 dwof total PAHs. Many studies reported the sedimentary PAHs in coastalbay areas, and their total PAHs (mean ¼ 266 ng g�1, dw, n ¼ 226)were similar to those measured in soil samples (mean ¼ 255 ng g�1,dw, n ¼ 216). The maximum concentration (3095 ng g�1 dw) of totalPAHs in marine sediments was found in Ulsan Bay near a shipbuildingarea.
2.5.4.2. Sources and distribution
The relative contributions of the 16 individual indicator PAHs to the totalconcentration of PAHs in air samples significantly differed from soil orsediment samples (Fig. 2.20). Low molecular weight PAHs (L-PAHs)such as 2-3 ring aromatic hydrocarbons (NAP, ACY, ACE, FLU, PHE,and ANT) were predominant in air samples, accounting for 450% oftotal PAHs. This is attributable to the contribution of gaseous L-PAHs ofgreater volatilities. Particle-associated PAH composition is similar tothose of soil and sediment. This is not only because their low volatility butdry/wet deposition of particulate PAHs plays a significant role as sourceto underlying soils. H-PAHs such as 4-5 ring aromatic hydrocarbons(FLT, PYR, BaA, CHR, BbK, BkF, BaP, and DahA) accounted for ca.70% of total PAHs detected in soil and sediment samples. A significantrelationship in composition of PAHs was found between soil and river-(r2 ¼ 0.65, po0.05) or marine-sediments (r2 ¼ 0.71, po0.05), indicatingtheir sources are closely related with each other. Furthermore, the strongcorrelation (r2 ¼ 0.97, po0.05) between river and marine sediments

Composition (%)
NAP
ACY
ACE
FLU
PHEANT
FLT
PYR
BaA
CHR
BbFBkF
BaPI123cdP
DahABghiP
NAP ACYACEFLU
PHE
ANT
FLT
PYRBaA
CHR
BbF
BkF
BaP
I123cdPDahA BghiP
PHE
ANT
FLT
PYRBaA
CHR
BbF
BkF
BaP
I123cdPDahA
BghiP
NAPACYACE
FLU
NAPACY
ACEFLU
PHE
ANT
FLT
PYRBaA
CHR
BbF
BkF
BaP
I123cdPDahA BghiP
(d) Marine sediment
(n=159)
(c) Freshwater sediment
(n=46)
(b) Soil(n=226)
(a) Air(n=24)
Fig. 2.20. Composition (mean%) of 16 individual polycyclic aromatic hydrocarbons
(PAHs) to total PAHs detected in various environmental media; in (a) air (n ¼ 24), (b) soil
(n ¼ 226), (c) freshwater (n ¼ 46), and (d) marine sediment (n ¼ 159), from the South Korea.
Naphthalene; NAP, Acenaphthylene; ACY, Acenaphthene; ACE, Fluorine; FLU,
Phenanthrene; PHE, Anthracene; ANT, Fluoranthene; FLT, Pyrene; PYR, Benz[a]ant-
hracene; BaA, Chrysene; CHR, Benzo[b]fluoranthene; BbF, Benzo[k]fluoranthene; BkF,
Benzo[a]pyrene; BaP, Indeno[1,2,3,c,d]pyrene; I123cdP, Dibenz[a,h]anthracene; DahA, Ben-
zo[g,h,i]perylene; BghiP.
Organic Pollutants in South Korea 115

Seung-Kyu Kim et al.116
reflected their widespread distribution from similar origins across the in-land and coastal bay areas.
Because PAHs can originate from pyrogenic sources (combustion) aswell as petrogenic origins (petroleum), the concentrations, distribution,and fate of PAHs in environment would vary with their sources. Severalmolecular ratios of specific hydrocarbons such as PHE/ANT, FLU/PYR,FLU/(FLU+PYR), CHR/BaA, and L-/H-PAHs have been used tocharacterize sources and origins (Budzinski et al., 1997; Baumard et al.,1998; Dickhut et al., 2000; Yunker et al., 2002). Analysis of such ratiosfor air, soil, and sediment samples in South Korea suggested that air-borne and soil PAHs were mainly pyrogenic while the sources for sed-iment were from both pyrogenic and petrogenic origins. It is alsonoteworthy that the sites near urban and industrial areas received morepyrolytic inputs whereas the bay areas or downstream of rivers close toharbor places and/or shipping yards could be influenced by more of pet-rogenic inputs (not presented).
The distribution of total PAHs in soil and sediment samples was de-pendent on the land use types (Fig. 2.21). Among the six areas inves-tigated for total PAHs in soil from South Korea, the industrial area suchas that at Pohang showed the greatest concentrations of PAHs and thewest plain area in Jeolla province where agricultural activities are dom-inant tended to show lower concentrations of PAHs. The greater con-centrations of PAHs in freshwater sediment have been found in the inlandarea near Pohang, further supporting the conclusion that there are directsources of PAHs input to this area. Only in the Pohang area existed a siteof contamination exceeding the ERL for total PAHs (4022 ng g�1 dw). Inno stations of other five areas, Seoul, Ulsan, Shihwa, Onsan, and Masandid exceed the corresponding ERL. Meanwhile, total PAHs in brackishsediment measured from Lake Shihwa contained the least concentrationsof PAHs in South Korea. Although the contamination of PAHs in ma-rine sediments showed a wide spatial variability, at none of the stationsexceeded the ERL for total PAHs. Overall, distribution for PAHs in soil(266 ng g�1, dw, n ¼ 226), freshwater (514 ng g�1, dw, n ¼ 81), and ma-rine sediment (182 ng g�1, dw, n ¼ 159) suggested the widespread con-tamination of PAHs across the inland and coastal bay areas in SouthKorea.
2.5.5. APs and BPA
Distributions of APs and BPA in South Korea have been studied sincethe late 1990s. Concentrations of APs and BPA have been measured in

Total PAHs (ng g-1, dw)
ERM(44,792)
ERL(4,022)
10-1 1 10 102 103 104 105
(a) Soil
Onsan Bay (n=12, 1999)Gwangyang Bay (n=11, 2001)Gyeonggi Bay (n=31, 1995)Han River mouth (n=16, 1995)Masan Bay (n=28, 1998)Incheon Har (n=19, 1995)Yeongil Bay (n=26, 2000)Ulsan Bay (n=16, 1999)(d) Marine sediment
Shihwalake (n=11, 1998)(c) Brackish sediment
Masan (n=8, 2000)Onsan (n=8, 1999)Shihwa (n=8, 2000)
Seoul (n=25, 2001-02)Pohang (n=8, 2000)(b) Freshwater sediment
Jeolla (n=45, <2002)Gyeongnam (n=31, <2002)Gyeongbuk (n=24, <2002)Seoul-Gyeonggi (n=61, <2002)Gwangwon (n=50, <2002)Pohang (n=15, <2002)
Ulsan (n=15, 1999)
min avg. max
Fig. 2.21. Comparison of measured levels and sediment quality guidelines (SQGs) for total
polycyclic aromatic hydrocarbons (PAHs) in soil and sediments from the various sites, in
South Korea; (a) soil (n ¼ 226), (b) freshwater (n ¼ 81), (c) brackish (n ¼ 11), and (d)
marine sediments (n ¼ 159). Range indicates minimum (min), maximum (max), and arith-
metic mean (avg.). Dotted lines represent SQGs of effect range low (ERL) and effect range
median (ERM) for total PAHs (Long et al., 1995).
Organic Pollutants in South Korea 117
water, suspended solids, and sediments in South Korea (Khim et al.,1999a, b, 2001; NIER, 2000a, 2001, 2002, 2003; Koh et al., 2002, 2005; Liet al., 2004a–c, 2005). NP was frequently detected and well reportedcompared to OP, BP, and BPA. Data available for these compounds aresummarized in Table 2.13.

Table 2.13. Concentrations of alkylphenols (APs) and bisphenol A (BPA) in various environmental media in Korea
Sampling Compounds measured Total APs and BPA References
Samples From Year n Min Max Mean
Water ng L�1
Freshwater
Westward Han river 1999 10 NP+OP+HP+PP+BPA 116 984 429 NIER, 2000a
2000 10 NP+OP+BPA 30 1266 294 NIER, 2001
2001 10 NP+BPA o10 1203 298 NIER, 2002
2002 13 NP+BPA o10 432 96 NIER, 2003
Southward Nakdong river 1999 10 NP+OP+HP+PP+BPA 190 874 367 NIER, 2000a
2000 10 NP+OP+BPA 30 488 211 NIER, 2001
2001 10 NP+BPA o10 871 528 NIER, 2002
2002 9 NP+BPA o10 298 73 NIER, 2003
Westward Geum river 1999 12 NP+OP+HP+PP+BPA 212 646 342 NIER, 2000a
2000 6 NP+OP+BPA 38 87 67 NIER, 2001
2001 6 NP+BPA 10 818 422 NIER, 2002
. 2002 6 NP+BPA o10 380 94 NIER, 2003
Southward Yeongsan river 2000 6 NP+OP+BPA 20 377 187 NIER, 2001
2001 6 NP+BPA 47 687 392 NIER, 2002
2002 4 NP+BPA o10 110 51 NIER, 2003
Other rivers of lakes 1999 11 NP+OP+HP+PP+BPA 55 6340 1133 NIER, 2000a
2000 11 NP+OP+BPA 20 1169 300 NIER, 2001
2001 11 NP+BPA o10 1742 511 NIER, 2002
2002 11 NP+BPA o10 432 104 NIER, 2003
Westward Han river Aug–2001 10 NP 71 188 103 Li et al., 2004(a)
Han river Oct–2001 10 NP 42 84 60 Li et al., 2004(a)
Han river Dec–2001 10 NP 17 72 43 Li et al., 2004(a)
6 Creeks, Shihwa Apr–2000 18 NP 46 41,300 3580 Li et al., 2004(b)
6 Creeks, Shihwa Aug–2002 6 NP 90 15,821 3010 Li et al., 2004(c)
6 Creeks, Shihwa Oct–2002 6 NP 118 4324 2309 Li et al., 2004(c)
6 Creeks, Shihwa Dec–2002 6 NP 131 5239 1339 Li et al., 2004(c)
Seung-K
yuKim
etal.
118

Brackish
West coast Shihwa lake Apr–2000 12 NP 37 770 183 Li et al., 2004(b)
Shihwa lake Aug–2002 10 NP 35 1533 280 Li et al., 2004(c)
Shihwa lake Oct–2002 10 NP 17 140 92 Li et al., 2004(c)
Shihwa lake Dec–2002 10 NP 31 87 61 Li et al., 2004(c)
Saltwater
West coast Saemangeum Bay May–2002 18 NP 4.5 52 20 Li et al., 2005
Saemangeum Bay Aug–2002 18 NP 23 48 30 Li et al., 2005
Saemangeum Bay Nov–2002 18 NP 3.1 22 12 Li et al., 2005
Saemangeum Bay Feb–2002 18 NP 7.1 79 21 Li et al., 2005
Saemangeum Bay May–2003 18 NP 17 129 34 Li et al., 2005
Saemangeum Bay Aug–2003 18 NP 28 247 76 Li et al., 2005
Suspended solid ng g�1, dw
Freshwater
Westward Han river Aug–2001 10 NP 3.8 17 8.7 Li et al., 2004(a)
Han river Oct–2001 10 NP 1.1 9.3 3.6 Li et al., 2004(a)
Han river Feb–2001 10 NP 1.0 6.9 3.1 Li et al., 2004(a)
6 Creeks, Shihwa Apr–2000 18 NP 600 116,700 14,400 Li et al., 2004(b)
6 Creeks, Shihwa Aug–2002 6 NP 69 10,183 2136 Li et al., 2004(c)
6 Creeks, Shihwa Oct–2002 6 NP 120 3836 1323 Li et al., 2004(c)
6 Creeks, Shihwa Dec–2002 6 NP 8.3 3487 742 Li et al., 2004(c)
Brackish
West coast Shihwa lake Apr–2000 12 NP 93 859 445 Li et al., 2004(b)
Shihwa lake Aug–2002 10 NP 31 87 61 Li et al., 2004(c)
Shihwa lake Oct–2002 10 NP 19 831 149 Li et al., 2004(c)
Shihwa lake Dec–2002 10 NP 15 38 26 Li et al., 2004(c)
Soil ng g�1, dw
Country wide 1999 35 BPA o0.5 54 7 NIER, 2000a
Country wide 2000 35 NP+OP+BPA o0.5 14 3 NIER, 2001
Country wide 2001 35 NP+BPA o0.5 8 2 NIER, 2002
Country wide 2002 35 NP+BPA o0.5 6 2 NIER, 2003
Organic
Pollu
tants
inSouth
Korea
119

Table 2.13. (Continued )
Sampling Compounds measured Total APs and BPA References
Samples From Year n Min Max Mean
Sediment ng g�1, dw
Freshwater
Westward Han river 1999 5 NP+OP+HP+PP+BPA 7 61 26 NIER, 2000a
2001 5 NP+BPA 2 5 3 NIER, 2002
2002 4 NP+BPA 1 2 1 NIER, 2003
Southward Nakdong river 1999 3 NP+OP+HP+PP+BPA 88 124 101 NIER, 2000a
2000 1 NP+OP+BPA 28 28 28 NIER, 2001
2001 3 NP+BPA o0.5 5 3 NIER, 2002
2002 2 NP+BPA 1 2 1 NIER, 2003
Westward Geum river 1999 1 NP+OP+HP+PP+BPA 104 104 104 NIER, 2000a
2000 1 NP+OP+BPA 31 31 31 NIER, 2001
2001 1 NP+BPA 6 6 6 NIER, 2002
2002 3 NP+BPA o0.5 2 1 NIER, 2003
Southward Yeongsan river 1999 2 NP+OP+HP+PP+BPA 31 80 55 NIER, 2000a
2001 2 NP+BPA o0.5 2 1 NIER, 2002
2002 1 NP+BPA 1 1 1 NIER, 2003
Other rivers or lakes 2000 9 NP+OP+BPA 6 38 15 NIER, 2001
2002 1 NP+BPA 1 1 1 NIER, 2003
Westward 2 Creeks, Shihwa Oct–2000 8 NP+OP+BP+BPA 308 5124 1736 Koh et al., 2005
6 Creeks, Shihwa Apr–2000 18 NP 1.0 31,700 3008 Li et al., 2004(b)
Han river Aug–2001 10 NP 11 624 251 Li et al., 2004(a)
Han river Oct–2001 10 NP 56 357 157 Li et al., 2004(a)
Han river Dec–2001 10 NP 35 550 192 Li et al., 2004(a)
Seung-K
yuKim
etal.
120

Southward 3 Rivers, Masan Nov–2000 8 NP+OP+BP+BPA 158 1114 479 Koh et al., 2005
Eastward 2 Rivers, Onsan Apr–1999 13 NP+OP+BPA 3.0 1074 168 Koh et al., 2002
3 Rivers, Ulsan Apr–1999 15 NP+OP+BPA 3.0 1161 180 Khim et al., 2001
Brackish
West coast Shihwa lake Jan–1998 11 NP+OP+BP 37 1783 637 Khim et al., 1999a
Shihwa lake Apr–2000 12 NP 11 624 235 Li et al., 2004b
Shihwa lake Oct–2002 12 NP 10 5054 826 Li et al., 2004c
Shihwa lake Dec–2002 12 NP 16 2513 772 Li et al., 2004c
Marine
South coast Masan Bay May–1998 28 NP+OP+BP+BPA 129 4168 547 Koh et al., 2002
Gwangyang Bay Feb–2001 11 NP+OP+BP+BPA 13 43 24 Koh et al., 2005
East coast Onsan Bay Apr–1999 13 NP+OP+BPA 3.0 6.3 3.9 Koh et al., 2002
Ulsan Bay Apr–1999 15 NP+OP+BPA 3.0 22 7.4 Khim et al., 2001
Yeongil Bay Mar–2000 26 NP+OP+BP+BPA 4.0 3199 194 Koh et al., 2006
Organic
Pollu
tants
inSouth
Korea
121

Seung-Kyu Kim et al.122
2.5.5.1. Environmental levels
Based on the data from 1999 through 2003, concentrations of APs andBPA were relatively greater in creeks in industrial areas than in rivers andlakes (Table 2.13). Among APs and BPA, NP was the predominantchemical species in water and sediment both from inland and coastalareas. Most sites were contaminated with NP where other APs and BPAwere generally low.
In a case study of the Shihwa-Banweol, creeks in this area were highlycontaminated with NP (10- to 1000-fold greater than those in the HanRiver and Saemangeum Bay). The maximum concentration of NP ob-served was as great as 41300 ng L�1 in creeks with the average concen-trations of from 1339 to 3580, depending upon sampling years.Concentrations of NP in Lake Shihwa ranged from 61 to 280 ng L�1.These concentrations were similar to those of the Han River with 43–103 ng L�1 whereas, NP in coastal seawater from Saemangeum Bay werein the range of 12–76 ng L�1.
The AP concentrations in sediments were also greater in creeks than inthe brackish and marine environment. The average concentrations of NP,OP, and BP in sediment from Lake Shihwa were 609, 18, and 10 ng g�1
dw, respectively (Khim et al., 1999a). The NP concentration was detectedup to 116700 ng g�1 dw in suspended solids, and 32000 n g�1 dw in se-diments. The concentrations of APs and BPA in soil samples from thenational monitoring sites of NIER were at a few ppb levels, implying thatlittle APs and BPA were introduced into soil.
2.5.5.2. Temporal and spatial distribution
Concentrations of APs and BPA in South Korea appear to decrease withtime. Based on the national monitoring data from NIER, the averageconcentrations of NP and BPA were 446 and 52 ng L�1 in 1999, 171 and60 ng L�1 in 2000, 416 and 116 ng L�1 in 2001, and 79 and 67 ng L�1 in2002. In the Shihwa-Banweol area, the concentration of NP might bedecreasing with time. The greatest concentration of NP (41300 ng L�1)measured in the tributaries to Lake Shihwa in April 2000 was reduced toalmost one-third (15821 ng L�1) in August 2002, and continuously de-creased to 4000–5000 ng/L in October and December 2002. Concentra-tions of NP in suspended solids in the Lake Shihwa area was alsoobserved to decrease. The average NP concentration in suspended solidsreduced from 4744 to 151 ng g�1 dw during the period from 2000 to 2002.This is presumably due to the expansion of wastewater treatment plants(WWTP) and solid treatment plants (STP) in the Shihwa-Banweol

Organic Pollutants in South Korea 123
industrial area. However, concentrations of NP in sediments from LakeShihwa did not show such a rapid reduction, indicating the persistence ofNP in sediment. Half-life of NP and OP is known to be in the order ofyears in sediments (Ying et al., 2002).
2.5.5.3. Comparison with EQCs
To evaluate the risks by water-borne NP exposure, the concentrations ofNP in water and sediments were compared to acute and chronic water
NP (ng g-1, dw)
Shihwa lake (n=11, Jan 1998)
Yeongil Bay (n=26, 2000)Ulsan Bay (n=15, 1999)
Onsan Bay (n=13, 1999)
Gwangyang Bay (n=11, 2001)
Masan Bay (n=28, 1998)
(e) Marine Sediment
Ulsan (n=15, 1999)
Onsan (n=8, 1999)Masan (n=8, 2000)
Han River (n=10, Aug 2001)
Shihwa (n=8, Oct 2000)
(d) Brackish Sediment
(b) Soil
Shihwa (n=18, Apr 2000)
Han River (n=10, Oct 2001)
Han River (n=10, Dec 2001)
Shihwa lake (n=12, Apr 2000)
Shihwa lake (n=12, Oct 2002)
Shihwa lake (n=12, Dec 2002)
Country-wide (n=35, 2000)
Country-wide (n=35, 2001)
Country-wide (n=35, 2002)
4 rivers (n=11, 1999)
4 rivers (n=11, 2000)
4 rivers (n=11, 2001)
4 rivers (n=11, 2002)
(c) Freshwater Sediment
Han River (n=10, 1999)
Han River (n=10, 2000)
Han River (n=10, 2001)
Nakdong River (n=10, 1999)
Nakdong River (n=10, 2000)
Nakdong River (n=10, 2001)
Nakdong River (n=9, 2002)
Han River (n=13, 2002)
Geum River (n=12, 1999)
Geum River (n=6, 2000)
Geum River (n=6, 2001)
Geum River (n=6, 2002)
Yeongsan River (n=6, 2000)
Yeongsan River (n=6, 2001)
Yeongsan River (n=4, 2002)
Other rivers (n=11, 1999)
Other rivers (n=11, 2000)
Other rivers (n=11, 2001)
Other rivers (n=11, 2002)
SQG-f(1,400)
SQG-m(1,000)
10-1 1 10 102 103 104 10510-1 1 10 102 103 104 105
NP (ng L-1)
WQG-f(1,000)
WQG-m(700)
(a) Water
min avg. maxmin avg. max
Fig. 2.22. Comparison of measured levels and environmental quality criteria (EQCs) for
nonylphenol (NP) in water, soil and sediments from the various sites, in South Korea; (a)
water (n ¼ 172), (b) soil (n ¼ 105), (c) freshwater sediment (n ¼ 131), (d) brakish sediment
(n ¼ 47), (e) marine sediment (n ¼ 93). Range indicates minimum (min), maximum (max),
and arithmetic mean (avg.). Dotted lines represent Canadian EQCs proposed for marine
water (WQC-m) and freshwater (WQC-f), and marine sediment (SQG-m) and freshwater
sediment (SQG-f) (see the text).

Seung-Kyu Kim et al.124
quality criteria (WQC) and sediment quality guideline (SQG). In thisevaluation, we used a final WQC and SQG for NP suggested by the USAand Canada (Environment Canada, 2001; US EPA, 2005). The acutecriterion of 28000 ng L�1 and chronic criterion of 6600 ng L�1 were pro-posed for freshwater, while acute criterion of 7000 ng L�1 and chroniccriterion of 1700 ng L�1 were proposed for salt water. These values arethe concentrations of NP in water at which aquatic life is protected fromacute and chronic adverse effects. In only 0.5% of the freshwater samplesfrom South Korea the concentration was over the EPA’s proposedchronic WQC of 6600 ng L�1 (Fig. 2.22). This is similar to the report that99% of the detectable levels of APs/APEs and their biodegradation in-termediates in US surface waters are below the chronic WQC (only fourdata among database exceeded chronic WQC). Canadian water qualityguidelines (WQGs) for NP and its ethoxylates were proposed in 2002 andthe guidelines were lower than USA chronic WQG. Based on the Ca-nadian WQG for NP (1000 ng L�1), 5.1% of water samples exceeded theWQG whereas 1.3% of salt water samples were over the guideline in saltwater (700 ng L�1). The fractions of the samples exceeding the Canadiansediment quality guidelines for NP in fresh water (1400 ng g�1) and saltwater (1000 ng g�1) were 3.6% and 6.6%, respectively (Fig. 2.22). Thepercentages of sediment samples over SQG are larger than in water sam-ple, indicating NP contamination in sediment might be more serious thanthat in water.
United States and Canada have water quality guidelines and Europeancountries banned the use of alkylphenol polyethoxylates. To date, there isno standard available for regulating APs in the environmental media ofSouth Korea. Most of the sites investigated throughout the South Koreanpeninsula are not expected to be sufficiently contaminated with APs orBPA to cause adverse effects. However, NP concentrations in some wa-ters and sediments were over the guidelines of the USA and Canada. Thismeans that aquatic organisms can be adversely affected by NP exposurein some aquatic systems. Therefore, actions should be taken to implementthe regulations of NP to protect the aquatic ecosystems in South Korea.
2.5.6. PBDEs
Although the use of PBBs in South Korea was banned in 1999 the totaluse of BFRs including PBDEs has increased during the last decade (Parkand Jeong, 2001). Concentrations of PBDEs in South Korea have onlyrecently been measured. There are three peer-reviewed papers available,which reported the concentrations of PBDEs in air, sediments andbivalves. One report was available focusing on the PBDEs in human

Organic Pollutants in South Korea 125
blood. A few reports on environmental policy of PBDE managementwere also published (Park and Jeong, 2001; Kim et al., 2002f; KMOE,2005c).
2.5.6.1. Environmental levels
PBDEs have been detected in air at the sites of Busan, Masan, and Jinhaecities (Moon et al., 2007a), in sediment and bivalve from coastal regions(Moon et al., 2001, 2007b), and in human blood samples from workersand general population in Seoul (Kim et al., 2005e). The predominantPBDE congener in all atmospheric deposition samples was deca-BDE(BDE 209), which accounted for 493% of the total PBDE concentra-tions, indicating that deca-BDE was mainly used for industrial applica-tions in South Korea. This observation is consistent with domesticconsumption history of PBDEs in South Korea. The depositional fluxesof PBDEs from air varied from 10.1 to 89.0 mg m�2 year�1. The totalPBDE concentrations ranged from 0.45 to 494 ng g�1 dw (average 27.8 ngg�1 dw) in sediments, and from 0.38 to 9.19 ng g�1 ww (average 2.94 ngg�1 ww) in bivalves. The predominant PBDE congener in sediments andbivalves was deca-BDE, which accounted for 490% and 460% of thetotal PBDE concentrations in sediment and bivalves, respectively. Therelatively great contribution of deca-BDE in sediments may be due tolarge quantity of industrial use and chemically stable property of deca-BDE. However, relatively great accumulation of deca-BDE in organismswas not consistent with other studies reporting that penta-BDE was morepersistent and accumulative in organisms than octa-BDE and deca-BDE,or could be formed from debromination process of heavier molecules (deWit, 2002).
Specific accumulation of PBDEs in organisms may vary with the sourceand the organisms’ diets and metabolic capacities. Laboratory studies ofPBDEs using aquatic organisms showed high potential of bioaccumula-tion up to the bioconcentration factor of 1,400,000 (Gustafsson et al.,1999). In the Baltic Sea, strong biomagnification in different tropic levelswas observed (Martin et al., 2004). As PBDE contamination appear to bean emerging problem, further studies on the distribution, fate and bio-accumulation of PBDEs should be conducted in future in South Korea.
2.5.7. PFAs
Only a few reports of concentrations of PFAs in South Korea have beenpublished (Kannan et al., 2002; So et al., 2004; Rostkowski et al., 2006).The distribution, fate and exposure level of PFAs should be intensively

Seung-Kyu Kim et al.126
investigated in South Korea because the very great concentrations ofPFAs from water bodies and human blood in South Korea have beenreported and the single greatest concentration of perfluorooctanesulfon-ate (PFOS) was reported for water in Lake Shihwa.
2.5.7.1. Environmental levels
PFAs concentrations in 11 seawater samples collected from west andsouth coasts of South Korea in 2003 were measured (So et al., 2004).Concentrations of PFOS ranged from 40 to 730000 pg L�1 and the av-erage concentrations of west and south coasts were 147000 and 748 pgL�1, respectively. The greatest concentration, 730000 pg L�1, was ob-served in the vicinity of Shihwa-Banweol industrial complex of westcoast, which was thousands of times greater than those reported in openoceans such as the Pacific Ocean, Atlantic Ocean, Zulu Sea, South ChinaSea, and two orders of magnitude greater than those reported in coastalregions of Japan, Hong Kong and China. The average concentration ofPFOA for overall South Korean waters was similar to that in Tokyo Bay,and 3–50 times lower than in Ai River from Japan, but 1–100 timesgreater than those reported for the open ocean (Table 2.14).
A detailed survey was conducted in the vicinity of the Shihwa-Banweolindustrial complex in 2004 (Rostkowski et al., 2006). Concentrations inseawater in 2004 were 100-fold less than what had been in 2003. However,the average (range) PFOS concentration in water from the inland areasnear Shihwa was as great as 89000 (8000–651000) pg L�1. The concen-tration decreased to 12900 (7330–18300) pg L�1 in Shihwa Lake, and to5210 (2240–8260) pg L�1 in coastal regions with increasing distance fromthe source area. The distribution of PFOA in this region was similar toPFOS with an average concentration of 19220 pg L�1 in inland area,6140 pg L�1 in Shihwa Lake, and 2200 pg L�1 in bay area. The distri-bution pattern of PFNA in this region was similar but the concentrationsof PFHxS, PFBS, PFOSA, PFDA, PFNA, and PFHxAha were one orderof magnitude lower than those of PFOS and PFOA. This means thatthere is a continuous input of PFOS from Shihwa-Banweol inland area.
The concentrations of PFAs were reported for 43 individuals of 10water bird species collected from Hongdo in the vicinity of NakdongRiver, and Nando, west coast of South Korea, between 1993 and 1994(Kannan et al., 2002). PFOS, PFOSA, PFOA and PFHS were analyzed inthis study, but only PFOS was found in bird samples. The greatest andaverage concentration of PFOS in these bird liver samples from SouthKorea were 500 and 80 ng g�1 ww, respectively, while those in Japan were650 and 215 ng g�1 ww, respectively. PFOS was detected in all bird
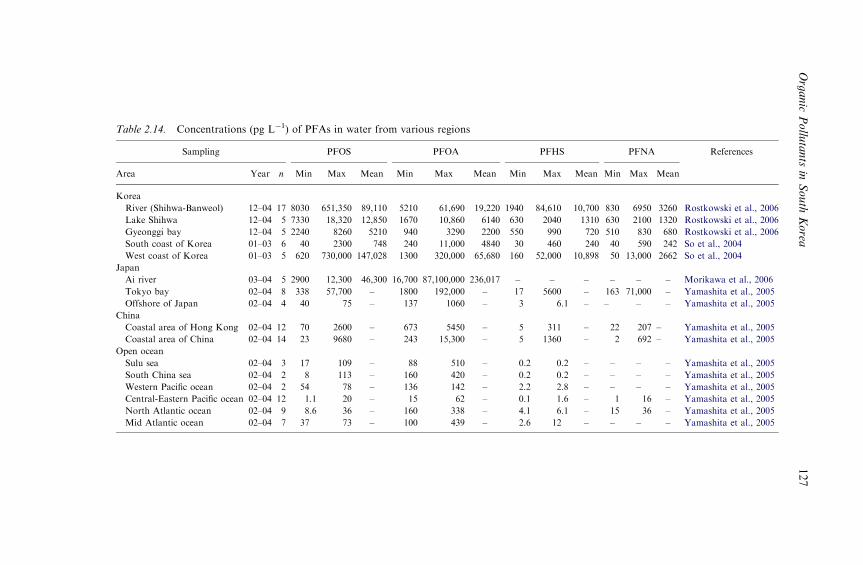
Table 2.14. Concentrations (pg L�1) of PFAs in water from various regions
Sampling PFOS PFOA PFHS PFNA References
Area Year n Min Max Mean Min Max Mean Min Max Mean Min Max Mean
Korea
River (Shihwa-Banweol) 12–04 17 8030 651,350 89,110 5210 61,690 19,220 1940 84,610 10,700 830 6950 3260 Rostkowski et al., 2006
Lake Shihwa 12–04 5 7330 18,320 12,850 1670 10,860 6140 630 2040 1310 630 2100 1320 Rostkowski et al., 2006
Gyeonggi bay 12–04 5 2240 8260 5210 940 3290 2200 550 990 720 510 830 680 Rostkowski et al., 2006
South coast of Korea 01–03 6 40 2300 748 240 11,000 4840 30 460 240 40 590 242 So et al., 2004
West coast of Korea 01–03 5 620 730,000 147,028 1300 320,000 65,680 160 52,000 10,898 50 13,000 2662 So et al., 2004
Japan
Ai river 03–04 5 2900 12,300 46,300 16,700 87,100,000 236,017 – – – – – – Morikawa et al., 2006
Tokyo bay 02–04 8 338 57,700 – 1800 192,000 – 17 5600 – 163 71,000 – Yamashita et al., 2005
Offshore of Japan 02–04 4 40 75 – 137 1060 – 3 6.1 – – – – Yamashita et al., 2005
China
Coastal area of Hong Kong 02–04 12 70 2600 – 673 5450 – 5 311 – 22 207 – Yamashita et al., 2005
Coastal area of China 02–04 14 23 9680 – 243 15,300 – 5 1360 – 2 692 – Yamashita et al., 2005
Open ocean
Sulu sea 02–04 3 17 109 – 88 510 – 0.2 0.2 – – – – Yamashita et al., 2005
South China sea 02–04 2 8 113 – 160 420 – 0.2 0.2 – – – – Yamashita et al., 2005
Western Pacific ocean 02–04 2 54 78 – 136 142 – 2.2 2.8 – – – – Yamashita et al., 2005
Central-Eastern Pacific ocean 02–04 12 1.1 20 – 15 62 – 0.1 1.6 – 1 16 – Yamashita et al., 2005
North Atlantic ocean 02–04 9 8.6 36 – 160 338 – 4.1 6.1 – 15 36 – Yamashita et al., 2005
Mid Atlantic ocean 02–04 7 37 73 – 100 439 – 2.6 12 – – – – Yamashita et al., 2005
Organic
Pollu
tants
inSouth
Korea
127

Seung-Kyu Kim et al.128
samples collected from South Korea and Japan, indicating that it is oneof the most persistent and accumulative PFAs. PFOS has a great poten-tial for bioaccumulation relative to other PFAs including PFOA. Thepersistence and bioaccumulative potential of PFOS in organisms havebeen reported in other studies (Martin et al., 2003; Morikawa et al.,2006). The average concentration of PFOS in human blood in Daegu,South Korea, was similar to that in Japan, 5–7 times greater than that inIndian and Italian samples, and two times less than in American andPolish samples (Kannan et al., 2004). The average PFOA concentrationin human blood was 62 ng ml�1 in South Korea. The level is three timesgreater than in American and Polish, six times greater than in Japaneseand Malaysians, and over 10 times greater than in other general pop-ulations in other countries. It is noteworthy that: (1) most of importedPFAs might be used as water-repellant for textile and leather industries;(2) PFCAs produced by telomerization process are likely to be the mainPFAs source in South Korea after phase out for perflurosulforamideproducts of 3M; and (3) over 50% of PFAs imported from abroad mighthave been used in Daegu and neighboring Kyeongsangbukdo where alarge number of textile plants have been in operation since the 1950s.
Although classical POPs such as PCBs, DDTs and CHLs in environ-mental media from South Korea were relatively less compared to otherindustrialized countries, the emerging pollutants including PBDEs, andPFAs in South Korea were relatively great. Great concentrations ofPFOS and PFOA in human serum were also reported in recent studies insome areas of South Korea. Therefore, it is necessary that the source,distribution, and fate of emerging pollutants in environmental mediashould be investigated nationwide and that the contamination levels andthe exposure routes of pollutants to human and wild life should be as-sessed. Additionally, establishment of toxic release inventory, sourcecontrol and management, and ecological/human risk assessment shouldbe performed. Especially, human exposure from the consumption offishes and shellfishes in South Korea should be assessed for these emerg-ing POPs.
2.6. Fate and transport of POPs in South Korea
2.6.1. Sources of PCDDs/DFs in environmental media
Relatively great concentrations of PCDDs/DFs ranging from 22.15 to92.99 pg I-TEQ g�1 fat wt (with an average concentration of 53.42 pg I-TEQ g�1 (fat wt)) were reported in the blood of residents near a large

Organic Pollutants in South Korea 129
scale industrial waste incinerator (CIES, 2002). Furthermore, more in-cidences of glycosuria and cancer were reported in the population nearthe incinerator facility than those in the distant areas. However, moreepidemiological investigation would be required to accurately assess theeffects of PCDDs/DFs. Extensive measurements of residues in soils, sed-iment at the wastewater discharging sites, agricultural products (includingpoultry), and human blood were performed from 2002 to 2003(Pyoungtak City, 2003). These efforts were focused on revealing thehealth effects from exposure to point sources (i.e., waste incinerator) ofPCDDs/DFs in the environment. Although no clear difference was foundin the extent of contamination of human blood or environmental mediabetween sites near and away from incinerators, the influence of inciner-ator on dioxin exposure was clearly shown by the congener patterns ofPCDDs/DFs that changed with distance from the incinerator in soil andhuman blood (Park et al., 2004). Furthermore, concentrations ofPCDDs/DFs in soils decreased as a function of distance from the incin-erator over the first few hundred meters. However, no clear trend wasfound beyond 200m (for instance, �60 pg WHO-TEQ g�1 near inciner-ator; �15 pg WHO-TEQ g�1 for 20m; and �3 pg WHO-TEQ g�1 formost samples over 200m). Soils 200m away from the incinerators hadsimilar TEQs with an average of 2.32 pg WHO-TEQ g�1 (geomean,n ¼ 3) detected at 7 km away from the incinerator. Thus, there is a char-acteristic spatial distribution of concentration with a clear decrease nearthe source followed by a fairly even distribution.
In contrast to the total concentration, a gradual transition was foundfor the relative composition of PCDDs/DFs congeners with distance fromthe incinerator. The proportion of PCDFs, particularly 1,2,3,4,6,7,8-HpCDF and OCDF, which were the dominant congeners in soils nearsources such as stack gas and fly ash decreased progressively with distancewhile OCDD enriched with distance. A similar trend in patterns of rel-ative concentrations of congeners was observed in blood of residents inthe area. The composition of PCDF congeners among 2,3,7,8-substitutedPCDDs/DFs was significantly greater in blood of residents living nearincinerators than in blood of those living farther away from incinerators.Based on the congener composition together with concentration gradient,the exposure and effect zones were determined to be within 1–1.5 km ofthe incinerator (Park et al., 2004). Several other studies have also reportedpoint sources of dioxins and their effects, i.e., the impact of sources to thesurrounding environment. In the late 1990s, Kim et al. (2002c) and Oh(2001) compared concentrations and composition profiles in soils nearincinerators used to combust solid wastes from paper mills or municipalsolid waste incinerators with those of stack gas. In order to obtain

Seung-Kyu Kim et al.130
information on the emissions of industrial waste incinerators (IWI) totheir surrounding environment, Kim et al. (2005d) determined the con-centrations of PCDDs/DFs in various samples such as stack gas, fly ash,ambient air, soil, pine needles, rice plants, IWI worker blood collectedfrom different distances in the vicinity of IWI. Recently, Kim et al.(2005b) and NIER (2005b) reported the results of a five year projectconducted between 2003 and 2008 to measure concentrations of PCDDs/DFs in stack gas, wastewater, sediment, and soil around incinerators.Based on a meta-analysis of the data collected from these studies, it wasconcluded that there was a common composition pattern which changesgradually from the source while the concentrations decreased more rap-idly before reaching a relatively uniform pattern (Fig. 2.23). At the samedistance from incinerator, similar concentrations were detected in ricefields, upland crop fields, and forests, whereas 30-fold greater concentra-tions were measured in roadside soil (NIER, 2005b). Residual PCDDs/DFs concentrations in soil decreased dramatically to concentrations lessthan 10 pg I-TEQ g�1 within 750m of the incinerator (Fig. 2.23a-1).Gaussian modeling using ISC (Industrial Source Complex) and ISCLT(Industrial Source Complex Long Term), showed maximum concen-trations occurred at a distance of approximately 250–500m from theincinerator (NIER, 2005b). Meanwhile, absolute and relative concentra-tions of PCDF and PCDD congeners, particularly 1,2,3,4,7,8,9-HpCDFand 1,2,3,4,6,7,8,9-OCDF decreased while the concentration of1,2,3,4,6,7,8,9-OCDD increased progressively from source to distant lo-cations beyond 1 km (Fig. 2.23a-2–a-4). It is noteworthy that the trend oftransition in the congener composition was clear, although the meta-analysis did not consider wind direction and land-use pattern, when theroadside samples that were collected within 500m from an incineratorwere excluded. Thus, incinerators have a significant impact only within afew kilometers.
The distance-dependent transition in relative congener compositionwas also observed in aged soils that had been affected by a forest fire(Fig. 2.23b-1) (Kim et al., 2003a). Five months after burning, concen-trations decreased to be the same in unburned soil at a remote area.However, the weathering of congeners seems to progress more slowly(Fig. 2.23b-2–b-4). The predominance of OCDD composition in aged orremote soils results from: (1) its intrinsic fate property such as low vaporpressure, water solubility, biodegradability, and reaction with hydroxylradicals; (2) release from use of pentachlorophenol (PCP); and (3) longenvironmental residence due to strong air-particle association and itsdeposition to underlying surface. The analysis of congener composition isfound to be useful to identify the sources.

0.0
0.2
0.4
0.6
0.8
1.0
pgI-
TE
Qg-1
dw.
pgI-
TE
Qg-1
dw.
0
1
2
3
4
5
0.00
0.01
0.02
0.03
0.04
1,2,
3,4,
6,7,
8,9-
OC
DF
frac
tion
(%)
1,2,
3,4,
6,7,
8,9-
OC
DF
frac
tion
(%)
1,2,
3,4,
6,7,
8,9-
OC
DF
frac
tion
(%)
1,2,
3,4,
6,7,
8,9-
OC
DF
frac
tion
(%)
0.0
0.1
0.2
0.3
0.4
0.5
0.6
Time after fire (month)
Time after fire (month)
0 5 10 15 20 25 301,2,
3,4,
6,7,
8,9-
OC
DD
fra
ctio
n (%
)
1,2,
3,4,
6,7,
8,9-
OC
DD
fra
ctio
n (%
)
0.2
0 5 10 15 20 25 30
Time after fire (month)0 5 10 15 20 25 30
Time after fire (month)0 5 10 15 20 25 30
0.4
0.6
0.8
1.0
Distance from incinerator (km)0 4 6 8 10
0
40
80
120
160
km0 10 20 30
0
40
80
120
160
0.0
0.1
0.2
0.3
0.4
km0 10 20 30
0.0
0.1
0.2
0.3
0.4
km0 10 20 30
0.000.010.020.030.040.05
0.00
0.01
0.02
0.03
0.04
0.05
(a-1)
(a-2)
(a-3)
(a-4)
(b-1)
(b-2)
(b-3)
(b-4)
unburnt
unburnt
unburnt
unburnt
2
Distance from incinerator (km)0 4 6 8 102
Distance from incinerator (km)0 4 6 8 102
Distance from incinerator (km)0 4 6 8 102
Fig. 2.23. Variation in total PCDDs/DFs concentration and congener fractions measured
for soils with distance from a source (‘a’ group, Kim et al., 2002c; Park et al., 2004; Kim et
al., 2005d; Oh et al., 2006; NIER, 2005b) and with time after forest fire (‘b’ group, Kim et al.,
2003a). An unburned remote soil sample was assigned to 24th month after fire.
Organic Pollutants in South Korea 131

Seung-Kyu Kim et al.132
2.6.2. Case study of multi-media fate of POPs (PAHs vs. PCBs)
Classical organochlorine POPs are hydrophobic and semi-volatile. Theydistribute among environmental media via inter-media transfer, parti-tioning, volatilization, and dry/wet deposition. The direction and mag-nitude of movement across media are dependent on media andconcentration at which they were emitted, chemical properties includingvolatility, solubility, hydrophobicity, and persistency, meteological/mor-phological/ecological conditions of the system. These factors vary withtime and space. For determining the direction and magnitude of move-ment among media, it is inevitable to simultaneously measure chemicalresidues and environmental factors in each of the media. One can inferthe transfer (or transport) among media through thermodynamic indexsuch as fugacity ratio and environmental processes such as dry/wet ordeposition flux.
The multi-media fate of PAHs and PCBs in Seoul Metropolitan citywith a population of over 10 million has been investigated by use ofconcurrent measurements in each season for multiple environmental me-dia including air (gas and particle phases), water (dissolved and sus-pended solid phases), sediment, terrestrial soil and plant leaf, and aquaticplank tonic organisms (Kim, 2004). To our knowledge, this is the onlystudy to describe multimedia fate and distribution of hydrophobic or-ganic compounds (HOCs) in South Korea that has been conducted basedon field-measured data. The study revealed that knowledge of the inter-relationships among different media is critical to elucidating distributionand behavior of HOCs in each medium. In the study, the differences inoverall fate such as distribution, behavior, and transport pathway wereobserved between PAHs and PCBs. We describe below some of thehighlights of the study of multimedia fate and transport of POPs in SouthKorea.
2.6.2.1. Air–water exchange
‘Fugacity’, representing ‘escaping tendency’ of a chemical in a medium,has been widely applied in assessing the status of fate and transport of achemical in and among environmental media (Mackay, 1991). If oneknows chemical concentration and fugacity capacity in each medium, thefugacity difference can be calculated as in the Eq. (2)
f if j
¼CiZi
CjZj
(2)

(a) Fugacity ratio between air vapor and dissolved water
PH AN
FLR
PY BaA CH
BbF
BkF
BeP
BaP PE IP
BPE DA
f AV
/fD
W
f AV
/fD
W
1e-3
1e-2
1e-1
1e+0
1e+1
1e+2
1e+3
1e+4
AugustOctoberDecemberFebruary
1e-2
1e-1
1e+0
1e+1
1e+2
Air vapor in equilibrium with soilObserved air vapaor
(b) Gaseous exchange flux between air and water
PH AN
FLR
PY BaA CH
BbF
BkF
BeP
BaP PE IP DA
BPE
Net
Gas
eous
Fux
(m
ol m
-2 d
ay-1
)
-8e-13
-6e-13
-4e-13
-2e-13
0
2e-13
August OctoberDecemberFebruary
PCB28
PCB52
PCB101
PCB110
PCB153
PCB138
PCB28
PCB52
PCB101
PCB110
PCB153
PCB138
Net
Gas
eous
Flu
x (m
ol m
-2 d
ay-1
)
0
1e-15
2e-15
3e-15
4e-15
5e-15
6e-15
NC
Fig. 2.24. Fugacity ratios (a) and gaseous exchange flux (b) between air and river water for
PAHs and PCBs from Seoul Metropolitan city in 2001–2002 (quoted from Kim (2004)); fAV
and fDW is fugacity in air vapor and dissolved water, respectively. Flux of PCBs was
calculated on basis of observed vapor PCBs and ‘NC’ indicate ‘not calculated’.
Organic Pollutants in South Korea 133
where, Ci,j, Zi,j, and fi,j, are chemical concentrations (mol m�3), fugacitycapacity (mol m�3 Pa�1), and fugacity (Pa) in medium i and j, respec-tively. The ratio of i–j fugacity, fi/fj is a measure of departure from equi-librium. Values greater than unity indicate that there is net-diffusion fromthe medium i to medium j. Conversely, values less than unity indicate netdiffusion to the medium i. For a system in equilibrium, fi/fj is approx-imately equal to 1. Based on these fugacity ratios among media, one candetermine the moving direction of a chemical between two contactingmedia. For example, air–water fugacity ratios measured for PAHs inSeoul city area were over 1 in all seasons but summer, indicatingthe diffusive movement from air-to-water (Fig. 2.24a). Contrarily, the

Seung-Kyu Kim et al.134
air–water fugacity ratios of PCBs were below unity, which suggestsevaporation from water to air (Fig. 2.24a).
In addition to qualitative assessment of direction of movement of achemical using fugacity ratio, quantitative assessment is determined bycalculating net gaseous diffusion across air–water interface (Mackay et al.(1986); Baker and Eisenreich, 1990; Achman et al., 1993). The two-filmtheory as shown in Eq. (3) has been frequently used to determine thegaseous diffusion rate of chemicals (Whitman, 1923; Liss and Slater, 1974).
F ¼ kol CDW �CAV
H0
� �(3)
where, F is the flux (mol m2 day�1), and kol (m day�1) is the overall masstransfer coefficient for movement across air–water interface. CDW, CAV,and H0 are dissolved concentrations in bulk water and the air vapor con-centration in bulk air of HOCs, and the dimensionless Henry’s law con-stant, respectively.
The air-to-water flux of PAHs and PCBs in the Han River was dis-tinctive (Fig. 2.24b). The overall gaseous transfer of PCB congeners oc-curred from water to air with greater transfer rates for lower chlorinatedcongeners; for instance, 4.34� 10�5 mol m�2 day�1 for PCB 28 and4.84� 10�6 mol m�2 day�1 for PCB 153. Obviously, the mass transfercoefficient is greater for lighter substances. The transfer of PAHs oc-curred from air to water with higher values in winter than in summer.This observation indicates that the burden and fate of PAHs in the HanRiver aquatic system can be strongly influenced by the variation in air-borne concentration (i.e., atmospheric emission) whereas the distributionof PCBs could be controlled by the burden discharged into the waterbody (e.g., desorption from historically contaminated sediments or directrelease into water) rather than atmospheric input.
The difference in environmental release of PAHs and PCBs is furthersupported by their differences in seasonality of atmospheric concentra-tion. PAH concentrations in air increased gradually in winter. This sea-sonality was also observed in more extensive measurements in Seoul city’sair (Panther et al., 1999). The seasonality in concentrations of PAHs inurban areas often results from greater combustion of fuel for heating inwintertime. To the contrary of PAHs, the potential emission sources ofPCBs such as waste incinerators or metallurgical processes do not showsignificant seasonality. Atmospheric concentrations of PCBs were greaterin summer than in winter (Yeo et al., 2003). In particular, a strong neg-ative linear regression between partial pressure (i.e., ln p; concentration)of atmospheric PCBs and the reciprocal of temperature (i.e., 1 T�1) wasobserved in urban air (Yeo et al., 2004a). Negative slopes of greater

Organic Pollutants in South Korea 135
magnitude derived from the Clausius-Clapeyron equation (Eq. 4) indicatetemperature-dependent distributions of PCBs in the air. PCBs in air maynot originate from direct release but by secondary source such as vol-atilization from terrestrial surface.
ln p ¼m
Tþ b (4)
where, p is partial pressure (Pa), T is ambient air temperature (K), and mand b are constant.
The major source of by-product PCB emission (�93%) was estimatedto be ferrous metal industry (see Section 2.4.1.1). All metal productionfactories are located in coastal areas far from the Seoul metropolitanarea. A possible emission source in Seoul is waste incinerators. However,the contribution from waste incinerators is generally small (see Fig. 2.6).Thus, direct atmospheric release is not likely to influence the distributionof PCBs in the air over South Korea. On the other hand, the leakage orspillage from capacitors and transformers may be a potential emissionsource of PCBs. This emission process is categorized as a major contrib-utor of PCBs into the environment (EMEP/CORINAIR, 2000). Al-though regulation of the use of PCBs began in 1979, existing PCB-containing articles were in use for other purposes, except electric heater,until 1996. Therefore, PCBs are likely to have been introduced intoaquatic system through leakage or spills from the use and/or storage ofthe articles. PCB concentrations were greater at the sites in the tributariesof the Han River flowing through the urban and industrial areas (Kim,2004).
OCPs such as DDTs, HCHs, CHLs, and endosulfan showed a similarseasonal variation of atmospheric levels as PCBs with greatest levels insummer (Yeo et al., 2004a). This seasonal distribution is due to limitedenvironmental release of OCPs following ban of OCPs in South Korea.
In contrast to PCBs and OCPs, the seasonal trend of atmosphericPCDDs/DFs in South Korea is not likely to be influenced by temper-ature, i.e., evaporation from surface. Oh et al. (2006) measured seasonaltrend in ambient air around a large-scale municipal waste incineratorfrom August 1999 to November 2000. PCDDs/DFs concentrationsranged from 0.22 to 1.15 pg I-TEQ m�3 (n ¼ 10, geomean ¼ 0.64 pg I-TEQ m�3). The great concentrations, including the greatest value, weredetected in winter even though there was a weak relationship betweentemperature and concentration (r2 ¼ 0.247). This seasonal trend was alsoobserved in monthly bulk atmospheric deposition samples at Busan andits surroundings (Moon et al., 2005). PCDDs/DFs bulk deposition fluxwas lowest in the summer season when temperature and precipitation

summer (n=32)
fall (n
=26)
winter (n
=28)
spring (n
=3)
summer (n=26)
fall (n
=26)
winter (n
=26)
spring (n
=26)
summer (n=33)
fall (n
=33)
winter (n
=33)
spring (n
=33)
pg I
-TE
Q m
-3
0
1
2
3
4
2000 2001 2002 2003
NI
Fig. 2.25. Seasonal variation of atmospheric PCDDs/DFs concentration in Korea (from
NIER, 2001, 2002, 2003). The boundary of the box indicates the 25th and 75th percentile,
and a line within the box marks the median. Whiskers above and below the box indicate the
90th and 10th percentiles. Points and dotted lines are the arithmetic mean and outlying
points. Values in the parenthesis are the number of samples. Three points from spring in
2001 (‘NI’) were not included.
Seung-Kyu Kim et al.136
were highest, whereas the flux was high in winter and moderate in springand fall. Wet deposition by precipitation together with dry deposition isknown to play a major role to scavenge PCDDs/DFs air to underlyingsurface. Thus, the lesser deposition flux that occurs in summer implies aminimum concentration would occur in air during the warm season. Ex-tensive seasonal monitoring of ambient air was performed from 2000 to2002 by NIER (2001, 2002, 2003). Atmospheric distribution of PCDDs/DFs was not expected to show any seasonality because waste incineratorsand industrial facilities, two major emission sources of PCDDs/DFs, mayemit PCDDs/DFs at a fairly constant rate throughout the year. However,as shown in Fig. 2.25, the concentrations in winter were significantlygreater than those in other seasons in 2001 and 2002 (ANOVA test,po0.05). This might be a result of lower mixing heights and reducedphotochemical degradation of PCDDs/DFs in winter. The little temper-ature dependency of atmospheric PCDDs/DFs concentration, is differentfrom those of PCBs and OCPs, and indicates the ongoing release of

Organic Pollutants in South Korea 137
PCDDs/DFs into air. Thus, it is expected that the levels in other media,soil in particular, may also increase or only decrease slowly even thoughemission of PCDDs/DFs was dramatically reduced (Fig. 2.25). Therefore,further regulations on PCDDs/DFs emission is needed in South Korea.
The third piece of evidence for differences in the sources and fate ofPAHs and PCBs is the fingerprint of isomers (or congeners) of eachchemical group. Based on the differences in thermodynamic stabilityamong PAH compounds, PAHs molecular indices have been widely usedto identify potential PAH sources. For instances, PHE:ANT ratio o10and FLT:PY ratio 41 tends to suggest that PAH contamination arisesfrom pyrogenic origin (Yunker et al., 2002). Additionally, ratios such asBaA:CHR and I123cdP:BghiP have been also suggested as useful indicesto identify various combustion processes (Dickhut et al., 2000; Yunker etal., 2002). Molecular indices from most sediment and suspended solidsamples in the Han River suggested petroleum combustion as the majorsource of PAHs (Kim, 2004). Thus, it may be inferred that atmosphericrelease from petroleum combustion mainly contributed to contaminationof the aquatic systems in Seoul. Alternatively, PCBs in sediment of theHan River appears to have originated from leakage of PCBs mixturesbased on their congener pattern that is similar to that of Aroclor mixtures(ca., Aroclor 1242:1254:1260 ¼ 2:1:1) (Kim, 2004). This pattern fromsediment was significantly different with those of terrestrial soils andsettled air particles (Kim, 2004).
2.6.2.2. Control factors for multimedia fate
Many factors influence in complicated manners the magnitude and di-rection of transport and the distribution of chemicals in the environment.The factors include both the chemical properties and environmental var-iables such as emission, metrological and morphological conditions.Therefore, it is necessary to identify dominant factors to understand thefate and distribution of POPs in a system and to establish system-specificcontrol strategies for POPs.
The difference in the emission histories of PAHs and PCBs was thepredominant factor for their fate, transport, and distribution in Seoul.Besides transfer directions among media such as air–water partitioning,the relative residue levels in individual medium may be determined basedon sources of release. PCB 52 and BaA have similar hydrophobicities(i.e., log Kow ¼ 5.84 vs. 5.55 for PCB 52 and BaA, respectively) butHenry’s law constant for PCB 52 is 100-fold higher. Thus, if both thecompounds are assumed to be released to the same media, BaA wouldshow higher partitioning to aqueous media in an air–soil–water-sediment
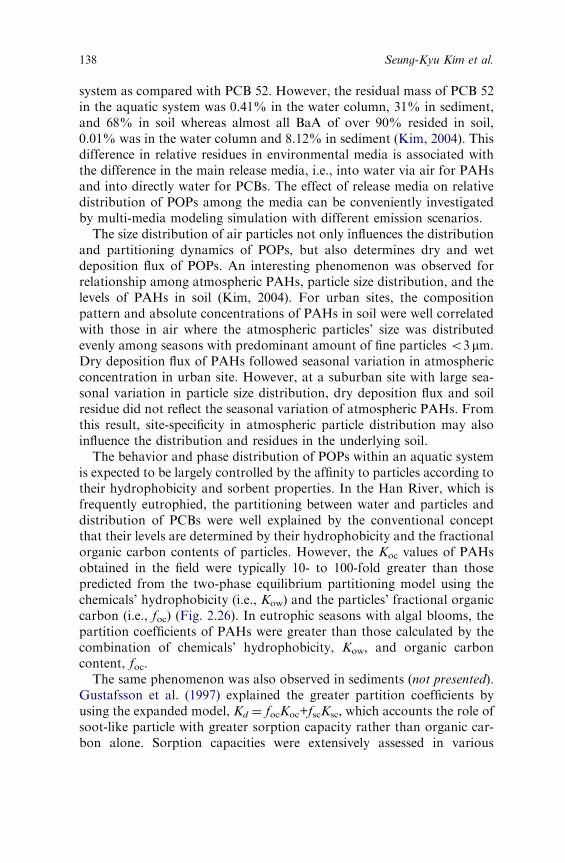
Seung-Kyu Kim et al.138
system as compared with PCB 52. However, the residual mass of PCB 52in the aquatic system was 0.41% in the water column, 31% in sediment,and 68% in soil whereas almost all BaA of over 90% resided in soil,0.01% was in the water column and 8.12% in sediment (Kim, 2004). Thisdifference in relative residues in environmental media is associated withthe difference in the main release media, i.e., into water via air for PAHsand into directly water for PCBs. The effect of release media on relativedistribution of POPs among the media can be conveniently investigatedby multi-media modeling simulation with different emission scenarios.
The size distribution of air particles not only influences the distributionand partitioning dynamics of POPs, but also determines dry and wetdeposition flux of POPs. An interesting phenomenon was observed forrelationship among atmospheric PAHs, particle size distribution, and thelevels of PAHs in soil (Kim, 2004). For urban sites, the compositionpattern and absolute concentrations of PAHs in soil were well correlatedwith those in air where the atmospheric particles’ size was distributedevenly among seasons with predominant amount of fine particles o3 mm.Dry deposition flux of PAHs followed seasonal variation in atmosphericconcentration in urban site. However, at a suburban site with large sea-sonal variation in particle size distribution, dry deposition flux and soilresidue did not reflect the seasonal variation of atmospheric PAHs. Fromthis result, site-specificity in atmospheric particle distribution may alsoinfluence the distribution and residues in the underlying soil.
The behavior and phase distribution of POPs within an aquatic systemis expected to be largely controlled by the affinity to particles according totheir hydrophobicity and sorbent properties. In the Han River, which isfrequently eutrophied, the partitioning between water and particles anddistribution of PCBs were well explained by the conventional conceptthat their levels are determined by their hydrophobicity and the fractionalorganic carbon contents of particles. However, the Koc values of PAHsobtained in the field were typically 10- to 100-fold greater than thosepredicted from the two-phase equilibrium partitioning model using thechemicals’ hydrophobicity (i.e., Kow) and the particles’ fractional organiccarbon (i.e., foc) (Fig. 2.26). In eutrophic seasons with algal blooms, thepartition coefficients of PAHs were greater than those calculated by thecombination of chemicals’ hydrophobicity, Kow, and organic carboncontent, foc.
The same phenomenon was also observed in sediments (not presented).Gustafsson et al. (1997) explained the greater partition coefficients byusing the expanded model, Kd ¼ focKoc+fscKsc, which accounts the role ofsoot-like particle with greater sorption capacity rather than organic car-bon alone. Sorption capacities were extensively assessed in various

Log Kow
3 4 5 6 7 8 9
Log
Koc
(L/K
g)
3
4
5
6
7
8
9
PAHs
PCBs
Fig. 2.26. Organic carbon-normalized partitioning coefficients (log Koc) in the Han river
water column for PAHs and PCBs (quoted from Kim (2004)); Linear solid line indicates the
estimates from two-phase partitioning model (Karickhoff, 1981) and dotted line denotes
those from three-phase partitioning model involving colloidal phase (Baker et al., 1986),
where Kcolloid ¼ Koc was assumed and average DOC was used.
Organic Pollutants in South Korea 139
particles (Cornelissen et al., 2005) or other POPs (Persson et al., 2002).This observation supports that the fate and distribution of PAHs in lo-cations with intensive combustion activity could be strongly influenced byexternal particles (e.g., soot-like particles) rather than organic carbonalone. Organic carbon-based chemical concentrations in sediment havebeen used to derive sediment quality guideline (SQG) to protect aquaticbenthic organisms (DiToro et al., 1991; Swartz, 1999; Rogers, 2002). Theequilibrium partitioning (EqP) method is currently supported by the USEPA for the development of sediment quality criteria for non-ionic or-ganic chemicals. The EqP approach assumes that partitioning of sedi-ment-bound chemicals between pore water and sediment organic carbonis governed by the organic carbon partition coefficient (Koc) under steady-state conditions. These results indicates that further studies of sedimentquality criteria needs to be conducted on soot carbon-bound concentra-tion but not organic carbon-based concentration alone.
In contrast to PAHs, PCB congeners did not reach the equilibriumbetween suspended particles and dissolved water (Fig. 2.26). The morechlorinated congeners are, the greater is algal bloom, the greater was the

Seung-Kyu Kim et al.140
deviation in partition coefficients from the equilibrium, based on theKoc�Kow plot (Kim, 2004). This indicates that PCBs are still in the proc-ess of sorption from dissolved water to suspended particles.
2.6.3. Long-range transport (LRT)
One of issues of POPs is their Long Range Transport (LRT) passing thenational boundaries. UNECE/EMEP (United Nations Economic Com-mission for Europe/Co-operative program for monitoring and evaluationof long range transmission of air pollutants in Europe) adopted ‘CLRTprotocol’ in 1998 to control trans-boundary movement of 16 potentialPOPs (http://webdab.emep.int/). In 2004, Stockholm Convention for in-ternational cooperation against POPs entered into force. In addition, theproject, funded by the GEF (Global Environment Facility) and imple-mented by the UNEP, was performed to make regional assessment of thedamages and threats posed by Persistent Toxic Substances (PTS;www.chem.unep.ch/pts). As a result of GEF-UNEP project, countriesinvolved in Region VII (i.e., Central and North East Asia) submitted theregional report in which dioxins and PCBs were assigned as priority PTSto manage in the region in 2002. In East Asia, there is another interna-tional effort to control trans-boundary movement of POPs such as ‘Es-tablishment of POPs Information Warehouse in East Asia’, throughwhich countries in the region share POPs monitoring data and cooperatefor POPs control.
LRT of atmospheric pollutants has become a concern in South Koreapartly because release of numbers of pollutants in eastern China may be apotential source of air pollution in South Korea (Kwon et al., 2002).Studies of LRT, however, have focused on suspended particulate mattersuch as PM10 or PM2.5 (Lee et al., 2006b), particle-associated heavymetals (Han et al., 2002), or acidic air pollutants (Park and In, 2002).Since Gosan in Jeju Island is used as a reference site for ACE-Asia(Asian-Pacific Regional Aerosol Characterization Experiment) project in2001, many studies are performed for LRT of pollutants from East Asia.Ghim et al. (2003) reported the variation in atmospheric concentrationsof POPs including PCDDs/DFs, coPCBs, OCPs, and PAHs in Asian dustat the reference site, Gosan. Little increase in atmospheric concentrationsof POPs was observed during the Yellow Sand season except for PAHs.Another study measured atmospheric bulk deposition of PCDDs/DFs inurban and suburban areas in South Korea during one year includingperiods of Asian dust. Elevated levels were not also observed in thepresence of Asian dust (Moon et al., 2005). Instead, they illustrated theeffect of Asian dust on South Korean air by using the specific congener

Organic Pollutants in South Korea 141
patterns observed during the period, clearly differing from those of otherseasons. These studies were, however, restricted to a short term. Thus,further long-term studies are needed on trans-boundary LRT of POPs inthis region.
LRT dynamics of POPs can be predicted and evaluated by environ-mental multimedia modeling (MMM). The models with different spatialscale such as POPsME, EDCSeoul, and KoEFT-PBTs have been devel-oped to predict the fate and transport of classical POPs or VOCs in multi-media environments (Lee et al., 2004; NIER, 2001, 2002, 2003; Lee,2005). These models are considered to serve as a basis for the futuredevelopment of LRT models of the north-east Asian region.
2.7. Conclusions
Due to their persistent, bioaccumulative, and toxic properties, POPs areworldwide categorized as priority pollutant group to be prohibited in theiruse and distribution, or removed from environments. Long-range trans-portation of POPs has result in relevant international efforts such asStockholm Convention. South Korean government has followed activelythe needs of the convention; 1) regulation in use, distribution, and treat-ment of POPs substances itself and/or POPs-containing facilities andwastes, 2) development and application of BAT and BEP to reduce POPsrelease, and 3) monitoring and investigation on POPs contamination na-tionwide. Nevertheless, the results of investigation and research effortswere not assessed through integrated overview and subsequently the POPsstatus in South Korean environments is not still evaluated until now.
The present study exhibits the meta-analysis results of data collectedfrom total 228 references published since mid-1990s. Emission, contam-ination and exposure levels in environments and human for both classicaland emerging POPs were firstly and thoroughly reviewed together withhistorical governmental management strategy and plans. Moreover, theenvironmental fate and transport natures of POPs in South Korean en-vironments were analyzed, from which POPs behavior status were eval-uated to suggest the efficient management strategy.
Most studies were focused on the classical POPs such as organochlo-rinated pollutants and little for emerging POPs such as PBDEs and PFAs.Preliminary emission inventory were estimated by use of the top-downapproach for by-product POPs. Recently, an emission inventory, basedon measurements, was established for dioxins. Over 80% of the totalemission for all by-products was determined to be from two majorsources, viz. waste incineration and metal production processes, among

Seung-Kyu Kim et al.142
the sources, suggesting the necessity of control focused on correspondingsources.
Based on the seasonal atmospheric levels and their environmental fate,existing emissions are still influencing significantly the distribution of di-oxins and PAHs but not for PCBs and OCPs. Due to governmentalregulatory action, during the most recent five years, emissions of dioxinshave been significantly reduced. However, the concentration levels inenvironments are likely to have decreased but the reduction extent wasless clear, compared with that of emission. In particular, annual emissionrate per unit area was still in great, relative to other countries. Conse-quently, environmental concentrations and human exposure levels in thesource areas frequently exceeded criteria suggested to protect environ-ments and human. Thus, to decrease human and ecological exposure,more reductions in emissions should be required. Besides dioxins, con-taminations of other classical POPs (including PCBs and OCPs) werelocalized in hot spots, such as coastal industrial area and/or big harborsand waste incineration areas. In some of these areas, concentrations ofresidues exceeded corresponding quality criteria. If these hot spots areexcluded from the analysis, general populations and ambient environ-ments did not contain concentrations exceeding established criteria. Incontrast to classical POPs, South Korean environments were observed tobe relatively more contaminated with emerging POPs, than were othercountries. This is likely due to the recent dramatic economic growth ofSouth Korea. However, to evaluate emission rates status and trendsof contamination of South Korea further monitoring efforts should beperformed, especially for the emerging pollutants.
REFERENCES
3M Company, 2000. Phase-out Plan for POSF-based products; U.S. EPA Administrative
Record AR226-0588. U.S. Environmental Protection Agency, Washington, DC.
Achman, D.R., Hornbuckle, K.C., Eisenreich, S.J., 1993. Volatilization of polychlorinated
biphenyls from Green Bay, Lake Michigan. Environ. Sci. Technol. 27, 75–87.
Baars, A.J., Bakker, M.I., Baumann, R.A., Boon, R.E., Freijer, J.I., Hoogenboom, L.A.P.,
Hoogerbrugge, R., van Klaveren, J.D., Liem, A.K.D., Traag, W.A., de Vries, J., 2004.
Dioxins, dioxin-like PCBs and non-dioxin-like PCBs in foodstuffs: Occurrence and di-
etary intake in The Netherlands. Toxicol. Lett. 151, 51–61.
Bailey, R.E., 2001. Global hexahlorobenzene emissions. Chemosphere 43, 167–182.
Baker, J.E., Capel, P.D., Eisenreich, S.J., 1986. Influence of colloids on sediment-water
partition coefficients of polychlorinated biphenyl congeners in natural waters. Environ.
Sci. Technol. 20, 1136–1143.

Organic Pollutants in South Korea 143
Baker, J.E., Eisenreich, S.J., 1990. Concentration and fluxes of polycyclic aromatic hydro-
carbons and polychlorinated biphenyls across the air–water interface of Lake Superior.
Environ. Sci. Technol. 24, 342–352.
Bamford, H.A., Poster, D.L., Baker, J.E., 1999. Temperature dependence of Henry’s law
constants of thirteen polycyclic aromatic hydrocarbons between 41C and 311C. Environ.
Toxicol. Chem. 18, 1905–1912.
Baumard, P., Budzinski, H., Garrigues, P., Burgeot, T., Bellocq., J., 1998. Origin and bio-
availability of PAHs in the Mediterranean Sea from mussel and sediment records. Est-
uar. Coast. Shelf Sci. 47, 77–90.
van den Berg, M., Birnbaum, L., Bosveld, A.T.C., Brunstrom, B., Cook, P., Feeley, M.,
Giesy, J.P., Hanberg, A., Hasegawa, R., Kennedy, S.W., Kubiak, T., Larsen, J.C., van
Leeuwen, F.X.R., Liem, A.K.D., Nolt, C., Peterson, R.E., Poellinger, L., Safe, S.,
Schrenk, D., Tillitt, D., Tysklind, M., Younes, M., Wærn, F., Tim Zacharewski, T.,
1998. Toxic equivalency factors (TEFs) for PCBs, PCDDs, and PCDFs for humans and
wildlife. Environ. Health Persp. 106, 775–792.
Bernard, A., Hermans, C., Broeckaert, F., De Poorter, G., De Cock, A., Houins, G., 1999.
Food contamination by PCBs and dioxins. Nature 401, 231–232.
Bocio, A., Domingo, J.L., 2005. Daily intake of polychlorinated dibenzo-p-dioxins/poly-
chlorinated dibenzofurans (PCDD/PCDFs) in foodstuffs consumed in Tarragona, Spain:
A review of recent studies (2001-2003) on human PCDD/PCDF exposure through the
diet. Environ. Res. 97, 1–9.
deBoer, J., deBoer, K., Boon, J.P., 1999. Polybrominated biphenyls and diphenyl ethers. In:
Paasivirta, J. (Ed.), The Handbook of Environmental Chemistry. Springer Verlag, New
York, USA.
Braekevelt, E., Tittlemier, S.A., Tomy, G.T., 2003. Direct measurement of octanol-water
partition coefficients of some environmentally relevant brominated diphenyl ether con-
geners. Chemosphere 51, 563–567.
Breivik, K., Alcock, R., Li, Y.-F., Bailey, R.E., Fiedler, H., Pacyna, J.M., 2004. Primary sources
of selected POPs: Regional and global scale emission inventories. Environ. Pollut. 128, 3–16.
Breivik, K., Sweetman, A., Pacyna, J.M., Jones, K.C., 2002a. Towards a global historical
emission inventory for selected PCB congeners – a mass balance approach 1. Global
production and consumption. Sci. Total Environ. 290, 181–198.
Breivik, K., Sweetman, A., Pacyna, J.M., Jones, K.C., 2002b. Towards a global historical
emission inventory for selected PCB congeners – a mass balance approach 2. Emission.
Sci. Total Environ. 290, 199–224.
Bruner, S., Hornung, E., Santi, H., Wolff, E., Plringer, O.G., Altschuh, J., Bruggemann, R.,
1990. Henry’s law constants for polychlorinated biphenyls: Experimental determination
and structure-property relationships. Environ. Sci. Technol. 24, 1751–1754.
BUA, 1997. Bisphenol A BUA-Stoffbericht 203 (Chemiker, B.f.u.A.B.d.G.D., Ed.), Hirzel,
Stuttgart.
Budzinski, H., Jones, I., Bellocq, J., Pierard, C., Garrigues, P., 1997. Evaluation of sediment
contamination by polycyclic aromatic hydrocarbons in the Gironde estuary. Mar. Chem.
58, 85–97.
Canadian Council of Ministers of the Environment (CCME), 1999. Canadian Environ-
mental Quality Guidelines, CCME Publication No. 1299, Quebec.
Canadian Council of Ministers of the Environment (CCME) website (http://www.ccme.ca/
assets/pdf/sqg_summary_table.pdf).
Cetin, B., Odabasi, M., 2005. Measurement of Henry’s law constants of seven polybromin-
ated diphenyl ether (PBDE) congeners as a function of temperature. Atmos. Environ. 39,
5273–5280.

Seung-Kyu Kim et al.144
Chae, K.-R., Kim, W.-S., Kim, S.-Y., Lee, S.-H., Jung, D.-Y., Kim, H.-S., Jung, H.-S.,
Yoon, C.-S., Yoon, T.-H., Lee, Y.J., Choi, S.-Y., 2004. Levels of dioxins in imported
food (I). The Annual Report of KFDA (in Korean). 8-1, 352-364.
Charnley, G., Doull, J., 2005. Human exposure to dioxins from food, 1999–2002. Food
Chem. Toxicol. 43, 671–679.
Choi, D., Hu, S., Jeong, J., Won, K., 2001b. Analysis of dioxins in meat by HRGC/HRMS.
Anal. Sci. Tech. 14, 88–93.
Choi, D., Hu, S., Jeong, J., Won, K., Song, I., 2002. Determining dioxin-like compounds in
selected Korean food. Chemosphere 46, 1423–1427.
Choi, J.-W., Lee, K.-S., Lee, J.-K., Noh, K.-B., 1987. Residues levels of organochlorine
pesticides on paddy field soils in the Chungnam area. Korean J. Environ. Agric. (in
Korean) 6, 12–21.
Choi, J.W., Matsuda, M., Kawano, M., Min, B.Y., Wakimoto, T., 2001a. Accumulation
profiles of persistent organochlorines in waterbirds from an estuary in Korea. Arch.
Environ. Contam. Toxicol. 41, 353–363.
Choi, K., 2002. Current status and perspectives of POPs research in Republic of Korea.
Proceeding of the Workshop on Environmental Monitoring of Persistent Organic Pol-
lutants (POPs) in East Asian Countries. Ministry of the Environment, Japan, 2nd–4th
December 2002, Tokyo/Tsukaba, Japan.
Choi, K.-I., Lee, D.-H., Kim, N.J., 2004. The distributions of PCDDs/DFs in leachate from
municipal solid waste landfills in Korea. J. Korean Soc. Waste Manage. 21(2), 143–151.
Chung, Y.H., Shin, S.K., Jang, S.K., 2001. Emission patterns and formation mechanism of
PCDDs/PCDFs in bleaching wastewater (I). Anal. Sci. Technol. (in Korean) 14, 266–
273.
Citizen Institute of Environmental Studies (CIES), 2002. Investigation on Residents’ health
near a waste incinerator, KeumHo Environment Incoporation. Research report (in Ko-
rean), Seoul, Korea.
Cooper, D.A., 2005. HCB, PCB, PCDD and PCDF emissions from ships. Atmos. Environ.
39, 4901–4912.
Cornelissen, G., Gustafsson, O., Bucheli, T.D., Jonker, M.T.O., Koelmans, A.A., van No-
ort, P.C.M., 2005. Extensive sorption of organic compounds to black carbon, coal, and
kerogen in sediments and soils: Mechanisms and consequences for distribution, bioac-
cumulation, and biodegradation. Environ. Sci. Technol. 39, 6881–6895.
Cox, P., Drys, G., 2003. Directive 2003/53/EC of the European Parliament and of the
council. Official Journal of the European Communities, 17.7.2003, document L178.
Darnerud, P.O., 2003. Toxic effects of brominated flame retardants in man and in wildlife.
Environ. Int. 29, 841–853.
Darnerud, P.O., Atuma, S., Aune, M., Bjerselius, R., Glynn, A., Grawe, K.P., Becker, W.,
2006. Dietary intake estimations of organohalogen contaminants (dioxins, PCB, PBDE
and chlorinated pesticides, e.g. DDT) based on Swedish market basket data. Food
Chem. Toxicol. 44, 1597–1606.
DEPA (Danish Environmental Protection Agency), 1999. Brominated Flame Retardants-
Substance Flow Analysis and Assessment of Alternatives. http://www.mst.dk (accessed
Dec. 1999).
Di Toro, D.M., Zarba, C., Hansen, D.J., Berry, W., Swartz, R.C., Cowan, C.E., Pavlou,
S.P., Allen, H.E., Thomas, N.A., Paquin, P.R., 1991. Technical Basis for Establishing
Sediment Quality Criteria for Non-ionic Organic Chemicals Using Equilibrium Parti-
tioning. Environ. Toxicol. Chem. 11, 1541–1583.
Dickhut, R.M., Canuel, E.A., Gustafson, K.E., Liu, K., Arzayus, K.M., Walker, S.E.,
Edgecombe, G., Gaylor, M.O., MacDonald, E.H., 2000. Automotive sources of

Organic Pollutants in South Korea 145
carcinogenic polycyclic aromatic hydrocarbons associated with particulate matter in the
Chesapeake Bay region. Environ. Sci. Technol. 34, 4635–4640.
Eem, J.H., Choi, Y.H., Yuh, I.C., Cheong, J.H., Yoon, J.S., Kim, M.Y., 2003. Distribution
of PCDDs/PCDFs in the ambient air of Seoul. Proceeding of the 36th meeting of KO-
SAE (Korean Soc. Atmos. Environ) (in Korean).
EMEP/CORINAIR, 2000. Emission Inventory Guidebook, 3rd Ed., European Environ-
ment Agency homepage (http://reports.eea.eu.int/technical_report_2001_3/en/page
021.html/pcb.pdf).
Environment Canada, 2001. Canadian sediment quality guidelines for the protection of
aquatic life nonylphenol and its ethoxylates., EPPC—Agenda # 8—Att 3.
Falconer, R.L., Bidleman, T.F., 1994. Vapor pressures and predicted particle/gas distribu-
tions of polychlorinated biphenyl congeners as functions of temperature and ortho-
chlorine substitution. Atmos. Environ. 28(3), 547–554.
Field, J.A., Reed, R.L., 1996. Nonylphenol polyethoxy carboxylate metabolites of nonionic
surfactants in U.S. paper mill effluents, municipal sewage treatment plant effluents, and
river wasters. Environ. Sci. Technol. 30, 3544–3550.
Focant, J.-F., Eppe, G., Pirard, C., Massart, A.-C., Andre, J.-E., De Pauw, E., 2002. Levels
and congener distributions of PCDDs, PCDFs and non-ortho PCBs in Belgium food-
stuffs assessment of dietary intake. Chemosphere 48, 167–179.
Furhacker, M., Scharf, S., Weber, H., 2000. Bisphenol A: Emissions from point sources.
Chemosphere 41, 751–756.
Geyer, H.J., Schramm, K.-W., Feicht, E.A., Behechti, A., Steinberg, C., Bruggemann, R.,
Poiget, H., Henkelmann, B., Kettrup, A., 2002. Half-lives of tetra-, penta-, hexa-, hepta-,
and octachlorodibenzo-p-dioxin in rats, monkeys, and humans-a critical review. Chemo-
sphere 48, 631–644.
Ghadiri, H., Rose, C.W., 2001. Degradation of endosulfan in a clay soil from cotton farms
of western Queensland. J. Environ. Manag. 62, 155–169.
Ghim, Y.S., Kim, J.Y., Kim, Y., Moon, K.-C., Moon, K.J., Han, J.S., Kim, S.-W., Yoon,
S.-C., Kwon, S.-A., 2003. Concentration variations of Persistent Organic Pollutants in
Gosan, Jeju during the Polluted period in November 2001 and the Yellow Sand Period in
Spring 2002. J. KOSAE (in Korean) 5, 469–490.
Giesy, J.P., Kannan, K., 2001. Global distribution of perfluorooctane sulfonate and related
perfluorinated compounds in wildlife. Environ. Sci. Technol. 35, 1339–1342.
Giger, W., Brunner, P.H., Schaffner, C., 1984. 4-Nonylphenol in sewage sludge: Accumu-
lation of toxic metabolites from non-ionic surfactants. Science 225, 623–625.
Gustafsson, K., Bjork, M., Burreau, S., Gilek, M., 1999. Bioaccumulation kinetics of bro-
minated flame retardants polybrominated diphenyl ethers in blue mussels,Mytilus edulis.
Environ. Toxicol. Chem. 18, 1218–1224.
Gustafsson, O., Haghseta, F., Chan, C., MacFarlane, J., Gschwend, P.M., 1997. Quanti-
fication of the dilute sedimentary soot phase: Implications for PAH speciation and bio-
availability. Environ. Sci. Technol. 31, 203–209.
Han, Y.-J., Holsen, T.M., Hopke, P.K., Cheong, J.-P., Kim, H., Yi, S.-M., 2002. Identi-
fication of source locations for atmospheric dry deposition of heavy metals during yel-
low-sand events in Seoul, Korea in 1998 using hybrid receptor models. Atmos. Environ.
38, 5353–5361.
Hashimoto, S., Cho, H.-S., Morita, M., 1998. Polychlorinated dibenzo-p-dioxins and po-
lychlorinated dibenzofurans in shellfishes from south coast of Korea. Chemosphere 37,
951–959.
Hawker, D.W., Connell, D.W., 1988. Octanol-wate partition coefficients of polychlorinated
biphenyl congeners. Enviorn. Sci. Technol. 22, 382–387.

Seung-Kyu Kim et al.146
Holmstrom, K., Jarnberg, U., Bignert, A., 2005. Temporal trends of PFOS and PFOA in
Guillemot eggs from the Baltic Sea, 1968–2003. Environ. Sci. Technol. 39, 80–84.
Holzapfel, W., 1966. Uses of fluorinated surfactants. Fette Seifen Anstrichm. 68, 837–842.
Hong, M., Choi, D., Hwang, I., Suh, J., Lee, E., Lee, K., Oh, G., Kim, J., Kim, M., Kim, M.
2003a. Levels of dioxins in food (IV). 2003 Research report of KFDA (in Korean).
Korea Food and Drug Administration (KFDA). Seoul, Korea.
Hong, M., Won, K., Choi, D., Hwang, I., Shu, J., Im, M., Hu, S., Lee, K., Oh, G., Kim, J.,
Choi, K., Kim, C. 2002. Levels of dioxins in food (III). 2002 Research report of KFDA
(in Korean). Korea Food and Drug Administration (KFDA). Seoul, Korea.
Hong, S.H., Yim, U.H., Shim, W.J., Li, D.H., Oh, J.R., 2006. Nationwide monitoring of
polychlorinated biphenyls and organochlorine pesticides in sediment from coastal en-
vironment of Korea. Chemosphere 64, 1479–1488.
Hong, S.H., Yim, U.H., Shim, W.J., Oh, J.R., Lee, I.S., 2003b. Horizontal and vertical
distribution of PCBs and chlorinated pesticides in sediments from Masan Bay,
Korea. Mar. Pollut. Bull. 46, 244–253.
Hong, S.H., Yim, Y.H., Shim, Y.J., Oh, J.R., 2005. Congener-specific survey for polychlo-
rinated biphenyls in sediments of industrialized bays in Korea: Regional characteristics
and pollution sources. Environ. Sci. Technol. 39, 7380–7388.
Ikeda, M., 1996. Comparison of clinical picture between Yusho/Yucheng cases and occu-
pational PCB poisoning cases. Chemosphere 32, 559–566.
Im, S.H., Kannan, K., Giesy, J.P., Matsuda, M., Wakimoto, T., 2002a. Concentrations and
profiles of polychlorinated dibenzo-p-dioxins and dibenzofurans in soils from Korea.
Environ. Sci. Technol. 36, 3700–3705.
Im, S.H., Kannan, K., Matsuda, M., Giesy, J.P., Wakimoto, T., 2002b. Sources and di-
sribution of polychlorinated dibenzo-p-dioxins and dibenzofurans in sediments from
Masan Bay, Korea. Environ. Toxicol. Chem. 21, 245–252.
Im, S.H., Strause, K.D., Giesy, J.P., Chang, Y.S., Matsuda, M., Wakimoto, T., 2004.
Concentrations and accumulation profiles of polychlorinated dibenzo-p-dioxins and di-
benzofurans in aquatic tissues, and ambient air from south Korea. Chemosphere 55,
1293–1302.
Japan Ministry of Environment (JMOE) website (http://www.env.go.jp/en/press/2004/).
Japanese Ministry of Environment (JMOE), 2002. The environmental monitoring report on
the persistent organic pollutants (POPs) in Japan. Tokyo, Japan. Environmental Health
and Safety Division, Environmental Health Department, JMOE, Tokyo, Japan.
JEMCAA (Japan Environmental Measurement & Chemical Analysis Association), 1997.
Analysis Manual of Industrial Waste (in Japan).
Jeong, G.H., Kim, D.Y., Kim, M.O., Lee, J.Y., Kim, Y.B., 2001b. Contents of polychlo-
rinated biphenyls in Carassius auratus from the major river system in S. Korea. Or-
ganohal. Comp. 51, 344–347.
Jeong, G.H., Kim, H.J., Joo, Y.J., Kim, Y.B., So, H.Y., 2001d. Distribution characteristics
of PCBs in the sediments of the lower Nakdong River, Korea. Chemosphere 44, 1403–
1411.
Jeong, G.H., You, J.-C., Joo, C.-H., Jeon, S.-E., 2001a. Distribution characteristics of
2,3,7,8-substituted dioxins in the freshwater fishes from the major rivers in S. Korea.
Organohal. Comp. 51, 247–250.
Jeong, Y.P., Choi, M.K., Yeo, H.G., Cheon, M.Y., 2001c. Seasonal variations in the con-
centration of persistent organochlorine pesticides in atmosphere. Korean Journal of
Environmental Agriculture (in Korean) 20(2), 79–85.
Jones, P.D., Hu, W., Coen, W.D., Newsted, J.L., Giesy, J.P., 2003. Binding of perfluor-
inated fatty acids to serum proteins. Environ. Toxicol. Chem. 22, 2639–2649.

Organic Pollutants in South Korea 147
Jonkers, N., Laane, R.W.P.M., de Graaf, C., de Voogt, P., 2005. Fate modeling of non-
ylphenol ethoxylates and their metabolites in the Dutch Scheldt and Rhine estuaries:
Validation with new field data. Est. Coast. Shelf Sci. 62, 141–160.
Kang, Y.-S., Choi, S., Han, J., Choi, S., Lee, M., Park, J., 2003. Residue and risk assessment
of PCDD/Fs and PCBs in the Korean population. 2003 Research report of KFDA (in
Korean), Korea Food and Drung Administration Ed., Seoul, Korea.
Kang, Y.-S., Matsuda, M., Kawano, M., Wakimoto, T., Min, B.-Y., 1997. Organochlorine
pesticides, polychlorinated biphenyls, polychlorinated dibenzo-p-dioxins and dibenzofu-
rans in human adipose tissue from western Kyungnam, Korea. Chemosphere 35, 2107–
2117.
Kang, Y.-S., Park, J.-S., Min, B.-Y., 2002. Residue and risk assessment of polychlorinated
dibenzo-p-dioxin/dibenzofurans in the Korean population. Anal. Sci. Tehcnol. 15(2),
270–286.
Kannan, K., Choi, J.W., Iseki, N., Senthilkumar, K., Kim, D.H., Masunaga, S., Giesy, J.P.,
2002. Concentrations of perfluorinated acids in livers of birds from Japan and Korea.
Chemosphere 49, 225–231.
Kannan, K., Corsolini, S., Falandysz, J., Fillmann, G., Kumar, K.S., Loganathan, B.G.,
Mohd, M.A., Olivero, J., van Wouwe, N., Yang, J.H., Aldous, K.M., 2004. Per-
fluorooctanesulfonate and related fluorochemicals in human blood from Several Count-
ires. Environ. Sci. Technol. 38, 4489–4495.
Kannan, K., Tao, L., Sinclair, E., Pastva, S.D., Jude, D.J., Giesy, J.P., 2005. Perfluorinated
compounds in aquatic organisms at various trophic levels in a Great Lakes food chain.
Arch. Environ. Contam. Toxicol. 48, 559–566.
Karickhoff, S.W., 1981. Semi-empirical estimation of sorption of hydrophobic pollutants on
natural sediments and soils. Chemosphere 10, 833–846.
Khim, J.S., Kannan, K., Villeneuve, D.L., Koh, C.H., Giesy, J.P., 1999b. Characterization
and distribution of trace organic contaminants in sediment from Masan Bay, Korea: 1.
Instrumental analysis. Environ. Sci. Technol. 33, 4199–4205.
Khim, J.S., Lee, K.T., Kannan, K., Villeneuve, D.L., Giesy, J.P., Koh, C.H., 2001. Trace
organic contaminants in sediment and water from Ulsan Bay and its vicinity, Korea.
Arch. Environ. Contam. Toxicol. 40, 141–150.
Khim, J.S., Villeneuve, D.L., Kannan, K., Hu, W.Y., Giesy, J.P., Kang, S.G., Song, K.J.,
Koh, C.H., 2000. Instrumental and bioanalytical measures of persistent organochlorines
in blue mussel (Mytilus edulis) from Korean coastal waters. Arch. Environ. Contam.
Toxicol. 39, 360–368.
Khim, J.S., Villeneuve, D.L., Kannan, K., Lee, K.T., Snyder, S.A., Koh, C.H., Giesy, J.P.,
1999a. Alkylphenols, polycyclic aromatic hydrocarbons (PAHs), and organochlorines in
sediment from Lake Shihwa, Korea: Instrumental and bioanalytical characterization.
Environ. Toxicol. Chem. 8, 2424–2432.
Kim, B.-H., Ikonomou, M.G., Lee, S.-J., Kim, H.-S., Chang, Y.-S., 2005e. Concentrations
of polybrominated diphenyl ethers, polychlorinated dibenzo-p-dioxins and dibenzofu-
rans, and polychlorinated biphenyls in human blood samples from Korea. Sci. Total
Environ. 336, 45–56.
Kim, B.-H., Lee, S.-J., Kim, H.-S., Chang, Y.-S., 2004a. Determination of polychlorinated
dibenzo-p-dioxins and dibenzofurans and comparison of extraction methods for edible
freshwater fish and frogs in South Korea by using a high-resolution GC/MS. Food
Additives and Contaminants 21, 700–710.
Kim, B.-H., Lee, S.-J., Mun, S.-J., Chang, Y.-S., 2005d. A case study of dioxin monit-
oring in and around an industrial waste incinerator in Korea. Chemosphere 58,
1589–1599.

Seung-Kyu Kim et al.148
Kim, E.-J., Oh, J.-E., Chang, Y.-S., 2003a. Effects of forest fire on the level and distribution
of PCDD/Fs and PAHs in soil. Sci. Total Environ. 311, 177–189.
Kim, E.S., Koh, B.Y., Park, Y.S., 2002f. Flame Retardants. Korea Institute of Science and
Technology Information (KISTI) report (in Korean). Seoul, Korea.
Kim, G.B., Maruya, K.A., Lee, R.F., Lee, J.H., Koh, C.H., Tanabe, S., 1999b. Distribution
and sources of polycyclic aromatic hydrocarbons in sediments from Kyeonggi Bay,
Korea. Mar. Pollut. Bull. 38, 7–15.
Kim, H.Y., Sho, Y.S., Chung, S.Y., Shu, J.H., Lee, E.J., Lee, Y.D., Park, S.S., Choi, W.J.,
Kim, J.S., Kim, S.H., 2004b. Safety evaluation of Dioxins in food. The Annual Report of
KFDA. 18-1, 638–653.
Kim, J., Shin, D., Park, S., Lim, Y., Hwang, M., 2002a. A study on risk communication and
risk perception in environmental problems-Radon and Dioxins. J. Environ. Toxicol. (in
Korean) 17, 315–324.
Kim, J.-G., Hong, H.-T., 2000. Levels and distribution of dioxin in aquatic environment.
Engineering and technology Research of Cheonbuk Univ. (in Korean) 31, 145–151.
Kim, J.-G., Kim, K.-S., Kim, J.-S., Shin, S.-K., Chung, Y.-H., Chung, I.-R., 2005b. Source
estimation of dioxin in soil using a congener pattern. J. KSEE (in Korean) 27, 316–322.
Kim, J.G., Kim, K.S., Lee, B.H., 1999a. Concentration and distribution of PCDDs/Fs in
Korea retail food. J. Korea Soc. Environ. Anal. (in Korean) 2(3), 167–174.
Kim, J.-G., Park, J.-S., Kim, K.-S., Won, C.H., 2002c. Monitoring of dioxin levels in stack
gas of incinerator and environmental samples. J. Korea. Soc. Environ. Anal. (in Korean)
5, 89–93.
Kim, J.H., Smith, A., 2001. Distribution of organochlorine pesticides in soils from South
Korea. Chemosphere 43, 137–140.
Kim, J.O., 2003. A study of consumer’s consciousness and attitude changes on endocrine
disrupters. 2003 Research report of KFDA (in Korean), Seoul, Korea.
Kim, K.-H., Seo, Y.-C., Nam, H., Joung, H.-T., You, J.-C., Kim, D.-J., Seo, Y.-C., 2005a.
Characteristics of major dioxin/furan congeners in melted slag of ash from municipal
solid waste incinerators. Mcirochem. J. 80, 171–181.
Kim, K.-S., Kim, J.-G., Kim, M.-Y., 2000c. Estimation of dietary daily intake of PCDDs/
PCDFs from Korean retail food. J. Korean Soc. Environ. Eng. 22(7), 1345–1355.
Kim, K.-S., Song, B.-J., Kim, J.-G., 2003b. Analysis of all PCB congeners in air samples by
HRGC/HRMS. Anal. Sci. Tech. 4, 309–319.
Kim, K.S., Song, B.-J., Kim, J.-G., Kim, K.-K., 2005c. A study on pollution levels and
source of polychlorinated biphenyl (PCB) in the ambient air of Korea and Japan. J.
KSEE 27, 170–176.
Kim, M., Choi, M., Myung, S.-W., Kim, Y., Min, H.K., Chang, Y., Lee, S.Y., Yang, S.Y.,
Kim, H.Y., Lee, Y.K., Ko, M., 2000b. Monitoring studies on the dioxins in biological
samples from Korea populations. 2000 Research Report of KFDA (in Korean). Korea
Food and Drung Administration Ed., Seoul, Korea.
Kim, S.-C., 2001. Emission characteristic of dioxins/furans and major air pollutants from
incinerators. J. Environ. Toxicol. (in Korean) Special Lecture in The Korean Society of
Environmental Toxicology 2001.
Kim, S.-C., Jeon, S.H., Jung, I.-R., Kim, K.-H., Kwon, M.-H., Kim, J.-H., Yi, J.-H., Kim,
S.-J., You, J.-C., Jung, D.-H., 2001a. Removal efficiencies of PCDDs/PCDFs by air pol-
lution control devices in municipal solid waste incinerators. Chemosphere 43, 773–776.
Kim, S.-C., Jeon, S.-H., Jung, I.-R., Kim, K.-H., Kwon, M.-H., Kim, J.-H., Yi, J.-H., Kim,
S.-J., You, J.-C., Jung, D.-H., 2001b. Formation and emission status of PCDDs/PCDFs
in municipal solid waste incinerators in Korea. Chemosphere 43, 701–707.

Organic Pollutants in South Korea 149
Kim, S.J., Lee, J.H., Lee, D.H., 2002d. Estimated amounts and rate of emission of Dioxins
from incineartor, Korea. Proceeding of J. Korean Solid Wastes Engineering Society
(in Korean). Seoul, Korea.
Kim, S.-K., 2004. Integrated Assessment of Multimedia Fates of PAHs and PCBs in Seoul
Metropolitan Area, Korea. PhD dissertation, Seoul National University, Seoul, South
Korea.
Kim, S.K., Lee, D.S., Oh, J.R., 2002e. Characteristics of trophic transfer of polychlorinated
biphenyls in marine organisms in Incheon North Harbor, Korea. Environ. Toxicol.
Chem. 21, 834–841.
Kim, S.K., Lee, D.S., Oh, J.R., Kahng, S.H., 2000a. Effects of extreme tidal range on
characteristics of polychlorinated biphenyl distribution in sediment of industrial Incheon
North Harbor, Korea. Environ. Toxicol. Chem. 19, 2448–2456.
Kim, S.-K., Oh, J.R., Shim, W.J., Lee, D.H., Yim, U.H., Hong, S.H., Shin, Y.B., Lee, D.S.,
2002b. Geographical distribution and accumulation features of organochlorine residues
in bivalves from coastal areas of South Korea. Mar. Pollut. Bull. 45, 268–279.
Kim, Y., Lee, S.Y., Kim, M., Kim, S.D., 2001c. The survey of PCDDs and PCDFs in the
ambient air of the urban and industrial sites in Korea, 1998–99. Chemosphere 43, 501–
506.
Kim, Y., Yang, S.H., Lee, S.Y., Kim, M., 2001e. Levels of PCDDs and PCDFs in two kinds
of fast foods in Korea. Chemosphere 43, 851–855.
Kim, Y.-H., Han, Y.-H., Lee, S.-R., 1981. Organochlorine insecticide residues in meats
consumed in Korea. Korean J. Food Sci. Technol. (in Korean) 13, 194–201.
Kim, Y.-H., Lee, S.-R., 1980. Organochlorine insecticide residues in cow’s milk produced in
Korea. Korean J. Food Sci. Technol. 12, 141–149.
Kim, Y.-J., Ohsako, M., You, J.-C., Lee, D.-H., 2001d. Leaching behavior of dioxins from
municipal solid waste landfills. J. Korean Solid Waste Eng. Soc. (in Korean) 18, 51–59.
Kiviranta, H., Ovaskainen, M.-L., Vartiainen, T., 2004. Market basket study on dietary
intake of PCDD/Fs, PCBs, and PBDEs in Finland. Environ. Int. 30, 923–932.
Knepper, T.P., Berna, J.L., 2003. Surfactants: Properties, production, and environmental
aspects. In: Knepper, T.P., Barcelo, D., De Voogt, P. (Eds.), Analysis and Fate of
Surfactants in the Aquatic Environment. Elsevier, Amsterdam, pp. 1–45.
Koh, C.H., Khim, J.S., Kannan, K., Villeneuve, D.L., Giesy, J.P., 2006a. Characterization
of trace organic contaminants in marine sediment from Yeongil Bay, Korea: 1. Instru-
mental analyses. Environ. Pollut. 142, 39–47.
Koh, C.H., Khim, J.S., Kannan, K., Villeneuve, D.L., Johnson, B.G., Giesy, J.P., 2005.
Instrumental and bioanalytical measures of dioxin-like and estrogenic compounds and
activities associated with sediment from the Korean coast. Ecotoxicol. Environ. Safety.
61, 366–379.
Koh, C.H., Khim, J.S., Kannan, K., Villeneuve, D.L., Senthilkumar, K., Giesy, J.P., 2004.
Polychlorinated dibenzo-p-dioxins (PCDDs), dibenzofurans (PCDFs), biphenyls (PCBs),
and polycyclic aromatic hydrocarbons (PAHs) and 2,3,7,8-TCDD equivalents (TEQs) in
sediments from Hyeongsan River, Korea. Environ. Pollut. 132, 489–501.
Koh, C.H., Khim, J.S., Villeneuve, D.L., Kannan, K., Giesy, J.P., 2002. Analysis of trace
organic contaminants in environmental samples from Onsan Bay, Korea. Environ. Tox-
icol. Chem. 21, 1796–1803.
Korea Food and Drug Administration (KFDA) website (http://www.kfda.go.kr/).
Korea Ministry of Environment (KMOE) website (http://www.me.go.kr/).
Korea Ministry of Environment (KMOE), 2001. National Reponse Strategy on Stockholm
Convention. KMOE report (in Korean), Seoul, Korea.

Seung-Kyu Kim et al.150
Korea Ministry of Environment (KMOE), 2002a. Development of methodology for national
Dioxins emission inventory establishment. KMOE report (in Korean), Seoul, Korea.
Korea Ministry of Environment (KMOE), 2002b. 1st (2001) Dioxins Monitoring Project for
emission inventory establishment. KMOE report (in Korean), Seoul, Korea.
Korea Ministry of Environment (KMOE), 2003a. 2nd (2002) Dioxins Monitoring Project
for emission inventory establishment. KMOE report (in Korean), Seoul. Korea.
Korea Ministry of Environment (KMOE), 2003b. Preliminary Development of national
source and emission inventories for persistent organic pollutants (POPs) emission inven-
tory establishment (HCB, PCBs, and PAHs). KMOE report (in Korean), Seoul, Korea.
Korea Ministry of Environment (KMOE), 2004a. Domestic status and control strategy of
POPs products and waste (I). KMOE report (in Korean), Seoul, Korea.
Korea Ministry of Environment (KMOE), 2004b. 3rd (2003) Dioxins Monitoring Project for
emission inventory establishment. KMOE report (in Korean), Seoul. Korea.
Korea Ministry of Environment (KMOE), 2004c. Development of methodology for Dioxins
emission inventory establishment for non-point sources. KMOE report (in Korean),
Seoul, Korea.
Korea Ministry of Environment (KMOE), 2005a. 4th (2004) Dioxins Monitoring Project for
emission inventory establishment. KMOE report (in Korean), Seoul. Korea.
Korea Ministry of Environment (KMOE), 2005b. Environmental Statistics Yearbook. An-
nual Report of Ministry of Environment. Seoul, Korea.
Korea Ministry of Environment (KMOE), 2005c. Worldwide regulation status of bromin-
ated flame retardants and response strategy in Korea. KMOE report (in Korean). Seoul,
Korea.
Korea Ministry of Environment & National Institute of Environmental Research (KMOE &
NIER), 1997, 1998, 1999, 2000, 2001, 2002, 2003. National statistics on waste generation
and treatment. Yearbook (in Korean). Seoul, Korea.
Korean Rural Economic Institute (KREI), 2004. Food balance sheet (in Korean). KREI
Report. 123-176.
Kwon, H.-J., Cho, S.-H., Chun, Y., Lagarde, F., Pershagen, G., 2002. Effects of the Asian
Dust Events on daily mortality in Seoul, Korea. Environ. Res. A90, 1–5.
Lau, F.K., Charles, M.J., Cahill, T.M., 2006. Evaluation of gas-stripping methods for the
determination of Henry’s law constants for polybrominated diphenyl ethers and poly-
chlorinated biphenyls. J. Chem. Eng. Data, 51, 871–878.
Lee, B.-K., KimLee, H., Jun, N.-Y., 2006b. Analysis of regional and temporal characteristics
of PM10 during an Asian dust episode in Korea. Chemosphere 63, 1106–1115.
Lee, D.-H., Kim, S.-D., Bae, S.-K., Lee, K.-O., 2002. Dioxin Emission from and man-
agement of small/medium size incinerators. 4th Korea-Japan joint Waste Symposium.
Lee, D.S., Kim, R.H., 1999. Exposure route of endocrine disrupting compounds and es-
timation of alteration in Korean male’s sperm quality (meta-analysis). Kyobo Founda-
tion of Education & Culture (in Korean). Seoul, Korea.
Lee, H.-M., 2002. Risk assessment and the latest trend of management in food dioxins. In:
International symposium in Korean society of environmental toxicology, 2002, Issues in
Environmental toxicology. The Society of Environmental Toxicology (in Korean), pp.
21–48.
Lee, I.K., Lee, J.H., Kang, S.-Y., Lee, S.-R., 1977. A study on the marine algae in the
Kwang Yang Bay 2. The residues of organochlorine pesticides in marine algae. Korean J.
Botany (in Korean) 20, 53–57.
Lee, K.-T., Lee, J.-H., Lee, J.-S., Park, K.-H., Kim, S.-K., Shim, W.-J., Hong, S.-H., Im,
Y.-H., Giesy, J.P., Oh, J.-R., 2007. Human health risk assessment: consumption of
dioxin-contaminated fish in South Korea. Human Ecol. Risk Assess. 13, 223–235.

Organic Pollutants in South Korea 151
Lee, K.T., Tanabe, S., Koh, C.H., 2001a. Contamination of polychlorinated biphenyls
(PCBs) in sediments from Kyeonggi Bay and Nearby Areas, Korea. Mar. Pollut. Bull.
42, 273–279.
Lee, K.T., Tanabe, S., Koh, C.H., 2001b. Distribution of organochlorine pesticides in se-
diments from Kyeonggi Bay and nearby areas, Korea. Environ. Pollut. 114, 207–213.
Lee, S.-R., 1982. Overall assessment of organochlorine insecticide residues in Korean Foods.
Korean J. Food Sci. Technol. (in Korean) 14(1), 82–94.
Lee, S.R., Kang, S.Y., Park, C.K., Lee, J.H., Rho, C.S., 1976. A survey on the residues of
organochlorine pesticides in water, mud and clam samples from the Kwangyang Bay,
Korea. J. Korean Agric. Chem. Soc. (in Korean) 19, 112–119.
Lee, Y., 2005. Regional scale assessment of environmental fate and transport of dioxins by a
multimedia model (KoEFT-PBTs). PhD dissertation, Seoul National University, Seoul,
Korea.
Lee, Y., Lee, D.S., Kim, S.-K., Kim, Y.K., Kim, D.W., 2004. Use of the relative concen-
tration to evaluate a multimedia model for PAHs in the absence of emission estimates.
Environ. Sci. Technol. 38, 1079–1088.
Lee, Y.G., Lee, H.K., Ryu, I.C., Han, K.M., 2000. A study on the concentration and
distribution of PCDDs/Fs at the leachate of landfill site in Seoul. J. Korea Soc. Environ.
Anal. (in Korean) 3(1), 45–52.
Leem, J.-H., Hong, Y.-C., Lee, K.-H., Kwon, H.-J., Chang, Y.-S., Jang, J.-Y., 2003. Health
survey on workers and residents near the municipal waste and industrial waste incin-
erators in Korea. Ind. Health 41, 181–188.
Li, D., Dong, M., Shim, W.J., Hong, S.H., Oh, J.R., Yim, U.H., Jeung, J.H., Kannan, N.,
Kim, E.S., Cho, S.R., 2005. Seasonal and spatial distribution of nonylphenol and IBP in
Saemangeum Bay, Korea. Mar. Pollut. Bull. 51, 8–12.
Li, D., Kim, M.S., Oh, J.R., Park, J., 2004a. Distribution characteristics of nonylphenols in
the artificial Shihwa Lake, and surrounding creeks in Korea. Chemosphere 56, 783–790.
Li, D., Kim, M.S., Shim, W.J., Yim, U.H., Oh, J.R., Kwon, Y.J., 2004b. Seasonal flux of
nonylphenol in Han River, Korea. Chemosphere 56, 1–6.
Li, Y.F., 1999. Global technical hexahlorocyclohexane usage and its contamination con-
sequences in the environment: From 1948 to 1997. Sci. Total Environ. 232, 121–158.
Li, Z., Li, D., Oh, J.R., Je, J.G., 2004c. Seasonal and spatial distribution of nonylphenol in
Shihwa Lake, Korea. Chemosphere 56, 611–618.
Liss, P.S., Slater, P.G., 1974. Flux of gases across the air–sea interface. Nature 247, 181–184.
Long, E.R., MacDonald, D.D., Smith, S.L., Calder, F.D., 1995. Incidence of adverse bi-
ological effects within ranges of chemical concentrations in marine and estuarine se-
diments. Environ. Manage. 19, 81–97.
Loutfy, N., Fuerhacker, M., Tundo, P., Raccanelli, S., El Dien, A.G., Ahmed, M.T., 2006.
Dietary intake of dioxins and dioxin-like PCBs, due to the consumption of dairy prod-
ucts, fish/seafood and meat from Ismailia city. Egypt. Sci. Total Environ. 370, 1–8.
Mackay, D., (Ed.), 1991, Multimedia Environmental Models. Lewis Publishers, Chelsea,
MI.
Mackay, D., Paterson, S., Schroeder, W.H., 1986. Model describing the rates of transfer
processes of organic chemicals between atmosphere and water. Environ. Sci. Technol. 20,
810–816.
Mackay, D., Shiu, W.-Y., Ma, K.-C., 2000. Physical-chemical properties and environmental
fate—Handbook. Chapman & Hall/CRCnetBASE. Weimar, Texas.
Martin, J.W., Mabury, S.A., Solomon, K.R., Muir, D.C.G., 2003. Bioconcentration and
tissue distribution of perfluorinated acids in rainbow trout (Oncorhynchus mykiss). Env-
iron. Toxicol. Chem. 22, 196–204.

Seung-Kyu Kim et al.152
Martin, J.W., Muir, D.C.G., Moody, C.A., Ellis, D.A., Kwan, W.C., Solomon, K.R., Ma-
bury, S.A., 2002. Collection of airborne fluorinated organics and analysis by gas
chromatorgraphy/chemical ionization mass spectrometry. Anal. Chem. 74, 584–590.
Martin, M., Lam, P.K.S., Richardson, B.J., 2004. An Asian quandary: Where have all of the
PBDEs gone? Mar. Poll. Bull. 49, 375–382.
McDonald, T.A., 2002. A perspective on the potential health risks of PBDEs. Chemosphere
46, 745–755.
Ministry of Commerce, Industry and Energy (MCIE), 1999. Effect on domestic industry of
and response strategy on Convention against Persistent Organic Pollutants (POPs). Re-
search Report (in Korean). Seoul. Korea.
Ministry of Maritime Affairs and Fisheries (MOMAF) website (http://www.momaf.go.kr/
help/sitemap/H_sitemap_search.asp).
Ministry of Maritime Affairs and Fisheries (MOMAF), 2001. Hydrophobic Persistent Or-
ganic Pollutants in Korean coasts. Research report, Seoul, Korea.
Ministry of Maritime Affairs and Fisheries (MOMAF), 2003. Endocrine Disrupting Com-
pounds in marine ecosystem (2003). Research report, MOMAF, Seoul, Korea.
Mocarelli, P., 2001. Seveso: A teaching story. Chemosphre 43, 391–402.
Monirith, I., Ueno, D., Takahashi, S., Nakata, H., Sudaryanto, A., Subramanian, A.,
Karuppiah, S., Ismail, A., Muchtar, M., Zheng, J., Richardson, B.J., Prudente, M., Hue,
N.D., Tana, T.S., Tkalin, A.V., Tanabe, S., 2003. Asia-Pacific mussel watch: Monitoring
contamination of persistent organochlorine compounds in coastal waters of Asian
countries. Mar. Pollut. Bull. 46, 281–300.
Moon, H.B., 2003. Fate of Dioxins and Dioxin-like contaminants in the coastal environment
of Korea. PhD Dissertation of Pukyong National University. Busan, Korea.
Moon, H.B., Choi, H.G., Kim, S.S., Jeong, S.R., Lee, P.Y., 2001. Analysis of polybromin-
ated diphenyl ethers (PBDEs) in sediments from the southeastern coastal areas of Korea.
J. Kor. Soc. Oceanogra. 36, 101–108.
Moon, H.B., Kannan, K., Lee, S.J., Choi, M.K., 2007a. Atmospheric deposition of
polybrominated diphenyl ethers (PBDEs) in coastal areas in Korea. Chemosphere 66,
585–593.
Moon, H.B., Kannan, K., Lee, S.J., Choi, M.K., 2007b. Polybrominated Diphenyl Ethers
(PBDEs) in Sediment and Bivalves from Korean Coastal Waters. Chemosphere 66,
243–251.
Moon, H.-B., Lee, S.-J., Choi, H.-G., Ok, G., 2005. Atmospheric deposition of polychlo-
rinated dibenzo-p-dioxins (PCDDs) and dibenzofurans (PCDFs) in urban and suburban
areas of Korea. Chemosphere 1525-1534, .
Moon, H.-B., Ok, G., 2006. Dietary intake of PCDDs, PCDFs and dioxin-like PCBs, due to
the consumption of various marine organisms from Korea. Chemosphere 62, 1142–1152.
Moon, J.Y., Kim, Y.B., Lee, S.I., Song, H., Choi, K., Jeong, G.H., 2006. Distribution
characteristics of polychlorinated biphenyls in crucian carp (Carassius auratus) from
major rivers in Korea. Chemosphere 62, 430–439.
Morikawa, A., Kamei, N., Harada, K., Inoue, K., Yoshinaga, T., Saito, N., Koizumi, A.,
2006. The bioconcentration factor of perfluorooctane sulfonate is significantly larger than
that of perfluorooctanoate in wild turtles (Trachemys scripta elegans and Chinemys reeves-
ii): An Ai river ecological study in Japan. Ecotoxicol. Environ. Safety. 65, 14–21.
MSC-E, 2002. EMEP workshop on Emission and Emission Factor Estimates, MSC-E Note
11/2002.
Nam, J.J., Song, B.H., Eom, K.C., Lee, S.H., Smith, A., 2003. Distribution of polycyclic
aromatic hydrocarbons in agricultural soils in South Korea. Chemosphere 50,
1281–1289.

Organic Pollutants in South Korea 153
National Institute of Environmental Research (NIER), 2000a, 2001, 2002, 2003, 2004,
2005a. Monitoring of Endrocrine Disrupting Compounds residues in environmental
media . NIER annual report, Incheon, Korea.
National Institute of Environmental Research (NIER), 2000b. Investigation of emission
characteristics of Dioxins and air pollutants in small and middle size incinerators.
KMOE report (in Korean), Seoul, Korea.
National Institute of Environmental Research (NIER), 2005b. Dioxins monitoring in en-
vironmental multi-media around waste incinerators (II). KMOE report (in Korean),
Incheon, Korea.
NATO/CCMS (North Atlantic Treaty Organization, Committee on the Challenges of
Modern Society), 1988. International toxicity equivalency factors (I-TEF) method of risk
assessment for complex mixtures of dioxins and related compounds. North Atlantic
Treaty Organization, Brussels, report no. 176.
Neff, J.M., 1979. Polycyclic aromatic hydrocarbons in the aquatic environment, sources,
fates, and biological effects. Applied Science, London, UK.
Oh, J.E., 2001. Distribution and fates of PCDD/Fs in soil/air around emission sources. PhD
Dissertation in Pohang Univ. of Science and Technology. Pohang, Korea.
Oh, J.-E., Choi, J.-S., Chang, Y.-S., 2001. Gas/particle partitioning of polychlorinated
dibenzo-p-dioxins and dibenzofurans in atmosphere; evaluation of predicting models.
Atmos. Environ. 35, 4125–4134.
Oh, J.-E., Choi, S.-D., Lee, S.J., Chang, Y.-S., 2006. Influence of a municipal solid
waste incinerator on ambient air and soil PCDD/Fs levels. Chemosphere 64,
579–587.
Oh, J.R., Choi, H.K. Hong, S.H., Yim, U.H., Shim, W.J., Kannan, N., 2005b. A prelim-
inary report of persistent organochlorine pollutants in the Yellow Sea. Base/Mar. Pollut.
Bull. 50, 217–222.
Oh, J.R., Hong, S.H., Shim, W.J., Kannan, N., 2005a. A survey of polychlorinated dibenzo-
p-dioxins and furans in Korean seafood—A congener-specific approach. Mar. Pollut.
Bull. 50, 1121–1127.
Oh, J.R., Ikonomou, M.G., Fernandez, M.P., Hong, S.-H., 2003. PCB and PCDD/F totals,
TEQs, and congener patterns in Korean coastal marine environments, 1987, 1988, 1990,
and 1996–1999. Arch. Environ. Contam. Toxicol. 44, 224–236.
Ok, G., Ji, S.-H., Kim, S.-J., Kim, Y.-K., Park, J.-H., Kim, Y.-S., Han, Y.-H.,
2002. Monitoring of air pollution by polychlorinated dibenzo-p-dioxins and
polychlorinated dibenzofurans of pine needles in Korea. Chemosphere 46,
1351–1357.
Paasivirta, J., Sinkkonen, S., Mikkelson, P., Rantio, T., Wania, F., 1999. Estimation of
vapor pressures, solubilities and henry’s law constants of selected persistent organic
pollutants as functions of temperature. Chemosphere 39(5), 811–832.
Palm, A., Cousins, I.T., Mackay, D., Tysklind, M., Metcalfe, C., Alaee, M., 2002. Assessing
the environmental fate of chemicals of emerging concern: A case study of the polybro-
minated diphenyl ethers. Environ. Pollut. 117, 195–213.
Panther, B.C., Hooper, M.A., Tapper, N.J., 1999. A comparison of air particulate matter
and associated polycyclic aromatic hydrocarbons in some tropical and temperate urban
environments. Atmos. Environ. 33, 4087–4099.
Park, C.K., Lee, K.S., Yoo, J.Y., 1974. Studies on the residues of chlorinated organic
insecticides 2. BHC residues in or on commercial vegetables. J. Korean Agric. Chem.
Soc. (in Korean) 17, 177–183.
Park, C.K., Ma, Y.S., 1982. Organochlorine pesticide residues in agricultural soils-1981.
Korean J. Environ. Agric. (in Korean) 1, 1–13.

Seung-Kyu Kim et al.154
Park, C.K., Yoo, J.Y., 1972. Studies on the residues of chlorinated organic insecticides I.
Heptachlor residues in or on commercial vegetables. J. Korean Agric. Chem. Soc. (in
Korean) 15, 7–17.
Park, J.-S., Kim, J.-G., 2002. Regional measurements of PCDD/PCDF concentrations in
Korean atmosphere and comparison with gas-particle partitioning models. Chemosphere
49, 755–764.
Park, J.-S., Wade, T.L., Sweet, S.T., 2002a. Atmospheric deposition of PAHs, PCBs, and
organochlorine pesticides to Corpus Christi Bay, Texas. Atmos. Environ. 36, 1707–1720.
Park, J.K., Jeong, D.U., 2001. Environmental risk assessment and regulation on flame
retardants. Korea Environment Institute (KEI) repont (in Korean), Seoul, Korea.
Park, S., Kim, S.-J., Kim, K.S., Lee, D.S., Kim, J.G., 2004. Influence of an industrial waste
incinerator as assessed by the levels and congener patterns of polychlorinated dibenzo-p-
dioxins and polychlorinated dibenzofurans. Environ. Sci. Technol. 38, 3820–3826.
Park, S.S., Kim, Y.J., Kang, C.H., 2002b. Atmospheric polycyclic aromatic hydrocarbons in
Seoul, Korea. Atmos. Environ. 36, 2917–2924.
Park, S.-U., In, H.-J., 2002. Simulation of long-range transport of acidic pollutants in East
Asia during the Yellow Sand event. Atmos. Environ. 36, 4877–4893.
Paul, V., Subramaniam, E., 1997. Effect of single and repeated administration of endosulfan
on behavior and its interaction with centrally acting drugs in experimental animals: a
mini review. Environ. Toxicol. Pharmocol. 3, 151–157.
Persson, N.J., Gustafsson, O., Bucheli, T.D., Ishaq, R., Nas, K., Broman, D., 2002. Soot-
Carbon Influenced Distribution of PCDD/Fs in the Marine Environment of the Gren-
landsfjords, Norway. Environ. Sci. Technol. 36, 968–4974.
Prevedouros, K., Cousins, I.T., Buck, R.C., Korzeniowski, S.H., 2006. Source, fate and
transport of perfluorocarboxylates. Environ. Sci. Technol. 40, 32–44.
Pulles, T., Kok, H., Quass, U., Juery, C., Matejovicova, J., 2005. Dioxin emissions in
candidate countries. TNO Report R&I-A R 2005/054. http://europa.eu.int/comm/envi-
ronment/dioxin/pdf/rapport_2005.pdf
Pyoungtak City, 2003. Investigation on Residents’ health and PCDDs/DFs contamination
in environments near a waste incinerator, KeumHo Environment Incoporation. Re-
search report (in Korean), Pyoungtak, Korea.
Quab, U., Fermann, M., Brokr, G., 2000. The Europrean Dioxin Emission Inventory, Stage
II Vol. 1. European Commission, Directorate General for Environment (DG ENV).
Final Report-December 2000. 96/771/3040/DEB/E1.
Quab, U., Fermann, M., Brokr, G., 2004. The European Dioxin Air Emission Inventory
Project-Final Results. Chemosphere 54, 1319–1327.
Renner, R., 2000. What fate for brominated fire retardant? Environ. Sci. Technol. 34, 223A–
226A.
Renner, R., 2001a. Perfluorinated compounds linked to carcinogenicity in vitro. Environ.
Sci. Technol. 35, 180A.
Renner, R., 2001b. Growing concern over perfluorinated chemicals. Environ. Sci. Technol.
35, 154A–160A.
Roberts, D.M., Dissanayake, W., Sheriff, M.H.R., Eddleston, M., 2004. Refractory status
epilepticus following self-poisoning with the organochlorine pesticide endosulfan. J. Clin.
Neurosci. 11, 760–762.
Rogers, H.R., 2002. Assessment of PAH contamination in estuarine sediments using the
equilibrium partitioning-toxic unit approach. Sci. Total. Environ. 290, 139–155.
Rostkowski, P., Yamashita, N., So, M.K., Taniyasu, S., Lam, P.K.S., Falandysz, J., Lee,
K.T., Kim, S.K., Khim, J.S., Im, S.H., Newsted, J.L., Jones, P.D., Kannan, K., Giesy,

Organic Pollutants in South Korea 155
J.P., 2006. Perfluorinated Compounds in Streams of the Shihwa Industrial Zone and
Shihwa Lake, South Korea. Environ. Toxicol. Chem. 25, 2374–2380.
Ryoo, K.S., Ko, S.-O., Hong, .P., Choi, J.-H., Cho, S., Kim, Y., Bae, .J., 2005. Levels of
PCDDs and PCDF in Korean river sediments and their detection by biomarkers.
Chemosphere 61, 323–331.
Ryu, B.-H., Ha, M.-S., Lee, C.-C., 1986. The residues of organochlorine pesticides in each
tissues of meats. Korean J. Food Hygiene (in Korean) 1, 163–169.
Sasamoto, T., Ushio, F., Kikutani, N., Saitoh, Y., Yamaki, Y., Hashimoto, T., Horri, S.,
Nakagawa, J., Ibe, A., 2006. Estimation of 1999-2004 dietary daily intake of PCDDs,
PCDFs and dioxin-like PCBs by a total diet study in metropolitan Tokyo, Japan.
Chemosphere 64, 634–641.
Schulz, D., 1993. PCDD/PCDF-German policy and measures to protect man and the en-
vironment. Chemosphere 27, 501–507.
Shang, D.Y., Macdonald, R.W., Ikonomou, M.G., 1999. Persistence of nonylphenol et-
hoxylate surfactants and their primary degradation products in sediments from near a
municipal outfall in the strait of Georgia, British Columbia, Canada. Environ. Sci.
Technol. 33, 1366–1372.
Shibata, Y., 2002. POPs monitoring activities in Japan In: Proceedings of the Workshop on
Environmental Monitoring of Persistent Organic Pollutants (POPs) in East Asian
Countries. Ministry of the Environment, Japan.
Shim, W.J., Kahng, S.H., Hong, S.H., Kim, N.S., Kim, S.-K., Shim, J.H., 2000. Imposex in
the rock shell, Thais clavigera, as evidence of organotin contamination in the marine
environment of Korea. Mar. Environ. Res. 49, 435–451.
Shin, K.-J., Chang, Y.-S., 1999. Characterization of polychlorinated dibenzo-p-dioxins, di-
benzofurans, biphenyls, and heavy metals in fly ash produced from Korean municipal
solid waste incinerators. Chemosphere 38, 2655–2666.
Shin, S.K., Jang, S.K., 2001. Emission patterns and formation mechanism of PCDDs/
PCDFs in bleaching wastewater (II). Anal. Sci. Technol. (in Korean) 14, 422–431.
Shoeib, M., Harner, T., Ikonomou, M., Kannan, K., 2004. Indoor and outdoor air con-
centrations and phase partitioning of perfluoroalkyl sulfonamides and polybrominated
diphenyl ethers. Environ. Sci. Technol. 38, 1313–1320.
Shoeib, M., Harner, T., Wilford, B.H., Jones, K.C., Zhu, J., 2005. Perfluorinated sulfonam-
ides in indoor and outdoor air and indoor dust: Occurrence, partitioning, and human
exposure. Environ. Sci. Technol. 39, 6599–6606.
Sidhu, S., Gullett, B., Striebich, R., Klosterman, J., Contreras, J., DeVito, M., 2005. En-
docrine disrupting chemical emissions from combustion sources: Diesel particulate
emissions and domestic waste open burn emissions. Atmos. Environ. 39, 801–811.
Sinclair, E., Mayack, D.T., Roblee, K., Yamashita, N., Kannan, K., 2006. Occurrence of
perfluoroalkyl surfactants in water, fish, and birds from New York State. Arch. Environ.
Contam. Toxicol. 49, 1–13.
So, M.K., Taniyasu, S., Yamashita, N., Giesy, J.P., Zheng, J., Fang, Z., Im, S.H., Lam, P.S.,
2004. Perfluorinated Compounds in Coastal Waters of Hong Kong, South China, and
Korea. Environ. Sci. Technol. 38, 4056–4063.
Stockholm Convention on Persistent Organic Pollutants. UNEP: persistent organic pollut-
ants 2001. (http://www.pops.int/documents/).
Suh, Y.-T., Im, G.-J., Shim, J.-H., 1986. Evaluation of organochlorine pesticide residues in
the mud flat. Korean J. Environ. Agric. (in Korean) 5, 113–118.
Swartz, R.C., 1999. Consensus sediment quality guidelines for polycyclic aromatic hydro-
carbon mixtures. Environ. Toxicol. Chem. 18, 780–787.

Seung-Kyu Kim et al.156
Tanabe, S., 2004. PBDEs, an emerging group of persistent pollutants. Mar. Pollut. Bull. 49,
369–370.
Tsutsumi, T., Yanagi, T., Nakamura, M., Kono, Y., Uchibe, H., Iida, T., Hori, T.,
Nakagawa, R., Tobiishi, K., Matsuda, R., Sasaki, K., Toyoda, M., 2001. Update of
daily intake of PCDDs, PCDFs, and dioxin-like PCBs from food in Japan. Chemosphere
45, 1129–1137.
UK NAEI (National Atmospheric Emissions Inventory) website (http://aeat.co.uk/netcen/
airqual/naei/annreport/annrep99/).
UN/ECE, 1998. The new Protocol on Persistent Organic Pollutants to the Convention on
Long-Range Transboundary Air Pollution. Press Release.
UNECE/EMEP (United Nations EconomicCommission for Europe/Co-operative pro-
gramme for monitoring and evaluation of long range transmission of air pollutants in
Europe ) emission database, WebDab 2002 (http://webdab.emep.int/).
UNEP, 1999. Dioxin and Furan Inventories: National and Regional Emissions of PCDD/
PCDF.
UNEP Chemicals, 1999. Guidelines for the identification of PCBs and materials containing
PCBs, First Issue, United Nations Environmental Program (UNEP).
UNEP Chemicals, 2001. Standardized toolkit for identification and quantification of dioxin
and furan release. UNEP Chemicals website (http://www.chem.unep.ch/pops/pcdd_ac-
tivities/toolkit/default.htm).
US EPA, 1998a. Locating and estimating air emission and source of Polycyclic Organic
Matter, EPA-454/R-98-014, Office of Air Quality Planning and Standards, Environ-
mental Protection Agency, Research Triangle Park, NC.
US EPA, 1998b. The Inventory of Sources of Dioxin in the United States. EPA/600/P-98/
002Aa. Washington D.C.
US EPA, 2000. Exposure and human health assessment of 2,3,7,8-tetrachlorodibenzo-p-
dioxins (TCDD) and related compounds: Part I. Estimating exposure to dioxin-like
compounds. Properties, Environmental levels, and Background Exposure, vol. 3. (EPA/
600/P-00/001 Bc).
US EPA, 2004. Exposure and human health reassessment of 2,3,7,8-tetrachlorodibenzo-p-
dioxin and related compounds. National Academy of Sciences Review Draft. National
Center for Environmental Assessment, Office of Research and Development. Washing-
ton, DC.
US EPA, 2005. Aquatic life ambient water quality criteria B nonylphenol (final), EPA-822-
R-05-005.
Vianna, N.J., 1983. The Love Canal: Issues and problems. Chemosphere 12, 705–712.
Wakimoto, T., Kannan, N., Ono, M., Tatsukawa, R., Masuda, Y., 1988. Isomer-specific
determination of polychlorinated dibenzofurans in Japanese and American Polychlo-
rinated biphenyls. Chemosphere 17, 743–750.
Wang, T., Lu, Y., Zhang, H., Shi, Y., 2005. Contamination of persistent organic pollutants
(POPs) and relevant management in China. Environ. Int. 31, 813–821.
Watanabe, I., Sakai, S.I., 2003. Environmental release and behavior of brominated flame
retardants. Environ. Int. 29, 665–682.
White, R., Jobling, S., Hoarse, S.A., Sumpter, J.P., Parker, M.G., 1994. Environmentally
persistent alkylphenolic compounds are estrognic. Endocrinology 135, 175–182.
Whitman, W.G., 1923. The two-film theory of gas absorption. Chem. Metal. Eng. 29, 146–148.
WHO European Centre for Environment and Health International Programme on Chemical
Safety, 1998. Assessment of the health risk of dioxins: re-evaluation of the Tolerable
Daily Intake (TDI). Executive Summary, WHO Consultation. May 25–29, Geneva,
Switzerland.

Organic Pollutants in South Korea 157
Wikipedia website (http://en.wikipedia.org/wiki/List_of_countries_by_population_density).
de Wit, C.A., 2002. An overview of brominated flame retardants in the environment.
Chemosphere 46, 583–624.
Won, K., Choi, D., Hwang, I., Park, K., Hu, S., Choi, Y., Lee, K., Suh, J., Choi, Y., Jeong,
J., Park, J., Kim, S., Cha, S., Kim, C., 2000. Levels of dixoins in food (I). 2000 Research
report of KFDA (in Korean). Korea Food and Drug Administration (KFDA). Seoul,
Korea.
Won, K., Choi, D., Hwang, I., Suh, J., Park, S., Lee, K., Oh, G., Choi, Y., Park, J., Cha, S.,
Kim, C., 2001. Levels of dioxins in food (II). 2001 Research report of KFDA (in Ko-
rean). Korea Food and Drug Administration (KFDA). Seoul, Korea.
Wong, A., Lei, Y.D., Alaee, M., Wania, F., 2001. Vapor pressures of the polybrominated
diphenyl ethers. J. Chem. Eng. Data 46, 239–242.
Yamashita, N., Kannan, K., Taniyasu, S., Horii, Y., Petrick, G., Gamo, T., 2005. A global
survey of perfluorinated acids in oceans. Mar. Pollut. Bull. 51, 658–668.
Yang, Y.-H., Chang, Y.-S., Kim, B.-H., Shin, D.C., Ikonomou, M.G., 2002. Congener-
distribution patterns and risk assessment of polychlorinated biphenyls, dipenzo-p-dioxins
and dibenzofurans in Korean human milk. Chemosphere 47, 1087–1095.
Yang, Y.H., Kim, B.H., Chang, Y.S., 2001. Analysis of PCDD/Fs and PCBs in human
blood and characteristics of contamination sources. Anal. Sci. Technol. 14, 147–158.
Yeo, H.-G., Choi, M., Chun, M.-Y., Kim, T.-W., Cho, K.-C., Sunwoo, Y., 2004a. Con-
centration characteristics of atmospheric PCBs for urban and rural area, Korea. Sci.
Total Environ. 324, 261–270.
Yeo, H.-G., Choi, M., Chun, M.-Y., Sunwoo, Y., 2003. Gas/particle concentrations and
partitioning of PCBs in the atmosphere of Korea. Atmos. Environ. 37, 3561–3570.
Yeo, H.-G., Choi, M., Sunwoo, Y., 2004b. Seasonal variations in atmospheric concentra-
tions of organochlorine pesticides in urban and rural areas of Korea. Atmos. Environ.
38, 4779–4788.
Yim, U.H., Hong, S.H., Shim, W.J., Oh, J.R., 2005. Levels of persistent organochlorine
contaminants in fish from Korea and their potential health risk. Arch. Environ. Contam.
Toxicol. 48, 358–366.
Yim, U.H., Oh, J.R., Hong, S.H., Lee, S.H., Shim, W.J., Shim, J.H., 2002. Identification of
PAHs sources in bivalves and sediments 5 years after the Sea Prince oil spill in Korea.
Environ. Forens. 3, 357–366.
Ying, G.G., Williams, B., Kookana, R., 2002. Environmental fate of alkylphenols and
alkylphenol ethoxylates: A review. Environ. Int. 28, 215–226.
You, S.-J., Park, C.-K., 1984. On the organochlorine pesticide residues in downstream area
of Nakdong river. J. Korean Agric. Chem. Soc. (in Korean) 27, 187–197.
Yu, B.-W., Jin, G.-Z., Moon, Y.-H., Kim, M.-K., Kyoung, J.-D., Chang, Y.-S., 2006.
Emission of PCDD/Fs and dioxin-like PCBs from metallurgy industries in S. Korea.
Chemosphere 62, 494–601.
Yunker, M.B., MacDonald, R.W., Vingarzan, R., Mitchell, R.H., Goyette, D., Sylvestre, S.,
2002. PAHs in the Fraser River basin: A critical appraisal of PAH ratios as indicators of
PAH source and composition. Org. Geochem. 33, 489–515.
Copyright © 2022 FDOKUMEN