Chapter 10 Financing for Materialization of the Master Plan ...
149
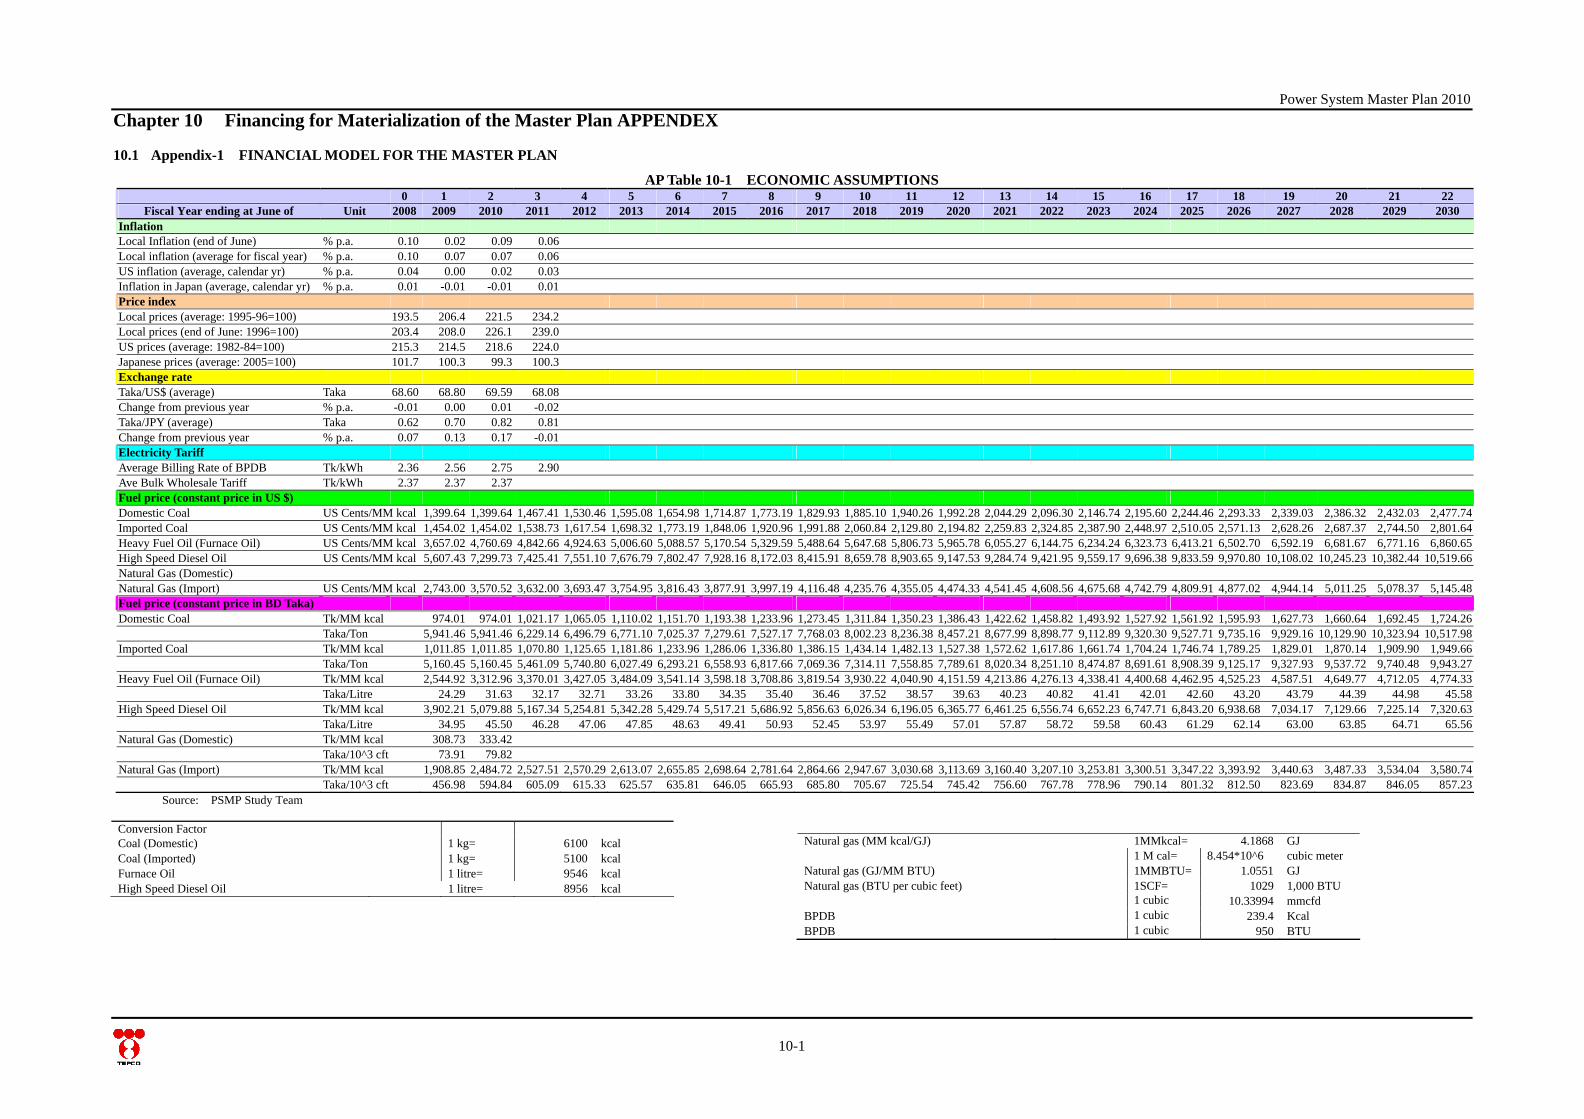
Power System Master Plan 2010 Chapter 10 Financing for Materialization of the Master Plan APPENDEX 10.1 Appendix-1 FINANCIAL MODEL FOR THE MASTER PLAN AP Table 10-1 ECONOMIC ASSUMPTIONS 0 1 2 3 4 5 6 7 8 9 10 11 12 13 14 15 16 17 18 19 20 21 22 Fiscal Year ending at June of Unit 2008 2009 2010 2011 2012 2013 2014 2015 2016 2017 2018 2019 2020 2021 2022 2023 2024 2025 2026 2027 2028 2029 2030 Inflation Local Inflation (end of June) % p.a. 0.10 0.02 0.09 0.06 Local inflation (average for fiscal year) % p.a. 0.10 0.07 0.07 0.06 US inflation (average, calendar yr) % p.a. 0.04 0.00 0.02 0.03 Inflation in Japan (average, calendar yr) % p.a. 0.01 -0.01 -0.01 0.01 Price index Local prices (average: 1995-96=100) 193.5 206.4 221.5 234.2 Local prices (end of June: 1996=100) 203.4 208.0 226.1 239.0 US prices (average: 1982-84=100) 215.3 214.5 218.6 224.0 Japanese prices (average: 2005=100) 101.7 100.3 99.3 100.3 Exchange rate Taka/US$ (average) Taka 68.60 68.80 69.59 68.08 Change from previous year % p.a. -0.01 0.00 0.01 -0.02 Taka/JPY (average) Taka 0.62 0.70 0.82 0.81 Change from previous year % p.a. 0.07 0.13 0.17 -0.01 Electricity Tariff Average Billing Rate of BPDB Tk/kWh 2.36 2.56 2.75 2.90 Ave Bulk Wholesale Tariff Tk/kWh 2.37 2.37 2.37 Fuel price (constant price in US $) Domestic Coal US Cents/MM kcal 1,399.64 1,399.64 1,467.41 1,530.46 1,595.08 1,654.98 1,714.87 1,773.19 1,829.93 1,885.10 1,940.26 1,992.28 2,044.29 2,096.30 2,146.74 2,195.60 2,244.46 2,293.33 2,339.03 2,386.32 2,432.03 2,477.74 Imported Coal US Cents/MM kcal 1,454.02 1,454.02 1,538.73 1,617.54 1,698.32 1,773.19 1,848.06 1,920.96 1,991.88 2,060.84 2,129.80 2,194.82 2,259.83 2,324.85 2,387.90 2,448.97 2,510.05 2,571.13 2,628.26 2,687.37 2,744.50 2,801.64 Heavy Fuel Oil (Furnace Oil) US Cents/MM kcal 3,657.02 4,760.69 4,842.66 4,924.63 5,006.60 5,088.57 5,170.54 5,329.59 5,488.64 5,647.68 5,806.73 5,965.78 6,055.27 6,144.75 6,234.24 6,323.73 6,413.21 6,502.70 6,592.19 6,681.67 6,771.16 6,860.65 High Speed Diesel Oil US Cents/MM kcal 5,607.43 7,299.73 7,425.41 7,551.10 7,676.79 7,802.47 7,928.16 8,172.03 8,415.91 8,659.78 8,903.65 9,147.53 9,284.74 9,421.95 9,559.17 9,696.38 9,833.59 9,970.80 10,108.02 10,245.23 10,382.44 10,519.66 Natural Gas (Domestic) Natural Gas (Import) US Cents/MM kcal 2,743.00 3,570.52 3,632.00 3,693.47 3,754.95 3,816.43 3,877.91 3,997.19 4,116.48 4,235.76 4,355.05 4,474.33 4,541.45 4,608.56 4,675.68 4,742.79 4,809.91 4,877.02 4,944.14 5,011.25 5,078.37 5,145.48 Fuel price (constant price in BD Taka) Domestic Coal Tk/MM kcal 974.01 974.01 1,021.17 1,065.05 1,110.02 1,151.70 1,193.38 1,233.96 1,273.45 1,311.84 1,350.23 1,386.43 1,422.62 1,458.82 1,493.92 1,527.92 1,561.92 1,595.93 1,627.73 1,660.64 1,692.45 1,724.26 Taka/Ton 5,941.46 5,941.46 6,229.14 6,496.79 6,771.10 7,025.37 7,279.61 7,527.17 7,768.03 8,002.23 8,236.38 8,457.21 8,677.99 8,898.77 9,112.89 9,320.30 9,527.71 9,735.16 9,929.16 10,129.90 10,323.94 10,517.98 Imported Coal Tk/MM kcal 1,011.85 1,011.85 1,070.80 1,125.65 1,181.86 1,233.96 1,286.06 1,336.80 1,386.15 1,434.14 1,482.13 1,527.38 1,572.62 1,617.86 1,661.74 1,704.24 1,746.74 1,789.25 1,829.01 1,870.14 1,909.90 1,949.66 Taka/Ton 5,160.45 5,160.45 5,461.09 5,740.80 6,027.49 6,293.21 6,558.93 6,817.66 7,069.36 7,314.11 7,558.85 7,789.61 8,020.34 8,251.10 8,474.87 8,691.61 8,908.39 9,125.17 9,327.93 9,537.72 9,740.48 9,943.27 Heavy Fuel Oil (Furnace Oil) Tk/MM kcal 2,544.92 3,312.96 3,370.01 3,427.05 3,484.09 3,541.14 3,598.18 3,708.86 3,819.54 3,930.22 4,040.90 4,151.59 4,213.86 4,276.13 4,338.41 4,400.68 4,462.95 4,525.23 4,587.51 4,649.77 4,712.05 4,774.33 Taka/Litre 24.29 31.63 32.17 32.71 33.26 33.80 34.35 35.40 36.46 37.52 38.57 39.63 40.23 40.82 41.41 42.01 42.60 43.20 43.79 44.39 44.98 45.58 High Speed Diesel Oil Tk/MM kcal 3,902.21 5,079.88 5,167.34 5,254.81 5,342.28 5,429.74 5,517.21 5,686.92 5,856.63 6,026.34 6,196.05 6,365.77 6,461.25 6,556.74 6,652.23 6,747.71 6,843.20 6,938.68 7,034.17 7,129.66 7,225.14 7,320.63 Taka/Litre 34.95 45.50 46.28 47.06 47.85 48.63 49.41 50.93 52.45 53.97 55.49 57.01 57.87 58.72 59.58 60.43 61.29 62.14 63.00 63.85 64.71 65.56 Natural Gas (Domestic) Tk/MM kcal 308.73 333.42 Taka/10^3 cft 73.91 79.82 Natural Gas (Import) Tk/MM kcal 1,908.85 2,484.72 2,527.51 2,570.29 2,613.07 2,655.85 2,698.64 2,781.64 2,864.66 2,947.67 3,030.68 3,113.69 3,160.40 3,207.10 3,253.81 3,300.51 3,347.22 3,393.92 3,440.63 3,487.33 3,534.04 3,580.74 Taka/10^3 cft 456.98 594.84 605.09 615.33 625.57 635.81 646.05 665.93 685.80 705.67 725.54 745.42 756.60 767.78 778.96 790.14 801.32 812.50 823.69 834.87 846.05 857.23 Source: PSMP Study Team Conversion Factor Coal (Domestic) 1 kg= 6100 kcal Coal (Imported) 1 kg= 5100 kcal Furnace Oil 1 litre= 9546 kcal High Speed Diesel Oil 1 litre= 8956 kcal Natural gas (MM kcal/GJ) 1MMkcal= 4.1868 GJ 1 M cal= 8.454*10^6 cubic meter Natural gas (GJ/MM BTU) 1MMBTU= 1.0551 GJ Natural gas (BTU per cubic feet) 1SCF= 1029 1,000 BTU 1 cubic 10.33994 mmcfd BPDB 1 cubic 239.4 Kcal BPDB 1 cubic 950 BTU 10-1
-
Upload
khangminh22 -
Category
Documents
-
view
2 -
download
0
Transcript of Chapter 10 Financing for Materialization of the Master Plan ...
Power System Master Plan 2010
Chapter 10 Financing for Materialization of the Master Plan APPENDEX
10.1 Appendix-1 FINANCIAL MODEL FOR THE MASTER PLAN
AP Table 10-1 ECONOMIC ASSUMPTIONS 0 1 2 3 4 5 6 7 8 9 10 11 12 13 14 15 16 17 18 19 20 21 22
Fiscal Year ending at June of Unit 2008 2009 2010 2011 2012 2013 2014 2015 2016 2017 2018 2019 2020 2021 2022 2023 2024 2025 2026 2027 2028 2029 2030 Inflation Local Inflation (end of June) % p.a. 0.10 0.02 0.09 0.06 Local inflation (average for fiscal year) % p.a. 0.10 0.07 0.07 0.06 US inflation (average, calendar yr) % p.a. 0.04 0.00 0.02 0.03 Inflation in Japan (average, calendar yr) % p.a. 0.01 -0.01 -0.01 0.01 Price index Local prices (average: 1995-96=100) 193.5 206.4 221.5 234.2 Local prices (end of June: 1996=100) 203.4 208.0 226.1 239.0 US prices (average: 1982-84=100) 215.3 214.5 218.6 224.0 Japanese prices (average: 2005=100) 101.7 100.3 99.3 100.3 Exchange rate Taka/US$ (average) Taka 68.60 68.80 69.59 68.08 Change from previous year % p.a. -0.01 0.00 0.01 -0.02 Taka/JPY (average) Taka 0.62 0.70 0.82 0.81 Change from previous year % p.a. 0.07 0.13 0.17 -0.01 Electricity Tariff Average Billing Rate of BPDB Tk/kWh 2.36 2.56 2.75 2.90 Ave Bulk Wholesale Tariff Tk/kWh 2.37 2.37 2.37 Fuel price (constant price in US $) Domestic Coal US Cents/MM kcal 1,399.64 1,399.64 1,467.41 1,530.46 1,595.08 1,654.98 1,714.87 1,773.19 1,829.93 1,885.10 1,940.26 1,992.28 2,044.29 2,096.30 2,146.74 2,195.60 2,244.46 2,293.33 2,339.03 2,386.32 2,432.03 2,477.74 Imported Coal US Cents/MM kcal 1,454.02 1,454.02 1,538.73 1,617.54 1,698.32 1,773.19 1,848.06 1,920.96 1,991.88 2,060.84 2,129.80 2,194.82 2,259.83 2,324.85 2,387.90 2,448.97 2,510.05 2,571.13 2,628.26 2,687.37 2,744.50 2,801.64 Heavy Fuel Oil (Furnace Oil) US Cents/MM kcal 3,657.02 4,760.69 4,842.66 4,924.63 5,006.60 5,088.57 5,170.54 5,329.59 5,488.64 5,647.68 5,806.73 5,965.78 6,055.27 6,144.75 6,234.24 6,323.73 6,413.21 6,502.70 6,592.19 6,681.67 6,771.16 6,860.65 High Speed Diesel Oil US Cents/MM kcal 5,607.43 7,299.73 7,425.41 7,551.10 7,676.79 7,802.47 7,928.16 8,172.03 8,415.91 8,659.78 8,903.65 9,147.53 9,284.74 9,421.95 9,559.17 9,696.38 9,833.59 9,970.80 10,108.02 10,245.23 10,382.44 10,519.66 Natural Gas (Domestic) Natural Gas (Import) US Cents/MM kcal 2,743.00 3,570.52 3,632.00 3,693.47 3,754.95 3,816.43 3,877.91 3,997.19 4,116.48 4,235.76 4,355.05 4,474.33 4,541.45 4,608.56 4,675.68 4,742.79 4,809.91 4,877.02 4,944.14 5,011.25 5,078.37 5,145.48 Fuel price (constant price in BD Taka) Domestic Coal Tk/MM kcal 974.01 974.01 1,021.17 1,065.05 1,110.02 1,151.70 1,193.38 1,233.96 1,273.45 1,311.84 1,350.23 1,386.43 1,422.62 1,458.82 1,493.92 1,527.92 1,561.92 1,595.93 1,627.73 1,660.64 1,692.45 1,724.26 Taka/Ton 5,941.46 5,941.46 6,229.14 6,496.79 6,771.10 7,025.37 7,279.61 7,527.17 7,768.03 8,002.23 8,236.38 8,457.21 8,677.99 8,898.77 9,112.89 9,320.30 9,527.71 9,735.16 9,929.16 10,129.90 10,323.94 10,517.98 Imported Coal Tk/MM kcal 1,011.85 1,011.85 1,070.80 1,125.65 1,181.86 1,233.96 1,286.06 1,336.80 1,386.15 1,434.14 1,482.13 1,527.38 1,572.62 1,617.86 1,661.74 1,704.24 1,746.74 1,789.25 1,829.01 1,870.14 1,909.90 1,949.66 Taka/Ton 5,160.45 5,160.45 5,461.09 5,740.80 6,027.49 6,293.21 6,558.93 6,817.66 7,069.36 7,314.11 7,558.85 7,789.61 8,020.34 8,251.10 8,474.87 8,691.61 8,908.39 9,125.17 9,327.93 9,537.72 9,740.48 9,943.27 Heavy Fuel Oil (Furnace Oil) Tk/MM kcal 2,544.92 3,312.96 3,370.01 3,427.05 3,484.09 3,541.14 3,598.18 3,708.86 3,819.54 3,930.22 4,040.90 4,151.59 4,213.86 4,276.13 4,338.41 4,400.68 4,462.95 4,525.23 4,587.51 4,649.77 4,712.05 4,774.33 Taka/Litre 24.29 31.63 32.17 32.71 33.26 33.80 34.35 35.40 36.46 37.52 38.57 39.63 40.23 40.82 41.41 42.01 42.60 43.20 43.79 44.39 44.98 45.58 High Speed Diesel Oil Tk/MM kcal 3,902.21 5,079.88 5,167.34 5,254.81 5,342.28 5,429.74 5,517.21 5,686.92 5,856.63 6,026.34 6,196.05 6,365.77 6,461.25 6,556.74 6,652.23 6,747.71 6,843.20 6,938.68 7,034.17 7,129.66 7,225.14 7,320.63 Taka/Litre 34.95 45.50 46.28 47.06 47.85 48.63 49.41 50.93 52.45 53.97 55.49 57.01 57.87 58.72 59.58 60.43 61.29 62.14 63.00 63.85 64.71 65.56 Natural Gas (Domestic) Tk/MM kcal 308.73 333.42 Taka/10^3 cft 73.91 79.82 Natural Gas (Import) Tk/MM kcal 1,908.85 2,484.72 2,527.51 2,570.29 2,613.07 2,655.85 2,698.64 2,781.64 2,864.66 2,947.67 3,030.68 3,113.69 3,160.40 3,207.10 3,253.81 3,300.51 3,347.22 3,393.92 3,440.63 3,487.33 3,534.04 3,580.74 Taka/10^3 cft 456.98 594.84 605.09 615.33 625.57 635.81 646.05 665.93 685.80 705.67 725.54 745.42 756.60 767.78 778.96 790.14 801.32 812.50 823.69 834.87 846.05 857.23
Source: PSMP Study Team
Conversion Factor Coal (Domestic) 1 kg= 6100 kcal Coal (Imported) 1 kg= 5100 kcal Furnace Oil 1 litre= 9546 kcal High Speed Diesel Oil 1 litre= 8956 kcal
Natural gas (MM kcal/GJ) 1MMkcal= 4.1868 GJ 1 M cal= 8.454*10^6 cubic meter Natural gas (GJ/MM BTU) 1MMBTU= 1.0551 GJ Natural gas (BTU per cubic feet) 1SCF= 1029 1,000 BTU 1 cubic 10.33994 mmcfd BPDB 1 cubic 239.4 Kcal BPDB 1 cubic 950 BTU
10-1
Power System Master Plan 2010
10-2
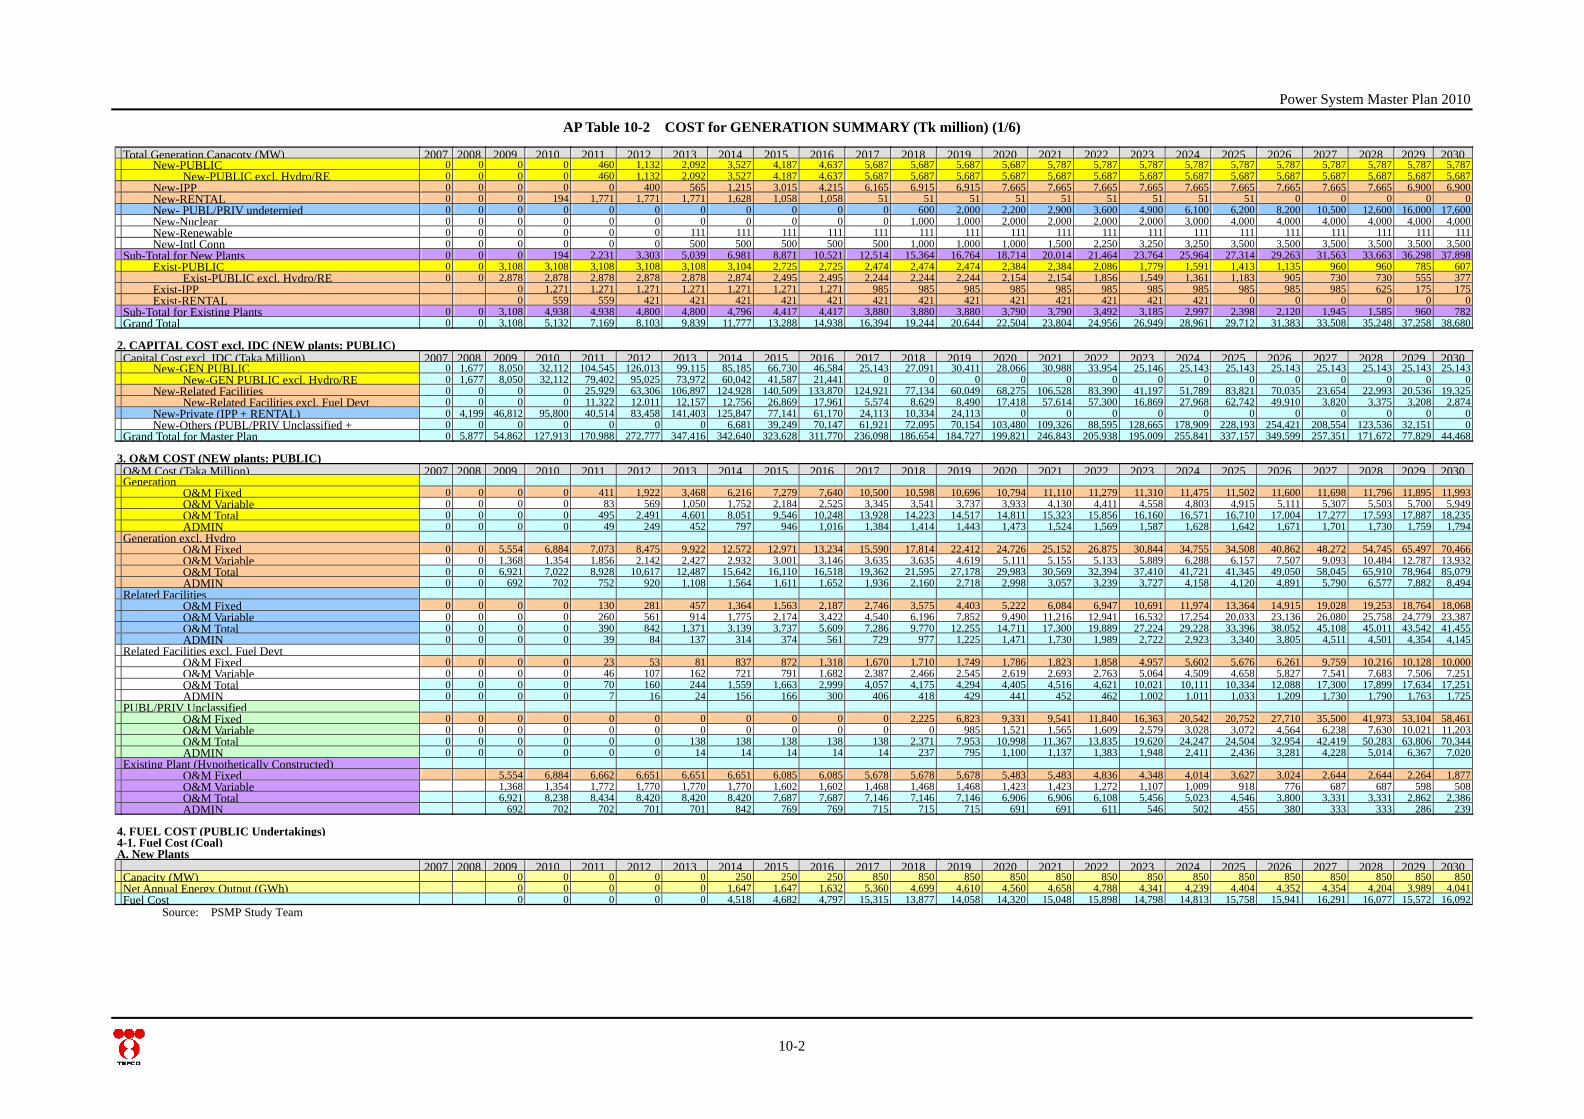
AP Table 10-2 COST for GENERATION SUMMARY (Tk million) (1/6) Total Generation Capacoty (MW) 2007 2008 2009 2010 2011 2012 2013 2014 2015 2016 2017 2018 2019 2020 2021 2022 2023 2024 2025 2026 2027 2028 2029 2030
New-PUBLIC 0 0 0 0 460 1,132 2,092 3,527 4,187 4,637 5,687 5,687 5,687 5,687 5,787 5,787 5,787 5,787 5,787 5,787 5,787 5,787 5,787 5,787 New-PUBLIC excl. Hydro/RE 0 0 0 0 460 1,132 2,092 3,527 4,187 4,637 5,687 5,687 5,687 5,687 5,687 5,687 5,687 5,687 5,687 5,687 5,687 5,687 5,687 5,687 New-IPP 0 0 0 0 0 400 565 1,215 3,015 4,215 6,165 6,915 6,915 7,665 7,665 7,665 7,665 7,665 7,665 7,665 7,665 7,665 6,900 6,900 New-RENTAL 0 0 0 194 1,771 1,771 1,771 1,628 1,058 1,058 51 51 51 51 51 51 51 51 51 0 0 0 0 0 New- PUBL/PRIV undeternied 0 0 0 0 0 0 0 0 0 0 0 600 2,000 2,200 2,900 3,600 4,900 6,100 6,200 8,200 10,500 12,600 16,000 17,600 New-Nuclear 0 0 0 0 0 0 0 0 0 0 0 1,000 1,000 2,000 2,000 2,000 2,000 3,000 4,000 4,000 4,000 4,000 4,000 4,000 New-Renewable 0 0 0 0 0 0 111 111 111 111 111 111 111 111 111 111 111 111 111 111 111 111 111 111 New-Intl Conn 0 0 0 0 0 0 500 500 500 500 500 1,000 1,000 1,000 1,500 2,250 3,250 3,250 3,500 3,500 3,500 3,500 3,500 3,500 Sub-Total for New Plants 0 0 0 194 2,231 3,303 5,039 6,981 8,871 10,521 12,514 15,364 16,764 18,714 20,014 21,464 23,764 25,964 27,314 29,263 31,563 33,663 36,298 37,898 Exist-PUBLIC 0 0 3,108 3,108 3,108 3,108 3,108 3,104 2,725 2,725 2,474 2,474 2,474 2,384 2,384 2,086 1,779 1,591 1,413 1,135 960 960 785 607 Exist-PUBLIC excl. Hydro/RE 0 0 2,878 2,878 2,878 2,878 2,878 2,874 2,495 2,495 2,244 2,244 2,244 2,154 2,154 1,856 1,549 1,361 1,183 905 730 730 555 377 Exist-IPP 0 1,271 1,271 1,271 1,271 1,271 1,271 1,271 985 985 985 985 985 985 985 985 985 985 985 625 175 175 Exist-RENTAL 0 559 559 421 421 421 421 421 421 421 421 421 421 421 421 421 0 0 0 0 0 0 Sub-Total for Existing Plants 0 0 3,108 4,938 4,938 4,800 4,800 4,796 4,417 4,417 3,880 3,880 3,880 3,790 3,790 3,492 3,185 2,997 2,398 2,120 1,945 1,585 960 782 Grand Total 0 0 3,108 5,132 7,169 8,103 9,839 11,777 13,288 14,938 16,394 19,244 20,644 22,504 23,804 24,956 26,949 28,961 29,712 31,383 33,508 35,248 37,258 38,680
2. CAPITAL COST excl. IDC (NEW plants: PUBLIC) Capital Cost excl. IDC (Taka Million) 2007 2008 2009 2010 2011 2012 2013 2014 2015 2016 2017 2018 2019 2020 2021 2022 2023 2024 2025 2026 2027 2028 2029 2030
New-GEN PUBLIC 0 1,677 8,050 32,112 104,545 126,013 99,115 85,185 66,730 46,584 25,143 27,091 30,411 28,066 30,988 33,954 25,146 25,143 25,143 25,143 25,143 25,143 25,143 25,143 New-GEN PUBLIC excl. Hydro/RE 0 1,677 8,050 32,112 79,402 95,025 73,972 60,042 41,587 21,441 0 0 0 0 0 0 0 0 0 0 0 0 0 0 New-Related Facilities 0 0 0 0 25,929 63,306 106,897 124,928 140,509 133,870 124,921 77,134 60,049 68,275 106,528 83,390 41,197 51,789 83,821 70,035 23,654 22,993 20,536 19,325 New-Related Facilities excl. Fuel Devt 0 0 0 0 11,322 12,011 12,157 12,756 26,869 17,961 5,574 8,629 8,490 17,418 57,614 57,300 16,869 27,968 62,742 49,910 3,820 3,375 3,208 2,874 New-Private (IPP + RENTAL) 0 4,199 46,812 95,800 40,514 83,458 141,403 125,847 77,141 61,170 24,113 10,334 24,113 0 0 0 0 0 0 0 0 0 0 0 New-Others (PUBL/PRIV Unclassified + 0 0 0 0 0 0 0 6,681 39,249 70,147 61,921 72,095 70,154 103,480 109,326 88,595 128,665 178,909 228,193 254,421 208,554 123,536 32,151 0 Grand Total for Master Plan 0 5,877 54,862 127,913 170,988 272,777 347,416 342,640 323,628 311,770 236,098 186,654 184,727 199,821 246,843 205,938 195,009 255,841 337,157 349,599 257,351 171,672 77,829 44,468
3. O&M COST (NEW plants: PUBLIC) O&M Cost (Taka Million) 2007 2008 2009 2010 2011 2012 2013 2014 2015 2016 2017 2018 2019 2020 2021 2022 2023 2024 2025 2026 2027 2028 2029 2030
Generation O&M Fixed 0 0 0 0 411 1,922 3,468 6,216 7,279 7,640 10,500 10,598 10,696 10,794 11,110 11,279 11,310 11,475 11,502 11,600 11,698 11,796 11,895 11,993 O&M Variable 0 0 0 0 83 569 1,050 1,752 2,184 2,525 3,345 3,541 3,737 3,933 4,130 4,411 4,558 4,803 4,915 5,111 5,307 5,503 5,700 5,949 O&M Total 0 0 0 0 495 2,491 4,601 8,051 9,546 10,248 13,928 14,223 14,517 14,811 15,323 15,856 16,160 16,571 16,710 17,004 17,277 17,593 17,887 18,235 ADMIN 0 0 0 0 49 249 452 797 946 1,016 1,384 1,414 1,443 1,473 1,524 1,569 1,587 1,628 1,642 1,671 1,701 1,730 1,759 1,794 Generation excl. Hydro O&M Fixed 0 0 5,554 6,884 7,073 8,475 9,922 12,572 12,971 13,234 15,590 17,814 22,412 24,726 25,152 26,875 30,844 34,755 34,508 40,862 48,272 54,745 65,497 70,466 O&M Variable 0 0 1,368 1,354 1,856 2,142 2,427 2,932 3,001 3,146 3,635 3,635 4,619 5,111 5,155 5,133 5,889 6,288 6,157 7,507 9,093 10,484 12,787 13,932 O&M Total 0 0 6,921 7,022 8,928 10,617 12,487 15,642 16,110 16,518 19,362 21,595 27,178 29,983 30,569 32,394 37,410 41,721 41,345 49,050 58,045 65,910 78,964 85,079 ADMIN 0 0 692 702 752 920 1,108 1,564 1,611 1,652 1,936 2,160 2,718 2,998 3,057 3,239 3,727 4,158 4,120 4,891 5,790 6,577 7,882 8,494 Related Facilities O&M Fixed 0 0 0 0 130 281 457 1,364 1,563 2,187 2,746 3,575 4,403 5,222 6,084 6,947 10,691 11,974 13,364 14,915 19,028 19,253 18,764 18,068 O&M Variable 0 0 0 0 260 561 914 1,775 2,174 3,422 4,540 6,196 7,852 9,490 11,216 12,941 16,532 17,254 20,033 23,136 26,080 25,758 24,779 23,387 O&M Total 0 0 0 0 390 842 1,371 3,139 3,737 5,609 7,286 9,770 12,255 14,711 17,300 19,889 27,224 29,228 33,396 38,052 45,108 45,011 43,542 41,455 ADMIN 0 0 0 0 39 84 137 314 374 561 729 977 1,225 1,471 1,730 1,989 2,722 2,923 3,340 3,805 4,511 4,501 4,354 4,145 Related Facilities excl. Fuel Devt O&M Fixed 0 0 0 0 23 53 81 837 872 1,318 1,670 1,710 1,749 1,786 1,823 1,858 4,957 5,602 5,676 6,261 9,759 10,216 10,128 10,000 O&M Variable 0 0 0 0 46 107 162 721 791 1,682 2,387 2,466 2,545 2,619 2,693 2,763 5,064 4,509 4,658 5,827 7,541 7,683 7,506 7,251 O&M Total 0 0 0 0 70 160 244 1,559 1,663 2,999 4,057 4,175 4,294 4,405 4,516 4,621 10,021 10,111 10,334 12,088 17,300 17,899 17,634 17,251 ADMIN 0 0 0 0 7 16 24 156 166 300 406 418 429 441 452 462 1,002 1,011 1,033 1,209 1,730 1,790 1,763 1,725 PUBL/PRIV Unclassified O&M Fixed 0 0 0 0 0 0 0 0 0 0 0 2,225 6,823 9,331 9,541 11,840 16,363 20,542 20,752 27,710 35,500 41,973 53,104 58,461 O&M Variable 0 0 0 0 0 0 0 0 0 0 0 0 985 1,521 1,565 1,609 2,579 3,028 3,072 4,564 6,238 7,630 10,021 11,203 O&M Total 0 0 0 0 0 0 138 138 138 138 138 2,371 7,953 10,998 11,367 13,835 19,620 24,247 24,504 32,954 42,419 50,283 63,806 70,344 ADMIN 0 0 0 0 0 0 14 14 14 14 14 237 795 1,100 1,137 1,383 1,948 2,411 2,436 3,281 4,228 5,014 6,367 7,020 Existing Plant (Hypothetically Constructed) O&M Fixed 5,554 6,884 6,662 6,651 6,651 6,651 6,085 6,085 5,678 5,678 5,678 5,483 5,483 4,836 4,348 4,014 3,627 3,024 2,644 2,644 2,264 1,877 O&M Variable 1,368 1,354 1,772 1,770 1,770 1,770 1,602 1,602 1,468 1,468 1,468 1,423 1,423 1,272 1,107 1,009 918 776 687 687 598 508 O&M Total 6,921 8,238 8,434 8,420 8,420 8,420 7,687 7,687 7,146 7,146 7,146 6,906 6,906 6,108 5,456 5,023 4,546 3,800 3,331 3,331 2,862 2,386 ADMIN 692 702 702 701 701 842 769 769 715 715 715 691 691 611 546 502 455 380 333 333 286 239
4. FUEL COST (PUBLIC Undertakings) 4-1. Fuel Cost (Coal) A. New Plants
2007 2008 2009 2010 2011 2012 2013 2014 2015 2016 2017 2018 2019 2020 2021 2022 2023 2024 2025 2026 2027 2028 2029 2030 Capacity (MW) 0 0 0 0 0 250 250 250 850 850 850 850 850 850 850 850 850 850 850 850 850 850 Net Annual Energy Output (GWh) 0 0 0 0 0 1,647 1,647 1,632 5,360 4,699 4,610 4,560 4,658 4,788 4,341 4,239 4,404 4,352 4,354 4,204 3,989 4,041 Fuel Cost 0 0 0 0 0 4,518 4,682 4,797 15,315 13,877 14,058 14,320 15,048 15,898 14,798 14,813 15,758 15,941 16,291 16,077 15,572 16,092
Source: PSMP Study Team
Power System Master Plan 2010
10-3
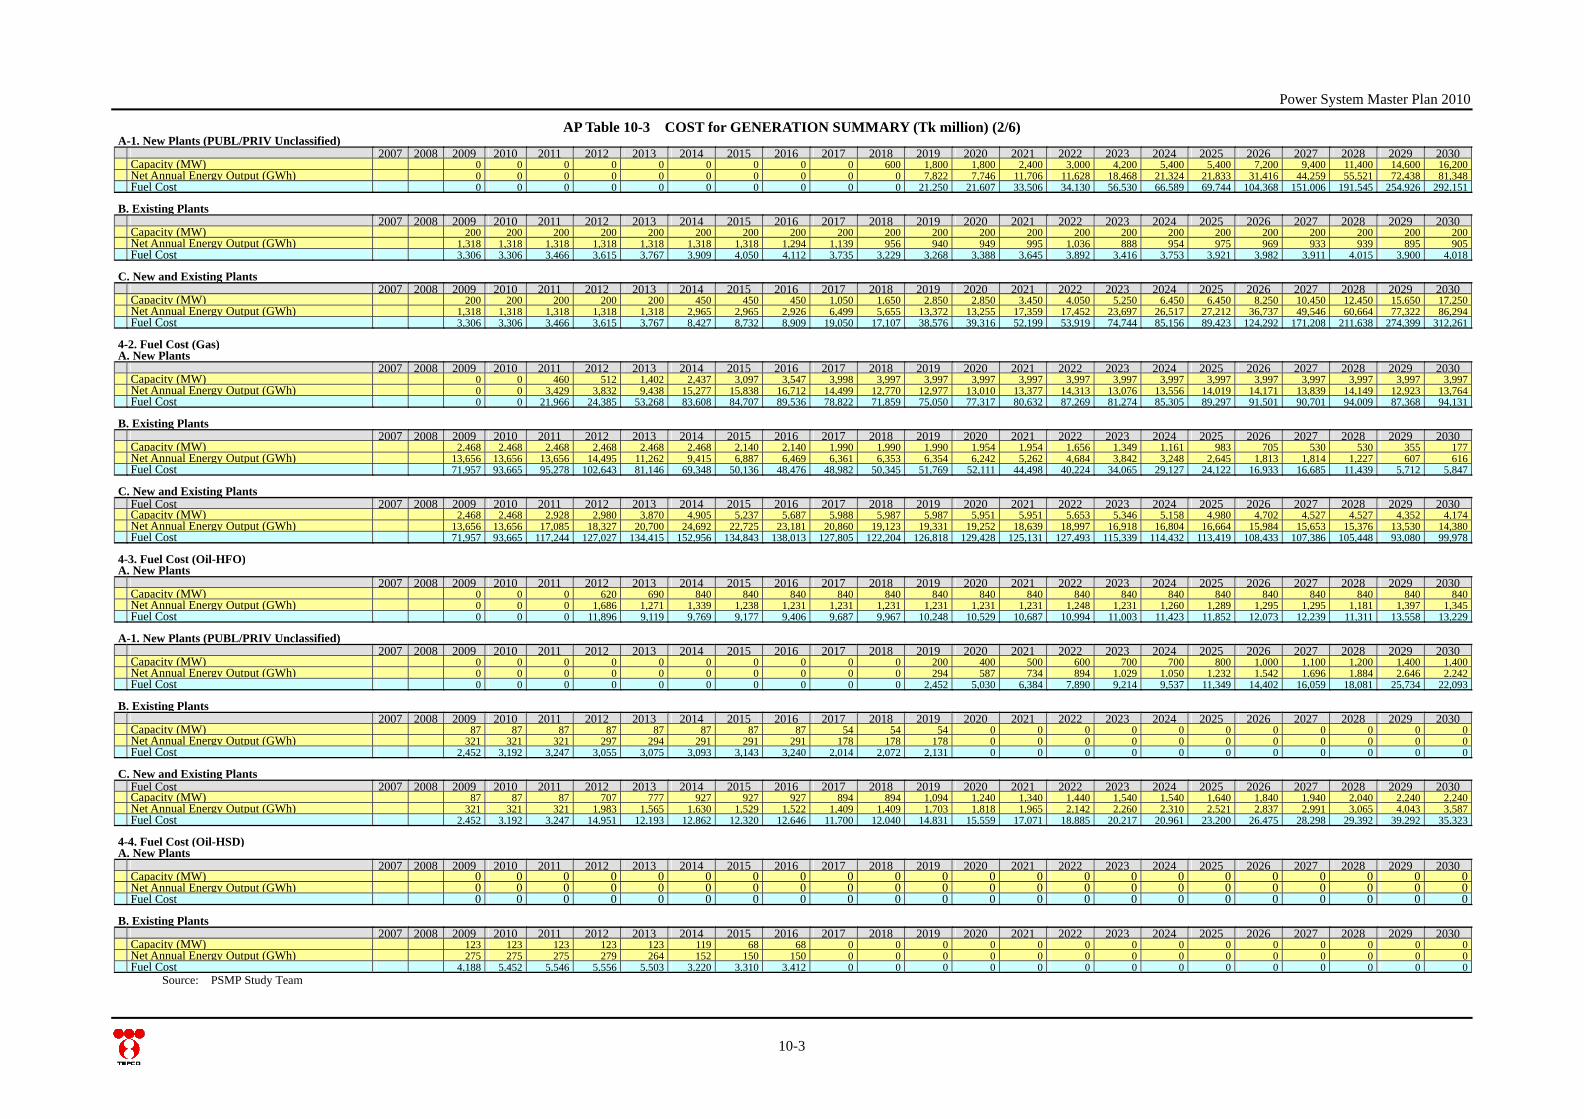
AP Table 10-3 COST for GENERATION SUMMARY (Tk million) (2/6) A-1. New Plants (PUBL/PRIV Unclassified) 2007 2008 2009 2010 2011 2012 2013 2014 2015 2016 2017 2018 2019 2020 2021 2022 2023 2024 2025 2026 2027 2028 2029 2030 Capacity (MW) 0 0 0 0 0 0 0 0 0 600 1,800 1,800 2,400 3,000 4,200 5,400 5,400 7,200 9,400 11,400 14,600 16,200 Net Annual Energy Output (GWh) 0 0 0 0 0 0 0 0 0 0 7,822 7,746 11,706 11,628 18,468 21,324 21,833 31,416 44,259 55,521 72,438 81,348 Fuel Cost 0 0 0 0 0 0 0 0 0 0 21,250 21,607 33,506 34,130 56,530 66,589 69,744 104,368 151,006 191,545 254,926 292,151 B. Existing Plants 2007 2008 2009 2010 2011 2012 2013 2014 2015 2016 2017 2018 2019 2020 2021 2022 2023 2024 2025 2026 2027 2028 2029 2030 Capacity (MW) 200 200 200 200 200 200 200 200 200 200 200 200 200 200 200 200 200 200 200 200 200 200 Net Annual Energy Output (GWh) 1,318 1,318 1,318 1,318 1,318 1,318 1,318 1,294 1,139 956 940 949 995 1,036 888 954 975 969 933 939 895 905 Fuel Cost 3,306 3,306 3,466 3,615 3,767 3,909 4,050 4,112 3,735 3,229 3,268 3,388 3,645 3,892 3,416 3,753 3,921 3,982 3,911 4,015 3,900 4,018 C. New and Existing Plants 2007 2008 2009 2010 2011 2012 2013 2014 2015 2016 2017 2018 2019 2020 2021 2022 2023 2024 2025 2026 2027 2028 2029 2030 Capacity (MW) 200 200 200 200 200 450 450 450 1,050 1,650 2,850 2,850 3,450 4,050 5,250 6,450 6,450 8,250 10,450 12,450 15,650 17,250 Net Annual Energy Output (GWh) 1,318 1,318 1,318 1,318 1,318 2,965 2,965 2,926 6,499 5,655 13,372 13,255 17,359 17,452 23,697 26,517 27,212 36,737 49,546 60,664 77,322 86,294 Fuel Cost 3,306 3,306 3,466 3,615 3,767 8,427 8,732 8,909 19,050 17,107 38,576 39,316 52,199 53,919 74,744 85,156 89,423 124,292 171,208 211,638 274,399 312,261 4-2. Fuel Cost (Gas) A. New Plants 2007 2008 2009 2010 2011 2012 2013 2014 2015 2016 2017 2018 2019 2020 2021 2022 2023 2024 2025 2026 2027 2028 2029 2030 Capacity (MW) 0 0 460 512 1,402 2,437 3,097 3,547 3,998 3,997 3,997 3,997 3,997 3,997 3,997 3,997 3,997 3,997 3,997 3,997 3,997 3,997 Net Annual Energy Output (GWh) 0 0 3,429 3,832 9,438 15,277 15,838 16,712 14,499 12,770 12,977 13,010 13,377 14,313 13,076 13,556 14,019 14,171 13,839 14,149 12,923 13,764 Fuel Cost 0 0 21,966 24,385 53,268 83,608 84,707 89,536 78,822 71,859 75,050 77,317 80,632 87,269 81,274 85,305 89,297 91,501 90,701 94,009 87,368 94,131 B. Existing Plants 2007 2008 2009 2010 2011 2012 2013 2014 2015 2016 2017 2018 2019 2020 2021 2022 2023 2024 2025 2026 2027 2028 2029 2030 Capacity (MW) 2,468 2,468 2,468 2,468 2,468 2,468 2,140 2,140 1,990 1,990 1,990 1,954 1,954 1,656 1,349 1,161 983 705 530 530 355 177 Net Annual Energy Output (GWh) 13,656 13,656 13,656 14,495 11,262 9,415 6,887 6,469 6,361 6,353 6,354 6,242 5,262 4,684 3,842 3,248 2,645 1,813 1,814 1,227 607 616 Fuel Cost 71,957 93,665 95,278 102,643 81,146 69,348 50,136 48,476 48,982 50,345 51,769 52,111 44,498 40,224 34,065 29,127 24,122 16,933 16,685 11,439 5,712 5,847 C. New and Existing Plants Fuel Cost 2007 2008 2009 2010 2011 2012 2013 2014 2015 2016 2017 2018 2019 2020 2021 2022 2023 2024 2025 2026 2027 2028 2029 2030 Capacity (MW) 2,468 2,468 2,928 2,980 3,870 4,905 5,237 5,687 5,988 5,987 5,987 5,951 5,951 5,653 5,346 5,158 4,980 4,702 4,527 4,527 4,352 4,174 Net Annual Energy Output (GWh) 13,656 13,656 17,085 18,327 20,700 24,692 22,725 23,181 20,860 19,123 19,331 19,252 18,639 18,997 16,918 16,804 16,664 15,984 15,653 15,376 13,530 14,380 Fuel Cost 71,957 93,665 117,244 127,027 134,415 152,956 134,843 138,013 127,805 122,204 126,818 129,428 125,131 127,493 115,339 114,432 113,419 108,433 107,386 105,448 93,080 99,978 4-3. Fuel Cost (Oil-HFO) A. New Plants 2007 2008 2009 2010 2011 2012 2013 2014 2015 2016 2017 2018 2019 2020 2021 2022 2023 2024 2025 2026 2027 2028 2029 2030 Capacity (MW) 0 0 0 620 690 840 840 840 840 840 840 840 840 840 840 840 840 840 840 840 840 840 Net Annual Energy Output (GWh) 0 0 0 1,686 1,271 1,339 1,238 1,231 1,231 1,231 1,231 1,231 1,231 1,248 1,231 1,260 1,289 1,295 1,295 1,181 1,397 1,345 Fuel Cost 0 0 0 11,896 9,119 9,769 9,177 9,406 9,687 9,967 10,248 10,529 10,687 10,994 11,003 11,423 11,852 12,073 12,239 11,311 13,558 13,229 A-1. New Plants (PUBL/PRIV Unclassified) 2007 2008 2009 2010 2011 2012 2013 2014 2015 2016 2017 2018 2019 2020 2021 2022 2023 2024 2025 2026 2027 2028 2029 2030 Capacity (MW) 0 0 0 0 0 0 0 0 0 0 200 400 500 600 700 700 800 1,000 1,100 1,200 1,400 1,400 Net Annual Energy Output (GWh) 0 0 0 0 0 0 0 0 0 0 294 587 734 894 1,029 1,050 1,232 1,542 1,696 1,884 2,646 2,242 Fuel Cost 0 0 0 0 0 0 0 0 0 0 2,452 5,030 6,384 7,890 9,214 9,537 11,349 14,402 16,059 18,081 25,734 22,093 B. Existing Plants 2007 2008 2009 2010 2011 2012 2013 2014 2015 2016 2017 2018 2019 2020 2021 2022 2023 2024 2025 2026 2027 2028 2029 2030 Capacity (MW) 87 87 87 87 87 87 87 87 54 54 54 0 0 0 0 0 0 0 0 0 0 0 Net Annual Energy Output (GWh) 321 321 321 297 294 291 291 291 178 178 178 0 0 0 0 0 0 0 0 0 0 0 Fuel Cost 2,452 3,192 3,247 3,055 3,075 3,093 3,143 3,240 2,014 2,072 2,131 0 0 0 0 0 0 0 0 0 0 0 C. New and Existing Plants Fuel Cost 2007 2008 2009 2010 2011 2012 2013 2014 2015 2016 2017 2018 2019 2020 2021 2022 2023 2024 2025 2026 2027 2028 2029 2030 Capacity (MW) 87 87 87 707 777 927 927 927 894 894 1,094 1,240 1,340 1,440 1,540 1,540 1,640 1,840 1,940 2,040 2,240 2,240 Net Annual Energy Output (GWh) 321 321 321 1,983 1,565 1,630 1,529 1,522 1,409 1,409 1,703 1,818 1,965 2,142 2,260 2,310 2,521 2,837 2,991 3,065 4,043 3,587 Fuel Cost 2,452 3,192 3,247 14,951 12,193 12,862 12,320 12,646 11,700 12,040 14,831 15,559 17,071 18,885 20,217 20,961 23,200 26,475 28,298 29,392 39,292 35,323 4-4. Fuel Cost (Oil-HSD) A. New Plants 2007 2008 2009 2010 2011 2012 2013 2014 2015 2016 2017 2018 2019 2020 2021 2022 2023 2024 2025 2026 2027 2028 2029 2030 Capacity (MW) 0 0 0 0 0 0 0 0 0 0 0 0 0 0 0 0 0 0 0 0 0 0 Net Annual Energy Output (GWh) 0 0 0 0 0 0 0 0 0 0 0 0 0 0 0 0 0 0 0 0 0 0 Fuel Cost 0 0 0 0 0 0 0 0 0 0 0 0 0 0 0 0 0 0 0 0 0 0 B. Existing Plants 2007 2008 2009 2010 2011 2012 2013 2014 2015 2016 2017 2018 2019 2020 2021 2022 2023 2024 2025 2026 2027 2028 2029 2030 Capacity (MW) 123 123 123 123 123 119 68 68 0 0 0 0 0 0 0 0 0 0 0 0 0 0 Net Annual Energy Output (GWh) 275 275 275 279 264 152 150 150 0 0 0 0 0 0 0 0 0 0 0 0 0 0 Fuel Cost 4,188 5,452 5,546 5,556 5,503 3,220 3,310 3,412 0 0 0 0 0 0 0 0 0 0 0 0 0 0
Source: PSMP Study Team
Power System Master Plan 2010
10-4
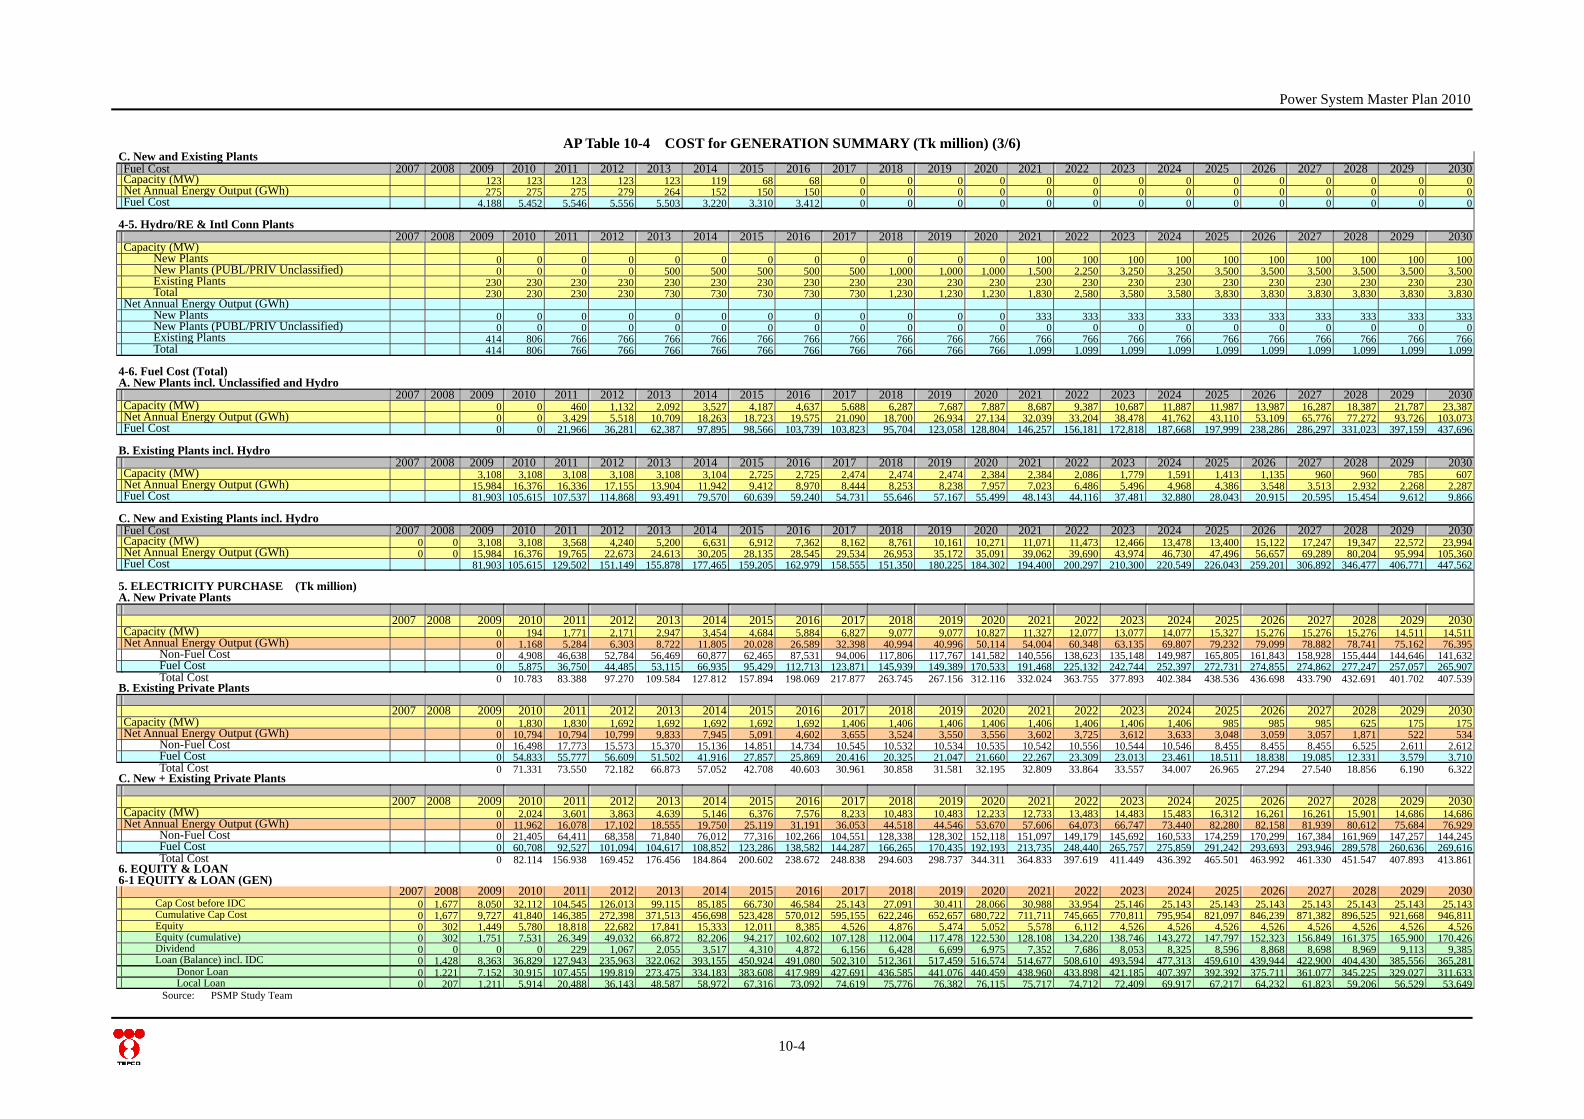
AP Table 10-4 COST for GENERATION SUMMARY (Tk million) (3/6) C. New and Existing Plants Fuel Cost 2007 2008 2009 2010 2011 2012 2013 2014 2015 2016 2017 2018 2019 2020 2021 2022 2023 2024 2025 2026 2027 2028 2029 2030 Capacity (MW) 123 123 123 123 123 119 68 68 0 0 0 0 0 0 0 0 0 0 0 0 0 0 Net Annual Energy Output (GWh) 275 275 275 279 264 152 150 150 0 0 0 0 0 0 0 0 0 0 0 0 0 0 Fuel Cost 4,188 5,452 5,546 5,556 5,503 3,220 3,310 3,412 0 0 0 0 0 0 0 0 0 0 0 0 0 0 4-5. Hydro/RE & Intl Conn Plants 2007 2008 2009 2010 2011 2012 2013 2014 2015 2016 2017 2018 2019 2020 2021 2022 2023 2024 2025 2026 2027 2028 2029 2030 Capacity (MW) New Plants 0 0 0 0 0 0 0 0 0 0 0 0 100 100 100 100 100 100 100 100 100 100 New Plants (PUBL/PRIV Unclassified) 0 0 0 0 500 500 500 500 500 1,000 1,000 1,000 1,500 2,250 3,250 3,250 3,500 3,500 3,500 3,500 3,500 3,500 Existing Plants 230 230 230 230 230 230 230 230 230 230 230 230 230 230 230 230 230 230 230 230 230 230 Total 230 230 230 230 730 730 730 730 730 1,230 1,230 1,230 1,830 2,580 3,580 3,580 3,830 3,830 3,830 3,830 3,830 3,830 Net Annual Energy Output (GWh) New Plants 0 0 0 0 0 0 0 0 0 0 0 0 333 333 333 333 333 333 333 333 333 333 New Plants (PUBL/PRIV Unclassified) 0 0 0 0 0 0 0 0 0 0 0 0 0 0 0 0 0 0 0 0 0 0 Existing Plants 414 806 766 766 766 766 766 766 766 766 766 766 766 766 766 766 766 766 766 766 766 766 Total 414 806 766 766 766 766 766 766 766 766 766 766 1,099 1,099 1,099 1,099 1,099 1,099 1,099 1,099 1,099 1,099 4-6. Fuel Cost (Total) A. New Plants incl. Unclassified and Hydro 2007 2008 2009 2010 2011 2012 2013 2014 2015 2016 2017 2018 2019 2020 2021 2022 2023 2024 2025 2026 2027 2028 2029 2030 Capacity (MW) 0 0 460 1,132 2,092 3,527 4,187 4,637 5,688 6,287 7,687 7,887 8,687 9,387 10,687 11,887 11,987 13,987 16,287 18,387 21,787 23,387 Net Annual Energy Output (GWh) 0 0 3,429 5,518 10,709 18,263 18,723 19,575 21,090 18,700 26,934 27,134 32,039 33,204 38,478 41,762 43,110 53,109 65,776 77,272 93,726 103,073 Fuel Cost 0 0 21,966 36,281 62,387 97,895 98,566 103,739 103,823 95,704 123,058 128,804 146,257 156,181 172,818 187,668 197,999 238,286 286,297 331,023 397,159 437,696 B. Existing Plants incl. Hydro 2007 2008 2009 2010 2011 2012 2013 2014 2015 2016 2017 2018 2019 2020 2021 2022 2023 2024 2025 2026 2027 2028 2029 2030 Capacity (MW) 3,108 3,108 3,108 3,108 3,108 3,104 2,725 2,725 2,474 2,474 2,474 2,384 2,384 2,086 1,779 1,591 1,413 1,135 960 960 785 607 Net Annual Energy Output (GWh) 15,984 16,376 16,336 17,155 13,904 11,942 9,412 8,970 8,444 8,253 8,238 7,957 7,023 6,486 5,496 4,968 4,386 3,548 3,513 2,932 2,268 2,287 Fuel Cost 81,903 105,615 107,537 114,868 93,491 79,570 60,639 59,240 54,731 55,646 57,167 55,499 48,143 44,116 37,481 32,880 28,043 20,915 20,595 15,454 9,612 9,866 C. New and Existing Plants incl. Hydro Fuel Cost 2007 2008 2009 2010 2011 2012 2013 2014 2015 2016 2017 2018 2019 2020 2021 2022 2023 2024 2025 2026 2027 2028 2029 2030 Capacity (MW) 0 0 3,108 3,108 3,568 4,240 5,200 6,631 6,912 7,362 8,162 8,761 10,161 10,271 11,071 11,473 12,466 13,478 13,400 15,122 17,247 19,347 22,572 23,994 Net Annual Energy Output (GWh) 0 0 15,984 16,376 19,765 22,673 24,613 30,205 28,135 28,545 29,534 26,953 35,172 35,091 39,062 39,690 43,974 46,730 47,496 56,657 69,289 80,204 95,994 105,360 Fuel Cost 81,903 105,615 129,502 151,149 155,878 177,465 159,205 162,979 158,555 151,350 180,225 184,302 194,400 200,297 210,300 220,549 226,043 259,201 306,892 346,477 406,771 447,562 5. ELECTRICITY PURCHASE (Tk million) A. New Private Plants 2007 2008 2009 2010 2011 2012 2013 2014 2015 2016 2017 2018 2019 2020 2021 2022 2023 2024 2025 2026 2027 2028 2029 2030 Capacity (MW) 0 194 1,771 2,171 2,947 3,454 4,684 5,884 6,827 9,077 9,077 10,827 11,327 12,077 13,077 14,077 15,327 15,276 15,276 15,276 14,511 14,511 Net Annual Energy Output (GWh) 0 1,168 5,284 6,303 8,722 11,805 20,028 26,589 32,398 40,994 40,996 50,114 54,004 60,348 63,135 69,807 79,232 79,099 78,882 78,741 75,162 76,395 Non-Fuel Cost 0 4,908 46,638 52,784 56,469 60,877 62,465 87,531 94,006 117,806 117,767 141,582 140,556 138,623 135,148 149,987 165,805 161,843 158,928 155,444 144,646 141,632 Fuel Cost 0 5,875 36,750 44,485 53,115 66,935 95,429 112,713 123,871 145,939 149,389 170,533 191,468 225,132 242,744 252,397 272,731 274,855 274,862 277,247 257,057 265,907 Total Cost 0 10,783 83,388 97,270 109,584 127,812 157,894 198,069 217,877 263,745 267,156 312,116 332,024 363,755 377,893 402,384 438,536 436,698 433,790 432,691 401,702 407,539 B. Existing Private Plants 2007 2008 2009 2010 2011 2012 2013 2014 2015 2016 2017 2018 2019 2020 2021 2022 2023 2024 2025 2026 2027 2028 2029 2030 Capacity (MW) 0 1,830 1,830 1,692 1,692 1,692 1,692 1,692 1,406 1,406 1,406 1,406 1,406 1,406 1,406 1,406 985 985 985 625 175 175 Net Annual Energy Output (GWh) 0 10,794 10,794 10,799 9,833 7,945 5,091 4,602 3,655 3,524 3,550 3,556 3,602 3,725 3,612 3,633 3,048 3,059 3,057 1,871 522 534 Non-Fuel Cost 0 16,498 17,773 15,573 15,370 15,136 14,851 14,734 10,545 10,532 10,534 10,535 10,542 10,556 10,544 10,546 8,455 8,455 8,455 6,525 2,611 2,612 Fuel Cost 0 54,833 55,777 56,609 51,502 41,916 27,857 25,869 20,416 20,325 21,047 21,660 22,267 23,309 23,013 23,461 18,511 18,838 19,085 12,331 3,579 3,710 Total Cost 0 71,331 73,550 72,182 66,873 57,052 42,708 40,603 30,961 30,858 31,581 32,195 32,809 33,864 33,557 34,007 26,965 27,294 27,540 18,856 6,190 6,322 C. New + Existing Private Plants 2007 2008 2009 2010 2011 2012 2013 2014 2015 2016 2017 2018 2019 2020 2021 2022 2023 2024 2025 2026 2027 2028 2029 2030 Capacity (MW) 0 2,024 3,601 3,863 4,639 5,146 6,376 7,576 8,233 10,483 10,483 12,233 12,733 13,483 14,483 15,483 16,312 16,261 16,261 15,901 14,686 14,686 Net Annual Energy Output (GWh) 0 11,962 16,078 17,102 18,555 19,750 25,119 31,191 36,053 44,518 44,546 53,670 57,606 64,073 66,747 73,440 82,280 82,158 81,939 80,612 75,684 76,929 Non-Fuel Cost 0 21,405 64,411 68,358 71,840 76,012 77,316 102,266 104,551 128,338 128,302 152,118 151,097 149,179 145,692 160,533 174,259 170,299 167,384 161,969 147,257 144,245 Fuel Cost 0 60,708 92,527 101,094 104,617 108,852 123,286 138,582 144,287 166,265 170,435 192,193 213,735 248,440 265,757 275,859 291,242 293,693 293,946 289,578 260,636 269,616 Total Cost 0 82,114 156,938 169,452 176,456 184,864 200,602 238,672 248,838 294,603 298,737 344,311 364,833 397,619 411,449 436,392 465,501 463,992 461,330 451,547 407,893 413,861 6. EQUITY & LOAN 6-1 EQUITY & LOAN (GEN) 2007 2008 2009 2010 2011 2012 2013 2014 2015 2016 2017 2018 2019 2020 2021 2022 2023 2024 2025 2026 2027 2028 2029 2030 Cap Cost before IDC 0 1,677 8,050 32,112 104,545 126,013 99,115 85,185 66,730 46,584 25,143 27,091 30,411 28,066 30,988 33,954 25,146 25,143 25,143 25,143 25,143 25,143 25,143 25,143 Cumulative Cap Cost 0 1,677 9,727 41,840 146,385 272,398 371,513 456,698 523,428 570,012 595,155 622,246 652,657 680,722 711,711 745,665 770,811 795,954 821,097 846,239 871,382 896,525 921,668 946,811 Equity 0 302 1,449 5,780 18,818 22,682 17,841 15,333 12,011 8,385 4,526 4,876 5,474 5,052 5,578 6,112 4,526 4,526 4,526 4,526 4,526 4,526 4,526 4,526 Equity (cumulative) 0 302 1,751 7,531 26,349 49,032 66,872 82,206 94,217 102,602 107,128 112,004 117,478 122,530 128,108 134,220 138,746 143,272 147,797 152,323 156,849 161,375 165,900 170,426 Dividend 0 0 0 0 229 1,067 2,055 3,517 4,310 4,872 6,156 6,428 6,699 6,975 7,352 7,686 8,053 8,325 8,596 8,868 8,698 8,969 9,113 9,385 Loan (Balance) incl. IDC 0 1,428 8,363 36,829 127,943 235,963 322,062 393,155 450,924 491,080 502,310 512,361 517,459 516,574 514,677 508,610 493,594 477,313 459,610 439,944 422,900 404,430 385,556 365,281 Donor Loan 0 1,221 7,152 30,915 107,455 199,819 273,475 334,183 383,608 417,989 427,691 436,585 441,076 440,459 438,960 433,898 421,185 407,397 392,392 375,711 361,077 345,225 329,027 311,633 Local Loan 0 207 1,211 5,914 20,488 36,143 48,587 58,972 67,316 73,092 74,619 75,776 76,382 76,115 75,717 74,712 72,409 69,917 67,217 64,232 61,823 59,206 56,529 53,649
Source: PSMP Study Team
Power System Master Plan 2010
10-5
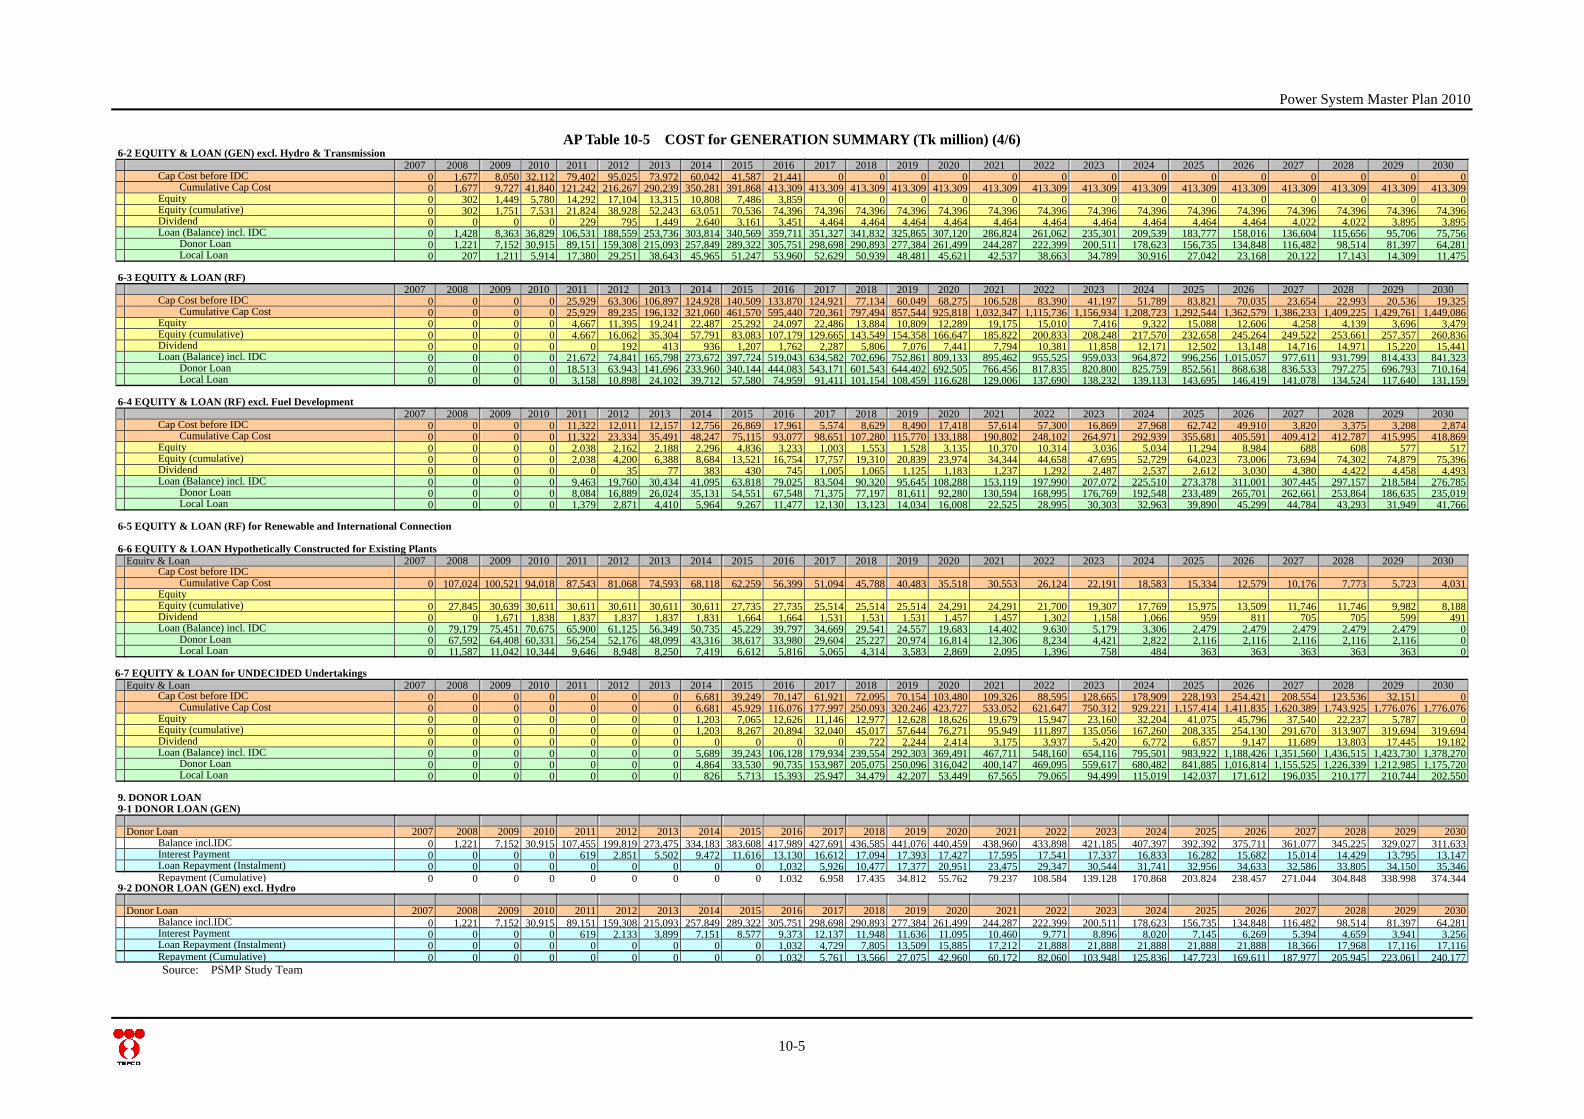
AP Table 10-5 COST for GENERATION SUMMARY (Tk million) (4/6) 6-2 EQUITY & LOAN (GEN) excl. Hydro & Transmission 2007 2008 2009 2010 2011 2012 2013 2014 2015 2016 2017 2018 2019 2020 2021 2022 2023 2024 2025 2026 2027 2028 2029 2030 Cap Cost before IDC 0 1,677 8,050 32,112 79,402 95,025 73,972 60,042 41,587 21,441 0 0 0 0 0 0 0 0 0 0 0 0 0 0 Cumulative Cap Cost 0 1,677 9,727 41,840 121,242 216,267 290,239 350,281 391,868 413,309 413,309 413,309 413,309 413,309 413,309 413,309 413,309 413,309 413,309 413,309 413,309 413,309 413,309 413,309 Equity 0 302 1,449 5,780 14,292 17,104 13,315 10,808 7,486 3,859 0 0 0 0 0 0 0 0 0 0 0 0 0 0 Equity (cumulative) 0 302 1,751 7,531 21,824 38,928 52,243 63,051 70,536 74,396 74,396 74,396 74,396 74,396 74,396 74,396 74,396 74,396 74,396 74,396 74,396 74,396 74,396 74,396 Dividend 0 0 0 0 229 795 1,449 2,640 3,161 3,451 4,464 4,464 4,464 4,464 4,464 4,464 4,464 4,464 4,464 4,464 4,022 4,022 3,895 3,895 Loan (Balance) incl. IDC 0 1,428 8,363 36,829 106,531 188,559 253,736 303,814 340,569 359,711 351,327 341,832 325,865 307,120 286,824 261,062 235,301 209,539 183,777 158,016 136,604 115,656 95,706 75,756 Donor Loan 0 1,221 7,152 30,915 89,151 159,308 215,093 257,849 289,322 305,751 298,698 290,893 277,384 261,499 244,287 222,399 200,511 178,623 156,735 134,848 116,482 98,514 81,397 64,281 Local Loan 0 207 1,211 5,914 17,380 29,251 38,643 45,965 51,247 53,960 52,629 50,939 48,481 45,621 42,537 38,663 34,789 30,916 27,042 23,168 20,122 17,143 14,309 11,475 6-3 EQUITY & LOAN (RF) 2007 2008 2009 2010 2011 2012 2013 2014 2015 2016 2017 2018 2019 2020 2021 2022 2023 2024 2025 2026 2027 2028 2029 2030 Cap Cost before IDC 0 0 0 0 25,929 63,306 106,897 124,928 140,509 133,870 124,921 77,134 60,049 68,275 106,528 83,390 41,197 51,789 83,821 70,035 23,654 22,993 20,536 19,325 Cumulative Cap Cost 0 0 0 0 25,929 89,235 196,132 321,060 461,570 595,440 720,361 797,494 857,544 925,818 1,032,347 1,115,736 1,156,934 1,208,723 1,292,544 1,362,579 1,386,233 1,409,225 1,429,761 1,449,086 Equity 0 0 0 0 4,667 11,395 19,241 22,487 25,292 24,097 22,486 13,884 10,809 12,289 19,175 15,010 7,416 9,322 15,088 12,606 4,258 4,139 3,696 3,479 Equity (cumulative) 0 0 0 0 4,667 16,062 35,304 57,791 83,083 107,179 129,665 143,549 154,358 166,647 185,822 200,833 208,248 217,570 232,658 245,264 249,522 253,661 257,357 260,836 Dividend 0 0 0 0 0 192 413 936 1,207 1,762 2,287 5,806 7,076 7,441 7,794 10,381 11,858 12,171 12,502 13,148 14,716 14,971 15,220 15,441 Loan (Balance) incl. IDC 0 0 0 0 21,672 74,841 165,798 273,672 397,724 519,043 634,582 702,696 752,861 809,133 895,462 955,525 959,033 964,872 996,256 1,015,057 977,611 931,799 814,433 841,323 Donor Loan 0 0 0 0 18,513 63,943 141,696 233,960 340,144 444,083 543,171 601,543 644,402 692,505 766,456 817,835 820,800 825,759 852,561 868,638 836,533 797,275 696,793 710,164 Local Loan 0 0 0 0 3,158 10,898 24,102 39,712 57,580 74,959 91,411 101,154 108,459 116,628 129,006 137,690 138,232 139,113 143,695 146,419 141,078 134,524 117,640 131,159 6-4 EQUITY & LOAN (RF) excl. Fuel Development 2007 2008 2009 2010 2011 2012 2013 2014 2015 2016 2017 2018 2019 2020 2021 2022 2023 2024 2025 2026 2027 2028 2029 2030 Cap Cost before IDC 0 0 0 0 11,322 12,011 12,157 12,756 26,869 17,961 5,574 8,629 8,490 17,418 57,614 57,300 16,869 27,968 62,742 49,910 3,820 3,375 3,208 2,874 Cumulative Cap Cost 0 0 0 0 11,322 23,334 35,491 48,247 75,115 93,077 98,651 107,280 115,770 133,188 190,802 248,102 264,971 292,939 355,681 405,591 409,412 412,787 415,995 418,869 Equity 0 0 0 0 2,038 2,162 2,188 2,296 4,836 3,233 1,003 1,553 1,528 3,135 10,370 10,314 3,036 5,034 11,294 8,984 688 608 577 517 Equity (cumulative) 0 0 0 0 2,038 4,200 6,388 8,684 13,521 16,754 17,757 19,310 20,839 23,974 34,344 44,658 47,695 52,729 64,023 73,006 73,694 74,302 74,879 75,396 Dividend 0 0 0 0 0 35 77 383 430 745 1,005 1,065 1,125 1,183 1,237 1,292 2,487 2,537 2,612 3,030 4,380 4,422 4,458 4,493 Loan (Balance) incl. IDC 0 0 0 0 9,463 19,760 30,434 41,095 63,818 79,025 83,504 90,320 95,645 108,288 153,119 197,990 207,072 225,510 273,378 311,001 307,445 297,157 218,584 276,785 Donor Loan 0 0 0 0 8,084 16,889 26,024 35,131 54,551 67,548 71,375 77,197 81,611 92,280 130,594 168,995 176,769 192,548 233,489 265,701 262,661 253,864 186,635 235,019 Local Loan 0 0 0 0 1,379 2,871 4,410 5,964 9,267 11,477 12,130 13,123 14,034 16,008 22,525 28,995 30,303 32,963 39,890 45,299 44,784 43,293 31,949 41,766 6-5 EQUITY & LOAN (RF) for Renewable and International Connection
6-6 EQUITY & LOAN Hypothetically Constructed for Existing Plants Equity & Loan 2007 2008 2009 2010 2011 2012 2013 2014 2015 2016 2017 2018 2019 2020 2021 2022 2023 2024 2025 2026 2027 2028 2029 2030 Cap Cost before IDC Cumulative Cap Cost 0 107,024 100,521 94,018 87,543 81,068 74,593 68,118 62,259 56,399 51,094 45,788 40,483 35,518 30,553 26,124 22,191 18,583 15,334 12,579 10,176 7,773 5,723 4,031 Equity Equity (cumulative) 0 27,845 30,639 30,611 30,611 30,611 30,611 30,611 27,735 27,735 25,514 25,514 25,514 24,291 24,291 21,700 19,307 17,769 15,975 13,509 11,746 11,746 9,982 8,188 Dividend 0 0 1,671 1,838 1,837 1,837 1,837 1,831 1,664 1,664 1,531 1,531 1,531 1,457 1,457 1,302 1,158 1,066 959 811 705 705 599 491 Loan (Balance) incl. IDC 0 79,179 75,451 70,675 65,900 61,125 56,349 50,735 45,229 39,797 34,669 29,541 24,557 19,683 14,402 9,630 5,179 3,306 2,479 2,479 2,479 2,479 2,479 0 Donor Loan 0 67,592 64,408 60,331 56,254 52,176 48,099 43,316 38,617 33,980 29,604 25,227 20,974 16,814 12,306 8,234 4,421 2,822 2,116 2,116 2,116 2,116 2,116 0 Local Loan 0 11,587 11,042 10,344 9,646 8,948 8,250 7,419 6,612 5,816 5,065 4,314 3,583 2,869 2,095 1,396 758 484 363 363 363 363 363 0
6-7 EQUITY & LOAN for UNDECIDED Undertakings Equity & Loan 2007 2008 2009 2010 2011 2012 2013 2014 2015 2016 2017 2018 2019 2020 2021 2022 2023 2024 2025 2026 2027 2028 2029 2030 Cap Cost before IDC 0 0 0 0 0 0 0 6,681 39,249 70,147 61,921 72,095 70,154 103,480 109,326 88,595 128,665 178,909 228,193 254,421 208,554 123,536 32,151 0 Cumulative Cap Cost 0 0 0 0 0 0 0 6,681 45,929 116,076 177,997 250,093 320,246 423,727 533,052 621,647 750,312 929,221 1,157,414 1,411,835 1,620,389 1,743,925 1,776,076 1,776,076 Equity 0 0 0 0 0 0 0 1,203 7,065 12,626 11,146 12,977 12,628 18,626 19,679 15,947 23,160 32,204 41,075 45,796 37,540 22,237 5,787 0 Equity (cumulative) 0 0 0 0 0 0 0 1,203 8,267 20,894 32,040 45,017 57,644 76,271 95,949 111,897 135,056 167,260 208,335 254,130 291,670 313,907 319,694 319,694 Dividend 0 0 0 0 0 0 0 0 0 0 0 722 2,244 2,414 3,175 3,937 5,420 6,772 6,857 9,147 11,689 13,803 17,445 19,182 Loan (Balance) incl. IDC 0 0 0 0 0 0 0 5,689 39,243 106,128 179,934 239,554 292,303 369,491 467,711 548,160 654,116 795,501 983,922 1,188,426 1,351,560 1,436,515 1,423,730 1,378,270 Donor Loan 0 0 0 0 0 0 0 4,864 33,530 90,735 153,987 205,075 250,096 316,042 400,147 469,095 559,617 680,482 841,885 1,016,814 1,155,525 1,226,339 1,212,985 1,175,720 Local Loan 0 0 0 0 0 0 0 826 5,713 15,393 25,947 34,479 42,207 53,449 67,565 79,065 94,499 115,019 142,037 171,612 196,035 210,177 210,744 202,550 9. DONOR LOAN
9-1 DONOR LOAN (GEN) Donor Loan 2007 2008 2009 2010 2011 2012 2013 2014 2015 2016 2017 2018 2019 2020 2021 2022 2023 2024 2025 2026 2027 2028 2029 2030 Balance incl.IDC 0 1,221 7,152 30,915 107,455 199,819 273,475 334,183 383,608 417,989 427,691 436,585 441,076 440,459 438,960 433,898 421,185 407,397 392,392 375,711 361,077 345,225 329,027 311,633 Interest Payment 0 0 0 0 619 2,851 5,502 9,472 11,616 13,130 16,612 17,094 17,393 17,427 17,595 17,541 17,337 16,833 16,282 15,682 15,014 14,429 13,795 13,147 Loan Repayment (Instalment) 0 0 0 0 0 0 0 0 0 1,032 5,926 10,477 17,377 20,951 23,475 29,347 30,544 31,741 32,956 34,633 32,586 33,805 34,150 35,346 Repayment (Cumulative) 0 0 0 0 0 0 0 0 0 1,032 6,958 17,435 34,812 55,762 79,237 108,584 139,128 170,868 203,824 238,457 271,044 304,848 338,998 374,344 9-2 DONOR LOAN (GEN) excl. Hydro Donor Loan 2007 2008 2009 2010 2011 2012 2013 2014 2015 2016 2017 2018 2019 2020 2021 2022 2023 2024 2025 2026 2027 2028 2029 2030 Balance incl.IDC 0 1,221 7,152 30,915 89,151 159,308 215,093 257,849 289,322 305,751 298,698 290,893 277,384 261,499 244,287 222,399 200,511 178,623 156,735 134,848 116,482 98,514 81,397 64,281 Interest Payment 0 0 0 0 619 2,133 3,899 7,151 8,577 9,373 12,137 11,948 11,636 11,095 10,460 9,771 8,896 8,020 7,145 6,269 5,394 4,659 3,941 3,256 Loan Repayment (Instalment) 0 0 0 0 0 0 0 0 0 1,032 4,729 7,805 13,509 15,885 17,212 21,888 21,888 21,888 21,888 21,888 18,366 17,968 17,116 17,116 Repayment (Cumulative) 0 0 0 0 0 0 0 0 0 1,032 5,761 13,566 27,075 42,960 60,172 82,060 103,948 125,836 147,723 169,611 187,977 205,945 223,061 240,177
Source: PSMP Study Team
Power System Master Plan 2010
10-6
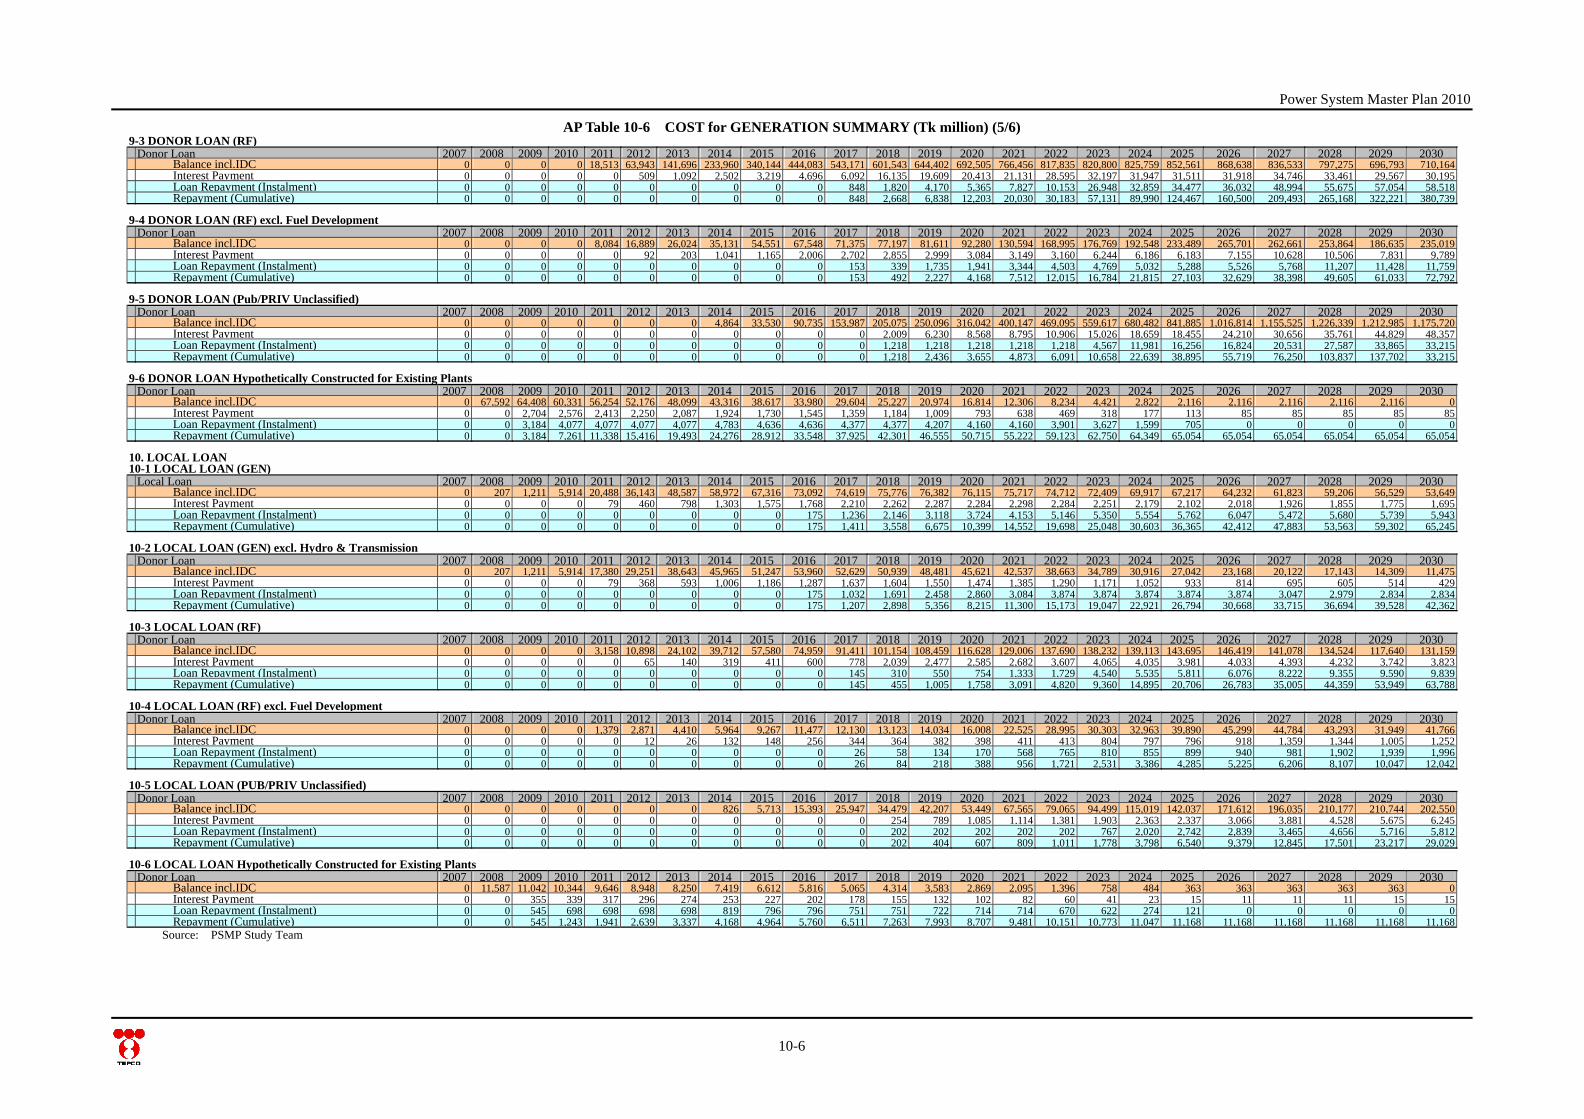
AP Table 10-6 COST for GENERATION SUMMARY (Tk million) (5/6) 9-3 DONOR LOAN (RF) Donor Loan 2007 2008 2009 2010 2011 2012 2013 2014 2015 2016 2017 2018 2019 2020 2021 2022 2023 2024 2025 2026 2027 2028 2029 2030 Balance incl.IDC 0 0 0 0 18,513 63,943 141,696 233,960 340,144 444,083 543,171 601,543 644,402 692,505 766,456 817,835 820,800 825,759 852,561 868,638 836,533 797,275 696,793 710,164 Interest Payment 0 0 0 0 0 509 1,092 2,502 3,219 4,696 6,092 16,135 19,609 20,413 21,131 28,595 32,197 31,947 31,511 31,918 34,746 33,461 29,567 30,195 Loan Repayment (Instalment) 0 0 0 0 0 0 0 0 0 0 848 1,820 4,170 5,365 7,827 10,153 26,948 32,859 34,477 36,032 48,994 55,675 57,054 58,518 Repayment (Cumulative) 0 0 0 0 0 0 0 0 0 0 848 2,668 6,838 12,203 20,030 30,183 57,131 89,990 124,467 160,500 209,493 265,168 322,221 380,739 9-4 DONOR LOAN (RF) excl. Fuel Development Donor Loan 2007 2008 2009 2010 2011 2012 2013 2014 2015 2016 2017 2018 2019 2020 2021 2022 2023 2024 2025 2026 2027 2028 2029 2030 Balance incl.IDC 0 0 0 0 8,084 16,889 26,024 35,131 54,551 67,548 71,375 77,197 81,611 92,280 130,594 168,995 176,769 192,548 233,489 265,701 262,661 253,864 186,635 235,019 Interest Payment 0 0 0 0 0 92 203 1,041 1,165 2,006 2,702 2,855 2,999 3,084 3,149 3,160 6,244 6,186 6,183 7,155 10,628 10,506 7,831 9,789 Loan Repayment (Instalment) 0 0 0 0 0 0 0 0 0 0 153 339 1,735 1,941 3,344 4,503 4,769 5,032 5,288 5,526 5,768 11,207 11,428 11,759 Repayment (Cumulative) 0 0 0 0 0 0 0 0 0 0 153 492 2,227 4,168 7,512 12,015 16,784 21,815 27,103 32,629 38,398 49,605 61,033 72,792 9-5 DONOR LOAN (Pub/PRIV Unclassified) Donor Loan 2007 2008 2009 2010 2011 2012 2013 2014 2015 2016 2017 2018 2019 2020 2021 2022 2023 2024 2025 2026 2027 2028 2029 2030 Balance incl.IDC 0 0 0 0 0 0 0 4,864 33,530 90,735 153,987 205,075 250,096 316,042 400,147 469,095 559,617 680,482 841,885 1,016,814 1,155,525 1,226,339 1,212,985 1,175,720 Interest Payment 0 0 0 0 0 0 0 0 0 0 0 2,009 6,230 8,568 8,795 10,906 15,026 18,659 18,455 24,210 30,656 35,761 44,829 48,357 Loan Repayment (Instalment) 0 0 0 0 0 0 0 0 0 0 0 1,218 1,218 1,218 1,218 1,218 4,567 11,981 16,256 16,824 20,531 27,587 33,865 33,215 Repayment (Cumulative) 0 0 0 0 0 0 0 0 0 0 0 1,218 2,436 3,655 4,873 6,091 10,658 22,639 38,895 55,719 76,250 103,837 137,702 33,215 9-6 DONOR LOAN Hypothetically Constructed for Existing Plants Donor Loan 2007 2008 2009 2010 2011 2012 2013 2014 2015 2016 2017 2018 2019 2020 2021 2022 2023 2024 2025 2026 2027 2028 2029 2030 Balance incl.IDC 0 67,592 64,408 60,331 56,254 52,176 48,099 43,316 38,617 33,980 29,604 25,227 20,974 16,814 12,306 8,234 4,421 2,822 2,116 2,116 2,116 2,116 2,116 0 Interest Payment 0 0 2,704 2,576 2,413 2,250 2,087 1,924 1,730 1,545 1,359 1,184 1,009 793 638 469 318 177 113 85 85 85 85 85 Loan Repayment (Instalment) 0 0 3,184 4,077 4,077 4,077 4,077 4,783 4,636 4,636 4,377 4,377 4,207 4,160 4,160 3,901 3,627 1,599 705 0 0 0 0 0 Repayment (Cumulative) 0 0 3,184 7,261 11,338 15,416 19,493 24,276 28,912 33,548 37,925 42,301 46,555 50,715 55,222 59,123 62,750 64,349 65,054 65,054 65,054 65,054 65,054 65,054 10. LOCAL LOAN 10-1 LOCAL LOAN (GEN) Local Loan 2007 2008 2009 2010 2011 2012 2013 2014 2015 2016 2017 2018 2019 2020 2021 2022 2023 2024 2025 2026 2027 2028 2029 2030 Balance incl.IDC 0 207 1,211 5,914 20,488 36,143 48,587 58,972 67,316 73,092 74,619 75,776 76,382 76,115 75,717 74,712 72,409 69,917 67,217 64,232 61,823 59,206 56,529 53,649 Interest Payment 0 0 0 0 79 460 798 1,303 1,575 1,768 2,210 2,262 2,287 2,284 2,298 2,284 2,251 2,179 2,102 2,018 1,926 1,855 1,775 1,695 Loan Repayment (Instalment) 0 0 0 0 0 0 0 0 0 175 1,236 2,146 3,118 3,724 4,153 5,146 5,350 5,554 5,762 6,047 5,472 5,680 5,739 5,943 Repayment (Cumulative) 0 0 0 0 0 0 0 0 0 175 1,411 3,558 6,675 10,399 14,552 19,698 25,048 30,603 36,365 42,412 47,883 53,563 59,302 65,245 10-2 LOCAL LOAN (GEN) excl. Hydro & Transmission Donor Loan 2007 2008 2009 2010 2011 2012 2013 2014 2015 2016 2017 2018 2019 2020 2021 2022 2023 2024 2025 2026 2027 2028 2029 2030 Balance incl.IDC 0 207 1,211 5,914 17,380 29,251 38,643 45,965 51,247 53,960 52,629 50,939 48,481 45,621 42,537 38,663 34,789 30,916 27,042 23,168 20,122 17,143 14,309 11,475 Interest Payment 0 0 0 0 79 368 593 1,006 1,186 1,287 1,637 1,604 1,550 1,474 1,385 1,290 1,171 1,052 933 814 695 605 514 429 Loan Repayment (Instalment) 0 0 0 0 0 0 0 0 0 175 1,032 1,691 2,458 2,860 3,084 3,874 3,874 3,874 3,874 3,874 3,047 2,979 2,834 2,834 Repayment (Cumulative) 0 0 0 0 0 0 0 0 0 175 1,207 2,898 5,356 8,215 11,300 15,173 19,047 22,921 26,794 30,668 33,715 36,694 39,528 42,362 10-3 LOCAL LOAN (RF) Donor Loan 2007 2008 2009 2010 2011 2012 2013 2014 2015 2016 2017 2018 2019 2020 2021 2022 2023 2024 2025 2026 2027 2028 2029 2030 Balance incl.IDC 0 0 0 0 3,158 10,898 24,102 39,712 57,580 74,959 91,411 101,154 108,459 116,628 129,006 137,690 138,232 139,113 143,695 146,419 141,078 134,524 117,640 131,159 Interest Payment 0 0 0 0 0 65 140 319 411 600 778 2,039 2,477 2,585 2,682 3,607 4,065 4,035 3,981 4,033 4,393 4,232 3,742 3,823 Loan Repayment (Instalment) 0 0 0 0 0 0 0 0 0 0 145 310 550 754 1,333 1,729 4,540 5,535 5,811 6,076 8,222 9,355 9,590 9,839 Repayment (Cumulative) 0 0 0 0 0 0 0 0 0 0 145 455 1,005 1,758 3,091 4,820 9,360 14,895 20,706 26,783 35,005 44,359 53,949 63,788 10-4 LOCAL LOAN (RF) excl. Fuel Development Donor Loan 2007 2008 2009 2010 2011 2012 2013 2014 2015 2016 2017 2018 2019 2020 2021 2022 2023 2024 2025 2026 2027 2028 2029 2030 Balance incl.IDC 0 0 0 0 1,379 2,871 4,410 5,964 9,267 11,477 12,130 13,123 14,034 16,008 22,525 28,995 30,303 32,963 39,890 45,299 44,784 43,293 31,949 41,766 Interest Payment 0 0 0 0 0 12 26 132 148 256 344 364 382 398 411 413 804 797 796 918 1,359 1,344 1,005 1,252 Loan Repayment (Instalment) 0 0 0 0 0 0 0 0 0 0 26 58 134 170 568 765 810 855 899 940 981 1,902 1,939 1,996 Repayment (Cumulative) 0 0 0 0 0 0 0 0 0 0 26 84 218 388 956 1,721 2,531 3,386 4,285 5,225 6,206 8,107 10,047 12,042 10-5 LOCAL LOAN (PUB/PRIV Unclassified) Donor Loan 2007 2008 2009 2010 2011 2012 2013 2014 2015 2016 2017 2018 2019 2020 2021 2022 2023 2024 2025 2026 2027 2028 2029 2030 Balance incl.IDC 0 0 0 0 0 0 0 826 5,713 15,393 25,947 34,479 42,207 53,449 67,565 79,065 94,499 115,019 142,037 171,612 196,035 210,177 210,744 202,550 Interest Payment 0 0 0 0 0 0 0 0 0 0 0 254 789 1,085 1,114 1,381 1,903 2,363 2,337 3,066 3,881 4,528 5,675 6,245 Loan Repayment (Instalment) 0 0 0 0 0 0 0 0 0 0 0 202 202 202 202 202 767 2,020 2,742 2,839 3,465 4,656 5,716 5,812 Repayment (Cumulative) 0 0 0 0 0 0 0 0 0 0 0 202 404 607 809 1,011 1,778 3,798 6,540 9,379 12,845 17,501 23,217 29,029 10-6 LOCAL LOAN Hypothetically Constructed for Existing Plants Donor Loan 2007 2008 2009 2010 2011 2012 2013 2014 2015 2016 2017 2018 2019 2020 2021 2022 2023 2024 2025 2026 2027 2028 2029 2030 Balance incl.IDC 0 11,587 11,042 10,344 9,646 8,948 8,250 7,419 6,612 5,816 5,065 4,314 3,583 2,869 2,095 1,396 758 484 363 363 363 363 363 0 Interest Payment 0 0 355 339 317 296 274 253 227 202 178 155 132 102 82 60 41 23 15 11 11 11 15 15 Loan Repayment (Instalment) 0 0 545 698 698 698 698 819 796 796 751 751 722 714 714 670 622 274 121 0 0 0 0 0 Repayment (Cumulative) 0 0 545 1,243 1,941 2,639 3,337 4,168 4,964 5,760 6,511 7,263 7,993 8,707 9,481 10,151 10,773 11,047 11,168 11,168 11,168 11,168 11,168 11,168
Source: PSMP Study Team
Power System Master Plan 2010
10-7
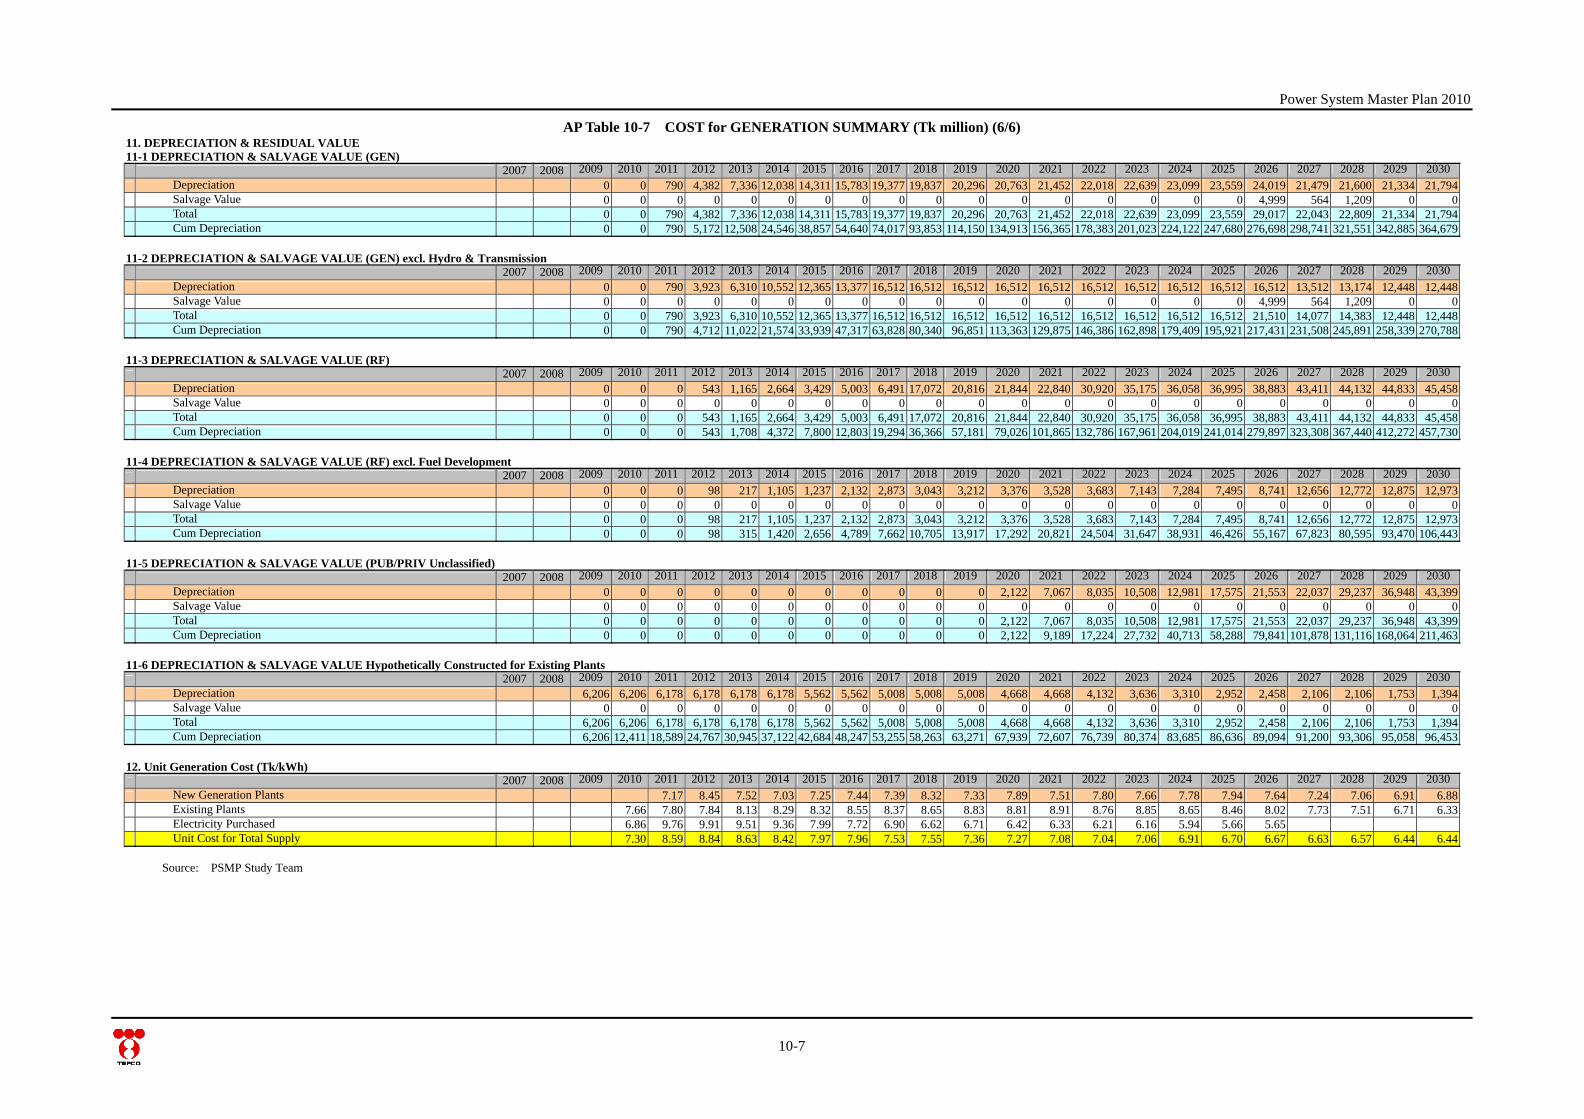
AP Table 10-7 COST for GENERATION SUMMARY (Tk million) (6/6) 11. DEPRECIATION & RESIDUAL VALUE 11-1 DEPRECIATION & SALVAGE VALUE (GEN) 2007 2008 2009 2010 2011 2012 2013 2014 2015 2016 2017 2018 2019 2020 2021 2022 2023 2024 2025 2026 2027 2028 2029 2030 Depreciation 0 0 790 4,382 7,336 12,038 14,311 15,783 19,377 19,837 20,296 20,763 21,452 22,018 22,639 23,099 23,559 24,019 21,479 21,600 21,334 21,794 Salvage Value 0 0 0 0 0 0 0 0 0 0 0 0 0 0 0 0 0 4,999 564 1,209 0 0 Total 0 0 790 4,382 7,336 12,038 14,311 15,783 19,377 19,837 20,296 20,763 21,452 22,018 22,639 23,099 23,559 29,017 22,043 22,809 21,334 21,794 Cum Depreciation 0 0 790 5,172 12,508 24,546 38,857 54,640 74,017 93,853 114,150 134,913 156,365 178,383 201,023 224,122 247,680 276,698 298,741 321,551 342,885 364,679 11-2 DEPRECIATION & SALVAGE VALUE (GEN) excl. Hydro & Transmission 2007 2008 2009 2010 2011 2012 2013 2014 2015 2016 2017 2018 2019 2020 2021 2022 2023 2024 2025 2026 2027 2028 2029 2030 Depreciation 0 0 790 3,923 6,310 10,552 12,365 13,377 16,512 16,512 16,512 16,512 16,512 16,512 16,512 16,512 16,512 16,512 13,512 13,174 12,448 12,448 Salvage Value 0 0 0 0 0 0 0 0 0 0 0 0 0 0 0 0 0 4,999 564 1,209 0 0 Total 0 0 790 3,923 6,310 10,552 12,365 13,377 16,512 16,512 16,512 16,512 16,512 16,512 16,512 16,512 16,512 21,510 14,077 14,383 12,448 12,448 Cum Depreciation 0 0 790 4,712 11,022 21,574 33,939 47,317 63,828 80,340 96,851 113,363 129,875 146,386 162,898 179,409 195,921 217,431 231,508 245,891 258,339 270,788 11-3 DEPRECIATION & SALVAGE VALUE (RF) 2007 2008 2009 2010 2011 2012 2013 2014 2015 2016 2017 2018 2019 2020 2021 2022 2023 2024 2025 2026 2027 2028 2029 2030 Depreciation 0 0 0 543 1,165 2,664 3,429 5,003 6,491 17,072 20,816 21,844 22,840 30,920 35,175 36,058 36,995 38,883 43,411 44,132 44,833 45,458 Salvage Value 0 0 0 0 0 0 0 0 0 0 0 0 0 0 0 0 0 0 0 0 0 0 Total 0 0 0 543 1,165 2,664 3,429 5,003 6,491 17,072 20,816 21,844 22,840 30,920 35,175 36,058 36,995 38,883 43,411 44,132 44,833 45,458 Cum Depreciation 0 0 0 543 1,708 4,372 7,800 12,803 19,294 36,366 57,181 79,026 101,865 132,786 167,961 204,019 241,014 279,897 323,308 367,440 412,272 457,730 11-4 DEPRECIATION & SALVAGE VALUE (RF) excl. Fuel Development 2007 2008 2009 2010 2011 2012 2013 2014 2015 2016 2017 2018 2019 2020 2021 2022 2023 2024 2025 2026 2027 2028 2029 2030 Depreciation 0 0 0 98 217 1,105 1,237 2,132 2,873 3,043 3,212 3,376 3,528 3,683 7,143 7,284 7,495 8,741 12,656 12,772 12,875 12,973 Salvage Value 0 0 0 0 0 0 0 0 0 0 0 0 0 0 0 0 0 0 0 0 0 0 Total 0 0 0 98 217 1,105 1,237 2,132 2,873 3,043 3,212 3,376 3,528 3,683 7,143 7,284 7,495 8,741 12,656 12,772 12,875 12,973 Cum Depreciation 0 0 0 98 315 1,420 2,656 4,789 7,662 10,705 13,917 17,292 20,821 24,504 31,647 38,931 46,426 55,167 67,823 80,595 93,470 106,443 11-5 DEPRECIATION & SALVAGE VALUE (PUB/PRIV Unclassified) 2007 2008 2009 2010 2011 2012 2013 2014 2015 2016 2017 2018 2019 2020 2021 2022 2023 2024 2025 2026 2027 2028 2029 2030 Depreciation 0 0 0 0 0 0 0 0 0 0 0 2,122 7,067 8,035 10,508 12,981 17,575 21,553 22,037 29,237 36,948 43,399 Salvage Value 0 0 0 0 0 0 0 0 0 0 0 0 0 0 0 0 0 0 0 0 0 0 Total 0 0 0 0 0 0 0 0 0 0 0 2,122 7,067 8,035 10,508 12,981 17,575 21,553 22,037 29,237 36,948 43,399 Cum Depreciation 0 0 0 0 0 0 0 0 0 0 0 2,122 9,189 17,224 27,732 40,713 58,288 79,841 101,878 131,116 168,064 211,463 11-6 DEPRECIATION & SALVAGE VALUE Hypothetically Constructed for Existing Plants 2007 2008 2009 2010 2011 2012 2013 2014 2015 2016 2017 2018 2019 2020 2021 2022 2023 2024 2025 2026 2027 2028 2029 2030 Depreciation 6,206 6,206 6,178 6,178 6,178 6,178 5,562 5,562 5,008 5,008 5,008 4,668 4,668 4,132 3,636 3,310 2,952 2,458 2,106 2,106 1,753 1,394 Salvage Value 0 0 0 0 0 0 0 0 0 0 0 0 0 0 0 0 0 0 0 0 0 0 Total 6,206 6,206 6,178 6,178 6,178 6,178 5,562 5,562 5,008 5,008 5,008 4,668 4,668 4,132 3,636 3,310 2,952 2,458 2,106 2,106 1,753 1,394 Cum Depreciation 6,206 12,411 18,589 24,767 30,945 37,122 42,684 48,247 53,255 58,263 63,271 67,939 72,607 76,739 80,374 83,685 86,636 89,094 91,200 93,306 95,058 96,453 12. Unit Generation Cost (Tk/kWh) 2007 2008 2009 2010 2011 2012 2013 2014 2015 2016 2017 2018 2019 2020 2021 2022 2023 2024 2025 2026 2027 2028 2029 2030 New Generation Plants 7.17 8.45 7.52 7.03 7.25 7.44 7.39 8.32 7.33 7.89 7.51 7.80 7.66 7.78 7.94 7.64 7.24 7.06 6.91 6.88 Existing Plants 7.66 7.80 7.84 8.13 8.29 8.32 8.55 8.37 8.65 8.83 8.81 8.91 8.76 8.85 8.65 8.46 8.02 7.73 7.51 6.71 6.33 Electricity Purchased 6.86 9.76 9.91 9.51 9.36 7.99 7.72 6.90 6.62 6.71 6.42 6.33 6.21 6.16 5.94 5.66 5.65 Unit Cost for Total Supply 7.30 8.59 8.84 8.63 8.42 7.97 7.96 7.53 7.55 7.36 7.27 7.08 7.04 7.06 6.91 6.70 6.67 6.63 6.57 6.44 6.44
Source: PSMP Study Team
Power System Master Plan 2010
10-8
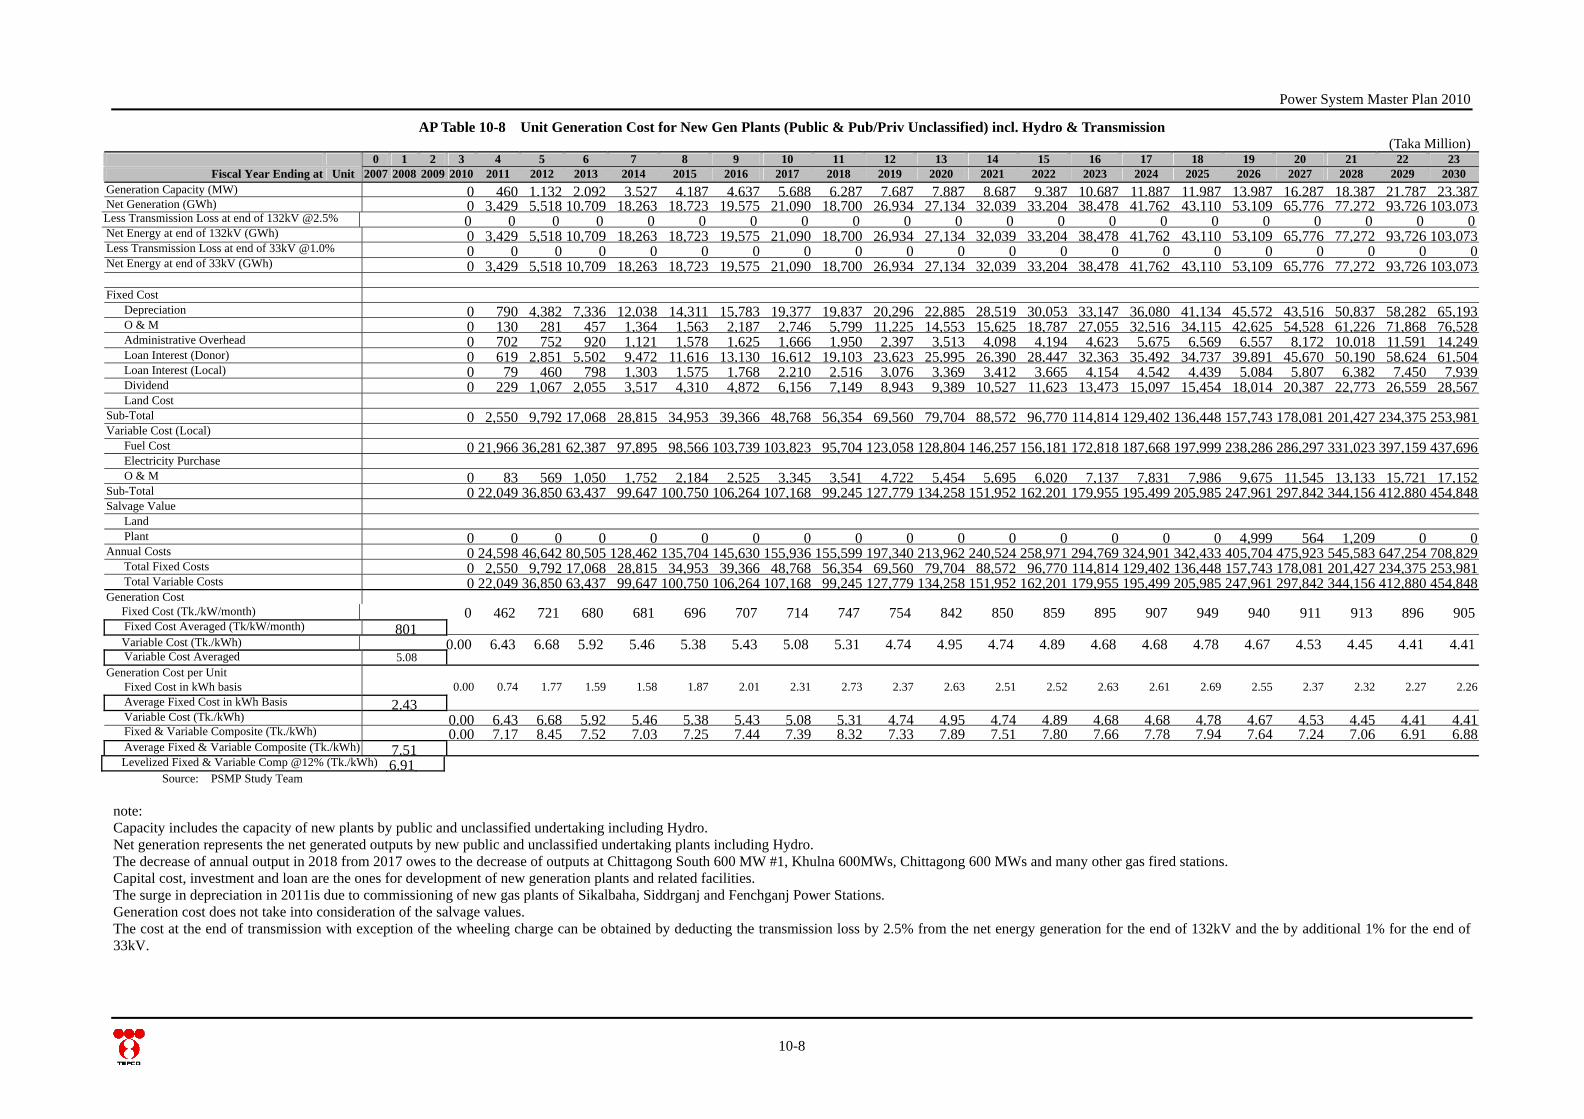
AP Table 10-8 Unit Generation Cost for New Gen Plants (Public & Pub/Priv Unclassified) incl. Hydro & Transmission (Taka Million)
0 1 2 3 4 5 6 7 8 9 10 11 12 13 14 15 16 17 18 19 20 21 22 23 Fiscal Year Ending at Unit 2007 2008 2009 2010 2011 2012 2013 2014 2015 2016 2017 2018 2019 2020 2021 2022 2023 2024 2025 2026 2027 2028 2029 2030
Generation Capacity (MW) 0 460 1,132 2,092 3,527 4,187 4,637 5,688 6,287 7,687 7,887 8,687 9,387 10,687 11,887 11,987 13,987 16,287 18,387 21,787 23,387 Net Generation (GWh) 0 3,429 5,518 10,709 18,263 18,723 19,575 21,090 18,700 26,934 27,134 32,039 33,204 38,478 41,762 43,110 53,109 65,776 77,272 93,726 103,073 Less Transmission Loss at end of 132kV @2.5% 0 0 0 0 0 0 0 0 0 0 0 0 0 0 0 0 0 0 0 0 0 Net Energy at end of 132kV (GWh) 0 3,429 5,518 10,709 18,263 18,723 19,575 21,090 18,700 26,934 27,134 32,039 33,204 38,478 41,762 43,110 53,109 65,776 77,272 93,726 103,073 Less Transmission Loss at end of 33kV @1.0% 0 0 0 0 0 0 0 0 0 0 0 0 0 0 0 0 0 0 0 0 0 Net Energy at end of 33kV (GWh) 0 3,429 5,518 10,709 18,263 18,723 19,575 21,090 18,700 26,934 27,134 32,039 33,204 38,478 41,762 43,110 53,109 65,776 77,272 93,726 103,073 Fixed Cost Depreciation 0 790 4,382 7,336 12,038 14,311 15,783 19,377 19,837 20,296 22,885 28,519 30,053 33,147 36,080 41,134 45,572 43,516 50,837 58,282 65,193 O & M 0 130 281 457 1,364 1,563 2,187 2,746 5,799 11,225 14,553 15,625 18,787 27,055 32,516 34,115 42,625 54,528 61,226 71,868 76,528 Administrative Overhead 0 702 752 920 1,121 1,578 1,625 1,666 1,950 2,397 3,513 4,098 4,194 4,623 5,675 6,569 6,557 8,172 10,018 11,591 14,249 Loan Interest (Donor) 0 619 2,851 5,502 9,472 11,616 13,130 16,612 19,103 23,623 25,995 26,390 28,447 32,363 35,492 34,737 39,891 45,670 50,190 58,624 61,504 Loan Interest (Local) 0 79 460 798 1,303 1,575 1,768 2,210 2,516 3,076 3,369 3,412 3,665 4,154 4,542 4,439 5,084 5,807 6,382 7,450 7,939 Dividend 0 229 1,067 2,055 3,517 4,310 4,872 6,156 7,149 8,943 9,389 10,527 11,623 13,473 15,097 15,454 18,014 20,387 22,773 26,559 28,567 Land Cost Sub-Total 0 2,550 9,792 17,068 28,815 34,953 39,366 48,768 56,354 69,560 79,704 88,572 96,770 114,814 129,402 136,448 157,743 178,081 201,427 234,375 253,981 Variable Cost (Local) Fuel Cost 0 21,966 36,281 62,387 97,895 98,566 103,739 103,823 95,704 123,058 128,804 146,257 156,181 172,818 187,668 197,999 238,286 286,297 331,023 397,159 437,696 Electricity Purchase O & M 0 83 569 1,050 1,752 2,184 2,525 3,345 3,541 4,722 5,454 5,695 6,020 7,137 7,831 7,986 9,675 11,545 13,133 15,721 17,152 Sub-Total 0 22,049 36,850 63,437 99,647 100,750 106,264 107,168 99,245 127,779 134,258 151,952 162,201 179,955 195,499 205,985 247,961 297,842 344,156 412,880 454,848 Salvage Value Land Plant 0 0 0 0 0 0 0 0 0 0 0 0 0 0 0 0 4,999 564 1,209 0 0 Annual Costs 0 24,598 46,642 80,505 128,462 135,704 145,630 155,936 155,599 197,340 213,962 240,524 258,971 294,769 324,901 342,433 405,704 475,923 545,583 647,254 708,829 Total Fixed Costs 0 2,550 9,792 17,068 28,815 34,953 39,366 48,768 56,354 69,560 79,704 88,572 96,770 114,814 129,402 136,448 157,743 178,081 201,427 234,375 253,981 Total Variable Costs 0 22,049 36,850 63,437 99,647 100,750 106,264 107,168 99,245 127,779 134,258 151,952 162,201 179,955 195,499 205,985 247,961 297,842 344,156 412,880 454,848 Generation Cost Fixed Cost (Tk./kW/month) 0 462 721 680 681 696 707 714 747 754 842 850 859 895 907 949 940 911 913 896 905 Fixed Cost Averaged (Tk/kW/month) 801 Variable Cost (Tk./kWh) 0.00 6.43 6.68 5.92 5.46 5.38 5.43 5.08 5.31 4.74 4.95 4.74 4.89 4.68 4.68 4.78 4.67 4.53 4.45 4.41 4.41 Variable Cost Averaged 5.08 Generation Cost per Unit Fixed Cost in kWh basis 0.00 0.74 1.77 1.59 1.58 1.87 2.01 2.31 2.73 2.37 2.63 2.51 2.52 2.63 2.61 2.69 2.55 2.37 2.32 2.27 2.26 Average Fixed Cost in kWh Basis 2.43 Variable Cost (Tk./kWh) 0.00 6.43 6.68 5.92 5.46 5.38 5.43 5.08 5.31 4.74 4.95 4.74 4.89 4.68 4.68 4.78 4.67 4.53 4.45 4.41 4.41 Fixed & Variable Composite (Tk./kWh) 0.00 7.17 8.45 7.52 7.03 7.25 7.44 7.39 8.32 7.33 7.89 7.51 7.80 7.66 7.78 7.94 7.64 7.24 7.06 6.91 6.88 Average Fixed & Variable Composite (Tk. /kWh) 7.51 Levelized Fixed & Variable Comp @12% (Tk./kWh) 6.91
Source: PSMP Study Team note: Capacity includes the capacity of new plants by public and unclassified undertaking including Hydro. Net generation represents the net generated outputs by new public and unclassified undertaking plants including Hydro. The decrease of annual output in 2018 from 2017 owes to the decrease of outputs at Chittagong South 600 MW #1, Khulna 600MWs, Chittagong 600 MWs and many other gas fired stations. Capital cost, investment and loan are the ones for development of new generation plants and related facilities. The surge in depreciation in 2011is due to commissioning of new gas plants of Sikalbaha, Siddrganj and Fenchganj Power Stations. Generation cost does not take into consideration of the salvage values. The cost at the end of transmission with exception of the wheeling charge can be obtained by deducting the transmission loss by 2.5% from the net energy generation for the end of 132kV and the by additional 1% for the end of 33kV.
Power System Master Plan 2010
10-9
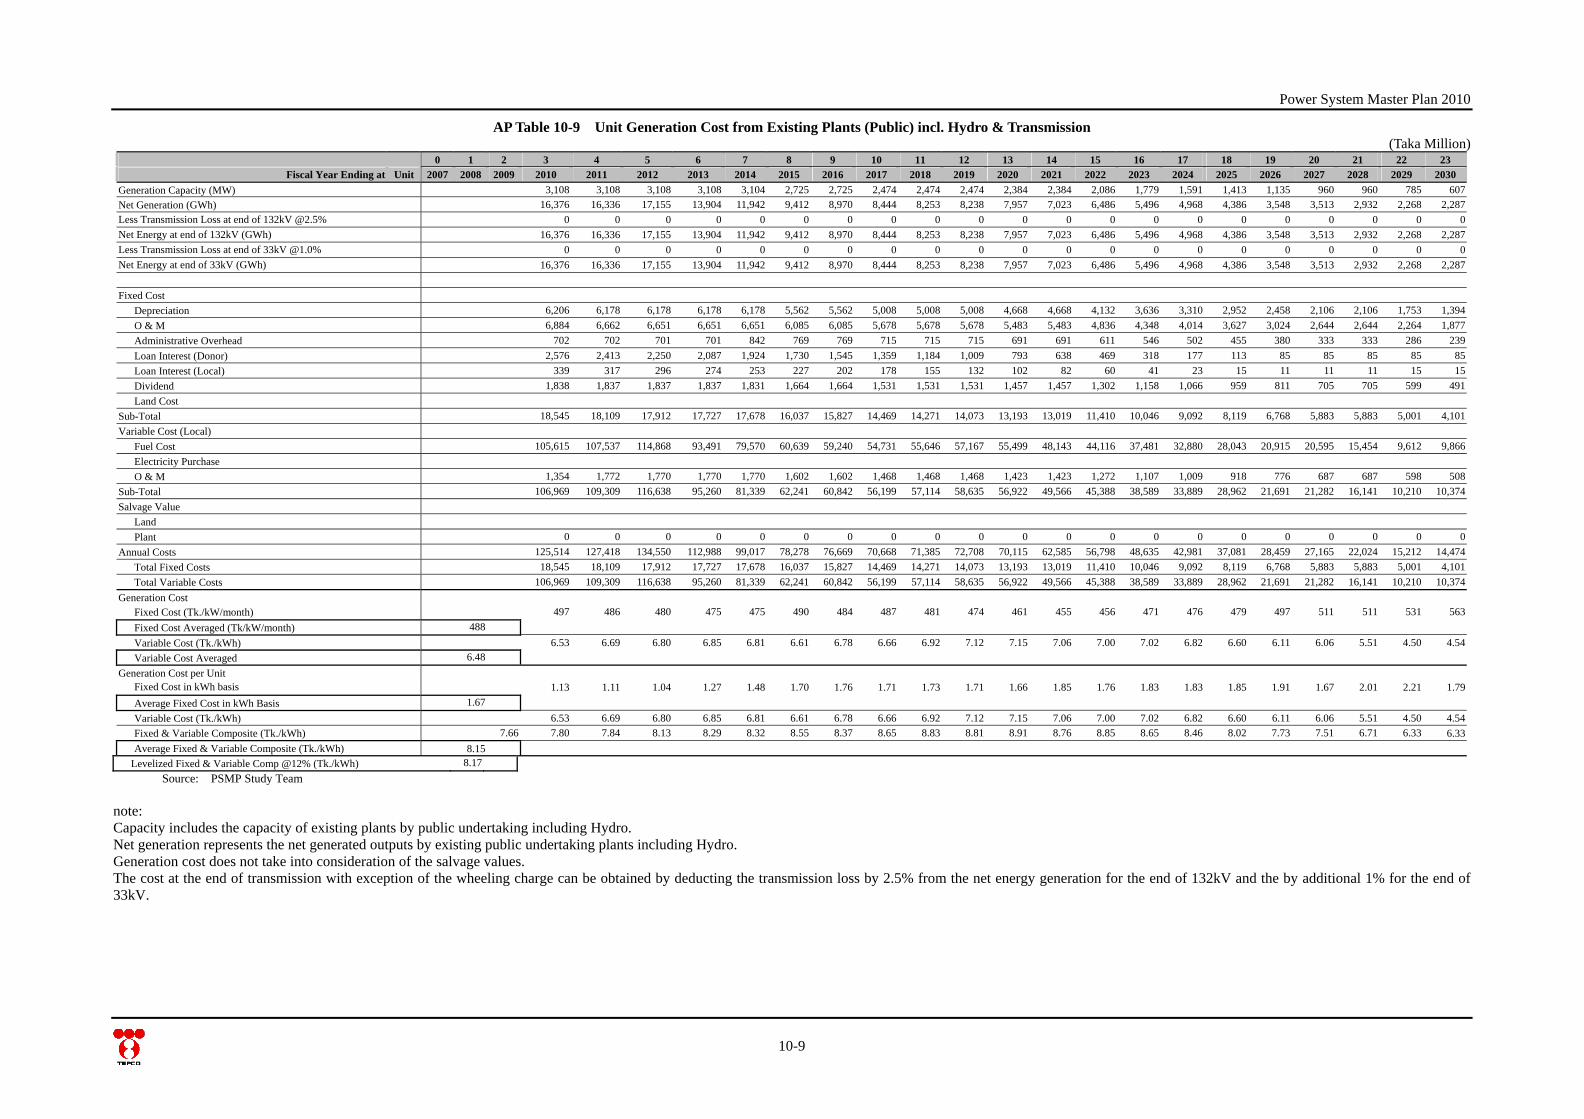
AP Table 10-9 Unit Generation Cost from Existing Plants (Public) incl. Hydro & Transmission (Taka Million)
0 1 2 3 4 5 6 7 8 9 10 11 12 13 14 15 16 17 18 19 20 21 22 23 Fiscal Year Ending at Unit 2007 2008 2009 2010 2011 2012 2013 2014 2015 2016 2017 2018 2019 2020 2021 2022 2023 2024 2025 2026 2027 2028 2029 2030
Generation Capacity (MW) 3,108 3,108 3,108 3,108 3,104 2,725 2,725 2,474 2,474 2,474 2,384 2,384 2,086 1,779 1,591 1,413 1,135 960 960 785 607 Net Generation (GWh) 16,376 16,336 17,155 13,904 11,942 9,412 8,970 8,444 8,253 8,238 7,957 7,023 6,486 5,496 4,968 4,386 3,548 3,513 2,932 2,268 2,287 Less Transmission Loss at end of 132kV @2.5% 0 0 0 0 0 0 0 0 0 0 0 0 0 0 0 0 0 0 0 0 0 Net Energy at end of 132kV (GWh) 16,376 16,336 17,155 13,904 11,942 9,412 8,970 8,444 8,253 8,238 7,957 7,023 6,486 5,496 4,968 4,386 3,548 3,513 2,932 2,268 2,287 Less Transmission Loss at end of 33kV @1.0% 0 0 0 0 0 0 0 0 0 0 0 0 0 0 0 0 0 0 0 0 0 Net Energy at end of 33kV (GWh) 16,376 16,336 17,155 13,904 11,942 9,412 8,970 8,444 8,253 8,238 7,957 7,023 6,486 5,496 4,968 4,386 3,548 3,513 2,932 2,268 2,287 Fixed Cost Depreciation 6,206 6,178 6,178 6,178 6,178 5,562 5,562 5,008 5,008 5,008 4,668 4,668 4,132 3,636 3,310 2,952 2,458 2,106 2,106 1,753 1,394 O & M 6,884 6,662 6,651 6,651 6,651 6,085 6,085 5,678 5,678 5,678 5,483 5,483 4,836 4,348 4,014 3,627 3,024 2,644 2,644 2,264 1,877 Administrative Overhead 702 702 701 701 842 769 769 715 715 715 691 691 611 546 502 455 380 333 333 286 239 Loan Interest (Donor) 2,576 2,413 2,250 2,087 1,924 1,730 1,545 1,359 1,184 1,009 793 638 469 318 177 113 85 85 85 85 85 Loan Interest (Local) 339 317 296 274 253 227 202 178 155 132 102 82 60 41 23 15 11 11 11 15 15 Dividend 1,838 1,837 1,837 1,837 1,831 1,664 1,664 1,531 1,531 1,531 1,457 1,457 1,302 1,158 1,066 959 811 705 705 599 491 Land Cost
Sub-Total 18,545 18,109 17,912 17,727 17,678 16,037 15,827 14,469 14,271 14,073 13,193 13,019 11,410 10,046 9,092 8,119 6,768 5,883 5,883 5,001 4,101 Variable Cost (Local) Fuel Cost 105,615 107,537 114,868 93,491 79,570 60,639 59,240 54,731 55,646 57,167 55,499 48,143 44,116 37,481 32,880 28,043 20,915 20,595 15,454 9,612 9,866 Electricity Purchase
O & M 1,354 1,772 1,770 1,770 1,770 1,602 1,602 1,468 1,468 1,468 1,423 1,423 1,272 1,107 1,009 918 776 687 687 598 508 Sub-Total 106,969 109,309 116,638 95,260 81,339 62,241 60,842 56,199 57,114 58,635 56,922 49,566 45,388 38,589 33,889 28,962 21,691 21,282 16,141 10,210 10,374 Salvage Value Land Plant 0 0 0 0 0 0 0 0 0 0 0 0 0 0 0 0 0 0 0 0 0 Annual Costs 125,514 127,418 134,550 112,988 99,017 78,278 76,669 70,668 71,385 72,708 70,115 62,585 56,798 48,635 42,981 37,081 28,459 27,165 22,024 15,212 14,474 Total Fixed Costs 18,545 18,109 17,912 17,727 17,678 16,037 15,827 14,469 14,271 14,073 13,193 13,019 11,410 10,046 9,092 8,119 6,768 5,883 5,883 5,001 4,101 Total Variable Costs 106,969 109,309 116,638 95,260 81,339 62,241 60,842 56,199 57,114 58,635 56,922 49,566 45,388 38,589 33,889 28,962 21,691 21,282 16,141 10,210 10,374 Generation Cost Fixed Cost (Tk./kW/month) 497 486 480 475 475 490 484 487 481 474 461 455 456 471 476 479 497 511 511 531 563 Fixed Cost Averaged (Tk/kW/month) 488 Variable Cost (Tk./kWh) 6.53 6.69 6.80 6.85 6.81 6.61 6.78 6.66 6.92 7.12 7.15 7.06 7.00 7.02 6.82 6.60 6.11 6.06 5.51 4.50 4.54 Variable Cost Averaged 6.48 Generation Cost per Unit Fixed Cost in kWh basis 1.13 1.11 1.04 1.27 1.48 1.70 1.76 1.71 1.73 1.71 1.66 1.85 1.76 1.83 1.83 1.85 1.91 1.67 2.01 2.21 1.79 Average Fixed Cost in kWh Basis 1.67 Variable Cost (Tk./kWh) 6.53 6.69 6.80 6.85 6.81 6.61 6.78 6.66 6.92 7.12 7.15 7.06 7.00 7.02 6.82 6.60 6.11 6.06 5.51 4.50 4.54 Fixed & Variable Composite (Tk./kWh) 7.66 7.80 7.84 8.13 8.29 8.32 8.55 8.37 8.65 8.83 8.81 8.91 8.76 8.85 8.65 8.46 8.02 7.73 7.51 6.71 6.33 6.33 Average Fixed & Variable Composite (Tk./kWh) 8.15
Levelized Fixed & Variable Comp @12% (Tk./kWh) 8.17 Source: PSMP Study Team
note: Capacity includes the capacity of existing plants by public undertaking including Hydro. Net generation represents the net generated outputs by existing public undertaking plants including Hydro. Generation cost does not take into consideration of the salvage values. The cost at the end of transmission with exception of the wheeling charge can be obtained by deducting the transmission loss by 2.5% from the net energy generation for the end of 132kV and the by additional 1% for the end of 33kV.
Power System Master Plan 2010
10-10
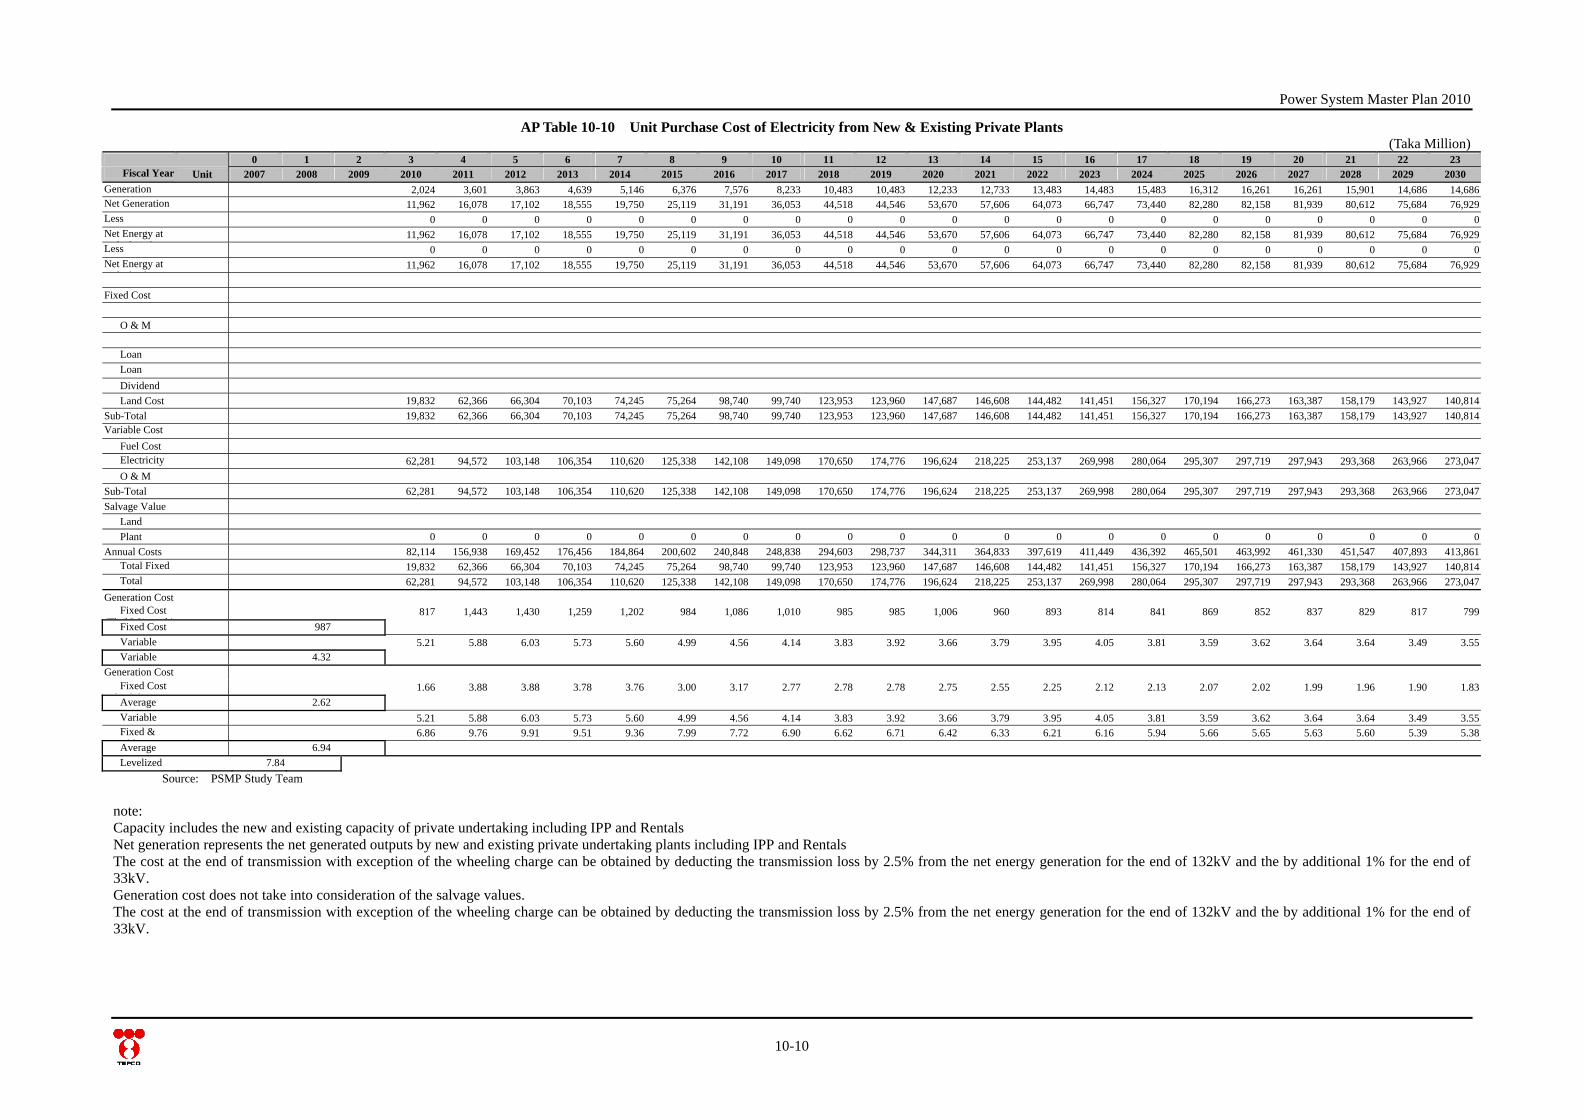
AP Table 10-10 Unit Purchase Cost of Electricity from New & Existing Private Plants (Taka Million)
0 1 2 3 4 5 6 7 8 9 10 11 12 13 14 15 16 17 18 19 20 21 22 23 Fiscal Year
iUnit 2007 2008 2009 2010 2011 2012 2013 2014 2015 2016 2017 2018 2019 2020 2021 2022 2023 2024 2025 2026 2027 2028 2029 2030
Generation 2,024 3,601 3,863 4,639 5,146 6,376 7,576 8,233 10,483 10,483 12,233 12,733 13,483 14,483 15,483 16,312 16,261 16,261 15,901 14,686 14,686 Net Generation (G h)
11,962 16,078 17,102 18,555 19,750 25,119 31,191 36,053 44,518 44,546 53,670 57,606 64,073 66,747 73,440 82,280 82,158 81,939 80,612 75,684 76,929 Less
i i 0 0 0 0 0 0 0 0 0 0 0 0 0 0 0 0 0 0 0 0 0
Net Energy at d f 132k
11,962 16,078 17,102 18,555 19,750 25,119 31,191 36,053 44,518 44,546 53,670 57,606 64,073 66,747 73,440 82,280 82,158 81,939 80,612 75,684 76,929 Less
i i 0 0 0 0 0 0 0 0 0 0 0 0 0 0 0 0 0 0 0 0 0
Net Energy at d f 33k
11,962 16,078 17,102 18,555 19,750 25,119 31,191 36,053 44,518 44,546 53,670 57,606 64,073 66,747 73,440 82,280 82,158 81,939 80,612 75,684 76,929 Fixed Cost
i i
O & M
Ad i i i
Loan ( )
Loan ( l)
Dividend
Land Cost 19,832 62,366 66,304 70,103 74,245 75,264 98,740 99,740 123,953 123,960 147,687 146,608 144,482 141,451 156,327 170,194 166,273 163,387 158,179 143,927 140,814 Sub-Total 19,832 62,366 66,304 70,103 74,245 75,264 98,740 99,740 123,953 123,960 147,687 146,608 144,482 141,451 156,327 170,194 166,273 163,387 158,179 143,927 140,814 Variable Cost ( l)
Fuel Cost
Electricity h
62,281 94,572 103,148 106,354 110,620 125,338 142,108 149,098 170,650 174,776 196,624 218,225 253,137 269,998 280,064 295,307 297,719 297,943 293,368 263,966 273,047 O & M
Sub-Total 62,281 94,572 103,148 106,354 110,620 125,338 142,108 149,098 170,650 174,776 196,624 218,225 253,137 269,998 280,064 295,307 297,719 297,943 293,368 263,966 273,047 Salvage Value Land Plant 0 0 0 0 0 0 0 0 0 0 0 0 0 0 0 0 0 0 0 0 0Annual Costs 82,114 156,938 169,452 176,456 184,864 200,602 240,848 248,838 294,603 298,737 344,311 364,833 397,619 411,449 436,392 465,501 463,992 461,330 451,547 407,893 413,861 Total Fixed C
19,832 62,366 66,304 70,103 74,245 75,264 98,740 99,740 123,953 123,960 147,687 146,608 144,482 141,451 156,327 170,194 166,273 163,387 158,179 143,927 140,814 Total
i bl C 62,281 94,572 103,148 106,354 110,620 125,338 142,108 149,098 170,650 174,776 196,624 218,225 253,137 269,998 280,064 295,307 297,719 297,943 293,368 263,966 273,047
Generation Cost Fixed Cost (Tk /kW/ h)
817 1,443 1,430 1,259 1,202 984 1,086 1,010 985 985 1,006 960 893 814 841 869 852 837 829 817 799 Fixed Cost 987 Variable 5.21 5.88 6.03 5.73 5.60 4.99 4.56 4.14 3.83 3.92 3.66 3.79 3.95 4.05 3.81 3.59 3.62 3.64 3.64 3.49 3.55 Variable 4.32 Generation Cost Fixed Cost i kWh b i
1.66 3.88 3.88 3.78 3.76 3.00 3.17 2.77 2.78 2.78 2.75 2.55 2.25 2.12 2.13 2.07 2.02 1.99 1.96 1.90 1.83 Average 2.62 Variable 5.21 5.88 6.03 5.73 5.60 4.99 4.56 4.14 3.83 3.92 3.66 3.79 3.95 4.05 3.81 3.59 3.62 3.64 3.64 3.49 3.55 Fixed &
i bl 6.86 9.76 9.91 9.51 9.36 7.99 7.72 6.90 6.62 6.71 6.42 6.33 6.21 6.16 5.94 5.66 5.65 5.63 5.60 5.39 5.38
Average 6.94 Levelized 7.84
Source: PSMP Study Team note: Capacity includes the new and existing capacity of private undertaking including IPP and Rentals Net generation represents the net generated outputs by new and existing private undertaking plants including IPP and Rentals The cost at the end of transmission with exception of the wheeling charge can be obtained by deducting the transmission loss by 2.5% from the net energy generation for the end of 132kV and the by additional 1% for the end of 33kV. Generation cost does not take into consideration of the salvage values. The cost at the end of transmission with exception of the wheeling charge can be obtained by deducting the transmission loss by 2.5% from the net energy generation for the end of 132kV and the by additional 1% for the end of 33kV.
Power System Master Plan 2010
10-11
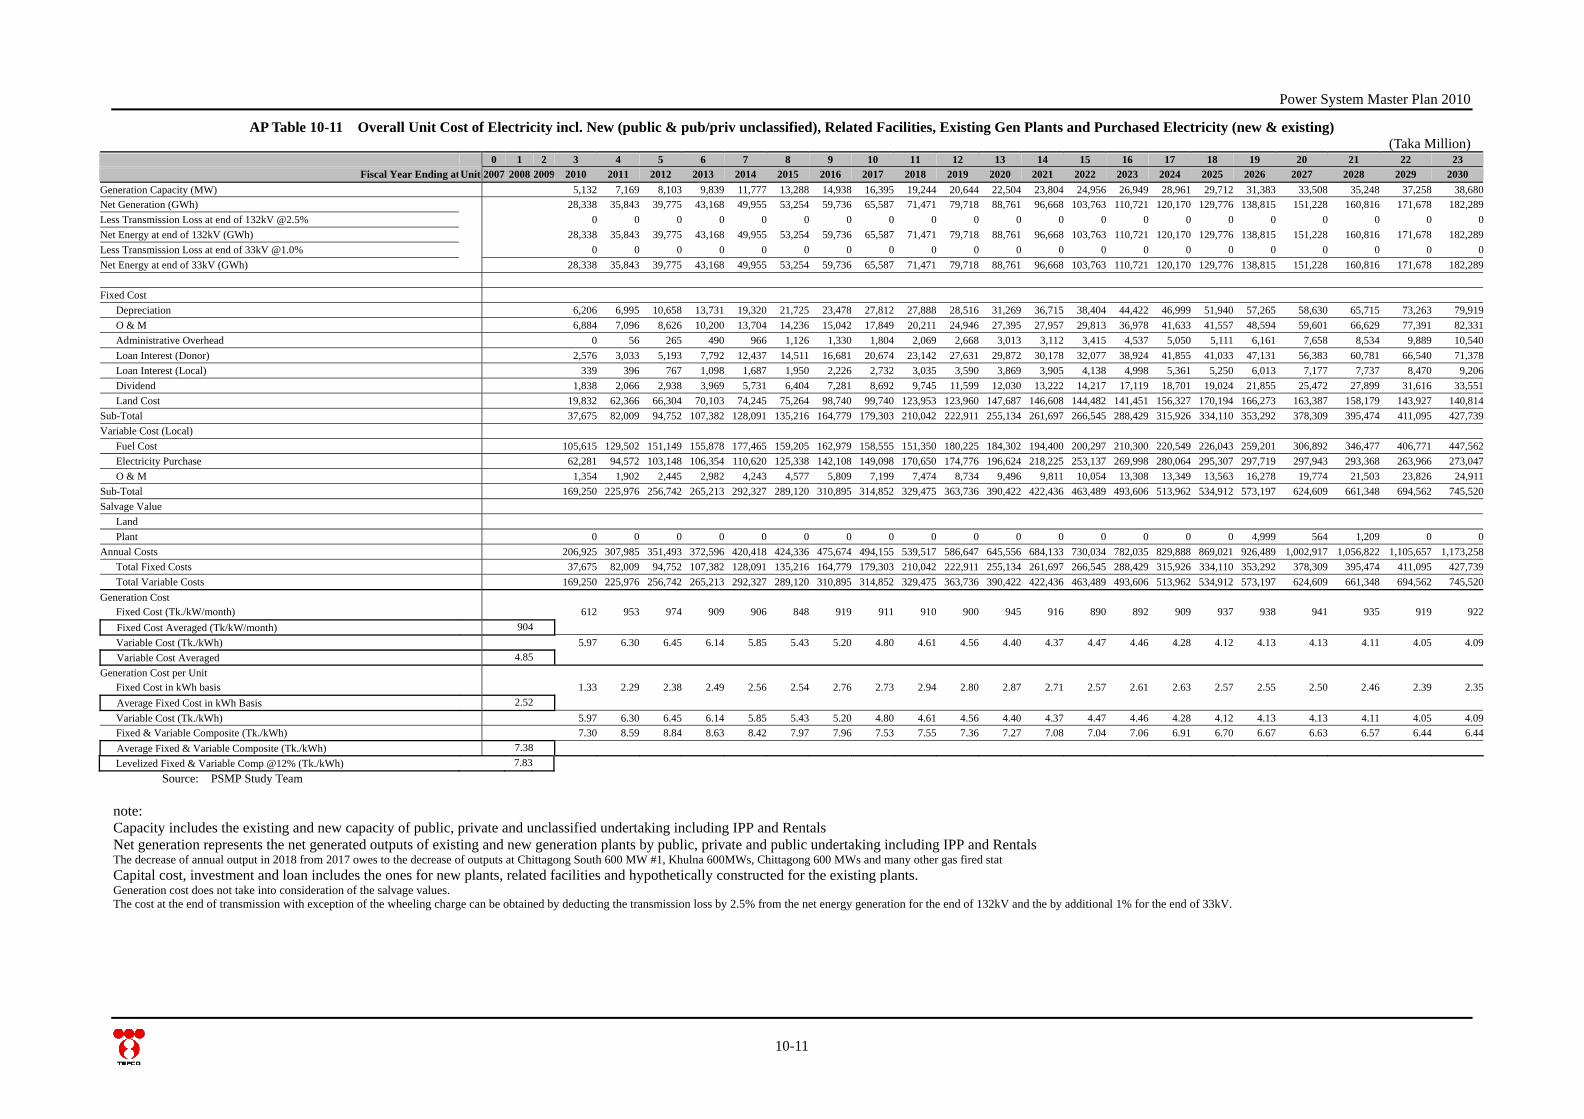
AP Table 10-11 Overall Unit Cost of Electricity incl. New (public & pub/priv unclassified), Related Facilities, Existing Gen Plants and Purchased Electricity (new & existing) (Taka Million)
0 1 2 3 4 5 6 7 8 9 10 11 12 13 14 15 16 17 18 19 20 21 22 23 Fiscal Year Ending atUnit 2007 2008 2009 2010 2011 2012 2013 2014 2015 2016 2017 2018 2019 2020 2021 2022 2023 2024 2025 2026 2027 2028 2029 2030
Generation Capacity (MW) 5,132 7,169 8,103 9,839 11,777 13,288 14,938 16,395 19,244 20,644 22,504 23,804 24,956 26,949 28,961 29,712 31,383 33,508 35,248 37,258 38,680Net Generation (GWh) 28,338 35,843 39,775 43,168 49,955 53,254 59,736 65,587 71,471 79,718 88,761 96,668 103,763 110,721 120,170 129,776 138,815 151,228 160,816 171,678 182,289Less Transmission Loss at end of 132kV @2.5% 0 0 0 0 0 0 0 0 0 0 0 0 0 0 0 0 0 0 0 0 0Net Energy at end of 132kV (GWh) 28,338 35,843 39,775 43,168 49,955 53,254 59,736 65,587 71,471 79,718 88,761 96,668 103,763 110,721 120,170 129,776 138,815 151,228 160,816 171,678 182,289Less Transmission Loss at end of 33kV @1.0% 0 0 0 0 0 0 0 0 0 0 0 0 0 0 0 0 0 0 0 0 0Net Energy at end of 33kV (GWh) 28,338 35,843 39,775 43,168 49,955 53,254 59,736 65,587 71,471 79,718 88,761 96,668 103,763 110,721 120,170 129,776 138,815 151,228 160,816 171,678 182,289 Fixed Cost Depreciation 6,206 6,995 10,658 13,731 19,320 21,725 23,478 27,812 27,888 28,516 31,269 36,715 38,404 44,422 46,999 51,940 57,265 58,630 65,715 73,263 79,919 O & M 6,884 7,096 8,626 10,200 13,704 14,236 15,042 17,849 20,211 24,946 27,395 27,957 29,813 36,978 41,633 41,557 48,594 59,601 66,629 77,391 82,331 Administrative Overhead 0 56 265 490 966 1,126 1,330 1,804 2,069 2,668 3,013 3,112 3,415 4,537 5,050 5,111 6,161 7,658 8,534 9,889 10,540 Loan Interest (Donor) 2,576 3,033 5,193 7,792 12,437 14,511 16,681 20,674 23,142 27,631 29,872 30,178 32,077 38,924 41,855 41,033 47,131 56,383 60,781 66,540 71,378 Loan Interest (Local) 339 396 767 1,098 1,687 1,950 2,226 2,732 3,035 3,590 3,869 3,905 4,138 4,998 5,361 5,250 6,013 7,177 7,737 8,470 9,206 Dividend 1,838 2,066 2,938 3,969 5,731 6,404 7,281 8,692 9,745 11,599 12,030 13,222 14,217 17,119 18,701 19,024 21,855 25,472 27,899 31,616 33,551 Land Cost 19,832 62,366 66,304 70,103 74,245 75,264 98,740 99,740 123,953 123,960 147,687 146,608 144,482 141,451 156,327 170,194 166,273 163,387 158,179 143,927 140,814Sub-Total 37,675 82,009 94,752 107,382 128,091 135,216 164,779 179,303 210,042 222,911 255,134 261,697 266,545 288,429 315,926 334,110 353,292 378,309 395,474 411,095 427,739Variable Cost (Local) Fuel Cost 105,615 129,502 151,149 155,878 177,465 159,205 162,979 158,555 151,350 180,225 184,302 194,400 200,297 210,300 220,549 226,043 259,201 306,892 346,477 406,771 447,562 Electricity Purchase 62,281 94,572 103,148 106,354 110,620 125,338 142,108 149,098 170,650 174,776 196,624 218,225 253,137 269,998 280,064 295,307 297,719 297,943 293,368 263,966 273,047 O & M 1,354 1,902 2,445 2,982 4,243 4,577 5,809 7,199 7,474 8,734 9,496 9,811 10,054 13,308 13,349 13,563 16,278 19,774 21,503 23,826 24,911Sub-Total 169,250 225,976 256,742 265,213 292,327 289,120 310,895 314,852 329,475 363,736 390,422 422,436 463,489 493,606 513,962 534,912 573,197 624,609 661,348 694,562 745,520Salvage Value Land Plant 0 0 0 0 0 0 0 0 0 0 0 0 0 0 0 0 4,999 564 1,209 0 0Annual Costs 206,925 307,985 351,493 372,596 420,418 424,336 475,674 494,155 539,517 586,647 645,556 684,133 730,034 782,035 829,888 869,021 926,489 1,002,917 1,056,822 1,105,657 1,173,258 Total Fixed Costs 37,675 82,009 94,752 107,382 128,091 135,216 164,779 179,303 210,042 222,911 255,134 261,697 266,545 288,429 315,926 334,110 353,292 378,309 395,474 411,095 427,739 Total Variable Costs 169,250 225,976 256,742 265,213 292,327 289,120 310,895 314,852 329,475 363,736 390,422 422,436 463,489 493,606 513,962 534,912 573,197 624,609 661,348 694,562 745,520Generation Cost Fixed Cost (Tk./kW/month) 612 953 974 909 906 848 919 911 910 900 945 916 890 892 909 937 938 941 935 919 922 Fixed Cost Averaged (Tk/kW/month) 904 Variable Cost (Tk./kWh) 5.97 6.30 6.45 6.14 5.85 5.43 5.20 4.80 4.61 4.56 4.40 4.37 4.47 4.46 4.28 4.12 4.13 4.13 4.11 4.05 4.09 Variable Cost Averaged 4.85 Generation Cost per Unit Fixed Cost in kWh basis 1.33 2.29 2.38 2.49 2.56 2.54 2.76 2.73 2.94 2.80 2.87 2.71 2.57 2.61 2.63 2.57 2.55 2.50 2.46 2.39 2.35 Average Fixed Cost in kWh Basis 2.52 Variable Cost (Tk./kWh) 5.97 6.30 6.45 6.14 5.85 5.43 5.20 4.80 4.61 4.56 4.40 4.37 4.47 4.46 4.28 4.12 4.13 4.13 4.11 4.05 4.09 Fixed & Variable Composite (Tk./kWh) 7.30 8.59 8.84 8.63 8.42 7.97 7.96 7.53 7.55 7.36 7.27 7.08 7.04 7.06 6.91 6.70 6.67 6.63 6.57 6.44 6.44 Average Fixed & Variable Composite (Tk./kWh) 7.38 Levelized Fixed & Variable Comp @12% (Tk./kWh) 7.83
Source: PSMP Study Team note: Capacity includes the existing and new capacity of public, private and unclassified undertaking including IPP and Rentals Net generation represents the net generated outputs of existing and new generation plants by public, private and public undertaking including IPP and Rentals The decrease of annual output in 2018 from 2017 owes to the decrease of outputs at Chittagong South 600 MW #1, Khulna 600MWs, Chittagong 600 MWs and many other gas fired stat Capital cost, investment and loan includes the ones for new plants, related facilities and hypothetically constructed for the existing plants. Generation cost does not take into consideration of the salvage values. The cost at the end of transmission with exception of the wheeling charge can be obtained by deducting the transmission loss by 2.5% from the net energy generation for the end of 132kV and the by additional 1% for the end of 33kV.

Power System Master Plan 2010
Chapter 12 Selection of Most-prioritized Projects APPENDIX
12.1 APPENDIX –Weighing of Evaluation Items by the AHP Method
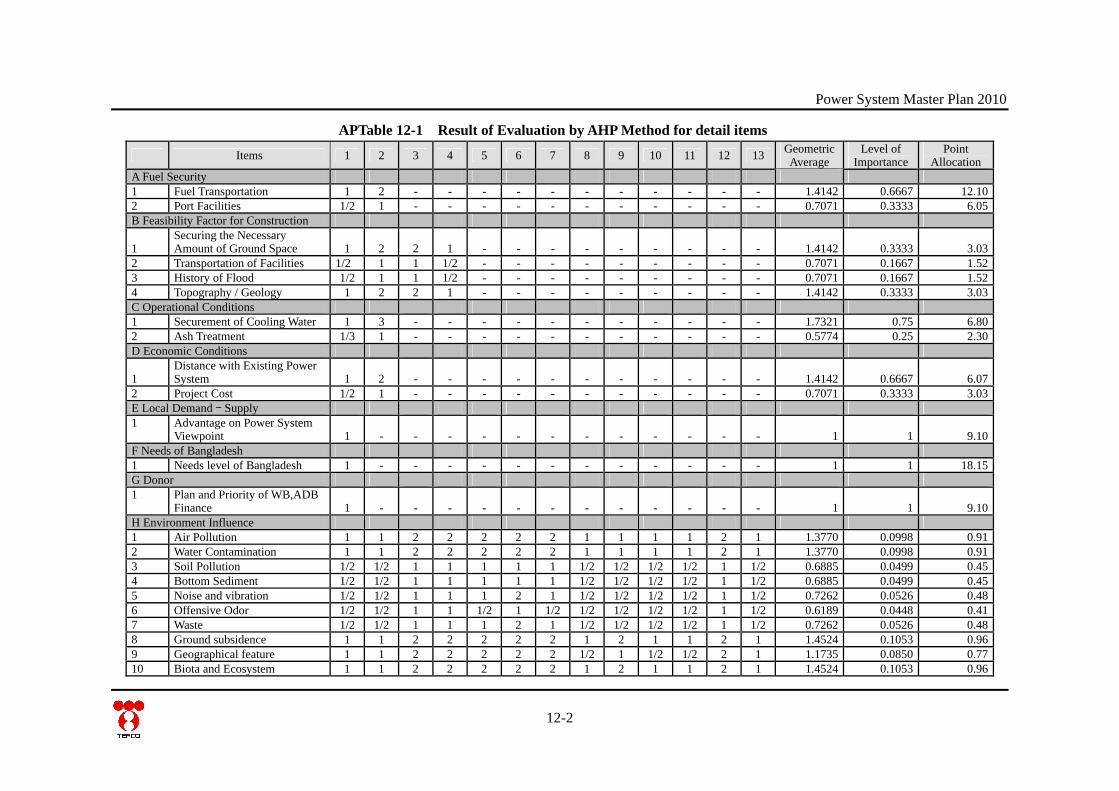
(1) Weighting for detail items The following table shows the result of weighting for detail item by using AHP method.
12-1
Power System Master Plan 2010
12-2
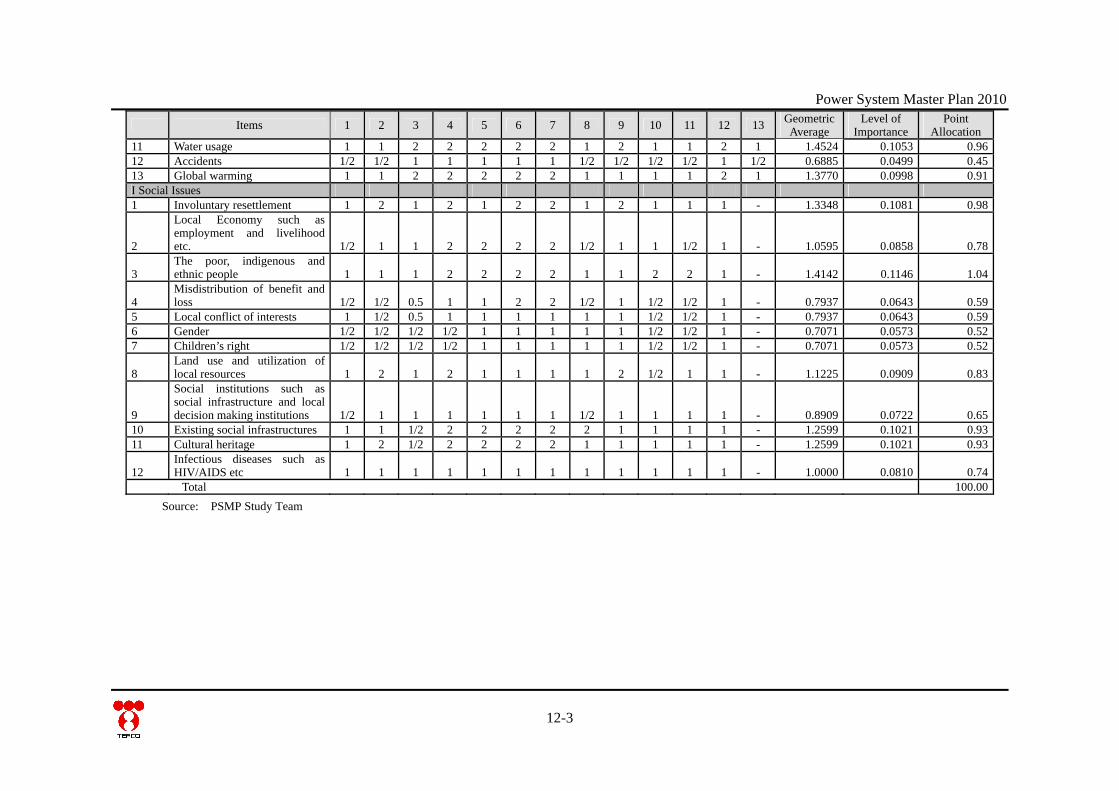
APTable 12-1 Result of Evaluation by AHP Method for detail items
Items 1 2 3 4 5 6 7 8 9 10 11 12 13 GeometricAverage
Level of Importance
Point Allocation
A Fuel Security 1 Fuel Transportation 1 2 - - - - - - - - - - - 1.4142 0.6667 12.10 2 Port Facilities 1/2 1 - - - - - - - - - - - 0.7071 0.3333 6.05 B Feasibility Factor for Construction
1 Securing the Necessary Amount of Ground Space 1 2 2 1 - - - - - - - - - 1.4142 0.3333 3.03
2 Transportation of Facilities 1/2 1 1 1/2 - - - - - - - - - 0.7071 0.1667 1.52 3 History of Flood 1/2 1 1 1/2 - - - - - - - - - 0.7071 0.1667 1.52 4 Topography / Geology 1 2 2 1 - - - - - - - - - 1.4142 0.3333 3.03 C Operational Conditions 1 Securement of Cooling Water 1 3 - - - - - - - - - - - 1.7321 0.75 6.80 2 Ash Treatment 1/3 1 - - - - - - - - - - - 0.5774 0.25 2.30 D Economic Conditions
1 Distance with Existing Power System 1 2 - - - - - - - - - - - 1.4142 0.6667 6.07
2 Project Cost 1/2 1 - - - - - - - - - - - 0.7071 0.3333 3.03 E Local Demand – Supply 1 Advantage on Power System
Viewpoint 1 - - - - - - - - - - - - 1 1 9.10 F Needs of Bangladesh 1 Needs level of Bangladesh 1 - - - - - - - - - - - - 1 1 18.15 G Donor 1 Plan and Priority of WB,ADB
Finance 1 - - - - - - - - - - - - 1 1 9.10 H Environment Influence 1 Air Pollution 1 1 2 2 2 2 2 1 1 1 1 2 1 1.3770 0.0998 0.91 2 Water Contamination 1 1 2 2 2 2 2 1 1 1 1 2 1 1.3770 0.0998 0.91 3 Soil Pollution 1/2 1/2 1 1 1 1 1 1/2 1/2 1/2 1/2 1 1/2 0.6885 0.0499 0.45 4 Bottom Sediment 1/2 1/2 1 1 1 1 1 1/2 1/2 1/2 1/2 1 1/2 0.6885 0.0499 0.45 5 Noise and vibration 1/2 1/2 1 1 1 2 1 1/2 1/2 1/2 1/2 1 1/2 0.7262 0.0526 0.48 6 Offensive Odor 1/2 1/2 1 1 1/2 1 1/2 1/2 1/2 1/2 1/2 1 1/2 0.6189 0.0448 0.41 7 Waste 1/2 1/2 1 1 1 2 1 1/2 1/2 1/2 1/2 1 1/2 0.7262 0.0526 0.48 8 Ground subsidence 1 1 2 2 2 2 2 1 2 1 1 2 1 1.4524 0.1053 0.96 9 Geographical feature 1 1 2 2 2 2 2 1/2 1 1/2 1/2 2 1 1.1735 0.0850 0.77 10 Biota and Ecosystem 1 1 2 2 2 2 2 1 2 1 1 2 1 1.4524 0.1053 0.96
Power System Master Plan 2010
12-3
Items 1 2 3 4 5 6 7 8 9 10 11 12 13 GeometricAverage
Level of Importance
Point Allocation
11 Water usage 1 1 2 2 2 2 2 1 2 1 1 2 1 1.4524 0.1053 0.96 12 Accidents 1/2 1/2 1 1 1 1 1 1/2 1/2 1/2 1/2 1 1/2 0.6885 0.0499 0.45 13 Global warming 1 1 2 2 2 2 2 1 1 1 1 2 1 1.3770 0.0998 0.91 I Social Issues 1 Involuntary resettlement 1 2 1 2 1 2 2 1 2 1 1 1 - 1.3348 0.1081 0.98
2
Local Economy such as employment and livelihood etc. 1/2 1 1 2 2 2 2 1/2 1 1 1/2 1 - 1.0595 0.0858 0.78
3 The poor, indigenous and ethnic people 1 1 1 2 2 2 2 1 1 2 2 1 - 1.4142 0.1146 1.04
4 Misdistribution of benefit and loss 1/2 1/2 0.5 1 1 2 2 1/2 1 1/2 1/2 1 - 0.7937 0.0643 0.59
5 Local conflict of interests 1 1/2 0.5 1 1 1 1 1 1 1/2 1/2 1 - 0.7937 0.0643 0.59 6 Gender 1/2 1/2 1/2 1/2 1 1 1 1 1 1/2 1/2 1 - 0.7071 0.0573 0.52 7 Children’s right 1/2 1/2 1/2 1/2 1 1 1 1 1 1/2 1/2 1 - 0.7071 0.0573 0.52
8 Land use and utilization of local resources 1 2 1 2 1 1 1 1 2 1/2 1 1 - 1.1225 0.0909 0.83
9
Social institutions such as social infrastructure and local decision making institutions 1/2 1 1 1 1 1 1 1/2 1 1 1 1 - 0.8909 0.0722 0.65
10 Existing social infrastructures 1 1 1/2 2 2 2 2 2 1 1 1 1 - 1.2599 0.1021 0.93 11 Cultural heritage 1 2 1/2 2 2 2 2 1 1 1 1 1 - 1.2599 0.1021 0.93
12 Infectious diseases such as HIV/AIDS etc 1 1 1 1 1 1 1 1 1 1 1 1 - 1.0000 0.0810 0.74
To tal 100.00 Source: PSMP Study Team
Power System Master Plan 2010
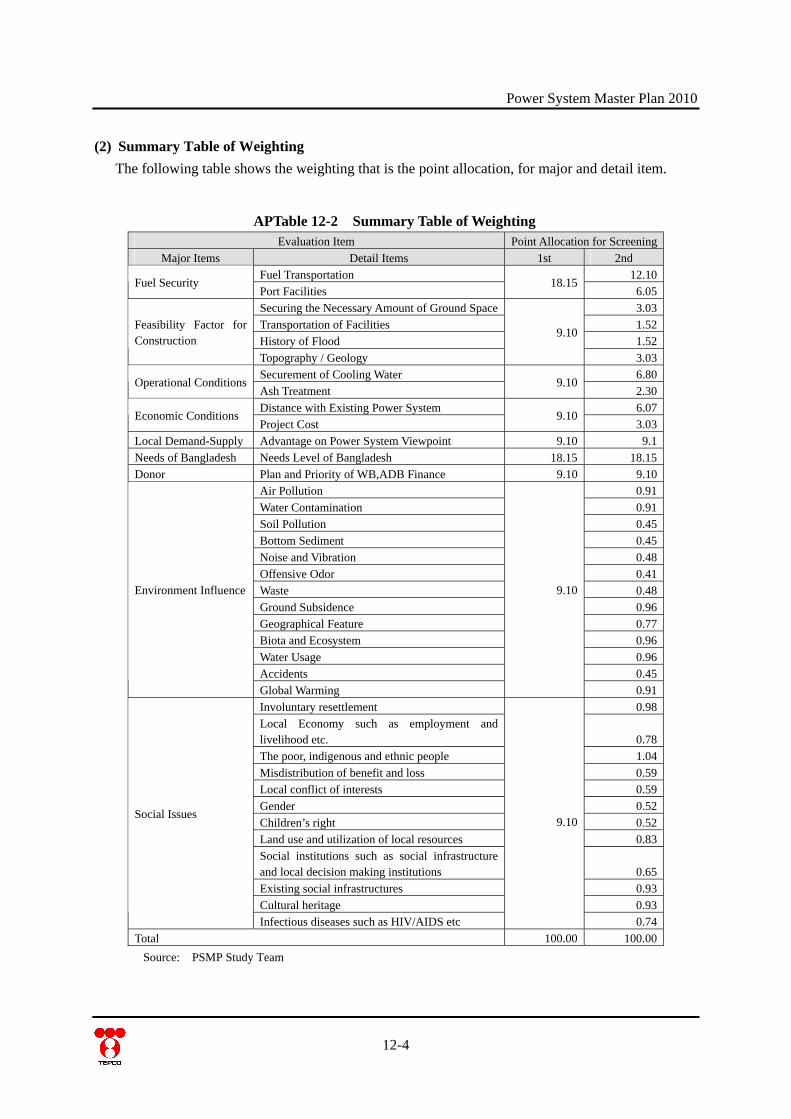
(2) Summary Table of Weighting The following table shows the weighting that is the point allocation, for major and detail item.
APTable 12-2 Summary Table of Weighting Evaluation Item Point Allocation for Screening
Major Items Detail Items 1st 2nd Fuel Transportation 12.10
Fuel Security Port Facilities
18.15 6.05
Securing the Necessary Amount of Ground Space 3.03 Transportation of Facilities 1.52 History of Flood 1.52
Feasibility Factor for Construction
Topography / Geology
9.10
3.03 Securement of Cooling Water 6.80
Operational Conditions Ash Treatment
9.10 2.30
Distance with Existing Power System 6.07 Economic Conditions
Project Cost 9.10
3.03 Local Demand-Supply Advantage on Power System Viewpoint 9.10 9.1Needs of Bangladesh Needs Level of Bangladesh 18.15 18.15Donor Plan and Priority of WB,ADB Finance 9.10 9.10
Air Pollution 0.91 Water Contamination 0.91 Soil Pollution 0.45 Bottom Sediment 0.45 Noise and Vibration 0.48 Offensive Odor 0.41 Waste 0.48 Ground Subsidence 0.96 Geographical Feature 0.77 Biota and Ecosystem 0.96 Water Usage 0.96 Accidents 0.45
Environment Influence
Global Warming
9.10
0.91 Involuntary resettlement 0.98 Local Economy such as employment and livelihood etc. 0.78 The poor, indigenous and ethnic people 1.04 Misdistribution of benefit and loss 0.59 Local conflict of interests 0.59 Gender 0.52 Children’s right 0.52 Land use and utilization of local resources 0.83 Social institutions such as social infrastructure and local decision making institutions 0.65 Existing social infrastructures 0.93 Cultural heritage 0.93
Social Issues
Infectious diseases such as HIV/AIDS etc
9.10
0.74 Total 100.00 100.00
Source: PSMP Study Team
12-4
Power System Master Plan 2010
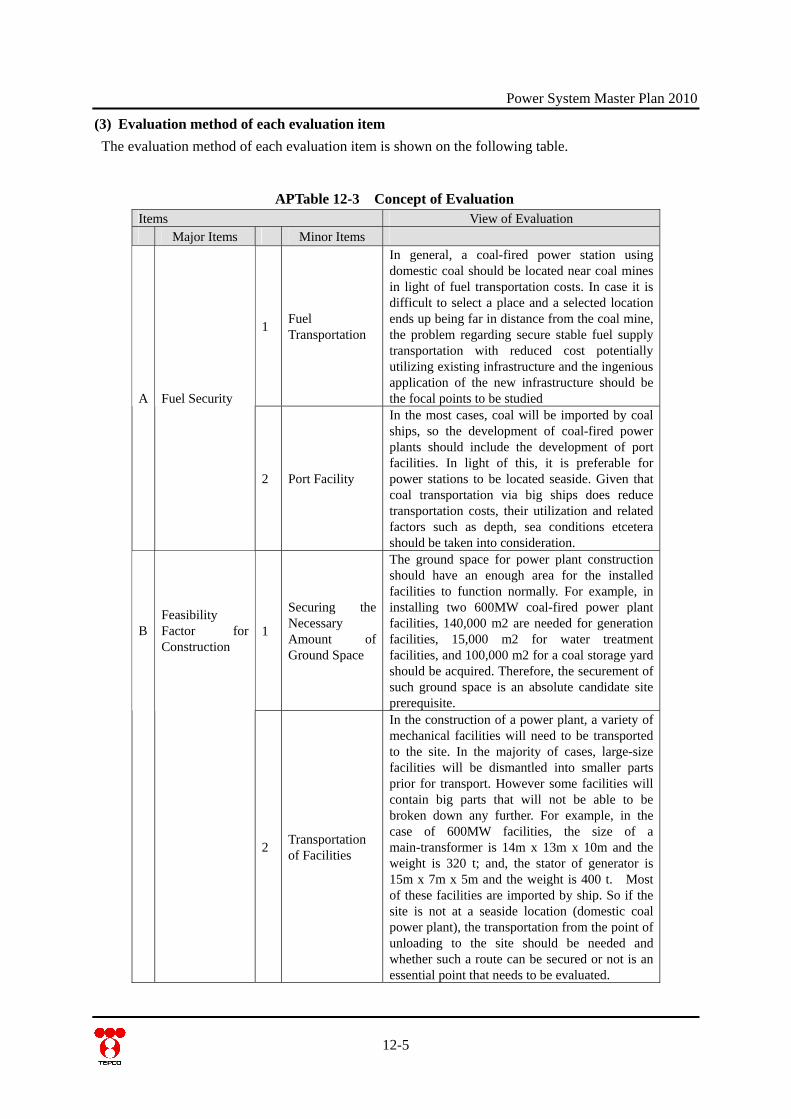
(3) Evaluation method of each evaluation item The evaluation method of each evaluation item is shown on the following table.
APTable 12-3 Concept of Evaluation Items View of Evaluation Major Items Minor Items
1 Fuel Transportation
In general, a coal-fired power station using domestic coal should be located near coal mines in light of fuel transportation costs. In case it is difficult to select a place and a selected location ends up being far in distance from the coal mine, the problem regarding secure stable fuel supply transportation with reduced cost potentially utilizing existing infrastructure and the ingenious application of the new infrastructure should be the focal points to be studied A Fuel Security
2 Port Facility
In the most cases, coal will be imported by coal ships, so the development of coal-fired power plants should include the development of port facilities. In light of this, it is preferable for power stations to be located seaside. Given that coal transportation via big ships does reduce transportation costs, their utilization and related factors such as depth, sea conditions etcetera should be taken into consideration.
1
Securing the Necessary Amount of Ground Space
The ground space for power plant construction should have an enough area for the installed facilities to function normally. For example, in installing two 600MW coal-fired power plant facilities, 140,000 m2 are needed for generation facilities, 15,000 m2 for water treatment facilities, and 100,000 m2 for a coal storage yard should be acquired. Therefore, the securement of such ground space is an absolute candidate site prerequisite.
B Feasibility Factor for Construction
2 Transportation of Facilities
In the construction of a power plant, a variety of mechanical facilities will need to be transported to the site. In the majority of cases, large-size facilities will be dismantled into smaller parts prior for transport. However some facilities will contain big parts that will not be able to be broken down any further. For example, in the case of 600MW facilities, the size of a main-transformer is 14m x 13m x 10m and the weight is 320 t; and, the stator of generator is 15m x 7m x 5m and the weight is 400 t. Most of these facilities are imported by ship. So if the site is not at a seaside location (domestic coal power plant), the transportation from the point of unloading to the site should be needed and whether such a route can be secured or not is an essential point that needs to be evaluated.
12-5
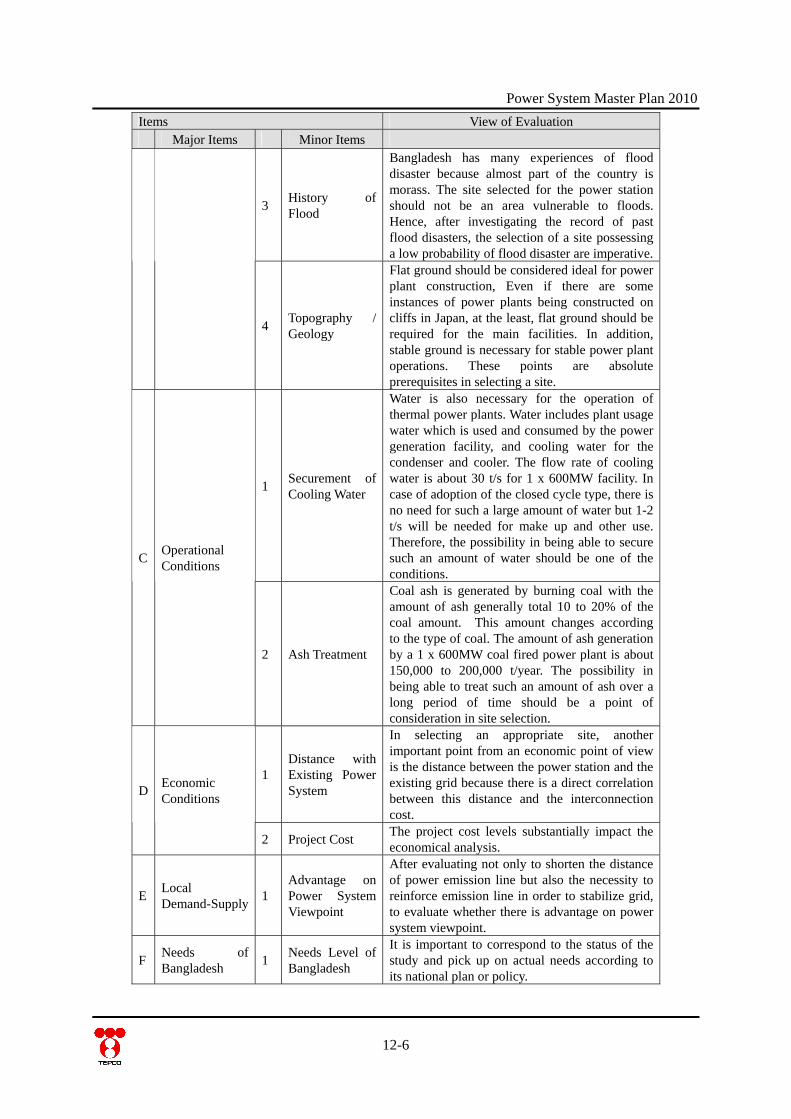
Power System Master Plan 2010
12-6
Items View of Evaluation Major Items Minor Items
3 History of Flood
Bangladesh has many experiences of flood disaster because almost part of the country is morass. The site selected for the power station should not be an area vulnerable to floods. Hence, after investigating the record of past flood disasters, the selection of a site possessing a low probability of flood disaster are imperative.
4 Topography / Geology
Flat ground should be considered ideal for power plant construction, Even if there are some instances of power plants being constructed on cliffs in Japan, at the least, flat ground should be required for the main facilities. In addition, stable ground is necessary for stable power plant operations. These points are absolute prerequisites in selecting a site.
1 Securement of Cooling Water
Water is also necessary for the operation of thermal power plants. Water includes plant usage water which is used and consumed by the power generation facility, and cooling water for the condenser and cooler. The flow rate of cooling water is about 30 t/s for 1 x 600MW facility. In case of adoption of the closed cycle type, there is no need for such a large amount of water but 1-2 t/s will be needed for make up and other use. Therefore, the possibility in being able to secure such an amount of water should be one of the conditions.
C Operational Conditions
2 Ash Treatment
Coal ash is generated by burning coal with the amount of ash generally total 10 to 20% of the coal amount. This amount changes according to the type of coal. The amount of ash generation by a 1 x 600MW coal fired power plant is about 150,000 to 200,000 t/year. The possibility in being able to treat such an amount of ash over a long period of time should be a point of consideration in site selection.
1 Distance with Existing Power System
In selecting an appropriate site, another important point from an economic point of view is the distance between the power station and the existing grid because there is a direct correlation between this distance and the interconnection cost.
D Economic Conditions
2 Project Cost The project cost levels substantially impact the economical analysis.
E Local Demand-Supply 1
Advantage on Power System Viewpoint
After evaluating not only to shorten the distance of power emission line but also the necessity to reinforce emission line in order to stabilize grid, to evaluate whether there is advantage on power system viewpoint.
F Needs of Bangladesh 1 Needs Level of
Bangladesh
It is important to correspond to the status of the study and pick up on actual needs according to its national plan or policy.
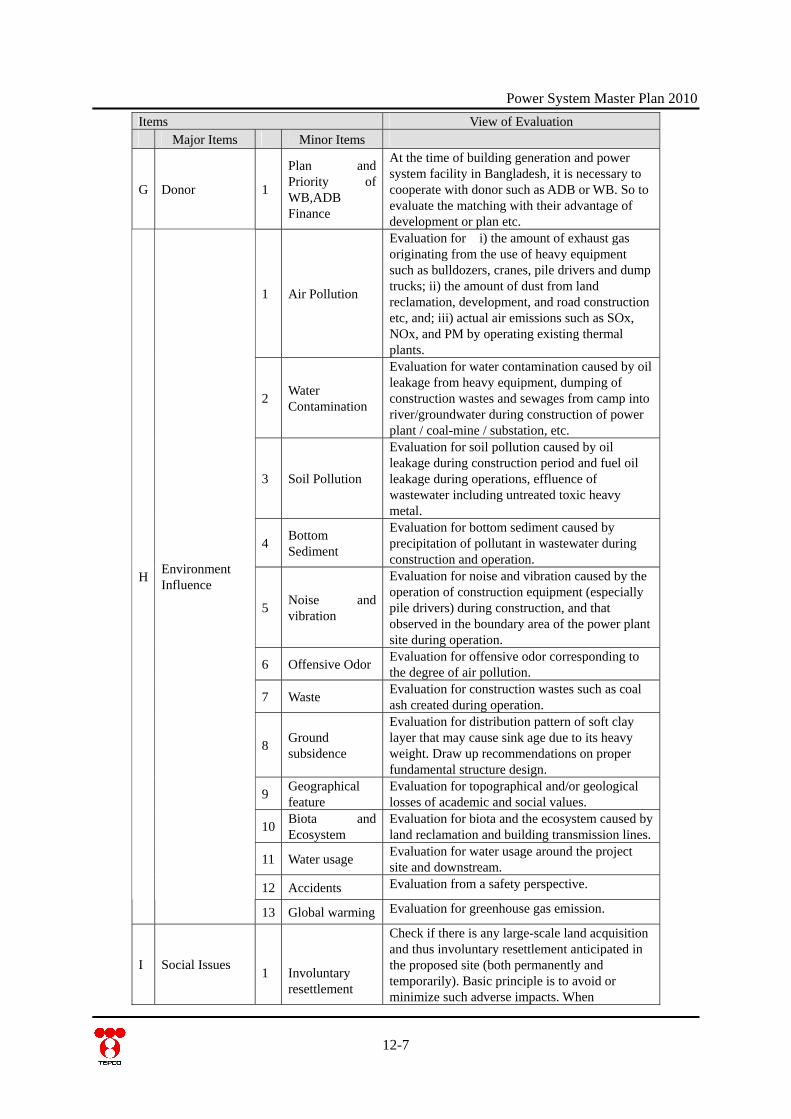
Power System Master Plan 2010
12-7
Items View of Evaluation Major Items Minor Items
G Donor 1
Plan and Priority of WB,ADB Finance
At the time of building generation and power system facility in Bangladesh, it is necessary to cooperate with donor such as ADB or WB. So to evaluate the matching with their advantage of development or plan etc.
1 Air Pollution
Evaluation for i) the amount of exhaust gas originating from the use of heavy equipment such as bulldozers, cranes, pile drivers and dump trucks; ii) the amount of dust from land reclamation, development, and road construction etc, and; iii) actual air emissions such as SOx, NOx, and PM by operating existing thermal plants.
2 Water Contamination
Evaluation for water contamination caused by oil leakage from heavy equipment, dumping of construction wastes and sewages from camp into river/groundwater during construction of power plant / coal-mine / substation, etc.
3 Soil Pollution
Evaluation for soil pollution caused by oil leakage during construction period and fuel oil leakage during operations, effluence of wastewater including untreated toxic heavy metal.
4 Bottom Sediment
Evaluation for bottom sediment caused by precipitation of pollutant in wastewater during construction and operation.
5 Noise and vibration
Evaluation for noise and vibration caused by the operation of construction equipment (especially pile drivers) during construction, and that observed in the boundary area of the power plant site during operation.
6 Offensive Odor Evaluation for offensive odor corresponding to the degree of air pollution.
7 Waste Evaluation for construction wastes such as coal ash created during operation.
8 Ground subsidence
Evaluation for distribution pattern of soft clay layer that may cause sink age due to its heavy weight. Draw up recommendations on proper fundamental structure design.
9 Geographical feature
Evaluation for topographical and/or geological losses of academic and social values.
10 Biota and Ecosystem
Evaluation for biota and the ecosystem caused by land reclamation and building transmission lines.
11 Water usage Evaluation for water usage around the project site and downstream.
12 Accidents Evaluation from a safety perspective.
H Environment Influence
13 Global warming Evaluation for greenhouse gas emission.
I Social Issues 1 Involuntary resettlement
Check if there is any large-scale land acquisition and thus involuntary resettlement anticipated in the proposed site (both permanently and temporarily). Basic principle is to avoid or minimize such adverse impacts. When
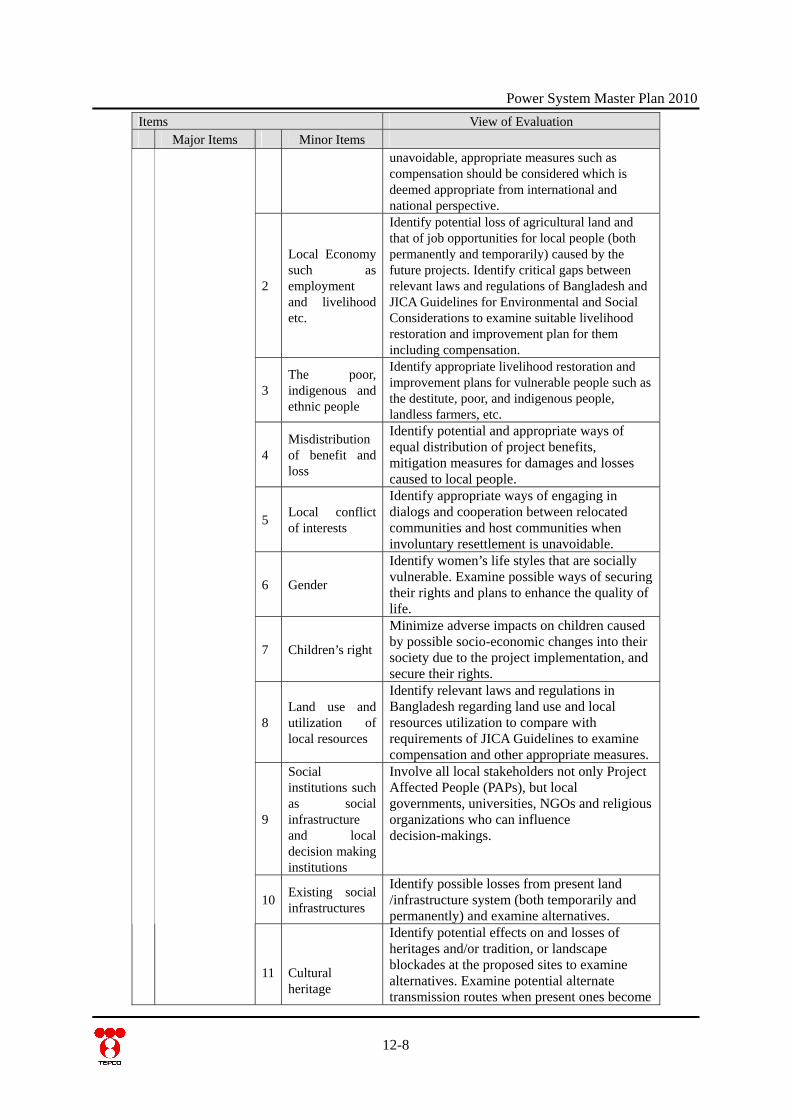
Power System Master Plan 2010
12-8
Items View of Evaluation Major Items Minor Items
unavoidable, appropriate measures such as compensation should be considered which is deemed appropriate from international and national perspective.
2
Local Economy such as employment and livelihood etc.
Identify potential loss of agricultural land and that of job opportunities for local people (both permanently and temporarily) caused by the future projects. Identify critical gaps between relevant laws and regulations of Bangladesh and JICA Guidelines for Environmental and Social Considerations to examine suitable livelihood restoration and improvement plan for them including compensation.
3 The poor, indigenous and ethnic people
Identify appropriate livelihood restoration and improvement plans for vulnerable people such as the destitute, poor, and indigenous people, landless farmers, etc.
4 Misdistribution of benefit and loss
Identify potential and appropriate ways of equal distribution of project benefits, mitigation measures for damages and losses caused to local people.
5 Local conflict of interests
Identify appropriate ways of engaging in dialogs and cooperation between relocated communities and host communities when involuntary resettlement is unavoidable.
6 Gender
Identify women’s life styles that are socially vulnerable. Examine possible ways of securing their rights and plans to enhance the quality of life.
7 Children’s right
Minimize adverse impacts on children caused by possible socio-economic changes into their society due to the project implementation, and secure their rights.
8 Land use and utilization of local resources
Identify relevant laws and regulations in Bangladesh regarding land use and local resources utilization to compare with requirements of JICA Guidelines to examine compensation and other appropriate measures.
9
Social institutions such as social infrastructure and local decision making institutions
Involve all local stakeholders not only Project Affected People (PAPs), but local governments, universities, NGOs and religious organizations who can influence decision-makings.
10 Existing social infrastructures
Identify possible losses from present land /infrastructure system (both temporarily and permanently) and examine alternatives.
11 Cultural heritage
Identify potential effects on and losses of heritages and/or tradition, or landscape blockades at the proposed sites to examine alternatives. Examine potential alternate transmission routes when present ones become

Power System Master Plan 2010
12-9
Items View of Evaluation Major Items Minor Items
an obstacle for worshipers and tourists to appreciate the country’s cultural heritage.
12 Infectious diseases such as HIV/AIDS etc
Identify possibility of HIV/AIDS infection among people related to project implementation (such as construction workers). And look into prevention measures.
Source: PSMP Study Team
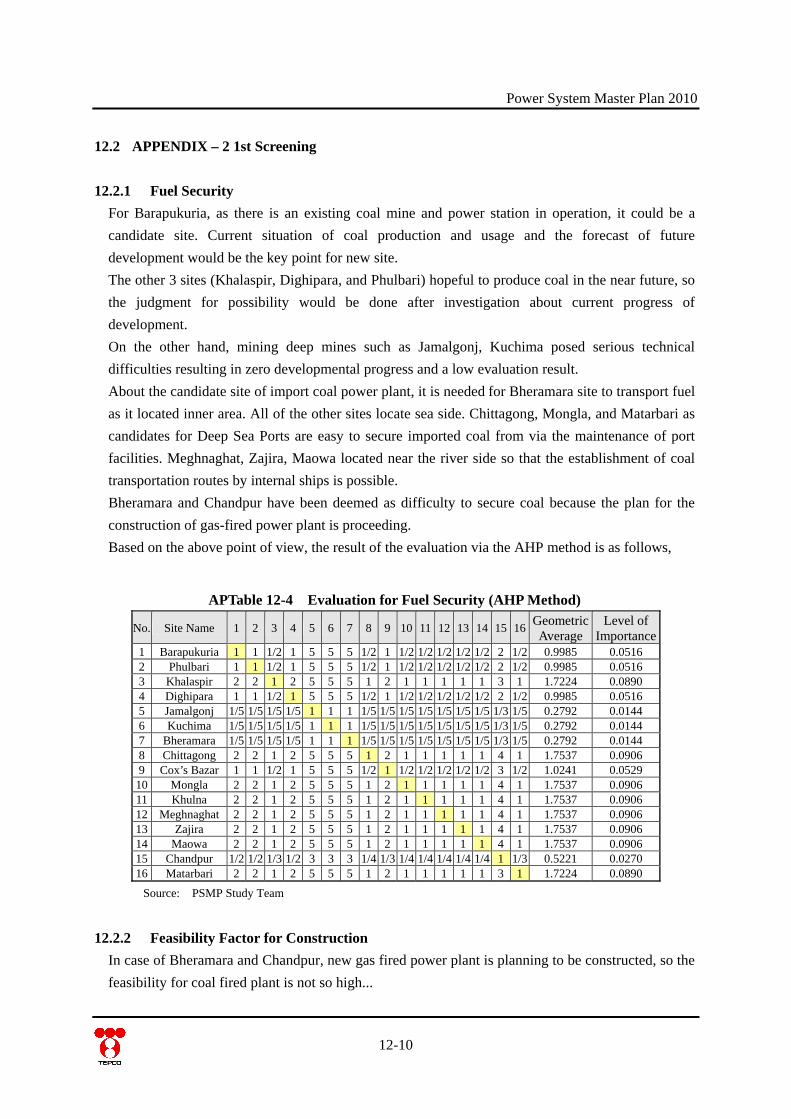
Power System Master Plan 2010
12.2 APPENDIX – 2 1st Screening
12.2.1 Fuel Security For Barapukuria, as there is an existing coal mine and power station in operation, it could be a candidate site. Current situation of coal production and usage and the forecast of future development would be the key point for new site. The other 3 sites (Khalaspir, Dighipara, and Phulbari) hopeful to produce coal in the near future, so the judgment for possibility would be done after investigation about current progress of development. On the other hand, mining deep mines such as Jamalgonj, Kuchima posed serious technical difficulties resulting in zero developmental progress and a low evaluation result. About the candidate site of import coal power plant, it is needed for Bheramara site to transport fuel as it located inner area. All of the other sites locate sea side. Chittagong, Mongla, and Matarbari as candidates for Deep Sea Ports are easy to secure imported coal from via the maintenance of port facilities. Meghnaghat, Zajira, Maowa located near the river side so that the establishment of coal transportation routes by internal ships is possible. Bheramara and Chandpur have been deemed as difficulty to secure coal because the plan for the construction of gas-fired power plant is proceeding. Based on the above point of view, the result of the evaluation via the AHP method is as follows,
APTable 12-4 Evaluation for Fuel Security (AHP Method)
No. Site Name 1 2 3 4 5 6 7 8 9 10 11 12 13 14 15 16 Geometric Average
Level of Importance
1 Barapukuria 1 1 1/2 1 5 5 5 1/2 1 1/2 1/2 1/2 1/2 1/2 2 1/2 0.9985 0.0516 2 Phulbari 1 1 1/2 1 5 5 5 1/2 1 1/2 1/2 1/2 1/2 1/2 2 1/2 0.9985 0.0516 3 Khalaspir 2 2 1 2 5 5 5 1 2 1 1 1 1 1 3 1 1.7224 0.0890 4 Dighipara 1 1 1/2 1 5 5 5 1/2 1 1/2 1/2 1/2 1/2 1/2 2 1/2 0.9985 0.0516 5 Jamalgonj 1/5 1/5 1/5 1/5 1 1 1 1/5 1/5 1/5 1/5 1/5 1/5 1/5 1/3 1/5 0.2792 0.0144 6 Kuchima 1/5 1/5 1/5 1/5 1 1 1 1/5 1/5 1/5 1/5 1/5 1/5 1/5 1/3 1/5 0.2792 0.0144 7 Bheramara 1/5 1/5 1/5 1/5 1 1 1 1/5 1/5 1/5 1/5 1/5 1/5 1/5 1/3 1/5 0.2792 0.0144 8 Chittagong 2 2 1 2 5 5 5 1 2 1 1 1 1 1 4 1 1.7537 0.0906 9 Cox’s Bazar 1 1 1/2 1 5 5 5 1/2 1 1/2 1/2 1/2 1/2 1/2 3 1/2 1.0241 0.0529
10 Mongla 2 2 1 2 5 5 5 1 2 1 1 1 1 1 4 1 1.7537 0.0906 11 Khulna 2 2 1 2 5 5 5 1 2 1 1 1 1 1 4 1 1.7537 0.0906 12 Meghnaghat 2 2 1 2 5 5 5 1 2 1 1 1 1 1 4 1 1.7537 0.0906 13 Zajira 2 2 1 2 5 5 5 1 2 1 1 1 1 1 4 1 1.7537 0.0906 14 Maowa 2 2 1 2 5 5 5 1 2 1 1 1 1 1 4 1 1.7537 0.0906 15 Chandpur 1/2 1/2 1/3 1/2 3 3 3 1/4 1/3 1/4 1/4 1/4 1/4 1/4 1 1/3 0.5221 0.0270 16 Matarbari 2 2 1 2 5 5 5 1 2 1 1 1 1 1 3 1 1.7224 0.0890
Source: PSMP Study Team
12.2.2 Feasibility Factor for Construction In case of Bheramara and Chandpur, new gas fired power plant is planning to be constructed, so the feasibility for coal fired plant is not so high...
12-10
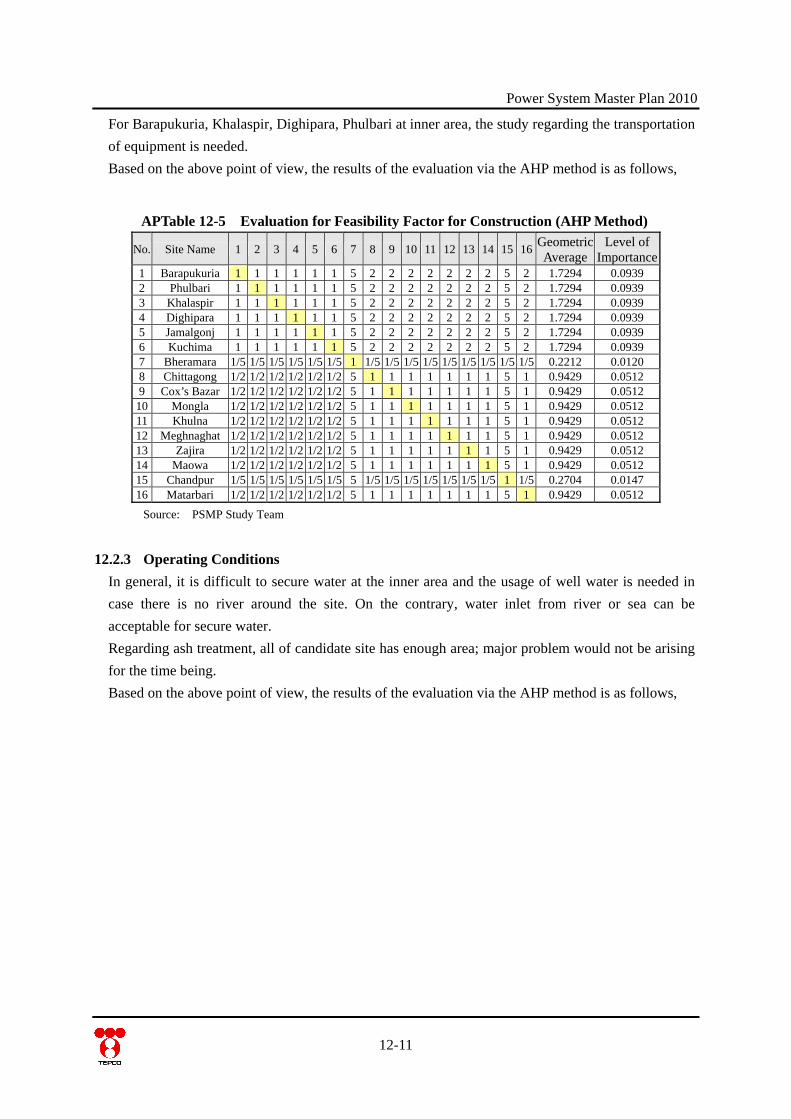
Power System Master Plan 2010
For Barapukuria, Khalaspir, Dighipara, Phulbari at inner area, the study regarding the transportation of equipment is needed. Based on the above point of view, the results of the evaluation via the AHP method is as follows,
APTable 12-5 Evaluation for Feasibility Factor for Construction (AHP Method)
No. Site Name 1 2 3 4 5 6 7 8 9 10 11 12 13 14 15 16 Geometric Average
Level of Importance
1 Barapukuria 1 1 1 1 1 1 5 2 2 2 2 2 2 2 5 2 1.7294 0.0939 2 Phulbari 1 1 1 1 1 1 5 2 2 2 2 2 2 2 5 2 1.7294 0.0939 3 Khalaspir 1 1 1 1 1 1 5 2 2 2 2 2 2 2 5 2 1.7294 0.0939 4 Dighipara 1 1 1 1 1 1 5 2 2 2 2 2 2 2 5 2 1.7294 0.0939 5 Jamalgonj 1 1 1 1 1 1 5 2 2 2 2 2 2 2 5 2 1.7294 0.0939 6 Kuchima 1 1 1 1 1 1 5 2 2 2 2 2 2 2 5 2 1.7294 0.0939 7 Bheramara 1/5 1/5 1/5 1/5 1/5 1/5 1 1/5 1/5 1/5 1/5 1/5 1/5 1/5 1/5 1/5 0.2212 0.0120 8 Chittagong 1/2 1/2 1/2 1/2 1/2 1/2 5 1 1 1 1 1 1 1 5 1 0.9429 0.0512 9 Cox’s Bazar 1/2 1/2 1/2 1/2 1/2 1/2 5 1 1 1 1 1 1 1 5 1 0.9429 0.0512
10 Mongla 1/2 1/2 1/2 1/2 1/2 1/2 5 1 1 1 1 1 1 1 5 1 0.9429 0.0512 11 Khulna 1/2 1/2 1/2 1/2 1/2 1/2 5 1 1 1 1 1 1 1 5 1 0.9429 0.0512 12 Meghnaghat 1/2 1/2 1/2 1/2 1/2 1/2 5 1 1 1 1 1 1 1 5 1 0.9429 0.0512 13 Zajira 1/2 1/2 1/2 1/2 1/2 1/2 5 1 1 1 1 1 1 1 5 1 0.9429 0.0512 14 Maowa 1/2 1/2 1/2 1/2 1/2 1/2 5 1 1 1 1 1 1 1 5 1 0.9429 0.0512 15 Chandpur 1/5 1/5 1/5 1/5 1/5 1/5 5 1/5 1/5 1/5 1/5 1/5 1/5 1/5 1 1/5 0.2704 0.0147 16 Matarbari 1/2 1/2 1/2 1/2 1/2 1/2 5 1 1 1 1 1 1 1 5 1 0.9429 0.0512
Source: PSMP Study Team
12.2.3 Operating Conditions In general, it is difficult to secure water at the inner area and the usage of well water is needed in case there is no river around the site. On the contrary, water inlet from river or sea can be acceptable for secure water. Regarding ash treatment, all of candidate site has enough area; major problem would not be arising for the time being. Based on the above point of view, the results of the evaluation via the AHP method is as follows,
12-11
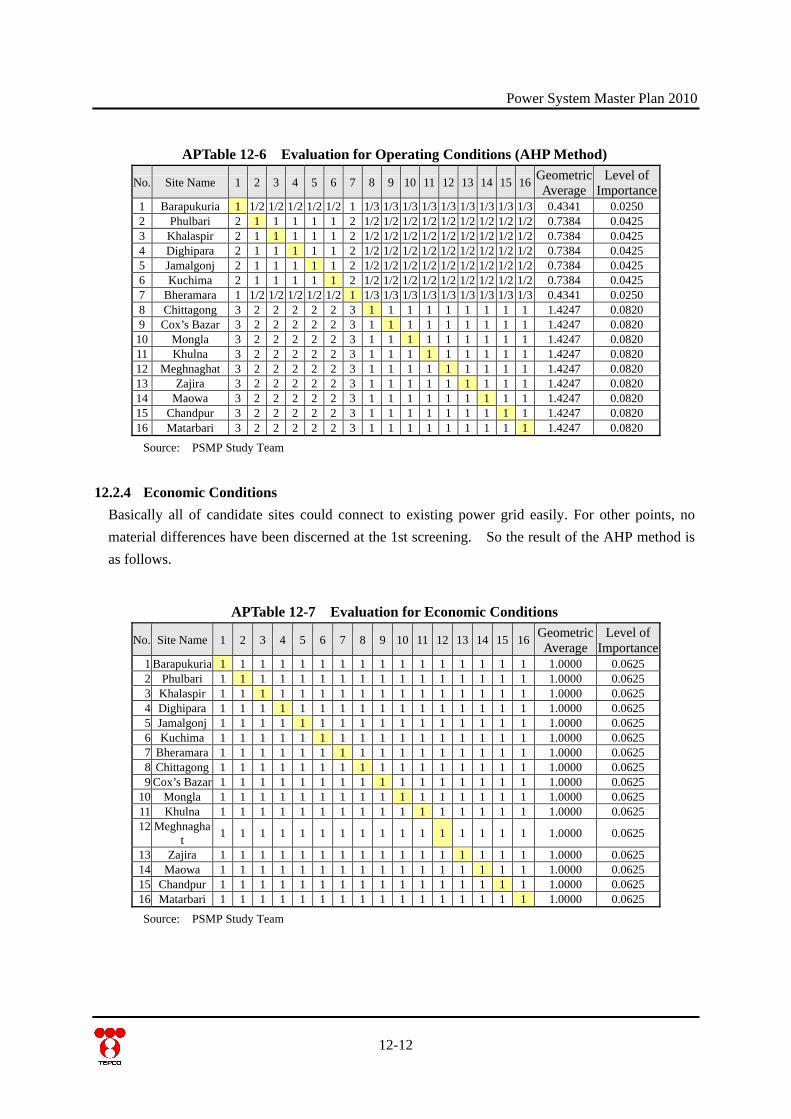
Power System Master Plan 2010
APTable 12-6 Evaluation for Operating Conditions (AHP Method)
No. Site Name 1 2 3 4 5 6 7 8 9 10 11 12 13 14 15 16 Geometric Average
Level of Importance
1 Barapukuria 1 1/2 1/2 1/2 1/2 1/2 1 1/3 1/3 1/3 1/3 1/3 1/3 1/3 1/3 1/3 0.4341 0.0250 2 Phulbari 2 1 1 1 1 1 2 1/2 1/2 1/2 1/2 1/2 1/2 1/2 1/2 1/2 0.7384 0.0425 3 Khalaspir 2 1 1 1 1 1 2 1/2 1/2 1/2 1/2 1/2 1/2 1/2 1/2 1/2 0.7384 0.0425 4 Dighipara 2 1 1 1 1 1 2 1/2 1/2 1/2 1/2 1/2 1/2 1/2 1/2 1/2 0.7384 0.0425 5 Jamalgonj 2 1 1 1 1 1 2 1/2 1/2 1/2 1/2 1/2 1/2 1/2 1/2 1/2 0.7384 0.0425 6 Kuchima 2 1 1 1 1 1 2 1/2 1/2 1/2 1/2 1/2 1/2 1/2 1/2 1/2 0.7384 0.0425 7 Bheramara 1 1/2 1/2 1/2 1/2 1/2 1 1/3 1/3 1/3 1/3 1/3 1/3 1/3 1/3 1/3 0.4341 0.0250 8 Chittagong 3 2 2 2 2 2 3 1 1 1 1 1 1 1 1 1 1.4247 0.0820 9 Cox’s Bazar 3 2 2 2 2 2 3 1 1 1 1 1 1 1 1 1 1.4247 0.0820
10 Mongla 3 2 2 2 2 2 3 1 1 1 1 1 1 1 1 1 1.4247 0.0820 11 Khulna 3 2 2 2 2 2 3 1 1 1 1 1 1 1 1 1 1.4247 0.0820 12 Meghnaghat 3 2 2 2 2 2 3 1 1 1 1 1 1 1 1 1 1.4247 0.0820 13 Zajira 3 2 2 2 2 2 3 1 1 1 1 1 1 1 1 1 1.4247 0.0820 14 Maowa 3 2 2 2 2 2 3 1 1 1 1 1 1 1 1 1 1.4247 0.0820 15 Chandpur 3 2 2 2 2 2 3 1 1 1 1 1 1 1 1 1 1.4247 0.0820 16 Matarbari 3 2 2 2 2 2 3 1 1 1 1 1 1 1 1 1 1.4247 0.0820
Source: PSMP Study Team
12.2.4 Economic Conditions Basically all of candidate sites could connect to existing power grid easily. For other points, no material differences have been discerned at the 1st screening. So the result of the AHP method is as follows.
APTable 12-7 Evaluation for Economic Conditions
No. Site Name 1 2 3 4 5 6 7 8 9 10 11 12 13 14 15 16 Geometric Average
Level of Importance
1 Barapukuria 1 1 1 1 1 1 1 1 1 1 1 1 1 1 1 1 1.0000 0.0625 2 Phulbari 1 1 1 1 1 1 1 1 1 1 1 1 1 1 1 1 1.0000 0.0625 3 Khalaspir 1 1 1 1 1 1 1 1 1 1 1 1 1 1 1 1 1.0000 0.0625 4 Dighipara 1 1 1 1 1 1 1 1 1 1 1 1 1 1 1 1 1.0000 0.0625 5 Jamalgonj 1 1 1 1 1 1 1 1 1 1 1 1 1 1 1 1 1.0000 0.0625 6 Kuchima 1 1 1 1 1 1 1 1 1 1 1 1 1 1 1 1 1.0000 0.0625 7 Bheramara 1 1 1 1 1 1 1 1 1 1 1 1 1 1 1 1 1.0000 0.0625 8 Chittagong 1 1 1 1 1 1 1 1 1 1 1 1 1 1 1 1 1.0000 0.0625 9 Cox’s Bazar 1 1 1 1 1 1 1 1 1 1 1 1 1 1 1 1 1.0000 0.0625
10 Mongla 1 1 1 1 1 1 1 1 1 1 1 1 1 1 1 1 1.0000 0.0625 11 Khulna 1 1 1 1 1 1 1 1 1 1 1 1 1 1 1 1 1.0000 0.0625 12 Meghnagha
t 1 1 1 1 1 1 1 1 1 1 1 1 1 1 1 1 1.0000 0.0625
13 Zajira 1 1 1 1 1 1 1 1 1 1 1 1 1 1 1 1 1.0000 0.0625 14 Maowa 1 1 1 1 1 1 1 1 1 1 1 1 1 1 1 1 1.0000 0.0625 15 Chandpur 1 1 1 1 1 1 1 1 1 1 1 1 1 1 1 1 1.0000 0.0625 16 Matarbari 1 1 1 1 1 1 1 1 1 1 1 1 1 1 1 1 1.0000 0.0625
Source: PSMP Study Team
12-12
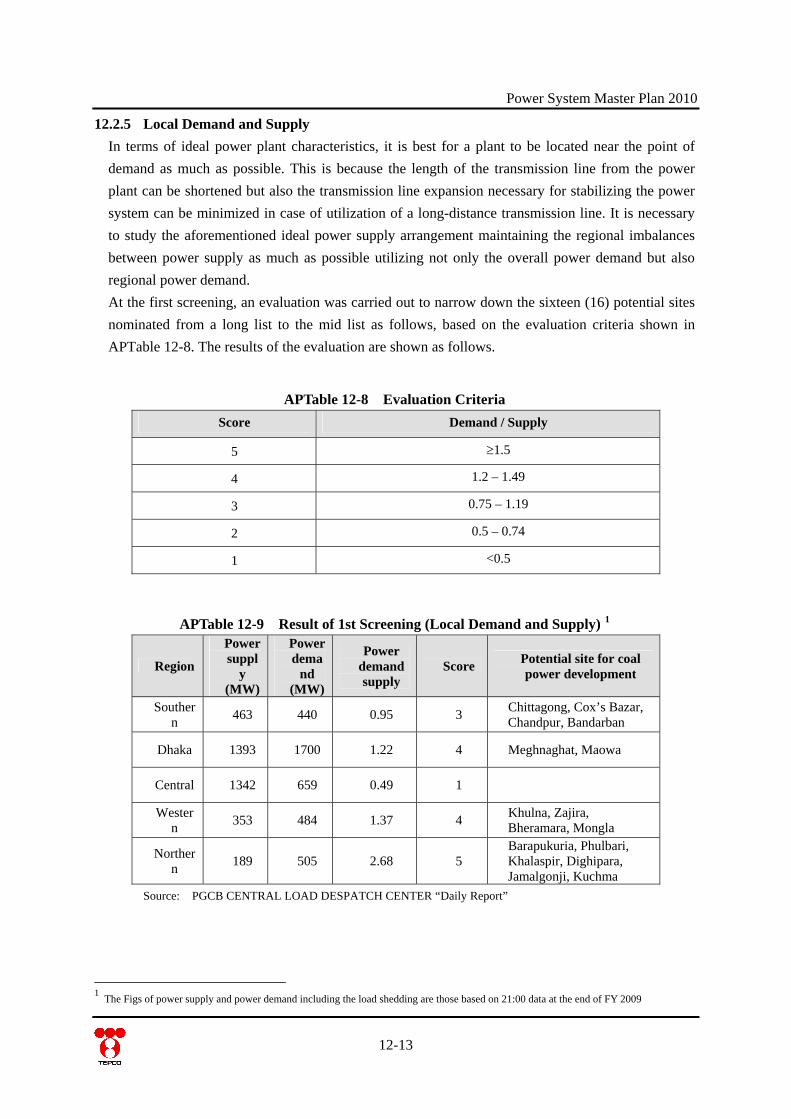
Power System Master Plan 2010
12-13
12.2.5 Local Demand and Supply In terms of ideal power plant characteristics, it is best for a plant to be located near the point of demand as much as possible. This is because the length of the transmission line from the power plant can be shortened but also the transmission line expansion necessary for stabilizing the power system can be minimized in case of utilization of a long-distance transmission line. It is necessary to study the aforementioned ideal power supply arrangement maintaining the regional imbalances between power supply as much as possible utilizing not only the overall power demand but also regional power demand. At the first screening, an evaluation was carried out to narrow down the sixteen (16) potential sites nominated from a long list to the mid list as follows, based on the evaluation criteria shown in APTable 12-8. The results of the evaluation are shown as follows.
APTable 12-8 Evaluation Criteria Score Demand / Supply
5 1.5
4 1.2 – 1.49
3 0.75 – 1.19
2 0.5 – 0.74
1 <0.5
APTable 12-9 Result of 1st Screening (Local Demand and Supply) 1
Region
Power suppl
y (MW)
Power dema
nd (MW)
Power demand supply
Score Potential site for coal power development
Southern 463 440 0.95 3 Chittagong, Cox’s Bazar,
Chandpur, Bandarban
Dhaka 1393 1700 1.22 4 Meghnaghat, Maowa
Central 1342 659 0.49 1
Western 353 484 1.37 4 Khulna, Zajira,
Bheramara, Mongla
Northern 189 505 2.68 5
Barapukuria, Phulbari, Khalaspir, Dighipara, Jamalgonji, Kuchma
Source: PGCB CENTRAL LOAD DESPATCH CENTER “Daily Report”
1 The Figs of power supply and power demand including the load shedding are those based on 21:00 data at the end of FY 2009
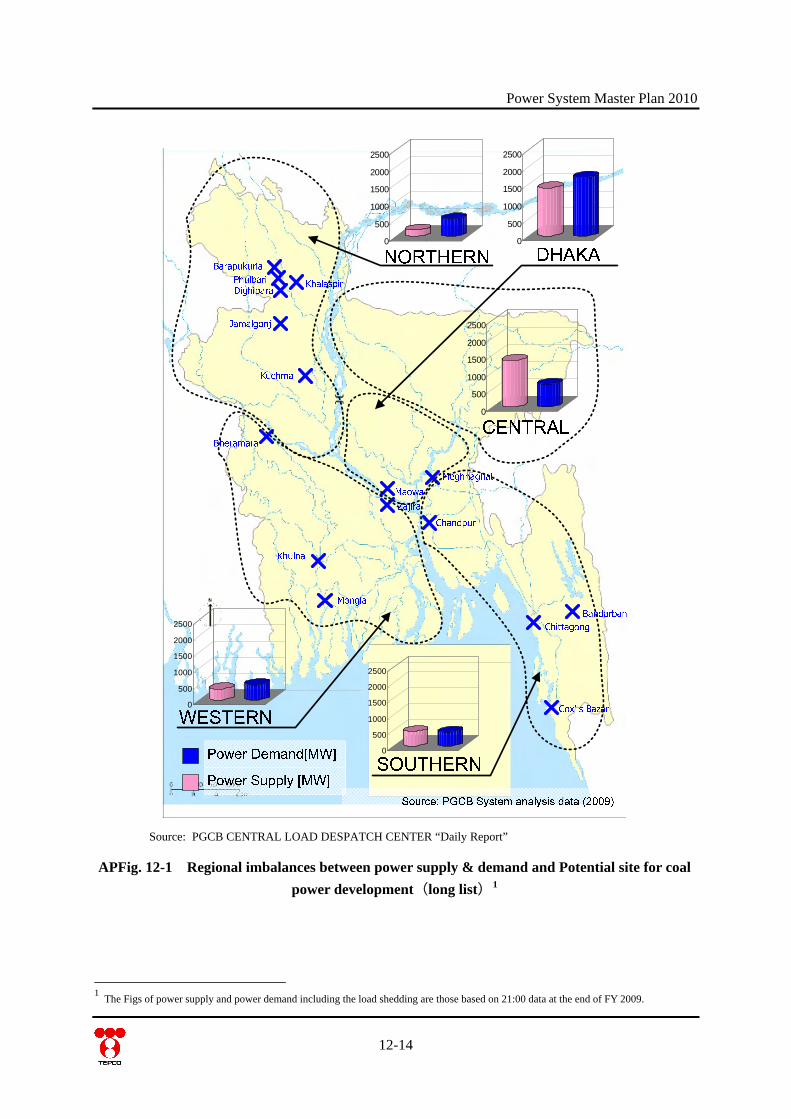
Power System Master Plan 2010
12-14
0
500
1000
1500
2000
2500
0
500
1000
1500
2000
2500
0
500
1000
1500
2000
2500
0
500
1000
1500
2000
2500
0
500
1000
1500
2000
2500
Source: PGCB CENTRAL LOAD DESPATCH CENTER “Daily Report”
APFig. 12-1 Regional imbalances between power supply & demand and Potential site for coal power development(long list)1
1 The Figs of power supply and power demand including the load shedding are those based on 21:00 data at the end of FY 2009.
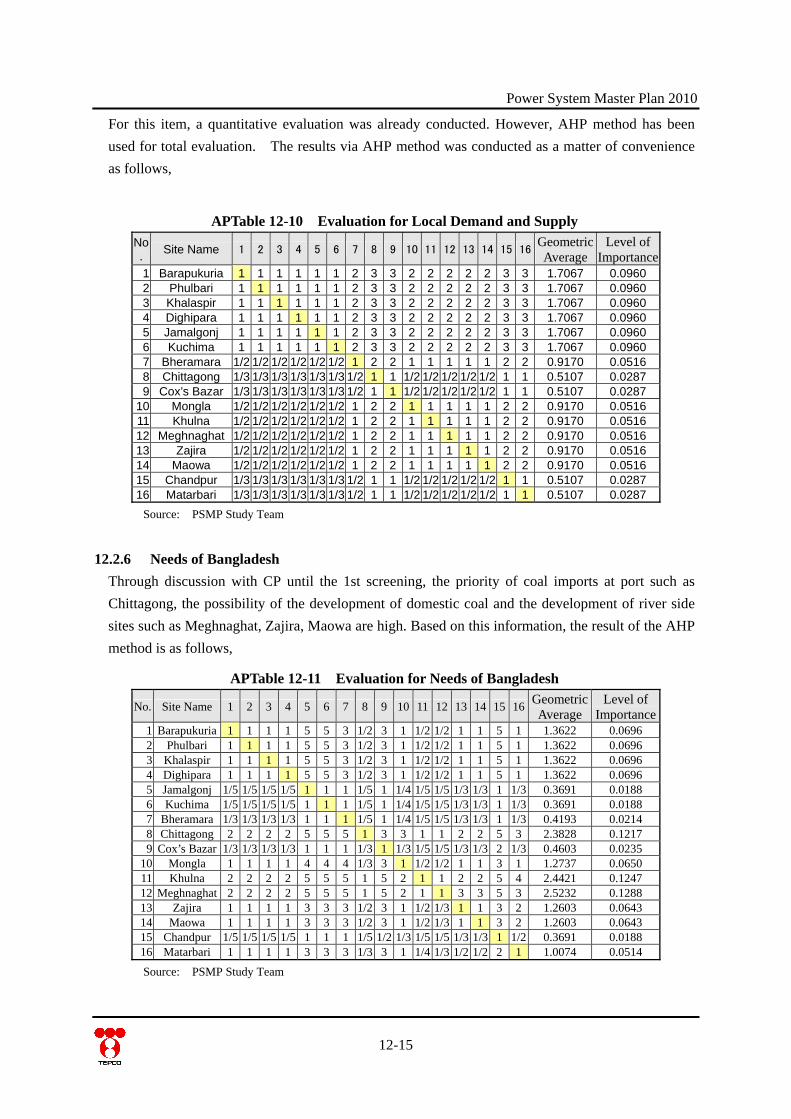
Power System Master Plan 2010
For this item, a quantitative evaluation was already conducted. However, AHP method has been used for total evaluation. The results via AHP method was conducted as a matter of convenience as follows,
APTable 12-10 Evaluation for Local Demand and Supply No.
Site Name 1 2 3 4 5 6 7 8 9 10 11 12 13 14 15 16Geometric Average
Level of Importance
1 Barapukuria 1 1 1 1 1 1 2 3 3 2 2 2 2 2 3 3 1.7067 0.0960 2 Phulbari 1 1 1 1 1 1 2 3 3 2 2 2 2 2 3 3 1.7067 0.0960 3 Khalaspir 1 1 1 1 1 1 2 3 3 2 2 2 2 2 3 3 1.7067 0.0960 4 Dighipara 1 1 1 1 1 1 2 3 3 2 2 2 2 2 3 3 1.7067 0.0960 5 Jamalgonj 1 1 1 1 1 1 2 3 3 2 2 2 2 2 3 3 1.7067 0.0960 6 Kuchima 1 1 1 1 1 1 2 3 3 2 2 2 2 2 3 3 1.7067 0.0960 7 Bheramara 1/2 1/2 1/2 1/2 1/2 1/2 1 2 2 1 1 1 1 1 2 2 0.9170 0.0516 8 Chittagong 1/3 1/3 1/3 1/3 1/3 1/3 1/2 1 1 1/2 1/2 1/2 1/2 1/2 1 1 0.5107 0.0287 9 Cox’s Bazar 1/3 1/3 1/3 1/3 1/3 1/3 1/2 1 1 1/2 1/2 1/2 1/2 1/2 1 1 0.5107 0.0287
10 Mongla 1/2 1/2 1/2 1/2 1/2 1/2 1 2 2 1 1 1 1 1 2 2 0.9170 0.0516 11 Khulna 1/2 1/2 1/2 1/2 1/2 1/2 1 2 2 1 1 1 1 1 2 2 0.9170 0.0516 12 Meghnaghat 1/2 1/2 1/2 1/2 1/2 1/2 1 2 2 1 1 1 1 1 2 2 0.9170 0.0516 13 Zajira 1/2 1/2 1/2 1/2 1/2 1/2 1 2 2 1 1 1 1 1 2 2 0.9170 0.0516 14 Maowa 1/2 1/2 1/2 1/2 1/2 1/2 1 2 2 1 1 1 1 1 2 2 0.9170 0.0516 15 Chandpur 1/3 1/3 1/3 1/3 1/3 1/3 1/2 1 1 1/2 1/2 1/2 1/2 1/2 1 1 0.5107 0.0287 16 Matarbari 1/3 1/3 1/3 1/3 1/3 1/3 1/2 1 1 1/2 1/2 1/2 1/2 1/2 1 1 0.5107 0.0287
Source: PSMP Study Team
12.2.6 Needs of Bangladesh Through discussion with CP until the 1st screening, the priority of coal imports at port such as Chittagong, the possibility of the development of domestic coal and the development of river side sites such as Meghnaghat, Zajira, Maowa are high. Based on this information, the result of the AHP method is as follows,
APTable 12-11 Evaluation for Needs of Bangladesh
No. Site Name 1 2 3 4 5 6 7 8 9 10 11 12 13 14 15 16 Geometric Average
Level of Importance
1 Barapukuria 1 1 1 1 5 5 3 1/2 3 1 1/2 1/2 1 1 5 1 1.3622 0.0696 2 Phulbari 1 1 1 1 5 5 3 1/2 3 1 1/2 1/2 1 1 5 1 1.3622 0.0696 3 Khalaspir 1 1 1 1 5 5 3 1/2 3 1 1/2 1/2 1 1 5 1 1.3622 0.0696 4 Dighipara 1 1 1 1 5 5 3 1/2 3 1 1/2 1/2 1 1 5 1 1.3622 0.0696 5 Jamalgonj 1/5 1/5 1/5 1/5 1 1 1 1/5 1 1/4 1/5 1/5 1/3 1/3 1 1/3 0.3691 0.0188 6 Kuchima 1/5 1/5 1/5 1/5 1 1 1 1/5 1 1/4 1/5 1/5 1/3 1/3 1 1/3 0.3691 0.0188 7 Bheramara 1/3 1/3 1/3 1/3 1 1 1 1/5 1 1/4 1/5 1/5 1/3 1/3 1 1/3 0.4193 0.0214 8 Chittagong 2 2 2 2 5 5 5 1 3 3 1 1 2 2 5 3 2.3828 0.1217 9 Cox’s Bazar 1/3 1/3 1/3 1/3 1 1 1 1/3 1 1/3 1/5 1/5 1/3 1/3 2 1/3 0.4603 0.0235
10 Mongla 1 1 1 1 4 4 4 1/3 3 1 1/2 1/2 1 1 3 1 1.2737 0.0650 11 Khulna 2 2 2 2 5 5 5 1 5 2 1 1 2 2 5 4 2.4421 0.1247 12 Meghnaghat 2 2 2 2 5 5 5 1 5 2 1 1 3 3 5 3 2.5232 0.1288 13 Zajira 1 1 1 1 3 3 3 1/2 3 1 1/2 1/3 1 1 3 2 1.2603 0.0643 14 Maowa 1 1 1 1 3 3 3 1/2 3 1 1/2 1/3 1 1 3 2 1.2603 0.0643 15 Chandpur 1/5 1/5 1/5 1/5 1 1 1 1/5 1/2 1/3 1/5 1/5 1/3 1/3 1 1/2 0.3691 0.0188 16 Matarbari 1 1 1 1 3 3 3 1/3 3 1 1/4 1/3 1/2 1/2 2 1 1.0074 0.0514
Source: PSMP Study Team
12-15
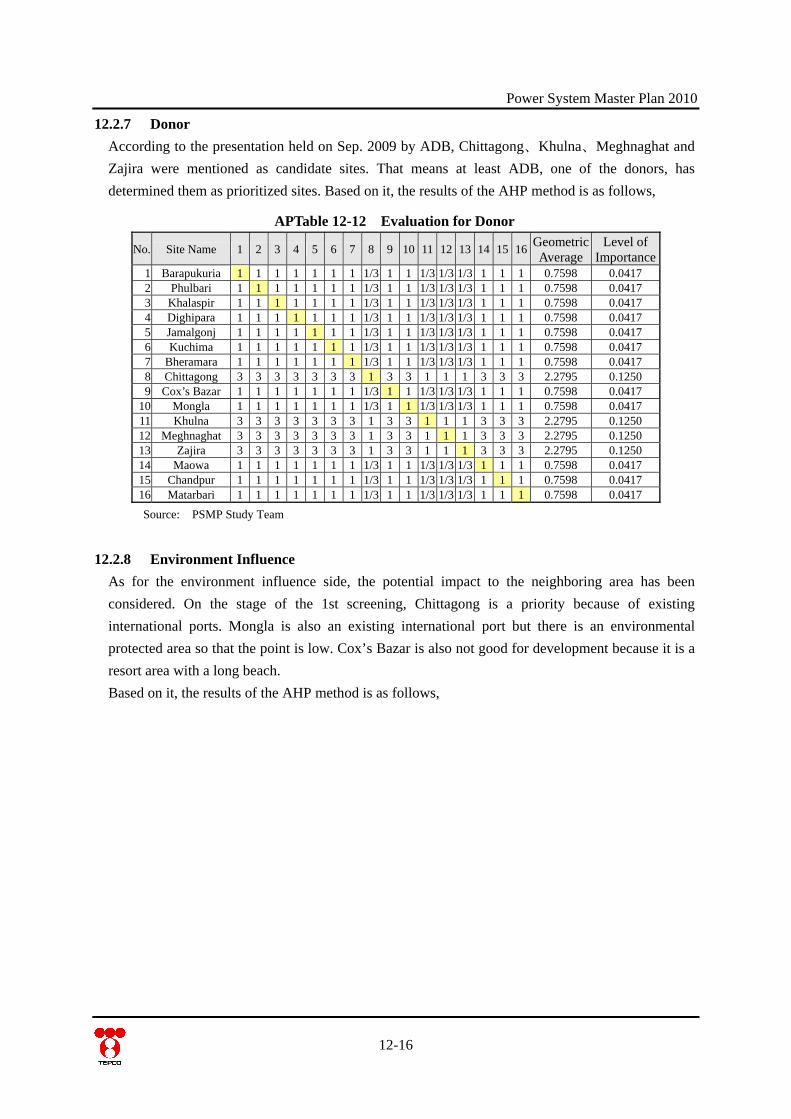
Power System Master Plan 2010
12.2.7 Donor According to the presentation held on Sep. 2009 by ADB, Chittagong、Khulna、Meghnaghat and Zajira were mentioned as candidate sites. That means at least ADB, one of the donors, has determined them as prioritized sites. Based on it, the results of the AHP method is as follows,
APTable 12-12 Evaluation for Donor
No. Site Name 1 2 3 4 5 6 7 8 9 10 11 12 13 14 15 16 Geometric Average
Level of Importance
1 Barapukuria 1 1 1 1 1 1 1 1/3 1 1 1/3 1/3 1/3 1 1 1 0.7598 0.0417 2 Phulbari 1 1 1 1 1 1 1 1/3 1 1 1/3 1/3 1/3 1 1 1 0.7598 0.0417 3 Khalaspir 1 1 1 1 1 1 1 1/3 1 1 1/3 1/3 1/3 1 1 1 0.7598 0.0417 4 Dighipara 1 1 1 1 1 1 1 1/3 1 1 1/3 1/3 1/3 1 1 1 0.7598 0.0417 5 Jamalgonj 1 1 1 1 1 1 1 1/3 1 1 1/3 1/3 1/3 1 1 1 0.7598 0.0417 6 Kuchima 1 1 1 1 1 1 1 1/3 1 1 1/3 1/3 1/3 1 1 1 0.7598 0.0417 7 Bheramara 1 1 1 1 1 1 1 1/3 1 1 1/3 1/3 1/3 1 1 1 0.7598 0.0417 8 Chittagong 3 3 3 3 3 3 3 1 3 3 1 1 1 3 3 3 2.2795 0.1250 9 Cox’s Bazar 1 1 1 1 1 1 1 1/3 1 1 1/3 1/3 1/3 1 1 1 0.7598 0.0417
10 Mongla 1 1 1 1 1 1 1 1/3 1 1 1/3 1/3 1/3 1 1 1 0.7598 0.0417 11 Khulna 3 3 3 3 3 3 3 1 3 3 1 1 1 3 3 3 2.2795 0.1250 12 Meghnaghat 3 3 3 3 3 3 3 1 3 3 1 1 1 3 3 3 2.2795 0.1250 13 Zajira 3 3 3 3 3 3 3 1 3 3 1 1 1 3 3 3 2.2795 0.1250 14 Maowa 1 1 1 1 1 1 1 1/3 1 1 1/3 1/3 1/3 1 1 1 0.7598 0.0417 15 Chandpur 1 1 1 1 1 1 1 1/3 1 1 1/3 1/3 1/3 1 1 1 0.7598 0.0417 16 Matarbari 1 1 1 1 1 1 1 1/3 1 1 1/3 1/3 1/3 1 1 1 0.7598 0.0417
Source: PSMP Study Team
12.2.8 Environment Influence As for the environment influence side, the potential impact to the neighboring area has been considered. On the stage of the 1st screening, Chittagong is a priority because of existing international ports. Mongla is also an existing international port but there is an environmental protected area so that the point is low. Cox’s Bazar is also not good for development because it is a resort area with a long beach. Based on it, the results of the AHP method is as follows,
12-16
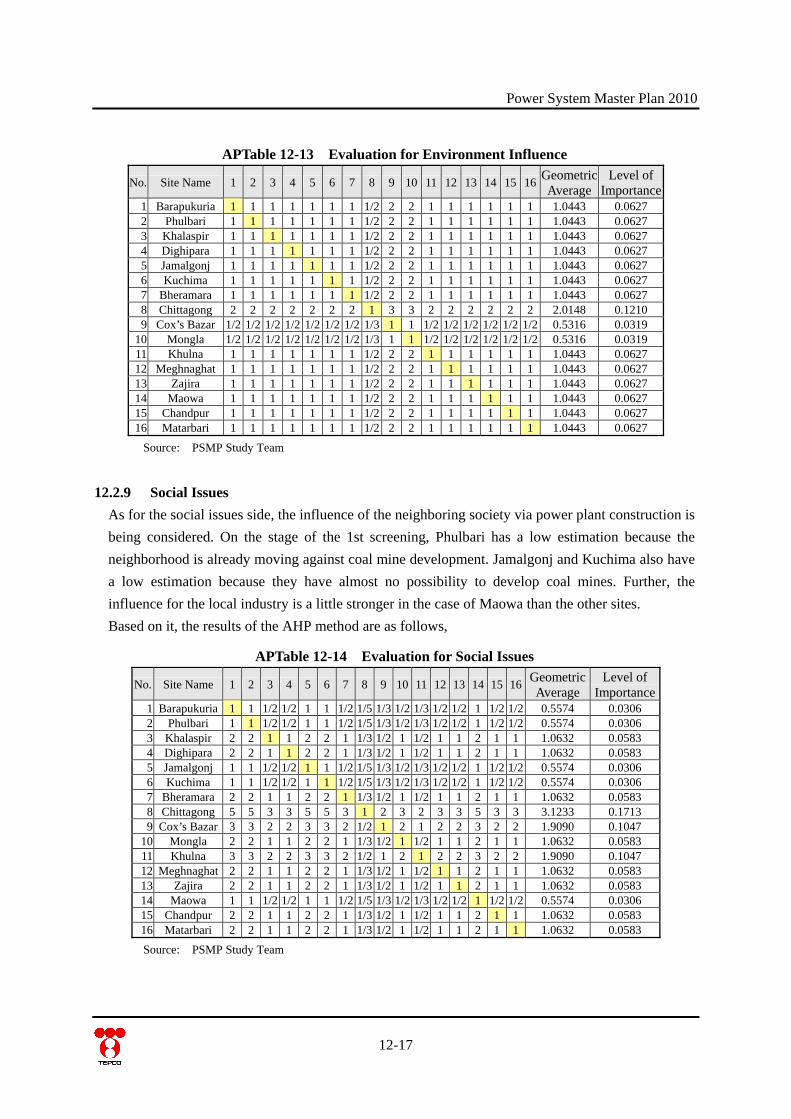
Power System Master Plan 2010
APTable 12-13 Evaluation for Environment Influence
No. Site Name 1 2 3 4 5 6 7 8 9 10 11 12 13 14 15 16 Geometric Average
Level of Importance
1 Barapukuria 1 1 1 1 1 1 1 1/2 2 2 1 1 1 1 1 1 1.0443 0.0627 2 Phulbari 1 1 1 1 1 1 1 1/2 2 2 1 1 1 1 1 1 1.0443 0.0627 3 Khalaspir 1 1 1 1 1 1 1 1/2 2 2 1 1 1 1 1 1 1.0443 0.0627 4 Dighipara 1 1 1 1 1 1 1 1/2 2 2 1 1 1 1 1 1 1.0443 0.0627 5 Jamalgonj 1 1 1 1 1 1 1 1/2 2 2 1 1 1 1 1 1 1.0443 0.0627 6 Kuchima 1 1 1 1 1 1 1 1/2 2 2 1 1 1 1 1 1 1.0443 0.0627 7 Bheramara 1 1 1 1 1 1 1 1/2 2 2 1 1 1 1 1 1 1.0443 0.0627 8 Chittagong 2 2 2 2 2 2 2 1 3 3 2 2 2 2 2 2 2.0148 0.1210 9 Cox’s Bazar 1/2 1/2 1/2 1/2 1/2 1/2 1/2 1/3 1 1 1/2 1/2 1/2 1/2 1/2 1/2 0.5316 0.0319
10 Mongla 1/2 1/2 1/2 1/2 1/2 1/2 1/2 1/3 1 1 1/2 1/2 1/2 1/2 1/2 1/2 0.5316 0.0319 11 Khulna 1 1 1 1 1 1 1 1/2 2 2 1 1 1 1 1 1 1.0443 0.0627 12 Meghnaghat 1 1 1 1 1 1 1 1/2 2 2 1 1 1 1 1 1 1.0443 0.0627 13 Zajira 1 1 1 1 1 1 1 1/2 2 2 1 1 1 1 1 1 1.0443 0.0627 14 Maowa 1 1 1 1 1 1 1 1/2 2 2 1 1 1 1 1 1 1.0443 0.0627 15 Chandpur 1 1 1 1 1 1 1 1/2 2 2 1 1 1 1 1 1 1.0443 0.0627 16 Matarbari 1 1 1 1 1 1 1 1/2 2 2 1 1 1 1 1 1 1.0443 0.0627
Source: PSMP Study Team
12.2.9 Social Issues As for the social issues side, the influence of the neighboring society via power plant construction is being considered. On the stage of the 1st screening, Phulbari has a low estimation because the neighborhood is already moving against coal mine development. Jamalgonj and Kuchima also have a low estimation because they have almost no possibility to develop coal mines. Further, the influence for the local industry is a little stronger in the case of Maowa than the other sites. Based on it, the results of the AHP method are as follows,
APTable 12-14 Evaluation for Social Issues
No. Site Name 1 2 3 4 5 6 7 8 9 10 11 12 13 14 15 16 Geometric Average
Level of Importance
1 Barapukuria 1 1 1/2 1/2 1 1 1/2 1/5 1/3 1/2 1/3 1/2 1/2 1 1/2 1/2 0.5574 0.0306 2 Phulbari 1 1 1/2 1/2 1 1 1/2 1/5 1/3 1/2 1/3 1/2 1/2 1 1/2 1/2 0.5574 0.0306 3 Khalaspir 2 2 1 1 2 2 1 1/3 1/2 1 1/2 1 1 2 1 1 1.0632 0.0583 4 Dighipara 2 2 1 1 2 2 1 1/3 1/2 1 1/2 1 1 2 1 1 1.0632 0.0583 5 Jamalgonj 1 1 1/2 1/2 1 1 1/2 1/5 1/3 1/2 1/3 1/2 1/2 1 1/2 1/2 0.5574 0.0306 6 Kuchima 1 1 1/2 1/2 1 1 1/2 1/5 1/3 1/2 1/3 1/2 1/2 1 1/2 1/2 0.5574 0.0306 7 Bheramara 2 2 1 1 2 2 1 1/3 1/2 1 1/2 1 1 2 1 1 1.0632 0.0583 8 Chittagong 5 5 3 3 5 5 3 1 2 3 2 3 3 5 3 3 3.1233 0.1713 9 Cox’s Bazar 3 3 2 2 3 3 2 1/2 1 2 1 2 2 3 2 2 1.9090 0.1047
10 Mongla 2 2 1 1 2 2 1 1/3 1/2 1 1/2 1 1 2 1 1 1.0632 0.0583 11 Khulna 3 3 2 2 3 3 2 1/2 1 2 1 2 2 3 2 2 1.9090 0.1047 12 Meghnaghat 2 2 1 1 2 2 1 1/3 1/2 1 1/2 1 1 2 1 1 1.0632 0.0583 13 Zajira 2 2 1 1 2 2 1 1/3 1/2 1 1/2 1 1 2 1 1 1.0632 0.0583 14 Maowa 1 1 1/2 1/2 1 1 1/2 1/5 1/3 1/2 1/3 1/2 1/2 1 1/2 1/2 0.5574 0.0306 15 Chandpur 2 2 1 1 2 2 1 1/3 1/2 1 1/2 1 1 2 1 1 1.0632 0.0583 16 Matarbari 2 2 1 1 2 2 1 1/3 1/2 1 1/2 1 1 2 1 1 1.0632 0.0583
Source: PSMP Study Team
12-17
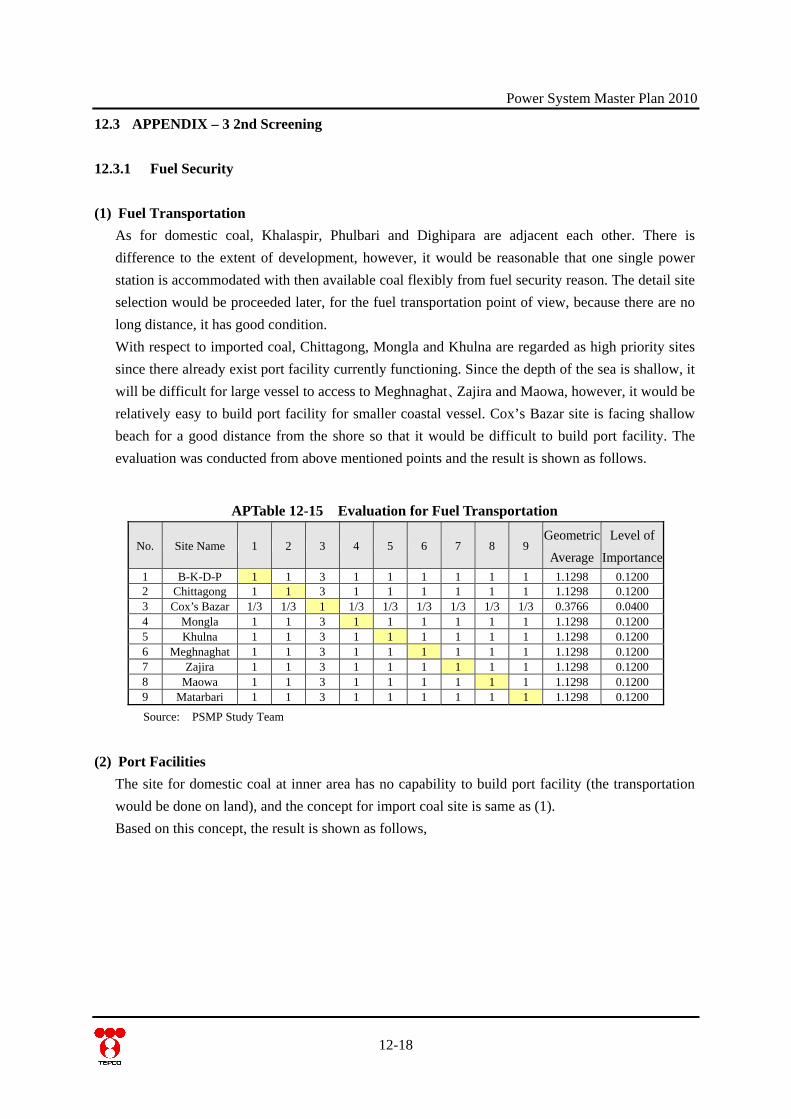
Power System Master Plan 2010
12.3 APPENDIX – 3 2nd Screening
12.3.1 Fuel Security
(1) Fuel Transportation As for domestic coal, Khalaspir, Phulbari and Dighipara are adjacent each other. There is difference to the extent of development, however, it would be reasonable that one single power station is accommodated with then available coal flexibly from fuel security reason. The detail site selection would be proceeded later, for the fuel transportation point of view, because there are no long distance, it has good condition. With respect to imported coal, Chittagong, Mongla and Khulna are regarded as high priority sites since there already exist port facility currently functioning. Since the depth of the sea is shallow, it will be difficult for large vessel to access to Meghnaghat、Zajira and Maowa, however, it would be relatively easy to build port facility for smaller coastal vessel. Cox’s Bazar site is facing shallow beach for a good distance from the shore so that it would be difficult to build port facility. The evaluation was conducted from above mentioned points and the result is shown as follows.
APTable 12-15 Evaluation for Fuel Transportation
No. Site Name 1 2 3 4 5 6 7 8 9 Geometric
Average
Level of
Importance1 B-K-D-P 1 1 3 1 1 1 1 1 1 1.1298 0.1200 2 Chittagong 1 1 3 1 1 1 1 1 1 1.1298 0.1200 3 Cox’s Bazar 1/3 1/3 1 1/3 1/3 1/3 1/3 1/3 1/3 0.3766 0.0400 4 Mongla 1 1 3 1 1 1 1 1 1 1.1298 0.1200 5 Khulna 1 1 3 1 1 1 1 1 1 1.1298 0.1200 6 Meghnaghat 1 1 3 1 1 1 1 1 1 1.1298 0.1200 7 Zajira 1 1 3 1 1 1 1 1 1 1.1298 0.1200 8 Maowa 1 1 3 1 1 1 1 1 1 1.1298 0.1200 9 Matarbari 1 1 3 1 1 1 1 1 1 1.1298 0.1200
Source: PSMP Study Team
(2) Port Facilities The site for domestic coal at inner area has no capability to build port facility (the transportation would be done on land), and the concept for import coal site is same as (1). Based on this concept, the result is shown as follows,
12-18
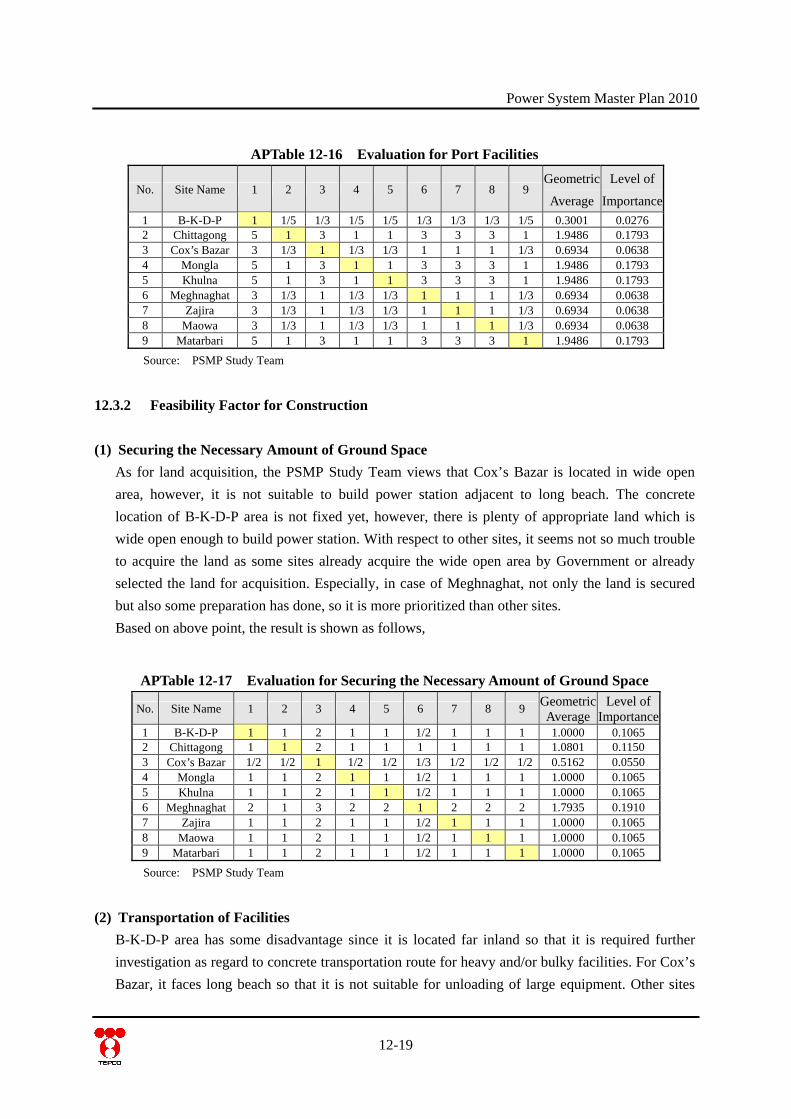
Power System Master Plan 2010
APTable 12-16 Evaluation for Port Facilities
No. Site Name 1 2 3 4 5 6 7 8 9 Geometric
Average
Level of
Importance1 B-K-D-P 1 1/5 1/3 1/5 1/5 1/3 1/3 1/3 1/5 0.3001 0.0276 2 Chittagong 5 1 3 1 1 3 3 3 1 1.9486 0.1793 3 Cox’s Bazar 3 1/3 1 1/3 1/3 1 1 1 1/3 0.6934 0.0638 4 Mongla 5 1 3 1 1 3 3 3 1 1.9486 0.1793 5 Khulna 5 1 3 1 1 3 3 3 1 1.9486 0.1793 6 Meghnaghat 3 1/3 1 1/3 1/3 1 1 1 1/3 0.6934 0.0638 7 Zajira 3 1/3 1 1/3 1/3 1 1 1 1/3 0.6934 0.0638 8 Maowa 3 1/3 1 1/3 1/3 1 1 1 1/3 0.6934 0.0638 9 Matarbari 5 1 3 1 1 3 3 3 1 1.9486 0.1793
Source: PSMP Study Team
12.3.2 Feasibility Factor for Construction
(1) Securing the Necessary Amount of Ground Space As for land acquisition, the PSMP Study Team views that Cox’s Bazar is located in wide open area, however, it is not suitable to build power station adjacent to long beach. The concrete location of B-K-D-P area is not fixed yet, however, there is plenty of appropriate land which is wide open enough to build power station. With respect to other sites, it seems not so much trouble to acquire the land as some sites already acquire the wide open area by Government or already selected the land for acquisition. Especially, in case of Meghnaghat, not only the land is secured but also some preparation has done, so it is more prioritized than other sites. Based on above point, the result is shown as follows,
APTable 12-17 Evaluation for Securing the Necessary Amount of Ground Space
No. Site Name 1 2 3 4 5 6 7 8 9 Geometric Average
Level of Importance
1 B-K-D-P 1 1 2 1 1 1/2 1 1 1 1.0000 0.1065 2 Chittagong 1 1 2 1 1 1 1 1 1 1.0801 0.1150 3 Cox’s Bazar 1/2 1/2 1 1/2 1/2 1/3 1/2 1/2 1/2 0.5162 0.0550 4 Mongla 1 1 2 1 1 1/2 1 1 1 1.0000 0.1065 5 Khulna 1 1 2 1 1 1/2 1 1 1 1.0000 0.1065 6 Meghnaghat 2 1 3 2 2 1 2 2 2 1.7935 0.1910 7 Zajira 1 1 2 1 1 1/2 1 1 1 1.0000 0.1065 8 Maowa 1 1 2 1 1 1/2 1 1 1 1.0000 0.1065 9 Matarbari 1 1 2 1 1 1/2 1 1 1 1.0000 0.1065
Source: PSMP Study Team
(2) Transportation of Facilities B-K-D-P area has some disadvantage since it is located far inland so that it is required further investigation as regard to concrete transportation route for heavy and/or bulky facilities. For Cox’s Bazar, it faces long beach so that it is not suitable for unloading of large equipment. Other sites
12-19
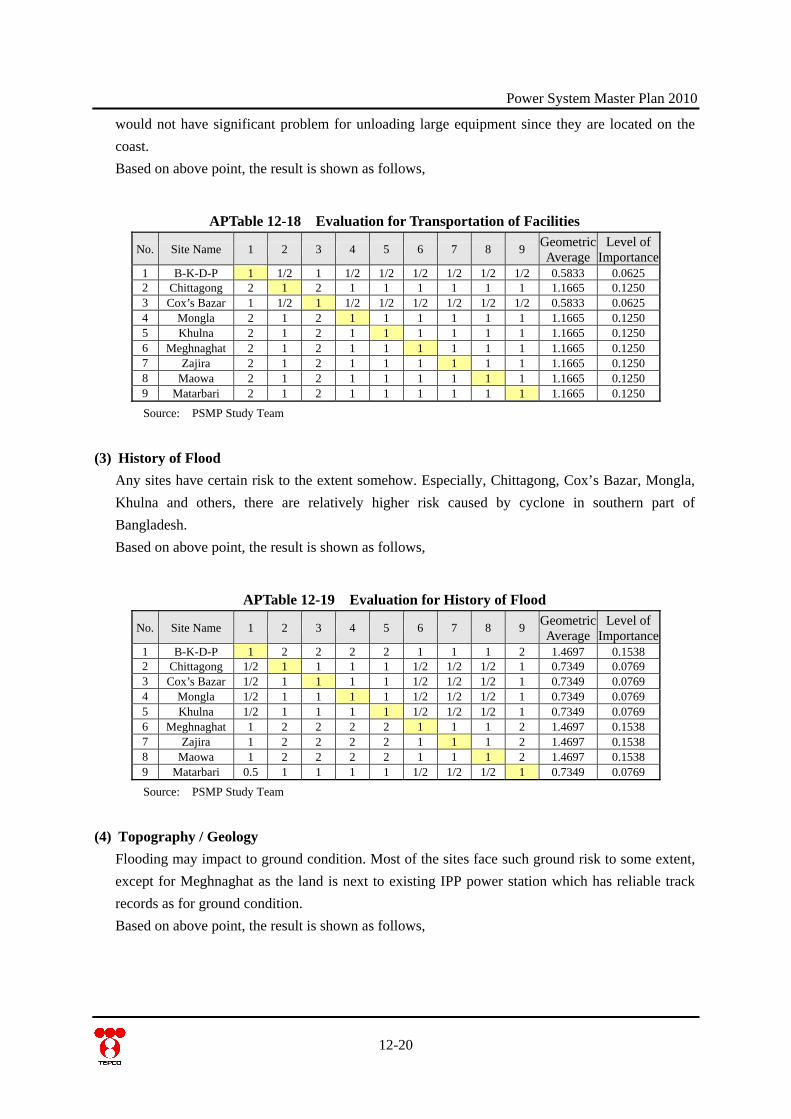
Power System Master Plan 2010
would not have significant problem for unloading large equipment since they are located on the coast. Based on above point, the result is shown as follows,
APTable 12-18 Evaluation for Transportation of Facilities
No. Site Name 1 2 3 4 5 6 7 8 9 Geometric Average
Level of Importance
1 B-K-D-P 1 1/2 1 1/2 1/2 1/2 1/2 1/2 1/2 0.5833 0.0625 2 Chittagong 2 1 2 1 1 1 1 1 1 1.1665 0.1250 3 Cox’s Bazar 1 1/2 1 1/2 1/2 1/2 1/2 1/2 1/2 0.5833 0.0625 4 Mongla 2 1 2 1 1 1 1 1 1 1.1665 0.1250 5 Khulna 2 1 2 1 1 1 1 1 1 1.1665 0.1250 6 Meghnaghat 2 1 2 1 1 1 1 1 1 1.1665 0.1250 7 Zajira 2 1 2 1 1 1 1 1 1 1.1665 0.1250 8 Maowa 2 1 2 1 1 1 1 1 1 1.1665 0.1250 9 Matarbari 2 1 2 1 1 1 1 1 1 1.1665 0.1250
Source: PSMP Study Team
(3) History of Flood Any sites have certain risk to the extent somehow. Especially, Chittagong, Cox’s Bazar, Mongla, Khulna and others, there are relatively higher risk caused by cyclone in southern part of Bangladesh. Based on above point, the result is shown as follows,
APTable 12-19 Evaluation for History of Flood
No. Site Name 1 2 3 4 5 6 7 8 9 Geometric Average
Level of Importance
1 B-K-D-P 1 2 2 2 2 1 1 1 2 1.4697 0.1538 2 Chittagong 1/2 1 1 1 1 1/2 1/2 1/2 1 0.7349 0.0769 3 Cox’s Bazar 1/2 1 1 1 1 1/2 1/2 1/2 1 0.7349 0.0769 4 Mongla 1/2 1 1 1 1 1/2 1/2 1/2 1 0.7349 0.0769 5 Khulna 1/2 1 1 1 1 1/2 1/2 1/2 1 0.7349 0.0769 6 Meghnaghat 1 2 2 2 2 1 1 1 2 1.4697 0.1538 7 Zajira 1 2 2 2 2 1 1 1 2 1.4697 0.1538 8 Maowa 1 2 2 2 2 1 1 1 2 1.4697 0.1538 9 Matarbari 0.5 1 1 1 1 1/2 1/2 1/2 1 0.7349 0.0769
Source: PSMP Study Team
(4) Topography / Geology Flooding may impact to ground condition. Most of the sites face such ground risk to some extent, except for Meghnaghat as the land is next to existing IPP power station which has reliable track records as for ground condition. Based on above point, the result is shown as follows,
12-20
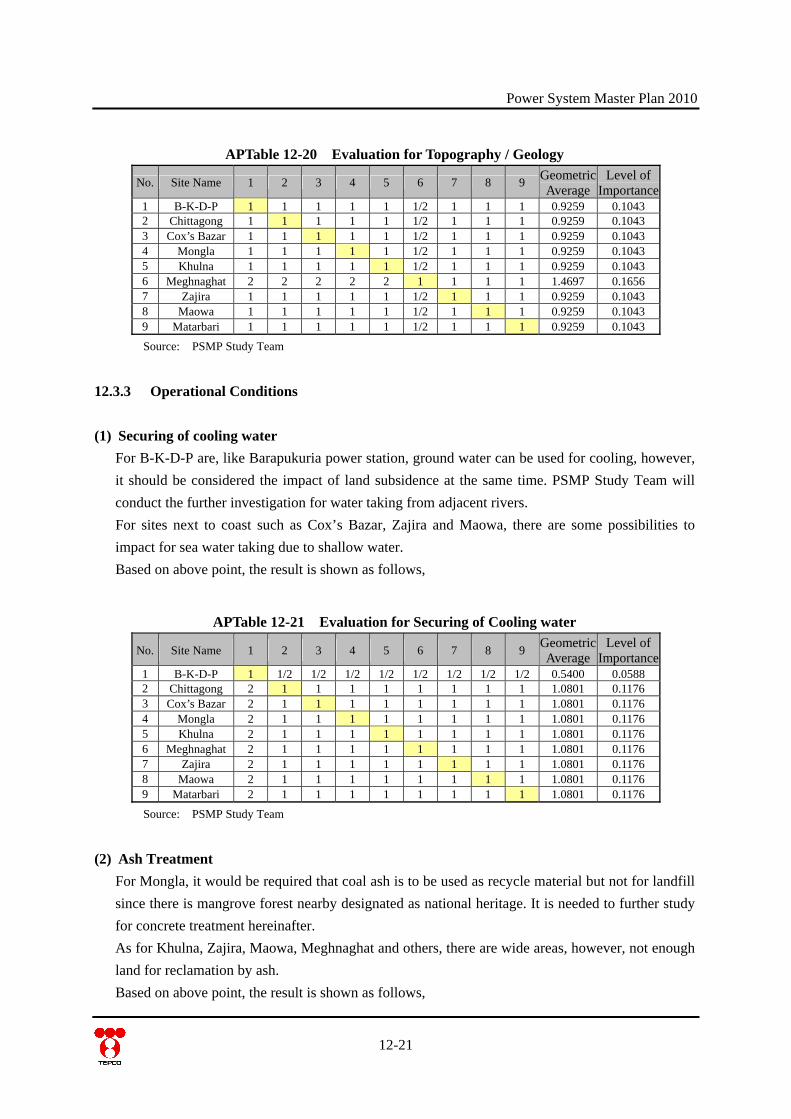
Power System Master Plan 2010
APTable 12-20 Evaluation for Topography / Geology
No. Site Name 1 2 3 4 5 6 7 8 9 Geometric Average
Level of Importance
1 B-K-D-P 1 1 1 1 1 1/2 1 1 1 0.9259 0.1043 2 Chittagong 1 1 1 1 1 1/2 1 1 1 0.9259 0.1043 3 Cox’s Bazar 1 1 1 1 1 1/2 1 1 1 0.9259 0.1043 4 Mongla 1 1 1 1 1 1/2 1 1 1 0.9259 0.1043 5 Khulna 1 1 1 1 1 1/2 1 1 1 0.9259 0.1043 6 Meghnaghat 2 2 2 2 2 1 1 1 1 1.4697 0.1656 7 Zajira 1 1 1 1 1 1/2 1 1 1 0.9259 0.1043 8 Maowa 1 1 1 1 1 1/2 1 1 1 0.9259 0.1043 9 Matarbari 1 1 1 1 1 1/2 1 1 1 0.9259 0.1043
Source: PSMP Study Team
12.3.3 Operational Conditions
(1) Securing of cooling water For B-K-D-P are, like Barapukuria power station, ground water can be used for cooling, however, it should be considered the impact of land subsidence at the same time. PSMP Study Team will conduct the further investigation for water taking from adjacent rivers. For sites next to coast such as Cox’s Bazar, Zajira and Maowa, there are some possibilities to impact for sea water taking due to shallow water. Based on above point, the result is shown as follows,
APTable 12-21 Evaluation for Securing of Cooling water
No. Site Name 1 2 3 4 5 6 7 8 9 Geometric Average
Level of Importance
1 B-K-D-P 1 1/2 1/2 1/2 1/2 1/2 1/2 1/2 1/2 0.5400 0.0588 2 Chittagong 2 1 1 1 1 1 1 1 1 1.0801 0.1176 3 Cox’s Bazar 2 1 1 1 1 1 1 1 1 1.0801 0.1176 4 Mongla 2 1 1 1 1 1 1 1 1 1.0801 0.1176 5 Khulna 2 1 1 1 1 1 1 1 1 1.0801 0.1176 6 Meghnaghat 2 1 1 1 1 1 1 1 1 1.0801 0.1176 7 Zajira 2 1 1 1 1 1 1 1 1 1.0801 0.1176 8 Maowa 2 1 1 1 1 1 1 1 1 1.0801 0.1176 9 Matarbari 2 1 1 1 1 1 1 1 1 1.0801 0.1176
Source: PSMP Study Team
(2) Ash Treatment For Mongla, it would be required that coal ash is to be used as recycle material but not for landfill since there is mangrove forest nearby designated as national heritage. It is needed to further study for concrete treatment hereinafter. As for Khulna, Zajira, Maowa, Meghnaghat and others, there are wide areas, however, not enough land for reclamation by ash. Based on above point, the result is shown as follows,
12-21
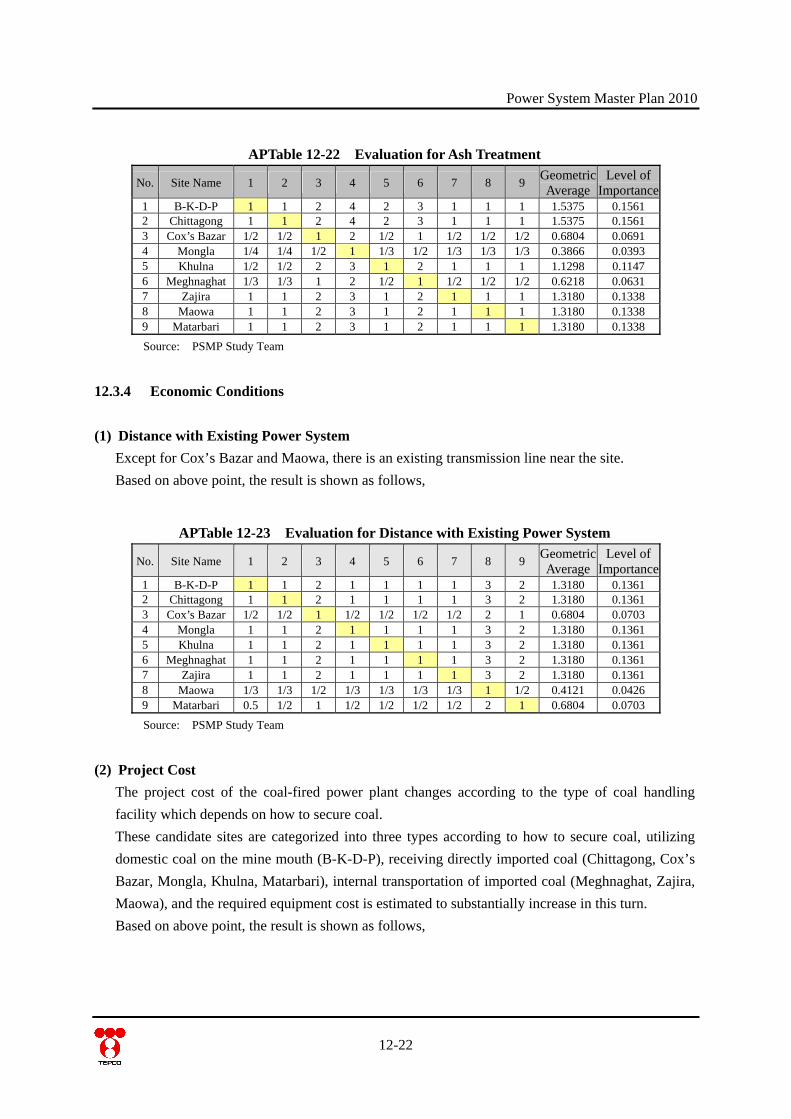
Power System Master Plan 2010
APTable 12-22 Evaluation for Ash Treatment
No. Site Name 1 2 3 4 5 6 7 8 9 Geometric Average
Level of Importance
1 B-K-D-P 1 1 2 4 2 3 1 1 1 1.5375 0.1561 2 Chittagong 1 1 2 4 2 3 1 1 1 1.5375 0.1561 3 Cox’s Bazar 1/2 1/2 1 2 1/2 1 1/2 1/2 1/2 0.6804 0.0691 4 Mongla 1/4 1/4 1/2 1 1/3 1/2 1/3 1/3 1/3 0.3866 0.0393 5 Khulna 1/2 1/2 2 3 1 2 1 1 1 1.1298 0.1147 6 Meghnaghat 1/3 1/3 1 2 1/2 1 1/2 1/2 1/2 0.6218 0.0631 7 Zajira 1 1 2 3 1 2 1 1 1 1.3180 0.1338 8 Maowa 1 1 2 3 1 2 1 1 1 1.3180 0.1338 9 Matarbari 1 1 2 3 1 2 1 1 1 1.3180 0.1338
Source: PSMP Study Team
12.3.4 Economic Conditions
(1) Distance with Existing Power System Except for Cox’s Bazar and Maowa, there is an existing transmission line near the site. Based on above point, the result is shown as follows,
APTable 12-23 Evaluation for Distance with Existing Power System
No. Site Name 1 2 3 4 5 6 7 8 9 Geometric Average
Level of Importance
1 B-K-D-P 1 1 2 1 1 1 1 3 2 1.3180 0.1361 2 Chittagong 1 1 2 1 1 1 1 3 2 1.3180 0.1361 3 Cox’s Bazar 1/2 1/2 1 1/2 1/2 1/2 1/2 2 1 0.6804 0.0703 4 Mongla 1 1 2 1 1 1 1 3 2 1.3180 0.1361 5 Khulna 1 1 2 1 1 1 1 3 2 1.3180 0.1361 6 Meghnaghat 1 1 2 1 1 1 1 3 2 1.3180 0.1361 7 Zajira 1 1 2 1 1 1 1 3 2 1.3180 0.1361 8 Maowa 1/3 1/3 1/2 1/3 1/3 1/3 1/3 1 1/2 0.4121 0.0426 9 Matarbari 0.5 1/2 1 1/2 1/2 1/2 1/2 2 1 0.6804 0.0703
Source: PSMP Study Team
(2) Project Cost The project cost of the coal-fired power plant changes according to the type of coal handling facility which depends on how to secure coal. These candidate sites are categorized into three types according to how to secure coal, utilizing domestic coal on the mine mouth (B-K-D-P), receiving directly imported coal (Chittagong, Cox’s Bazar, Mongla, Khulna, Matarbari), internal transportation of imported coal (Meghnaghat, Zajira, Maowa), and the required equipment cost is estimated to substantially increase in this turn. Based on above point, the result is shown as follows,
12-22
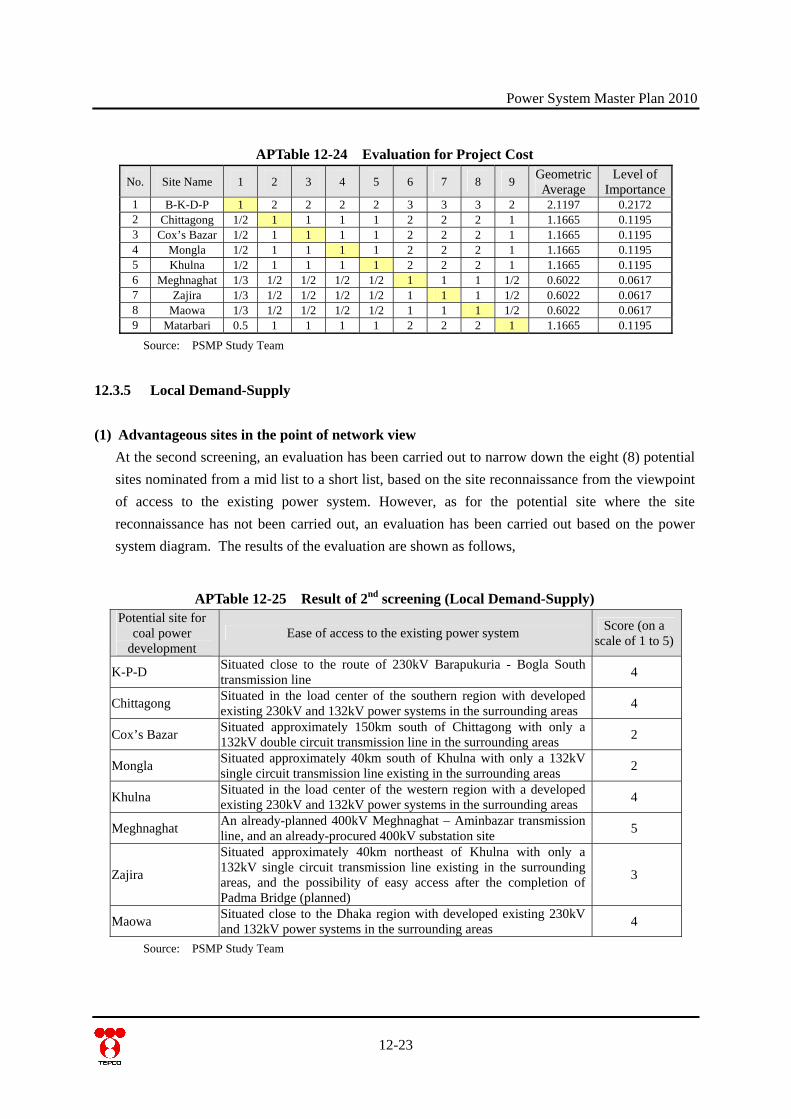
Power System Master Plan 2010
APTable 12-24 Evaluation for Project Cost
No. Site Name 1 2 3 4 5 6 7 8 9 Geometric Average
Level of Importance
1 B-K-D-P 1 2 2 2 2 3 3 3 2 2.1197 0.2172 2 Chittagong 1/2 1 1 1 1 2 2 2 1 1.1665 0.1195 3 Cox’s Bazar 1/2 1 1 1 1 2 2 2 1 1.1665 0.1195 4 Mongla 1/2 1 1 1 1 2 2 2 1 1.1665 0.1195 5 Khulna 1/2 1 1 1 1 2 2 2 1 1.1665 0.1195 6 Meghnaghat 1/3 1/2 1/2 1/2 1/2 1 1 1 1/2 0.6022 0.0617 7 Zajira 1/3 1/2 1/2 1/2 1/2 1 1 1 1/2 0.6022 0.0617 8 Maowa 1/3 1/2 1/2 1/2 1/2 1 1 1 1/2 0.6022 0.0617 9 Matarbari 0.5 1 1 1 1 2 2 2 1 1.1665 0.1195
Source: PSMP Study Team
12.3.5 Local Demand-Supply
(1) Advantageous sites in the point of network view At the second screening, an evaluation has been carried out to narrow down the eight (8) potential sites nominated from a mid list to a short list, based on the site reconnaissance from the viewpoint of access to the existing power system. However, as for the potential site where the site reconnaissance has not been carried out, an evaluation has been carried out based on the power system diagram. The results of the evaluation are shown as follows,
APTable 12-25 Result of 2nd screening (Local Demand-Supply) Potential site for
coal power development
Ease of access to the existing power system Score (on a scale of 1 to 5)
K-P-D Situated close to the route of 230kV Barapukuria - Bogla South transmission line 4
Chittagong Situated in the load center of the southern region with developed existing 230kV and 132kV power systems in the surrounding areas 4
Cox’s Bazar Situated approximately 150km south of Chittagong with only a 132kV double circuit transmission line in the surrounding areas 2
Mongla Situated approximately 40km south of Khulna with only a 132kV single circuit transmission line existing in the surrounding areas 2
Khulna Situated in the load center of the western region with a developed existing 230kV and 132kV power systems in the surrounding areas 4
Meghnaghat An already-planned 400kV Meghnaghat – Aminbazar transmission line, and an already-procured 400kV substation site 5
Zajira
Situated approximately 40km northeast of Khulna with only a 132kV single circuit transmission line existing in the surrounding areas, and the possibility of easy access after the completion of Padma Bridge (planned)
3
Maowa Situated close to the Dhaka region with developed existing 230kV and 132kV power systems in the surrounding areas 4
Source: PSMP Study Team
12-23
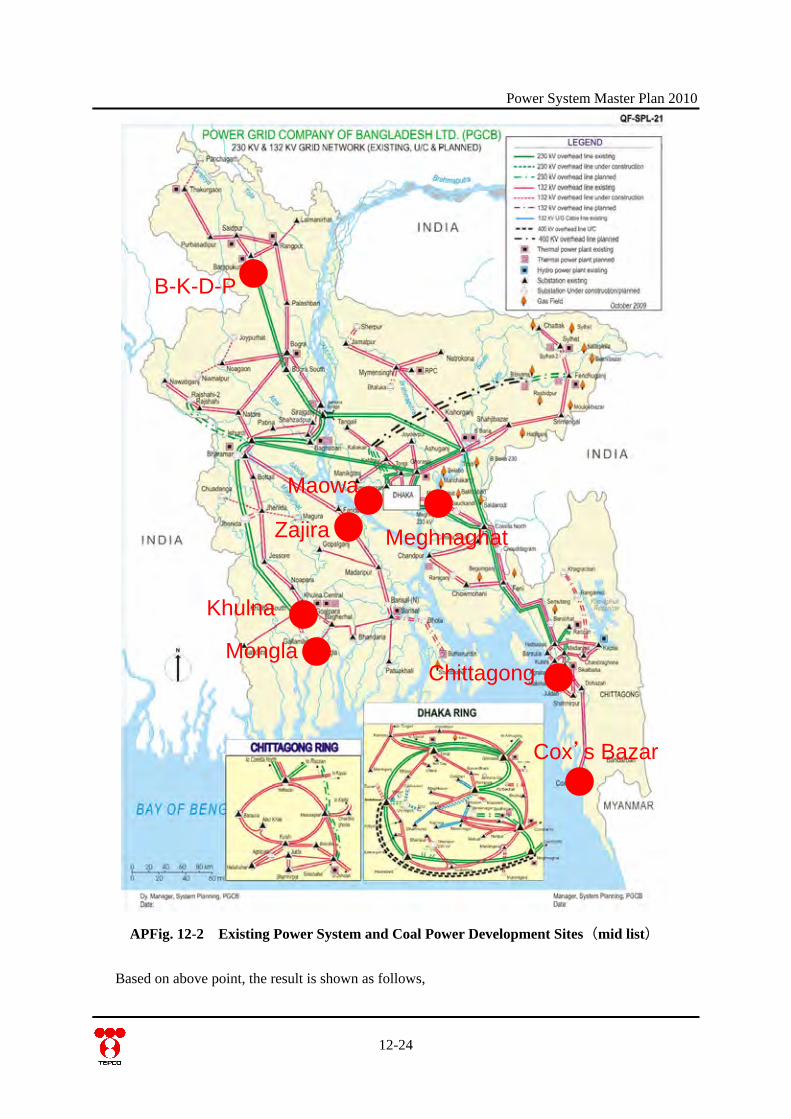
Power System Master Plan 2010
B-K-D-P
Maowa
Meghnaghat
Chittagong
Khulna
Mongla
Zajira
Cox’s Bazar
APFig. 12-2 Existing Power System and Coal Power Development Sites(mid list)
Based on above point, the result is shown as follows,
12-24
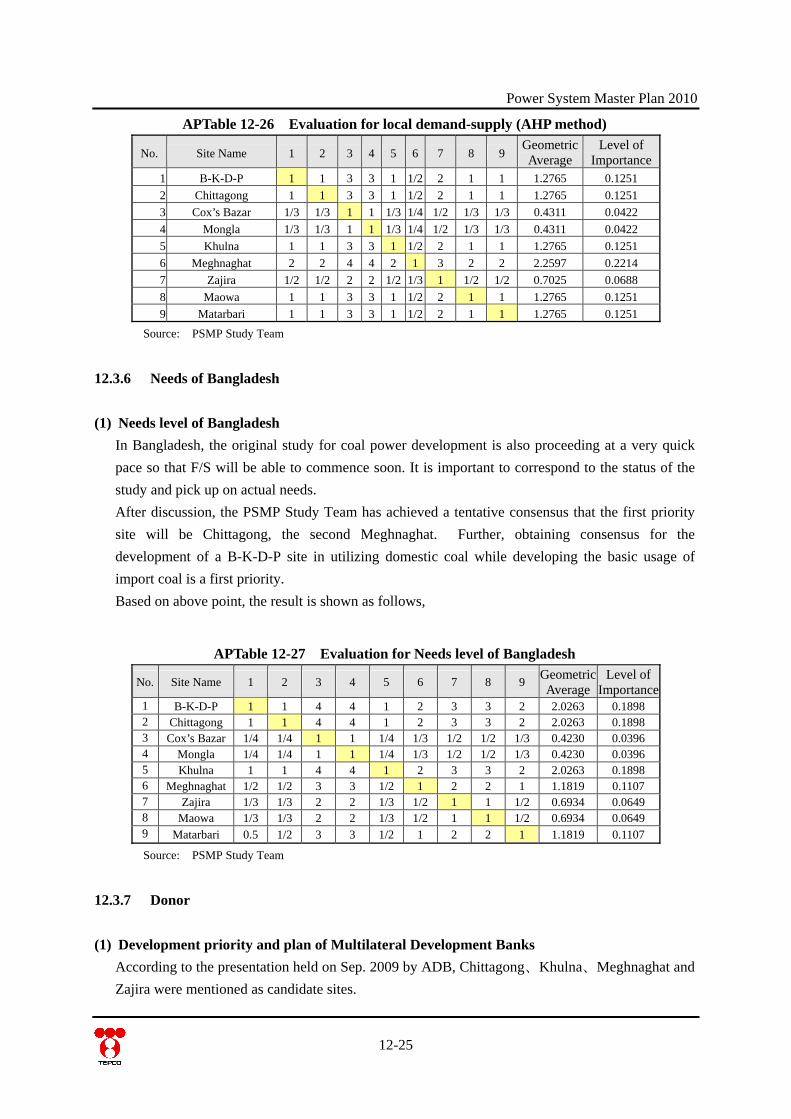
Power System Master Plan 2010
APTable 12-26 Evaluation for local demand-supply (AHP method)
No. Site Name 1 2 3 4 5 6 7 8 9 Geometric Average
Level of Importance
1 B-K-D-P 1 1 3 3 1 1/2 2 1 1 1.2765 0.1251 2 Chittagong 1 1 3 3 1 1/2 2 1 1 1.2765 0.1251 3 Cox’s Bazar 1/3 1/3 1 1 1/3 1/4 1/2 1/3 1/3 0.4311 0.0422 4 Mongla 1/3 1/3 1 1 1/3 1/4 1/2 1/3 1/3 0.4311 0.0422 5 Khulna 1 1 3 3 1 1/2 2 1 1 1.2765 0.1251 6 Meghnaghat 2 2 4 4 2 1 3 2 2 2.2597 0.2214 7 Zajira 1/2 1/2 2 2 1/2 1/3 1 1/2 1/2 0.7025 0.0688 8 Maowa 1 1 3 3 1 1/2 2 1 1 1.2765 0.1251 9 Matarbari 1 1 3 3 1 1/2 2 1 1 1.2765 0.1251
Source: PSMP Study Team
12.3.6 Needs of Bangladesh
(1) Needs level of Bangladesh In Bangladesh, the original study for coal power development is also proceeding at a very quick pace so that F/S will be able to commence soon. It is important to correspond to the status of the study and pick up on actual needs. After discussion, the PSMP Study Team has achieved a tentative consensus that the first priority site will be Chittagong, the second Meghnaghat. Further, obtaining consensus for the development of a B-K-D-P site in utilizing domestic coal while developing the basic usage of import coal is a first priority. Based on above point, the result is shown as follows,
APTable 12-27 Evaluation for Needs level of Bangladesh
No. Site Name 1 2 3 4 5 6 7 8 9 Geometric Average
Level of Importance
1 B-K-D-P 1 1 4 4 1 2 3 3 2 2.0263 0.1898 2 Chittagong 1 1 4 4 1 2 3 3 2 2.0263 0.1898 3 Cox’s Bazar 1/4 1/4 1 1 1/4 1/3 1/2 1/2 1/3 0.4230 0.0396 4 Mongla 1/4 1/4 1 1 1/4 1/3 1/2 1/2 1/3 0.4230 0.0396 5 Khulna 1 1 4 4 1 2 3 3 2 2.0263 0.1898 6 Meghnaghat 1/2 1/2 3 3 1/2 1 2 2 1 1.1819 0.1107 7 Zajira 1/3 1/3 2 2 1/3 1/2 1 1 1/2 0.6934 0.0649 8 Maowa 1/3 1/3 2 2 1/3 1/2 1 1 1/2 0.6934 0.0649 9 Matarbari 0.5 1/2 3 3 1/2 1 2 2 1 1.1819 0.1107
Source: PSMP Study Team
12.3.7 Donor
(1) Development priority and plan of Multilateral Development Banks According to the presentation held on Sep. 2009 by ADB, Chittagong、Khulna、Meghnaghat and Zajira were mentioned as candidate sites.
12-25
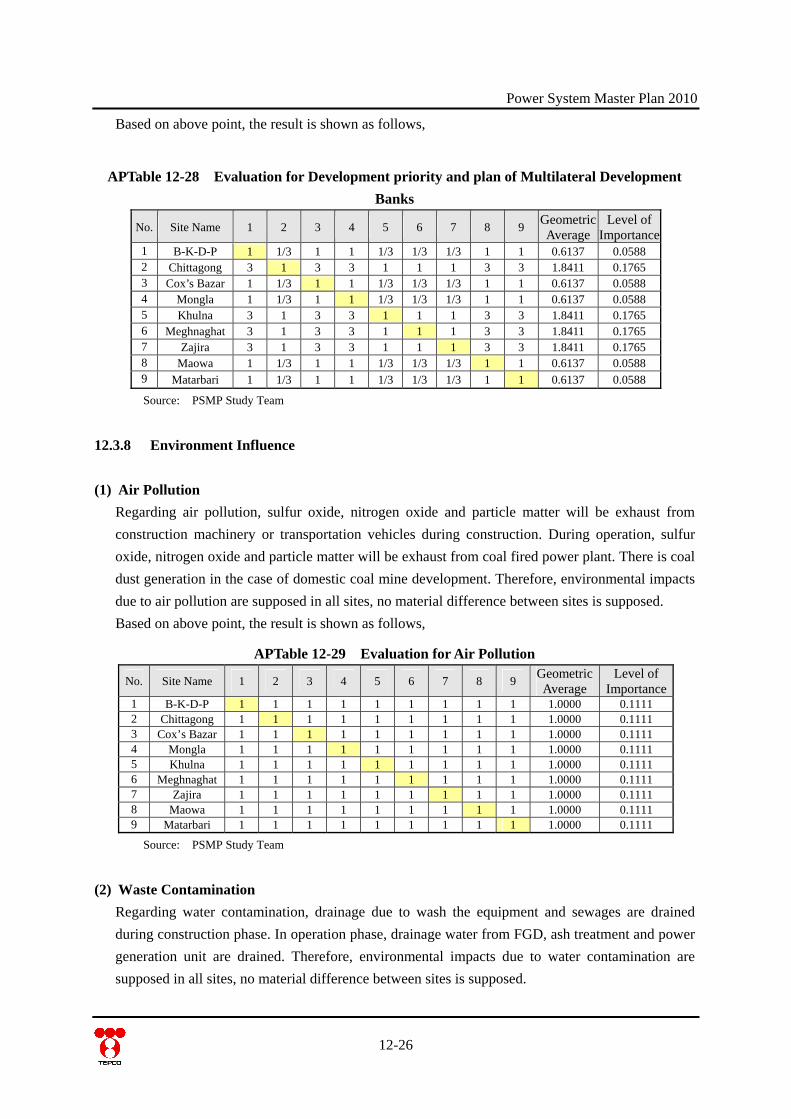
Power System Master Plan 2010
Based on above point, the result is shown as follows,
APTable 12-28 Evaluation for Development priority and plan of Multilateral Development Banks
No. Site Name 1 2 3 4 5 6 7 8 9 Geometric Average
Level of Importance
1 B-K-D-P 1 1/3 1 1 1/3 1/3 1/3 1 1 0.6137 0.0588 2 Chittagong 3 1 3 3 1 1 1 3 3 1.8411 0.1765 3 Cox’s Bazar 1 1/3 1 1 1/3 1/3 1/3 1 1 0.6137 0.0588 4 Mongla 1 1/3 1 1 1/3 1/3 1/3 1 1 0.6137 0.0588 5 Khulna 3 1 3 3 1 1 1 3 3 1.8411 0.1765 6 Meghnaghat 3 1 3 3 1 1 1 3 3 1.8411 0.1765 7 Zajira 3 1 3 3 1 1 1 3 3 1.8411 0.1765 8 Maowa 1 1/3 1 1 1/3 1/3 1/3 1 1 0.6137 0.0588 9 Matarbari 1 1/3 1 1 1/3 1/3 1/3 1 1 0.6137 0.0588
Source: PSMP Study Team
12.3.8 Environment Influence
(1) Air Pollution Regarding air pollution, sulfur oxide, nitrogen oxide and particle matter will be exhaust from construction machinery or transportation vehicles during construction. During operation, sulfur oxide, nitrogen oxide and particle matter will be exhaust from coal fired power plant. There is coal dust generation in the case of domestic coal mine development. Therefore, environmental impacts due to air pollution are supposed in all sites, no material difference between sites is supposed. Based on above point, the result is shown as follows,
APTable 12-29 Evaluation for Air Pollution
No. Site Name 1 2 3 4 5 6 7 8 9 Geometric Average
Level of Importance
1 B-K-D-P 1 1 1 1 1 1 1 1 1 1.0000 0.1111 2 Chittagong 1 1 1 1 1 1 1 1 1 1.0000 0.1111 3 Cox’s Bazar 1 1 1 1 1 1 1 1 1 1.0000 0.1111 4 Mongla 1 1 1 1 1 1 1 1 1 1.0000 0.1111 5 Khulna 1 1 1 1 1 1 1 1 1 1.0000 0.1111 6 Meghnaghat 1 1 1 1 1 1 1 1 1 1.0000 0.1111 7 Zajira 1 1 1 1 1 1 1 1 1 1.0000 0.1111 8 Maowa 1 1 1 1 1 1 1 1 1 1.0000 0.1111 9 Matarbari 1 1 1 1 1 1 1 1 1 1.0000 0.1111
Source: PSMP Study Team
(2) Waste Contamination Regarding water contamination, drainage due to wash the equipment and sewages are drained during construction phase. In operation phase, drainage water from FGD, ash treatment and power generation unit are drained. Therefore, environmental impacts due to water contamination are supposed in all sites, no material difference between sites is supposed.
12-26
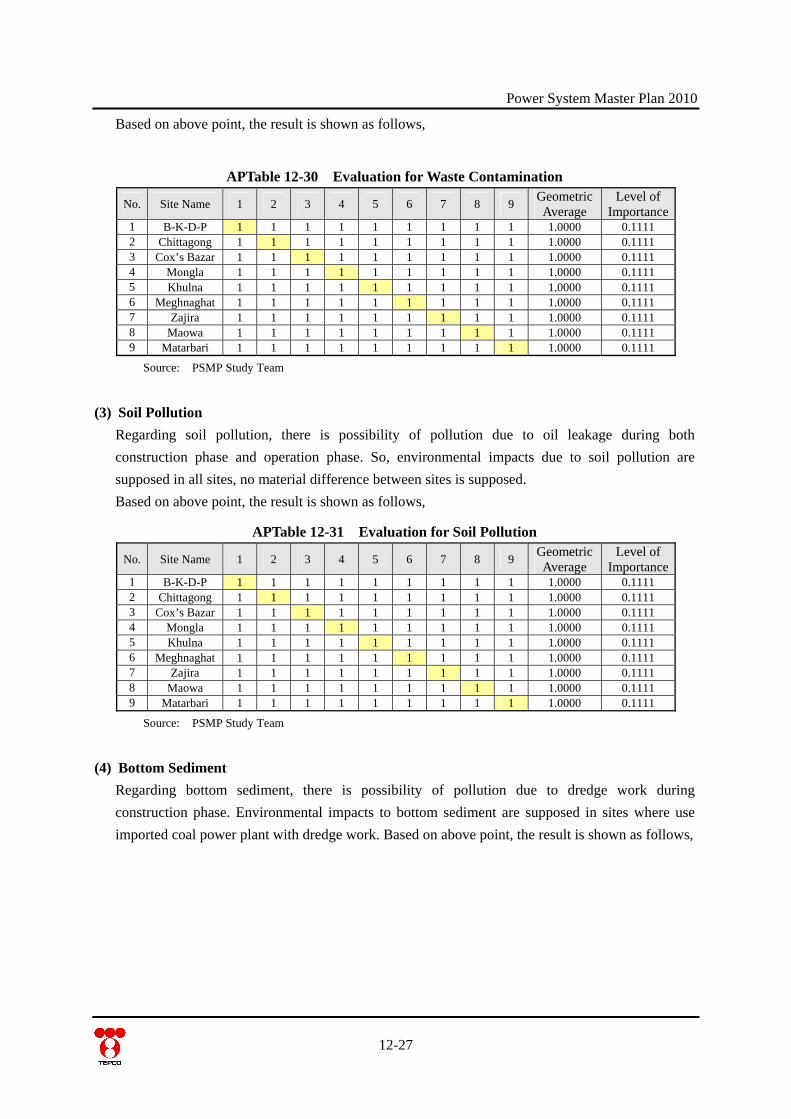
Power System Master Plan 2010
Based on above point, the result is shown as follows,
APTable 12-30 Evaluation for Waste Contamination
No. Site Name 1 2 3 4 5 6 7 8 9 Geometric Average
Level of Importance
1 B-K-D-P 1 1 1 1 1 1 1 1 1 1.0000 0.1111 2 Chittagong 1 1 1 1 1 1 1 1 1 1.0000 0.1111 3 Cox’s Bazar 1 1 1 1 1 1 1 1 1 1.0000 0.1111 4 Mongla 1 1 1 1 1 1 1 1 1 1.0000 0.1111 5 Khulna 1 1 1 1 1 1 1 1 1 1.0000 0.1111 6 Meghnaghat 1 1 1 1 1 1 1 1 1 1.0000 0.1111 7 Zajira 1 1 1 1 1 1 1 1 1 1.0000 0.1111 8 Maowa 1 1 1 1 1 1 1 1 1 1.0000 0.1111 9 Matarbari 1 1 1 1 1 1 1 1 1 1.0000 0.1111
Source: PSMP Study Team
(3) Soil Pollution Regarding soil pollution, there is possibility of pollution due to oil leakage during both construction phase and operation phase. So, environmental impacts due to soil pollution are supposed in all sites, no material difference between sites is supposed. Based on above point, the result is shown as follows,
APTable 12-31 Evaluation for Soil Pollution
No. Site Name 1 2 3 4 5 6 7 8 9 Geometric Average
Level of Importance
1 B-K-D-P 1 1 1 1 1 1 1 1 1 1.0000 0.1111 2 Chittagong 1 1 1 1 1 1 1 1 1 1.0000 0.1111 3 Cox’s Bazar 1 1 1 1 1 1 1 1 1 1.0000 0.1111 4 Mongla 1 1 1 1 1 1 1 1 1 1.0000 0.1111 5 Khulna 1 1 1 1 1 1 1 1 1 1.0000 0.1111 6 Meghnaghat 1 1 1 1 1 1 1 1 1 1.0000 0.1111 7 Zajira 1 1 1 1 1 1 1 1 1 1.0000 0.1111 8 Maowa 1 1 1 1 1 1 1 1 1 1.0000 0.1111 9 Matarbari 1 1 1 1 1 1 1 1 1 1.0000 0.1111
Source: PSMP Study Team
(4) Bottom Sediment Regarding bottom sediment, there is possibility of pollution due to dredge work during construction phase. Environmental impacts to bottom sediment are supposed in sites where use imported coal power plant with dredge work. Based on above point, the result is shown as follows,
12-27
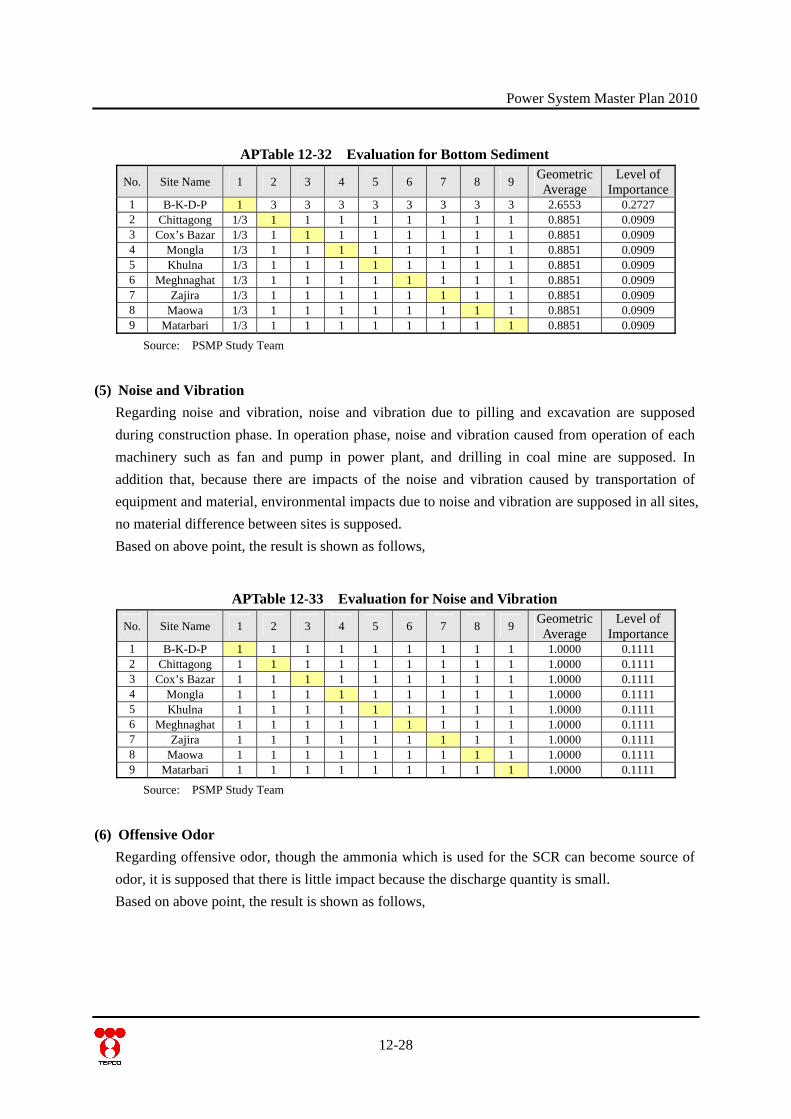
Power System Master Plan 2010
APTable 12-32 Evaluation for Bottom Sediment
No. Site Name 1 2 3 4 5 6 7 8 9 Geometric Average
Level of Importance
1 B-K-D-P 1 3 3 3 3 3 3 3 3 2.6553 0.2727 2 Chittagong 1/3 1 1 1 1 1 1 1 1 0.8851 0.0909 3 Cox’s Bazar 1/3 1 1 1 1 1 1 1 1 0.8851 0.0909 4 Mongla 1/3 1 1 1 1 1 1 1 1 0.8851 0.0909 5 Khulna 1/3 1 1 1 1 1 1 1 1 0.8851 0.0909 6 Meghnaghat 1/3 1 1 1 1 1 1 1 1 0.8851 0.0909 7 Zajira 1/3 1 1 1 1 1 1 1 1 0.8851 0.0909 8 Maowa 1/3 1 1 1 1 1 1 1 1 0.8851 0.0909 9 Matarbari 1/3 1 1 1 1 1 1 1 1 0.8851 0.0909
Source: PSMP Study Team
(5) Noise and Vibration Regarding noise and vibration, noise and vibration due to pilling and excavation are supposed during construction phase. In operation phase, noise and vibration caused from operation of each machinery such as fan and pump in power plant, and drilling in coal mine are supposed. In addition that, because there are impacts of the noise and vibration caused by transportation of equipment and material, environmental impacts due to noise and vibration are supposed in all sites, no material difference between sites is supposed. Based on above point, the result is shown as follows,
APTable 12-33 Evaluation for Noise and Vibration
No. Site Name 1 2 3 4 5 6 7 8 9 Geometric Average
Level of Importance
1 B-K-D-P 1 1 1 1 1 1 1 1 1 1.0000 0.1111 2 Chittagong 1 1 1 1 1 1 1 1 1 1.0000 0.1111 3 Cox’s Bazar 1 1 1 1 1 1 1 1 1 1.0000 0.1111 4 Mongla 1 1 1 1 1 1 1 1 1 1.0000 0.1111 5 Khulna 1 1 1 1 1 1 1 1 1 1.0000 0.1111 6 Meghnaghat 1 1 1 1 1 1 1 1 1 1.0000 0.1111 7 Zajira 1 1 1 1 1 1 1 1 1 1.0000 0.1111 8 Maowa 1 1 1 1 1 1 1 1 1 1.0000 0.1111 9 Matarbari 1 1 1 1 1 1 1 1 1 1.0000 0.1111
Source: PSMP Study Team
(6) Offensive Odor Regarding offensive odor, though the ammonia which is used for the SCR can become source of odor, it is supposed that there is little impact because the discharge quantity is small. Based on above point, the result is shown as follows,
12-28
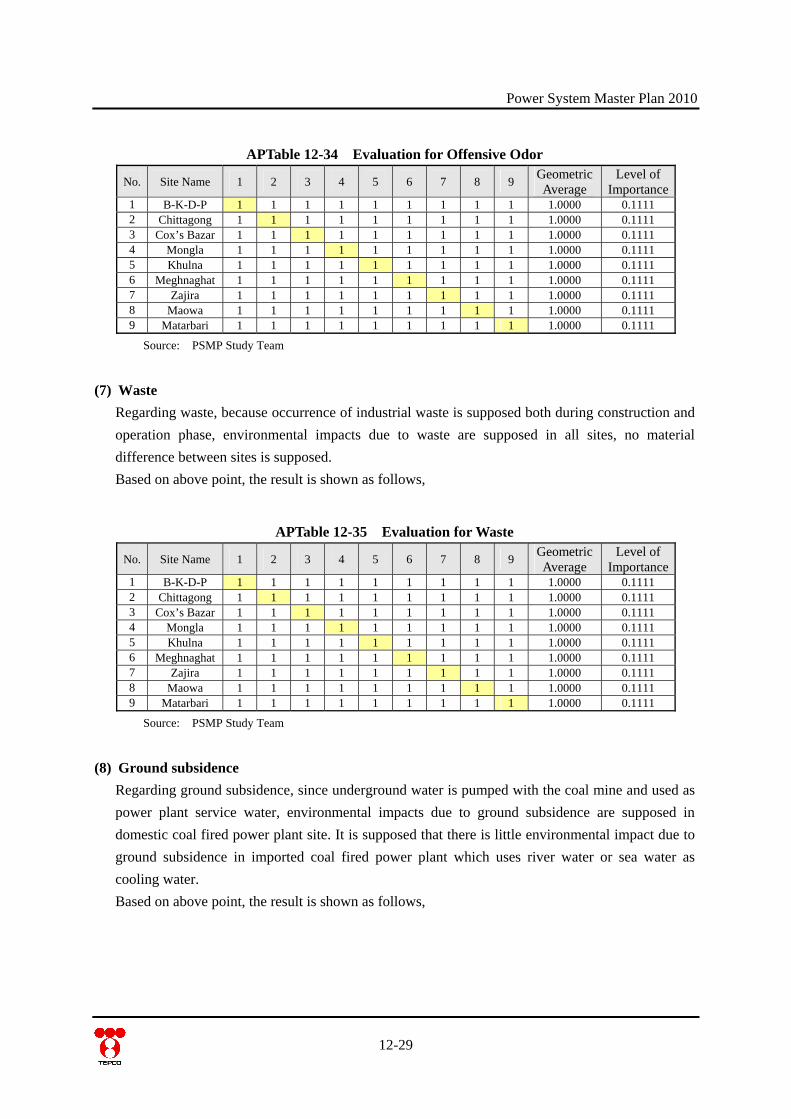
Power System Master Plan 2010
APTable 12-34 Evaluation for Offensive Odor
No. Site Name 1 2 3 4 5 6 7 8 9 Geometric Average
Level of Importance
1 B-K-D-P 1 1 1 1 1 1 1 1 1 1.0000 0.1111 2 Chittagong 1 1 1 1 1 1 1 1 1 1.0000 0.1111 3 Cox’s Bazar 1 1 1 1 1 1 1 1 1 1.0000 0.1111 4 Mongla 1 1 1 1 1 1 1 1 1 1.0000 0.1111 5 Khulna 1 1 1 1 1 1 1 1 1 1.0000 0.1111 6 Meghnaghat 1 1 1 1 1 1 1 1 1 1.0000 0.1111 7 Zajira 1 1 1 1 1 1 1 1 1 1.0000 0.1111 8 Maowa 1 1 1 1 1 1 1 1 1 1.0000 0.1111 9 Matarbari 1 1 1 1 1 1 1 1 1 1.0000 0.1111
Source: PSMP Study Team
(7) Waste Regarding waste, because occurrence of industrial waste is supposed both during construction and operation phase, environmental impacts due to waste are supposed in all sites, no material difference between sites is supposed. Based on above point, the result is shown as follows,
APTable 12-35 Evaluation for Waste
No. Site Name 1 2 3 4 5 6 7 8 9 Geometric Average
Level of Importance
1 B-K-D-P 1 1 1 1 1 1 1 1 1 1.0000 0.1111 2 Chittagong 1 1 1 1 1 1 1 1 1 1.0000 0.1111 3 Cox’s Bazar 1 1 1 1 1 1 1 1 1 1.0000 0.1111 4 Mongla 1 1 1 1 1 1 1 1 1 1.0000 0.1111 5 Khulna 1 1 1 1 1 1 1 1 1 1.0000 0.1111 6 Meghnaghat 1 1 1 1 1 1 1 1 1 1.0000 0.1111 7 Zajira 1 1 1 1 1 1 1 1 1 1.0000 0.1111 8 Maowa 1 1 1 1 1 1 1 1 1 1.0000 0.1111 9 Matarbari 1 1 1 1 1 1 1 1 1 1.0000 0.1111
Source: PSMP Study Team
(8) Ground subsidence Regarding ground subsidence, since underground water is pumped with the coal mine and used as power plant service water, environmental impacts due to ground subsidence are supposed in domestic coal fired power plant site. It is supposed that there is little environmental impact due to ground subsidence in imported coal fired power plant which uses river water or sea water as cooling water. Based on above point, the result is shown as follows,
12-29
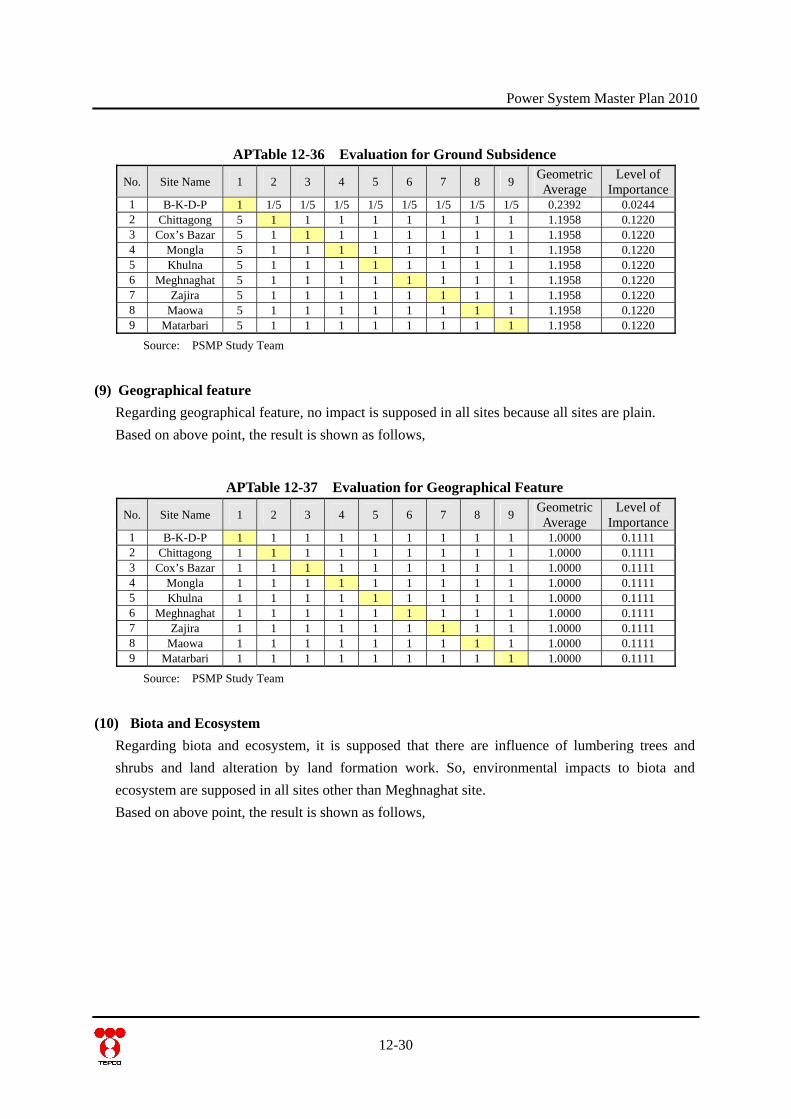
Power System Master Plan 2010
APTable 12-36 Evaluation for Ground Subsidence
No. Site Name 1 2 3 4 5 6 7 8 9 Geometric Average
Level of Importance
1 B-K-D-P 1 1/5 1/5 1/5 1/5 1/5 1/5 1/5 1/5 0.2392 0.0244 2 Chittagong 5 1 1 1 1 1 1 1 1 1.1958 0.1220 3 Cox’s Bazar 5 1 1 1 1 1 1 1 1 1.1958 0.1220 4 Mongla 5 1 1 1 1 1 1 1 1 1.1958 0.1220 5 Khulna 5 1 1 1 1 1 1 1 1 1.1958 0.1220 6 Meghnaghat 5 1 1 1 1 1 1 1 1 1.1958 0.1220 7 Zajira 5 1 1 1 1 1 1 1 1 1.1958 0.1220 8 Maowa 5 1 1 1 1 1 1 1 1 1.1958 0.1220 9 Matarbari 5 1 1 1 1 1 1 1 1 1.1958 0.1220
Source: PSMP Study Team
(9) Geographical feature Regarding geographical feature, no impact is supposed in all sites because all sites are plain. Based on above point, the result is shown as follows,
APTable 12-37 Evaluation for Geographical Feature
No. Site Name 1 2 3 4 5 6 7 8 9 Geometric Average
Level of Importance
1 B-K-D-P 1 1 1 1 1 1 1 1 1 1.0000 0.1111 2 Chittagong 1 1 1 1 1 1 1 1 1 1.0000 0.1111 3 Cox’s Bazar 1 1 1 1 1 1 1 1 1 1.0000 0.1111 4 Mongla 1 1 1 1 1 1 1 1 1 1.0000 0.1111 5 Khulna 1 1 1 1 1 1 1 1 1 1.0000 0.1111 6 Meghnaghat 1 1 1 1 1 1 1 1 1 1.0000 0.1111 7 Zajira 1 1 1 1 1 1 1 1 1 1.0000 0.1111 8 Maowa 1 1 1 1 1 1 1 1 1 1.0000 0.1111 9 Matarbari 1 1 1 1 1 1 1 1 1 1.0000 0.1111
Source: PSMP Study Team
(10) Biota and Ecosystem Regarding biota and ecosystem, it is supposed that there are influence of lumbering trees and shrubs and land alteration by land formation work. So, environmental impacts to biota and ecosystem are supposed in all sites other than Meghnaghat site. Based on above point, the result is shown as follows,
12-30
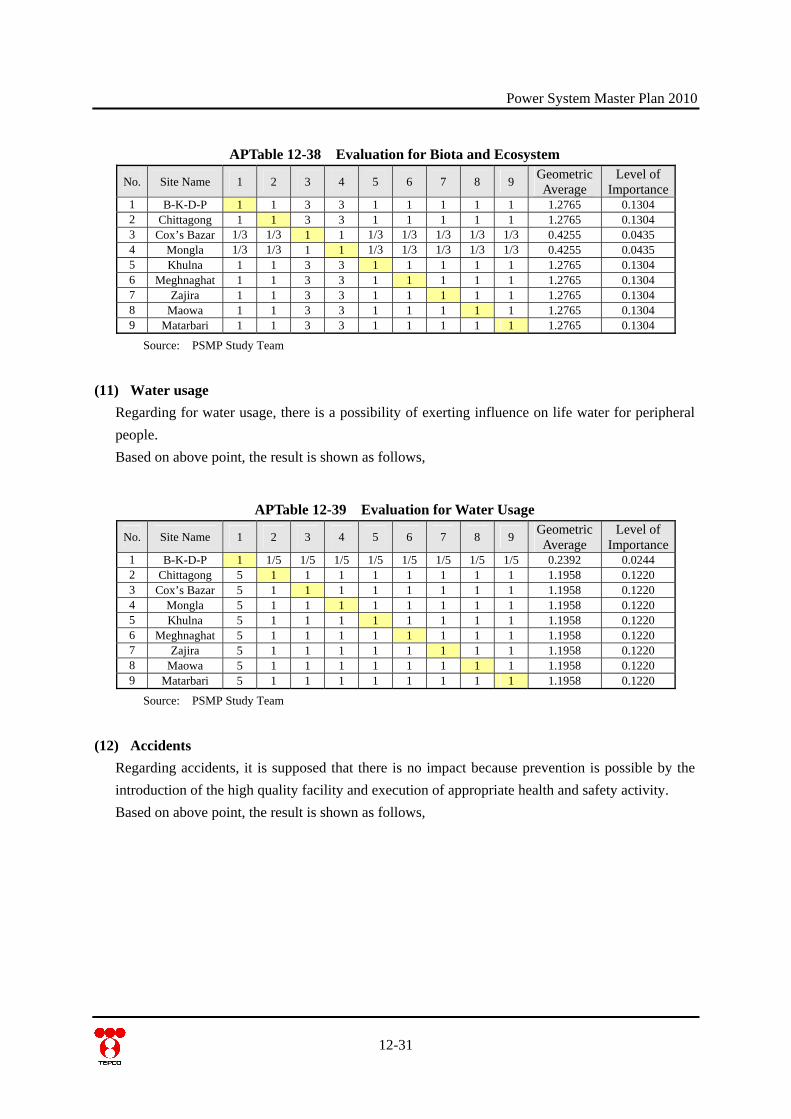
Power System Master Plan 2010
APTable 12-38 Evaluation for Biota and Ecosystem
No. Site Name 1 2 3 4 5 6 7 8 9 Geometric Average
Level of Importance
1 B-K-D-P 1 1 3 3 1 1 1 1 1 1.2765 0.1304 2 Chittagong 1 1 3 3 1 1 1 1 1 1.2765 0.1304 3 Cox’s Bazar 1/3 1/3 1 1 1/3 1/3 1/3 1/3 1/3 0.4255 0.0435 4 Mongla 1/3 1/3 1 1 1/3 1/3 1/3 1/3 1/3 0.4255 0.0435 5 Khulna 1 1 3 3 1 1 1 1 1 1.2765 0.1304 6 Meghnaghat 1 1 3 3 1 1 1 1 1 1.2765 0.1304 7 Zajira 1 1 3 3 1 1 1 1 1 1.2765 0.1304 8 Maowa 1 1 3 3 1 1 1 1 1 1.2765 0.1304 9 Matarbari 1 1 3 3 1 1 1 1 1 1.2765 0.1304
Source: PSMP Study Team
(11) Water usage Regarding for water usage, there is a possibility of exerting influence on life water for peripheral people. Based on above point, the result is shown as follows,
APTable 12-39 Evaluation for Water Usage
No. Site Name 1 2 3 4 5 6 7 8 9 Geometric Average
Level of Importance
1 B-K-D-P 1 1/5 1/5 1/5 1/5 1/5 1/5 1/5 1/5 0.2392 0.0244 2 Chittagong 5 1 1 1 1 1 1 1 1 1.1958 0.1220 3 Cox’s Bazar 5 1 1 1 1 1 1 1 1 1.1958 0.1220 4 Mongla 5 1 1 1 1 1 1 1 1 1.1958 0.1220 5 Khulna 5 1 1 1 1 1 1 1 1 1.1958 0.1220 6 Meghnaghat 5 1 1 1 1 1 1 1 1 1.1958 0.1220 7 Zajira 5 1 1 1 1 1 1 1 1 1.1958 0.1220 8 Maowa 5 1 1 1 1 1 1 1 1 1.1958 0.1220 9 Matarbari 5 1 1 1 1 1 1 1 1 1.1958 0.1220
Source: PSMP Study Team
(12) Accidents Regarding accidents, it is supposed that there is no impact because prevention is possible by the introduction of the high quality facility and execution of appropriate health and safety activity. Based on above point, the result is shown as follows,
12-31
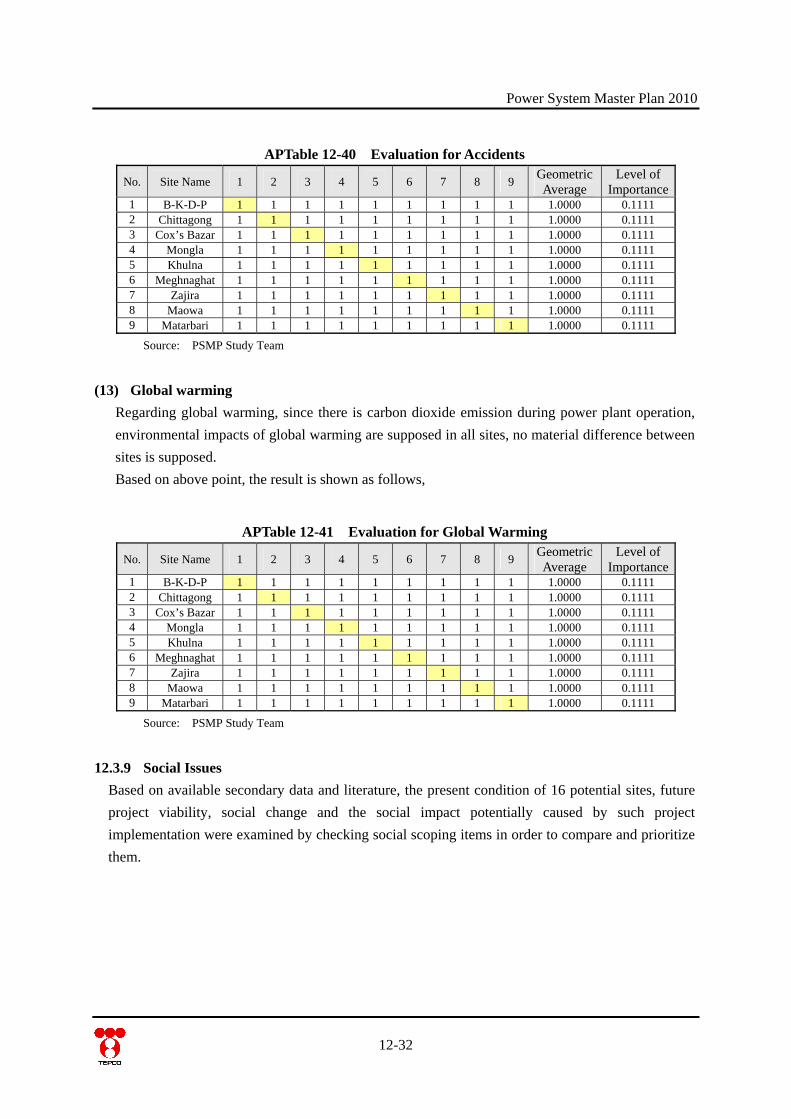
Power System Master Plan 2010
12-32
APTable 12-40 Evaluation for Accidents
No. Site Name 1 2 3 4 5 6 7 8 9 Geometric Average
Level of Importance
1 B-K-D-P 1 1 1 1 1 1 1 1 1 1.0000 0.1111 2 Chittagong 1 1 1 1 1 1 1 1 1 1.0000 0.1111 3 Cox’s Bazar 1 1 1 1 1 1 1 1 1 1.0000 0.1111 4 Mongla 1 1 1 1 1 1 1 1 1 1.0000 0.1111 5 Khulna 1 1 1 1 1 1 1 1 1 1.0000 0.1111 6 Meghnaghat 1 1 1 1 1 1 1 1 1 1.0000 0.1111 7 Zajira 1 1 1 1 1 1 1 1 1 1.0000 0.1111 8 Maowa 1 1 1 1 1 1 1 1 1 1.0000 0.1111 9 Matarbari 1 1 1 1 1 1 1 1 1 1.0000 0.1111
Source: PSMP Study Team
(13) Global warming Regarding global warming, since there is carbon dioxide emission during power plant operation, environmental impacts of global warming are supposed in all sites, no material difference between sites is supposed. Based on above point, the result is shown as follows,
APTable 12-41 Evaluation for Global Warming
No. Site Name 1 2 3 4 5 6 7 8 9 Geometric Average
Level of Importance
1 B-K-D-P 1 1 1 1 1 1 1 1 1 1.0000 0.1111 2 Chittagong 1 1 1 1 1 1 1 1 1 1.0000 0.1111 3 Cox’s Bazar 1 1 1 1 1 1 1 1 1 1.0000 0.1111 4 Mongla 1 1 1 1 1 1 1 1 1 1.0000 0.1111 5 Khulna 1 1 1 1 1 1 1 1 1 1.0000 0.1111 6 Meghnaghat 1 1 1 1 1 1 1 1 1 1.0000 0.1111 7 Zajira 1 1 1 1 1 1 1 1 1 1.0000 0.1111 8 Maowa 1 1 1 1 1 1 1 1 1 1.0000 0.1111 9 Matarbari 1 1 1 1 1 1 1 1 1 1.0000 0.1111
Source: PSMP Study Team
12.3.9 Social Issues Based on available secondary data and literature, the present condition of 16 potential sites, future project viability, social change and the social impact potentially caused by such project implementation were examined by checking social scoping items in order to compare and prioritize them.
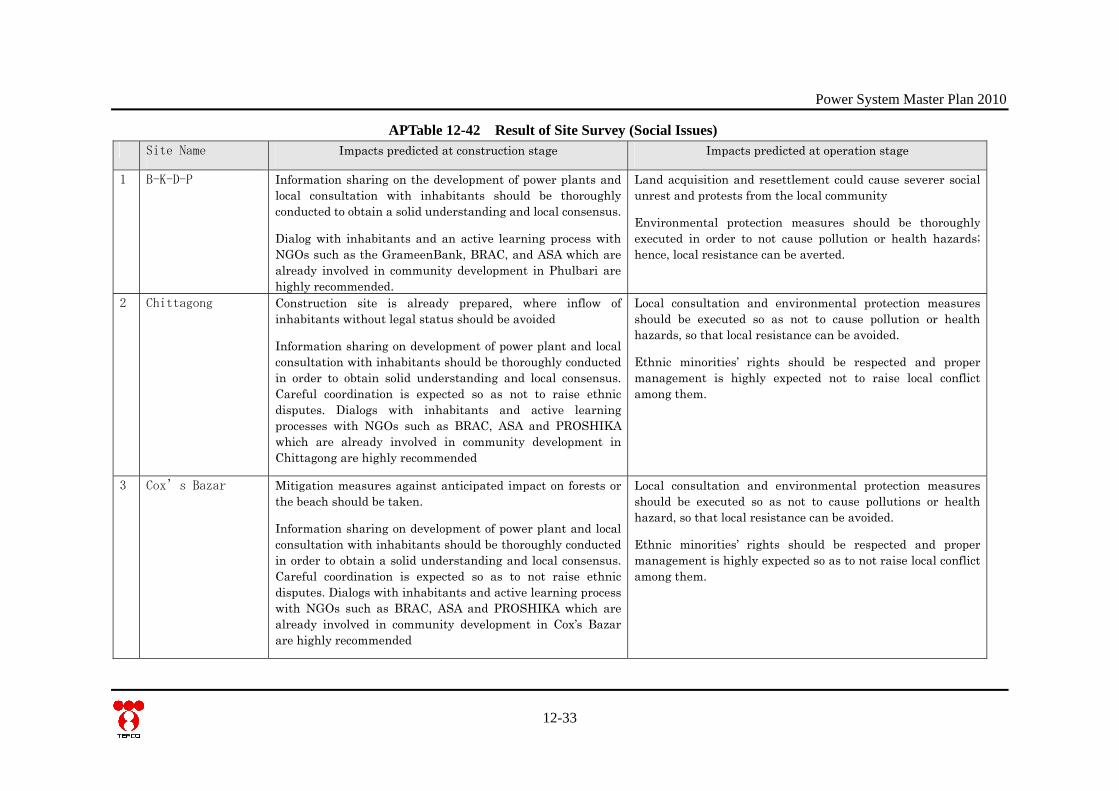
Power System Master Plan 2010
12-33
APTable 12-42 Result of Site Survey (Social Issues) Site Name Impacts predicted at construction stage Impacts predicted at operation stage
1 B-K-D-P Information sharing on the development of power plants and local consultation with inhabitants should be thoroughly conducted to obtain a solid understanding and local consensus.
Dialog with inhabitants and an active learning process with NGOs such as the GrameenBank, BRAC, and ASA which are already involved in community development in Phulbari are highly recommended.
Land acquisition and resettlement could cause severer social unrest and protests from the local community
Environmental protection measures should be thoroughly executed in order to not cause pollution or health hazards; hence, local resistance can be averted.
2 Chittagong
Construction site is already prepared, where inflow of inhabitants without legal status should be avoided
Information sharing on development of power plant and local consultation with inhabitants should be thoroughly conducted in order to obtain solid understanding and local consensus. Careful coordination is expected so as not to raise ethnic disputes. Dialogs with inhabitants and active learning processes with NGOs such as BRAC, ASA and PROSHIKA which are already involved in community development in Chittagong are highly recommended
Local consultation and environmental protection measures should be executed so as not to cause pollution or health hazards, so that local resistance can be avoided.
Ethnic minorities’ rights should be respected and proper management is highly expected not to raise local conflict among them.
3 Cox’s Bazar
Mitigation measures against anticipated impact on forests or the beach should be taken.
Information sharing on development of power plant and local consultation with inhabitants should be thoroughly conducted in order to obtain a solid understanding and local consensus. Careful coordination is expected so as to not raise ethnic disputes. Dialogs with inhabitants and active learning process with NGOs such as BRAC, ASA and PROSHIKA which are already involved in community development in Cox’s Bazar are highly recommended
Local consultation and environmental protection measures should be executed so as not to cause pollutions or health hazard, so that local resistance can be avoided.
Ethnic minorities’ rights should be respected and proper management is highly expected so as to not raise local conflict among them.
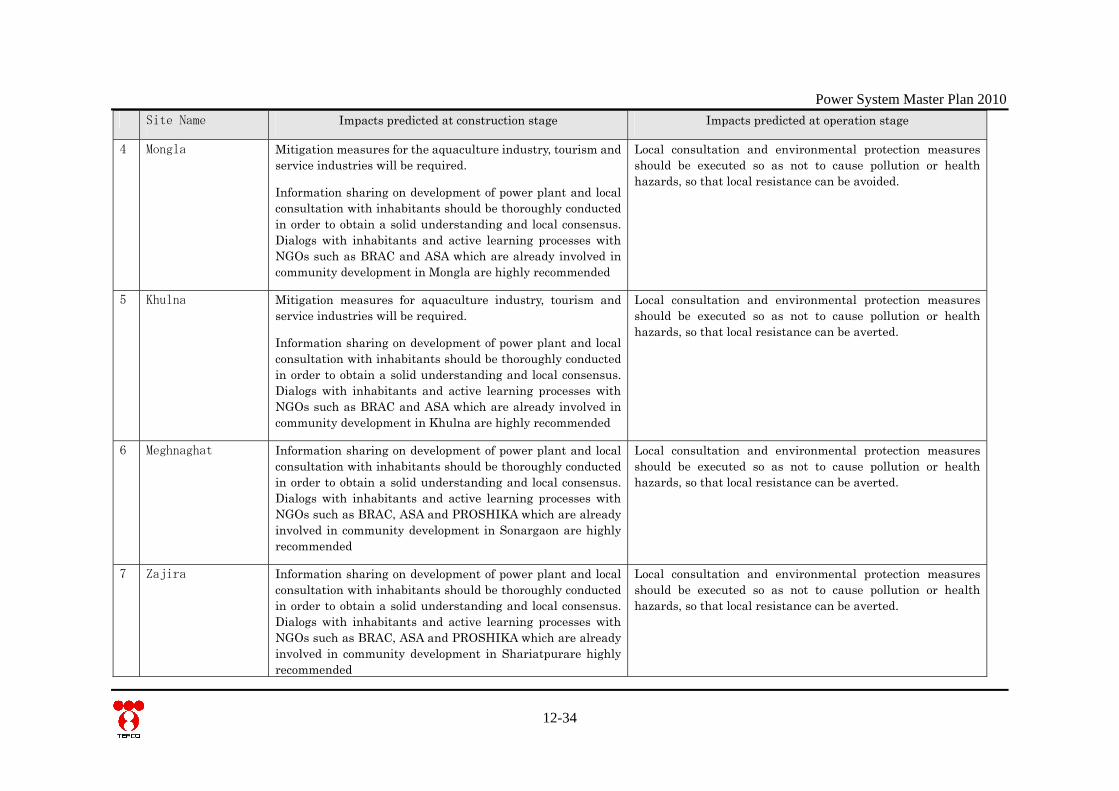
Power System Master Plan 2010
12-34
Site Name Impacts predicted at construction stage Impacts predicted at operation stage
4 Mongla
Mitigation measures for the aquaculture industry, tourism and service industries will be required.
Information sharing on development of power plant and local consultation with inhabitants should be thoroughly conducted in order to obtain a solid understanding and local consensus. Dialogs with inhabitants and active learning processes with NGOs such as BRAC and ASA which are already involved in community development in Mongla are highly recommended
Local consultation and environmental protection measures should be executed so as not to cause pollution or health hazards, so that local resistance can be avoided.
5 Khulna
Mitigation measures for aquaculture industry, tourism and service industries will be required.
Information sharing on development of power plant and local consultation with inhabitants should be thoroughly conducted in order to obtain a solid understanding and local consensus. Dialogs with inhabitants and active learning processes with NGOs such as BRAC and ASA which are already involved in community development in Khulna are highly recommended
Local consultation and environmental protection measures should be executed so as not to cause pollution or health hazards, so that local resistance can be averted.
6 Meghnaghat
Information sharing on development of power plant and local consultation with inhabitants should be thoroughly conducted in order to obtain a solid understanding and local consensus. Dialogs with inhabitants and active learning processes with NGOs such as BRAC, ASA and PROSHIKA which are already involved in community development in Sonargaon are highly recommended
Local consultation and environmental protection measures should be executed so as not to cause pollution or health hazards, so that local resistance can be averted.
7 Zajira
Information sharing on development of power plant and local consultation with inhabitants should be thoroughly conducted in order to obtain a solid understanding and local consensus. Dialogs with inhabitants and active learning processes with NGOs such as BRAC, ASA and PROSHIKA which are already involved in community development in Shariatpurare highly recommended
Local consultation and environmental protection measures should be executed so as not to cause pollution or health hazards, so that local resistance can be averted.
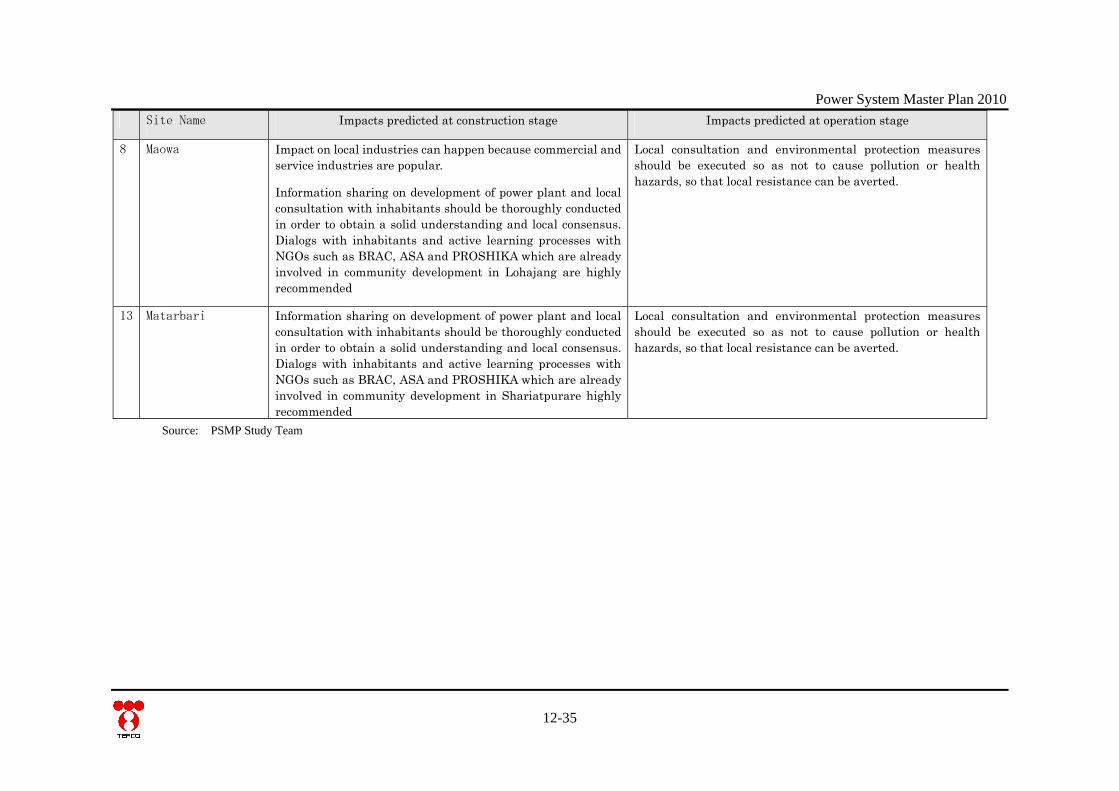
Power System Master Plan 2010
12-35
Site Name Impacts predicted at construction stage Impacts predicted at operation stage
8 Maowa
Impact on local industries can happen because commercial and service industries are popular.
Information sharing on development of power plant and local consultation with inhabitants should be thoroughly conducted in order to obtain a solid understanding and local consensus. Dialogs with inhabitants and active learning processes with NGOs such as BRAC, ASA and PROSHIKA which are already involved in community development in Lohajang are highly recommended
Local consultation and environmental protection measures should be executed so as not to cause pollution or health hazards, so that local resistance can be averted.
13 Matarbari
Information sharing on development of power plant and local consultation with inhabitants should be thoroughly conducted in order to obtain a solid understanding and local consensus. Dialogs with inhabitants and active learning processes with NGOs such as BRAC, ASA and PROSHIKA which are already involved in community development in Shariatpurare highly recommended
Local consultation and environmental protection measures should be executed so as not to cause pollution or health hazards, so that local resistance can be averted.
Source: PSMP Study Team
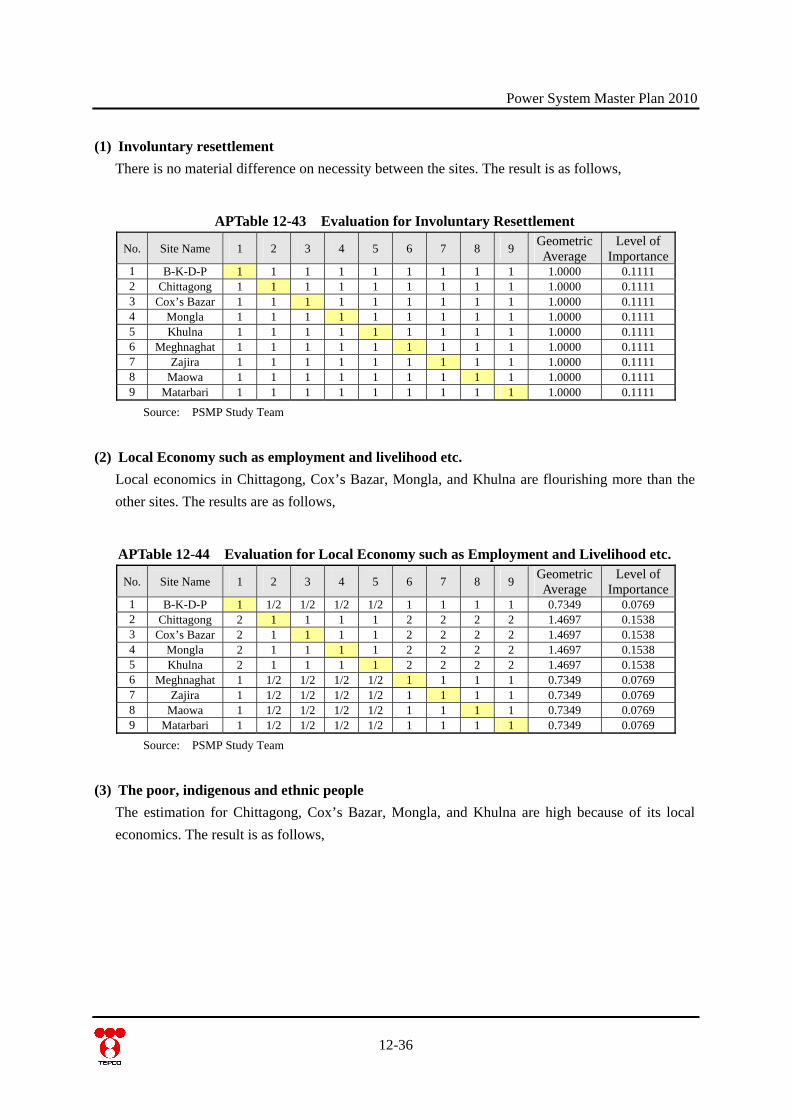
Power System Master Plan 2010
(1) Involuntary resettlement There is no material difference on necessity between the sites. The result is as follows,
APTable 12-43 Evaluation for Involuntary Resettlement
No. Site Name 1 2 3 4 5 6 7 8 9 Geometric Average
Level of Importance
1 B-K-D-P 1 1 1 1 1 1 1 1 1 1.0000 0.1111 2 Chittagong 1 1 1 1 1 1 1 1 1 1.0000 0.1111 3 Cox’s Bazar 1 1 1 1 1 1 1 1 1 1.0000 0.1111 4 Mongla 1 1 1 1 1 1 1 1 1 1.0000 0.1111 5 Khulna 1 1 1 1 1 1 1 1 1 1.0000 0.1111 6 Meghnaghat 1 1 1 1 1 1 1 1 1 1.0000 0.1111 7 Zajira 1 1 1 1 1 1 1 1 1 1.0000 0.1111 8 Maowa 1 1 1 1 1 1 1 1 1 1.0000 0.1111 9 Matarbari 1 1 1 1 1 1 1 1 1 1.0000 0.1111
Source: PSMP Study Team
(2) Local Economy such as employment and livelihood etc. Local economics in Chittagong, Cox’s Bazar, Mongla, and Khulna are flourishing more than the other sites. The results are as follows,
APTable 12-44 Evaluation for Local Economy such as Employment and Livelihood etc.
No. Site Name 1 2 3 4 5 6 7 8 9 Geometric Average
Level of Importance
1 B-K-D-P 1 1/2 1/2 1/2 1/2 1 1 1 1 0.7349 0.0769 2 Chittagong 2 1 1 1 1 2 2 2 2 1.4697 0.1538 3 Cox’s Bazar 2 1 1 1 1 2 2 2 2 1.4697 0.1538 4 Mongla 2 1 1 1 1 2 2 2 2 1.4697 0.1538 5 Khulna 2 1 1 1 1 2 2 2 2 1.4697 0.1538 6 Meghnaghat 1 1/2 1/2 1/2 1/2 1 1 1 1 0.7349 0.0769 7 Zajira 1 1/2 1/2 1/2 1/2 1 1 1 1 0.7349 0.0769 8 Maowa 1 1/2 1/2 1/2 1/2 1 1 1 1 0.7349 0.0769 9 Matarbari 1 1/2 1/2 1/2 1/2 1 1 1 1 0.7349 0.0769
Source: PSMP Study Team
(3) The poor, indigenous and ethnic people The estimation for Chittagong, Cox’s Bazar, Mongla, and Khulna are high because of its local economics. The result is as follows,
12-36

Power System Master Plan 2010
APTable 12-45 Evaluation for the Poor, Indigenous and Ethnic People
No. Site Name 1 2 3 4 5 6 7 8 9 Geometric Average
Level of Importance
1 B-K-D-P 1 1/2 1/2 1/2 1/2 1 1 1 1 0.7349 0.0769 2 Chittagong 2 1 1 1 1 2 2 2 2 1.4697 0.1538 3 Cox’s Bazar 2 1 1 1 1 2 2 2 2 1.4697 0.1538 4 Mongla 2 1 1 1 1 2 2 2 2 1.4697 0.1538 5 Khulna 2 1 1 1 1 2 2 2 2 1.4697 0.1538 6 Meghnaghat 1 1/2 1/2 1/2 1/2 1 1 1 1 0.7349 0.0769 7 Zajira 1 1/2 1/2 1/2 1/2 1 1 1 1 0.7349 0.0769 8 Maowa 1 1/2 1/2 1/2 1/2 1 1 1 1 0.7349 0.0769 9 Matarbari 1 1/2 1/2 1/2 1/2 1 1 1 1 0.7349 0.0769
Source: PSMP Study Team
(4) Misdistribution of benefit and loss There is no difference between the sites. The results are as follows,
APTable 12-46 Evaluation for Misdistribution of Benefit and Loss
No. Site Name 1 2 3 4 5 6 7 8 9 Geometric Average
Level of Importance
1 B-K-D-P 1 1 1 1 1 1 1 1 1 1.0000 0.1111 2 Chittagong 1 1 1 1 1 1 1 1 1 1.0000 0.1111 3 Cox’s Bazar 1 1 1 1 1 1 1 1 1 1.0000 0.1111 4 Mongla 1 1 1 1 1 1 1 1 1 1.0000 0.1111 5 Khulna 1 1 1 1 1 1 1 1 1 1.0000 0.1111 6 Meghnaghat 1 1 1 1 1 1 1 1 1 1.0000 0.1111 7 Zajira 1 1 1 1 1 1 1 1 1 1.0000 0.1111 8 Maowa 1 1 1 1 1 1 1 1 1 1.0000 0.1111 9 Matarbari 1 1 1 1 1 1 1 1 1 1.0000 0.1111
Source: PSMP Study Team
(5) Local conflict of interests There is also no difference between the sites. The results are as follows,
APTable 12-47 Evaluation for Local Conflict to Interests
No. Site Name 1 2 3 4 5 6 7 8 9 Geometric Average
Level of Importance
1 B-K-D-P 1 1 1 1 1 1 1 1 1 1.0000 0.1111 2 Chittagong 1 1 1 1 1 1 1 1 1 1.0000 0.1111 3 Cox’s Bazar 1 1 1 1 1 1 1 1 1 1.0000 0.1111 4 Mongla 1 1 1 1 1 1 1 1 1 1.0000 0.1111 5 Khulna 1 1 1 1 1 1 1 1 1 1.0000 0.1111 6 Meghnaghat 1 1 1 1 1 1 1 1 1 1.0000 0.1111 7 Zajira 1 1 1 1 1 1 1 1 1 1.0000 0.1111 8 Maowa 1 1 1 1 1 1 1 1 1 1.0000 0.1111 9 Matarbari 1 1 1 1 1 1 1 1 1 1.0000 0.1111
Source: PSMP Study Team
12-37
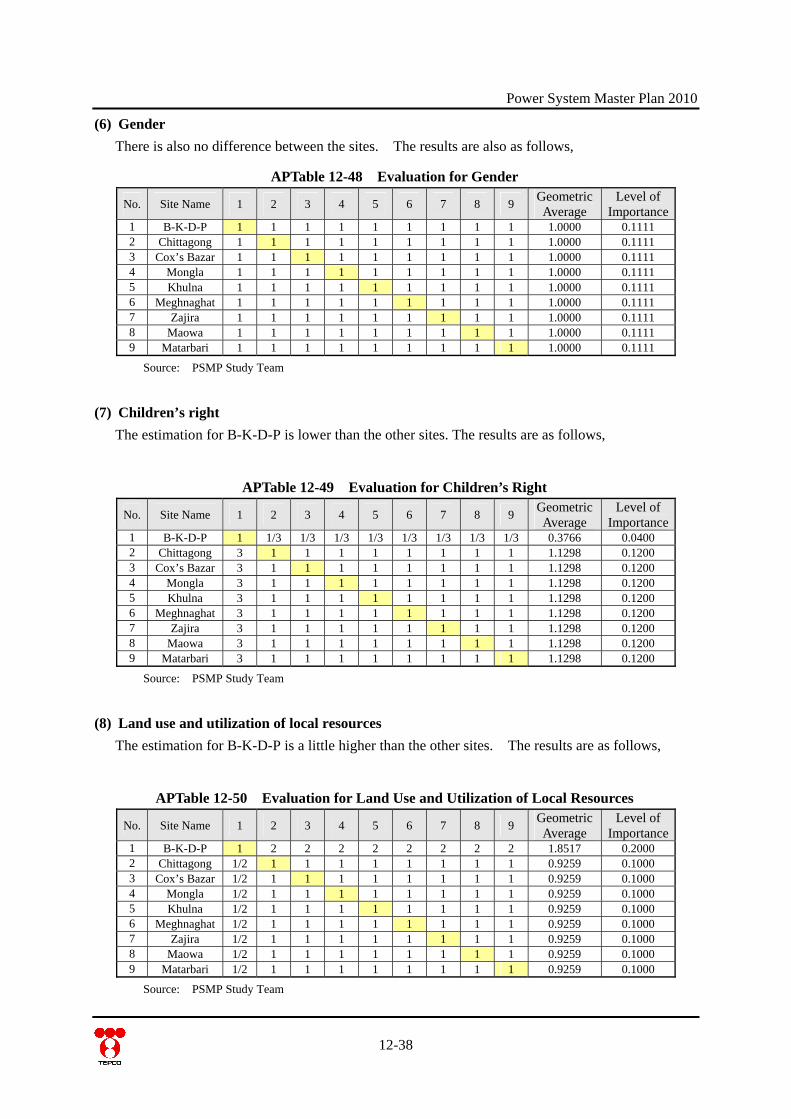
Power System Master Plan 2010
(6) Gender There is also no difference between the sites. The results are also as follows,
APTable 12-48 Evaluation for Gender
No. Site Name 1 2 3 4 5 6 7 8 9 Geometric Average
Level of Importance
1 B-K-D-P 1 1 1 1 1 1 1 1 1 1.0000 0.1111 2 Chittagong 1 1 1 1 1 1 1 1 1 1.0000 0.1111 3 Cox’s Bazar 1 1 1 1 1 1 1 1 1 1.0000 0.1111 4 Mongla 1 1 1 1 1 1 1 1 1 1.0000 0.1111 5 Khulna 1 1 1 1 1 1 1 1 1 1.0000 0.1111 6 Meghnaghat 1 1 1 1 1 1 1 1 1 1.0000 0.1111 7 Zajira 1 1 1 1 1 1 1 1 1 1.0000 0.1111 8 Maowa 1 1 1 1 1 1 1 1 1 1.0000 0.1111 9 Matarbari 1 1 1 1 1 1 1 1 1 1.0000 0.1111
Source: PSMP Study Team
(7) Children’s right The estimation for B-K-D-P is lower than the other sites. The results are as follows,
APTable 12-49 Evaluation for Children’s Right
No. Site Name 1 2 3 4 5 6 7 8 9 Geometric Average
Level of Importance
1 B-K-D-P 1 1/3 1/3 1/3 1/3 1/3 1/3 1/3 1/3 0.3766 0.0400 2 Chittagong 3 1 1 1 1 1 1 1 1 1.1298 0.1200 3 Cox’s Bazar 3 1 1 1 1 1 1 1 1 1.1298 0.1200 4 Mongla 3 1 1 1 1 1 1 1 1 1.1298 0.1200 5 Khulna 3 1 1 1 1 1 1 1 1 1.1298 0.1200 6 Meghnaghat 3 1 1 1 1 1 1 1 1 1.1298 0.1200 7 Zajira 3 1 1 1 1 1 1 1 1 1.1298 0.1200 8 Maowa 3 1 1 1 1 1 1 1 1 1.1298 0.1200 9 Matarbari 3 1 1 1 1 1 1 1 1 1.1298 0.1200
Source: PSMP Study Team
(8) Land use and utilization of local resources The estimation for B-K-D-P is a little higher than the other sites. The results are as follows,
APTable 12-50 Evaluation for Land Use and Utilization of Local Resources
No. Site Name 1 2 3 4 5 6 7 8 9 Geometric Average
Level of Importance
1 B-K-D-P 1 2 2 2 2 2 2 2 2 1.8517 0.2000 2 Chittagong 1/2 1 1 1 1 1 1 1 1 0.9259 0.1000 3 Cox’s Bazar 1/2 1 1 1 1 1 1 1 1 0.9259 0.1000 4 Mongla 1/2 1 1 1 1 1 1 1 1 0.9259 0.1000 5 Khulna 1/2 1 1 1 1 1 1 1 1 0.9259 0.1000 6 Meghnaghat 1/2 1 1 1 1 1 1 1 1 0.9259 0.1000 7 Zajira 1/2 1 1 1 1 1 1 1 1 0.9259 0.1000 8 Maowa 1/2 1 1 1 1 1 1 1 1 0.9259 0.1000 9 Matarbari 1/2 1 1 1 1 1 1 1 1 0.9259 0.1000
Source: PSMP Study Team
12-38
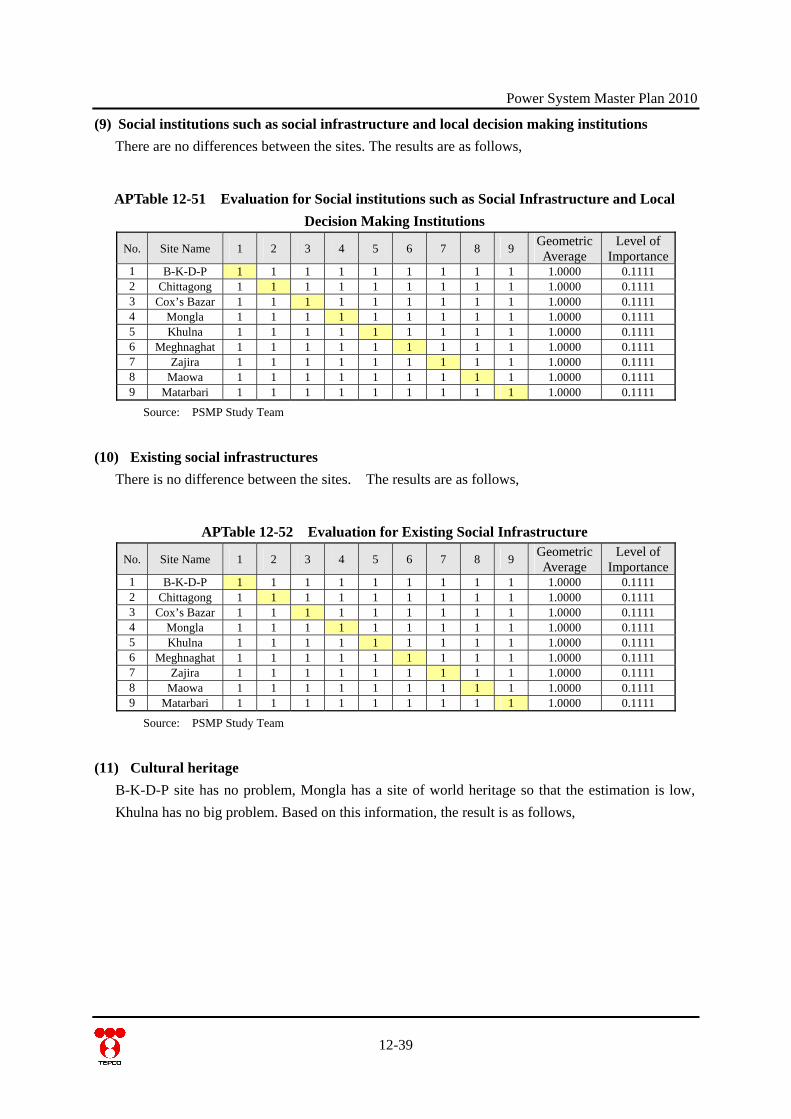
Power System Master Plan 2010
(9) Social institutions such as social infrastructure and local decision making institutions There are no differences between the sites. The results are as follows,
APTable 12-51 Evaluation for Social institutions such as Social Infrastructure and Local Decision Making Institutions
No. Site Name 1 2 3 4 5 6 7 8 9 Geometric Average
Level of Importance
1 B-K-D-P 1 1 1 1 1 1 1 1 1 1.0000 0.1111 2 Chittagong 1 1 1 1 1 1 1 1 1 1.0000 0.1111 3 Cox’s Bazar 1 1 1 1 1 1 1 1 1 1.0000 0.1111 4 Mongla 1 1 1 1 1 1 1 1 1 1.0000 0.1111 5 Khulna 1 1 1 1 1 1 1 1 1 1.0000 0.1111 6 Meghnaghat 1 1 1 1 1 1 1 1 1 1.0000 0.1111 7 Zajira 1 1 1 1 1 1 1 1 1 1.0000 0.1111 8 Maowa 1 1 1 1 1 1 1 1 1 1.0000 0.1111 9 Matarbari 1 1 1 1 1 1 1 1 1 1.0000 0.1111
Source: PSMP Study Team
(10) Existing social infrastructures There is no difference between the sites. The results are as follows,
APTable 12-52 Evaluation for Existing Social Infrastructure
No. Site Name 1 2 3 4 5 6 7 8 9 Geometric Average
Level of Importance
1 B-K-D-P 1 1 1 1 1 1 1 1 1 1.0000 0.1111 2 Chittagong 1 1 1 1 1 1 1 1 1 1.0000 0.1111 3 Cox’s Bazar 1 1 1 1 1 1 1 1 1 1.0000 0.1111 4 Mongla 1 1 1 1 1 1 1 1 1 1.0000 0.1111 5 Khulna 1 1 1 1 1 1 1 1 1 1.0000 0.1111 6 Meghnaghat 1 1 1 1 1 1 1 1 1 1.0000 0.1111 7 Zajira 1 1 1 1 1 1 1 1 1 1.0000 0.1111 8 Maowa 1 1 1 1 1 1 1 1 1 1.0000 0.1111 9 Matarbari 1 1 1 1 1 1 1 1 1 1.0000 0.1111
Source: PSMP Study Team
(11) Cultural heritage B-K-D-P site has no problem, Mongla has a site of world heritage so that the estimation is low, Khulna has no big problem. Based on this information, the result is as follows,
12-39
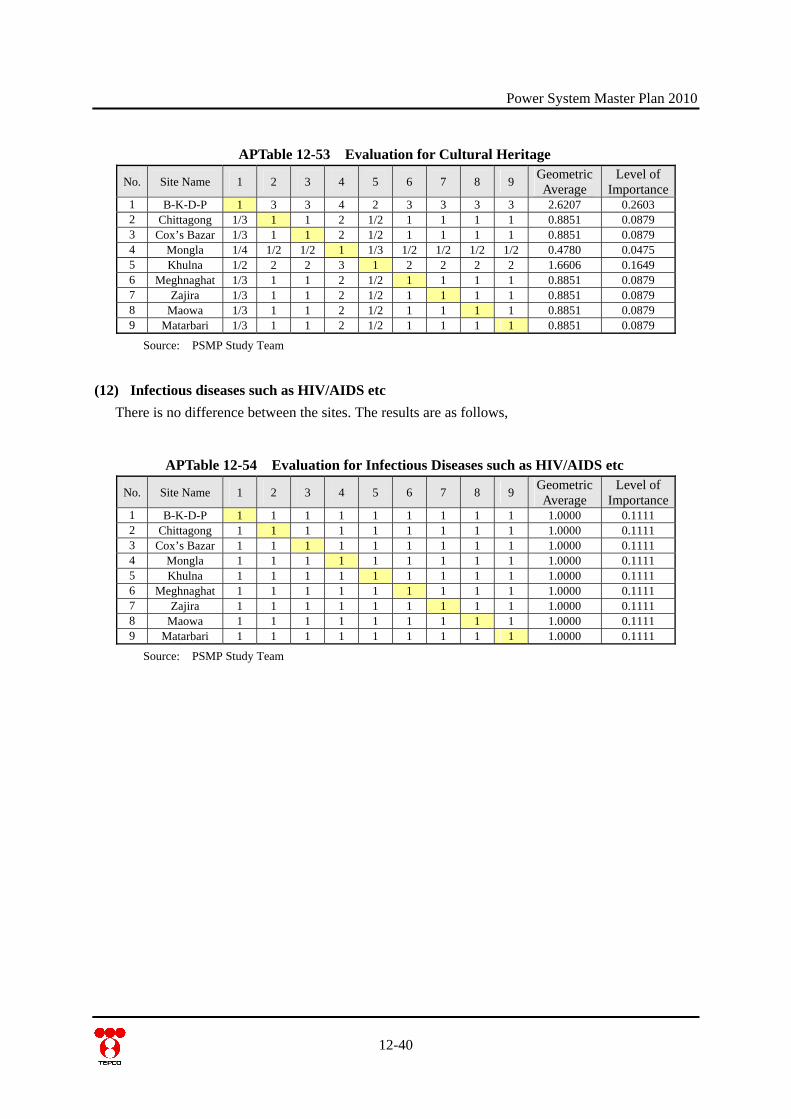
Power System Master Plan 2010
12-40
APTable 12-53 Evaluation for Cultural Heritage
No. Site Name 1 2 3 4 5 6 7 8 9 Geometric Average
Level of Importance
1 B-K-D-P 1 3 3 4 2 3 3 3 3 2.6207 0.2603 2 Chittagong 1/3 1 1 2 1/2 1 1 1 1 0.8851 0.0879 3 Cox’s Bazar 1/3 1 1 2 1/2 1 1 1 1 0.8851 0.0879 4 Mongla 1/4 1/2 1/2 1 1/3 1/2 1/2 1/2 1/2 0.4780 0.0475 5 Khulna 1/2 2 2 3 1 2 2 2 2 1.6606 0.1649 6 Meghnaghat 1/3 1 1 2 1/2 1 1 1 1 0.8851 0.0879 7 Zajira 1/3 1 1 2 1/2 1 1 1 1 0.8851 0.0879 8 Maowa 1/3 1 1 2 1/2 1 1 1 1 0.8851 0.0879 9 Matarbari 1/3 1 1 2 1/2 1 1 1 1 0.8851 0.0879
Source: PSMP Study Team
(12) Infectious diseases such as HIV/AIDS etc There is no difference between the sites. The results are as follows,
APTable 12-54 Evaluation for Infectious Diseases such as HIV/AIDS etc
No. Site Name 1 2 3 4 5 6 7 8 9 Geometric Average
Level of Importance
1 B-K-D-P 1 1 1 1 1 1 1 1 1 1.0000 0.1111 2 Chittagong 1 1 1 1 1 1 1 1 1 1.0000 0.1111 3 Cox’s Bazar 1 1 1 1 1 1 1 1 1 1.0000 0.1111 4 Mongla 1 1 1 1 1 1 1 1 1 1.0000 0.1111 5 Khulna 1 1 1 1 1 1 1 1 1 1.0000 0.1111 6 Meghnaghat 1 1 1 1 1 1 1 1 1 1.0000 0.1111 7 Zajira 1 1 1 1 1 1 1 1 1 1.0000 0.1111 8 Maowa 1 1 1 1 1 1 1 1 1 1.0000 0.1111 9 Matarbari 1 1 1 1 1 1 1 1 1 1.0000 0.1111
Source: PSMP Study Team
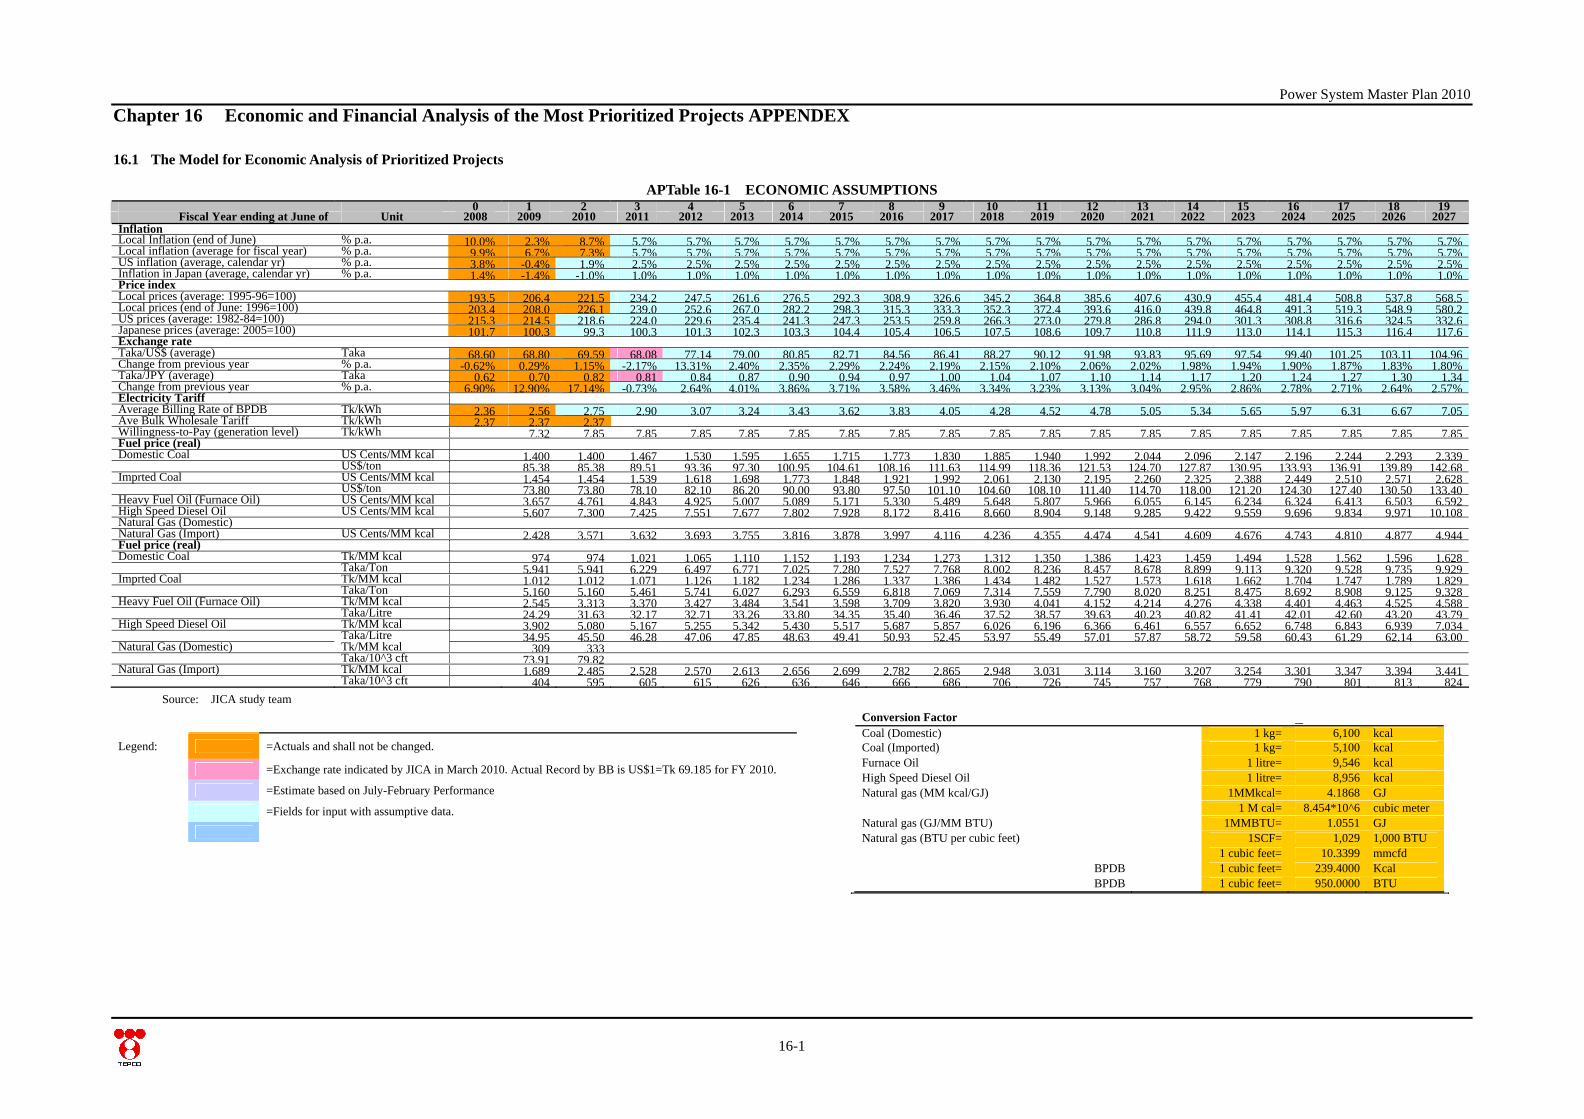
Power System Master Plan 2010
Chapter 16 Economic and Financial Analysis of the Most Prioritized Projects APPENDEX
16.1 The Model for Economic Analysis of Prioritized Projects
APTable 16-1 ECONOMIC ASSUMPTIONS 0 1 2 3 4 5 6 7 8 9 10 11 12 13 14 15 16 17 18 19
Fiscal Year ending at June of Unit 2008 2009 2010 2011 2012 2013 2014 2015 2016 2017 2018 2019 2020 2021 2022 2023 2024 2025 2026 2027 Inflation Local Inflation (end of June) % p.a. 10.0% 2.3% 8.7% 5.7% 5.7% 5.7% 5.7% 5.7% 5.7% 5.7% 5.7% 5.7% 5.7% 5.7% 5.7% 5.7% 5.7% 5.7% 5.7% 5.7%Local inflation (average for fiscal year) % p.a. 9.9% 6.7% 7.3% 5.7% 5.7% 5.7% 5.7% 5.7% 5.7% 5.7% 5.7% 5.7% 5.7% 5.7% 5.7% 5.7% 5.7% 5.7% 5.7% 5.7%US inflation (average, calendar yr) % p.a. 3.8% -0.4% 1.9% 2.5% 2.5% 2.5% 2.5% 2.5% 2.5% 2.5% 2.5% 2.5% 2.5% 2.5% 2.5% 2.5% 2.5% 2.5% 2.5% 2.5%Inflation in Japan (average, calendar yr) % p.a. 1.4% -1.4% -1.0% 1.0% 1.0% 1.0% 1.0% 1.0% 1.0% 1.0% 1.0% 1.0% 1.0% 1.0% 1.0% 1.0% 1.0% 1.0% 1.0% 1.0%Price index Local prices (average: 1995-96=100) 193.5 206.4 221.5 234.2 247.5 261.6 276.5 292.3 308.9 326.6 345.2 364.8 385.6 407.6 430.9 455.4 481.4 508.8 537.8 568.5 Local prices (end of June: 1996=100) 203.4 208.0 226.1 239.0 252.6 267.0 282.2 298.3 315.3 333.3 352.3 372.4 393.6 416.0 439.8 464.8 491.3 519.3 548.9 580.2 US prices (average: 1982-84=100) 215.3 214.5 218.6 224.0 229.6 235.4 241.3 247.3 253.5 259.8 266.3 273.0 279.8 286.8 294.0 301.3 308.8 316.6 324.5 332.6 Japanese prices (average: 2005=100) 101.7 100.3 99.3 100.3 101.3 102.3 103.3 104.4 105.4 106.5 107.5 108.6 109.7 110.8 111.9 113.0 114.1 115.3 116.4 117.6 Exchange rate Taka/US$ (average) Taka 68.60 68.80 69.59 68.08 77.14 79.00 80.85 82.71 84.56 86.41 88.27 90.12 91.98 93.83 95.69 97.54 99.40 101.25 103.11 104.96 Change from previous year % p.a. -0.62% 0.29% 1.15% -2.17% 13.31% 2.40% 2.35% 2.29% 2.24% 2.19% 2.15% 2.10% 2.06% 2.02% 1.98% 1.94% 1.90% 1.87% 1.83% 1.80%Taka/JPY (average) Taka 0.62 0.70 0.82 0.81 0.84 0.87 0.90 0.94 0.97 1.00 1.04 1.07 1.10 1.14 1.17 1.20 1.24 1.27 1.30 1.34 Change from previous year % p.a. 6.90% 12.90% 17.14% -0.73% 2.64% 4.01% 3.86% 3.71% 3.58% 3.46% 3.34% 3.23% 3.13% 3.04% 2.95% 2.86% 2.78% 2.71% 2.64% 2.57%Electricity Tariff Average Billing Rate of BPDB Tk/kWh 2.36 2.56 2.75 2.90 3.07 3.24 3.43 3.62 3.83 4.05 4.28 4.52 4.78 5.05 5.34 5.65 5.97 6.31 6.67 7.05 Ave Bulk Wholesale Tariff Tk/kWh 2.37 2.37 2.37 Willingness-to-Pay (generation level) Tk/kWh 7.32 7.85 7.85 7.85 7.85 7.85 7.85 7.85 7.85 7.85 7.85 7.85 7.85 7.85 7.85 7.85 7.85 7.85 7.85 Fuel price (real) Domestic Coal US Cents/MM kcal 1,400 1,400 1,467 1,530 1,595 1,655 1,715 1,773 1,830 1,885 1,940 1,992 2,044 2,096 2,147 2,196 2,244 2,293 2,339 US$/ton 85.38 85.38 89.51 93.36 97.30 100.95 104.61 108.16 111.63 114.99 118.36 121.53 124.70 127.87 130.95 133.93 136.91 139.89 142.68 Imprted Coal US Cents/MM kcal 1,454 1,454 1,539 1,618 1,698 1,773 1,848 1,921 1,992 2,061 2,130 2,195 2,260 2,325 2,388 2,449 2,510 2,571 2,628 US$/ton 73.80 73.80 78.10 82.10 86.20 90.00 93.80 97.50 101.10 104.60 108.10 111.40 114.70 118.00 121.20 124.30 127.40 130.50 133.40 Heavy Fuel Oil (Furnace Oil) US Cents/MM kcal 3,657 4,761 4,843 4,925 5,007 5,089 5,171 5,330 5,489 5,648 5,807 5,966 6,055 6,145 6,234 6,324 6,413 6,503 6,592 High Speed Diesel Oil US Cents/MM kcal 5,607 7,300 7,425 7,551 7,677 7,802 7,928 8,172 8,416 8,660 8,904 9,148 9,285 9,422 9,559 9,696 9,834 9,971 10,108 Natural Gas (Domestic) Natural Gas (Import) US Cents/MM kcal 2,428 3,571 3,632 3,693 3,755 3,816 3,878 3,997 4,116 4,236 4,355 4,474 4,541 4,609 4,676 4,743 4,810 4,877 4,944 Fuel price (real) Domestic Coal Tk/MM kcal 974 974 1,021 1,065 1,110 1,152 1,193 1,234 1,273 1,312 1,350 1,386 1,423 1,459 1,494 1,528 1,562 1,596 1,628 Taka/Ton 5,941 5,941 6,229 6,497 6,771 7,025 7,280 7,527 7,768 8,002 8,236 8,457 8,678 8,899 9,113 9,320 9,528 9,735 9,929 Imprted Coal Tk/MM kcal 1,012 1,012 1,071 1,126 1,182 1,234 1,286 1,337 1,386 1,434 1,482 1,527 1,573 1,618 1,662 1,704 1,747 1,789 1,829 Taka/Ton 5,160 5,160 5,461 5,741 6,027 6,293 6,559 6,818 7,069 7,314 7,559 7,790 8,020 8,251 8,475 8,692 8,908 9,125 9,328 Heavy Fuel Oil (Furnace Oil) Tk/MM kcal 2,545 3,313 3,370 3,427 3,484 3,541 3,598 3,709 3,820 3,930 4,041 4,152 4,214 4,276 4,338 4,401 4,463 4,525 4,588 Taka/Litre 24.29 31.63 32.17 32.71 33.26 33.80 34.35 35.40 36.46 37.52 38.57 39.63 40.23 40.82 41.41 42.01 42.60 43.20 43.79 High Speed Diesel Oil Tk/MM kcal 3,902 5,080 5,167 5,255 5,342 5,430 5,517 5,687 5,857 6,026 6,196 6,366 6,461 6,557 6,652 6,748 6,843 6,939 7,034 Taka/Litre 34.95 45.50 46.28 47.06 47.85 48.63 49.41 50.93 52.45 53.97 55.49 57.01 57.87 58.72 59.58 60.43 61.29 62.14 63.00 Natural Gas (Domestic) Tk/MM kcal 309 333 Taka/10^3 cft 73.91 79.82 Natural Gas (Import) Tk/MM kcal 1,689 2,485 2,528 2,570 2,613 2,656 2,699 2,782 2,865 2,948 3,031 3,114 3,160 3,207 3,254 3,301 3,347 3,394 3,441 Taka/10^3 cft 404 595 605 615 626 636 646 666 686 706 726 745 757 768 779 790 801 813 824
Source: JICA study team
16-1
Legend: =Actuals and shall not be changed.
=Exchange rate indicated by JICA in March 2010. Actual Record by BB is US$1=Tk 69.185 for FY 2010.
=Estimate based on July-February Performance
=Fields for input with assumptive data.
Conversion Factor Coal (Domestic) 1 kg= 6,100 kcal Coal (Imported) 1 kg= 5,100 kcal Furnace Oil 1 litre= 9,546 kcal High Speed Diesel Oil 1 litre= 8,956 kcal Natural gas (MM kcal/GJ) 1MMkcal= 4.1868 GJ 1 M cal= 8.454*10^6 cubic meter Natural gas (GJ/MM BTU) 1MMBTU= 1.0551 GJ Natural gas (BTU per cubic feet) 1SCF= 1,029 1,000 BTU 1 cubic feet= 10.3399 mmcfd
BPDB 1 cubic feet= 239.4000 Kcal BPDB 1 cubic feet= 950.0000 BTU
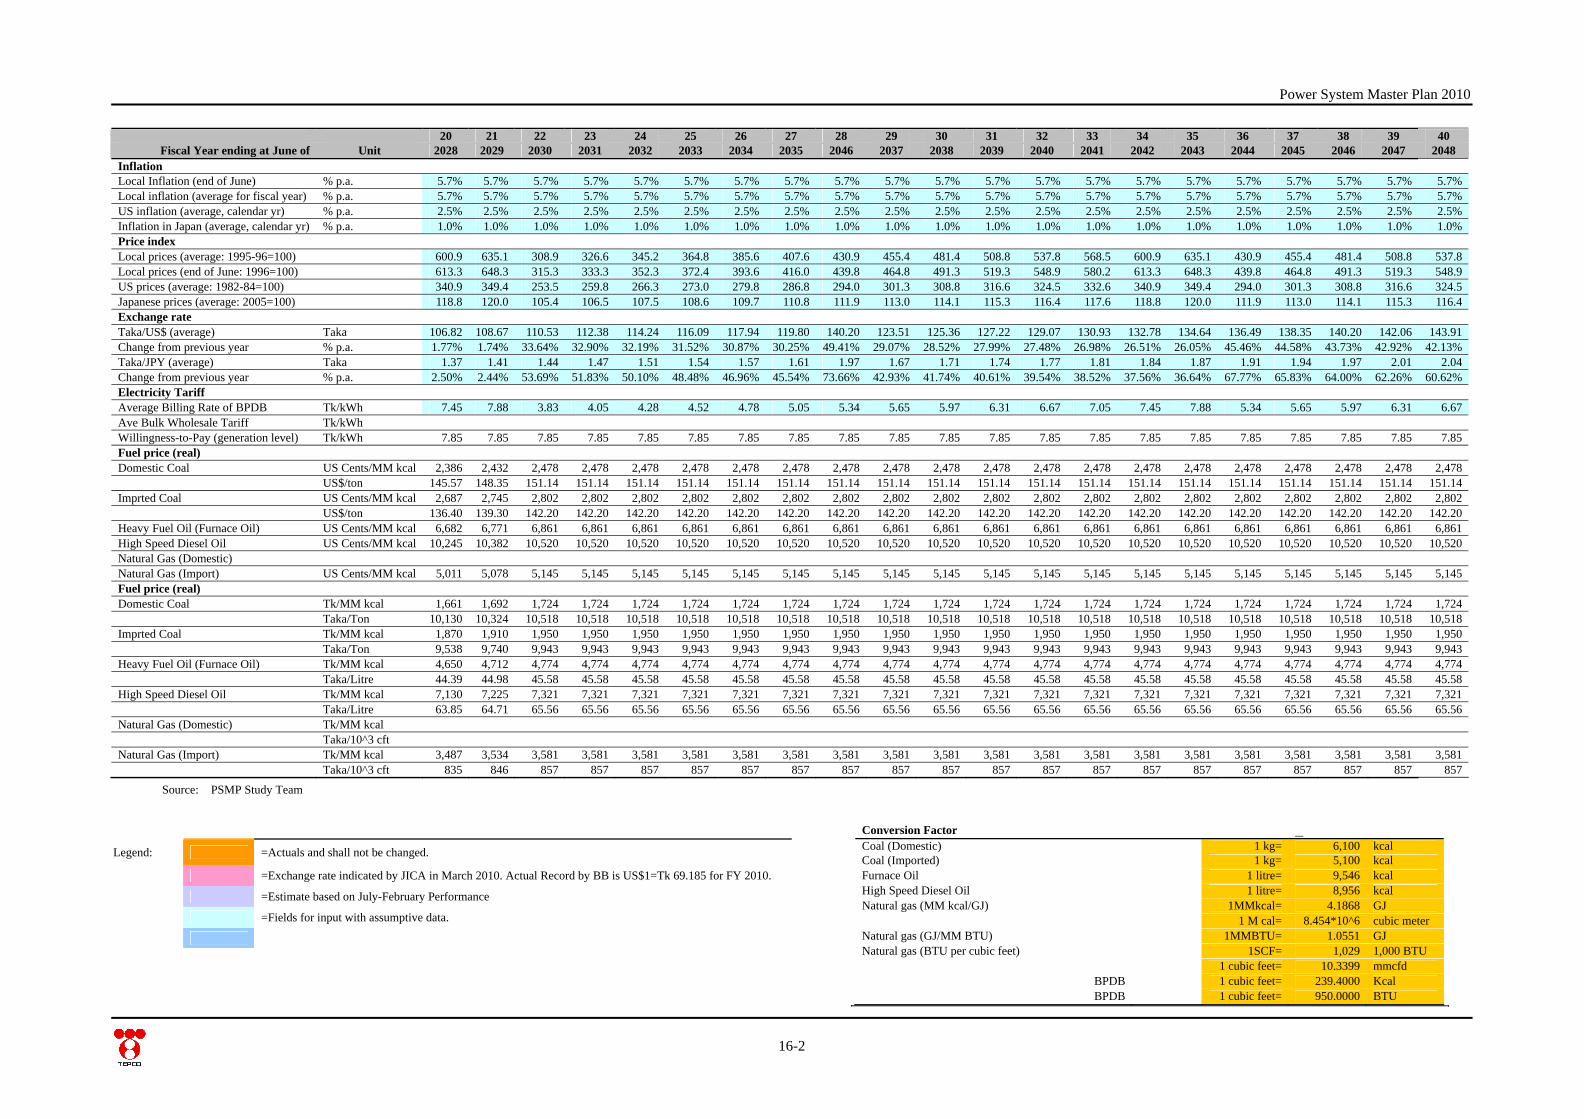
Power System Master Plan 2010
16-2
20 21 22 23 24 25 26 27 28 29 30 31 32 33 34 35 36 37 38 39 40
Fiscal Year ending at June of Unit 2028 2029 2030 2031 2032 2033 2034 2035 2046 2037 2038 2039 2040 2041 2042 2043 2044 2045 2046 2047 2048 Inflation Local Inflation (end of June) % p.a. 5.7% 5.7% 5.7% 5.7% 5.7% 5.7% 5.7% 5.7% 5.7% 5.7% 5.7% 5.7% 5.7% 5.7% 5.7% 5.7% 5.7% 5.7% 5.7% 5.7% 5.7%Local inflation (average for fiscal year) % p.a. 5.7% 5.7% 5.7% 5.7% 5.7% 5.7% 5.7% 5.7% 5.7% 5.7% 5.7% 5.7% 5.7% 5.7% 5.7% 5.7% 5.7% 5.7% 5.7% 5.7% 5.7%US inflation (average, calendar yr) % p.a. 2.5% 2.5% 2.5% 2.5% 2.5% 2.5% 2.5% 2.5% 2.5% 2.5% 2.5% 2.5% 2.5% 2.5% 2.5% 2.5% 2.5% 2.5% 2.5% 2.5% 2.5%Inflation in Japan (average, calendar yr) % p.a. 1.0% 1.0% 1.0% 1.0% 1.0% 1.0% 1.0% 1.0% 1.0% 1.0% 1.0% 1.0% 1.0% 1.0% 1.0% 1.0% 1.0% 1.0% 1.0% 1.0% 1.0%Price index Local prices (average: 1995-96=100) 600.9 635.1 308.9 326.6 345.2 364.8 385.6 407.6 430.9 455.4 481.4 508.8 537.8 568.5 600.9 635.1 430.9 455.4 481.4 508.8 537.8 Local prices (end of June: 1996=100) 613.3 648.3 315.3 333.3 352.3 372.4 393.6 416.0 439.8 464.8 491.3 519.3 548.9 580.2 613.3 648.3 439.8 464.8 491.3 519.3 548.9 US prices (average: 1982-84=100) 340.9 349.4 253.5 259.8 266.3 273.0 279.8 286.8 294.0 301.3 308.8 316.6 324.5 332.6 340.9 349.4 294.0 301.3 308.8 316.6 324.5 Japanese prices (average: 2005=100) 118.8 120.0 105.4 106.5 107.5 108.6 109.7 110.8 111.9 113.0 114.1 115.3 116.4 117.6 118.8 120.0 111.9 113.0 114.1 115.3 116.4 Exchange rate Taka/US$ (average) Taka 106.82 108.67 110.53 112.38 114.24 116.09 117.94 119.80 140.20 123.51 125.36 127.22 129.07 130.93 132.78 134.64 136.49 138.35 140.20 142.06 143.91 Change from previous year % p.a. 1.77% 1.74% 33.64% 32.90% 32.19% 31.52% 30.87% 30.25% 49.41% 29.07% 28.52% 27.99% 27.48% 26.98% 26.51% 26.05% 45.46% 44.58% 43.73% 42.92% 42.13%Taka/JPY (average) Taka 1.37 1.41 1.44 1.47 1.51 1.54 1.57 1.61 1.97 1.67 1.71 1.74 1.77 1.81 1.84 1.87 1.91 1.94 1.97 2.01 2.04 Change from previous year % p.a. 2.50% 2.44% 53.69% 51.83% 50.10% 48.48% 46.96% 45.54% 73.66% 42.93% 41.74% 40.61% 39.54% 38.52% 37.56% 36.64% 67.77% 65.83% 64.00% 62.26% 60.62%Electricity Tariff Average Billing Rate of BPDB Tk/kWh 7.45 7.88 3.83 4.05 4.28 4.52 4.78 5.05 5.34 5.65 5.97 6.31 6.67 7.05 7.45 7.88 5.34 5.65 5.97 6.31 6.67 Ave Bulk Wholesale Tariff Tk/kWh Willingness-to-Pay (generation level) Tk/kWh 7.85 7.85 7.85 7.85 7.85 7.85 7.85 7.85 7.85 7.85 7.85 7.85 7.85 7.85 7.85 7.85 7.85 7.85 7.85 7.85 7.85 Fuel price (real) Domestic Coal US Cents/MM kcal 2,386 2,432 2,478 2,478 2,478 2,478 2,478 2,478 2,478 2,478 2,478 2,478 2,478 2,478 2,478 2,478 2,478 2,478 2,478 2,478 2,478 US$/ton 145.57 148.35 151.14 151.14 151.14 151.14 151.14 151.14 151.14 151.14 151.14 151.14 151.14 151.14 151.14 151.14 151.14 151.14 151.14 151.14 151.14 Imprted Coal US Cents/MM kcal 2,687 2,745 2,802 2,802 2,802 2,802 2,802 2,802 2,802 2,802 2,802 2,802 2,802 2,802 2,802 2,802 2,802 2,802 2,802 2,802 2,802 US$/ton 136.40 139.30 142.20 142.20 142.20 142.20 142.20 142.20 142.20 142.20 142.20 142.20 142.20 142.20 142.20 142.20 142.20 142.20 142.20 142.20 142.20 Heavy Fuel Oil (Furnace Oil) US Cents/MM kcal 6,682 6,771 6,861 6,861 6,861 6,861 6,861 6,861 6,861 6,861 6,861 6,861 6,861 6,861 6,861 6,861 6,861 6,861 6,861 6,861 6,861 High Speed Diesel Oil US Cents/MM kcal 10,245 10,382 10,520 10,520 10,520 10,520 10,520 10,520 10,520 10,520 10,520 10,520 10,520 10,520 10,520 10,520 10,520 10,520 10,520 10,520 10,520 Natural Gas (Domestic) Natural Gas (Import) US Cents/MM kcal 5,011 5,078 5,145 5,145 5,145 5,145 5,145 5,145 5,145 5,145 5,145 5,145 5,145 5,145 5,145 5,145 5,145 5,145 5,145 5,145 5,145 Fuel price (real) Domestic Coal Tk/MM kcal 1,661 1,692 1,724 1,724 1,724 1,724 1,724 1,724 1,724 1,724 1,724 1,724 1,724 1,724 1,724 1,724 1,724 1,724 1,724 1,724 1,724 Taka/Ton 10,130 10,324 10,518 10,518 10,518 10,518 10,518 10,518 10,518 10,518 10,518 10,518 10,518 10,518 10,518 10,518 10,518 10,518 10,518 10,518 10,518 Imprted Coal Tk/MM kcal 1,870 1,910 1,950 1,950 1,950 1,950 1,950 1,950 1,950 1,950 1,950 1,950 1,950 1,950 1,950 1,950 1,950 1,950 1,950 1,950 1,950 Taka/Ton 9,538 9,740 9,943 9,943 9,943 9,943 9,943 9,943 9,943 9,943 9,943 9,943 9,943 9,943 9,943 9,943 9,943 9,943 9,943 9,943 9,943 Heavy Fuel Oil (Furnace Oil) Tk/MM kcal 4,650 4,712 4,774 4,774 4,774 4,774 4,774 4,774 4,774 4,774 4,774 4,774 4,774 4,774 4,774 4,774 4,774 4,774 4,774 4,774 4,774 Taka/Litre 44.39 44.98 45.58 45.58 45.58 45.58 45.58 45.58 45.58 45.58 45.58 45.58 45.58 45.58 45.58 45.58 45.58 45.58 45.58 45.58 45.58 High Speed Diesel Oil Tk/MM kcal 7,130 7,225 7,321 7,321 7,321 7,321 7,321 7,321 7,321 7,321 7,321 7,321 7,321 7,321 7,321 7,321 7,321 7,321 7,321 7,321 7,321 Taka/Litre 63.85 64.71 65.56 65.56 65.56 65.56 65.56 65.56 65.56 65.56 65.56 65.56 65.56 65.56 65.56 65.56 65.56 65.56 65.56 65.56 65.56 Natural Gas (Domestic) Tk/MM kcal Taka/10^3 cft Natural Gas (Import) Tk/MM kcal 3,487 3,534 3,581 3,581 3,581 3,581 3,581 3,581 3,581 3,581 3,581 3,581 3,581 3,581 3,581 3,581 3,581 3,581 3,581 3,581 3,581 Taka/10^3 cft 835 846 857 857 857 857 857 857 857 857 857 857 857 857 857 857 857 857 857 857 857
Legend: =Actuals and shall not be changed.
=Exchange rate indicated by JICA in March 2010. Actual Record by BB is US$1=Tk 69.185 for FY 2010.
=Estimate based on July-February Performance
=Fields for input with assumptive data.
Conversion Factor Coal (Domestic) 1 kg= 6,100 kcal Coal (Imported) 1 kg= 5,100 kcal Furnace Oil 1 litre= 9,546 kcal High Speed Diesel Oil 1 litre= 8,956 kcal Natural gas (MM kcal/GJ) 1MMkcal= 4.1868 GJ 1 M cal= 8.454*10^6 cubic meter Natural gas (GJ/MM BTU) 1MMBTU= 1.0551 GJ Natural gas (BTU per cubic feet) 1SCF= 1,029 1,000 BTU 1 cubic feet= 10.3399 mmcfd
BPDB 1 cubic feet= 239.4000 Kcal BPDB 1 cubic feet= 950.0000 BTU
Source: PSMP Study Team
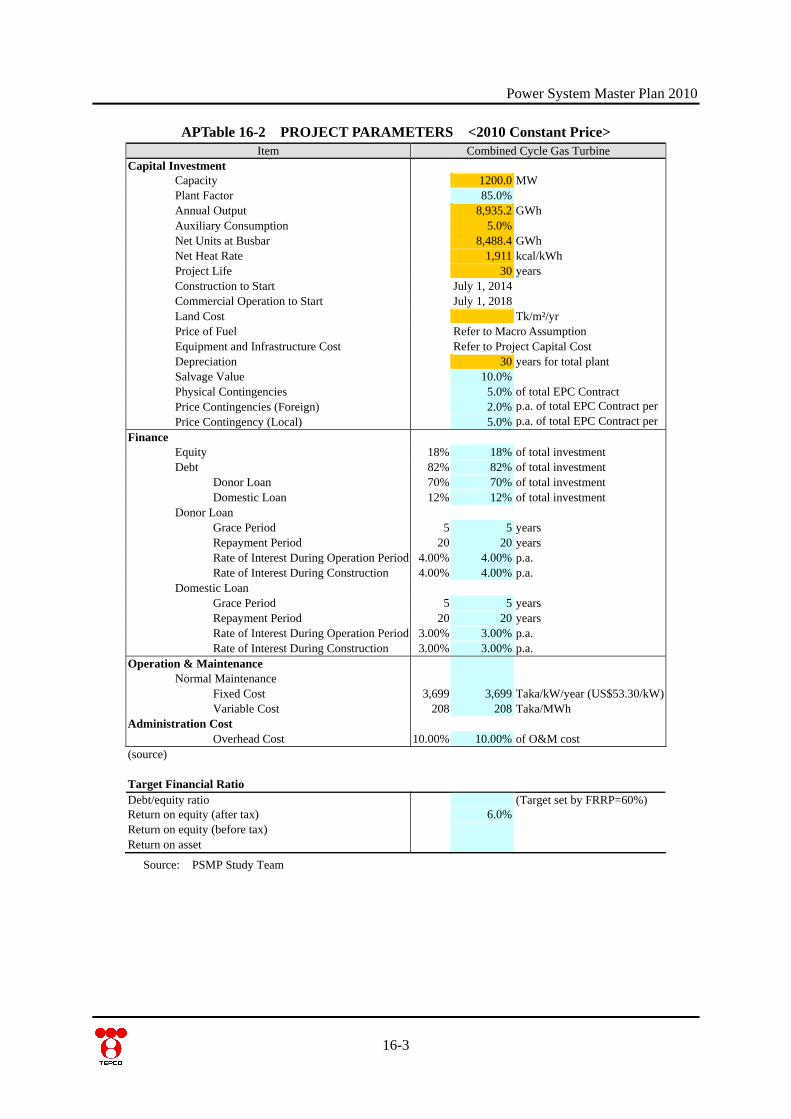
Power System Master Plan 2010
APTable 16-2 PROJECT PARAMETERS <2010 Constant Price> Item Combined Cycle Gas Turbine
Capital Investment Capacity 1200.0 MW Plant Factor 85.0% Annual Output 8,935.2 GWh Auxiliary Consumption 5.0% Net Units at Busbar 8,488.4 GWh Net Heat Rate 1,911 kcal/kWh Project Life 30 years Construction to Start July 1, 2014 Commercial Operation to Start July 1, 2018 Land Cost Tk/m²/yr Price of Fuel Refer to Macro Assumption Equipment and Infrastructure Cost Refer to Project Capital Cost Depreciation 30 years for total plant Salvage Value 10.0% Physical Contingencies 5.0% of total EPC Contract Price Contingencies (Foreign) 2.0% p.a. of total EPC Contract per Price Contingency (Local) 5.0% p.a. of total EPC Contract per Finance Equity 18% 18% of total investment Debt 82% 82% of total investment Donor Loan 70% 70% of total investment Domestic Loan 12% 12% of total investment Donor Loan Grace Period 5 5 years Repayment Period 20 20 years Rate of Interest During Operation Period 4.00% 4.00% p.a. Rate of Interest During Construction 4.00% 4.00% p.a. Domestic Loan Grace Period 5 5 years Repayment Period 20 20 years Rate of Interest During Operation Period 3.00% 3.00% p.a. Rate of Interest During Construction 3.00% 3.00% p.a. Operation & Maintenance Normal Maintenance Fixed Cost 3,699 3,699 Taka/kW/year (US$53.30/kW) Variable Cost 208 208 Taka/MWh Administration Cost Overhead Cost 10.00% 10.00% of O&M cost (source) Target Financial Ratio Debt/equity ratio (Target set by FRRP=60%) Return on equity (after tax) 6.0%Return on equity (before tax) Return on asset
Source: PSMP Study Team
16-3
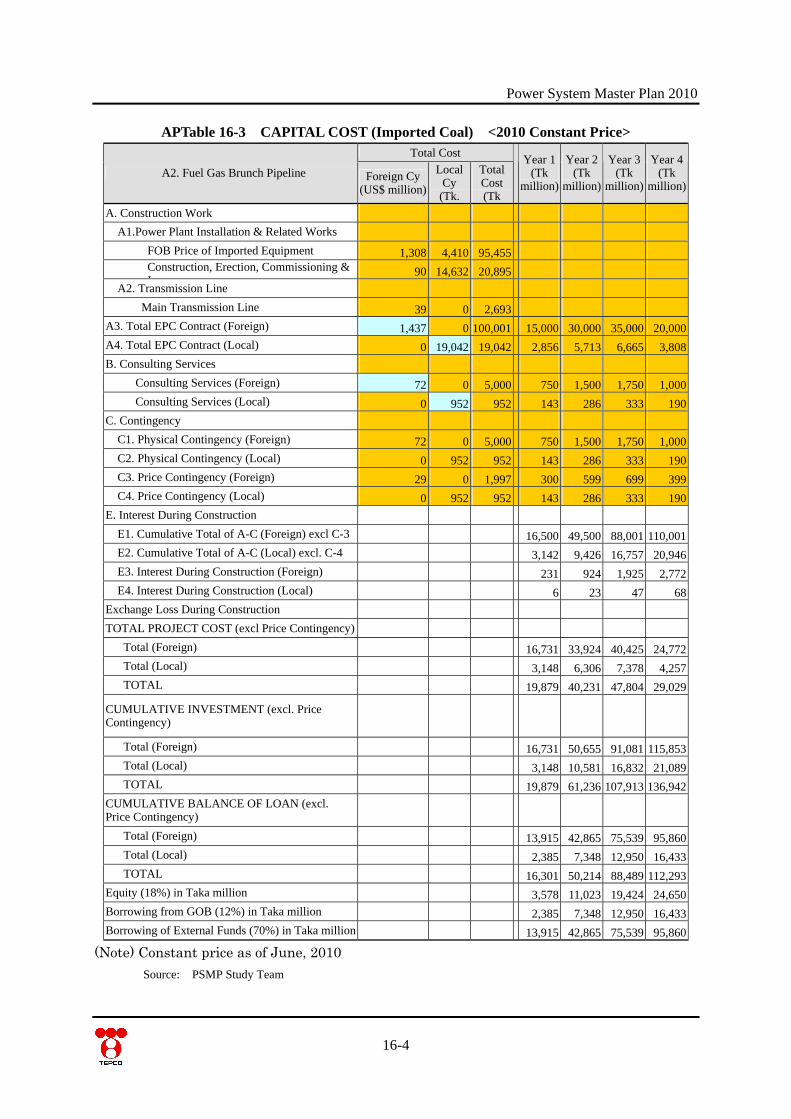
Power System Master Plan 2010
APTable 16-3 CAPITAL COST (Imported Coal) <2010 Constant Price> Total Cost
A2. Fuel Gas Brunch Pipeline Foreign Cy(US$ million)
Local Cy
(Tk.
Total Cost (Tk
Year 1(Tk
million)
Year 2 (Tk
million)
Year 3 (Tk
million)
Year 4(Tk
million)
A. Construction Work
A1.Power Plant Installation & Related Works FOB Price of Imported Equipment 1,308 4,410 95,455 Construction, Erection, Commissioning &
I90 14,632 20,895
A2. Transmission Line Main Transmission Line 39 0 2,693 A3. Total EPC Contract (Foreign) 1,437 0 100,001 15,000 30,000 35,000 20,000 A4. Total EPC Contract (Local) 0 19,042 19,042 2,856 5,713 6,665 3,808 B. Consulting Services Consulting Services (Foreign) 72 0 5,000 750 1,500 1,750 1,000 Consulting Services (Local) 0 952 952 143 286 333 190 C. Contingency C1. Physical Contingency (Foreign) 72 0 5,000 750 1,500 1,750 1,000 C2. Physical Contingency (Local) 0 952 952 143 286 333 190 C3. Price Contingency (Foreign) 29 0 1,997 300 599 699 399 C4. Price Contingency (Local) 0 952 952 143 286 333 190 E. Interest During Construction E1. Cumulative Total of A-C (Foreign) excl C-3 16,500 49,500 88,001 110,001 E2. Cumulative Total of A-C (Local) excl. C-4 3,142 9,426 16,757 20,946 E3. Interest During Construction (Foreign) 231 924 1,925 2,772 E4. Interest During Construction (Local) 6 23 47 68 Exchange Loss During Construction TOTAL PROJECT COST (excl Price Contingency) Total (Foreign) 16,731 33,924 40,425 24,772 Total (Local) 3,148 6,306 7,378 4,257 TOTAL 19,879 40,231 47,804 29,029
CUMULATIVE INVESTMENT (excl. Price Contingency)
Total (Foreign) 16,731 50,655 91,081 115,853 Total (Local) 3,148 10,581 16,832 21,089 TOTAL 19,879 61,236 107,913 136,942 CUMULATIVE BALANCE OF LOAN (excl. Price Contingency)
Total (Foreign) 13,915 42,865 75,539 95,860 Total (Local) 2,385 7,348 12,950 16,433 TOTAL 16,301 50,214 88,489 112,293 Equity (18%) in Taka million 3,578 11,023 19,424 24,650 Borrowing from GOB (12%) in Taka million 2,385 7,348 12,950 16,433 Borrowing of External Funds (70%) in Taka million 13,915 42,865 75,539 95,860
(Note) Constant price as of June, 2010
Source: PSMP Study Team
16-4
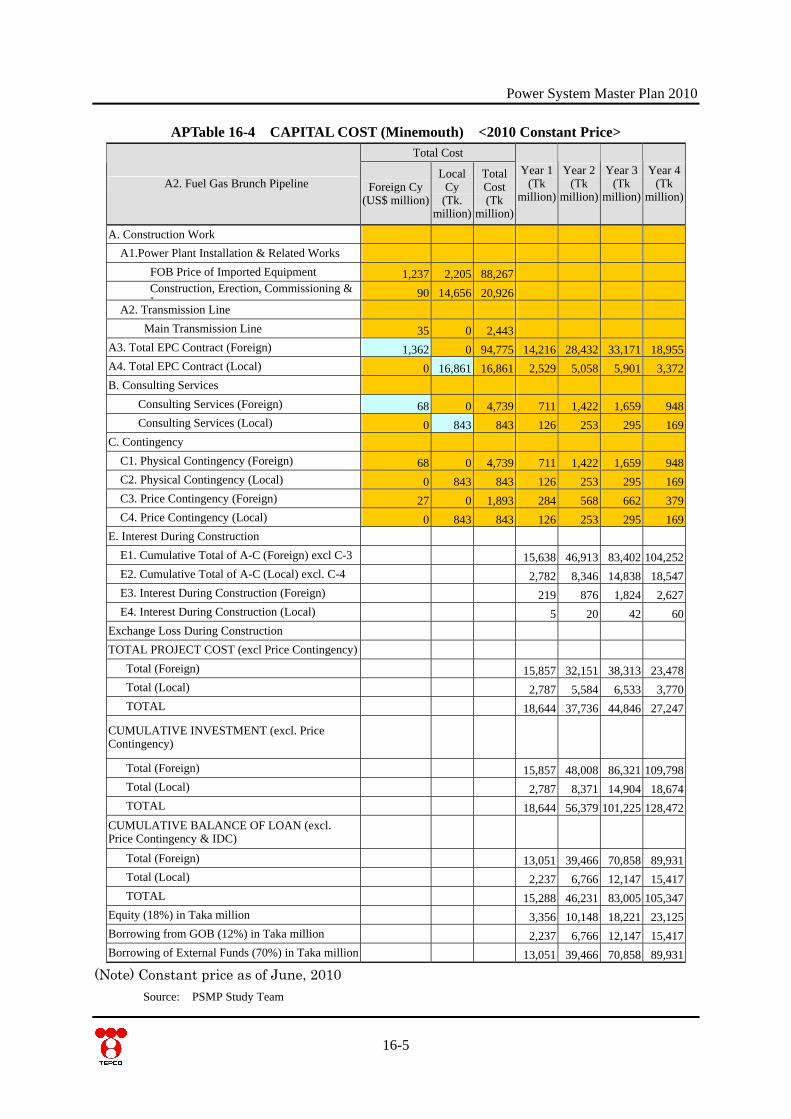
Power System Master Plan 2010
16-5
APTable 16-4 CAPITAL COST (Minemouth) <2010 Constant Price> Total Cost
A2. Fuel Gas Brunch Pipeline Foreign Cy(US$ million)
Local Cy
(Tk. million)
Total Cost (Tk
million)
Year 1(Tk
million)
Year 2 (Tk
million)
Year 3 (Tk
million)
Year 4(Tk
million)
A. Construction Work
A1.Power Plant Installation & Related Works FOB Price of Imported Equipment 1,237 2,205 88,267 Construction, Erection, Commissioning &
I90 14,656 20,926
A2. Transmission Line Main Transmission Line 35 0 2,443 A3. Total EPC Contract (Foreign) 1,362 0 94,775 14,216 28,432 33,171 18,955 A4. Total EPC Contract (Local) 0 16,861 16,861 2,529 5,058 5,901 3,372 B. Consulting Services Consulting Services (Foreign) 68 0 4,739 711 1,422 1,659 948 Consulting Services (Local) 0 843 843 126 253 295 169 C. Contingency C1. Physical Contingency (Foreign) 68 0 4,739 711 1,422 1,659 948 C2. Physical Contingency (Local) 0 843 843 126 253 295 169 C3. Price Contingency (Foreign) 27 0 1,893 284 568 662 379 C4. Price Contingency (Local) 0 843 843 126 253 295 169 E. Interest During Construction E1. Cumulative Total of A-C (Foreign) excl C-3 15,638 46,913 83,402 104,252 E2. Cumulative Total of A-C (Local) excl. C-4 2,782 8,346 14,838 18,547 E3. Interest During Construction (Foreign) 219 876 1,824 2,627 E4. Interest During Construction (Local) 5 20 42 60 Exchange Loss During Construction TOTAL PROJECT COST (excl Price Contingency) Total (Foreign) 15,857 32,151 38,313 23,478 Total (Local) 2,787 5,584 6,533 3,770 TOTAL 18,644 37,736 44,846 27,247
CUMULATIVE INVESTMENT (excl. Price Contingency)
Total (Foreign) 15,857 48,008 86,321 109,798 Total (Local) 2,787 8,371 14,904 18,674 TOTAL 18,644 56,379 101,225 128,472 CUMULATIVE BALANCE OF LOAN (excl. Price Contingency & IDC)
Total (Foreign) 13,051 39,466 70,858 89,931 Total (Local) 2,237 6,766 12,147 15,417 TOTAL 15,288 46,231 83,005 105,347 Equity (18%) in Taka million 3,356 10,148 18,221 23,125 Borrowing from GOB (12%) in Taka million 2,237 6,766 12,147 15,417 Borrowing of External Funds (70%) in Taka million 13,051 39,466 70,858 89,931
(Note) Constant price as of June, 2010
Source: PSMP Study Team

Power System Master Plan 2010
APTable 16-5 CAPITAL & OPERATIONAL COST <EIRR> (Imported Coal) (Taka Million)
1 2 3 4 5 6 7 8 9 10 11 12 13 14 15 16 17 18 19 20 Fiscal Year Ending at Unit 2015 2016 2017 2018 2019 2020 2021 2022 2023 2024 2025 2026 2027 2028 2029 2030 2031 2032 2033 2034
Gross Annual Energy Output (GWh) 8,935 8,935 8,935 8,935 8,935 8,935 8,935 8,935 8,935 8,935 8,935 8,935 8,935 8,935 8,935 8,935 Net Annual Energy Output (GWh) 8,488 8,488 8,488 8,488 8,488 8,488 8,488 8,488 8,488 8,488 8,488 8,488 8,488 8,488 8,488 8,488
Electricity Sales 66,634 66,634 66,634 66,634 66,634 66,634 66,634 66,634 66,634 66,634 66,634 66,634 66,634 66,634 66,634 66,634
Capital Expenditure (cumulative) 19,879 61,236 107,913 136,942
Foreign Currency 16,731 50,655 91,081 115,853
Local Currency 3,148 10,581 16,832 21,089
Fund Raising (Balance at Year End)
Equity (Cumulative Investment) 3,578 11,023 19,424 24,650 24,650 24,650 24,650 24,650 24,650 24,650 24,650 24,650 24,650 24,650 24,650 24,650 24,650 24,650 24,650 24,650 Loan Balance (foreign) 13,915 42,865 75,539 95,860 95,860 95,860 95,860 95,860 95,860 89,469 83,078 76,688 70,297 63,906 57,516 51,125 44,735 38,344 31,953 25,563 Loan Balance (local) 2,385 7,348 12,950 16,433 16,433 16,433 16,433 16,433 16,433 15,338 14,242 13,146 12,051 10,955 9,860 8,764 7,669 6,573 5,478 4,382 Repayment of Loans Foreign Loan Repayment 0 0 0 0 0 6,391 6,391 6,391 6,391 6,391 6,391 6,391 6,391 6,391 6,391 6,391 Local Loan Repayment 0 0 0 0 0 1,096 1,096 1,096 1,096 1,096 1,096 1,096 1,096 1,096 1,096 1,096 Equity Increase of Equity 0 0 0 0 0 0 0 0 0 0 0 0 0 0 0 0 Redemption of Equity 0 0 0 0 0 0 0 0 0 0 0 0 0 0 0 0 Fixed Cost
O & M (Fixed) 4,439 4,439 4,439 4,439 4,439 4,439 4,439 4,439 4,439 4,439 4,439 4,439 4,439 4,439 4,439 4,439 Admin Overhead Expense (Fixed) 444 444 444 444 444 444 444 444 444 444 444 444 444 444 444 444 Depreciation
Variable Cost
Fuel Cost 25,308 26,080 26,853 27,625 28,374 29,100 29,826 30,552 31,231 31,933 32,612 33,291 33,291 33,291 33,291 33,291 O & M (Variable) 1,859 1,859 1,859 1,859 1,859 1,859 1,859 1,859 1,859 1,859 1,859 1,859 1,859 1,859 1,859 1,859 Admin Overhead Expense (Variable) 186 186 186 186 186 186 186 186 186 186 186 186 186 186 186 186 Salvage Value
Land
Plant
Annual Costs 32,235 33,007 33,780 34,552 35,302 36,027 36,753 37,479 38,158 38,860 39,539 40,218 40,218 40,218 40,218 40,218 Total Fixed Costs 4,883 4,883 4,883 4,883 4,883 4,883 4,883 4,883 4,883 4,883 4,883 4,883 4,883 4,883 4,883 4,883 Total Variable Costs 27,352 28,125 28,897 29,670 30,419 31,145 31,870 32,596 33,275 33,977 34,656 35,335 35,335 35,335 35,335 35,335 EIRR under the Logical Willingness-to-Pay
Economic Benefit 66,634 66,634 66,634 66,634 66,634 66,634 66,634 66,634 66,634 66,634 66,634 66,634 66,634 66,634 66,634 66,634 Capital Cost 19,879 41,357 46,677 29,029 Operation Cost 32,235 33,007 33,780 34,552 35,302 36,027 36,753 37,479 38,158 38,860 39,539 40,218 40,218 40,218 40,218 40,218 Economic Benefit - Economic Cost -19,879 -41,357 -46,677 -29,029 34,400 33,627 32,855 32,082 31,333 30,607 29,881 29,155 28,477 27,774 27,095 26,416 26,416 26,416 26,416 26,416 EIRR 17.69%
Source: PSMP Study Team
16-6
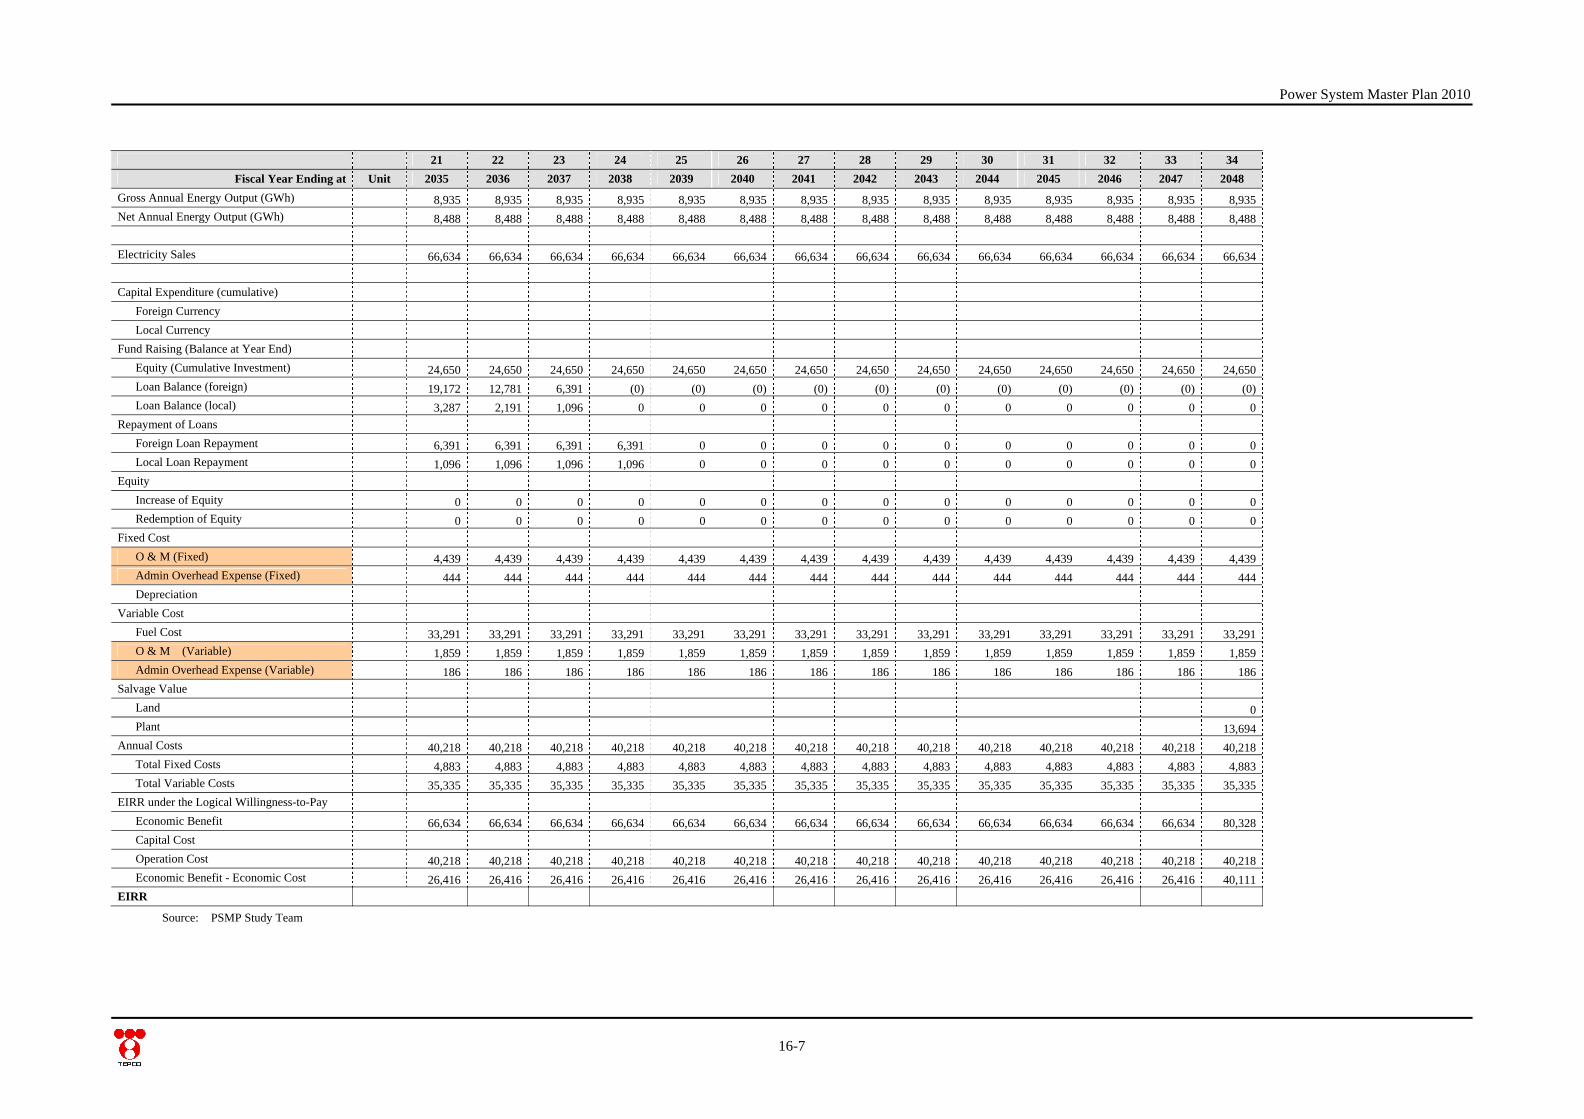
Power System Master Plan 2010
16-7
21 22 23 24 25 26 27 28 29 30 31 32 33 34
Fiscal Year Ending at Unit 2035 2036 2037 2038 2039 2040 2041 2042 2043 2044 2045 2046 2047 2048 Gross Annual Energy Output (GWh) 8,935 8,935 8,935 8,935 8,935 8,935 8,935 8,935 8,935 8,935 8,935 8,935 8,935 8,935 Net Annual Energy Output (GWh) 8,488 8,488 8,488 8,488 8,488 8,488 8,488 8,488 8,488 8,488 8,488 8,488 8,488 8,488 Electricity Sales 66,634 66,634 66,634 66,634 66,634 66,634 66,634 66,634 66,634 66,634 66,634 66,634 66,634 66,634 Capital Expenditure (cumulative) Foreign Currency Local Currency Fund Raising (Balance at Year End) Equity (Cumulative Investment) 24,650 24,650 24,650 24,650 24,650 24,650 24,650 24,650 24,650 24,650 24,650 24,650 24,650 24,650 Loan Balance (foreign) 19,172 12,781 6,391 (0) (0) (0) (0) (0) (0) (0) (0) (0) (0) (0) Loan Balance (local) 3,287 2,191 1,096 0 0 0 0 0 0 0 0 0 0 0 Repayment of Loans Foreign Loan Repayment 6,391 6,391 6,391 6,391 0 0 0 0 0 0 0 0 0 0 Local Loan Repayment 1,096 1,096 1,096 1,096 0 0 0 0 0 0 0 0 0 0 Equity Increase of Equity 0 0 0 0 0 0 0 0 0 0 0 0 0 0 Redemption of Equity 0 0 0 0 0 0 0 0 0 0 0 0 0 0 Fixed Cost O & M (Fixed) 4,439 4,439 4,439 4,439 4,439 4,439 4,439 4,439 4,439 4,439 4,439 4,439 4,439 4,439 Admin Overhead Expense (Fixed) 444 444 444 444 444 444 444 444 444 444 444 444 444 444 Depreciation Variable Cost Fuel Cost 33,291 33,291 33,291 33,291 33,291 33,291 33,291 33,291 33,291 33,291 33,291 33,291 33,291 33,291 O & M (Variable) 1,859 1,859 1,859 1,859 1,859 1,859 1,859 1,859 1,859 1,859 1,859 1,859 1,859 1,859 Admin Overhead Expense (Variable) 186 186 186 186 186 186 186 186 186 186 186 186 186 186 Salvage Value Land 0 Plant 13,694 Annual Costs 40,218 40,218 40,218 40,218 40,218 40,218 40,218 40,218 40,218 40,218 40,218 40,218 40,218 40,218 Total Fixed Costs 4,883 4,883 4,883 4,883 4,883 4,883 4,883 4,883 4,883 4,883 4,883 4,883 4,883 4,883 Total Variable Costs 35,335 35,335 35,335 35,335 35,335 35,335 35,335 35,335 35,335 35,335 35,335 35,335 35,335 35,335 EIRR under the Logical Willingness-to-Pay Economic Benefit 66,634 66,634 66,634 66,634 66,634 66,634 66,634 66,634 66,634 66,634 66,634 66,634 66,634 80,328 Capital Cost Operation Cost 40,218 40,218 40,218 40,218 40,218 40,218 40,218 40,218 40,218 40,218 40,218 40,218 40,218 40,218 Economic Benefit - Economic Cost 26,416 26,416 26,416 26,416 26,416 26,416 26,416 26,416 26,416 26,416 26,416 26,416 26,416 40,111 EIRR
Source: PSMP Study Team
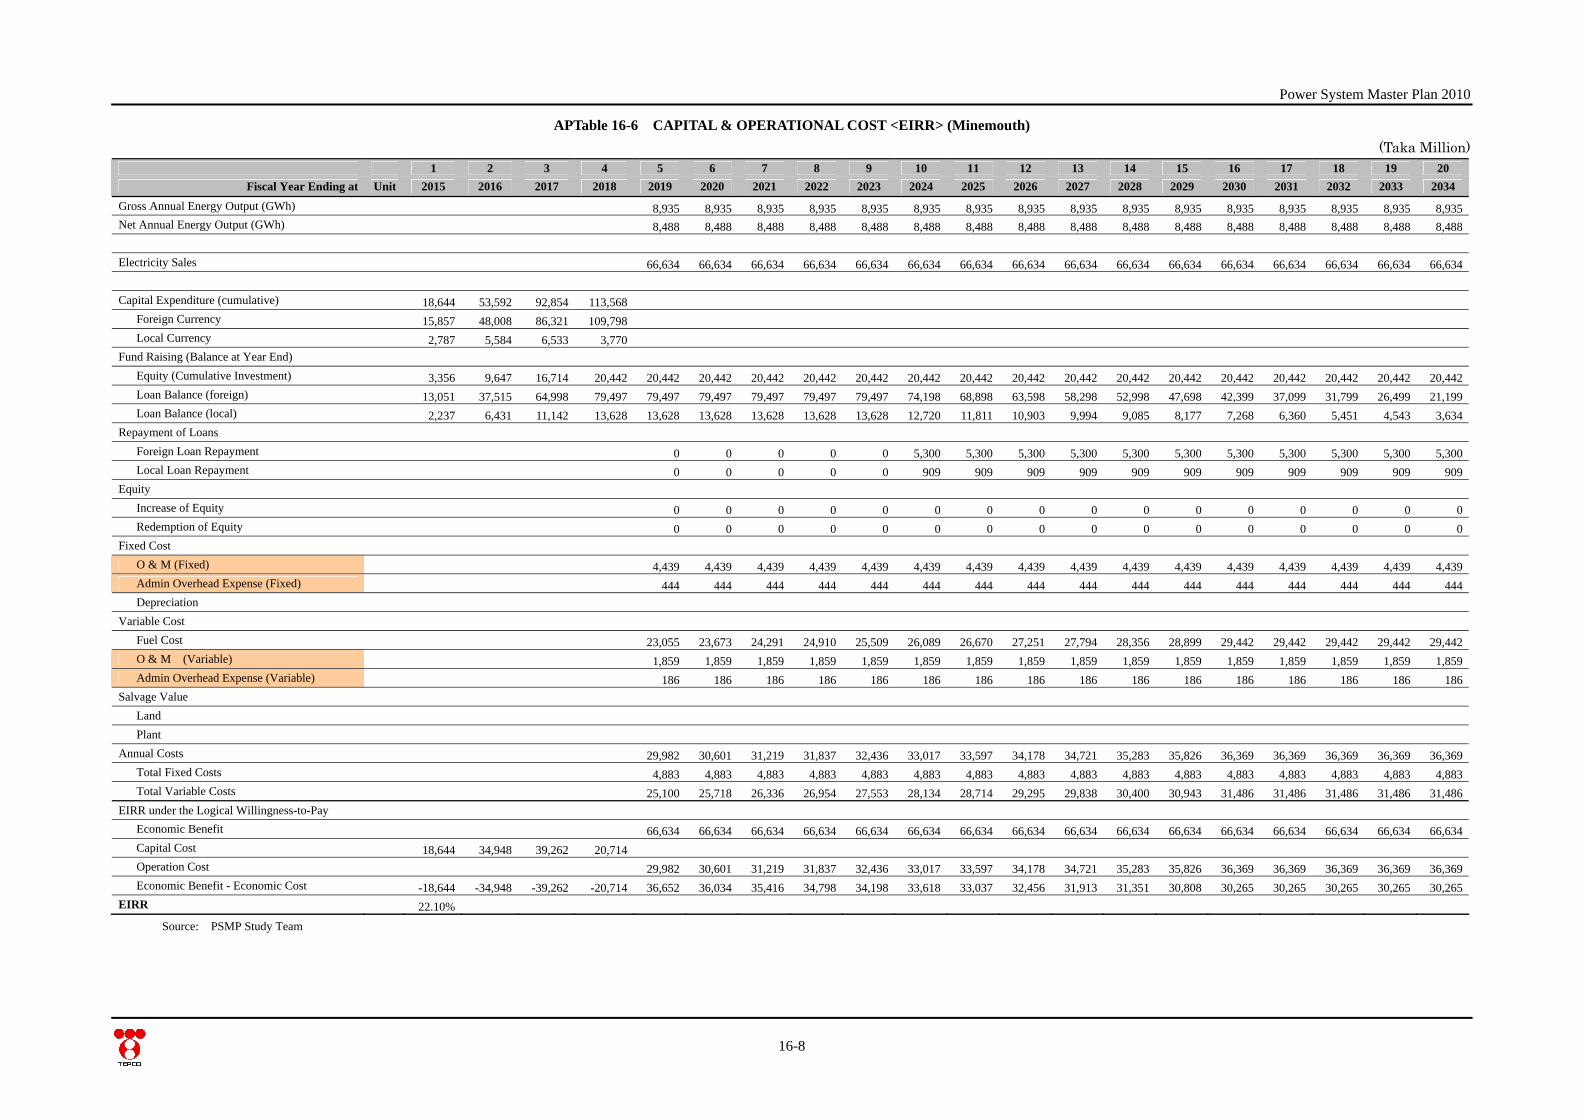
Power System Master Plan 2010
16-8
APTable 16-6 CAPITAL & OPERATIONAL COST <EIRR> (Minemouth) (Taka Million)
1 2 3 4 5 6 7 8 9 10 11 12 13 14 15 16 17 18 19 20 Fiscal Year Ending at Unit 2015 2016 2017 2018 2019 2020 2021 2022 2023 2024 2025 2026 2027 2028 2029 2030 2031 2032 2033 2034
Gross Annual Energy Output (GWh) 8,935 8,935 8,935 8,935 8,935 8,935 8,935 8,935 8,935 8,935 8,935 8,935 8,935 8,935 8,935 8,935 Net Annual Energy Output (GWh) 8,488 8,488 8,488 8,488 8,488 8,488 8,488 8,488 8,488 8,488 8,488 8,488 8,488 8,488 8,488 8,488
Electricity Sales 66,634 66,634 66,634 66,634 66,634 66,634 66,634 66,634 66,634 66,634 66,634 66,634 66,634 66,634 66,634 66,634
Capital Expenditure (cumulative) 18,644 53,592 92,854 113,568
Foreign Currency 15,857 48,008 86,321 109,798
Local Currency 2,787 5,584 6,533 3,770
Fund Raising (Balance at Year End)
Equity (Cumulative Investment) 3,356 9,647 16,714 20,442 20,442 20,442 20,442 20,442 20,442 20,442 20,442 20,442 20,442 20,442 20,442 20,442 20,442 20,442 20,442 20,442 Loan Balance (foreign) 13,051 37,515 64,998 79,497 79,497 79,497 79,497 79,497 79,497 74,198 68,898 63,598 58,298 52,998 47,698 42,399 37,099 31,799 26,499 21,199 Loan Balance (local) 2,237 6,431 11,142 13,628 13,628 13,628 13,628 13,628 13,628 12,720 11,811 10,903 9,994 9,085 8,177 7,268 6,360 5,451 4,543 3,634 Repayment of Loans Foreign Loan Repayment 0 0 0 0 0 5,300 5,300 5,300 5,300 5,300 5,300 5,300 5,300 5,300 5,300 5,300 Local Loan Repayment 0 0 0 0 0 909 909 909 909 909 909 909 909 909 909 909 Equity Increase of Equity 0 0 0 0 0 0 0 0 0 0 0 0 0 0 0 0 Redemption of Equity 0 0 0 0 0 0 0 0 0 0 0 0 0 0 0 0 Fixed Cost
O & M (Fixed) 4,439 4,439 4,439 4,439 4,439 4,439 4,439 4,439 4,439 4,439 4,439 4,439 4,439 4,439 4,439 4,439 Admin Overhead Expense (Fixed) 444 444 444 444 444 444 444 444 444 444 444 444 444 444 444 444 Depreciation
Variable Cost
Fuel Cost 23,055 23,673 24,291 24,910 25,509 26,089 26,670 27,251 27,794 28,356 28,899 29,442 29,442 29,442 29,442 29,442 O & M (Variable) 1,859 1,859 1,859 1,859 1,859 1,859 1,859 1,859 1,859 1,859 1,859 1,859 1,859 1,859 1,859 1,859 Admin Overhead Expense (Variable) 186 186 186 186 186 186 186 186 186 186 186 186 186 186 186 186 Salvage Value
Land
Plant
Annual Costs 29,982 30,601 31,219 31,837 32,436 33,017 33,597 34,178 34,721 35,283 35,826 36,369 36,369 36,369 36,369 36,369 Total Fixed Costs 4,883 4,883 4,883 4,883 4,883 4,883 4,883 4,883 4,883 4,883 4,883 4,883 4,883 4,883 4,883 4,883 Total Variable Costs 25,100 25,718 26,336 26,954 27,553 28,134 28,714 29,295 29,838 30,400 30,943 31,486 31,486 31,486 31,486 31,486 EIRR under the Logical Willingness-to-Pay
Economic Benefit 66,634 66,634 66,634 66,634 66,634 66,634 66,634 66,634 66,634 66,634 66,634 66,634 66,634 66,634 66,634 66,634 Capital Cost 18,644 34,948 39,262 20,714 Operation Cost 29,982 30,601 31,219 31,837 32,436 33,017 33,597 34,178 34,721 35,283 35,826 36,369 36,369 36,369 36,369 36,369 Economic Benefit - Economic Cost -18,644 -34,948 -39,262 -20,714 36,652 36,034 35,416 34,798 34,198 33,618 33,037 32,456 31,913 31,351 30,808 30,265 30,265 30,265 30,265 30,265 EIRR 22.10%
Source: PSMP Study Team
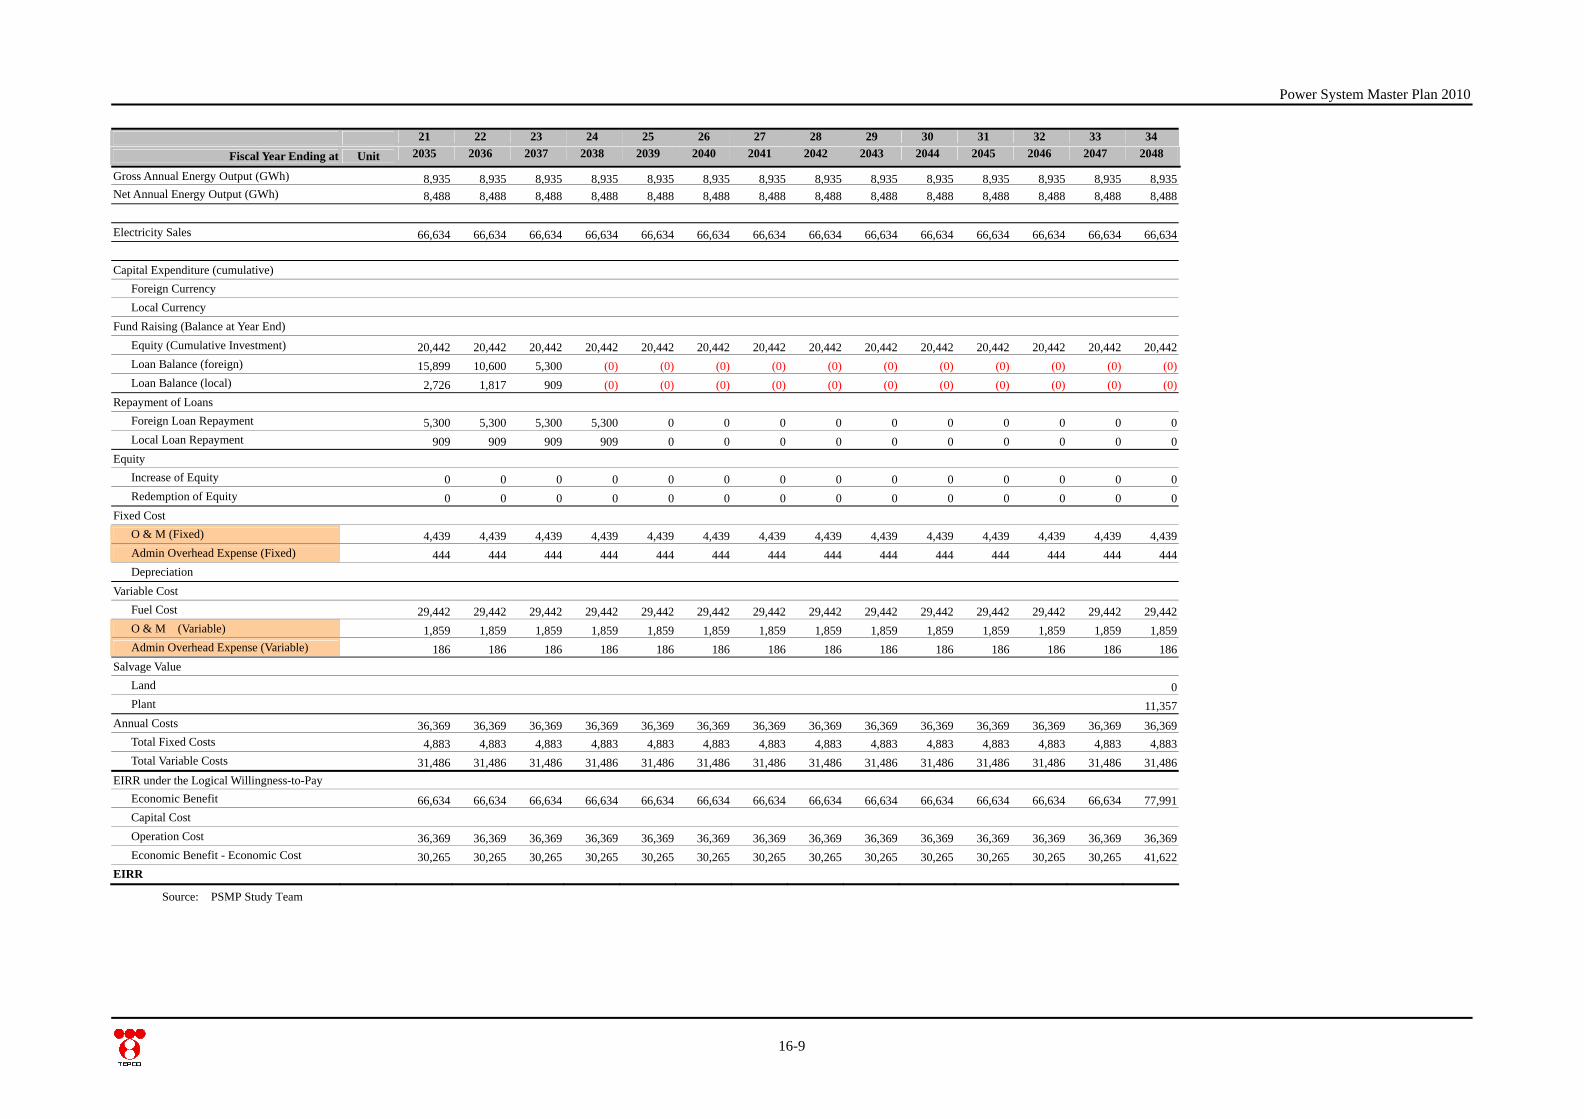
Power System Master Plan 2010
16-9
21 22 23 24 25 26 27 28 29 30 31 32 33 34
Fiscal Year Ending at Unit 2035 2036 2037 2038 2039 2040 2041 2042 2043 2044 2045 2046 2047 2048
Gross Annual Energy Output (GWh) 8,935 8,935 8,935 8,935 8,935 8,935 8,935 8,935 8,935 8,935 8,935 8,935 8,935 8,935 Net Annual Energy Output (GWh) 8,488 8,488 8,488 8,488 8,488 8,488 8,488 8,488 8,488 8,488 8,488 8,488 8,488 8,488
Electricity Sales 66,634 66,634 66,634 66,634 66,634 66,634 66,634 66,634 66,634 66,634 66,634 66,634 66,634 66,634
Capital Expenditure (cumulative)
Foreign Currency
Local Currency
Fund Raising (Balance at Year End)
Equity (Cumulative Investment) 20,442 20,442 20,442 20,442 20,442 20,442 20,442 20,442 20,442 20,442 20,442 20,442 20,442 20,442 Loan Balance (foreign) 15,899 10,600 5,300 (0) (0) (0) (0) (0) (0) (0) (0) (0) (0) (0) Loan Balance (local) 2,726 1,817 909 (0) (0) (0) (0) (0) (0) (0) (0) (0) (0) (0) Repayment of Loans Foreign Loan Repayment 5,300 5,300 5,300 5,300 0 0 0 0 0 0 0 0 0 0 Local Loan Repayment 909 909 909 909 0 0 0 0 0 0 0 0 0 0 Equity Increase of Equity 0 0 0 0 0 0 0 0 0 0 0 0 0 0 Redemption of Equity 0 0 0 0 0 0 0 0 0 0 0 0 0 0 Fixed Cost O & M (Fixed) 4,439 4,439 4,439 4,439 4,439 4,439 4,439 4,439 4,439 4,439 4,439 4,439 4,439 4,439 Admin Overhead Expense (Fixed) 444 444 444 444 444 444 444 444 444 444 444 444 444 444 Depreciation
Variable Cost
Fuel Cost 29,442 29,442 29,442 29,442 29,442 29,442 29,442 29,442 29,442 29,442 29,442 29,442 29,442 29,442 O & M (Variable) 1,859 1,859 1,859 1,859 1,859 1,859 1,859 1,859 1,859 1,859 1,859 1,859 1,859 1,859 Admin Overhead Expense (Variable) 186 186 186 186 186 186 186 186 186 186 186 186 186 186 Salvage Value Land 0 Plant 11,357 Annual Costs 36,369 36,369 36,369 36,369 36,369 36,369 36,369 36,369 36,369 36,369 36,369 36,369 36,369 36,369 Total Fixed Costs 4,883 4,883 4,883 4,883 4,883 4,883 4,883 4,883 4,883 4,883 4,883 4,883 4,883 4,883 Total Variable Costs 31,486 31,486 31,486 31,486 31,486 31,486 31,486 31,486 31,486 31,486 31,486 31,486 31,486 31,486 EIRR under the Logical Willingness-to-Pay
Economic Benefit 66,634 66,634 66,634 66,634 66,634 66,634 66,634 66,634 66,634 66,634 66,634 66,634 66,634 77,991 Capital Cost Operation Cost 36,369 36,369 36,369 36,369 36,369 36,369 36,369 36,369 36,369 36,369 36,369 36,369 36,369 36,369 Economic Benefit - Economic Cost 30,265 30,265 30,265 30,265 30,265 30,265 30,265 30,265 30,265 30,265 30,265 30,265 30,265 41,622 EIRR
Source: PSMP Study Team
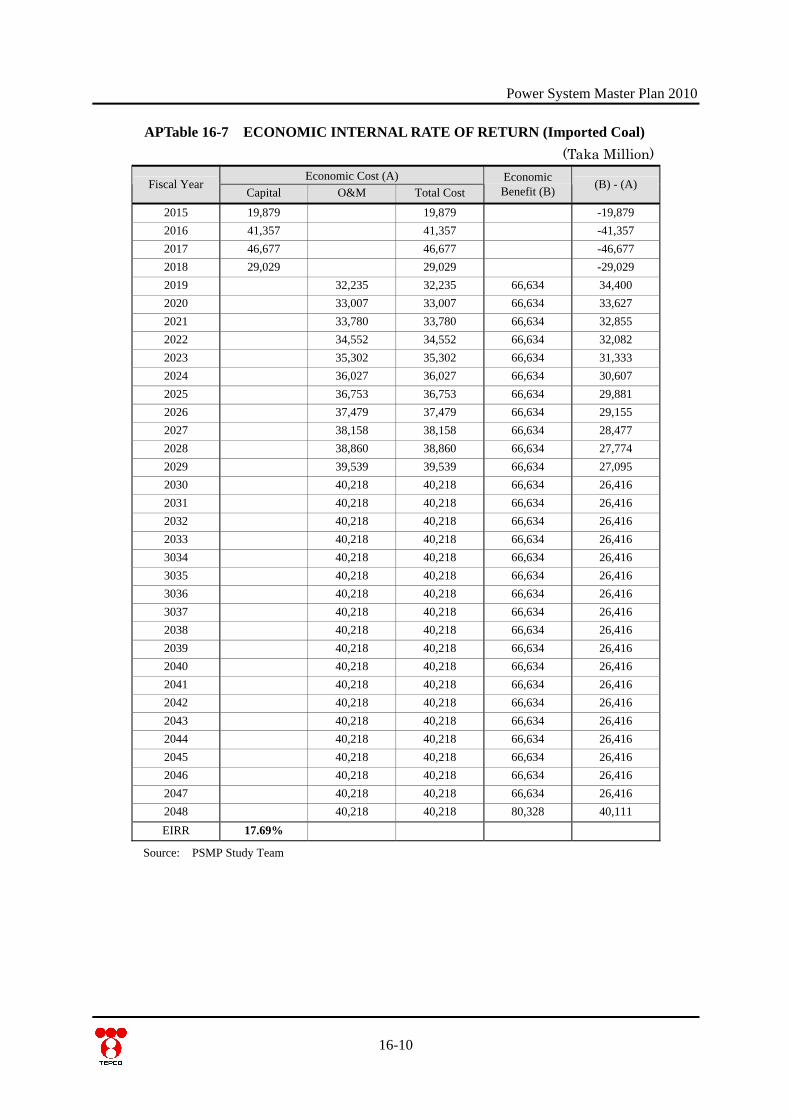
Power System Master Plan 2010
APTable 16-7 ECONOMIC INTERNAL RATE OF RETURN (Imported Coal) (Taka Million)
Economic Cost (A) Fiscal Year
Capital O&M Total Cost Economic Benefit (B) (B) - (A)
2015 19,879 19,879 -19,879 2016 41,357 41,357 -41,357 2017 46,677 46,677 -46,677 2018 29,029 29,029 -29,029 2019 32,235 32,235 66,634 34,400 2020 33,007 33,007 66,634 33,627 2021 33,780 33,780 66,634 32,855 2022 34,552 34,552 66,634 32,082 2023 35,302 35,302 66,634 31,333 2024 36,027 36,027 66,634 30,607 2025 36,753 36,753 66,634 29,881 2026 37,479 37,479 66,634 29,155 2027 38,158 38,158 66,634 28,477 2028 38,860 38,860 66,634 27,774 2029 39,539 39,539 66,634 27,095 2030 40,218 40,218 66,634 26,416 2031 40,218 40,218 66,634 26,416 2032 40,218 40,218 66,634 26,416 2033 40,218 40,218 66,634 26,416 3034 40,218 40,218 66,634 26,416 3035 40,218 40,218 66,634 26,416 3036 40,218 40,218 66,634 26,416 3037 40,218 40,218 66,634 26,416 2038 40,218 40,218 66,634 26,416 2039 40,218 40,218 66,634 26,416 2040 40,218 40,218 66,634 26,416 2041 40,218 40,218 66,634 26,416 2042 40,218 40,218 66,634 26,416 2043 40,218 40,218 66,634 26,416 2044 40,218 40,218 66,634 26,416 2045 40,218 40,218 66,634 26,416 2046 40,218 40,218 66,634 26,416 2047 40,218 40,218 66,634 26,416 2048 40,218 40,218 80,328 40,111 EIRR 17.69%
Source: PSMP Study Team
16-10
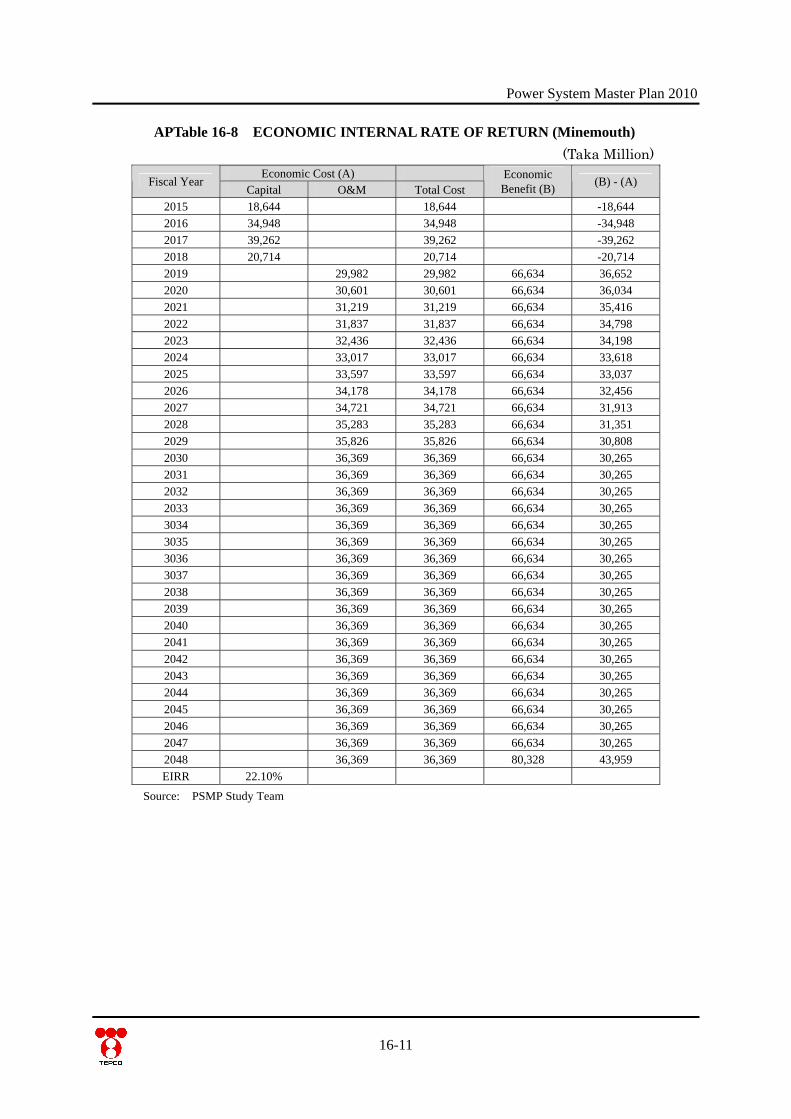
Power System Master Plan 2010
16-11
APTable 16-8 ECONOMIC INTERNAL RATE OF RETURN (Minemouth) (Taka Million)
Economic Cost (A) Fiscal Year
Capital O&M Total Cost Economic Benefit (B) (B) - (A)
2015 18,644 18,644 -18,644 2016 34,948 34,948 -34,948 2017 39,262 39,262 -39,262 2018 20,714 20,714 -20,714 2019 29,982 29,982 66,634 36,652 2020 30,601 30,601 66,634 36,034 2021 31,219 31,219 66,634 35,416 2022 31,837 31,837 66,634 34,798 2023 32,436 32,436 66,634 34,198 2024 33,017 33,017 66,634 33,618 2025 33,597 33,597 66,634 33,037 2026 34,178 34,178 66,634 32,456 2027 34,721 34,721 66,634 31,913 2028 35,283 35,283 66,634 31,351 2029 35,826 35,826 66,634 30,808 2030 36,369 36,369 66,634 30,265 2031 36,369 36,369 66,634 30,265 2032 36,369 36,369 66,634 30,265 2033 36,369 36,369 66,634 30,265 3034 36,369 36,369 66,634 30,265 3035 36,369 36,369 66,634 30,265 3036 36,369 36,369 66,634 30,265 3037 36,369 36,369 66,634 30,265 2038 36,369 36,369 66,634 30,265 2039 36,369 36,369 66,634 30,265 2040 36,369 36,369 66,634 30,265 2041 36,369 36,369 66,634 30,265 2042 36,369 36,369 66,634 30,265 2043 36,369 36,369 66,634 30,265 2044 36,369 36,369 66,634 30,265 2045 36,369 36,369 66,634 30,265 2046 36,369 36,369 66,634 30,265 2047 36,369 36,369 66,634 30,265 2048 36,369 36,369 80,328 43,959 EIRR 22.10%
Source: PSMP Study Team

Power System Master Plan 2010
Chapter 18 Environmental and Social Examination on Most Prioritized Projects APPENDIX
18.1 Laws and regulation regarding environmental and social consideration
18.1.1 Environmental policy Strategy, Policy, Law, Rule Bangladesh has legislated an inclusive policy and law, which is related to all environmental controls after the United Nations Conference on Environment and Development (UNCED), Rio de Janeiro, 3-14 June 1992. The main domestic strategies, policies, laws and rules adopted in Bangladesh related to the environment are shown below.
(1) The National Environmental Policy, 1992 (2) Environmental Action Plan, 1992 (3) The Bangladesh Environmental Conservation Act, 1995 (4) The Environmental Conservation Rules, 1997(ECR) (5) National Conservation Strategy (NCS), 1992 (6) National Environmental Management Action Plan “NEMAP”, 1995 (7) The Environmental Court Act, 2000
The Environmental Policy which was established in 1992 plays the overarching role of outlining the whole of the policy. The objectives of the Environmental Policy are: To maintain ecological balance and overall development through protection and
improvement of the environment To protect the country against natural disasters To identify and regulate activities, which pollute and degrade the environment To ensure environmentally sound development in all sectors To ensure sustainable, long term and environmentally sound use of all national resources To actively remain adherent to all international environmental initiatives as much as
possible These objectives include 15 sectors. Environmental policy for industrial areas has been stipulated as follows: Adopt corrective measures for industries polluting the environment in phases. Undertake Environmental Impact Assessment (EIA) for all new industries both in the
public and private sectors. Impose a ban on the establishment of industries producing goods which cause
environmental pollution; close down such existing industries in phases and discourage the use of such polluting products through the development/introduction of the environmentally sound substitutes.
Encourage development of environmentally sound and appropriate technology and initiatives with the best of labors and provision of proper wages.
Prevent wastage of raw materials in industries and ensure their sustainable use. It also stipulates policy implementation by the National Environment Committee and the legal status of the Department of the Environment (DOE) which implements EIA. In addition, the Bangladesh State of Environment (SoE) Report, which was prepared in 2001 as a response to the recommendations provided in Agenda 21 at the Earth Summit in 1992, identifies five key environmental issues in Bangladesh (Land degradation, Water Pollution and Scarcity, Air
18-1
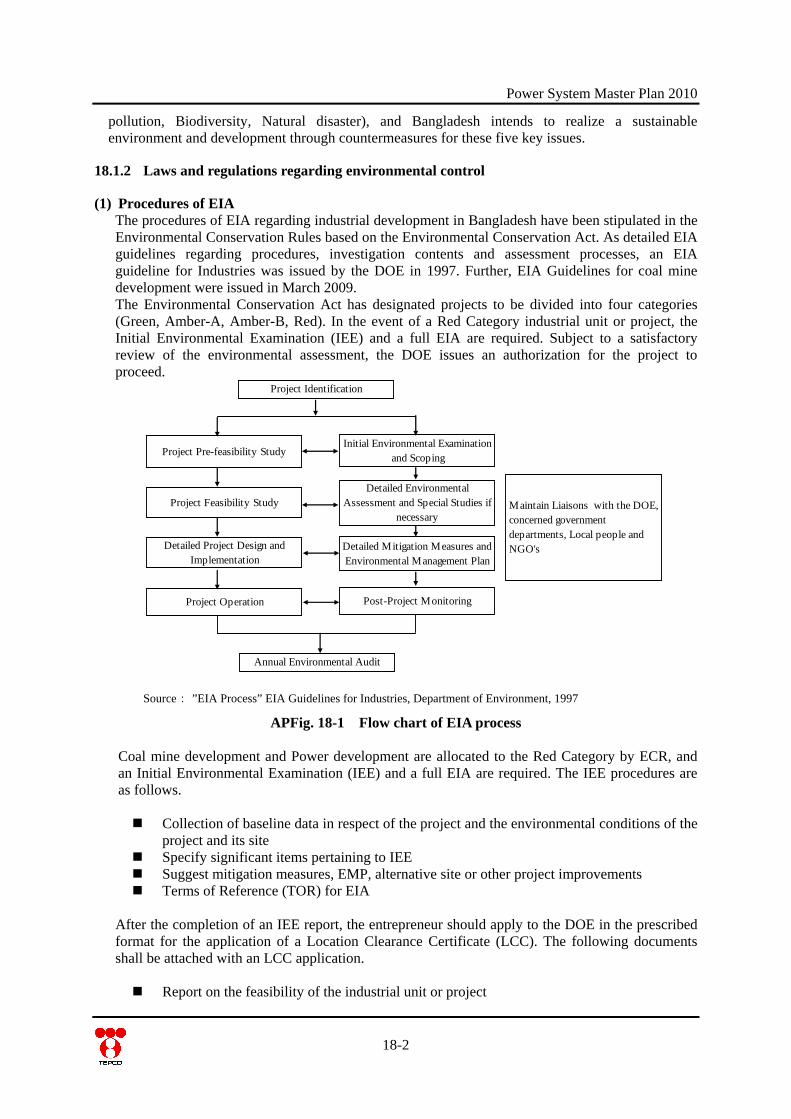
Power System Master Plan 2010
pollution, Biodiversity, Natural disaster), and Bangladesh intends to realize a sustainable environment and development through countermeasures for these five key issues.
18.1.2 Laws and regulations regarding environmental control
(1) Procedures of EIA The procedures of EIA regarding industrial development in Bangladesh have been stipulated in the Environmental Conservation Rules based on the Environmental Conservation Act. As detailed EIA guidelines regarding procedures, investigation contents and assessment processes, an EIA guideline for Industries was issued by the DOE in 1997. Further, EIA Guidelines for coal mine development were issued in March 2009. The Environmental Conservation Act has designated projects to be divided into four categories (Green, Amber-A, Amber-B, Red). In the event of a Red Category industrial unit or project, the Initial Environmental Examination (IEE) and a full EIA are required. Subject to a satisfactory review of the environmental assessment, the DOE issues an authorization for the project to proceed.
Project Identification
Project Pre-feasibility Study
Project Feasibility Study
Detailed Project Design andImplementation
Project Operation
Initial Environmental Examinationand Scoping
Detailed EnvironmentalAssessment and Special Studies if
necessary
Detailed Mitigation Measures andEnvironmental Management Plan
Post-Project Monitoring
Annual Environmental Audit
Maintain Liaisons with the DOE,concerned governmentdepartments, Local people andNGO's
Source: ”EIA Process” EIA Guidelines for Industries, Department of Environment, 1997
APFig. 18-1 Flow chart of EIA process
Coal mine development and Power development are allocated to the Red Category by ECR, and an Initial Environmental Examination (IEE) and a full EIA are required. The IEE procedures are as follows. Collection of baseline data in respect of the project and the environmental conditions of the
project and its site Specify significant items pertaining to IEE Suggest mitigation measures, EMP, alternative site or other project improvements Terms of Reference (TOR) for EIA
After the completion of an IEE report, the entrepreneur should apply to the DOE in the prescribed format for the application of a Location Clearance Certificate (LCC). The following documents shall be attached with an LCC application. Report on the feasibility of the industrial unit or project
18-2
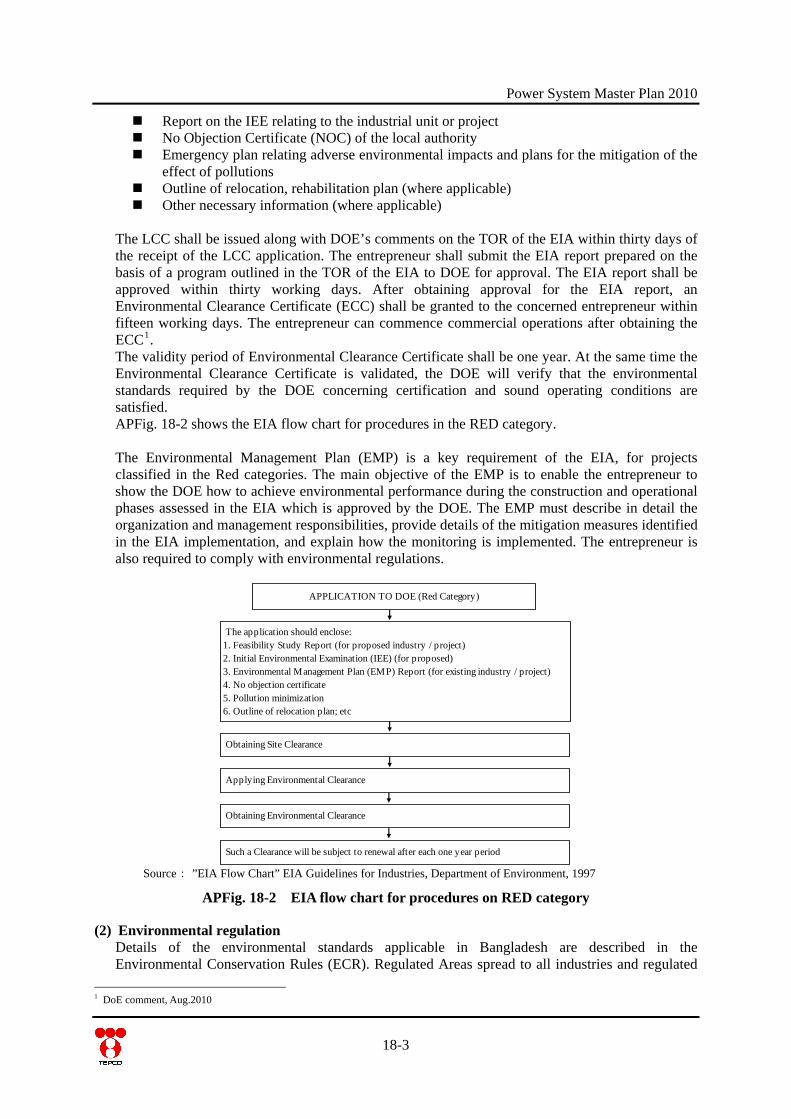
Power System Master Plan 2010
18-3
Report on the IEE relating to the industrial unit or project No Objection Certificate (NOC) of the local authority Emergency plan relating adverse environmental impacts and plans for the mitigation of the
effect of pollutions Outline of relocation, rehabilitation plan (where applicable) Other necessary information (where applicable)
The LCC shall be issued along with DOE’s comments on the TOR of the EIA within thirty days of the receipt of the LCC application. The entrepreneur shall submit the EIA report prepared on the basis of a program outlined in the TOR of the EIA to DOE for approval. The EIA report shall be approved within thirty working days. After obtaining approval for the EIA report, an Environmental Clearance Certificate (ECC) shall be granted to the concerned entrepreneur within fifteen working days. The entrepreneur can commence commercial operations after obtaining the ECC1. The validity period of Environmental Clearance Certificate shall be one year. At the same time the Environmental Clearance Certificate is validated, the DOE will verify that the environmental standards required by the DOE concerning certification and sound operating conditions are satisfied. APFig. 18-2 shows the EIA flow chart for procedures in the RED category. The Environmental Management Plan (EMP) is a key requirement of the EIA, for projects classified in the Red categories. The main objective of the EMP is to enable the entrepreneur to show the DOE how to achieve environmental performance during the construction and operational phases assessed in the EIA which is approved by the DOE. The EMP must describe in detail the organization and management responsibilities, provide details of the mitigation measures identified in the EIA implementation, and explain how the monitoring is implemented. The entrepreneur is also required to comply with environmental regulations.
APPLICATION TO DOE (Red Category)
The application should enclose:1. Feasibility Study Report (for proposed industry / project)2. Initial Environmental Examination (IEE) (for proposed)3. Environmental Management Plan (EMP) Report (for existing industry / project)4. No objection certificate5. Pollution minimization6. Outline of relocation plan; etc
Obtaining Site Clearance
Applying Environmental Clearance
Obtaining Environmental Clearance
Such a Clearance will be subject to renewal after each one year period
Source: ”EIA Flow Chart” EIA Guidelines for Industries, Department of Environment, 1997
APFig. 18-2 EIA flow chart for procedures on RED category
(2) Environmental regulation Details of the environmental standards applicable in Bangladesh are described in the Environmental Conservation Rules (ECR). Regulated Areas spread to all industries and regulated
1 DoE comment, Aug.2010
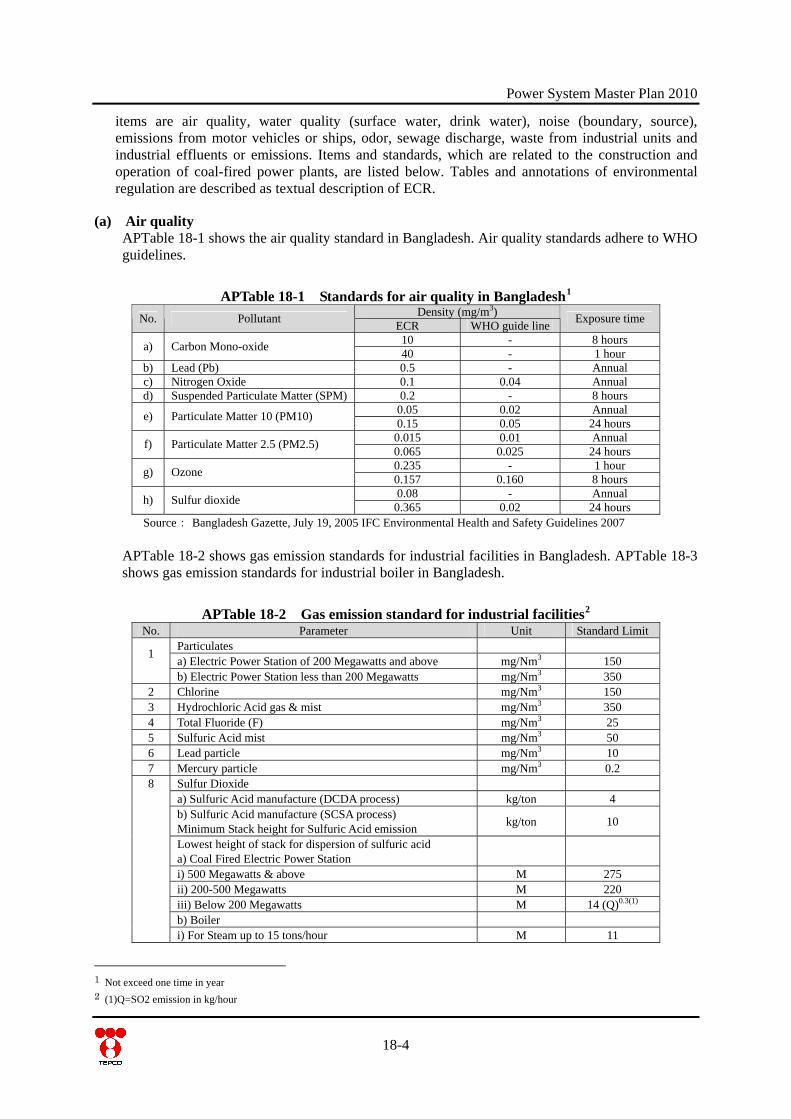
Power System Master Plan 2010
18-4
items are air quality, water quality (surface water, drink water), noise (boundary, source), emissions from motor vehicles or ships, odor, sewage discharge, waste from industrial units and industrial effluents or emissions. Items and standards, which are related to the construction and operation of coal-fired power plants, are listed below. Tables and annotations of environmental regulation are described as textual description of ECR.
(a) Air quality APTable 18-1 shows the air quality standard in Bangladesh. Air quality standards adhere to WHO guidelines.
APTable 18-1 Standards for air quality in Bangladesh1 Density (mg/m3) No. Pollutant ECR WHO guide line Exposure time
10 - 8 hours a) Carbon Mono-oxide 40 - 1 hour b) Lead (Pb) 0.5 - Annual c) Nitrogen Oxide 0.1 0.04 Annual d) Suspended Particulate Matter (SPM) 0.2 - 8 hours
0.05 0.02 Annual e) Particulate Matter 10 (PM10) 0.15 0.05 24 hours 0.015 0.01 Annual f) Particulate Matter 2.5 (PM2.5) 0.065 0.025 24 hours 0.235 - 1 hour g) Ozone 0.157 0.160 8 hours 0.08 - Annual h) Sulfur dioxide 0.365 0.02 24 hours
Source: Bangladesh Gazette, July 19, 2005 IFC Environmental Health and Safety Guidelines 2007 APTable 18-2 shows gas emission standards for industrial facilities in Bangladesh. APTable 18-3 shows gas emission standards for industrial boiler in Bangladesh.
APTable 18-2 Gas emission standard for industrial facilities2 No. Parameter Unit Standard Limit
Particulates a) Electric Power Station of 200 Megawatts and above mg/Nm3 150 1
b) Electric Power Station less than 200 Megawatts mg/Nm3 350
2 Chlorine mg/Nm3 150 3 Hydrochloric Acid gas & mist mg/Nm3 350 4 Total Fluoride (F) mg/Nm3 25 5 Sulfuric Acid mist mg/Nm3 50 6 Lead particle mg/Nm3 10 7 Mercury particle mg/Nm3 0.2
Sulfur Dioxide a) Sulfuric Acid manufacture (DCDA process) kg/ton 4 b) Sulfuric Acid manufacture (SCSA process) Minimum Stack height for Sulfuric Acid emission kg/ton 10
Lowest height of stack for dispersion of sulfuric acid a) Coal Fired Electric Power Station
i) 500 Megawatts & above M 275 ii) 200-500 Megawatts M 220 iii) Below 200 Megawatts M 14 (Q)0.3(1) b) Boiler
8
i) For Steam up to 15 tons/hour M 11
1 Not exceed one time in year 2 (1)Q=SO2 emission in kg/hour
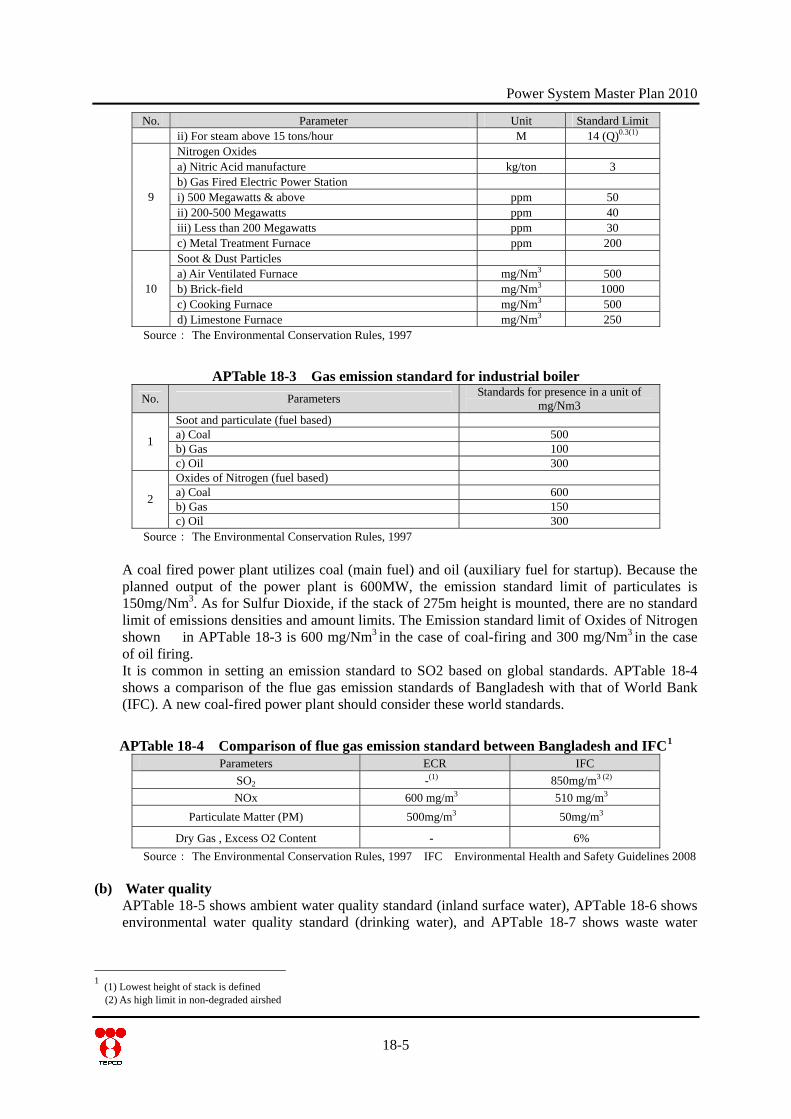
Power System Master Plan 2010
18-5
No. Parameter Unit Standard Limit ii) For steam above 15 tons/hour M 14 (Q)0.3(1) Nitrogen Oxides a) Nitric Acid manufacture kg/ton 3 b) Gas Fired Electric Power Station i) 500 Megawatts & above ppm 50 ii) 200-500 Megawatts ppm 40 iii) Less than 200 Megawatts ppm 30
9
c) Metal Treatment Furnace ppm 200 Soot & Dust Particles a) Air Ventilated Furnace mg/Nm3 500 b) Brick-field mg/Nm3 1000 c) Cooking Furnace mg/Nm3 500
10
d) Limestone Furnace mg/Nm3 250 Source: The Environmental Conservation Rules, 1997
APTable 18-3 Gas emission standard for industrial boiler No. Parameters Standards for presence in a unit of
mg/Nm3 Soot and particulate (fuel based) a) Coal 500 b) Gas 100 1
c) Oil 300 Oxides of Nitrogen (fuel based) a) Coal 600 b) Gas 150 2
c) Oil 300 Source: The Environmental Conservation Rules, 1997
A coal fired power plant utilizes coal (main fuel) and oil (auxiliary fuel for startup). Because the planned output of the power plant is 600MW, the emission standard limit of particulates is 150mg/Nm3. As for Sulfur Dioxide, if the stack of 275m height is mounted, there are no standard limit of emissions densities and amount limits. The Emission standard limit of Oxides of Nitrogen shown in APTable 18-3 is 600 mg/Nm3 in the case of coal-firing and 300 mg/Nm3 in the case of oil firing. It is common in setting an emission standard to SO2 based on global standards. APTable 18-4 shows a comparison of the flue gas emission standards of Bangladesh with that of World Bank (IFC). A new coal-fired power plant should consider these world standards.
APTable 18-4 Comparison of flue gas emission standard between Bangladesh and IFC1 Parameters ECR IFC
SO2 -(1) 850mg/m3 (2)
NOx 600 mg/m3 510 mg/m3 Particulate Matter (PM) 500mg/m3 50mg/m3
Dry Gas , Excess O2 Content - 6% Source: The Environmental Conservation Rules, 1997 IFC Environmental Health and Safety Guidelines 2008
(b) Water quality APTable 18-5 shows ambient water quality standard (inland surface water), APTable 18-6 shows environmental water quality standard (drinking water), and APTable 18-7 shows waste water
1 (1) Lowest height of stack is defined (2) As high limit in non-degraded airshed
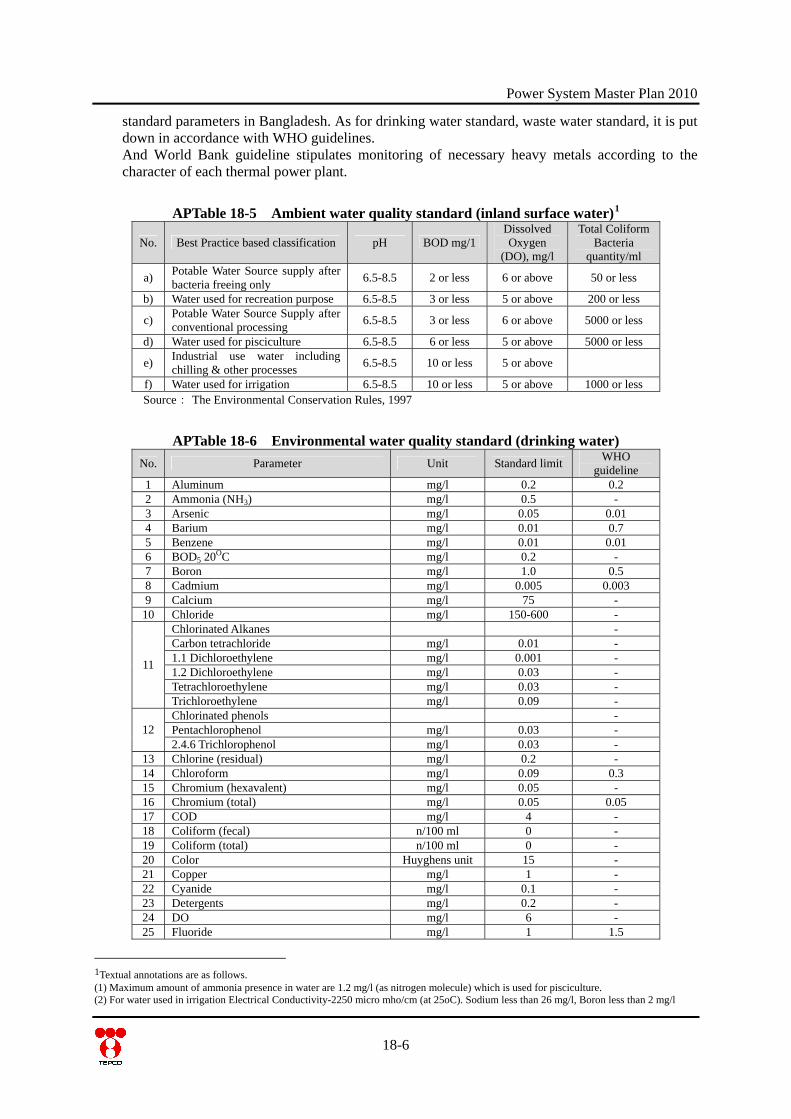
Power System Master Plan 2010
18-6
standard parameters in Bangladesh. As for drinking water standard, waste water standard, it is put down in accordance with WHO guidelines. And World Bank guideline stipulates monitoring of necessary heavy metals according to the character of each thermal power plant.
APTable 18-5 Ambient water quality standard (inland surface water)1
No. Best Practice based classification pH BOD mg/1Dissolved Oxygen
(DO), mg/l
Total Coliform Bacteria
quantity/ml
a) Potable Water Source supply after bacteria freeing only 6.5-8.5 2 or less 6 or above 50 or less
b) Water used for recreation purpose 6.5-8.5 3 or less 5 or above 200 or less
c) Potable Water Source Supply after conventional processing 6.5-8.5 3 or less 6 or above 5000 or less
d) Water used for pisciculture 6.5-8.5 6 or less 5 or above 5000 or less
e) Industrial use water including chilling & other processes 6.5-8.5 10 or less 5 or above
f) Water used for irrigation 6.5-8.5 10 or less 5 or above 1000 or less Source: The Environmental Conservation Rules, 1997
APTable 18-6 Environmental water quality standard (drinking water) No. Parameter Unit Standard limit WHO
guideline 1 Aluminum mg/l 0.2 0.2 2 Ammonia (NH3) mg/l 0.5 - 3 Arsenic mg/l 0.05 0.01 4 Barium mg/l 0.01 0.7 5 Benzene mg/l 0.01 0.01 6 BOD5 20OC mg/l 0.2 - 7 Boron mg/l 1.0 0.5 8 Cadmium mg/l 0.005 0.003 9 Calcium mg/l 75 - 10 Chloride mg/l 150-600 -
Chlorinated Alkanes - Carbon tetrachloride mg/l 0.01 - 1.1 Dichloroethylene mg/l 0.001 - 1.2 Dichloroethylene mg/l 0.03 - Tetrachloroethylene mg/l 0.03 -
11
Trichloroethylene mg/l 0.09 - Chlorinated phenols - Pentachlorophenol mg/l 0.03 - 12 2.4.6 Trichlorophenol mg/l 0.03 -
13 Chlorine (residual) mg/l 0.2 - 14 Chloroform mg/l 0.09 0.3 15 Chromium (hexavalent) mg/l 0.05 - 16 Chromium (total) mg/l 0.05 0.05 17 COD mg/l 4 - 18 Coliform (fecal) n/100 ml 0 - 19 Coliform (total) n/100 ml 0 - 20 Color Huyghens unit 15 - 21 Copper mg/l 1 - 22 Cyanide mg/l 0.1 - 23 Detergents mg/l 0.2 - 24 DO mg/l 6 - 25 Fluoride mg/l 1 1.5
1Textual annotations are as follows. (1) Maximum amount of ammonia presence in water are 1.2 mg/l (as nitrogen molecule) which is used for pisciculture. (2) For water used in irrigation Electrical Conductivity-2250 micro mho/cm (at 25oC). Sodium less than 26 mg/l, Boron less than 2 mg/l

Power System Master Plan 2010
18-7
No. Parameter Unit Standard limit WHO guideline
26 Hardness (as CaCO3) mg/l 200-500 - 27 Iron mg/l 0.3 - 28 Nitrogen (Total) mg/l 1 - 29 Lead mg/l 0.05 0.01 30 Magnesium mg/l 30-35 - 31 Manganese mg/l 0.1 0.4 32 Mercury mg/l 0.001 0.006 33 Nickel mg/l 0.1 0.07 34 Nitrate mg/l 10 3 35 Nitrite mg/l Less than 1 - 36 Odor Odorless - 37 Oil & Grease mg/l 0.01 - 38 Ph 6.5-8.5 - 39 Phenolic compounds mg/l 0.002 - 40 Phosphate mg/l 6 - 41 Phosphorus mg/l 0 - 42 Potassium mg/l 12 - 43 Radioactive Materials (gross alpha activity) Bq/l 0.01 - 44 Radioactive Materials (gross beta activity) mg/l 0.1 - 45 Selenium mg/l 0.01 - 46 Silver mg/l 0.02 - 47 Sodium mg/l 200 - 48 Suspended particulate matters mg/l 10 - 49 Sulfide mg/l 0 - 50 Sulfate mg/l 400 - 51 Total dissolived solids mg/l 1000 1000 52 Temperature ℃ 20-30 - 53 Tin mg/l 2 - 54 Turbidity JTU 10 - 55 Zinc mg/l 5 - Source: The Environmental Conservation Rules, 1997 Guidelines for Drinking-water Quality WHO 2008
APTable 18-7 Wastewater discharge standards1
No. Parameter Unit Inland
Surface Water
Public Sewer at secondary
treatment plant
Irrigated Land
IFC (World Bank
guideline)
1 Ammoniacal Nitrogen (N molecule) mg/l 50 75 75 -
2 Ammonia (free ammonia)
mg/l 5 5 15 -
3 Arsenic (As) mg/l 0.2 0.05 0.2 0.5 4 BOD5 20°C mg/l 50 250 100 - 5 Boron mg/l 2 2 2 - 6 Cadmium (Cd) mg/l 0.05 0.5 0.5 0.1 7 Chloride mg/l 600 600 600 - 8 Chromium (total Cr) mg/l 0.5 1.0 1.0 0.5 9 COD mg/l 200 400 400 -
1Textual annotations are as follows. (1) These standards shall be applicable to industrial units or projects other than those given under Quality Standards for Classified Industries (Schedule 12). (2) These quality standards must be ensured at the moment of going into trial production for industrial units and at the moment of going into trial production for industrial units and at the moment of going into operation for other projects. (3) The value must not exceed the quality standard during spot check at any time ; if required, the quality standards may be more strict to meet the environment terms in certain areas. (4) Inland Surface Water shall mean drain, pond, tank, water body or water hole, canal, river, spring and estuary. (5) Public sewer shall mean sewer connected with fully combined processing plant including primary and secondary treatment. (6) Irrigated land shall mean appropriately irrigated plantation area of specified crops based on quantity and quality of waste water. (7) Inland Surface Quality Standards (Schedule 13) shall be applicable for any discharge taking place in public sewer or land not defined in Notes 5
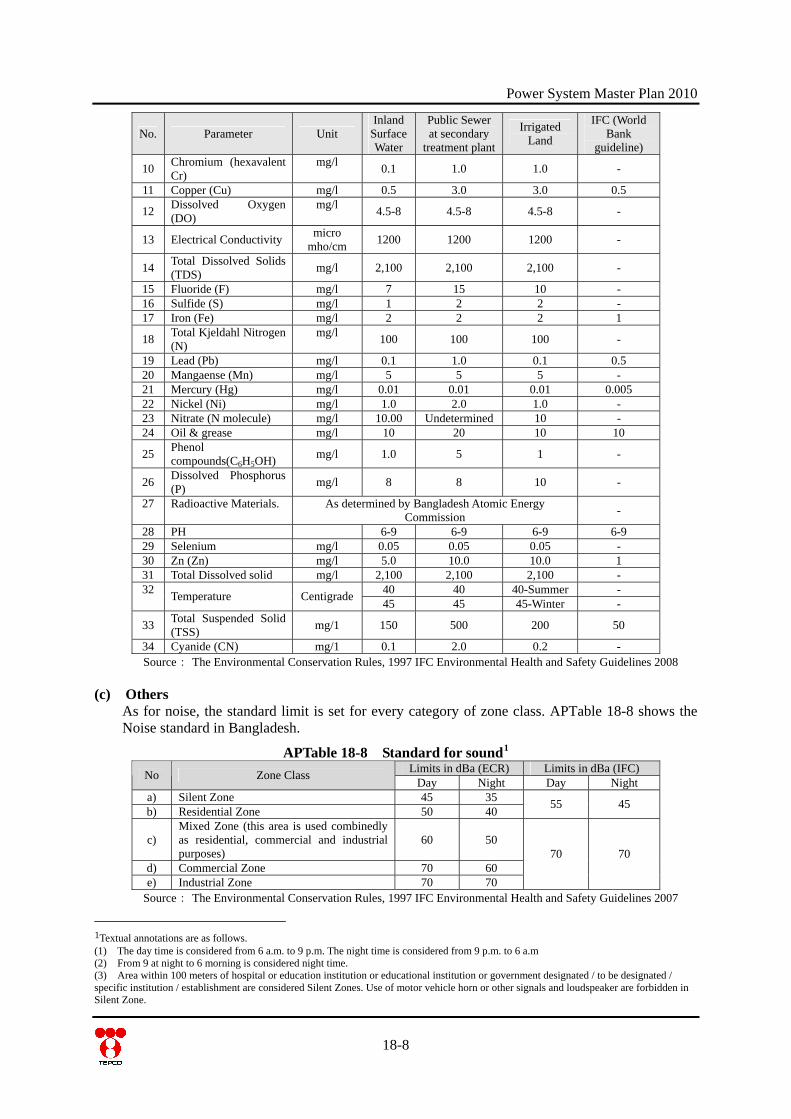
Power System Master Plan 2010
18-8
No. Parameter Unit Inland
Surface Water
Public Sewer at secondary
treatment plant
Irrigated Land
IFC (World Bank
guideline)
10 Chromium (hexavalent Cr)
mg/l 0.1 1.0 1.0 -
11 Copper (Cu) mg/l 0.5 3.0 3.0 0.5
12 Dissolved Oxygen (DO)
mg/l 4.5-8 4.5-8 4.5-8 -
13 Electrical Conductivity micro mho/cm 1200 1200 1200 -
14 Total Dissolved Solids (TDS) mg/l 2,100 2,100 2,100 -
15 Fluoride (F) mg/l 7 15 10 - 16 Sulfide (S) mg/l 1 2 2 - 17 Iron (Fe) mg/l 2 2 2 1
18 Total Kjeldahl Nitrogen (N)
mg/l 100 100 100 -
19 Lead (Pb) mg/l 0.1 1.0 0.1 0.5 20 Mangaense (Mn) mg/l 5 5 5 - 21 Mercury (Hg) mg/l 0.01 0.01 0.01 0.005 22 Nickel (Ni) mg/l 1.0 2.0 1.0 - 23 Nitrate (N molecule) mg/l 10.00 Undetermined 10 - 24 Oil & grease mg/l 10 20 10 10
25 Phenol compounds(C6H5OH) mg/l 1.0 5 1 -
26 Dissolved Phosphorus (P) mg/l 8 8 10 -
27 Radioactive Materials. As determined by Bangladesh Atomic Energy Commission -
28 PH 6-9 6-9 6-9 6-9 29 Selenium mg/l 0.05 0.05 0.05 - 30 Zn (Zn) mg/l 5.0 10.0 10.0 1 31 Total Dissolved solid mg/l 2,100 2,100 2,100 -
40 40 40-Summer - 32 Temperature Centigrade 45 45 45-Winter -
33 Total Suspended Solid (TSS) mg/1 150 500 200 50
34 Cyanide (CN) mg/1 0.1 2.0 0.2 - Source: The Environmental Conservation Rules, 1997 IFC Environmental Health and Safety Guidelines 2008
(c) Others As for noise, the standard limit is set for every category of zone class. APTable 18-8 shows the Noise standard in Bangladesh.
APTable 18-8 Standard for sound1 Limits in dBa (ECR) Limits in dBa (IFC) No Zone Class Day Night Day Night
a) Silent Zone 45 35 b) Residential Zone 50 40 55 45
c) Mixed Zone (this area is used combinedly as residential, commercial and industrial purposes)
60 50
d) Commercial Zone 70 60 e) Industrial Zone 70 70
70 70
Source: The Environmental Conservation Rules, 1997 IFC Environmental Health and Safety Guidelines 2007
1Textual annotations are as follows. (1) The day time is considered from 6 a.m. to 9 p.m. The night time is considered from 9 p.m. to 6 a.m (2) From 9 at night to 6 morning is considered night time. (3) Area within 100 meters of hospital or education institution or educational institution or government designated / to be designated / specific institution / establishment are considered Silent Zones. Use of motor vehicle horn or other signals and loudspeaker are forbidden in Silent Zone.
Power System Master Plan 2010
18-9
Ammonia is used in SCR, which is possible to be introduced for the purpose of nitrogen oxide reduction. Including ammonia, APTable 18-9 shows the odor emission standard in Bangladesh.
APTable 18-9 Odor emission standard1 Parameter Unit Standard Limit
Acetaldehyde ppm 0.5 – 5 Ammonia ppm 1 – 5
Hydrogen Sulfide ppm 0.02 – 0.2 Methyl Disulfide ppm 0.009 – 0.1 Methyl Sulfide ppm 0.01 – 0.2
Styrene ppm 0.4 – 2.0 Source The Environmental Conservation Rules, 1997
18.1.3 Protected area and environmentally controlled area Classification of Protected areas and environmentally-controlled areas in Bangladesh are shown in APTable 18-10. Those areas are declared as National Park, Wildlife Sanctuary, Game Reserve, Botanical gardens, and Eco-parks under the Wildlife (Preservation) Order, Reserved Forests and Protected Forests under the Forest Act and Ecologically Critical Areas (ECA) notified under the Environmental Conservation Act.
APTable 18-10 Classification of Protected area, Environmentally controlled area Classification Competent Authority Governing law
A National Park B Wildlife Sanctuary C Game Reserve D Botanical Gardens, Eco-parks
Wildlife (Preservation) Order
E Reserved Forests, Protected Forests
Department of Forest
Forest Act
F Ecologically Critical Areas Department of Environment
Environmental Conservation Act
Source: PSMP Study Team
There are fifteen National parks, thirteen wildlife sanctuaries, five botanical gardens and eco-parks in Bangladesh declared under the Wildlife (Preservation) Order having total area of 2,702.2km2. List of Protected areas and environmentally-controlled areas are shown as APTable 18-11. There are nine ECA and the total areas is 8063.2 km2 excluding the Gulshan-Banani-Baridhara Lake.2 Though industrial development is basically restricted in the ECA, if the project possesses a high development possibility and a high priority as a nation, IEE will be implemented as an exception and the DOE will render a judgment concerning project implementation3. APTable 18-12 shows a list of ECA notified under the Environmental Conservation Act. Site selection should be implemented under the condition of not causing environmental impact to protected areas and/or environmentally controlled areas.
1Textual annotations are as follows. (1)Following regulatory limit shall be generally applicable to emission/exhaust outlet pipe of above 5 meter hight: Q = 0.108 x He2Cm ( Where Q = Gas Emission rate Nm3/hour ) He = Hight of exhaust outlet pipe (m) Cm = Above mentioned limit (ppm) (2)In cases where a special parameter has been mentioned, the lower limit shall be applicable for warning purpose, and the higher limit shall be applicable for prosecution purpose or punitive measure. 2 A situation Analysis Report on Environment(MDG7) Bangladesh 3 Interviewed with DoE
Power System Master Plan 2010
APTable 18-11 List of Protected area, environmentally controlled area Classification No. Name Place Area (km2)
1 Bhawal National Park Gazipur 50.2 2 Modhupur National Park Tangail/ Mymensingh 84.4 3 Ramsagar National Park Dinajpur 0.3 4 Himchari National Park Cox's Bazar 17.3 5 Lawachara National Park Moulavibazar 12.5 6 Kaptai National Park Chittagong Hill Tracts 54.6 7 Nijhum Dweep National Park Noakhali 163.5 8 Medha Kachhapia National Park Cox's Bazar 4.0 9 Satchari National Park Habigonj 2.4 10 Khadim Nagar National Park Sylhet 6.8 11 Baraiyadhala National Park Chittagong 29.3 12 Kuakata National Park Patuakhali 16.1 13 Nababgonj National Park Dinajpur 5.2 14 Shingra National Park Dinajpur 3.1
A
15 Kadigarh National Park Mymensingh 3.4 1 Rema-Kalenga Wildlife Sanctuary Hobigonj 18.0
2 Char Kukri-Mukri Wildlife Sanctuary
Bhola 0.4
3 Sundarban (East) Wildlife Sanctuary
Bagerhat 312.3
4 Sundarban (West) Wildlife Sanctuary
Satkhira 715.0
5 Sundarban (South) Wildlife Sanctuary
Khulna 369.7
6 Pablakhali Wildlife Sanctuary Chittagong Hill Tracts 420.9 7 Chunati Wildlife Sanctuary Chittagong 77.6 8 Fashiakhali Wildlife Sanctuary Cox's Bazar 32.2
9 Dudh Pukuria-Dhopachari Wildlife Sanctuary
Chittagong 47.2
10 Hazarikhil Wildlife Sanctuary Chittagong 29.1 11 Sangu Wildlife Sanctuary Bandarban 57.6 12 Teknaf Wildlife Sanctuary Cox's Bazar 116.2
B
13 Tengragiri Wildlife Sanctuary Barguna 40.5 1 National Botanical Garden Dhaka 0.8 2 Baldha Garden Dhaka - 3 Madhabkunda Eco-Park Moulavibazar 2.7
4 Sitakunda Botanical Garden and Eco-park
Chittagong 8.1 D
5 Dulahazara Safari Parks Cox’s Bazar 6.0 Source: UUhttp://www.bforest.gov.bd/conservation.php (accessed January 2011)
APTable 18-12 List of Environmental Critical Areas Classification No. Name Place Area (km2)
1 The Sundarbans Bagerhat, Khulna, Satkhira 7,620.3
2 Cox’s Bazar ( Teknaf, Sea beach ) Cox’s Bazar 104.7 3 St. Martin Island Cox’s Bazar 5.9 4 Sonadia Island Cox’s Bazar 49.2 5 Hakaluki Haor Moulavi Bazar 183.8 6 Tanguar Haor Sumamganj 97.3 7 Marjat Baor Jhinaidha 2 8 Gulshan-Banani-Baridhara Lake Dhaka -
F
9 Rivers (Buriganga, Turag, Sitalakhya and Balu) around Dhaka city Dhaka -
Source: Biodiversity National Assessment and Programme of Action 2020) ,DoE Bangladesh, 2010
18-10

Power System Master Plan 2010
18-11
18.1.4 Land Acquisition and Involuntary Resettlement
(1) Land Acquisition Land acquisition is implemented in Bangladesh as stipulated in the Acquisition and Requisition of Immovable Property Ordinance of 1982, and land acquisition for power plant and transformer substation is not an exception. The Ordinance stipulates the procedure for land acquisition as the following.
(1) The Project Owner submits an application for land acquisition to the Deputy Commissioner’s Office1. The Project Owner is responsible to describe the project details in the application.
(2) DC Office appraises the application within 90 days from the submission date. DC Office conducts site visits in which site observation and local consultation with politicians and residents are done, and develops a project profile and cost estimate.
(3) DC Office submits a proposal for land acquisition to the Ministry of Land (MOL). (4) MOL appraises the proposal and forwards it to the Prime Minister. PM appraises the proposal
within 3 months from the submission date. (5) After getting PM’s approval, DC Office takes a course of action for land acquisition. It takes 2
months in average. It is the Project Owner who should pay for compensation.
Project OwnerDeputy Commissioner's Office
(at District level)Ministry of Land
(MOL)Prime Minister's Office
Apply LandAcquisition
AppraiseApplication
Develop and SubmitProposal on Land
Acquisition
a) Site observationb) Consultation withlocal politicians andresidentsc) Develop projectprofiled) Cost estimate
AppraiseApplication
AppraiseApplication
Acquire LandPayCompensation
within 90 days fromdate of applicationreceipt
within 90 days fromdate of applicationreceipt
SubmitApplication
ApproveApplication
takes 2 months inaverage
Source: PSMP Study Team
APFig. 18-3 Official Process for Land Acquisition
1 Each District is headed by the Deputy Commissioner, and each Division is comprised of several Districts, and headed by the Commissioner.
Power System Master Plan 2010
18-12
As for government-funded projects, the project owner also has to submit a Development Project Proposal, DPP, to the Government of Bangladesh. These two applications: one for land acquisition and another for development project proposal, can go spontaneously for getting approval. The Project Owner does not have to reach MOL for their intervention as long as the size of the acquired land is less than 16.5 acres. DC Office handles all the procedures on behalf. In Metropolitan Area1, however, MOL is involved in the appraisal process of all applications of land acquisition no matter how big the land size is. The Ordinance stipulates that land owners are compensated with 1.5 times of the present land price for acquisition of their private-owned lands. No other payment is made even for their resettlement cost including new land purchase and house construction. As for the land acquisition for the right of way (ROW) of new transmission line extension, the Electricity Act 1910 stipulates that it is not required to acquire land, even the sites for transmission towers. No compensation for land is considered in the Act. Agricultural products, trees and other properties in the ROW are however compensated for their values for the adverse impact during construction period. The owners and users of land and property are entitled to continue their original activities in the operation stage.
(2) Involuntary Resettlement There is no legislation in Bangladesh that stipulates involuntary resettlement and compensation, and it is left to each Project Owner can make a decision. The Project Owners therefore tend to follow established guidelines introduced by investors and donors.
18.2 B-K-D-P Site Information
18.2.1 Site Outlook The proposed power plant site with domestic coal use is located at the center of Barapukuria, Khalaspir, Dighipara, and Phulbari (B-K-D-P site). The site is within Kushdaha and Binodpur Unions under Nawabganj Upazilla of Dinajpur District. Not far from Nawabganj Town, it is situated in the middle of three domestic coal mines: Barapukuria, Khalashpir, and Dighipara. A map depicting the B-K-D-P site is provided in APFig. 18-4.
1 Dhaka Mega City, Chittagong City, Barisal City, Khulna City, Rajshahi City and Sylhet City.
Power System Master Plan 2010
Source: http://www.banglapedia.org/httpdocs/HT/H_0143.HTM (accessed May 2010)
Proposed Site
APFig. 18-4 Proposed B-K-D-P Site
(1) Health and Sanitation Environment Local respondents drink water from tube wells. There is no problem with groundwater level which varies from between 25 to 30 feet in the rainy season and from 60 to 80 feet in the dry season. Further, the tube well water is arsenic free. Local people often suffer from respiratory diseases, diarrhea, fevers, headaches, colds, etc. They do not know the direct causes behind these diseases and simply believe it is normal day-to-day phenomenon. Simple and effective prevention measures have not been fully taken such as the washing of hands after returning home from their outside sojourns or after latrine usage, after caring for their livestock (such as cows and hens) at home, and especially before and after meals that are eaten by hand. Latrines vary from the pucca (concrete) slab one, the kutcha (soil-made) one, sanitary (brick-built) one, or just through open spaces use. The residents in the study area go to the village doctors (quake) for simple treatment, and visit the qualified doctors or the government hospital for critical treatment.
(2) Housing Conditions The house floors are made of clay without any solid foundation. The ceiling is made of tin and the walls are often made out of clay. Some houses are made of bamboo, bricks and tin-shade. Some have a separate kitchen. Their houses are not quake or sound proof. Massive floods can wash them away if heavy rain strikes the area.
18-13
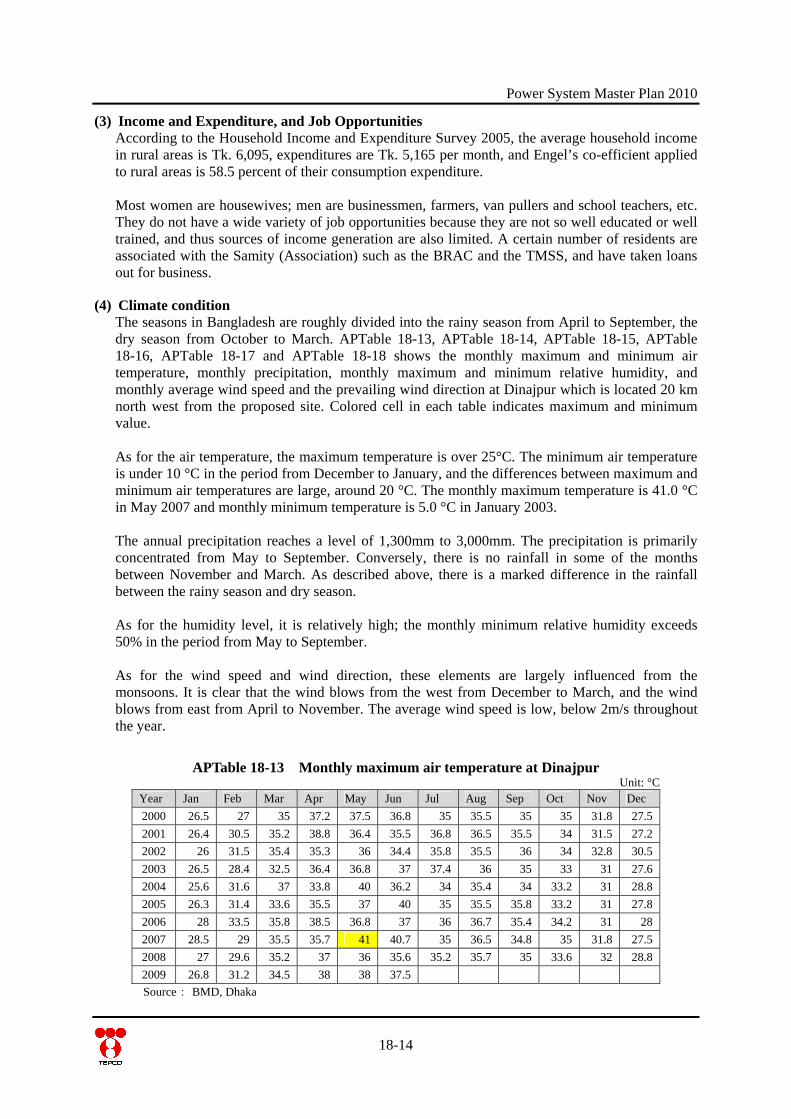
Power System Master Plan 2010
(3) Income and Expenditure, and Job Opportunities According to the Household Income and Expenditure Survey 2005, the average household income in rural areas is Tk. 6,095, expenditures are Tk. 5,165 per month, and Engel’s co-efficient applied to rural areas is 58.5 percent of their consumption expenditure. Most women are housewives; men are businessmen, farmers, van pullers and school teachers, etc. They do not have a wide variety of job opportunities because they are not so well educated or well trained, and thus sources of income generation are also limited. A certain number of residents are associated with the Samity (Association) such as the BRAC and the TMSS, and have taken loans out for business.
(4) Climate condition The seasons in Bangladesh are roughly divided into the rainy season from April to September, the dry season from October to March. APTable 18-13, APTable 18-14, APTable 18-15, APTable 18-16, APTable 18-17 and APTable 18-18 shows the monthly maximum and minimum air temperature, monthly precipitation, monthly maximum and minimum relative humidity, and monthly average wind speed and the prevailing wind direction at Dinajpur which is located 20 km north west from the proposed site. Colored cell in each table indicates maximum and minimum value. As for the air temperature, the maximum temperature is over 25°C. The minimum air temperature is under 10 °C in the period from December to January, and the differences between maximum and minimum air temperatures are large, around 20 °C. The monthly maximum temperature is 41.0 °C in May 2007 and monthly minimum temperature is 5.0 °C in January 2003. The annual precipitation reaches a level of 1,300mm to 3,000mm. The precipitation is primarily concentrated from May to September. Conversely, there is no rainfall in some of the months between November and March. As described above, there is a marked difference in the rainfall between the rainy season and dry season. As for the humidity level, it is relatively high; the monthly minimum relative humidity exceeds 50% in the period from May to September. As for the wind speed and wind direction, these elements are largely influenced from the monsoons. It is clear that the wind blows from the west from December to March, and the wind blows from east from April to November. The average wind speed is low, below 2m/s throughout the year.
APTable 18-13 Monthly maximum air temperature at Dinajpur Unit: °C
Year Jan Feb Mar Apr May Jun Jul Aug Sep Oct Nov Dec 2000 26.5 27 35 37.2 37.5 36.8 35 35.5 35 35 31.8 27.5 2001 26.4 30.5 35.2 38.8 36.4 35.5 36.8 36.5 35.5 34 31.5 27.2 2002 26 31.5 35.4 35.3 36 34.4 35.8 35.5 36 34 32.8 30.5 2003 26.5 28.4 32.5 36.4 36.8 37 37.4 36 35 33 31 27.6 2004 25.6 31.6 37 33.8 40 36.2 34 35.4 34 33.2 31 28.8 2005 26.3 31.4 33.6 35.5 37 40 35 35.5 35.8 33.2 31 27.8 2006 28 33.5 35.8 38.5 36.8 37 36 36.7 35.4 34.2 31 28 2007 28.5 29 35.5 35.7 41 40.7 35 36.5 34.8 35 31.8 27.5 2008 27 29.6 35.2 37 36 35.6 35.2 35.7 35 33.6 32 28.8 2009 26.8 31.2 34.5 38 38 37.5 Source: BMD, Dhaka
18-14
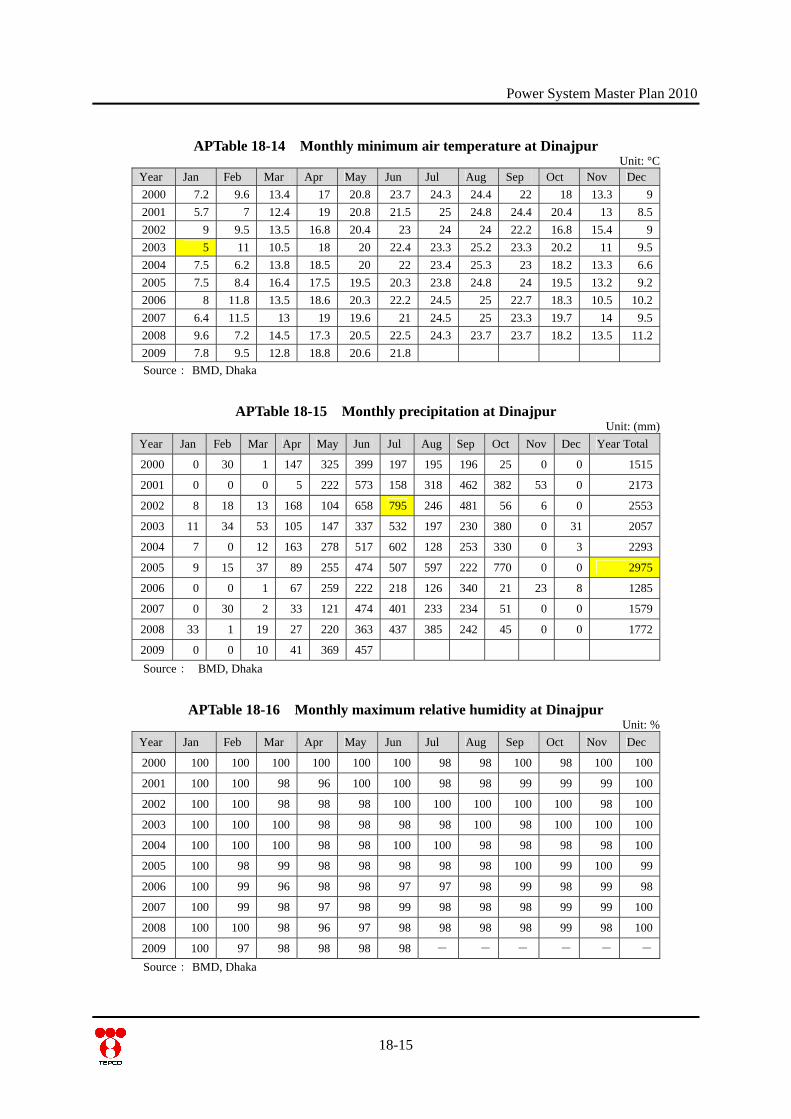
Power System Master Plan 2010
APTable 18-14 Monthly minimum air temperature at Dinajpur Unit: °C
Year Jan Feb Mar Apr May Jun Jul Aug Sep Oct Nov Dec 2000 7.2 9.6 13.4 17 20.8 23.7 24.3 24.4 22 18 13.3 9 2001 5.7 7 12.4 19 20.8 21.5 25 24.8 24.4 20.4 13 8.5 2002 9 9.5 13.5 16.8 20.4 23 24 24 22.2 16.8 15.4 9 2003 5 11 10.5 18 20 22.4 23.3 25.2 23.3 20.2 11 9.5 2004 7.5 6.2 13.8 18.5 20 22 23.4 25.3 23 18.2 13.3 6.6 2005 7.5 8.4 16.4 17.5 19.5 20.3 23.8 24.8 24 19.5 13.2 9.2 2006 8 11.8 13.5 18.6 20.3 22.2 24.5 25 22.7 18.3 10.5 10.2 2007 6.4 11.5 13 19 19.6 21 24.5 25 23.3 19.7 14 9.5 2008 9.6 7.2 14.5 17.3 20.5 22.5 24.3 23.7 23.7 18.2 13.5 11.2 2009 7.8 9.5 12.8 18.8 20.6 21.8 Source: BMD, Dhaka
APTable 18-15 Monthly precipitation at Dinajpur Unit: (mm)
Year Jan Feb Mar Apr May Jun Jul Aug Sep Oct Nov Dec Year Total
2000 0 30 1 147 325 399 197 195 196 25 0 0 1515
2001 0 0 0 5 222 573 158 318 462 382 53 0 2173
2002 8 18 13 168 104 658 795 246 481 56 6 0 2553
2003 11 34 53 105 147 337 532 197 230 380 0 31 2057
2004 7 0 12 163 278 517 602 128 253 330 0 3 2293
2005 9 15 37 89 255 474 507 597 222 770 0 0 2975
2006 0 0 1 67 259 222 218 126 340 21 23 8 1285
2007 0 30 2 33 121 474 401 233 234 51 0 0 1579
2008 33 1 19 27 220 363 437 385 242 45 0 0 1772
2009 0 0 10 41 369 457 Source: BMD, Dhaka
APTable 18-16 Monthly maximum relative humidity at Dinajpur Unit: %
Year Jan Feb Mar Apr May Jun Jul Aug Sep Oct Nov Dec
2000 100 100 100 100 100 100 98 98 100 98 100 100
2001 100 100 98 96 100 100 98 98 99 99 99 100
2002 100 100 98 98 98 100 100 100 100 100 98 100
2003 100 100 100 98 98 98 98 100 98 100 100 100
2004 100 100 100 98 98 100 100 98 98 98 98 100
2005 100 98 99 98 98 98 98 98 100 99 100 99
2006 100 99 96 98 98 97 97 98 99 98 99 98
2007 100 99 98 97 98 99 98 98 98 99 99 100
2008 100 100 98 96 97 98 98 98 98 99 98 100
2009 100 97 98 98 98 98 - - - - - - Source: BMD, Dhaka
18-15
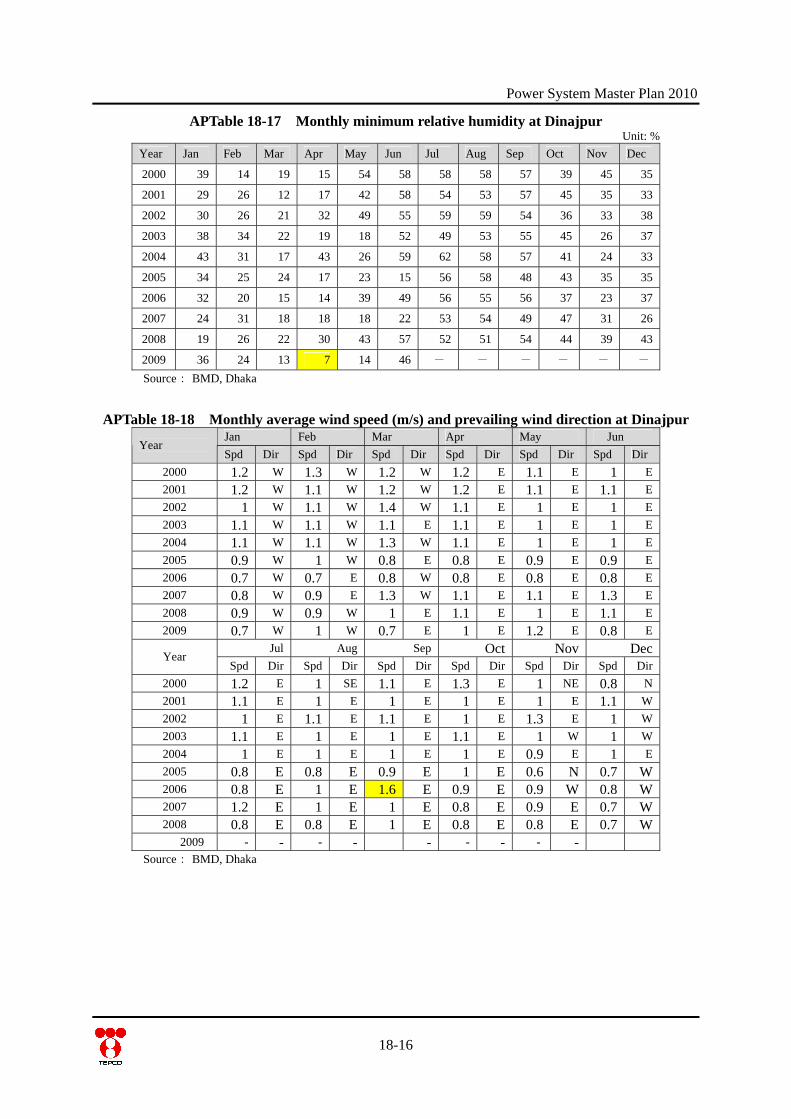
Power System Master Plan 2010
APTable 18-17 Monthly minimum relative humidity at Dinajpur Unit: %
Year Jan Feb Mar Apr May Jun Jul Aug Sep Oct Nov Dec
2000 39 14 19 15 54 58 58 58 57 39 45 35
2001 29 26 12 17 42 58 54 53 57 45 35 33
2002 30 26 21 32 49 55 59 59 54 36 33 38
2003 38 34 22 19 18 52 49 53 55 45 26 37
2004 43 31 17 43 26 59 62 58 57 41 24 33
2005 34 25 24 17 23 15 56 58 48 43 35 35
2006 32 20 15 14 39 49 56 55 56 37 23 37
2007 24 31 18 18 18 22 53 54 49 47 31 26
2008 19 26 22 30 43 57 52 51 54 44 39 43
2009 36 24 13 7 14 46 - - - - - - Source: BMD, Dhaka
APTable 18-18 Monthly average wind speed (m/s) and prevailing wind direction at Dinajpur Jan Feb Mar Apr May Jun
Year Spd Dir Spd Dir Spd Dir Spd Dir Spd Dir Spd Dir
2000 1.2 W 1.3 W 1.2 W 1.2 E 1.1 E 1 E 1.2 2001 W 1.1 W 1.2 W 1.2 E 1.1 E 1.1 E
2002 1 W 1.1 W 1.4 W 1.1 E 1 E 1 E 2003 1.1 W 1.1 W 1.1 E 1.1 E 1 E 1 E 2004 1.1 W 1.1 W 1.3 W 1.1 E 1 E 1 E 2005 0.9 W 1 W 0.8 E 0.8 E 0.9 E 0.9 E 2006 0.7 W 0.7 E 0.8 W 0.8 E 0.8 E 0.8 E 2007 0.8 0.9 1.3 W 1.1 E 1.1 E W E 1.3 E 2008 0.9 W 0.9 W 1 E 1.1 E 1 E 1.1 E 2009 0.7 W 1 W 0.7 E 1 E 1.2 E 0.8 E
Jul Aug Sep Oct Nov Dec Year Spd Dir Spd Dir Spd Dir Spd Dir Spd Dir Spd Dir
2000 1.2 E 1 SE 1.1 E 1.3 E 1 NE 0.8 N 2001 1.1 E 1 E 1 E 1 E 1 E 1.1 W 2002 1 E 1.1 E 1.1 E 1 E 1.3 E 1 W 2003 1.1 E 1 E 1 E 1.1 E 1 W 1 W 2004 1 E 1 E 1 E 1 E 0.9 E 1 E 2005 0.8 E 0.8 E 0.9 E 1 E 0.6 N 0.7 W 2006 0.8 E 1 E 1.6 E 0.9 E 0.9 W 0.8 W 2007 1.2 E 1 E 1 E 0.8 E 0.9 E 0.7 W 2008 0.8 E 0.8 E 1 E 0.8 E 0.8 E 0.7 W
2009 - - - - - - - - - Source: BMD, Dhaka
18-16
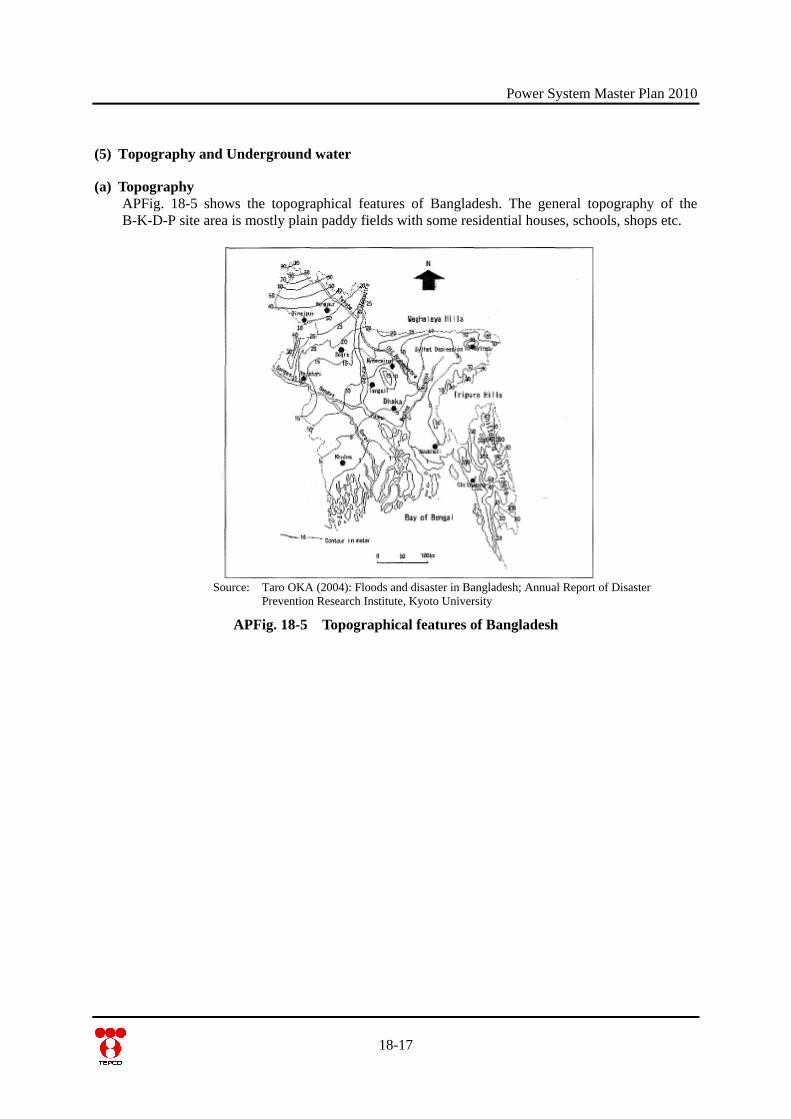
Power System Master Plan 2010
(5) Topography and Underground water
(a) Topography APFig. 18-5 shows the topographical features of Bangladesh. The general topography of the B-K-D-P site area is mostly plain paddy fields with some residential houses, schools, shops etc.
Source: Taro OKA (2004): Floods and disaster in Bangladesh; Annual Report of Disaster
Prevention Research Institute, Kyoto University
APFig. 18-5 Topographical features of Bangladesh
18-17
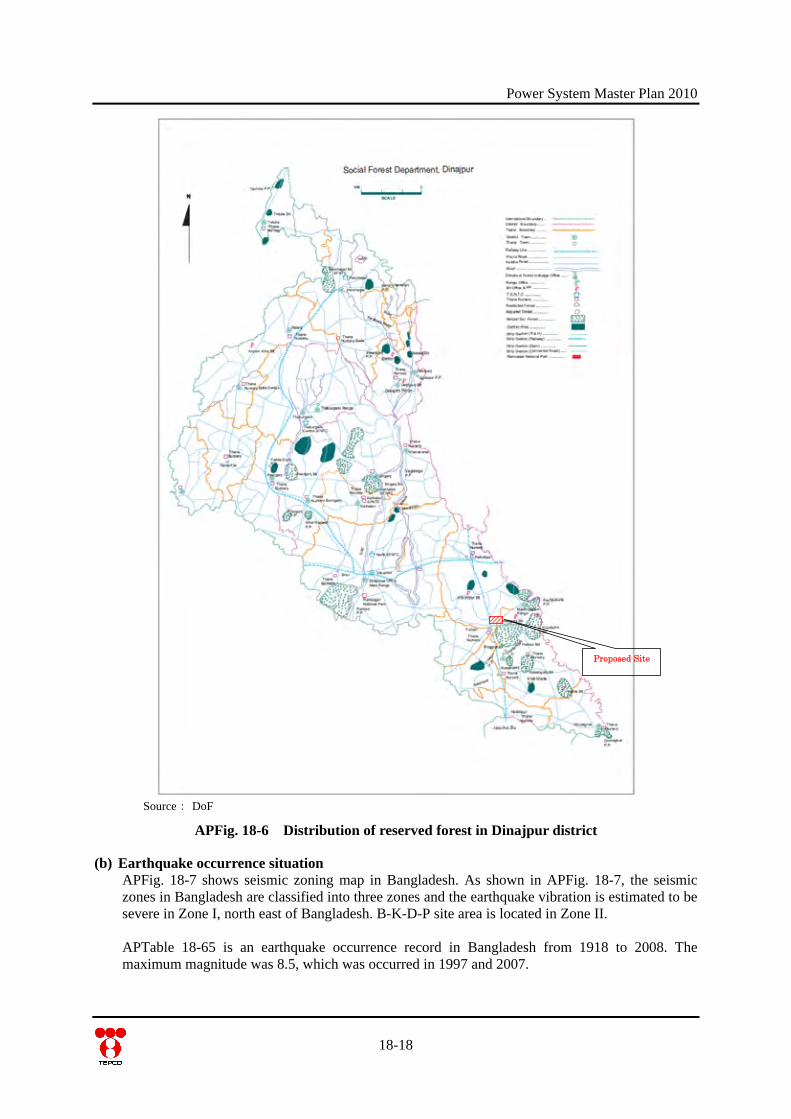
Power System Master Plan 2010
Proposed Site
Source: DoF
APFig. 18-6 Distribution of reserved forest in Dinajpur district
(b) Earthquake occurrence situation APFig. 18-7 shows seismic zoning map in Bangladesh. As shown in APFig. 18-7, the seismic zones in Bangladesh are classified into three zones and the earthquake vibration is estimated to be severe in Zone I, north east of Bangladesh. B-K-D-P site area is located in Zone II. APTable 18-65 is an earthquake occurrence record in Bangladesh from 1918 to 2008. The maximum magnitude was 8.5, which was occurred in 1997 and 2007.
18-18
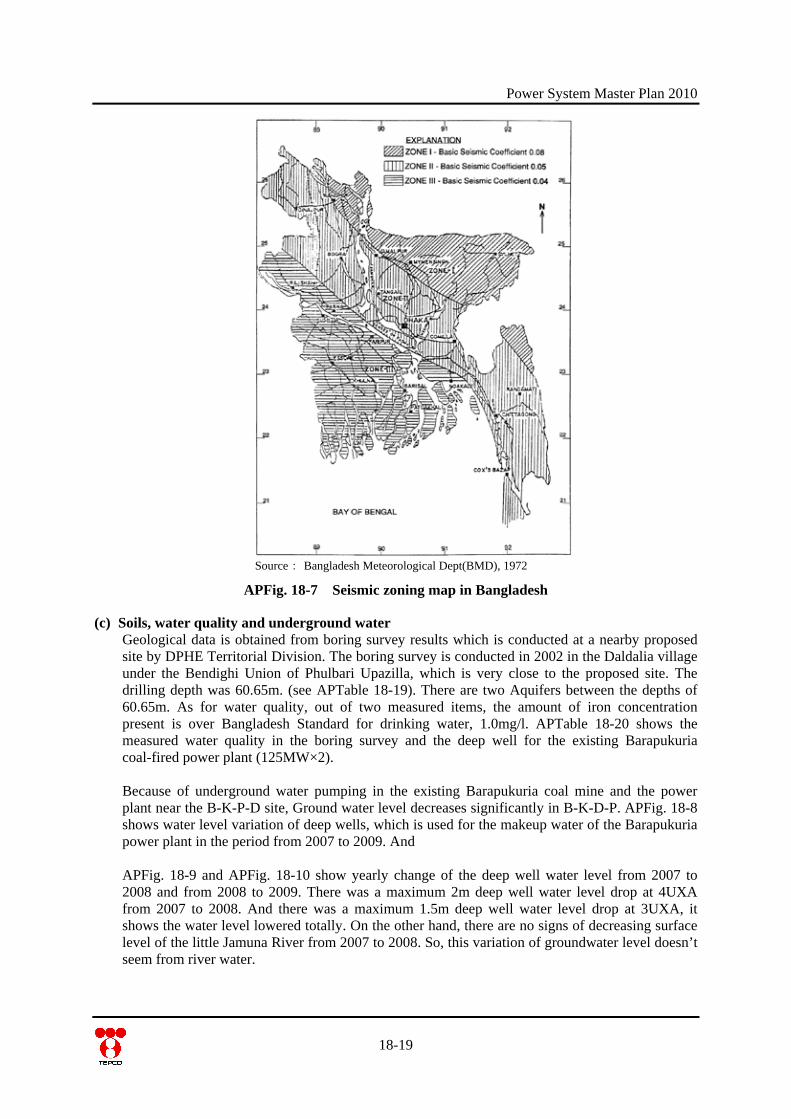
Power System Master Plan 2010
Source: Bangladesh Meteorological Dept(BMD), 1972
APFig. 18-7 Seismic zoning map in Bangladesh
(c) Soils, water quality and underground water Geological data is obtained from boring survey results which is conducted at a nearby proposed site by DPHE Territorial Division. The boring survey is conducted in 2002 in the Daldalia village under the Bendighi Union of Phulbari Upazilla, which is very close to the proposed site. The drilling depth was 60.65m. (see APTable 18-19). There are two Aquifers between the depths of 60.65m. As for water quality, out of two measured items, the amount of iron concentration present is over Bangladesh Standard for drinking water, 1.0mg/l. APTable 18-20 shows the measured water quality in the boring survey and the deep well for the existing Barapukuria coal-fired power plant (125MW×2). Because of underground water pumping in the existing Barapukuria coal mine and the power plant near the B-K-P-D site, Ground water level decreases significantly in B-K-D-P. APFig. 18-8 shows water level variation of deep wells, which is used for the makeup water of the Barapukuria power plant in the period from 2007 to 2009. And APFig. 18-9 and APFig. 18-10 show yearly change of the deep well water level from 2007 to 2008 and from 2008 to 2009. There was a maximum 2m deep well water level drop at 4UXA from 2007 to 2008. And there was a maximum 1.5m deep well water level drop at 3UXA, it shows the water level lowered totally. On the other hand, there are no signs of decreasing surface level of the little Jamuna River from 2007 to 2008. So, this variation of groundwater level doesn’t seem from river water.
18-19
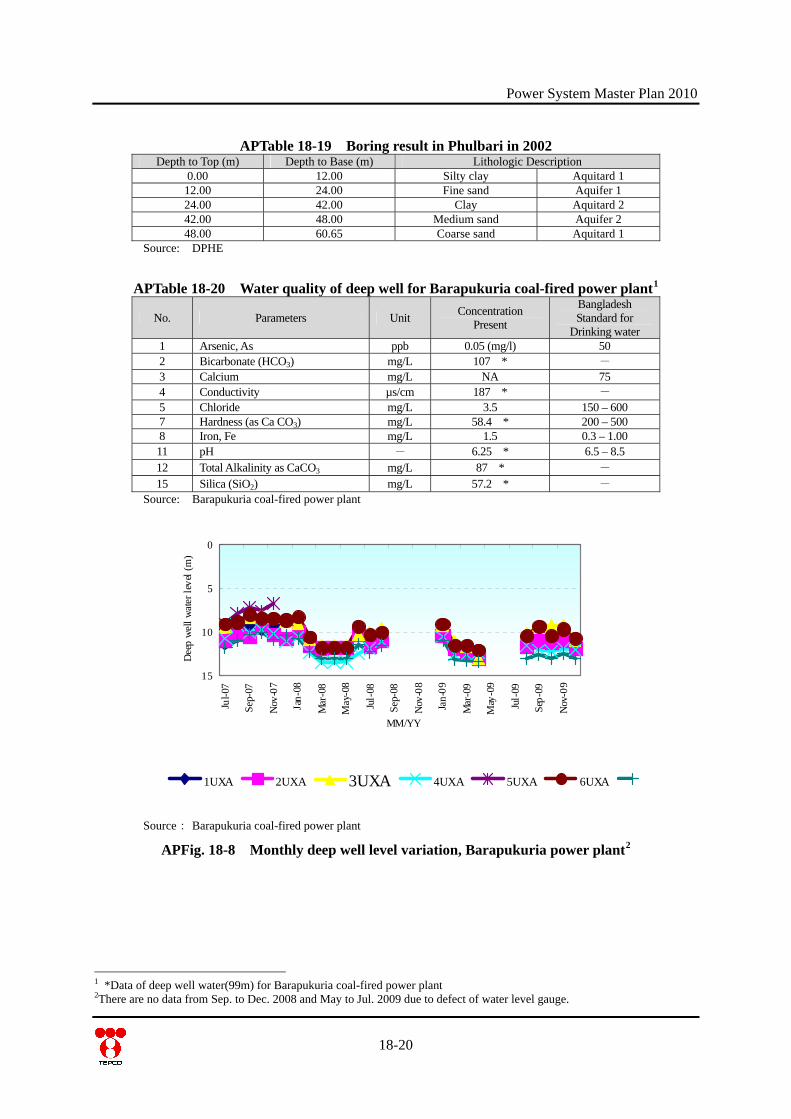
Power System Master Plan 2010
18-20
APTable 18-19 Boring result in Phulbari in 2002 Depth to Top (m) Depth to Base (m) Lithologic Description
0.00 12.00 Silty clay Aquitard 1 12.00 24.00 Fine sand Aquifer 1 24.00 42.00 Clay Aquitard 2 42.00 48.00 Medium sand Aquifer 2 48.00 60.65 Coarse sand Aquitard 1
Source: DPHE
APTable 18-20 Water quality of deep well for Barapukuria coal-fired power plant1
No. Parameters Unit Concentration Present
Bangladesh Standard for
Drinking water 1 Arsenic, As ppb 0.05 (mg/l) 50 2 Bicarbonate (HCO3) mg/L 107 * - 3 Calcium mg/L NA 75 4 Conductivity µs/cm 187 * - 5 Chloride mg/L 3.5 150 – 600 7 Hardness (as Ca CO3) mg/L 58.4 * 200 – 500 8 Iron, Fe mg/L 1.5 0.3 – 1.00 11 pH - 6.25 * 6.5 – 8.5 12 Total Alkalinity as CaCO3 mg/L 87 * - 15 Silica (SiO2) mg/L 57.2 * -
Source: Barapukuria coal-fired power plant
0
5
10
15
Jul-0
7
Sep-
07
Nov
-07
Jan-
08
Mar
-08
May
-08
Jul-
08
Sep-
08
Nov
-08
Jan-
09
Mar
-09
May
-09
Jul-
09
Sep-
09
Nov
-09
MM/YY
Dee
p w
ell w
ater
leve
l (m
)
1UXA 2UXA 3UXA 4UXA 5UXA 6UXA
Source: Barapukuria coal-fired power plant
APFig. 18-8 Monthly deep well level variation, Barapukuria power plant2
1 *Data of deep well water(99m) for Barapukuria coal-fired power plant 2There are no data from Sep. to Dec. 2008 and May to Jul. 2009 due to defect of water level gauge.
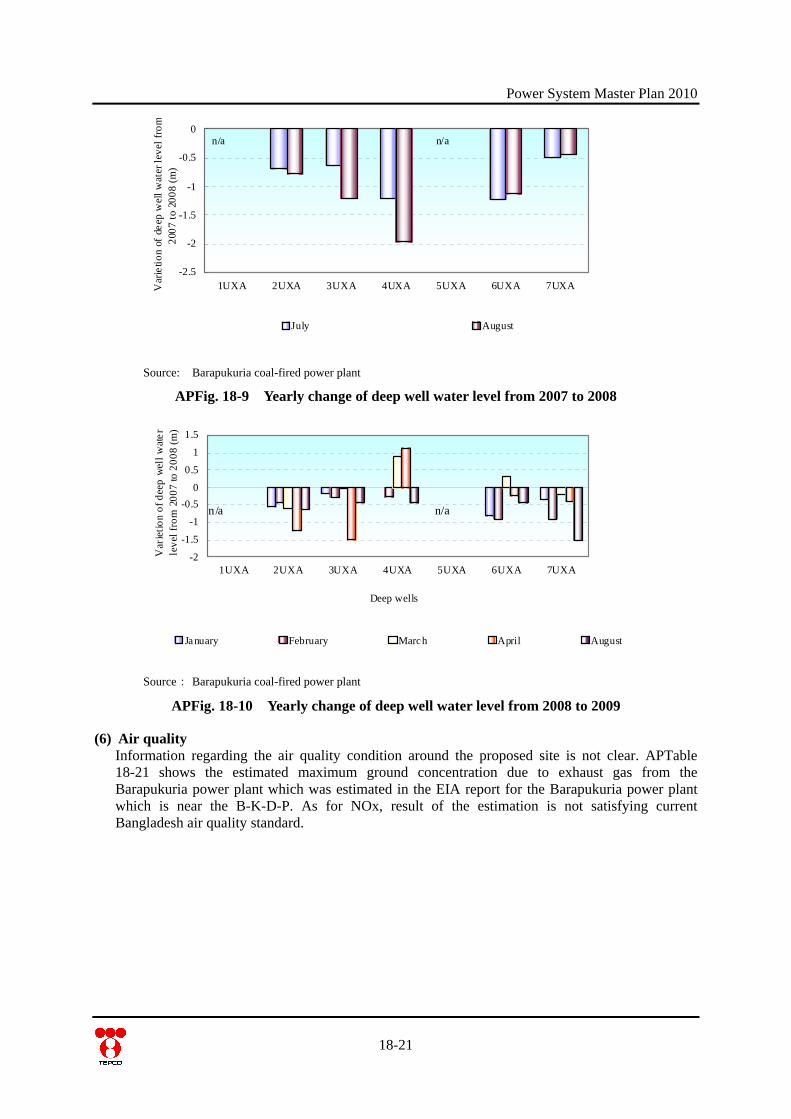
Power System Master Plan 2010
-2.5
-2
-1.5
-1
-0.5
0
1UXA 2UXA 3UXA 4UXA 5UXA 6UXA 7UXA
Deep wells
Var
ietio
n of
dee
p w
ell w
ater
leve
l fro
m20
07 to
200
8 (m
)
July August
n/an/a
Source: Barapukuria coal-fired power plant
APFig. 18-9 Yearly change of deep well water level from 2007 to 2008
-2
-1.5
-1
-0.50
0.5
1
1.5
1UXA 2UXA 3UXA 4UXA 5UXA 6UXA 7UXA
Deep wells
Var
ietio
n of
dee
p w
ell w
ater
leve
l fro
m 2
007
to 2
008
(m)
January February March April August
n/an/a
Source: Barapukuria coal-fired power plant
APFig. 18-10 Yearly change of deep well water level from 2008 to 2009
(6) Air quality Information regarding the air quality condition around the proposed site is not clear. APTable 18-21 shows the estimated maximum ground concentration due to exhaust gas from the Barapukuria power plant which was estimated in the EIA report for the Barapukuria power plant which is near the B-K-D-P. As for NOx, result of the estimation is not satisfying current Bangladesh air quality standard.
18-21
Power System Master Plan 2010
18-22
APTable 18-21 Estimated maximum ground concentration due to exhaust gas from Barapukuria power plant
(Unit: microgram/m3)
No. Parameter Maximum average concentrations
Current Environmental Standard (Bangladesh)
1 Sulfur-dioxide 230 365 (24 hour), 80 (1 year)
2 Oxides Nitrogen 134 100 (1 year)
3 Suspended Particulate Maters(SPM) 7.5 20 (8 hour)
Source: Environmental Impact Assessment (EIA) of Barapukuria Coal Fired Thermal Power Plant, BPDP, Dinajpur
(7) Ecological situation The ecological situation data has been obtained from the Department of Botany and Zoology of Dhaka University, Respective Upazila offices and local consultant.
(a) Terrestrial Communities
1) Flora The area is well vegetated with planted trees. The plants found around the site include a total of 74 different species. Out of those plants on the Red List of the International Union for Conservation of Nature (IUCN) there are two species. All of them fall under the category of LC1. A list of plants near the proposed site is shown in APTable 18-22.
APTable 18-22 List of plants near B-K-P-D site
No. Local Name English Name Scientific Name IUCN Global
Status 1 Ada Ginger Zingiber officinale --
2 Am Mango Mangifera indica L. (Anacard) --
3 Arjun Terminalia arjuna --
4 Ashoke Saraca asoca --
5 Ashwagondha Withania somniferum --
6 Babla Acacia nilotica --
7 Basak Adhatoda zeylanica --
8 Bash Bamboo Podocarpus neriifolius LC 9 Bel Indian apple Aegle marmelos (L). --
10 Beli Jasmin sambac Ait (Olea) --
11 Bet Cane Tree --
12 Bokul Mimusops Elengi Mimusops elengi L --
13 Boroi Indian Jujube Zizyphus rugosa Lam --
14 Bot Banayan tree Ficus benghalensis L. (Mora) --
15 Chameli Jasminum grandiflorum L. (Oleace) --
16 Dalim Pomegranate Punica granatum L. --
17 Debdaru Pine Polyalthia longifolia --
18 Dhol Kalmi Ipomoea fistolosa -- 19 Dhutra Barringtonia acutangula --
20 Dumur Ficus hispida --
21 Gashpul Zephyranthes tubispatha Herb. (Amaryllidaceae)
--
22 Golap Rose Rosa centifolia L. (Rosaceae) --
1 Least Concern
Power System Master Plan 2010
18-23
No. Local Name English Name Scientific Name IUCN Global
Status 23 Halencha (Altermanthere philoxeroides) --
24 Hyacinth (Eichhomia crassipes) --
25 Ipil Ipil Ipil Ipil Leucaena Latisiliqua --
26 Jaba Hibiscus rosa sinensis L. (Malvaceae)
--
27 Jam Black Berry Syzygium cumini skiel. (Myrtaceae) --
28 Jambura Citron Citrus grandis --
29 Jamrul Star apple Syzygium samraogense (Bl.) --
30 Jhau Poplar Thysanolaena maxima --
31 Kachu Colocasia esculenta (L.) --
32 Kadbel Wood apple Feronia limonia (L.) --
33 Kalmi (lpomoea aquatica) --
34 Kalo Dhutra Datura metel --
35 Kamranga Carambola Averrhoa carambola --
36 Kathal Jack fruts Artocarpus heterphyllus Lamk --
37 Khejur Date Palm Phoenix sylvestris --
38 Kola Banana Musa Paradisica --
39 Koroi Derris robusta Benth. --
40 Kowa nim Melia sempervirens --
41 Krishnachura Delonix Regia Delonix regia (Boj.) Raf. (Leguminosae)
--
42 Lebu Lemon Citrus aurantifolia --
43 Madar Erythriana variegata L. var. orientalis Merr.
--
44 Mahua Madhuca indica gmel --
45 Man Kochu Alocasia indica --
46 Mankata Xeromphis spinosa --
47 Mehedi Lawsonia inermis --
48 Mehogoni Swietenia mahagoni --
49 Methi Trigonella foenumgraecum --
50 Muktajhuri Abroma augusta --
51 Narikel Coconut Cocos nucifers L. (Palmae) --
52 Nayantara Catharanthus roseus --
53 Neem Azadirachta indica --
54 Pakur Ficus infectoria --
55 Patabahar Patabahar Cdiaeum variegatum --
56 Pepe Papaya Carica papaya L (caricaceae) --
57 Peyara Guava Psidium Guajava (L) Bat. (Myrtaceae)
--
58 Pui Shak Basella alba L. --
59 Radhachura Caesalpinia pulcherrima Sw. (Leguminosae)
--
60 Rain tree Samea Samon --
61 Rangan Ixorarosea will (Rubiceae) --
62 Rashun Garlic Allium sativum --
63 Sajina Moringa Oleifera Lamk. (Moringa) --
64 Shal Shorea robusta LC 65 Shatamuli Asparagus racemosus --
66 Shimul Bombax ceiba L. (Bombacaceae) --
67 Shonali Lota --
68 Sofeda Sopodilla achras Manilkara --
Power System Master Plan 2010
18-24
No. Local Name English Name Scientific Name IUCN Global
Status 69 Supari Colloq Areca catechu --
70 Tal Palm tree Borassus flabellifer L. (Palmae) --
71 Tentul Tamarind Tamarindus indica --
72 Thankuni Centella asiatica --
73 Topa pana (Pistia stratiotes) --
74 Ulatkambal Abroma augusta -- Source: PSMP Study Team
2) Fauna The animals found around the site include a total 65 species – 18 species of mammalian animals, 33 species of birds, 12 species of reptiles and 2 species of amphibians. Out of those animals on the Red List of the International Union for Conservation of Nature (IUCN) there are 17 species of LC, 3 species of NT1, 1 species of EN2, 1 species of CR3. APTable 18-23 shows a list of animals found around the B-K-P-D site. Special attention must be paid to the protection of the Painted Roofed Turtle (CR) and Fishing Cat (ER).
APTable 18-23 List of animals found around the B-K-P-D site No. Local Name English Name Scientific Name IUCN Global
Status MAMMALS
1 Badur/Daini Greater False Vampire Bat
Megaderma Lyra LC
2 Bagdash Large Indian civet Viverra Zibetha NT 3 Bara Benji Indian Gray Mongoose Herpestes edwardsi LC 4 Bhera Sheep Bovidae: Ovis -- 5 Biral Cat Felis: Catus -- 6 Bon Biral/Wab Jungal Cat/Swamp Cat Felis chaus -- 7 Indur Common House Rat Rattus rattus -- 8 Gadha Ass -- -- 9 Ghora Horse Equus caballus --
10 Goru Cow -- --
11 Kathbirali Black giant squirrel/Malayan giant squirrel
Ratufa bicolor NT
12 Khek Shiyal Bengol Fox/Indian Fox Vulpes bengalensis LC 13 Khargosh/Shashak Rufous-tailed Hare Lepus nigricollis -- 14 Kukur Dog Cannis Familiaris --
15 Mecho Biral/Mecho Bagh
Fishing cat Proionailurus viverrinus EN
16 Mohish Bafallow -- -- 17 Sagol Goat Capra Hircus -- 18 Shojaru Indian crested Porcupine Hystrix Indica LC
BIRDS 1 Babui-Batan Small Pratincole Glareola Lactea -- 2 Bok Intermediate Egret Mesophoyx intermedia -- 3 Banspaati Green Bee-eater merops orientails -- 4 Baj Crested Groshawk Accipiter trivirgatus -- 5 Bulbuli Red-vented Bulbul Pycnonotus cafer LC
1 Near Threatened 2 Endangered 3 Critically endangered
Power System Master Plan 2010
18-25
No. Local Name English Name Scientific Name IUCN Global Status
6 Hutum Pecha Rock Eagle Owl Bubo bengalensis LC
7 Chil Pariah Kite Passer domesticus -- 8 Chorui House Sparrow Passer Domesticus -- 9 Dahuk White Breasted water hen Amaurornis phoenicurus LC
10 Doyel White-eyed Buzzard Butastur teesa LC
11 Eagal Bazzard -Eagal Dicrurus macrocercus -- 12 Fingey Black Drongo Dicrurus macrocercus -- 13 Ghughu Oriental Turtle Dove Streptopelia orientails LC
14 Hash Duck Anatidae Anseriformes -- 15 Hot-titi River Lapwing Vanellus duvaucelii LC
16 Jalali Kobutor Rock Pigon Columba Livia LC
17 Kak House Crow Corvus splendens -- 18 Kana Bok Indian Pond Heron Ardeola grayii -- 19 Kat Tokra Woodpecker Picoides pubescens -- 20 Kokil Asian Koel Eudynamys scolopacea -- 21 Konch Bak. Pond Heron. Ardeola grayii --
22 Machhranga White Throated Kingfisher
Halcyn smyrensis --
23 Mohanchura Hoopoe Upupa epops -- 24 Moutusi Purple rumped Sunbird Nectarinia zeylonica -- 25 Paira Pigeon Columba livia domestica -- 26 Pankouri Great Cormorant Phalacrocorax carbo LC
27 Pencha Spot-bellied Eagle-owl Bubo nipalensis LC
28 Rajhans Bar-headed Goose Anser indicus LC
29 Shalik Indian mynah -- -- 30 Shonkho Chil Brammoni Kite Haliastur Indus -- 31 Sipahi Bulbuli Red –whiskered Bulbul Pycnonotus jocosus -- 32 Tia Roseringed parakeet Psittscula krameri -- 33 Tuntuni Tailor bird Orthotomus sutorius --
REPTILE 1 Tiktiki House Lizard Hemidactylus brokii -- 2 Kasim Painted Roofed Turtle Kachuga Kachuga CR
3 Ajogor Rock Python Python molurus NT
4 Gui Shap Bengal Monitor Varanus bengalensis -- 5 Daraj Green Rat Snake Coluber nigromarginatus -- 6 Dudhraj Common Trinket Snake Elaphe Helena --
7 Sabuj Dhora Green Keel back Snake Macropisthodon plumbicolor
--
8 Laldhora Shap Red-necked Keelback Rhabdophis subminiatus --
9 Kalo Mete Dhora Shap
Dark-Bellied Marsh Snake
Xenochrophis cersogaster --
10 Shakini Shap Banded Krait Bungarus fasciatus LC
11 Gokhra Shap Monocellate Cobra Naja kaouthia -- 12 Raj Gokhra King Cobra Ophiophagus Hannah LC
AMPHIBIA 1 Beng Frog Anura: Ranidae -- 2 Brischik Scorpion Archinida1 Scorpionida -- Source: PSMP Study Team
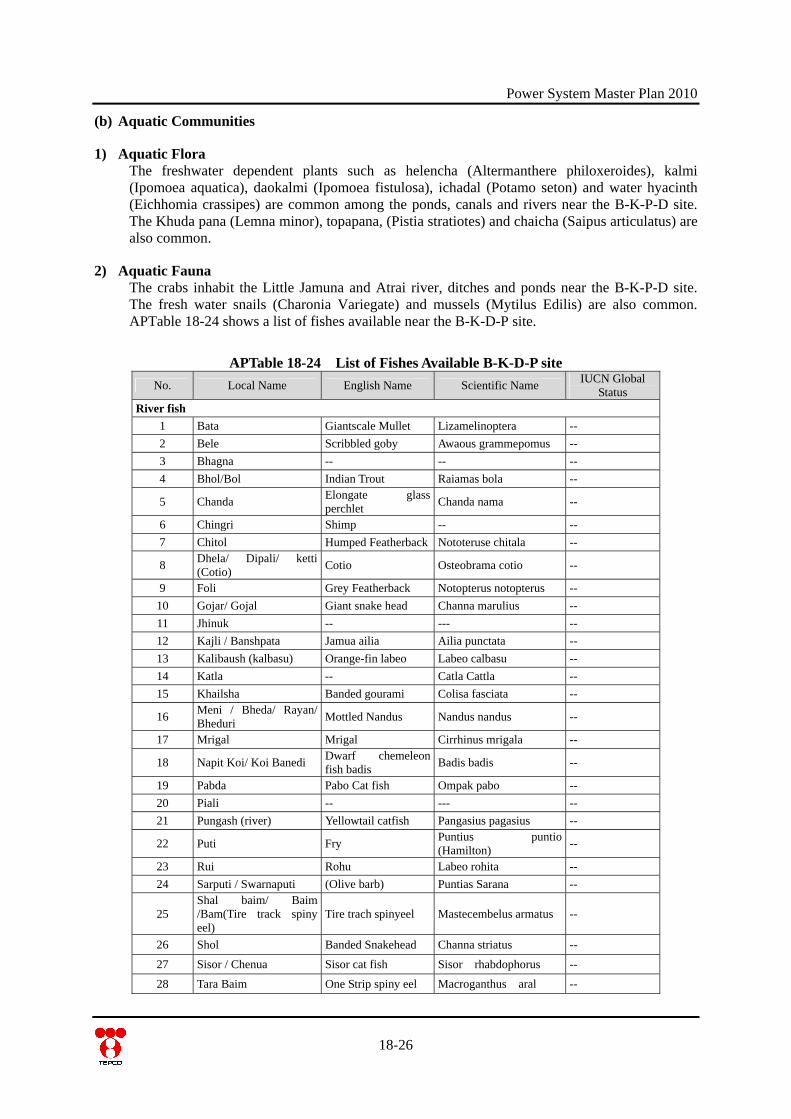
Power System Master Plan 2010
(b) Aquatic Communities
1) Aquatic Flora The freshwater dependent plants such as helencha (Altermanthere philoxeroides), kalmi (Ipomoea aquatica), daokalmi (Ipomoea fistulosa), ichadal (Potamo seton) and water hyacinth (Eichhomia crassipes) are common among the ponds, canals and rivers near the B-K-P-D site. The Khuda pana (Lemna minor), topapana, (Pistia stratiotes) and chaicha (Saipus articulatus) are also common.
2) Aquatic Fauna The crabs inhabit the Little Jamuna and Atrai river, ditches and ponds near the B-K-P-D site. The fresh water snails (Charonia Variegate) and mussels (Mytilus Edilis) are also common. APTable 18-24 shows a list of fishes available near the B-K-D-P site.
APTable 18-24 List of Fishes Available B-K-D-P site No. Local Name English Name Scientific Name IUCN Global
Status River fish
1 Bata Giantscale Mullet Lizamelinoptera --
2 Bele Scribbled goby Awaous grammepomus --
3 Bhagna -- -- --
4 Bhol/Bol Indian Trout Raiamas bola --
5 Chanda Elongate glass perchlet Chanda nama --
6 Chingri Shimp -- --
7 Chitol Humped Featherback Nototeruse chitala --
8 Dhela/ Dipali/ ketti (Cotio) Cotio Osteobrama cotio --
9 Foli Grey Featherback Notopterus notopterus --
10 Gojar/ Gojal Giant snake head Channa marulius --
11 Jhinuk -- --- --
12 Kajli / Banshpata Jamua ailia Ailia punctata --
13 Kalibaush (kalbasu) Orange-fin labeo Labeo calbasu --
14 Katla -- Catla Cattla --
15 Khailsha Banded gourami Colisa fasciata --
16 Meni / Bheda/ Rayan/ Bheduri Mottled Nandus Nandus nandus --
17 Mrigal Mrigal Cirrhinus mrigala --
18 Napit Koi/ Koi Banedi Dwarf chemeleon fish badis
Badis badis --
19 Pabda Pabo Cat fish Ompak pabo --
20 Piali -- --- --
21 Pungash (river) Yellowtail catfish Pangasius pagasius --
22 Puti Fry Puntius puntio (Hamilton) --
23 Rui Rohu Labeo rohita --
24 Sarputi / Swarnaputi (Olive barb) Puntias Sarana --
25 Shal baim/ Baim /Bam(Tire track spiny eel)
Tire trach spinyeel Mastecembelus armatus --
26 Shol Banded Snakehead Channa striatus --
27 Sisor / Chenua Sisor cat fish Sisor rhabdophorus --
28 Tara Baim One Strip spiny eel Macroganthus aral --
18-26
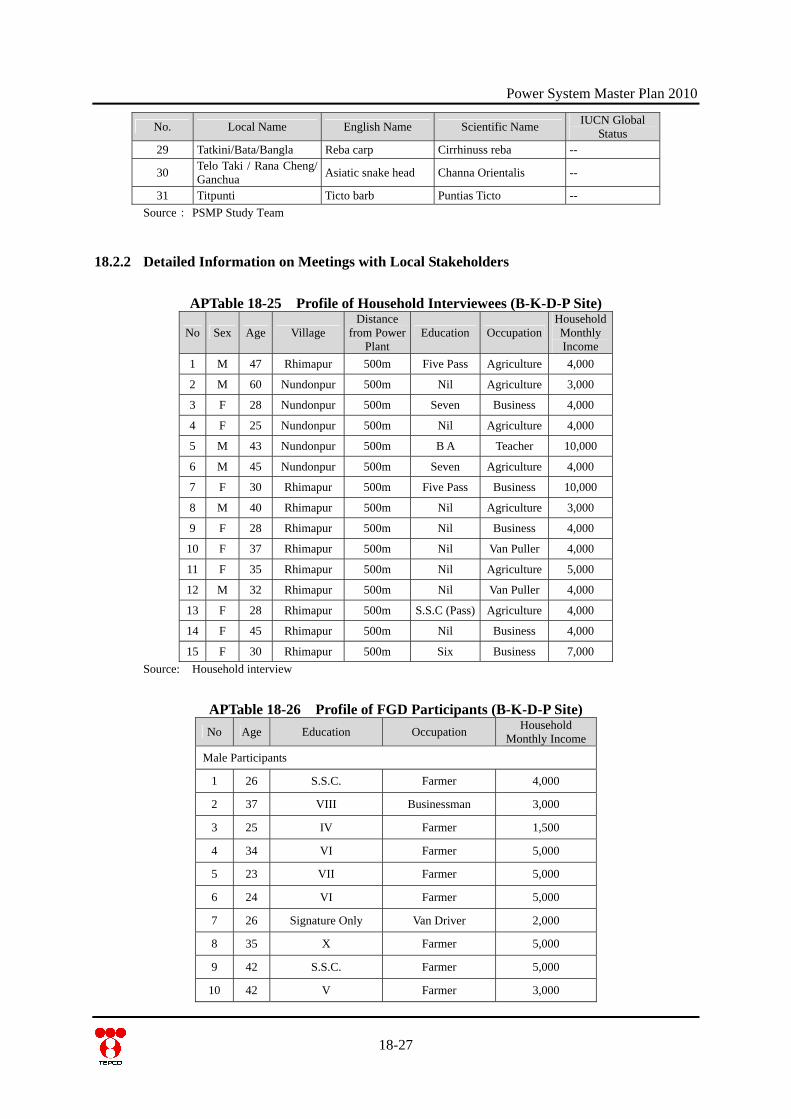
Power System Master Plan 2010
18-27
No. Local Name English Name Scientific Name IUCN Global Status
29 Tatkini/Bata/Bangla Reba carp Cirrhinuss reba --
30 Telo Taki / Rana Cheng/ Ganchua Asiatic snake head Channa Orientalis --
31 Titpunti Ticto barb Puntias Ticto --
Source: PSMP Study Team
18.2.2 Detailed Information on Meetings with Local Stakeholders
APTable 18-25 Profile of Household Interviewees (B-K-D-P Site)
No Sex Age Village Distance
from Power Plant
Education OccupationHousehold Monthly Income
1 M 47 Rhimapur 500m Five Pass Agriculture 4,000
2 M 60 Nundonpur 500m Nil Agriculture 3,000
3 F 28 Nundonpur 500m Seven Business 4,000
4 F 25 Nundonpur 500m Nil Agriculture 4,000
5 M 43 Nundonpur 500m B A Teacher 10,000
6 M 45 Nundonpur 500m Seven Agriculture 4,000
7 F 30 Rhimapur 500m Five Pass Business 10,000
8 M 40 Rhimapur 500m Nil Agriculture 3,000
9 F 28 Rhimapur 500m Nil Business 4,000
10 F 37 Rhimapur 500m Nil Van Puller 4,000
11 F 35 Rhimapur 500m Nil Agriculture 5,000
12 M 32 Rhimapur 500m Nil Van Puller 4,000
13 F 28 Rhimapur 500m S.S.C (Pass) Agriculture 4,000
14 F 45 Rhimapur 500m Nil Business 4,000
15 F 30 Rhimapur 500m Six Business 7,000 Source: Household interview
APTable 18-26 Profile of FGD Participants (B-K-D-P Site) No Age Education Occupation Household
Monthly Income Male Participants
1 26 S.S.C. Farmer 4,000
2 37 VIII Businessman 3,000
3 25 IV Farmer 1,500
4 34 VI Farmer 5,000
5 23 VII Farmer 5,000
6 24 VI Farmer 5,000
7 26 Signature Only Van Driver 2,000
8 35 X Farmer 5,000
9 42 S.S.C. Farmer 5,000
10 42 V Farmer 3,000
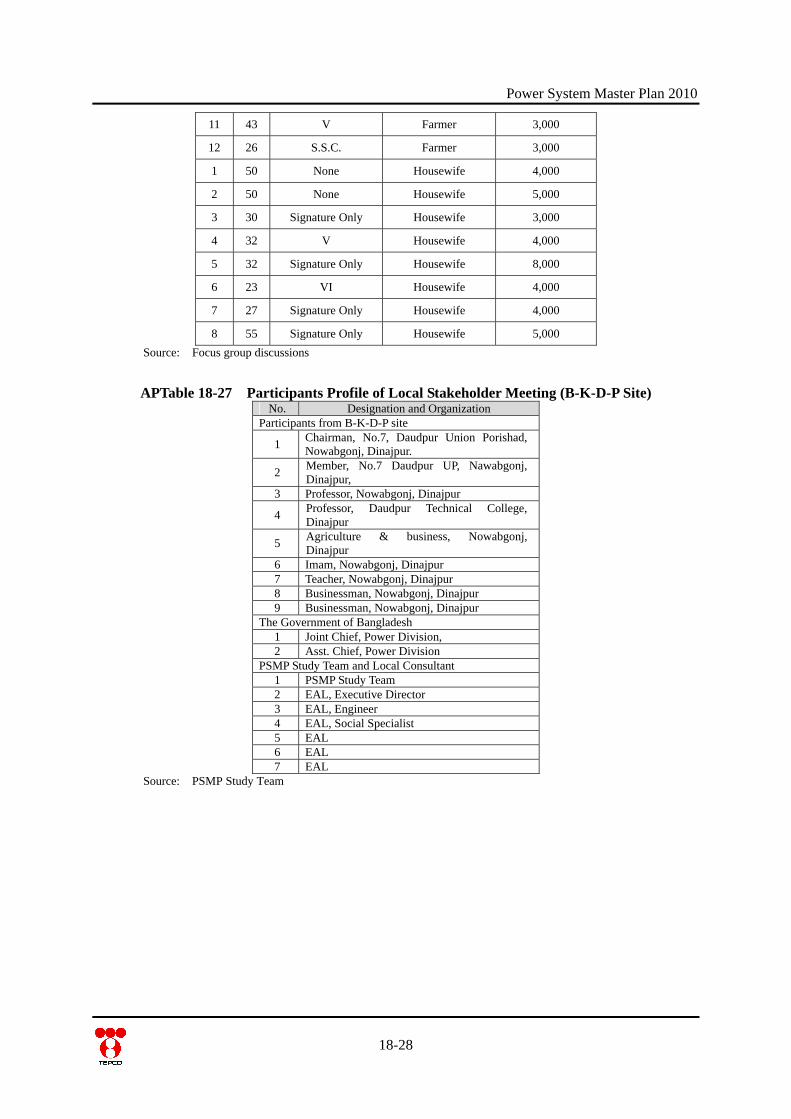
Power System Master Plan 2010
11 43 V Farmer 3,000
12 26 S.S.C. Farmer 3,000
1 50 None Housewife 4,000
2 50 None Housewife 5,000
3 30 Signature Only Housewife 3,000
4 32 V Housewife 4,000
5 32 Signature Only Housewife 8,000
6 23 VI Housewife 4,000
7 27 Signature Only Housewife 4,000
8 55 Signature Only Housewife 5,000 Source: Focus group discussions
APTable 18-27 Participants Profile of Local Stakeholder Meeting (B-K-D-P Site) No. Designation and Organization
Participants from B-K-D-P site
1 Chairman, No.7, Daudpur Union Porishad, Nowabgonj, Dinajpur.
2 Member, No.7 Daudpur UP, Nawabgonj, Dinajpur,
3 Professor, Nowabgonj, Dinajpur
4 Professor, Daudpur Technical College, Dinajpur
5 Agriculture & business, Nowabgonj, Dinajpur
6 Imam, Nowabgonj, Dinajpur 7 Teacher, Nowabgonj, Dinajpur 8 Businessman, Nowabgonj, Dinajpur 9 Businessman, Nowabgonj, Dinajpur
The Government of Bangladesh 1 Joint Chief, Power Division, 2 Asst. Chief, Power Division
PSMP Study Team and Local Consultant 1 PSMP Study Team 2 EAL, Executive Director 3 EAL, Engineer 4 EAL, Social Specialist 5 EAL 6 EAL 7 EAL
Source: PSMP Study Team
18-28
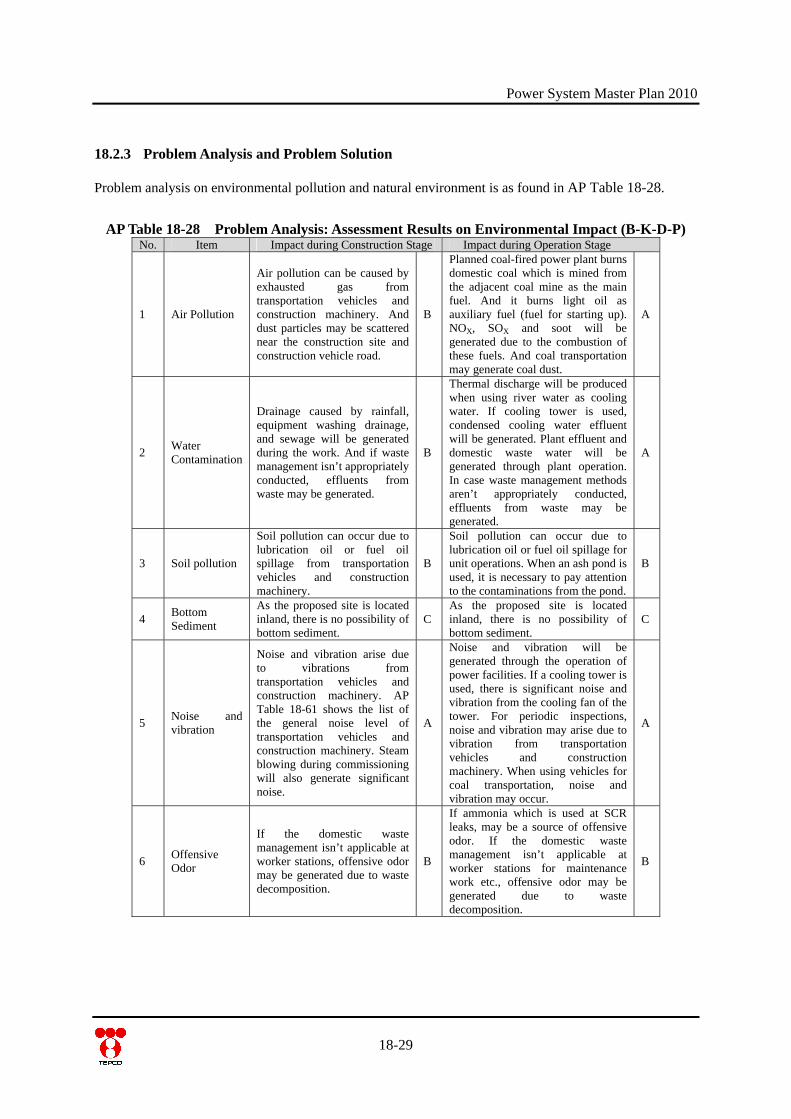
Power System Master Plan 2010
18.2.3 Problem Analysis and Problem Solution Problem analysis on environmental pollution and natural environment is as found in AP Table 18-28.
AP Table 18-28 Problem Analysis: Assessment Results on Environmental Impact (B-K-D-P) No. Item Impact during Construction Stage Impact during Operation Stage
1 Air Pollution
Air pollution can be caused by exhausted gas from transportation vehicles and construction machinery. And dust particles may be scattered near the construction site and construction vehicle road.
B
Planned coal-fired power plant burns domestic coal which is mined from the adjacent coal mine as the main fuel. And it burns light oil as auxiliary fuel (fuel for starting up). NOX, SOX and soot will be generated due to the combustion of these fuels. And coal transportation may generate coal dust.
A
2 Water Contamination
Drainage caused by rainfall, equipment washing drainage, and sewage will be generated during the work. And if waste management isn’t appropriately conducted, effluents from waste may be generated.
B
Thermal discharge will be produced when using river water as cooling water. If cooling tower is used, condensed cooling water effluent will be generated. Plant effluent and domestic waste water will be generated through plant operation. In case waste management methods aren’t appropriately conducted, effluents from waste may be generated.
A
3 Soil pollution
Soil pollution can occur due to lubrication oil or fuel oil spillage from transportation vehicles and construction machinery.
B
Soil pollution can occur due to lubrication oil or fuel oil spillage for unit operations. When an ash pond is used, it is necessary to pay attention to the contaminations from the pond.
B
4 Bottom Sediment
As the proposed site is located inland, there is no possibility of bottom sediment.
CAs the proposed site is located inland, there is no possibility of bottom sediment.
C
5 Noise and vibration
Noise and vibration arise due to vibrations from transportation vehicles and construction machinery. AP Table 18-61 shows the list of the general noise level of transportation vehicles and construction machinery. Steam blowing during commissioning will also generate significant noise.
A
Noise and vibration will be generated through the operation of power facilities. If a cooling tower is used, there is significant noise and vibration from the cooling fan of the tower. For periodic inspections, noise and vibration may arise due to vibration from transportation vehicles and construction machinery. When using vehicles for coal transportation, noise and vibration may occur.
A
6 Offensive Odor
If the domestic waste management isn’t applicable at worker stations, offensive odor may be generated due to waste decomposition.
B
If ammonia which is used at SCR leaks, may be a source of offensive odor. If the domestic waste management isn’t applicable at worker stations for maintenance work etc., offensive odor may be generated due to waste decomposition.
B
18-29

Power System Master Plan 2010
18-30
No. Item Impact during Construction Stage Impact during Operation Stage
7 Waste
Construction work will generate metal chips, waste plastic, wood shavings, waste glass and waste oil. Domestic wastes such as cans, bottles and food residue will be generated by construction workers at their work stations.
B
By-products generated through the operation of coal-fired power plant are coal ash, gypsum (if limestone-gypsum FGD is used), sludge from waste water treatment facility, and cooling water canal fouling (if the river water or sea water is used for the cooling water). These by-products will be wasted if they are discarded without recycling. Maintenance work will generate metal chips, waste plastic, wood shavings, waste glass and waste oil. And domestic waste such as cans, bottles, and food residue will be generated at the workers’ stations.
A
8 Ground Subsidence
If the underground water level decreases due to water being used for construction work, there is a possibility of ground subsidence occurring. However, water usage during construction work stays minimum, and such possibility is small.
CThere is a large possibility of ground subsidence occurring if ground water is used as cooling water.
A
9 Geographical Feature
There is little impact since the proposed site is plain and doesn’t have any outstanding geographical features.
C
There is little impact since the proposed site is plain and doesn’t have any outstanding geographical features.
C
10 Biota and Ecosystem
There is a possibility of Painted Roofed Turtle existing in the site which is categorized CR in IUCN Red list. Site location and transmission line route should be carefully examined in order to avoid the reserved forests in Dinajpur District (see AP Fig.18-6) not to bring adverse impact to the natural environment.
B
There is a possibility of Painted Roofed Turtle existing which is categorized CR in IUCN Red list. Site location and transmission line route should be carefully examined in order to avoid the reserved forests in Dinajpur District (see AP Fig.18-6) not to bring adverse impact to the natural environment.
B
11 Water Usage
People in the surrounding areas of the proposed site use tube well water for their daily life needs. If the underground water level decreases due to water used during construction work, there is a possibility of adverse impact to life water usage. Because water usage for construction work is not so large, the impact of underground water level reduction on water usage will be small.
C
People in the surrounding area of the proposed site uses tube well water for daily life. If underground water is used for cooling water, it will have a large impact on water usage by decreasing underground water level.
A
Power System Master Plan 2010
18-31
No. Item Impact during Construction Stage Impact during Operation Stage
12 Accident
Construction accidents may be caused due to the defects of health and safety management of construction work. It is necessary to pay attention especially to high altitude areas where accidents from falling may occur as well as construction vehicle road accidents and electricity accident.
A
There is possibility of accidents occurring such as fires due to oil spillage or instantaneous combustion of coal, accidents due to leakage or spillage of chemicals like caustic soda and sulfuric acid, accidents or incidents involving maintenance work.
B
13 Global Warming
Transportation vehicles and construction machinery will emit CO2.
C
It is estimated that approximately 3.54 million tons of CO2 will be emitted from per 600MW unit per year through operation of coal-fired power plant. Domestic coal is classified bituminous coal which exhausts less amount of CO2 compared with sub-bituminous coal and brown coal.
B
Source: PSMP Study Team
Problem analysis on social impact is as found in AP Table 18-29.
AP Table 18-29 Problem Analysis: Assessment Results on Social Impact (B-K-D-P) No Item Impact during Construction Stage Impact during Operation Stage
1
Involuntary Resettlement
Land acquisition is anticipated for 200 acres that require approximately 1,250 households to be relocated.
A
Damage to houses and health hazards can be caused by smoke extraction, noise pollution, water pollution and land subsidence when the resettlement action plan is not appropriately planned and implemented. Political intervention and/or local movement against the operation of the power station can occur when adverse impacts on local residents’ lives and livelihoods are severe.
B
Loss of employment and livelihoods can be caused by temporary loss of agricultural lands during the construction period.
Permanent loss of employment and livelihoods can be caused by land acquisition due to power station construction and surrounding areas.
2
Local Economy such as Employment and Livelihood etc.
The Bangladesh regulation stipulates that displaced persons are entitled to compensation for loss of land, property and standing crops in monetary terms at the fixed rates. It however does not compensate for loss of employment or livelihoods.
B
The Bangladesh regulation stipulates that displaced persons are entitled to compensation for loss of land, property and standing crops in monetary terms at the fixed rates. It however does not for loss of employment or livelihoods. The destitute, poor and landless farmers as agricultural laborers and wage laborers can become further distressed when job opportunities or at least skill training opportunities for them are not secured.
B
3 The Poor, Indigenous and
There are no ethnic minorities living on site grounds. B There are no ethnic minorities living
on site grounds. B
Power System Master Plan 2010
18-32
No Item Impact during Construction Stage Impact during Operation Stage
Ethnic People The destitute, poor and landless farmers can lose their jobs when agricultural land is lost due to the construction of power station.
The destitute, poor and landless farmers can become further distressed when job opportunities or at least skill training opportunities for them are not secured.
Disparity between the land owners and the rest (landless farmers, wage laborers etc.) can be widened.
Landless farmers and wage laborers can become further distressed and the disparity between the land owners and them can be widened when job opportunities and skill training opportunities are not given to them.
4 Misdistribution of Benefit and Loss In case an ample number of job
opportunities and skill training opportunities are not provided to meet the demand, the disparity between those with such opportunities and those without may widen.
B Local livelihoods can be affected and health hazards can be caused by land subsidence, smoke extraction, noise pollution, water pollution and water shortage in case the environmental management plan is not appropriately planned and implemented.
B
Local conflict can occur between the relocated people and the host community.
Local conflict can become constant between the relocated people and the host community.
5 Local Conflict of Interests
Excessive interventions by various stakeholders can trigger local conflict among residents, and the disruption of the local community.
B
-
B
Appropriate information and knowledge may not be properly disseminated to the illiterate, particularly women. 6 Gender
Gender gaps can occur in job opportunities.
B
Appropriate information and knowledge may not be properly disseminated to the illiterate, particularly women.
B
Child labor may occur due to their parents’ loss of job.
Child labor may occur due to their parents’ loss of job.
Children may lose education opportunities.
Children may lose education opportunities.
Playgrounds for children may be lost.
Playgrounds for children may be lost.
7 Children’s Rights
Children may catch infectious diseases triggered by outsiders’ entry into the community.
C
Children may catch infectious diseases triggered by outsiders’ entry into the community.
C
The present potential site that has been selected is away from the city center, residential areas, local markets, and protected forests. Land use and utilization of local resources however may be affected by the selected location and transmission line route.
The present potential site that has been selected is away from the city center, residential areas, local markets, and protected forests. Land use and utilization of local resources however may be affected by the selected location and transmission line route.
8
Land Use and Utilization of Local Resources
Temporary loss of present land use pattern and/or economic infrastructure may occur.
C
Permanent loss of present land use pattern and/or economic infrastructure may occur.
C
Power System Master Plan 2010
18-33
No Item Impact during Construction Stage Impact during Operation Stage
9
Social Institutions such as Social Infrastructure and Local Decision Making Institutions
Disruption of local community can be caused via a conflict of interests among politicians, government offices, and residents. It might cause a delay in procedures of land acquisition and resettlement.
B - C
10 Existing Social Infrastructure
Temporary loss of existing social infrastructure can occur due to the construction works.
CTraffic to/from power station may become heavier. Social services may become insufficient.
C
There is no cultural heritage existing in the site. A careful consideration however should be given to Seeta Kuthuri located near the site.
A careful consideration however should be given to Seeta Kuthuri located near the site. 11 Cultural
Heritage
Landscape may be lost.
C
-
C
12 Infectious Diseases such as HIV/AIDS
Infectious diseases may be spread via the construction workers into the community.
CInfectious diseases may be spread via the operation workers into the community.
C
Source: PSMP Study Team Mitigation measures on environmental pollution and natural environment are as found in AP Table 18-30.
AP Table 18-30 Mitigation Measures for Environmental Impact (B-K-D-P)
No. Item Mitigation measures during
Construction Stage Mitigation measures during Operation
Stage
1 Air pollution
Countermeasures for air pollution by exhaust gas from transportation vehicles and construction machinery, and dust scattering from construction traffic are studied as in AP Table 18-67 and AP Table 18-68. As for the reduction of exhaust gas from transportation vehicles and construction machinery, idling stops and keeping proper exhaust condition by routine inspection of vehicles are judged to be applied. As for countermeasures for dust scattering, load cover, periodical vehicle washing and periodic peripheral road cleaning are judged to be applied.
AP table 18-62 shows countermeasures for NOX, AP Table 18-63 shows countermeasures for SOX, AP Table 18-64 shows countermeasures for Soot, and AP Table 18-66 shows countermeasures for coal dust. Besides conducting flue gas treatment by system including FGD, SCR, and ESP etc., mitigation of coal dust scattering is paid attention to. It is desirable to apply covered conveyer to prevent coal dust with coal transfer.
2 Water contamination
Countermeasures for water contamination due to excavation waste soil outflow are suitable via a fence installation utilizing sandbags etc. As for the effluent due to equipment washing, it is suitable to install a temporary precipitation tank and to drain the supernatant water. As for sewage, it is suitable to put up a septic tank. In addition, as for waste, water contamination can be prevented if waste treatment is conducted promptly and the waste is not left for long time.
There will be no warm effluent water generation since cooling tower or air cooled condenser will be adopted as cooling system. Plant effluent and sewage according to plant operations are discharged after waste water treatment including coagulating sedimentation, neutralization, and oil separation. Appropriate waste water facility capacity design is needed especially if air cooling tower is adopted as condensed cooling water blow effluent is a large amount.
Power System Master Plan 2010
18-34
No. Item Mitigation measures during
Construction Stage Mitigation measures during Operation
Stage
3 Soil pollution
AP Table 18-69 shows the study result of countermeasures for soil pollution due to oil spillage from transportation vehicles and construction machinery. As a result, periodic maintenance implementation and conducting pre-operational machinery checks of machinery is judged important to be applied.
Oil and grease treatment procedures make it clear to prevent the spillage of lubrication oil or fuel oil. In addition, the management organization has been established to implement works according to designated procedures. And action procedures should be prepared in order to not to spread the adverse impact in case of an oil spillage occurrence. An oil dike has been set around the oil storage tank. It is necessary to dump ash properties in dumping site with water proof seat to prevent bottom sediment leakage out of the ash pond.
4 Noise and vibration
AP Table 18-70shows the study result of countermeasures for noise and vibration due to vibrations from transportation vehicles and construction machinery. As a result, leveling the construction process, using low-noise machinery, and lowering vehicle speed in residential areas are judged to be proper countermeasures. As for countermeasures for noise due to steam blowing during commissioning, the establishment of a work schedule without the blowing of steam during the night time is judged to be applied.
Developing the green belt along the site border is a costless and effective way to mitigate noise and vibrational impact. To avoid noise and vibration due to coal transportation, covered conveyor is desirable to use. If the boundary noise simulated in the detail EIA exceeds the noise regulations which is decided on each category (AP Table 18-8), the introduction of a green belt, sound insulating material and a sound insulating wall will be examined. B-K-D-P site is categorized in Residential Zone1.
5 Offensive odor
Offensive odor caused by domestic waste decomposition from workers camps can be prevented by the separate collection and periodic disposal of waste.
NOx mitigation without SCR which uses ammonia is effective measure against offensive odor. When using ammonia, storage tanks, pipes, and valves must be inspected periodically. In addition to preventing operational mishaps, operations of the ammonia facility are to be managed by the person in charge. With regards to garbage treatment, it is suitable to dump it periodically and not have it in storage for a long time.
6 Waste
Reduction of waste amount can be conducted by establishing a waste management program including reduction, reuse and recycling. Implementation of a separate collection of waste, especially for paint sludge and batteries will be required. These items should be collected separately and disposed in designated areas.
Reduction of waste amount can be conducted by establishing a waste management program including reduction, reuse, and recycling. Because by-products due to plant operations are large amount, they should be recycled as much as possible. AP Table 18-71 shows examples of by-products recycling.
7 Ground subsidence
- Ground subsidence should be prevented by adopting a cooling tower or air cooled condenser as a cooling system.
1 Information source is DoE.
Power System Master Plan 2010
18-35
No. Item Mitigation measures during
Construction Stage Mitigation measures during Operation
Stage
8 Biota and Ecosystem
Painted Roofed Turtle’s nest building should be investigated in detail EIA. The nest relocation should be conducted when detected. Existence of Painted Roofed Turtle should be carefully paid attention to during construction stage and necessary protection actions should be conducted if detected. The site location and transmission line route should avoid protected forests.
Painted Roofed Turtle nest building should be investigated in detail EIA. The nest relocation should be conducted when detected. Existence of Painted Roofed Turtle should be carefully paid attention to during operation stage, and necessary protection actions should be conducted when detected
9 Water Usage
- Air cooled condenser or cooling tower will be adopted as cooling system. Underground water drawdown for power plant operation should be prevented by using river water even if adopting the cooling tower. It is difficult to avoid a groundwater drawdown due to coal mine development. At the timing of pilot mining, mitigation measures should be confirmed of ground water drawdown by reinjection of drainage.
10 Accidents
A suitable OHS organization (policy, manual, announcement of policy, safety training and safety patrol) should be established to prevent accidents. It is also important to conduct quality control in construction work to prevent accidents during commissioning and operation period.
A suitable OHS organization (policy, manual, announcement of the policy and manuals, safety training, safety patrols) should be established for accident prevention. It is also important to conduct quality control in maintenance work in order to prevent accidents.
11 Global warming
- It is estimated that approximately 3.54 million ton of CO2 will be emitted from per 600MW unit per year through the operation of a coal-fired power plant. An ultra-super critical boiler with high thermal efficiency is being planned to be introduced into this master plan. Due to the introduction of a high efficiency unit, 1.07 million tons of CO2 can be reduced per 600MW unit per year compared with the case of the Barapukuria class unit introduction. These figures are calculated based on designed value. It is important to keep designed output and efficiency from adequate O&M.
source: PSMP Study Team
18.3 Chittagong Site Information
18.3.1 Site Overview The proposed Chittagong site (Chittagong South) is expected to be located on land covering several mauzas of Banskhali Upazilla under Chittagong District, on the southern mouth of the Sangu River pouring into the Bay of Bengal. It is 15 km away from Chittagong town in the south-eastern direction. A map showing the site has been given in APFig. 18-11.
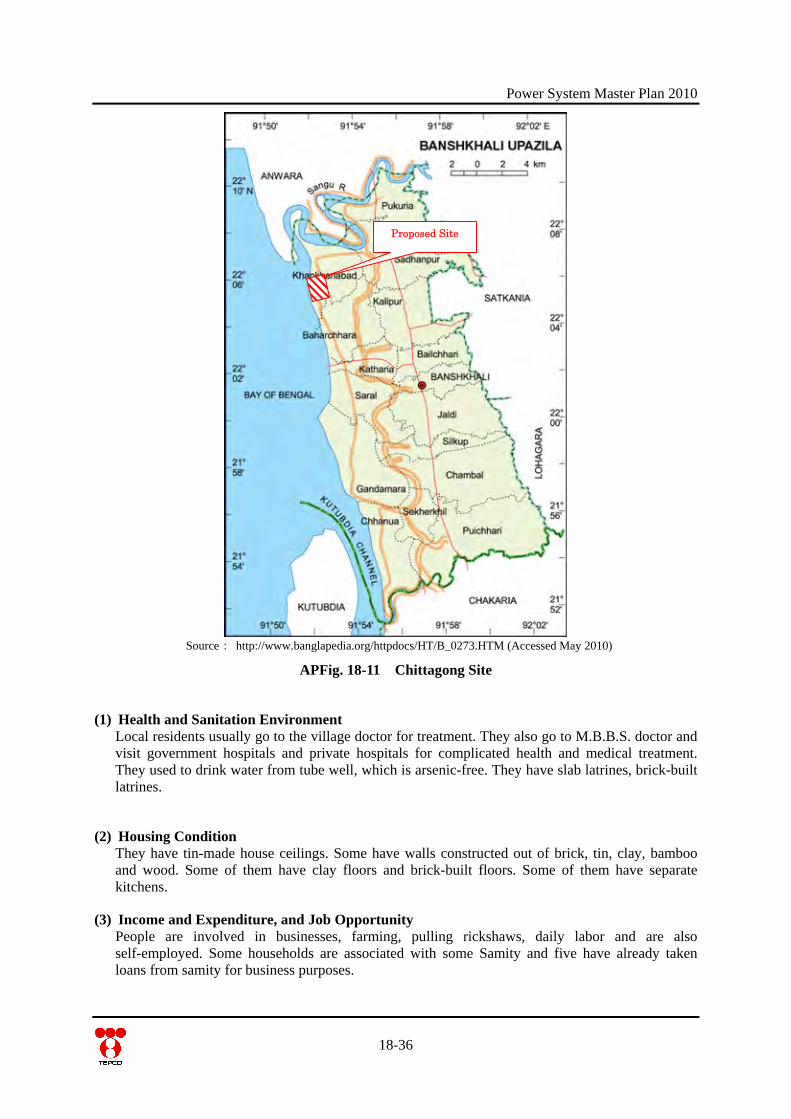
Power System Master Plan 2010
Proposed Site
Source: http://www.banglapedia.org/httpdocs/HT/B_0273.HTM (Accessed May 2010)
APFig. 18-11 Chittagong Site
(1) Health and Sanitation Environment Local residents usually go to the village doctor for treatment. They also go to M.B.B.S. doctor and visit government hospitals and private hospitals for complicated health and medical treatment. They used to drink water from tube well, which is arsenic-free. They have slab latrines, brick-built latrines.
(2) Housing Condition They have tin-made house ceilings. Some have walls constructed out of brick, tin, clay, bamboo and wood. Some of them have clay floors and brick-built floors. Some of them have separate kitchens.
(3) Income and Expenditure, and Job Opportunity People are involved in businesses, farming, pulling rickshaws, daily labor and are also self-employed. Some households are associated with some Samity and five have already taken loans from samity for business purposes.
18-36
Power System Master Plan 2010
(4) Climate condition APTable 18-31, APTable 18-32, APTable 18-33, APTable 18-34, APTable 18-35 and APTable 18-36 show the monthly maximum and minimum air temperature, monthly precipitation, monthly maximum and minimum relative humidity, and monthly average wind speed and prevailing wind direction at Chittagong (Patenga) station from 2000 to 2002 and from 2008 to 2009. Colored cell in each table indicates maximum and minimum value. As for the air temperature, it is as hot as the maximum air temperature is over 28°C throughout the year. The minimum air temperature is under 20°C from November to March. The monthly maximum temperature is 39.5°C in May 2001 and the monthly minimum temperature is 9.0 °C in January 2001. The annual precipitation reaches a level of 2,100mm to 3,500mm. The precipitation is at its most concentrated in the months from May to September. Conversely, there is no rainfall in some of the months from November to March. As described above, there is a marked difference in the rainfall between the rainy season and the dry season. As for the humidity, it is relatively high, the monthly minimum relative humidity exceeds 50% in the period from May to October As for the wind speed and wind direction, there are large influences from monsoons. It is clear that the wind blows from north from November to January, and the wind blows from south or southeast from April to September. The wind direction fluctuated between February and March. The average wind speed is not high, below 5m/s throughout a year. However, the Chittagong port experienced 12 times as many major cyclonic storms in the past 50 years. The maximum wind speed of the major cyclonic storm in 1991 was 62.5m/s. APTable 18-66 shows a past record of the Major Cyclonic storms in Bangladesh.
APTable 18-31 Monthly maximum air temperature at Chittagong Unit: °C
Year Jan Feb Mar Apr May Jun Jul Aug Sep Oct Nov Dec 2000 30.2 30.6 36 34.9 35 35.5 35 35 34.4 35.8 34 29.6 2001 30 32.4 36.7 38.5 39.5 33 33.3 34.5 36 36 34 30.8 2002 31.2 35.2 37.2 34.5 35.4 33.5 33 33.5 35.2 35.4 35 30.6 2008 28 29.5 33.6 34 34.3 34.2 32.4 33.3 33.5 34 31.7 30.5 2009 29.5 31 34 34.3 35 34.2 34.5 - - - - - Source: BMD, Dhaka
APTable 18-32 Monthly minimum air temperature at Chittagong Unit: °C
Year Jan Feb Mar Apr May Jun Jul Aug Sep Oct Nov Dec 2000 12 13 17 19.4 19.8 21.4 21.5 22.3 22 21.5 15.6 13 2001 9 11.6 14 22.5 21.2 22.8 25.5 24.5 22.8 22.8 16.5 14.2 2002 12.5 12.5 17.2 17.3 21 23 24 24 22.5 20.5 17.5 12.2 2008 12.6 11.8 17.6 20.5 22.1 24.2 24 24.2 23.4 20.6 17 14.5 2009 12.8 14 18.2 18.8 21.4 22.2 24 - - - - - Source: BMD, Dhaka
18-37

Power System Master Plan 2010
APTable 18-33 Monthly precipitation at Chittagong (mm) Year Jan Feb Mar Apr May Jun Jul Aug Sep Oct Nov Dec Year Total 2000 17 0 16 108 748 643 713 689 138 416 15 0 3503 2001 0 12 1 41 423 - 385 238 224 242 81 0 - 2002 1 0 70 67 453 366 920 456 145 129 128 10 2745 2008 64 7 6 1 244 538 963 757 250 171 31 0 3032 2009 0 2 3 114 373 434 1244 - - - - - - Source: BMD, Dhaka
APTable 18-34 Monthly maximum relative humidity at Chittagong (%) Year Jan Feb Mar Apr May Jun Jul Aug Sep Oct Nov Dec
2000 100 98 98 98 98 100 100 100 100 100 100 100
2001 100 100 100 93 94 98 96 96 100 100 100 100
2002 91 100 93 98 97 97 95 96 96 95 93 -
2008 100 100 100 98 96 98 100 100 100 100 98 100
2009 100 100 98 97 98 97 100 - - - - - Source: BMD, Dhaka
APTable 18-35 Monthly minimum relative humidity at Chittagong (%) Year Jan Feb Mar Apr May Jun Jul Aug Sep Oct Nov Dec
2000 23 26 28 48 45 59 64 57 60 61 41 38
2001 31 22 16 34 46 54 62 60 56 59 33 29
2002 29 32 23 34 54 55 57 63 58 43 45 36
2008 31 20 31 26 40 60 67 69 52 48 41 44
2009 20 25 16 47 43 59 60 - - - - - Source: BMD, Dhaka
APTable 18-36 Monthly average wind speed (m/s) and prevailing wind direction at Chittagong Jan Feb Mar Apr May Jun
Year Spd Dir Spd Dir Spd Dir Spd Dir Spd Dir Spd Dir
2000 1.7 N 2.1 N 3.8 S 4.9 S 2.7 SE 4.0 S 2001 1.4 N 4.2 S 2.5 W 4.3 S 2.7 SE 4.2 SE 2002 2.2 NE 3.3 W 3.2 W 4.4 S 5.2 S 3.6 SE 2008 2.7 N 2.9 N 2.9 WSW 2.7 S 3.7 SSE 4.4 SSE 2009 3.2 WSW 3.9 WSW 3.2 WSW 4.4 SSE 3.7 SSE 3.3 E
Jul Aug Sep Oct Nov Dec Year
Spd Dir Spd Dir Spd Dir Spd Dir Spd Dir Spd Dir 2000 4.1 SSE 2.7 SE 3 S 2.3 W 1.7 NNE 1.7 N 2001 5.3 S 3.4 SE 3.1 SE 2.7 W 2.6 NNE 2.1 NE 2002 4.3 S 4.5 S 2.7 SE 2.7 WNW 2.2 NE 2.1 NE 2008 4.4 SE 4.3 ESE 3.1 E 2.5 NNW 2.6 NNW 2.5 NNW 2009 4.5 E - - - - - - - - - - Source: BMD, Dhaka
18-38
Power System Master Plan 2010
(5) Topography and Underground water Bangladesh’s topography and earthquake situation of Bangladesh is shown in APFig. 18-5 and APTable 18-65. The land form around the proposed site is almost a flat land with some high spots. The Chittagong site area is located in Zone II as seismic zones.
(a) Geology and water quality Geological data has been obtained from boring survey results conducted at our near proposed site by the DPHE Territorial Division. The boring survey conducted in 2008 in the Deotala village under the Paraikora Union of Anowara Upazilla, which is close to the proposed site. APTable 18-37 and APTable 18-38 shows the result of the boring survey. The drilling depth was 208.23m. The results indicate that there is an Aquifer under 150m in depth. In addition, as for water quality, the iron concentration present exceeds the Bangladeshi Standard for drinking water, 1.0mg/l out of 3 measured items.
APTable 18-37 Boring result in Anowara (1) Depth to Top (m) Depth to Base (m) Lithologic Description
0.00 20.00 Silty clay 20.00 60.00 Silty 60.00 100.00 Silty clay
100.00 150.00 Silty
Aquitard 1
150.00 180.00 Fine to Medium Sand 180.00 200.00 Medium to Coarse Sand 200.00 208.23 Coarse Sand with gravel
Aquifer 1
Source: DPHE
APTable 18-38 Boring result in Anowara (2)
Sl. No. Parameters Unit Concentration
Present
Bangladesh Standard for
Drinking water 1 Iron, Fe mg/L 3.0 0.3 – 1.00
2 Arsenic, As ppb 0.0 (mg/l) 50
3 Chloride mg/L 200 150 – 600
Source: DPHE
(6) Ecological situation Data on the ecological situation has been obtained from the Department of Botany and Zoology of Dhaka University, Respective Upazila offices and local consultant.
(a) Terrestrial Communities
1) Flora The area is well vegetated with planted trees. 75 species of the plants were found around the site. According to the Red List of the International Union for Conservation of Nature (IUCN), 2 species of them are identified as Least Concern (LC). A list of plants near the proposed site is provided in APTable 18-39.
APTable 18-39 List of animals found around Chittagong site No. Local Name English Name Scientific Name IUCN status 1 Ada Ginger Zingiber officinale --
2 Am Mango Mangifera indica L. (Anacard) -- 3 Arjun Terminalia arjuna --
4 Ashoke Saraca asoca --
18-39
Power System Master Plan 2010
18-40
No. Local Name English Name Scientific Name IUCN status 5 Ashwagondha Withania somniferum --
6 Babla Acacia nilotica --
7 Bansh pata Podocarpus nerifolia --
8 Basak Adhatoda zeylanica --
9 Bash Bamboo Podocarpus nebifolia LC
10 Beet Can Tree Beta vulgaris -- 11 Bel Indian apple Aegle marmelos (L). -- 12 Beli Jasmin sambac Ait (Olea) --
13 Bokul (Mimusops Elengi) Mimusops elengi L
--
14 Boroi Indian Jujube Zizyphus rugosa Lam -- 15 Bot Banayan tree Ficus benghalensis L. (Mora) -- 16 Chameli Jasminum grandiflorum L. (Oleace) -- 17 Chandan Sandal Santalum album L. (Santalaceae) -- 18 Dalim Pomegranate Punica granatum L. -- 19 Debdaru Pine Polyalthia longifolia -- 20 Dhol Kalmi Ipomoea fistolosa -- 21 Dhutra Thorn Apple Barringtonia acutangula -- 22 Dumur Ficus hispida --
23 Gashpul Zephyranthes tubispatha Herb. (Amaryllidaceae)
--
24 Golap Rose Rosa centifolia L. (Rosaceae) -- 25 Halencha (Altermanthere philoxeroides) -- 26 Hyacinth (Eichhomia crassipes) -- 27 Ipil Ipil Ipil Ipil Leucaena Latisiliqua -- 28 Jaba Hibiscus rosa sinensis L. (Malvaceae) -- 29 Jam Black Berry Syzygium cumini skiel. (Myrtaceae) -- 30 Jambura Citron Citrus grandis -- 31 Jamrul Star apple Syzygium samraogense (Bl.) -- 32 Jhau Poplar Thysanolaena maxima -- 33 Kachu Colocasia esculenta (L.) -- 34 Kadbel Wood Apple Feronia limonia (L.) -- 35 Kalmi (lpomoea aquatica) -- 36 Kalo Dhutra Datura metel -- 37 Kamranga Carambola Averrhoa carambola -- 38 Kathal Jack Fruit Artocarpus heterphyllus Lamk -- 39 Khejur Date Plam Phoenix sylvestris -- 40 Kola Banana Musa Paradisica -- 41 Koroi Derris robusta Benth. -- 42 Kowa nim Melia sempervirens --
43 Krishnachura Delonix regia Delonix regia (Boj.) Raf. (Leguminosae)
--
44 Lazzaboti M. pudica L -- 45 Lebo Lemon Citrus aurantifolia --
46 Madar Erythriana variegata L. var. orientalis Merr.
--
47 Man Kochu Alocasia indica -- 48 Mankata Xeromphis spinosa -- 49 Mehedi Lawsonia inermis -- 50 Mehogoni Swietenia mahagoni -- 51 Methi Trigonella foenum-graecum -- 52 Muktajhuri Abroma augusta --
Power System Master Plan 2010
18-41
No. Local Name English Name Scientific Name IUCN status 53 Narikel Coconut Cocos nucifers L. (Palmae) -- 54 Neem Azadirachta indica -- 55 Pakur Ficus Infectoria -- 56 Patabahar Patabahar Codiaeum Variegateum -- 57 Pepe Papaya Carica papaya L (caricaceae) --
58 Peyara Guava Psidium Guajava (L) Bat. (Myrtaceae)
--
59 Pui Shak Basella alba L. --
60 Radhachura Caesalpinia pulcherrima Sw. (Leguminosae)
--
61 Rain tree Samea Samon -- 62 Rangan Ixora rosea Will (Rubiceae) -- 63 Rashun Garlic Allium sativum -- 64 Sajina Moringa Oleifera Lamk. (Moringa) -- 65 Shal Shorea robusta LC
66 Shatamuli Asparagus racemosus -- 67 Shimul Bombax ceiba L. (Bombacaceae) -- 68 Shonali Lota -- 69 Sofeda Sapodilla Achras Manilkara -- 70 Supari Colloq -- 71 Tal Palm Tree Borassus flabellifer L. (Palmae) -- 72 Tentul Tamarind Tamarindus indica -- 73 Thankuni Centella asiatica -- 74 Topa pana (Pistia stratiotes) -- 75 Ulatkambal Abroma augusta -- Source : PSMP Study Team
2) Fauna The animals found around the site include a total of 73 species - 24 species of mammalian animals, 39 species of birds, 8 species of reptiles and 2 species of amphibians. Out of those animals on the Red List of the International Union for Conservation of Nature (IUCN) there are 8 species of LC, 1 species NT, 1 species of VU1, 3 species of EN, 1 species of CR. Special care is needed for the protection of the Panited Roofed Turtle (CR) and Fishing Cat, Ganges River dolphin, Blue Whale (ER). APTable 18-40 shows a list of all the animals found around the Chittagong site.
APTable 18-40 List of animals found around Chittagong site No. Local Name English Name Scientific Name IUCN Global
Status MAMMALS
1 Badur/Daini False Vampire Megaderma Lyra -- 2 Bagdash Large Indian civet Viverra Zibetha -- 3 Bara Benji Common Mongoose Herpestes edwardsi -- 4 Bhera Sheep Bovidae : Ovis -- 5 Biral Cat Felis : Catus -- 6 Bon Biral/Wab Jungal Cat/Swamp Cat Felis chaus -- 7 Indur Common House Rat Rattus rattus -- 8 Gadha Ass -- -- 9 Gecho Chucho Common Tree shrew Tupaiaglis -- 10 Ghora Horse Equus caballus --
1 Vulnerable
Power System Master Plan 2010
18-42
No. Local Name English Name Scientific Name IUCN Global Status
11 Goru Cow -- -- 12 Kathbirali Malayan Giant Squirrel Ratufa bicolor -- 13 Khek Shiyal Bengol Fox/Indian Fox Vulpes bengalensis -- 14 Khargosh/Shashak Rufous-tailed Hare Lepus nigricollis -- 15 Kukur Dog Cannis Familiaris --
16 Mecho Biral/Mecho Bagh
Fishing cat Prionailurus viverrinus
EN
17 Mohish Bafallow -- -- 18 Sagol Goat Capra Hircus -- 19 Shojaru Indian crested Porcupine Hystrix Indica LC
20 Shesu Ganges River dolphin Platanista gangetica gangetica
EN
21 Shial Jackal Canis Aureus Linnaeus
--
22 Shukor Pig -- --
23 Timi Blue Whale Balaenoptera musculus
EN
24 Uod Biral Oriental Small-clawed Otter
Aonyx cinerea VU
BIRDS 1 Babui-Batan Small Pratincole Glareola Lactea -- 2 Bali Hash -- -- -- 3 Banspaati Green Bee-eater merops orientalis -- 4 Baj Crested Groshawk Accipiter trivirgatus --
5 Bok Intermediate Egret Mesophoyx intermedia
--
6 Bulbuli Red-vented Bulbul Pycnonotus cafer -- 7 Hutum Pecha Rock Eagle Owl Bubo bengalensis -- 8 Chil Pariah Kite Passer domesticus -- 9 Chorai House Sparrow Passer Domesticus --
10 Dahuk White Breasted water henAmaurornis phoenicurus
LC
11 Doyel Magpie Robin Butastur teesa -- 12 Eagal Bazzard -Eagal Butastur teesa LC
13 Fingey Black Drongo Dicrurus macrocercus
LC
14 Gang Shalik Bank Myna Acridotheres ginginianus
--
15 Ghughu Oriental Turtle Dove Streptopelia orientails
--
16 Gung Chil Whiskered Tern Chlidonias hybridus --
17 Hash Duck Anatidae Anseriformes
--
18 Hot-titi River Lapwing Vanellus duvaucelii -- 19 Jalali Kobutor Rock Pigon Columba Livia LC
20 Kak House Crow Corvus splendens -- 21 Kana Bok Indian Pond Heron Ardeola grayii -- 22 Kat Tokra Woodpecker Picoides pubescens --
23 Kokil Asian Koel Eudynamys scolopacea
--
24 Konch Bak. Pond Heron. Ardeola grayii -- 25 Machhranga White Throated Halcyn smyrensis --
Power System Master Plan 2010
18-43
No. Local Name English Name Scientific Name IUCN Global Status
Kingfisher 26 Mohanchura Hoopoe Upupa epops -- 27 Moutusi Purple rumped Sunbird Nectarinia zeylonica --
28 Paira Pigeon Columba livia domestica
--
29 Pankouri Great Cormorant Phalacrocorax carbo
--
30 Pencha Sport-bellied Owl Bubo nipalensis -- 31 Rajhans Bar-headed Goose Anser indicus LC
32 Shalik Indian mynah -- --
33 Shamuk Bhanga, Shamuk Khol.
Open Bill Stork Anastomus oscitans --
34 Shonkho Chil Brammoni Kite Haliastur Indus -- 35 Sipahi Bulbuli Red –whiskered Bulbul Pycnonotus jocosus --
36 Baro Tia Large Indian Parakeet Psittacula eupatria
--
37 Kalim Purple Moorhen Porphyrio porphyrio -- 38 Tuntuni Tailor bird Orthotomus sutorius --
REPTILE
1 Tiktiki HouseLizard Hemidactylus bowringii
--
2 Ajogor Rock Python Pyhon molurus NT
3 Kasim Painted Roofed Turtle Kachuga Kachuga CR
4 Gui Shap Bengal Monitor/ Grey Monitor Lizard
Varanus bengalensis --
5 Sabuj Dhora Green Keel back Snake Macropisthodon plumbicolor
--
6 Kalo Mete Dhora Shap Dark-Bellied Marsh Snake
Xenochrophis cersogaster
--
7 Gokhra Shap Monocellate Cobra Naja kaouthia --
8 Raj Gokhra King Cobra Ophiophagus hannah
--
AMPHIBIAN 1 Beng Frog Anura : Ranidae --
2 Geso Beng Canyon treefrog Hyla arenicolor Cope
--
Source: PSMP Study Team
(b) Aquatic Communities
1) Aquatic Flora The freshwater dependent plants such as helencha (Altermanthere philoxeroides), kalmi (Ipomoea aquatica), daokalmi (Ipomoea fistulosa ), ichadal (Potamo seton) and water hyacinth (Eichhomia crassipes) are common among the ponds, canals and rivers near the Chittagong site. The Khuda pana (Lemna minor), topapana, (Pistia stratiotes) and chaicha (Saipus articulatus) are also common.
2) Aquatic Fauna The fishes found around the site include a total of 56 species of river dwellers and 15 species of sea dwellers. Out of those animals on the Red List of the International Union for Conservation of Nature (IUCN) contain 1 species of NT. APTable 18-41 shows confirmed species of fishes.
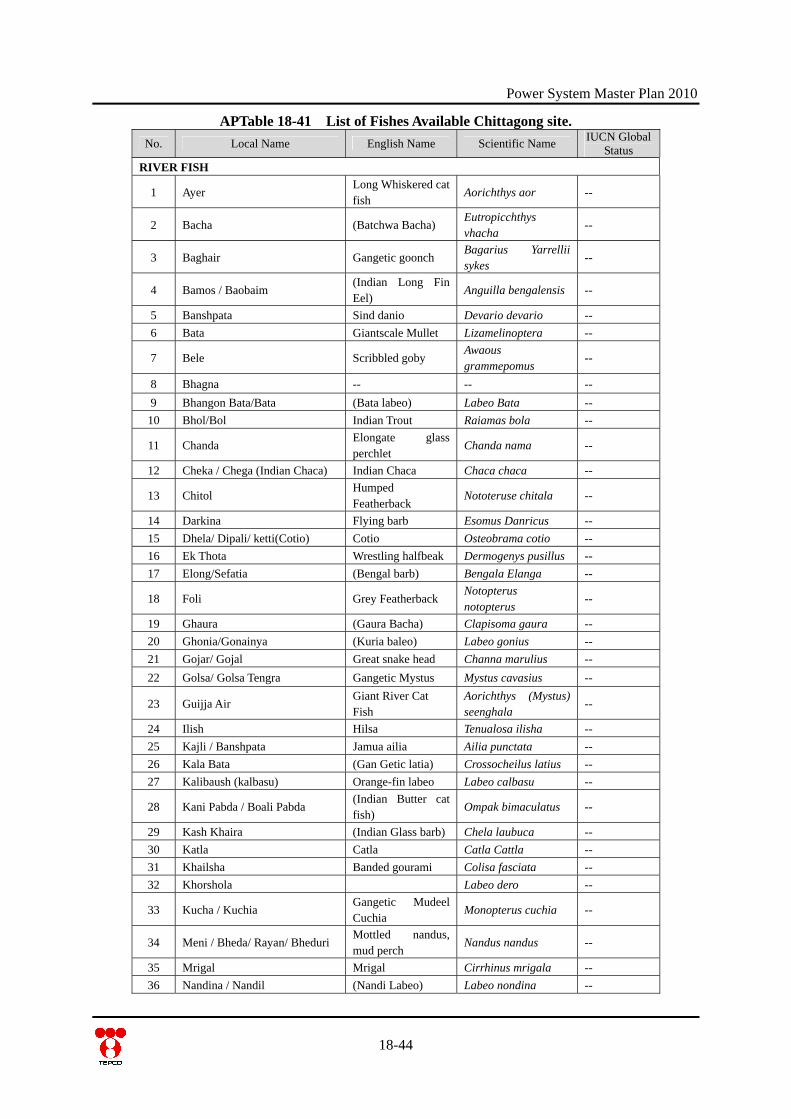
Power System Master Plan 2010
APTable 18-41 List of Fishes Available Chittagong site. No. Local Name English Name Scientific Name IUCN Global
Status RIVER FISH
1 Ayer Long Whiskered cat fish
Aorichthys aor --
2 Bacha (Batchwa Bacha) Eutropicchthys vhacha
--
3 Baghair Gangetic goonch Bagarius Yarrellii sykes
--
4 Bamos / Baobaim (Indian Long Fin Eel)
Anguilla bengalensis --
5 Banshpata Sind danio Devario devario -- 6 Bata Giantscale Mullet Lizamelinoptera --
7 Bele Scribbled goby Awaous grammepomus
--
8 Bhagna -- -- -- 9 Bhangon Bata/Bata (Bata labeo) Labeo Bata -- 10 Bhol/Bol Indian Trout Raiamas bola --
11 Chanda Elongate glass perchlet
Chanda nama --
12 Cheka / Chega (Indian Chaca) Indian Chaca Chaca chaca --
13 Chitol Humped Featherback
Nototeruse chitala --
14 Darkina Flying barb Esomus Danricus -- 15 Dhela/ Dipali/ ketti(Cotio) Cotio Osteobrama cotio -- 16 Ek Thota Wrestling halfbeak Dermogenys pusillus -- 17 Elong/Sefatia (Bengal barb) Bengala Elanga --
18 Foli Grey Featherback Notopterus notopterus
--
19 Ghaura (Gaura Bacha) Clapisoma gaura -- 20 Ghonia/Gonainya (Kuria baleo) Labeo gonius -- 21 Gojar/ Gojal Great snake head Channa marulius -- 22 Golsa/ Golsa Tengra Gangetic Mystus Mystus cavasius --
23 Guijja Air Giant River Cat Fish
Aorichthys (Mystus) seenghala
--
24 Ilish Hilsa Tenualosa ilisha -- 25 Kajli / Banshpata Jamua ailia Ailia punctata -- 26 Kala Bata (Gan Getic latia) Crossocheilus latius -- 27 Kalibaush (kalbasu) Orange-fin labeo Labeo calbasu --
28 Kani Pabda / Boali Pabda (Indian Butter cat fish)
Ompak bimaculatus --
29 Kash Khaira (Indian Glass barb) Chela laubuca -- 30 Katla Catla Catla Cattla -- 31 Khailsha Banded gourami Colisa fasciata -- 32 Khorshola Labeo dero --
33 Kucha / Kuchia Gangetic Mudeel Cuchia
Monopterus cuchia --
34 Meni / Bheda/ Rayan/ Bheduri Mottled nandus, mud perch
Nandus nandus --
35 Mrigal Mrigal Cirrhinus mrigala -- 36 Nandina / Nandil (Nandi Labeo) Labeo nondina --
18-44
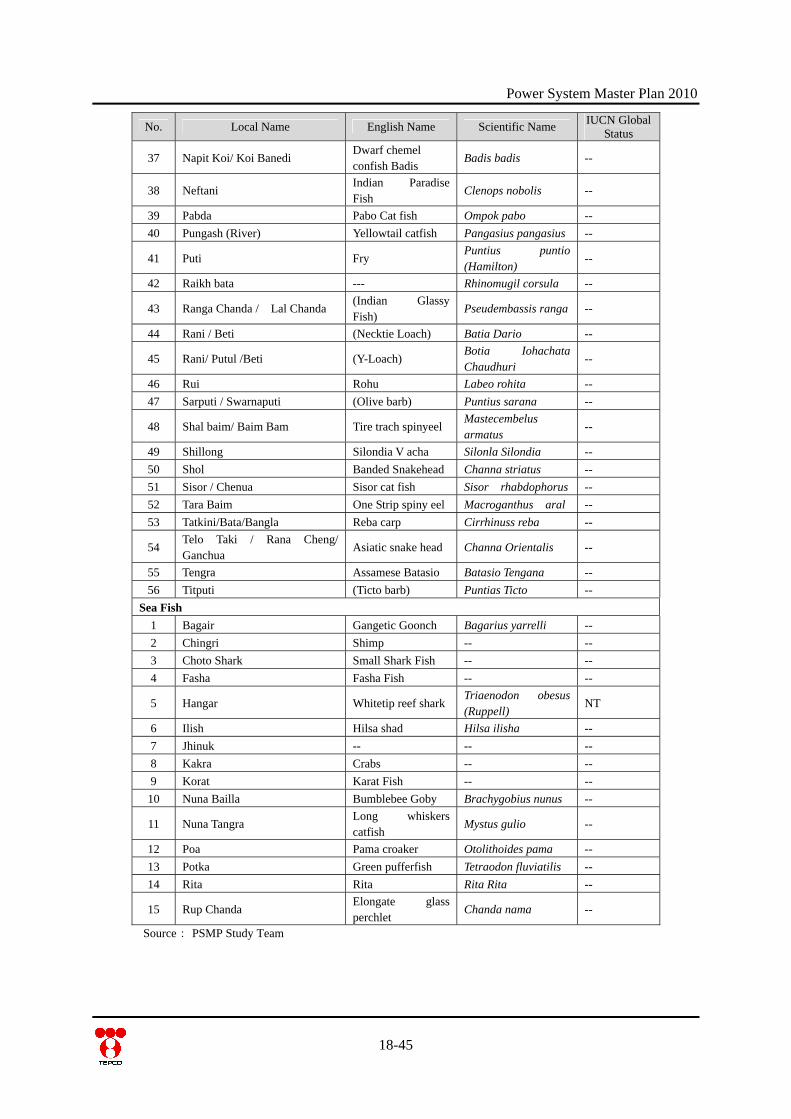
Power System Master Plan 2010
18-45
No. Local Name English Name Scientific Name IUCN Global Status
37 Napit Koi/ Koi Banedi Dwarf chemel confish Badis
Badis badis --
38 Neftani Indian Paradise Fish
Clenops nobolis --
39 Pabda Pabo Cat fish Ompok pabo -- 40 Pungash (River) Yellowtail catfish Pangasius pangasius --
41 Puti Fry Puntius puntio (Hamilton)
--
42 Raikh bata --- Rhinomugil corsula --
43 Ranga Chanda / Lal Chanda (Indian Glassy Fish)
Pseudembassis ranga --
44 Rani / Beti (Necktie Loach) Batia Dario --
45 Rani/ Putul /Beti (Y-Loach) Botia Iohachata Chaudhuri
--
46 Rui Rohu Labeo rohita -- 47 Sarputi / Swarnaputi (Olive barb) Puntius sarana --
48 Shal baim/ Baim Bam Tire trach spinyeel Mastecembelus armatus
--
49 Shillong Silondia V acha Silonla Silondia -- 50 Shol Banded Snakehead Channa striatus -- 51 Sisor / Chenua Sisor cat fish Sisor rhabdophorus -- 52 Tara Baim One Strip spiny eel Macroganthus aral -- 53 Tatkini/Bata/Bangla Reba carp Cirrhinuss reba --
54 Telo Taki / Rana Cheng/ Ganchua
Asiatic snake head Channa Orientalis --
55 Tengra Assamese Batasio Batasio Tengana -- 56 Titputi (Ticto barb) Puntias Ticto --
Sea Fish 1 Bagair Gangetic Goonch Bagarius yarrelli -- 2 Chingri Shimp -- -- 3 Choto Shark Small Shark Fish -- -- 4 Fasha Fasha Fish -- --
5 Hangar Whitetip reef sharkTriaenodon obesus (Ruppell)
NT
6 Ilish Hilsa shad Hilsa ilisha -- 7 Jhinuk -- -- -- 8 Kakra Crabs -- -- 9 Korat Karat Fish -- -- 10 Nuna Bailla Bumblebee Goby Brachygobius nunus --
11 Nuna Tangra Long whiskers catfish
Mystus gulio --
12 Poa Pama croaker Otolithoides pama -- 13 Potka Green pufferfish Tetraodon fluviatilis -- 14 Rita Rita Rita Rita --
15 Rup Chanda Elongate glass perchlet
Chanda nama --
Source: PSMP Study Team

Power System Master Plan 2010
18.3.2 Detailed Information on Meetings with Local Stakeholders
APTable 18-42 Profile of Household Interviewees (near Chittagong Site)
No Sex Ag
e Village Distance
from Power Plant
Education Occupation
Household
Monthly Income
1 F 35 Gobadiya 400m Nil Agriculture 7,500
2 F 30 Dud Kumra 250m Nil Business 4,000
3 M 27 Dud Kumra 300m S.S.C Business 8,000
4 F 35 Gobadiya 500m Nil Riksha Puller 3,000
5 F 30 Gobadiya 500m Nil Riksha Puller 4,000
6 F 20 Dud Kumra 300m Class V Business 4,000
7 M 30 Dud Kumra 300m S.S.C Business 10,000
8 F 27 Dud Kumra 300m Nil Day labor 4,000
9 F 30 Dud Kumra 300m Class V Day labor 5,000
10 M 55 Dud Kumra 200m Class V Agriculture 4,000
11 M 38 Dud Kumra 250m H.S.C Service 70000
12 M Gobadiya 300m Class VIII Service 6,000
13 M Gobadiya 350m Class IV Business 6,000
14 M 23 Gobadiya 400m Class VII Business 6,000
15 M 35 Gobadiya 450m S.S.C Business 6,000 Source: Household interview
APTable 18-43 Profile of FGD Participants (near Chittagong Site) No Age Education Occupation Household
Monthly Income
Male Participants
1 75 Nil Rickshaw Puller 3,000
2 54 VI Job 8,000
3 61 VIII Unemployed 10,000
4 28 Only Signature Business 3,000
5 32 VI Business 6,000
6 37 V Electrician 5,000
7 36 Only Signature Rickshaw Puller 4,000
8 57 VIII Business 8,000
Female Participants
1 26 V Housewife 4,000
2 60 None Housewife 4,000
18-46
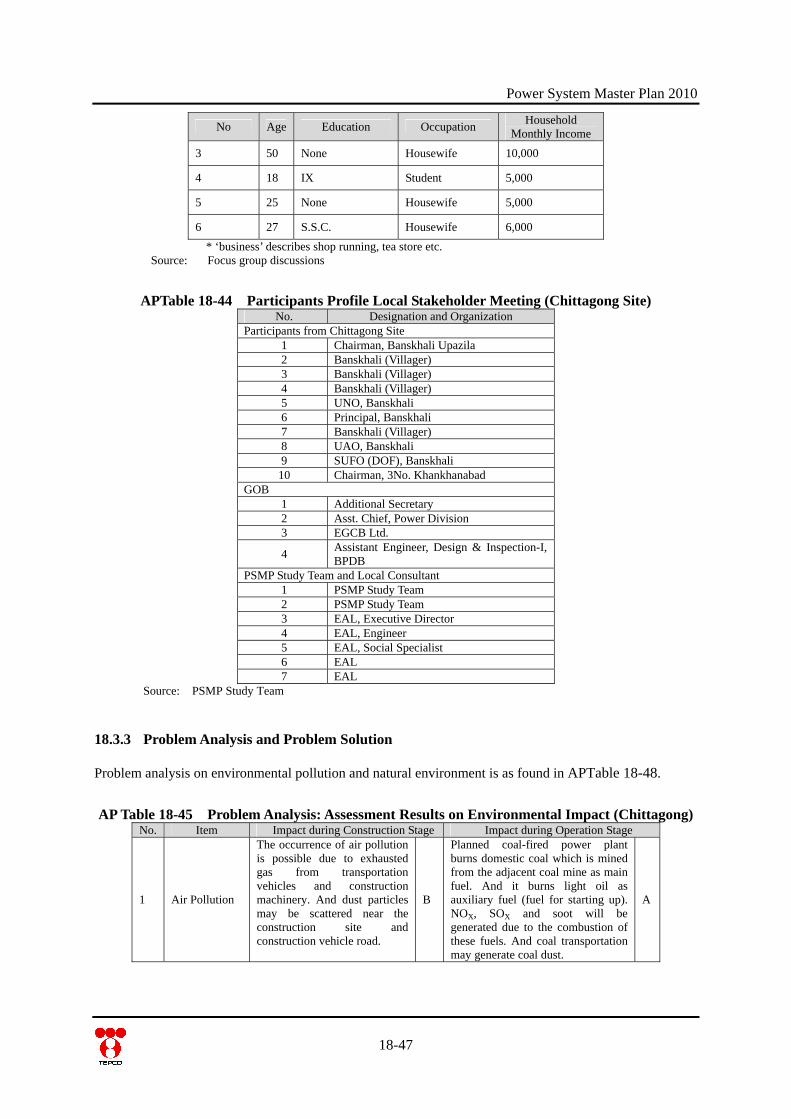
Power System Master Plan 2010
18-47
No Age Education Occupation Household Monthly Income
3 50 None Housewife 10,000
4 18 IX Student 5,000
5 25 None Housewife 5,000
6 27 S.S.C. Housewife 6,000 * ‘business’ describes shop running, tea store etc.
Source: Focus group discussions
APTable 18-44 Participants Profile Local Stakeholder Meeting (Chittagong Site) No. Designation and Organization
Participants from Chittagong Site 1 Chairman, Banskhali Upazila 2 Banskhali (Villager) 3 Banskhali (Villager) 4 Banskhali (Villager) 5 UNO, Banskhali 6 Principal, Banskhali 7 Banskhali (Villager) 8 UAO, Banskhali 9 SUFO (DOF), Banskhali 10 Chairman, 3No. Khankhanabad
GOB 1 Additional Secretary 2 Asst. Chief, Power Division 3 EGCB Ltd.
4 Assistant Engineer, Design & Inspection-I, BPDB
PSMP Study Team and Local Consultant 1 PSMP Study Team 2 PSMP Study Team 3 EAL, Executive Director 4 EAL, Engineer 5 EAL, Social Specialist 6 EAL 7 EAL
Source: PSMP Study Team
18.3.3 Problem Analysis and Problem Solution Problem analysis on environmental pollution and natural environment is as found in APTable 18-48.
AP Table 18-45 Problem Analysis: Assessment Results on Environmental Impact (Chittagong) No. Item Impact during Construction Stage Impact during Operation Stage
1 Air Pollution
The occurrence of air pollution is possible due to exhausted gas from transportation vehicles and construction machinery. And dust particles may be scattered near the construction site and construction vehicle road.
B
Planned coal-fired power plant burns domestic coal which is mined from the adjacent coal mine as main fuel. And it burns light oil as auxiliary fuel (fuel for starting up). NOX, SOX and soot will be generated due to the combustion of these fuels. And coal transportation may generate coal dust.
A
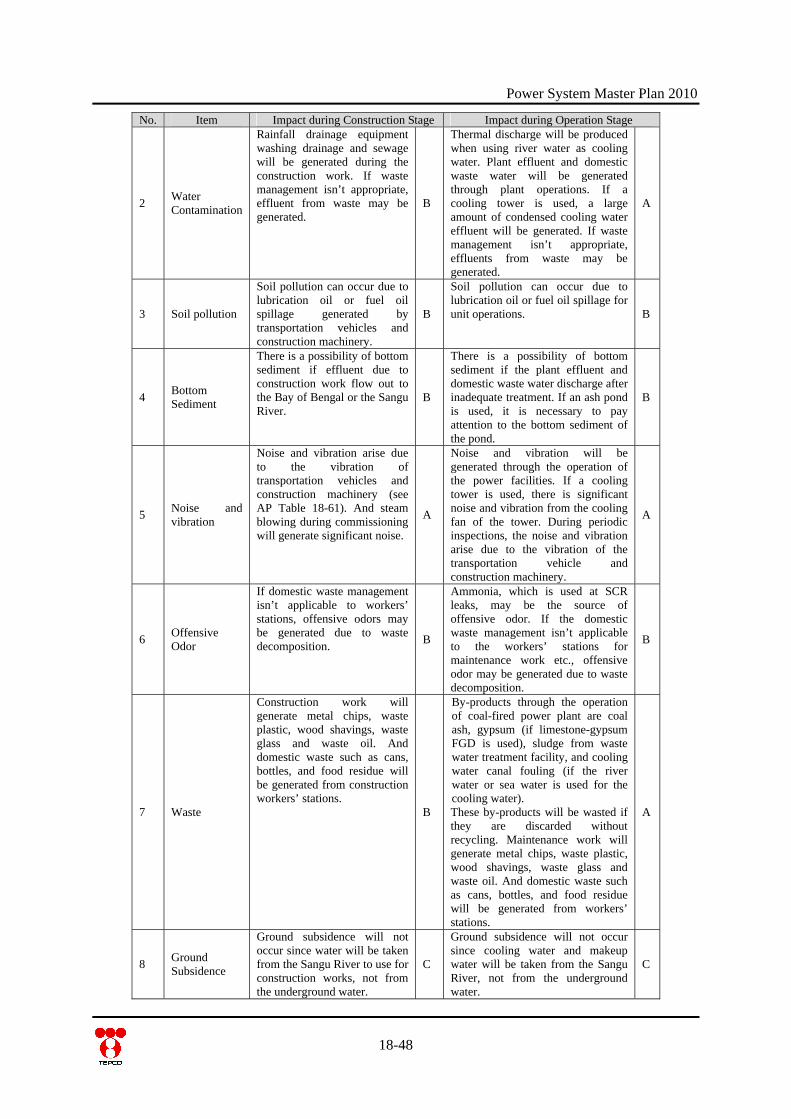
Power System Master Plan 2010
18-48
No. Item Impact during Construction Stage Impact during Operation Stage
2 Water Contamination
Rainfall drainage equipment washing drainage and sewage will be generated during the construction work. If waste management isn’t appropriate, effluent from waste may be generated.
B
Thermal discharge will be produced when using river water as cooling water. Plant effluent and domestic waste water will be generated through plant operations. If a cooling tower is used, a large amount of condensed cooling water effluent will be generated. If waste management isn’t appropriate, effluents from waste may be generated.
A
3 Soil pollution
Soil pollution can occur due to lubrication oil or fuel oil spillage generated by transportation vehicles and construction machinery.
B
Soil pollution can occur due to lubrication oil or fuel oil spillage for unit operations. B
4 Bottom Sediment
There is a possibility of bottom sediment if effluent due to construction work flow out to the Bay of Bengal or the Sangu River.
B
There is a possibility of bottom sediment if the plant effluent and domestic waste water discharge after inadequate treatment. If an ash pond is used, it is necessary to pay attention to the bottom sediment of the pond.
B
5 Noise and vibration
Noise and vibration arise due to the vibration of transportation vehicles and construction machinery (see AP Table 18-61). And steam blowing during commissioning will generate significant noise.
A
Noise and vibration will be generated through the operation of the power facilities. If a cooling tower is used, there is significant noise and vibration from the cooling fan of the tower. During periodic inspections, the noise and vibration arise due to the vibration of the transportation vehicle and construction machinery.
A
6 Offensive Odor
If domestic waste management isn’t applicable to workers’ stations, offensive odors may be generated due to waste decomposition. B
Ammonia, which is used at SCR leaks, may be the source of offensive odor. If the domestic waste management isn’t applicable to the workers’ stations for maintenance work etc., offensive odor may be generated due to waste decomposition.
B
7 Waste
Construction work will generate metal chips, waste plastic, wood shavings, waste glass and waste oil. And domestic waste such as cans, bottles, and food residue will be generated from construction workers’ stations.
B
By-products through the operation of coal-fired power plant are coal ash, gypsum (if limestone-gypsum FGD is used), sludge from waste water treatment facility, and cooling water canal fouling (if the river water or sea water is used for the cooling water). These by-products will be wasted if they are discarded without recycling. Maintenance work will generate metal chips, waste plastic, wood shavings, waste glass and waste oil. And domestic waste such as cans, bottles, and food residue will be generated from workers’ stations.
A
8 Ground Subsidence
Ground subsidence will not occur since water will be taken from the Sangu River to use for construction works, not from the underground water.
C
Ground subsidence will not occur since cooling water and makeup water will be taken from the Sangu River, not from the underground water.
C
Power System Master Plan 2010
18-49
No. Item Impact during Construction Stage Impact during Operation Stage
9 Geographical Feature
There is little impact since the proposed site is plain and doesn’t possess any outstanding geographical features.
C
There is little impact since the proposed site is plain and doesn’t have any outstanding geographical features.
C
10 Biota and Ecosystem
Though the proposed site and its surrounding area have already been converted into the agricultural land, there is a possibility of Painted Roofed Turtle which is categorized CR in IUCN Red List and Fishing Cat which is categorized EN in IUCN Red List existing around the site. Around sea area, Ganges River Dolphin and Blue Whale which are categorized EN in IUCN Red List may Exist.
B
Though the proposed site and its surrounding area have already been converted into the agricultural land, there is a possibility of Painted Roofed Turtle which is categorized CR in IUCN Red List and Fishing Cat which is categorized EN in IUCN Red List existing around the site. Around sea area, Ganges River Dolphin and Blue Whale which are categorized EN in IUCN Red List may exist.
B
11 Water Usage
There is no impact to water usage as the Sangu River water is available as water for construction work.
C
There is no impact to water usage as the Sangu River water is available as cooling water and makeup water of power plant.
C
12 Accident
Construction accidents can occur due to the oversights of health and safety management during construction work. It is necessary to pay attention especially to falling accidents from high altitude locations, road accidents of construction vehicles and electrical accidents.
A
Fires due to oil spillage or instantaneous combustion of coal, accidents due to leakage or spillage of chemicals like caustic soda and sulfuric acid, and accidents or incidents involving maintenance work can occur.
B
13 Global Warming
Transportation vehicles and construction machinery will exhaust CO2.
C
It is estimated that approximately 3.79 million ton of CO2 will be exhausted from per 600MW unit per year through the operations of coal-fired power plant. In light of its cost-effectiveness, brown coal will be imported. Brown coal emits more CO2 than domestic coal which has been classified as bituminous coal.
B
Source: PSMP Study Team Social impact assessment results can be found in AP Table 18-46
AP Table 18-46 Problem Analysis: Assessment Results on Social Impact (Chittagong Site) No Item Impact during Construction Stage Impact during Operation Stage
1 Involuntary Resettlement
Land acquisition is anticipated for 1,000 acres that require approximately 1,000 households to be relocated.
A
Damage to houses and health hazards can be caused by smoke extraction, noise pollution, water pollution and land subsidence when the resettlement action plan is not appropriately planned and implemented. Political intervention and/or local movement against the operation of power stations can occur when adverse impacts on local residents’ lives and livelihoods are severe.
B
Power System Master Plan 2010
18-50
No Item Impact during Construction Stage Impact during Operation Stage
Residents around the site are mainly involved in the secondary and the tertiary industries. There are much more seaport workers than there are agricultural laborers. The temporary loss of agricultural lands can cause loss of employment and livelihoods, particularly among agricultural laborers during the construction
. period
Land acquisition for power station operations and surrounding areas can cause permanent loss of employment and livelihoods, particularly among agricultural laborers. In case water treatment is not properly conducted, adverse impacts may occur to local fishing industry.
2
Local Economy such as Employment and Livelihood etc.
The Bangladesh regulation stipulates that displaced persons are entitled to compensation for loss of land, property and standing crops in monetary terms at the fixed rates. It however does not compensate for the loss of employment or livelihoods.
C The Bangladesh regulation stipulates that displaced persons are entitled to compensation for loss of land, property and standing crops in monetary terms at the fixed rates. It however does not compensate for the loss of employment or livelihoods. The destitute and poor, particularly landless farmers can become further distressed when job opportunities or at the least, skill training opportunities for them are not secured.
C
There are no ethnic people living in the site.
There are no ethnic people living in the site.
3
The Poor, Indigenous and Ethnic People
The destitute, poor and landless farmers can lose their jobs when agricultural land is lost due to the construction of power station.
C
The destitute, poor and landless farmers can become further distressed when job opportunities or at the least skill training opportunities for them are not secured.
C
Disparity between land owners and the rest (landless farmers, wage laborers etc.) may widen.
Landless farmers and wage laborers can become further distressed and the disparity between land owners and them can be widened when job opportunities and skill training opportunities are not provided.
4 Misdistribution of Benefit and Loss
In case an ample number of job opportunities and skill training opportunities are not provided to meet the demand, the disparity between those with such opportunities and those without can be widened.
C Local livelihoods can be affected and health hazards can be caused by land subsidence, smoke extraction, noise pollution, water pollution and water shortages when the environmental management plan is not appropriately planned and implemented.
C
Local conflict can occur between the relocated people and the host community.
5 Local Conflict of Interests
Excessive interventions by various stakeholders can trigger local conflict among residents, and the disruption of the local community.
C
Local conflict can become constant between the relocated people and the host community.
C
Appropriate information and knowledge may not be properly communicated to the illiterate, particularly women. 6 Gender
Gender gaps can occur in terms of job opportunities.
C
Appropriate information and knowledge may not be properly communicated to the illiterate, particularly women. C
Power System Master Plan 2010
18-51
No Item Impact during Construction Stage Impact during Operation Stage
Child labor may occur due to their parents’ loss of job.
Child labor may occur due to their parents’ loss of job.
Children may lose education opportunities.
Children may lose education opportunities.
Playgrounds for children may be lost.
Playgrounds for children may be lost. 7 Children’s Rights
Children may catch infectious diseases triggered by outsiders’ entry into the community.
C
Children may catch infectious diseases triggered by outsiders’ entry into the community.
C
The present potential site that has been selected is away from the city center, residential area, local market, and the protected forest.
The present potential site that has been selected is away from the city center, residential area, local market, and the protected forest. 8
Land Use and Utilization of Local Resources Temporary loss of present land
use patterns and/or economic infrastructure may occur.
C
Permanent loss of present land use patterns and/or economic infrastructure may occur.
C
9
Social Institutions such as Social Infrastructure and Local Decision Making Institutions
Disruption of local community may be caused by a conflict of interests among politicians, government offices, and residents. It might cause a delay in procedures of land acquisition and resettlement.
C
-
C
10 Existing Social Infrastructure
Temporary loss of existing social infrastructure may occur due to the construction works.
CTraffic to/from power station may become heavier. Social services may become insufficient.
C
There is no cultural heritage existing on the site. Careful consideration however should be given to Mazan of Peer Mohsin Aulia located near the site.
Careful consideration however should be given to Mazan of Peer Mohsin Aulia located near the site.
11 Cultural Heritage
Landscapes may be lost.
C
-
C
12 Infectious Diseases such as HIV/AIDS
Infectious diseases may spread via the construction workers into the community.
CInfectious diseases may spread via the operation workers into the community.
C
Source: PSMP Study Team Mitigation measures are examined for environmental pollution and natural environmental impacts are as found in APTable 18-47 .

Power System Master Plan 2010
APTable 18-47 Mitigation Measures for Environmental Impact (Chittagong) No. Item Mitigation measures during
Construction Stage Mitigation measures during Operation
Stage
1 Air pollution
Countermeasures for air pollution due to exhaust gas from transportation vehicles and construction machinery and dust scattering due to construction traffic are studied as in AP Table 18-67 and AP Table 18-68. As for the reduction of exhaust gas from transportation vehicles and construction machinery, idling stops and keeping proper exhaust condition by routine inspection of vehicles are judged to be applied. As for countermeasures for dust scattering, load cover, periodical vehicle washing, and periodic peripheral road cleaning are judged to be applied.
AP Table 18-62 shows countermeasures for NOX, AP Table 18-63 shows countermeasures for SOX, AP Table 18-64 shows countermeasures for Soot, and AP Table 18-66 shows countermeasures for coal dust. Besides conducting flue gas treatment by system including FGD, SCR and ESP etc., mitigation of coal dust scattering should be paid attention to.
2 Water contamination
Countermeasures for water contamination due to excavation waste soil outflow are suitable via a fence installation utilizing sandbags etc. As for the effluent due to equipment washing, it is suitable to install a temporary precipitation tank and to drain the supernatant water. As for sewage, it is suitable to put up a septic tank. In addition, as for waste, water contamination can be prevented if waste treatment is conducted promptly and the waste is not left for long time.
There is no warm effluent water generation since cooling tower or air cooled condenser will be adopted as a cooling system from consideration to impact of warm effluent water and local fishery. Plant effluent and sewage according to plant operations are discharged after waste water treatment including coagulating sedimentation, neutralization, and oil separation. Appropriate waste water facility capacity design is needed especially because condensed cooling water blow effluent is a large amount.
3 Soil pollution
AP Table 18-69 shows the study result of countermeasures for soil pollution by oil spillage from transportation vehicles and construction machinery. As a result, periodic maintenance implementation and conducting pre-operational machinery checks of machinery is judged important to be applied.
Oil and grease treatment procedures make it clear to prevent the spillage of lubrication oil or fuel oil. The management organization should be established to implement works according to designated procedures. And action procedures should be prepared in order not to spread the adverse impact in case of an oil spillage occurrence. An oil dike should be set around the oil storage tank.
4 Bottom sediment
Implement measures described in 2)Water contamination.
It is necessary to dump ash properties in dumping site with water proof seat to prevent bottom sediment leakage out of the ash pond.
18-52
Power System Master Plan 2010
18-53
No. Item Mitigation measures during Construction Stage
Mitigation measures during Operation Stage
5 Noise and vibration
AP Table 18-70 shows the study result of countermeasures for noise and vibration due to vibrations from transportation vehicles and construction machinery. As a result, leveling the construction process, using low-noise machinery, and lowering vehicle speed in residential areas are judged to be proper countermeasures. As for countermeasures for noise due to steam blowing during commissioning, the establishment of a work schedule without the blowing of steam during the nighttime is judged to be applied.
Developing the green belt along the site border is a costless and effective way to mitigate noise and vibrational impact. If the boundary noise simulated in the detail EIA exceeds the noise regulations which is decided on each category (AP table 18-8), the introduction of a green belt, sound insulating material and a sound insulating wall will be examined. Chittagong site is categorized in Mixed Zone1
6 Offensive Odor
Offensive odor caused by domestic waste decomposition from workers camps can be prevented by separate collection and periodic disposal of waste.
NOx mitigation without SCR which uses ammonia is an effective measure against offensive odor. In the case of use ammonia, storage tanks, pipes, and valves must surely be inspected periodically. In addition to preventing operational mishaps, operations of the ammonia facility are to be strictly managed by the person in charge. With regards to garbage treatment, it is suitable to dump periodically and not keep in storage for a long time.
7 Waste
Reduction of waste amount can be conducted by establishing a waste management program including reduction, reuse, and recycling (3R). Implementation of a thorough separate collection of the waste is needed, especially for paint sludge and batteries. These items should be collected separately and disposed in designated areas.
Reduction of waste amount can be conducted by establishing a waste management program including reduction, reuse, and recycling (3R). Because by-products through plant operations are large amount, they should be recycled as much as possible. APTable 18-71 shows examples of by-products recycling
8 Biota and Ecosystem
Nest building of Painted Roofed Turtle, Fishing Cat, Ganges River Dolphin, and Blue Whale should be examined in detail EIA. The nest relocation should be conducted if there are any. Existence of each endangered species should be carefully paid attention to during construction stage, and necessary protection action should be conducted if there are any.
Nest building of Painted Roofed Turtle, Fishing Cat, Ganges River Dolphin, and Blue Whale is examined in detail EIA. The nest relocation should be conducted if there are any. Existence of each endangered species should be carefully paid attention to during operation stage and necessary protection action should be conducted if there are any
9 Accident
A suitable OHS organization (policy, manual, announcement of policy, safety training and safety patrol) should be established to prevent accidents. It is also important to conduct quality control in construction work to prevent accidents during commissioning and operation period.
A suitable OHS organization (policy, manual, announcement of the policy and manuals, safety training, safety patrols) should be established for accident prevention. It is also important to conduct quality control in maintenance work to prevent accident.
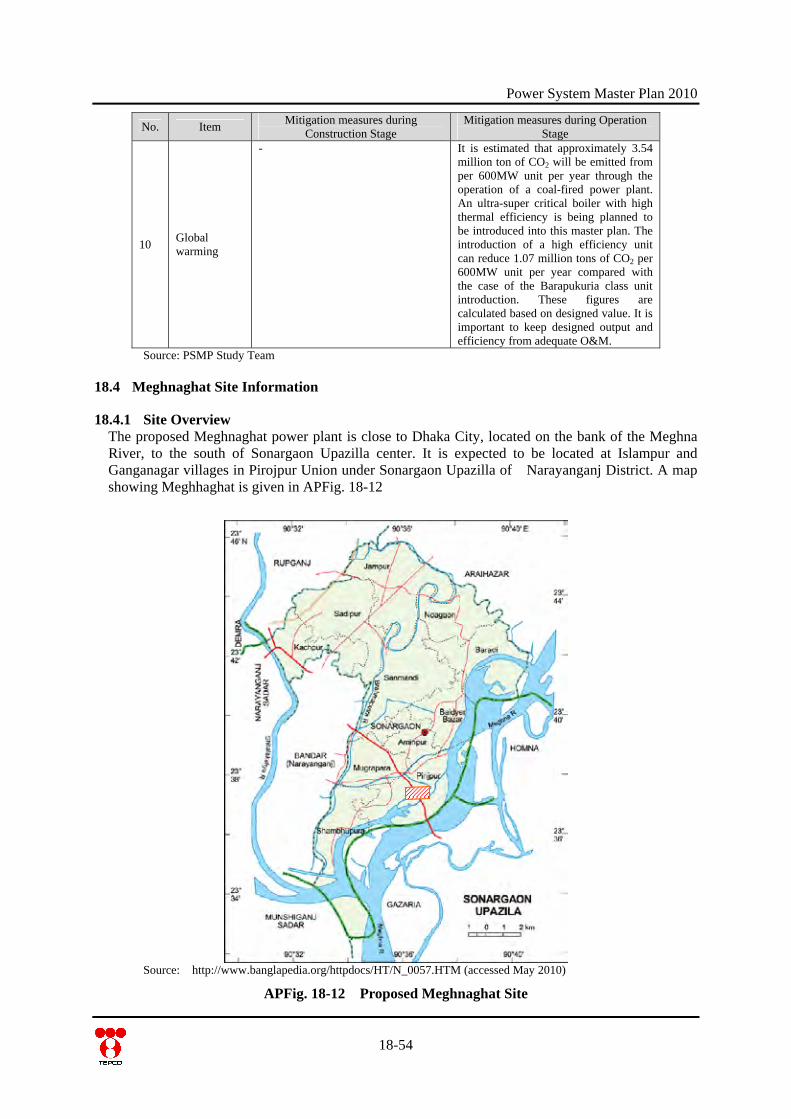
Power System Master Plan 2010
18-54
No. Item Mitigation measures during Construction Stage
Mitigation measures during Operation Stage
10 Global warming
- It is estimated that approximately 3.54 million ton of CO2 will be emitted from per 600MW unit per year through the operation of a coal-fired power plant. An ultra-super critical boiler with high thermal efficiency is being planned to be introduced into this master plan. The introduction of a high efficiency unit can reduce 1.07 million tons of CO2 per 600MW unit per year compared with the case of the Barapukuria class unit introduction. These figures are calculated based on designed value. It is important to keep designed output and efficiency from adequate O&M.
Source: PSMP Study Team
18.4 Meghnaghat Site Information
18.4.1 Site Overview The proposed Meghnaghat power plant is close to Dhaka City, located on the bank of the Meghna River, to the south of Sonargaon Upazilla center. It is expected to be located at Islampur and Ganganagar villages in Pirojpur Union under Sonargaon Upazilla of Narayanganj District. A map showing Meghhaghat is given in APFig. 18-12
Source: http://www.banglapedia.org/httpdocs/HT/N_0057.HTM (accessed May 2010)
APFig. 18-12 Proposed Meghnaghat Site

Power System Master Plan 2010
(1) Health and Sanitation Environment Local people suffer from diseases like colds, asthma, headaches, fevers, etc. They consult with local pharmacists, medical doctors or go to public hospital. For more serious problems, they go to Dhaka or visit the Sheba Clinic as there’s no hospital in town. They used to drink arsenic free water from the tube-well which is also used for cooking and use the river water for bathing and washing clothes. The present layer of water is 100 feet below, although it was around a depth of 60 feet in the past. All respondents have hygienic slab latrines in their houses.
(2) Housing Condition and Surrounding Area The floors of houses are made out of brick and clay. The walls of houses are brick-made and the ceilings are tin-made. Electricity is distributed for 24 hours a day except during irrigation periods and they are very conscious about the proper consumption of electricity.
(3) Income, Expenditure and Job Opportunities They do business, are self-employed, and work in other professions. Some of them are associated with samity (Association) and have taken out loans from samity to start their own businesses.
(4) Climate condition The Dhaka station is the nearest station of the Bangladesh Meteorological Department (BMD) from Meghnaghat. APTable 18-48, APTable 18-49, APTable 18-50, APTable 18-51, APTable 18-52 and APTable 18-53 show the monthly maximum and minimum air temperature, monthly precipitation, monthly maximum and minimum relative humidity, and monthly average wind speed and prevailing wind direction at the Dhaka station from 2000 to 2009. Colored cell in each table indicates maximum and minimum value. As for the air temperature, it is as hot as the maximum air temperature is over 27°C throughout the year. The minimum air temperature is under 10°C from November to March, so the difference between maximum and minimum temperature is large. The monthly maximum temperature is 39.6°C as of April 2009 and the monthly minimum temperature is 8.1 °C in January 2003. The annual precipitation reaches a level of 1,700mm to 2,900mm. The precipitation is at its most concentrated between May and September. Conversely, there is no rainfall during some of the months from November to March. As described above, there is a marked difference in the rainfall between the rainy season and the dry season. As for the humidity, it is relatively high; the monthly minimum relative humidity exceeds 50% during the period between May and September. As for the wind speed and wind direction, there are large influences from the monsoon. It is clear that the wind blows from the north or northeast between November and February, and the wind blows from the south to the southeast between March and September. The average wind speed is not that high, below 3m/s throughout a year.
18-55
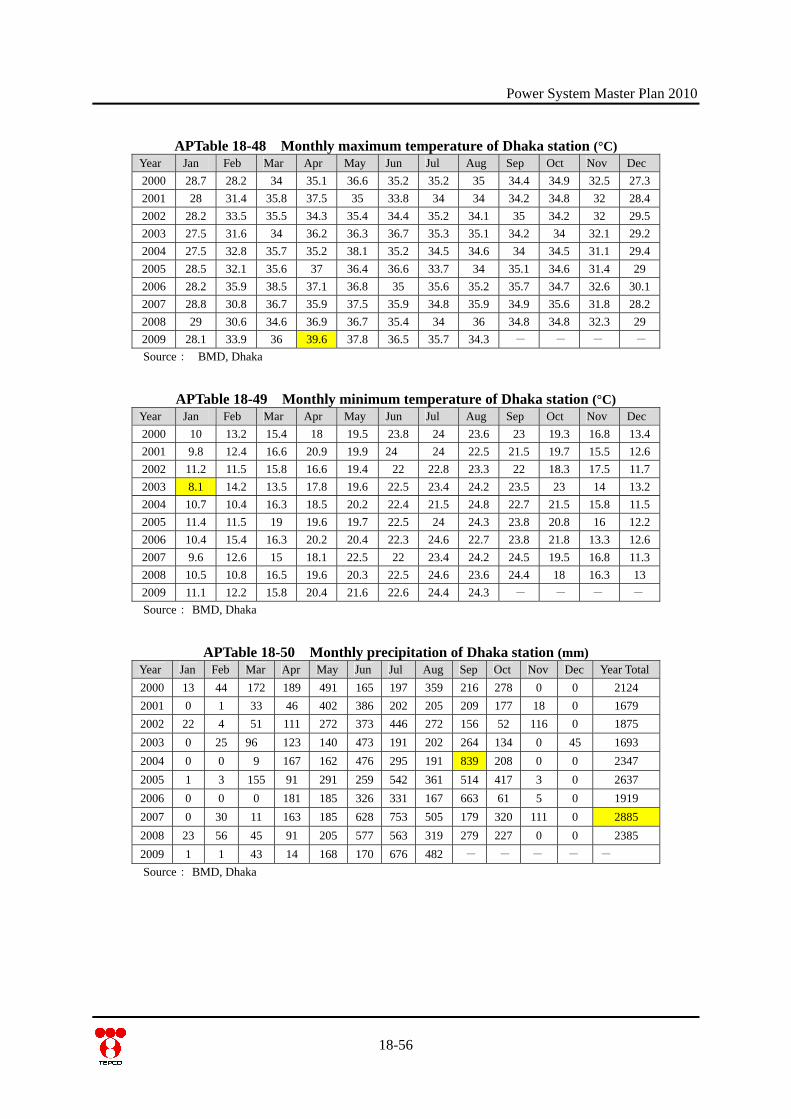
Power System Master Plan 2010
APTable 18-48 Monthly maximum temperature of Dhaka station (°C) Year Jan Feb Mar Apr May Jun Jul Aug Sep Oct Nov Dec 2000 28.7 28.2 34 35.1 36.6 35.2 35.2 35 34.4 34.9 32.5 27.3 2001 28 31.4 35.8 37.5 35 33.8 34 34 34.2 34.8 32 28.4 2002 28.2 33.5 35.5 34.3 35.4 34.4 35.2 34.1 35 34.2 32 29.5 2003 27.5 31.6 34 36.2 36.3 36.7 35.3 35.1 34.2 34 32.1 29.2 2004 27.5 32.8 35.7 35.2 38.1 35.2 34.5 34.6 34 34.5 31.1 29.4 2005 28.5 32.1 35.6 37 36.4 36.6 33.7 34 35.1 34.6 31.4 29 2006 28.2 35.9 38.5 37.1 36.8 35 35.6 35.2 35.7 34.7 32.6 30.1 2007 28.8 30.8 36.7 35.9 37.5 35.9 34.8 35.9 34.9 35.6 31.8 28.2 2008 29 30.6 34.6 36.9 36.7 35.4 34 36 34.8 34.8 32.3 29 2009 28.1 33.9 36 39.6 37.8 36.5 35.7 34.3 - - - - Source: BMD, Dhaka
APTable 18-49 Monthly minimum temperature of Dhaka station (°C)
Year Jan Feb Mar Apr May Jun Jul Aug Sep Oct Nov Dec 2000 10 13.2 15.4 18 19.5 23.8 24 23.6 23 19.3 16.8 13.4 2001 9.8 12.4 16.6 20.9 19.9 24 24 22.5 21.5 19.7 15.5 12.6 2002 11.2 11.5 15.8 16.6 19.4 22 22.8 23.3 22 18.3 17.5 11.7 2003 8.1 14.2 13.5 17.8 19.6 22.5 23.4 24.2 23.5 23 14 13.2 2004 10.7 10.4 16.3 18.5 20.2 22.4 21.5 24.8 22.7 21.5 15.8 11.5 2005 11.4 11.5 19 19.6 19.7 22.5 24 24.3 23.8 20.8 16 12.2 2006 10.4 15.4 16.3 20.2 20.4 22.3 24.6 22.7 23.8 21.8 13.3 12.6 2007 9.6 12.6 15 18.1 22.5 22 23.4 24.2 24.5 19.5 16.8 11.3 2008 10.5 10.8 16.5 19.6 20.3 22.5 24.6 23.6 24.4 18 16.3 13 2009 11.1 12.2 15.8 20.4 21.6 22.6 24.4 24.3 - - - - Source: BMD, Dhaka
APTable 18-50 Monthly precipitation of Dhaka station (mm)
Year Jan Feb Mar Apr May Jun Jul Aug Sep Oct Nov Dec Year Total 2000 13 44 172 189 491 165 197 359 216 278 0 0 2124 2001 0 1 33 46 402 386 202 205 209 177 18 0 1679 2002 22 4 51 111 272 373 446 272 156 52 116 0 1875 2003 0 25 96 123 140 473 191 202 264 134 0 45 1693 2004 0 0 9 167 162 476 295 191 839 208 0 0 2347 2005 1 3 155 91 291 259 542 361 514 417 3 0 2637 2006 0 0 0 181 185 326 331 167 663 61 5 0 1919 2007 0 30 11 163 185 628 753 505 179 320 111 0 2885 2008 23 56 45 91 205 577 563 319 279 227 0 0 2385 2009 1 1 43 14 168 170 676 482 - - - - - Source: BMD, Dhaka
18-56
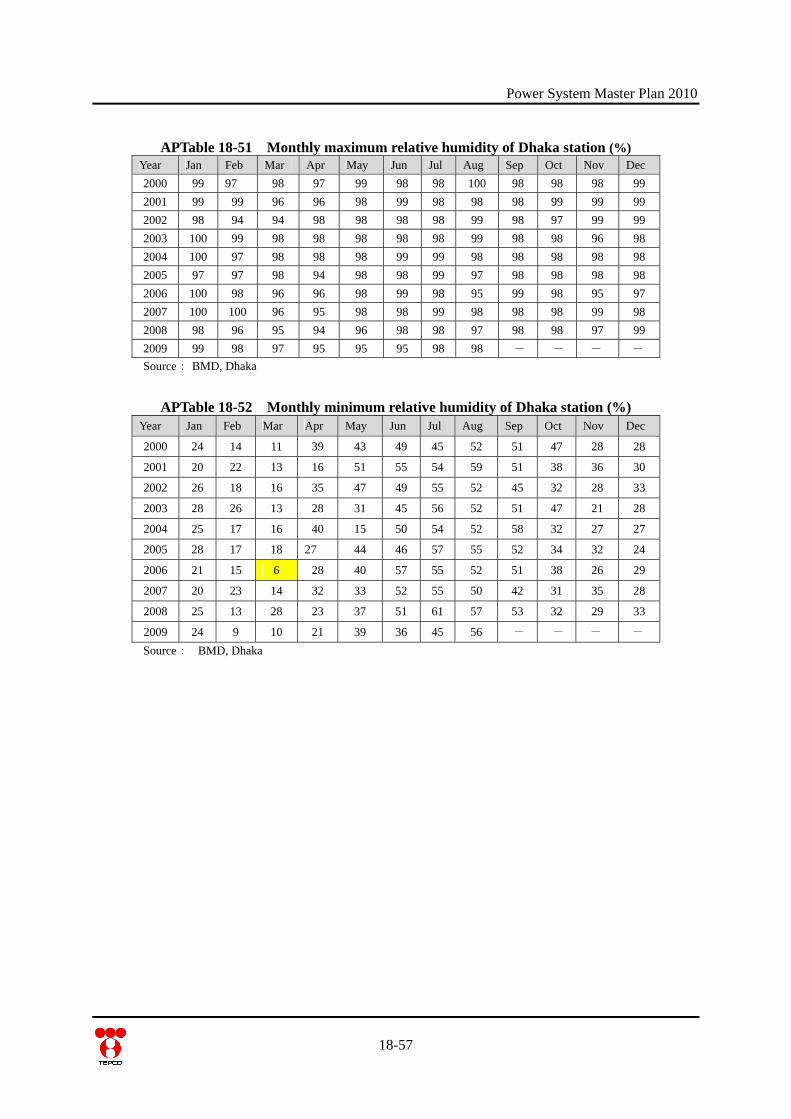
Power System Master Plan 2010
APTable 18-51 Monthly maximum relative humidity of Dhaka station (%)
Year Jan Feb Mar Apr May Jun Jul Aug Sep Oct Nov Dec 2000 99 97 98 97 99 98 98 100 98 98 98 99 2001 99 99 96 96 98 99 98 98 98 99 99 99 2002 98 94 94 98 98 98 98 99 98 97 99 99 2003 100 99 98 98 98 98 98 99 98 98 96 98 2004 100 97 98 98 98 99 99 98 98 98 98 98 2005 97 97 98 94 98 98 99 97 98 98 98 98 2006 100 98 96 96 98 99 98 95 99 98 95 97 2007 100 100 96 95 98 98 99 98 98 98 99 98 2008 98 96 95 94 96 98 98 97 98 98 97 99 2009 99 98 97 95 95 95 98 98 - - - - Source: BMD, Dhaka
APTable 18-52 Monthly minimum relative humidity of Dhaka station (%) Year Jan Feb Mar Apr May Jun Jul Aug Sep Oct Nov Dec
2000 24 14 11 39 43 49 45 52 51 47 28 28
2001 20 22 13 16 51 55 54 59 51 38 36 30
2002 26 18 16 35 47 49 55 52 45 32 28 33
2003 28 26 13 28 31 45 56 52 51 47 21 28
2004 25 17 16 40 15 50 54 52 58 32 27 27
2005 28 17 18 27 44 46 57 55 52 34 32 24
2006 21 15 6 28 40 57 55 52 51 38 26 29
2007 20 23 14 32 33 52 55 50 42 31 35 28
2008 25 13 28 23 37 51 61 57 53 32 29 33
2009 24 9 10 21 39 36 45 56 - - - - Source: BMD, Dhaka
18-57
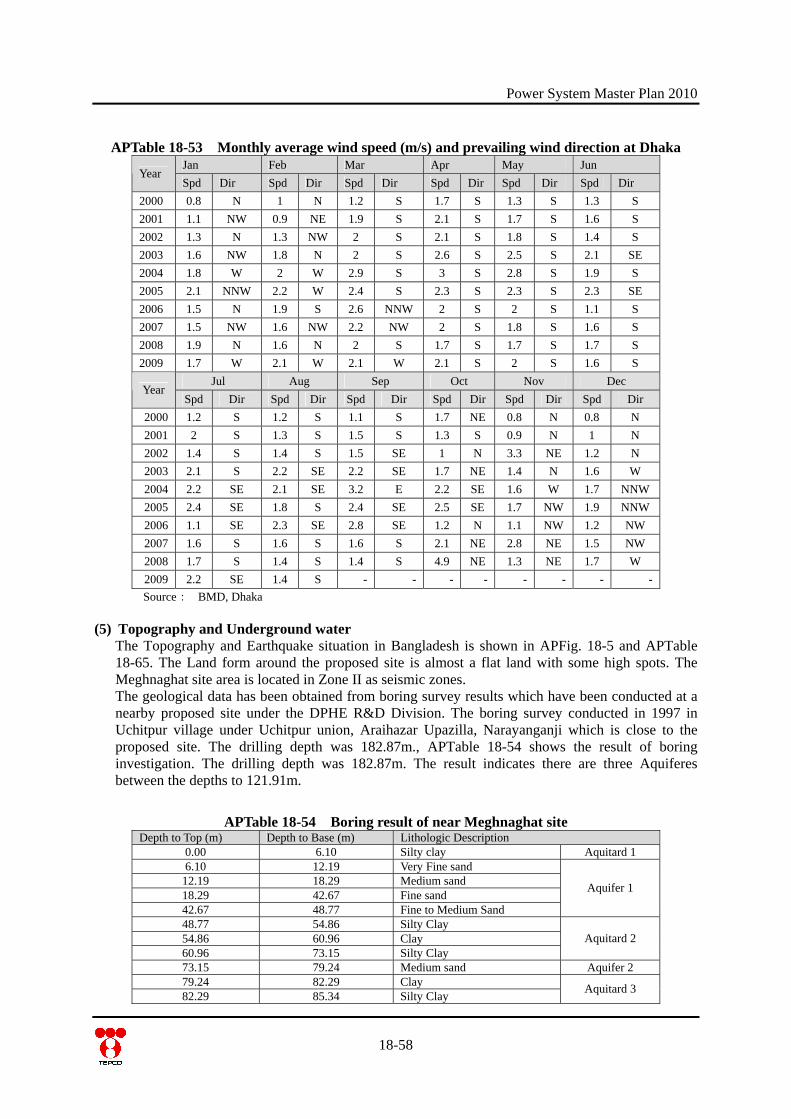
Power System Master Plan 2010
APTable 18-53 Monthly average wind speed (m/s) and prevailing wind direction at Dhaka
Jan Feb Mar Apr May Jun Year
Spd Dir Spd Dir Spd Dir Spd Dir Spd Dir Spd Dir 2000 0.8 N 1 N 1.2 S 1.7 S 1.3 S 1.3 S 2001 1.1 NW 0.9 NE 1.9 S 2.1 S 1.7 S 1.6 S 2002 1.3 N 1.3 NW 2 S 2.1 S 1.8 S 1.4 S 2003 1.6 NW 1.8 N 2 S 2.6 S 2.5 S 2.1 SE 2004 1.8 W 2 W 2.9 S 3 S 2.8 S 1.9 S 2005 2.1 NNW 2.2 W 2.4 S 2.3 S 2.3 S 2.3 SE 2006 1.5 N 1.9 S 2.6 NNW 2 S 2 S 1.1 S 2007 1.5 NW 1.6 NW 2.2 NW 2 S 1.8 S 1.6 S 2008 1.9 N 1.6 N 2 S 1.7 S 1.7 S 1.7 S 2009 1.7 W 2.1 W 2.1 W 2.1 S 2 S 1.6 S
Jul Aug Sep Oct Nov Dec Year
Spd Dir Spd Dir Spd Dir Spd Dir Spd Dir Spd Dir 2000 1.2 S 1.2 S 1.1 S 1.7 NE 0.8 N 0.8 N 2001 2 S 1.3 S 1.5 S 1.3 S 0.9 N 1 N 2002 1.4 S 1.4 S 1.5 SE 1 N 3.3 NE 1.2 N 2003 2.1 S 2.2 SE 2.2 SE 1.7 NE 1.4 N 1.6 W 2004 2.2 SE 2.1 SE 3.2 E 2.2 SE 1.6 W 1.7 NNW 2005 2.4 SE 1.8 S 2.4 SE 2.5 SE 1.7 NW 1.9 NNW 2006 1.1 SE 2.3 SE 2.8 SE 1.2 N 1.1 NW 1.2 NW 2007 1.6 S 1.6 S 1.6 S 2.1 NE 2.8 NE 1.5 NW 2008 1.7 S 1.4 S 1.4 S 4.9 NE 1.3 NE 1.7 W 2009 2.2 SE 1.4 S - - - - - - - - Source: BMD, Dhaka
(5) Topography and Underground water The Topography and Earthquake situation in Bangladesh is shown in APFig. 18-5 and APTable 18-65. The Land form around the proposed site is almost a flat land with some high spots. The Meghnaghat site area is located in Zone II as seismic zones. The geological data has been obtained from boring survey results which have been conducted at a nearby proposed site under the DPHE R&D Division. The boring survey conducted in 1997 in Uchitpur village under Uchitpur union, Araihazar Upazilla, Narayanganji which is close to the proposed site. The drilling depth was 182.87m., APTable 18-54 shows the result of boring investigation. The drilling depth was 182.87m. The result indicates there are three Aquiferes between the depths to 121.91m.
APTable 18-54 Boring result of near Meghnaghat site Depth to Top (m) Depth to Base (m) Lithologic Description
0.00 6.10 Silty clay Aquitard 1 6.10 12.19 Very Fine sand
12.19 18.29 Medium sand 18.29 42.67 Fine sand 42.67 48.77 Fine to Medium Sand
Aquifer 1
48.77 54.86 Silty Clay 54.86 60.96 Clay 60.96 73.15 Silty Clay
Aquitard 2
73.15 79.24 Medium sand Aquifer 2 79.24 82.29 Clay 82.29 85.34 Silty Clay Aquitard 3
18-58
Power System Master Plan 2010
18-59
Depth to Top (m) Depth to Base (m) Lithologic Description 85.34 97.53 Fine to medium sand 97.53 106.67 Fine Sand 106.67 121.91 Fine to medium sand
Aquifer 3
121.91 128.01 Silty Clay 128.01 137.15 Very Fine sand 137.15 167.63 Silty Clay 167.63 182.87 Clay
Aquitard 4
Source: DPHE
(6) Surface water APTable 18-55 shows the water quality of the Meghna River which is measured in the Meghnaghat combined cycle power plant EIA in 1999. Chromium (total), COD, BOD5 20OC do not satisfy the standard of drinking water of Bangladesh.
APTable 18-55 Water quality of Meghna River upstream of Meghnaghat site (1999) No. Parameter Unit Concentration Bangladesh Standard
for drinking water 1 Arsenic mg/l <0.001 0.05 2 BOD5 20OC mg/l 7.2 0.2 3 Chromium (total) mg/l 0.071 0.05 4 Chlorine (residual) mg/l - 0.2 5 COD mg/l 15.2 4 6 Copper mg/l 0.224 1 7 DO mg/l 3.31 6 8 Hardness (as CaCO3) mg/l 40.0 200-500 9 Lead mg/l 0.19 0.05
10 Mercury mg/l - 0.001 11 Nickel mg/l 0.025 0.1 12 Oil & Grease mg/l - 0.01 13 pH 7.2 6.5-8.5 14 Suspended particulate matters mg/l 2.0 10 15 Total dissolived solids mg/l 79.0 1000 16 Turbidity NTU 18.4 10(JTU) 17 Zinc mg/l 0.479 5
Source: Meghnaghat Power Project Final Environmental Impact Assessment, AES Meghnaghat Limited
(7) Ecological situation Data of the ecological situation has been obtained from the Department of Botany and Zoology of Dhaka University, Respective Upazila offices and local consultants. According to the EIA examination of the Meghnaghat gas combined power station in 2000, there is the possibility of existence of 6 species of NT, 2 species of VU, 2 species of EN, and 1 species of CR. However, the report states that the power station has no impact on these species and their respective habitats.
(a) Terrestrial Communities
1) Flora There seems to be 53 species of land plants around the proposed site. Out of them, there is 1 species of LC on the IUCN Red List. A list of plants near the proposed site is provided in APTable 18-56.
Power System Master Plan 2010
APTable 18-56 List of plants near Meghnaghat site
No. Local Name English Name Scientific Name IUCN Global Status
1 Am Mango Mangifera indica L. (Anacard) -- 2 Arjun -- Terminalia arjuna --
3 Bansh pata -- Podocarpus nerifolia --
4 Bash Bamboo Podocarpus nebifolia LC
5 Bel Indian apple Aegle marmelos (L). -- 6 Beli -- Jasmin sambac Ait (Olea) --
7 Bokul (Mimusops Elengi) Mimusops elengi L --
8 Boroi Indian Jujube Zizyphus rugosa Lam -- 9 Bot Banayan tree Ficus benghalensis L. (Mora) --
10 Debdaru Pine Polyalthia longifolia --
11 Dhol Kalmi -- Ipomoea fistolosa -- 12 Dhutra -- Barringtonia acatangula --
13 Golap Rose Rosa centifolia L. (Rosaceae) -- 14 Halencha -- (Altermanthere philoxeroides) --
15 Hyacinth -- (Eichhomia crassipes) --
16 Jaba -- Hibiscus rosa sinensis L. (Malvaceae)
--
17 Jam Black berry Syzygium cumini skiel. (Myrtaceae) --
18 Jambura Citron Citrus grandis --
19 Jamrul Star apple Syzygium samraogense (Bl.) --
20 Jhau Poplar Thysanolaena maxima --
21 Kachu Date Plam Colocasia esculenta (L.) --
22 Kadbel Wood apple Feronia limonia (L.) --
23 Kalmi -- (lpomoea aquatica) --
24 Kamranga Carambola Averrhoa carambola --
25 Kathal Jack fruit Artocarpus heterphyllus Lamk --
26 Khejur Date palm Phoenix sylvestris --
27 Kola Banana Musa Sapientum --
28 Krishnachura Delonix regia Delonix regia (Boj.) Raf. (Leguminosae)
--
29 Lazzaboti -- M. pudica L --
30 Lebo Lemon Citrus aurantifolia --
31 Madar -- Erythriana variegata L. var. orientalis Merr.
--
32 Man Kochu -- Alocasia indica --
33 Mehedi -- Lawsonia inermis --
34 Mehogoni -- Swietenia mahagoni --
35 Narikel Coconut Cocos nucifers L. (Palmae) --
36 Nim -- Azadirachta indica --
37 Pakur -- Ficus Infectoria --
38 Patabahar Patabahar Acalypha welkesiana (Euphorbiaceae)
--
39 Pepe Papaya Carica papaya L (caricaceae) --
40 Peyara Guava Psidium Guajava (L) Bat. (Myrtaceae)
--
41 Pui Shak -- Basella alba L. --
42 Radhachura -- Caesalpinia pulcherrima Sw. (Leguminosae)
--
43 Rain tree -- Samea Samon --
18-60

Power System Master Plan 2010
18-61
No. Local Name English Name Scientific Name IUCN Global Status
44 Rashun Garlic Allium sativum --
45 Sajina -- Moringa Oleifera Lamk. (Moringa) --
46 Shimul -- Bombax ceiba L. (Bombacaceae) --
47 Sofeda Sapodilla Manilkara Achras --
48 Supari Colloq --
49 Tal Palm tree Borassus flabellifer L. (Palmae) --
50 Tentul Tamarind Tamarindus indica --
51 Thankuni -- Centella asiatica --
52 Topa pana -- (Pistia stratiotes) --
53 Ulatkambal -- Abroma augusta -- Source: PSMP Study Team
2) Fauna The animals found within a 1km circumference around the site include a total 55 species – 17 species of mammalian animals, 30 species of birds, 7 species of reptiles and 1 species of amphibian. Out of the animals on the 2007 Red List of the International Union for the Conservation of Nature (IUCN), there are 16 species of LC, 1 species of NT, 1 species of EN, and 2 species of CR. Special care must be given to the protection of Red Headed Vultures, Panited Roofed Turtles (CR) and Fishing Cats, (ER). APTable 18-57 is a list of animals found around the Meghnaghat site.
APTable 18-57 List of animals found around Meghnaghat site No. Local Name English Name Scientific Name IUCN Global
Status MAMMALS
1 Badur/Daini False Vampire Megaderma Lyra -- 2 Bagdash Large Indian civet Viverra Zibetha -- 3 Bon Biral/Wab Jungal Cat/Swamp Cat Felis chaus -- 4 Bara Benji Common Mongoose Herpestes edwardsi -- 5 Bhera Sheep Bovidae : Ovis -- 6 Biral Cat Felis : Catus -- 7 Indur Common House Rat Rattus rattus -- 8 Ghora Horse Equus caballus -- 9 Goru Cow -- --
10 Kathbirali Malayan Giant Squirrel Rataufa bicolor -- 11 Khek Shiyal Bengol Fox/Indian Fox Vulpes bengalensis LC
12 Khargosh/Shashak Rufous-tailed Hare Lepus nigricollis LC
13 Kukur Dog Cannis Familiaris --
14 Mecho Biral/Mecho Bagh
Fishing cat Prionailurus viverrinus
EN
15 Mohish Bafallow -- -- 16 Sagol Goat Capra Hircus -- 17 Shojaru Indian crested Porcupine Hystrix Indica LC
BIRDS 1 Babui-Batan Small Pratincole Glareola Lactea LC
2 Baj Crested Groshawk Accipiter trivirgatus LC
3 Bok Intermediate Egret Mesophoyx intermedia
--
4 Bulbuli Red-vented Bulbul Pycnonotus cafer -- 5 Hutum Pecha Rock Eagle Owl Bubo bengalensis LC
6 Chil Pariah Kite Passer domesticus --
Power System Master Plan 2010
18-62
No. Local Name English Name Scientific Name IUCN Global Status
7 Chorai House Sparrow Passer Domesticus --
8 Dahuk White Breasted water hen Amaurornis phoenicurus
LC
9 Doyel Magpie Robin Copsychus saularis LC
10 Eagal Bazzard -Eagal Butastur teesa LC
11 Fingey Black Drongo Dicrurus macrocercus --
12 Gang Shalik Bank Myna Acridotheres ginginianus
LC
13 Ghughu Oriental Turtle Dove Streptopelia orientalis LC
14 Gung Chil Whiskered Tern Chlidonias hybridus LC
15 Hash Duck Anatidae Anseriformes
--
16 Jalali Kobutor Rock Pigon Columba Livia LC
17 Kak House Crow Corvus splendens -- 18 Kana Bok Indian Pond Heron Ardeola grayii -- 19 Kat Tokra Woodpecker Picoides pubescens --
20 Kokil Asian Koel Eudynamys scolopacea
--
21 Konch Bak. Pond Heron. Ardeola grayii -- 22 Machhranga White Throated Kingfisher Halcyn smyrensis -- 23 Mohanchura Hoopoe Upupa epops --
24 Paira Pigeon Columba livia domestica
--
25 Pencha Sport-bellied Owl Bubo nipalensis LC
26 Rajhans Bar-headed Goose Anser indicus LC
27 Shalik Indian mynah -- -- 28 Raj Shokun Red Headed Vulture Sarcogyps calvus CR
29 Tia Rose-ringed Parakeet Psittacula krameri LC 30 Tuntuni Tailor bird Orthotomus sutorius --
REPTILE 1 Tiktiki House Lizard Hemidactylus brookii -- 2 Ajogor Rock Python Python molurus NT
3 Kasim Painted Roofed Turtle Kachuga Kachuga CR
4 Gui Shap Bengal Monitor Varanus bengalensis --
5 Sabuj Dhora Green Keel back Snake Macrophistodon plumbicolor
--
6 Kalo Mete Dhora Shap Dark-Bellied Marsh SnakeXenochrophis cersogaster
--
7 Gokhra Shap Monocellate Cobra Naja kaouthia -- AMPHIBIA
1 Beng Frog Anura : Ranidae Source: PSMP Study Team
(b) Aquatic Communities
1) Aquatic Flora The freshwater dependent plants such as the helencha (Altermanthere philoxeroides), kalmi (Ipomoea aquatica), daokalmi (Ipomoea fistulosa), ichadal (Potamo seton) and water hyacinth (Eichhomia crassipes) are common in the ponds, canals and rivers near the Meghnaghat site. Khuda pana (Lemna minor), topapana, (Pistia stratiotes) and chaicha (Saipus articulatus) are also common.
Power System Master Plan 2010
2) Aquatic Fauna The Meghnaghat site is on bank of the Meghna River. The crabs inhabit ditches and ponds on the bank of Meghna River. Fresh water snails (Charonia Variegate) and mussels (Mytilus Edilis) are also common. The fishes found within around the site include a total of 41 species of river fishes. APTable 18-58 shows a list of fishes available near the Meghnaghat site.
APTable 18-58 List of fishes available near Meghnaghat site
No. Local Name English Name Scientific Name IUCN Global Status
1 Ayer Long Whiskered cat fish
Aorichthys aor --
2 Bata Giantscale Mullet Lizamelinoptera -- 3 Bele Scribbled goby Awaous grammepomus -- 4 Bhol/Bol Indian Trout Raiamas bola --
5 Chanda Elongate glass perchlet
Chanda nama --
6 Chingri Shimp --- --
7 Chitol Humped Featherback
Notopterus chitala --
8 Dhela/ Dipali/ ketti(Cotio) Cotio Osteobrama cotio -- 9 Foli Grey Featherback Notopterus notopterus --
10 Ghaura (Gaura Bacha) Clapisoma gaura -- 11 Ghonia/Gonainya (Kuria Lebeo) Labeo gonius -- 12 Gojar/ Gojal Giant snake head Channa marulius -- 13 Golsa/ Golsa Tengra Gangetic Mystus Mystus cavaslus -- 14 Ilish Hilsa Tenualosa ilisha -- 15 Jhinuk -- -- -- 16 Kajli / Banshpata Jamua ailia Ailia punctata -- 17 Kalibaush (kalbasu) Orange-fin labeo Labeo calbasu --
18 Kani Pabda / Boali Pabda (Indian Butter cat fish)
Ompak bimaculatus --
19 Katol Catla Catla Cattla -- 20 Khailsha Banded gourami Colisa fasciata --
21 Kucha / Kuchia Gangetic Mud Eel Cuchia
Monopterus cuchia --
22 Meni / Bheda/ Rayan/ Bheduri Mottled Nandus Nandus nandus -- 23 Mrigal Mrigal Cirrhinus mrigala --
24 Napit Koi/ Koi Banedi Dwarf chemeleon fish badis
Badis badis --
25 Pabda Pabo Cat fish Ompak pabo -- 26 Poa Pama croaker Otolithoides pama -- 27 Potka Green pufferfish Tetraodon fluviatilis -- 28 Pungash (river) Yellowtail catfish Pangasius pagasius --
29 Puti Fry Puntius puntio (Hamilton)
--
30 Rui Rohu Labeo rohita -- 31 Sarputi / Swarnaputi (Olive barb) Puntias Sarana -- 32 Shal baim/ Baim Bam Tire trach spinyeel Mastecembelus armatus -- 33 Shamuk Snail -- --
34 Shol Banded Snakehead Channa striatus --
18-63
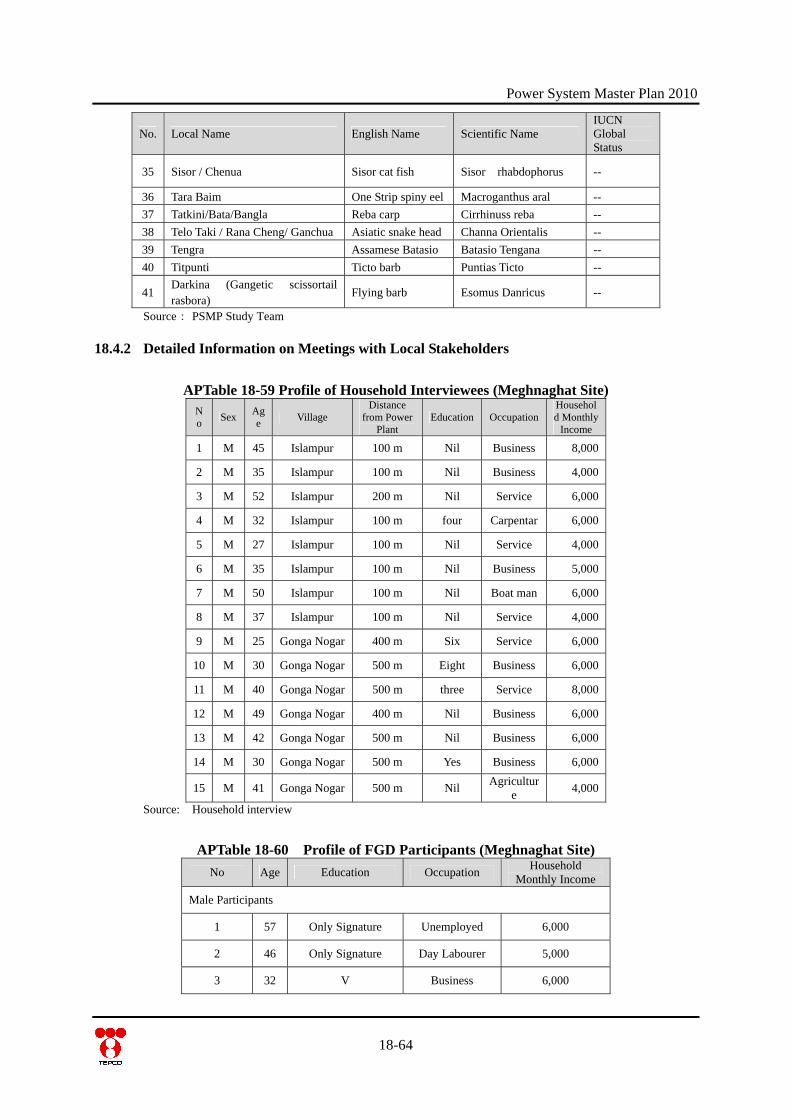
Power System Master Plan 2010
18-64
No. Local Name English Name Scientific Name IUCN Global Status
35 Sisor / Chenua Sisor cat fish Sisor rhabdophorus --
36 Tara Baim One Strip spiny eel Macroganthus aral -- 37 Tatkini/Bata/Bangla Reba carp Cirrhinuss reba -- 38 Telo Taki / Rana Cheng/ Ganchua Asiatic snake head Channa Orientalis -- 39 Tengra Assamese Batasio Batasio Tengana -- 40 Titpunti Ticto barb Puntias Ticto --
41 Darkina (Gangetic scissortail rasbora)
Flying barb Esomus Danricus --
Source: PSMP Study Team
18.4.2 Detailed Information on Meetings with Local Stakeholders
APTable 18-59 Profile of Household Interviewees (Meghnaghat Site) No Sex Ag
e Village Distance
from Power Plant
Education OccupationHousehold Monthly
Income
1 M 45 Islampur 100 m Nil Business 8,000
2 M 35 Islampur 100 m Nil Business 4,000
3 M 52 Islampur 200 m Nil Service 6,000
4 M 32 Islampur 100 m four Carpentar 6,000
5 M 27 Islampur 100 m Nil Service 4,000
6 M 35 Islampur 100 m Nil Business 5,000
7 M 50 Islampur 100 m Nil Boat man 6,000
8 M 37 Islampur 100 m Nil Service 4,000
9 M 25 Gonga Nogar 400 m Six Service 6,000
10 M 30 Gonga Nogar 500 m Eight Business 6,000
11 M 40 Gonga Nogar 500 m three Service 8,000
12 M 49 Gonga Nogar 400 m Nil Business 6,000
13 M 42 Gonga Nogar 500 m Nil Business 6,000
14 M 30 Gonga Nogar 500 m Yes Business 6,000
15 M 41 Gonga Nogar 500 m Nil Agriculture 4,000
Source: Household interview
APTable 18-60 Profile of FGD Participants (Meghnaghat Site) No Age Education Occupation Household
Monthly Income
Male Participants
1 57 Only Signature Unemployed 6,000
2 46 Only Signature Day Labourer 5,000
3 32 V Business 6,000
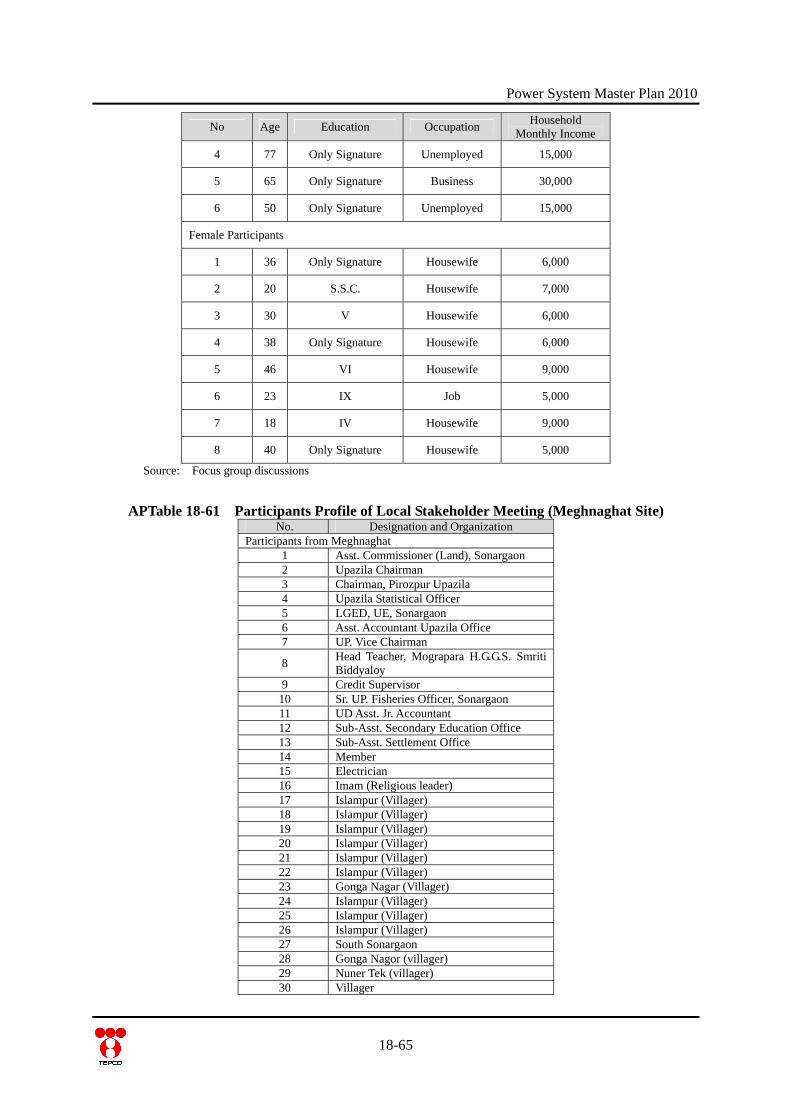
Power System Master Plan 2010
18-65
No Age Education Occupation Household Monthly Income
4 77 Only Signature Unemployed 15,000
5 65 Only Signature Business 30,000
6 50 Only Signature Unemployed 15,000
Female Participants
1 36 Only Signature Housewife 6,000
2 20 S.S.C. Housewife 7,000
3 30 V Housewife 6,000
4 38 Only Signature Housewife 6,000
5 46 VI Housewife 9,000
6 23 IX Job 5,000
7 18 IV Housewife 9,000
8 40 Only Signature Housewife 5,000
Source: Focus group discussions
APTable 18-61 Participants Profile of Local Stakeholder Meeting (Meghnaghat Site) No. Designation and Organization
Participants from Meghnaghat 1 Asst. Commissioner (Land), Sonargaon 2 Upazila Chairman 3 Chairman, Pirozpur Upazila 4 Upazila Statistical Officer 5 LGED, UE, Sonargaon 6 Asst. Accountant Upazila Office 7 UP. Vice Chairman
8 Head Teacher, Mograpara H.G.G.S. Smriti Biddyaloy
9 Credit Supervisor 10 Sr. UP. Fisheries Officer, Sonargaon 11 UD Asst. Jr. Accountant 12 Sub-Asst. Secondary Education Office 13 Sub-Asst. Settlement Office 14 Member 15 Electrician 16 Imam (Religious leader) 17 Islampur (Villager) 18 Islampur (Villager) 19 Islampur (Villager) 20 Islampur (Villager) 21 Islampur (Villager) 22 Islampur (Villager) 23 Gonga Nagar (Villager) 24 Islampur (Villager) 25 Islampur (Villager) 26 Islampur (Villager) 27 South Sonargaon 28 Gonga Nagor (villager) 29 Nuner Tek (villager) 30 Villager
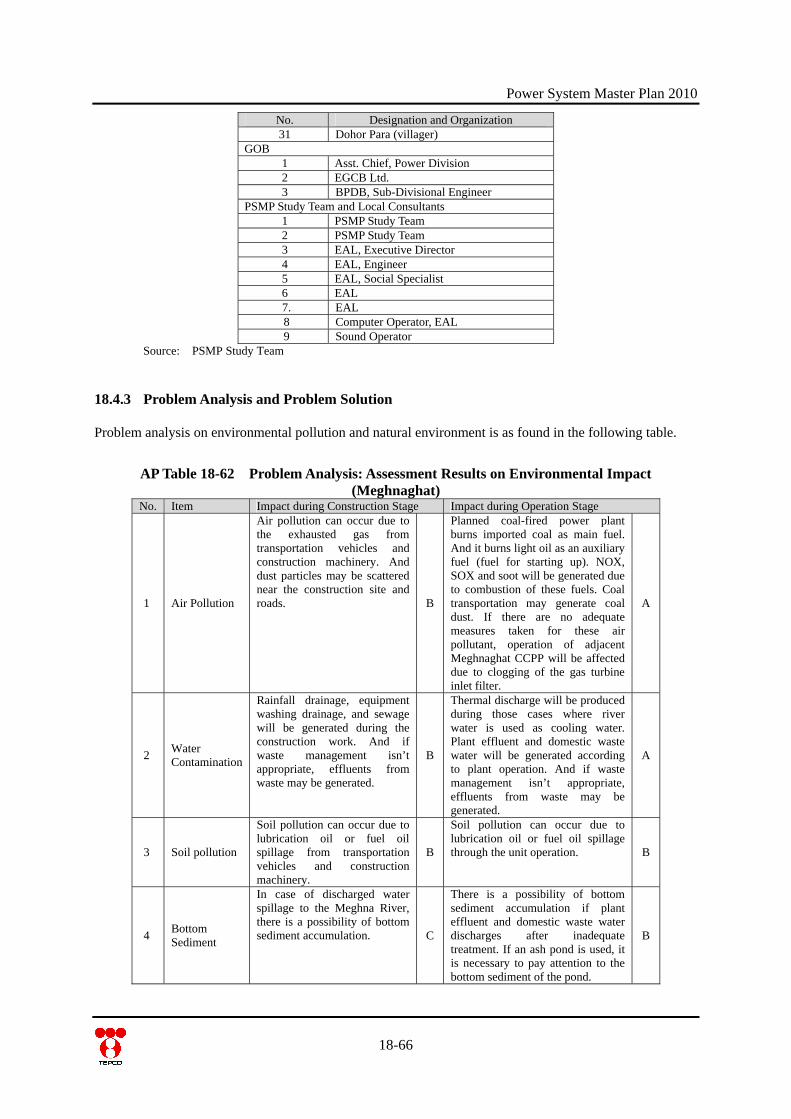
Power System Master Plan 2010
18-66
No. Designation and Organization 31 Dohor Para (villager)
GOB 1 Asst. Chief, Power Division 2 EGCB Ltd. 3 BPDB, Sub-Divisional Engineer
PSMP Study Team and Local Consultants 1 PSMP Study Team 2 PSMP Study Team 3 EAL, Executive Director 4 EAL, Engineer 5 EAL, Social Specialist 6 EAL 7. EAL 8 Computer Operator, EAL 9 Sound Operator
Source: PSMP Study Team
18.4.3 Problem Analysis and Problem Solution Problem analysis on environmental pollution and natural environment is as found in the following table.
AP Table 18-62 Problem Analysis: Assessment Results on Environmental Impact (Meghnaghat)
No. Item Impact during Construction Stage Impact during Operation Stage
1 Air Pollution
Air pollution can occur due to the exhausted gas from transportation vehicles and construction machinery. And dust particles may be scattered near the construction site and roads. B
Planned coal-fired power plant burns imported coal as main fuel. And it burns light oil as an auxiliary fuel (fuel for starting up). NOX, SOX and soot will be generated due to combustion of these fuels. Coal transportation may generate coal dust. If there are no adequate measures taken for these air pollutant, operation of adjacent Meghnaghat CCPP will be affected due to clogging of the gas turbine inlet filter.
A
2 Water Contamination
Rainfall drainage, equipment washing drainage, and sewage will be generated during the construction work. And if waste management isn’t appropriate, effluents from waste may be generated.
B
Thermal discharge will be produced during those cases where river water is used as cooling water. Plant effluent and domestic waste water will be generated according to plant operation. And if waste management isn’t appropriate, effluents from waste may be generated.
A
3 Soil pollution
Soil pollution can occur due to lubrication oil or fuel oil spillage from transportation vehicles and construction machinery.
B
Soil pollution can occur due to lubrication oil or fuel oil spillage through the unit operation. B
4 Bottom Sediment
In case of discharged water spillage to the Meghna River, there is a possibility of bottom sediment accumulation. C
There is a possibility of bottom sediment accumulation if plant effluent and domestic waste water discharges after inadequate treatment. If an ash pond is used, it is necessary to pay attention to the bottom sediment of the pond.
B
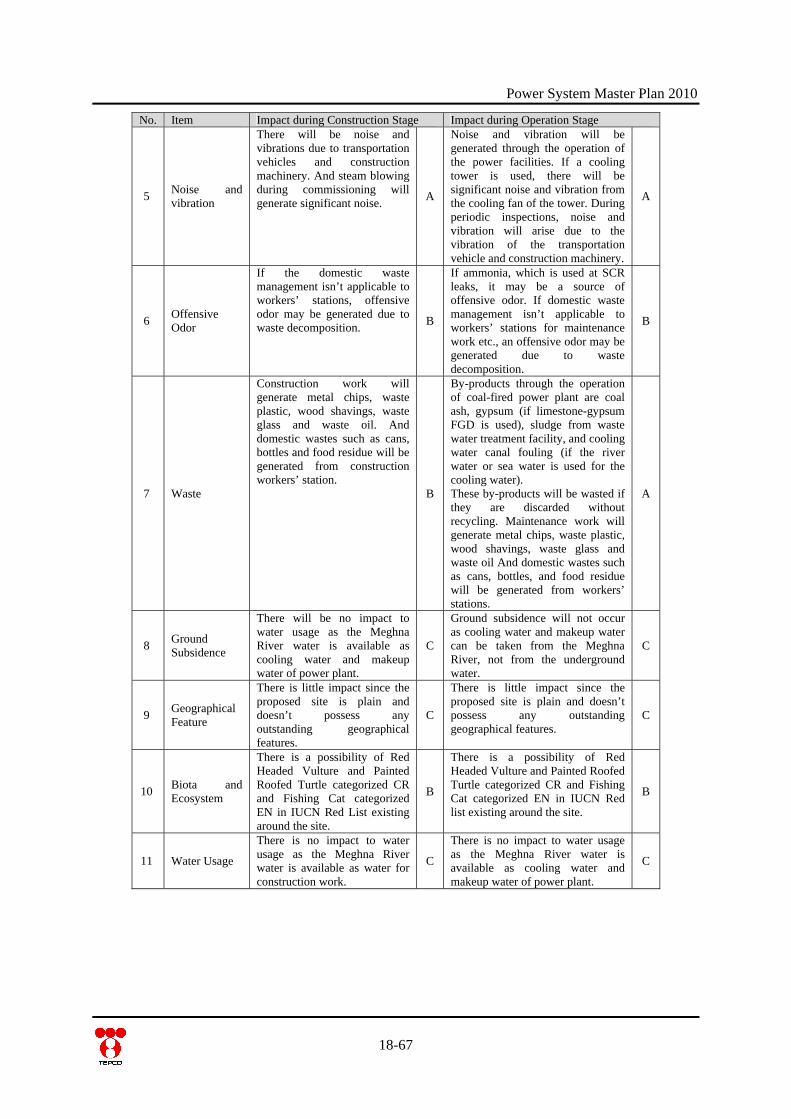
Power System Master Plan 2010
18-67
No. Item Impact during Construction Stage Impact during Operation Stage
5 Noise and vibration
There will be noise and vibrations due to transportation vehicles and construction machinery. And steam blowing during commissioning will generate significant noise. A
Noise and vibration will be generated through the operation of the power facilities. If a cooling tower is used, there will be significant noise and vibration from the cooling fan of the tower. During periodic inspections, noise and vibration will arise due to the vibration of the transportation vehicle and construction machinery.
A
6 Offensive Odor
If the domestic waste management isn’t applicable to workers’ stations, offensive odor may be generated due to waste decomposition. B
If ammonia, which is used at SCR leaks, it may be a source of offensive odor. If domestic waste management isn’t applicable to workers’ stations for maintenance work etc., an offensive odor may be generated due to waste decomposition.
B
7 Waste
Construction work will generate metal chips, waste plastic, wood shavings, waste glass and waste oil. And domestic wastes such as cans, bottles and food residue will be generated from construction workers’ station.
B
By-products through the operation of coal-fired power plant are coal ash, gypsum (if limestone-gypsum FGD is used), sludge from waste water treatment facility, and cooling water canal fouling (if the river water or sea water is used for the cooling water). These by-products will be wasted if they are discarded without recycling. Maintenance work will generate metal chips, waste plastic, wood shavings, waste glass and waste oil And domestic wastes such as cans, bottles, and food residue will be generated from workers’ stations.
A
8 Ground Subsidence
There will be no impact to water usage as the Meghna River water is available as cooling water and makeup water of power plant.
C
Ground subsidence will not occur as cooling water and makeup water can be taken from the Meghna River, not from the underground water.
C
9 Geographical Feature
There is little impact since the proposed site is plain and doesn’t possess any outstanding geographical features.
C
There is little impact since the proposed site is plain and doesn’t possess any outstanding geographical features.
C
10 Biota and Ecosystem
There is a possibility of Red Headed Vulture and Painted Roofed Turtle categorized CR and Fishing Cat categorized EN in IUCN Red List existing around the site.
B
There is a possibility of Red Headed Vulture and Painted Roofed Turtle categorized CR and Fishing Cat categorized EN in IUCN Red list existing around the site.
B
11 Water Usage
There is no impact to water usage as the Meghna River water is available as water for construction work.
C
There is no impact to water usage as the Meghna River water is available as cooling water and makeup water of power plant.
C
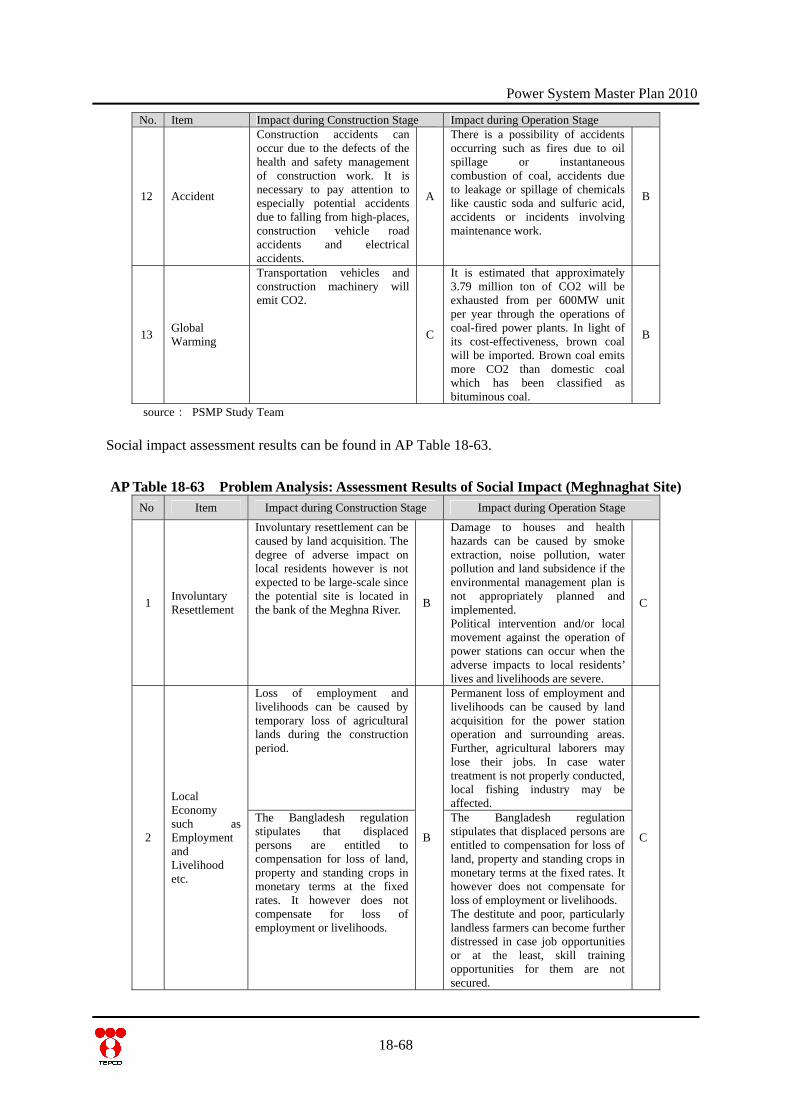
Power System Master Plan 2010
18-68
No. Item Impact during Construction Stage Impact during Operation Stage
12 Accident
Construction accidents can occur due to the defects of the health and safety management of construction work. It is necessary to pay attention to especially potential accidents due to falling from high-places, construction vehicle road accidents and electrical accidents.
A
There is a possibility of accidents occurring such as fires due to oil spillage or instantaneous combustion of coal, accidents due to leakage or spillage of chemicals like caustic soda and sulfuric acid, accidents or incidents involving maintenance work.
B
13 Global Warming
Transportation vehicles and construction machinery will emit CO2.
C
It is estimated that approximately 3.79 million ton of CO2 will be exhausted from per 600MW unit per year through the operations of coal-fired power plants. In light of its cost-effectiveness, brown coal will be imported. Brown coal emits more CO2 than domestic coal which has been classified as bituminous coal.
B
source: PSMP Study Team
Social impact assessment results can be found in AP Table 18-63.
AP Table 18-63 Problem Analysis: Assessment Results of Social Impact (Meghnaghat Site) No Item Impact during Construction Stage Impact during Operation Stage
1 Involuntary Resettlement
Involuntary resettlement can be caused by land acquisition. The degree of adverse impact on local residents however is not expected to be large-scale since the potential site is located in the bank of the Meghna River. B
Damage to houses and health hazards can be caused by smoke extraction, noise pollution, water pollution and land subsidence if the environmental management plan is not appropriately planned and implemented. Political intervention and/or local movement against the operation of power stations can occur when the adverse impacts to local residents’ lives and livelihoods are severe.
C
Loss of employment and livelihoods can be caused by temporary loss of agricultural lands during the construction period.
Permanent loss of employment and livelihoods can be caused by land acquisition for the power station operation and surrounding areas. Further, agricultural laborers may lose their jobs. In case water treatment is not properly conducted, local fishing industry may be affected.
2
Local Economy such as Employment and Livelihood etc.
The Bangladesh regulation stipulates that displaced persons are entitled to compensation for loss of land, property and standing crops in monetary terms at the fixed rates. It however does not compensate for loss of employment or livelihoods.
B
The Bangladesh regulation stipulates that displaced persons are entitled to compensation for loss of land, property and standing crops in monetary terms at the fixed rates. It however does not compensate for loss of employment or livelihoods. The destitute and poor, particularly landless farmers can become further distressed in case job opportunities or at the least, skill training opportunities for them are not secured.
C

Power System Master Plan 2010
18-69
No Item Impact during Construction Stage Impact during Operation Stage
There are no ethnic minorities ing in the site. liv
There are no ethnic minorities living in the site.
3
The Poor, Indigenous and Ethnic People
The destitute, poor and landless farmers may lose their jobs when agricultural land is lost due to the construction of power station.
C The destitute, poor and landless farmers can become further distressed if job opportunities or at least skill training opportunities for them are not secured.
C
The disparity between land owners and the rest (landless farmers, wage laborers etc.) may widen.
Landless farmers and wage laborers may become further distressed and the disparity between land owners and them can be widened when job opportunities and skill training opportunities are not provided to them.
4 Misdistribution of Benefit and Loss
In case an ample number of job opportunities and skill training opportunities are not provided to meet the demand, the disparity between those with such opportunities and those without may widen.
B Local livelihoods may be affected and health hazards may be caused by land subsidence, smoke extraction, noise pollution, water pollution and water shortage if the environmental management plan is not appropriately planned and implemented.
C
Local conflict may occur between the relocated people and the host community.
5 Local Conflict of Interests
Excessive interventions by various stakeholders can trigger local conflict among residents, and the disruption of the local community.
C
Local conflict can become constant between the relocated people and the host community.
C
Appropriate information and knowledge may not be properly disseminated to the illiterate, particularly women. 6 Gender
Gender gap may widen in terms of job opportunities.
C
Appropriate information and knowledge may not be properly disseminated to the illiterate, particularly women. C
Child labor may occur due to their parents’ loss of job.
Child labor may occur due to their parents’ loss of job.
Children may lose education opportunities.
Children may lose education opportunities.
Playgrounds for children may be lost.
Playgrounds for children may be lost.
7 Children’s Rights
Children may catch infectious diseases triggered by outsiders’ entry into the community.
C
Children may catch infectious diseases triggered by outsiders’ entry into the community.
C
The present potential site that has been selected is away from the city center, residential area, local market, and the protected forest.
The present potential site that has been selected is away from the city center, residential area, local market, and the protected forest. 8
Land Use and Utilization of Local Resources Temporary loss of present land
use pattern and/or economic infrastructure may occur.
C
Permanent loss of present land use pattern and/or economic infrastructure may occur.
C
9
Social Institutions such as Social Infrastructure and Local Decision Making Institutions
Disruption of local community may be caused by the conflict of interests among politicians, government offices, and residents. It may cause a delay in procedures of land acquisition and resettlement.
C
-
C

Power System Master Plan 2010
18-70
No Item Impact during Construction Stage Impact during Operation Stage
10 Existing Social Infrastructure
Temporary loss of existing social infrastructure may occur due to the construction works.
C Traffic to/from power station may become heavier. Social services may become insufficient.
C
There is no cultural heritage existing in the site. Careful consideration however should be given to the Tomb of Sultan Giasuddin and Shah Abdul Alla located 4 km away from the site.
11 Cultural Heritage
Landscape may be lost.
C
Careful consideration however should be given to the Tomb of Sultan Giasuddin and Shah Abdul Alla located 4 km away from the site. C
12 Infectious Diseases such as HIV/AIDS
Infectious diseases may spread via the construction workers into the community.
C Infectious diseases may spread via the operation workers into the community.
C
Source: PSMP Study Team
Mitigation measures on environmental pollution and natural environment are as found in AP Table 18-64.
AP Table 18-64 Mitigation Measures for Environmental Impact (Meghnaghat) No. Item Mitigation measures during
Construction Stage Mitigation measures during Operation
Stage
1 Air pollution
Countermeasures for air pollution by exhaust gas from transportation vehicles and construction machinery, and dust scattering due to construction traffic are studied as in AP Table 18-67 and AP Table 18-68. As for the reduction of exhaust gas from transportation vehicles and construction machinery, idling stops and keeping proper exhaust condition by routine inspection of vehicles are judged to be applied. As for countermeasures for dust scattering, load cover, periodical vehicle washing and periodic peripheral road cleaning are judged to be applied.
AP Table 18-62 shows countermeasures for NOX, AP Table 18-63 shows countermeasures for SOX, AP Table 18-64 shows countermeasures for soot, and AP Table 18-66 shows countermeasures for coal dust. Besides conducting flue gas treatment by system including FGD, SCR, and ESP etc., mitigation of coal dust scattering is paid attention to.
2 Water contamination
Countermeasures for water contamination due to excavation waste soil outflow are suitable via a fence installation utilizing sandbags etc. As for the effluent due to equipment washing, it is suitable to install a temporary precipitation tank and to drain the supernatant water. As for sewage, it is suitable to put up a septic tank. As for waste, water contamination can be prevented if waste treatment is conducted promptly and the waste is not left for long time.
There is no warm effluent water generation since cooling tower or air cooled condenser will be adopted as cooling system from consideration to impact of warm effluent water and local fishery. Plant effluent and sewage according to plant operations are discharged after waste water treatment including coagulating sedimentation, neutralization, and oil separation. Appropriate waste water facility capacity design is needed as condensed cooling water blow effluent is a large amount.
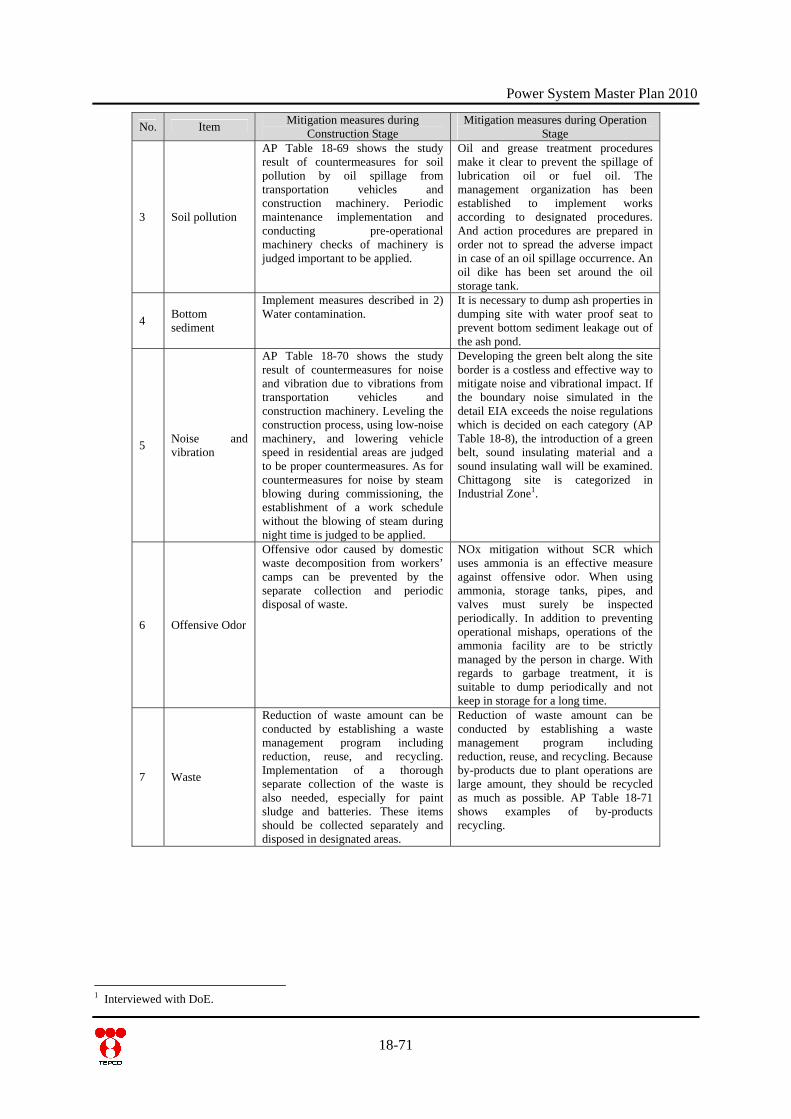
Power System Master Plan 2010
18-71
No. Item Mitigation measures during Construction Stage
Mitigation measures during Operation Stage
3 Soil pollution
AP Table 18-69 shows the study result of countermeasures for soil pollution by oil spillage from transportation vehicles and construction machinery. Periodic maintenance implementation and conducting pre-operational machinery checks of machinery is judged important to be applied.
Oil and grease treatment procedures make it clear to prevent the spillage of lubrication oil or fuel oil. The management organization has been established to implement works according to designated procedures. And action procedures are prepared in order not to spread the adverse impact in case of an oil spillage occurrence. An oil dike has been set around the oil storage tank.
4 Bottom sediment
Implement measures described in 2) Water contamination.
It is necessary to dump ash properties in dumping site with water proof seat to prevent bottom sediment leakage out of the ash pond.
5 Noise and vibration
AP Table 18-70 shows the study result of countermeasures for noise and vibration due to vibrations from transportation vehicles and construction machinery. Leveling the construction process, using low-noise machinery, and lowering vehicle speed in residential areas are judged to be proper countermeasures. As for countermeasures for noise by steam blowing during commissioning, the establishment of a work schedule without the blowing of steam during night time is judged to be applied.
Developing the green belt along the site border is a costless and effective way to mitigate noise and vibrational impact. If the boundary noise simulated in the detail EIA exceeds the noise regulations which is decided on each category (AP Table 18-8), the introduction of a green belt, sound insulating material and a sound insulating wall will be examined. Chittagong site is categorized in Industrial Zone1.
6 Offensive Odor
Offensive odor caused by domestic waste decomposition from workers’ camps can be prevented by the separate collection and periodic disposal of waste.
NOx mitigation without SCR which uses ammonia is an effective measure against offensive odor. When using ammonia, storage tanks, pipes, and valves must surely be inspected periodically. In addition to preventing operational mishaps, operations of the ammonia facility are to be strictly managed by the person in charge. With regards to garbage treatment, it is suitable to dump periodically and not keep in storage for a long time.
7 Waste
Reduction of waste amount can be conducted by establishing a waste management program including reduction, reuse, and recycling. Implementation of a thorough separate collection of the waste is also needed, especially for paint sludge and batteries. These items should be collected separately and disposed in designated areas.
Reduction of waste amount can be conducted by establishing a waste management program including reduction, reuse, and recycling. Because by-products due to plant operations are large amount, they should be recycled as much as possible. AP Table 18-71 shows examples of by-products recycling.
1 Interviewed with DoE.
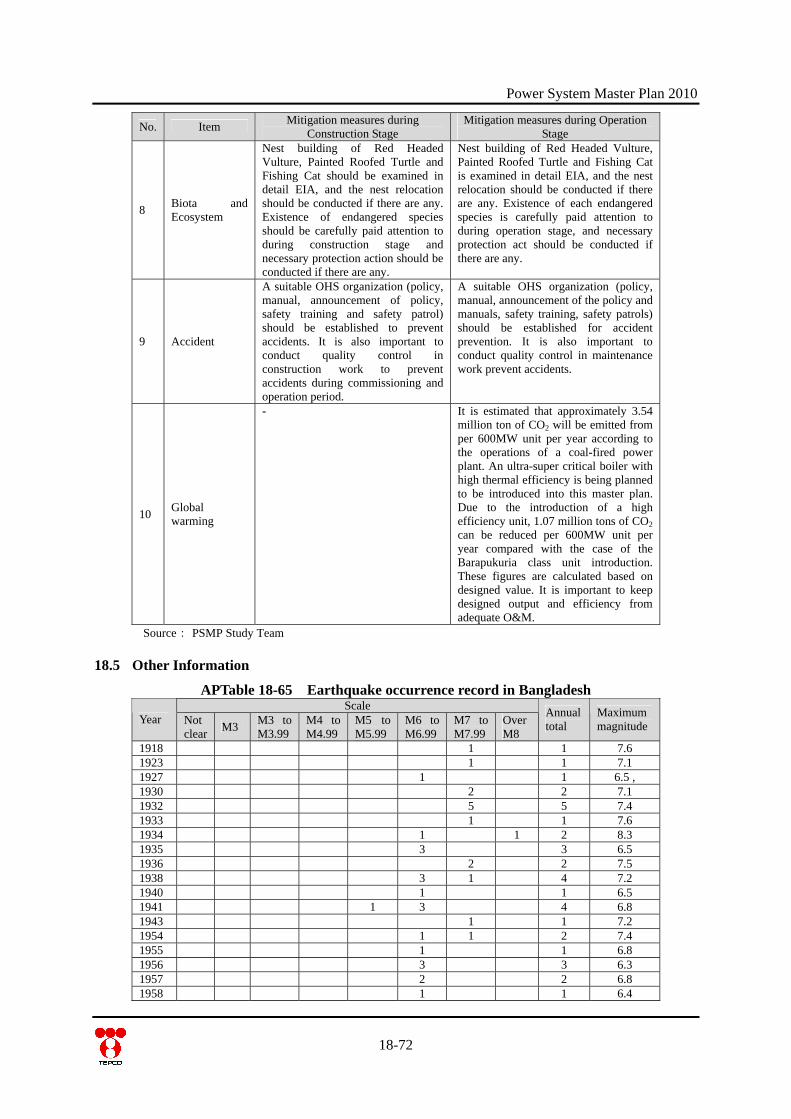
Power System Master Plan 2010
18-72
No. Item Mitigation measures during Construction Stage
Mitigation measures during Operation Stage
8 Biota and Ecosystem
Nest building of Red Headed Vulture, Painted Roofed Turtle and Fishing Cat should be examined in detail EIA, and the nest relocation should be conducted if there are any. Existence of endangered species should be carefully paid attention to during construction stage and necessary protection action should be conducted if there are any.
Nest building of Red Headed Vulture, Painted Roofed Turtle and Fishing Cat is examined in detail EIA, and the nest relocation should be conducted if there are any. Existence of each endangered species is carefully paid attention to during operation stage, and necessary protection act should be conducted if there are any.
9 Accident
A suitable OHS organization (policy, manual, announcement of policy, safety training and safety patrol) should be established to prevent accidents. It is also important to conduct quality control in construction work to prevent accidents during commissioning and operation period.
A suitable OHS organization (policy, manual, announcement of the policy and manuals, safety training, safety patrols) should be established for accident prevention. It is also important to conduct quality control in maintenance work prevent accidents.
10 Global warming
- It is estimated that approximately 3.54 million ton of CO2 will be emitted from per 600MW unit per year according to the operations of a coal-fired power plant. An ultra-super critical boiler with high thermal efficiency is being planned to be introduced into this master plan. Due to the introduction of a high efficiency unit, 1.07 million tons of CO2 can be reduced per 600MW unit per year compared with the case of the Barapukuria class unit introduction. These figures are calculated based on designed value. It is important to keep designed output and efficiency from adequate O&M.
Source: PSMP Study Team
18.5 Other Information
APTable 18-65 Earthquake occurrence record in Bangladesh Scale
Year Not clear M3 M3 to
M3.99 M4 to M4.99
M5 to M5.99
M6 to M6.99
M7 to M7.99
Over M8
Annual total
Maximum magnitude
1918 1 1 7.6 1923 1 1 7.1 1927 1 1 6.5 , 1930 2 2 7.1 1932 5 5 7.4 1933 1 1 7.6 1934 1 1 2 8.3 1935 3 3 6.5 1936 2 2 7.5 1938 3 1 4 7.2 1940 1 1 6.5 1941 1 3 4 6.8 1943 1 1 7.2 1954 1 1 2 7.4 1955 1 1 6.8 1956 3 3 6.3 1957 2 2 6.8 1958 1 1 6.4
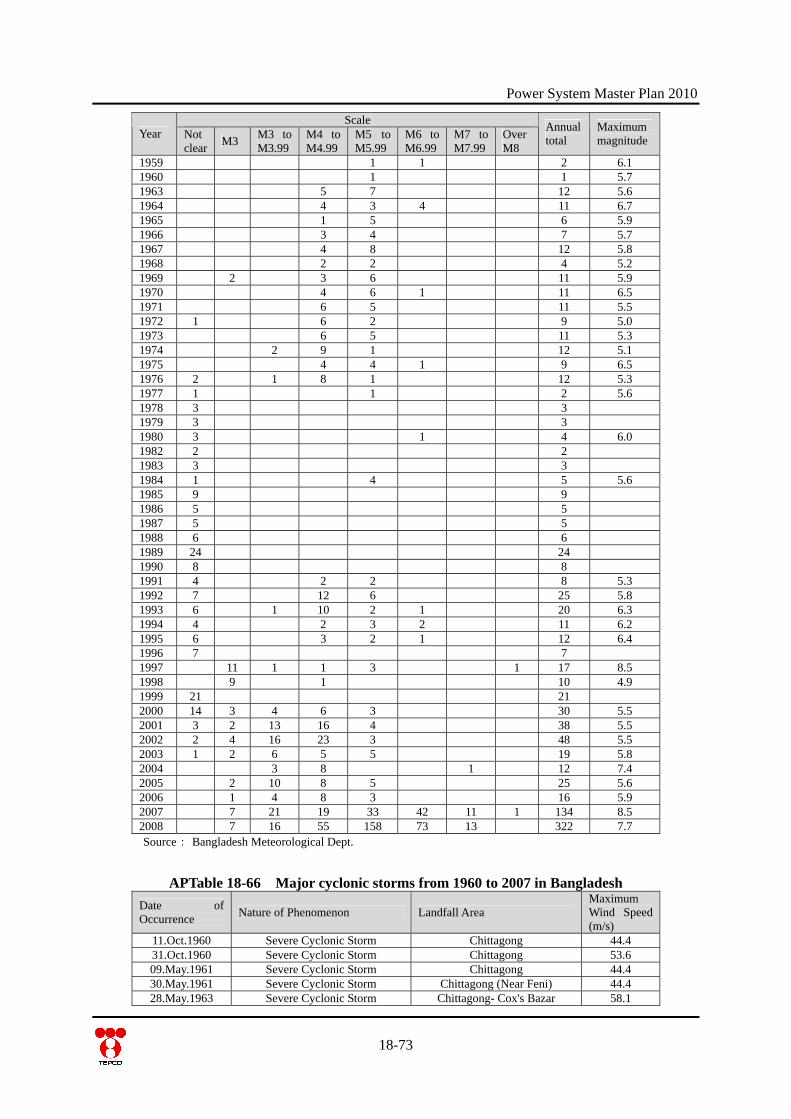
Power System Master Plan 2010
18-73
Scale Year Not
clear M3 M3 to M3.99
M4 to M4.99
M5 to M5.99
M6 to M6.99
M7 to M7.99
Over M8
Annual total
Maximum magnitude
1959 1 1 2 6.1 1960 1 1 5.7 1963 5 7 12 5.6 1964 4 3 4 11 6.7 1965 1 5 6 5.9 1966 3 4 7 5.7 1967 4 8 12 5.8 1968 2 2 4 5.2 1969 2 3 6 11 5.9 1970 4 6 1 11 6.5 1971 6 5 11 5.5 1972 1 6 2 9 5.0 1973 6 5 11 5.3 1974 2 9 1 12 5.1 1975 4 4 1 9 6.5 1976 2 1 8 1 12 5.3 1977 1 1 2 5.6 1978 3 3 1979 3 3 1980 3 1 4 6.0 1982 2 2 1983 3 3 1984 1 4 5 5.6 1985 9 9 1986 5 5 1987 5 5 1988 6 6 1989 24 24 1990 8 8 1991 4 2 2 8 5.3 1992 7 12 6 25 5.8 1993 6 1 10 2 1 20 6.3 1994 4 2 3 2 11 6.2 1995 6 3 2 1 12 6.4 1996 7 7 1997 11 1 1 3 1 17 8.5 1998 9 1 10 4.9 1999 21 21 2000 14 3 4 6 3 30 5.5 2001 3 2 13 16 4 38 5.5 2002 2 4 16 23 3 48 5.5 2003 1 2 6 5 5 19 5.8 2004 3 8 1 12 7.4 2005 2 10 8 5 25 5.6 2006 1 4 8 3 16 5.9 2007 7 21 19 33 42 11 1 134 8.5 2008 7 16 55 158 73 13 322 7.7 Source: Bangladesh Meteorological Dept.
APTable 18-66 Major cyclonic storms from 1960 to 2007 in Bangladesh Date of Occurrence Nature of Phenomenon Landfall Area
Maximum Wind Speed (m/s)
11.Oct.1960 Severe Cyclonic Storm Chittagong 44.4 31.Oct.1960 Severe Cyclonic Storm Chittagong 53.6 09.May.1961 Severe Cyclonic Storm Chittagong 44.4 30.May.1961 Severe Cyclonic Storm Chittagong (Near Feni) 44.4 28.May.1963 Severe Cyclonic Storm Chittagong- Cox's Bazar 58.1
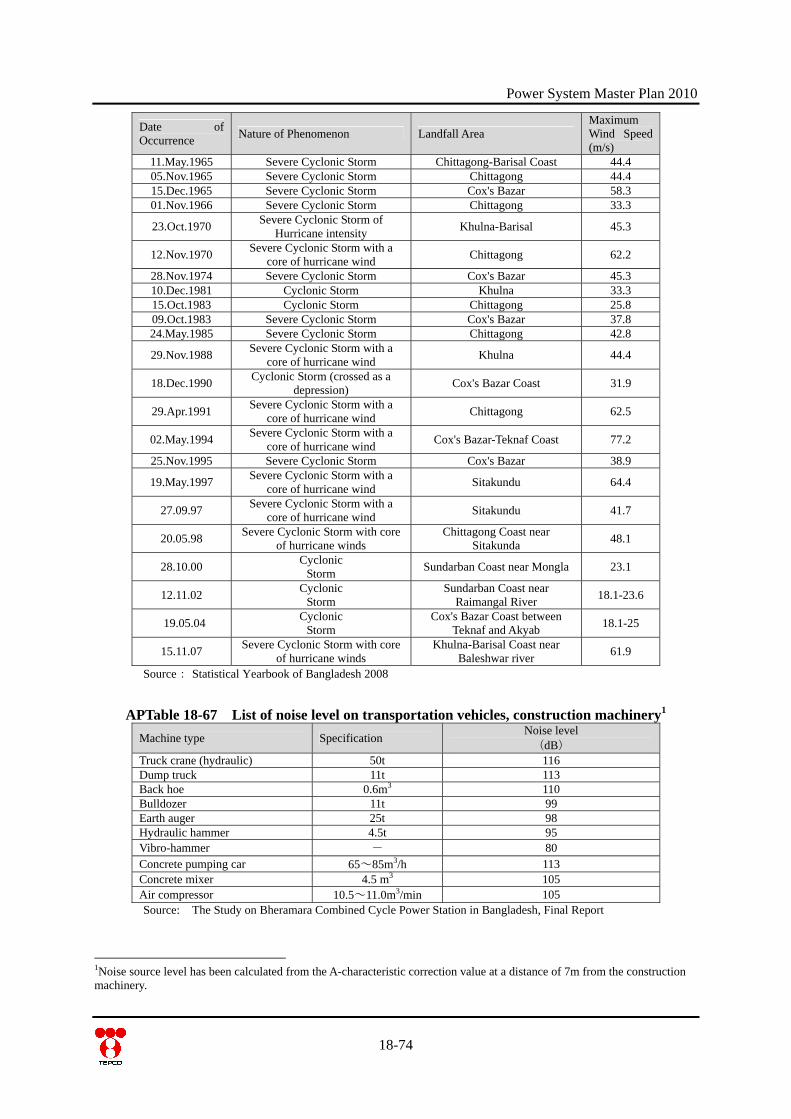
Power System Master Plan 2010
18-74
Date of Occurrence Nature of Phenomenon Landfall Area
Maximum Wind Speed (m/s)
11.May.1965 Severe Cyclonic Storm Chittagong-Barisal Coast 44.4 05.Nov.1965 Severe Cyclonic Storm Chittagong 44.4 15.Dec.1965 Severe Cyclonic Storm Cox's Bazar 58.3 01.Nov.1966 Severe Cyclonic Storm Chittagong 33.3
23.Oct.1970 Severe Cyclonic Storm of Hurricane intensity Khulna-Barisal 45.3
12.Nov.1970 Severe Cyclonic Storm with a core of hurricane wind Chittagong 62.2
28.Nov.1974 Severe Cyclonic Storm Cox's Bazar 45.3 10.Dec.1981 Cyclonic Storm Khulna 33.3 15.Oct.1983 Cyclonic Storm Chittagong 25.8 09.Oct.1983 Severe Cyclonic Storm Cox's Bazar 37.8 24.May.1985 Severe Cyclonic Storm Chittagong 42.8
29.Nov.1988 Severe Cyclonic Storm with a core of hurricane wind Khulna 44.4
18.Dec.1990 Cyclonic Storm (crossed as a depression) Cox's Bazar Coast 31.9
29.Apr.1991 Severe Cyclonic Storm with a core of hurricane wind Chittagong 62.5
02.May.1994 Severe Cyclonic Storm with a core of hurricane wind Cox's Bazar-Teknaf Coast 77.2
25.Nov.1995 Severe Cyclonic Storm Cox's Bazar 38.9
19.May.1997 Severe Cyclonic Storm with a core of hurricane wind Sitakundu 64.4
27.09.97 Severe Cyclonic Storm with a core of hurricane wind Sitakundu 41.7
20.05.98 Severe Cyclonic Storm with core of hurricane winds
Chittagong Coast near Sitakunda 48.1
28.10.00 Cyclonic Storm Sundarban Coast near Mongla 23.1
12.11.02 Cyclonic Storm
Sundarban Coast near Raimangal River 18.1-23.6
19.05.04 Cyclonic Storm
Cox's Bazar Coast between Teknaf and Akyab 18.1-25
15.11.07 Severe Cyclonic Storm with core of hurricane winds
Khulna-Barisal Coast near Baleshwar river 61.9
Source: Statistical Yearbook of Bangladesh 2008
APTable 18-67 List of noise level on transportation vehicles, construction machinery1 Machine type Specification Noise level
(dB) Truck crane (hydraulic) 50t 116 Dump truck 11t 113 Back hoe 0.6m3 110 Bulldozer 11t 99 Earth auger 25t 98 Hydraulic hammer 4.5t 95 Vibro-hammer - 80 Concrete pumping car 65~85m3/h 113 Concrete mixer 4.5 m3 105 Air compressor 10.5~11.0m3/min 105 Source: The Study on Bheramara Combined Cycle Power Station in Bangladesh, Final Report
1Noise source level has been calculated from the A-characteristic correction value at a distance of 7m from the construction machinery.
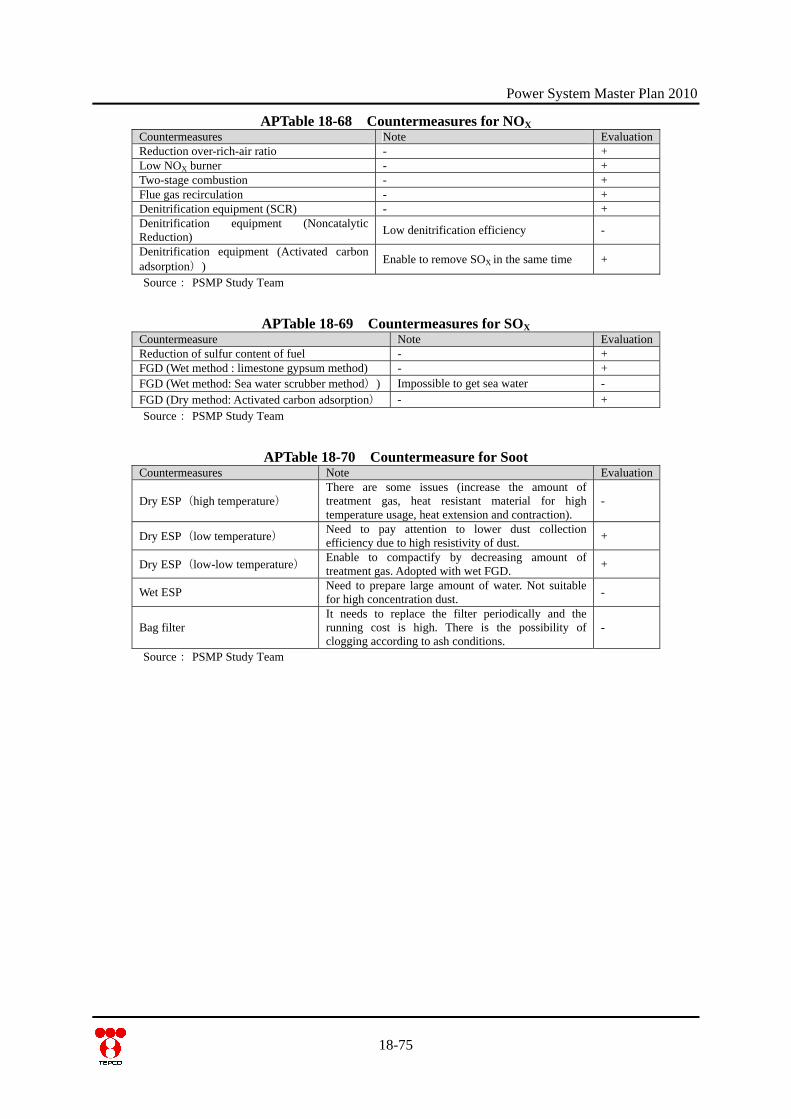
Power System Master Plan 2010
APTable 18-68 Countermeasures for NOX Countermeasures Note Evaluation Reduction over-rich-air ratio - + Low NOX burner - + Two-stage combustion - + Flue gas recirculation - + Denitrification equipment (SCR) - + Denitrification equipment (Noncatalytic Reduction) Low denitrification efficiency -
Denitrification equipment (Activated carbon adsorption)) Enable to remove SOX in the same time +
Source: PSMP Study Team
APTable 18-69 Countermeasures for SOX Countermeasure Note Evaluation Reduction of sulfur content of fuel - + FGD (Wet method : limestone gypsum method) - + FGD (Wet method: Sea water scrubber method)) Impossible to get sea water - FGD (Dry method: Activated carbon adsorption) - + Source: PSMP Study Team
APTable 18-70 Countermeasure for Soot Countermeasures Note Evaluation
Dry ESP(high temperature) There are some issues (increase the amount of treatment gas, heat resistant material for high temperature usage, heat extension and contraction).
-
Dry ESP(low temperature) Need to pay attention to lower dust collection efficiency due to high resistivity of dust. +
Dry ESP(low-low temperature) Enable to compactify by decreasing amount of treatment gas. Adopted with wet FGD. +
Wet ESP Need to prepare large amount of water. Not suitable for high concentration dust. -
Bag filter It needs to replace the filter periodically and the running cost is high. There is the possibility of clogging according to ash conditions.
-
Source: PSMP Study Team
18-75
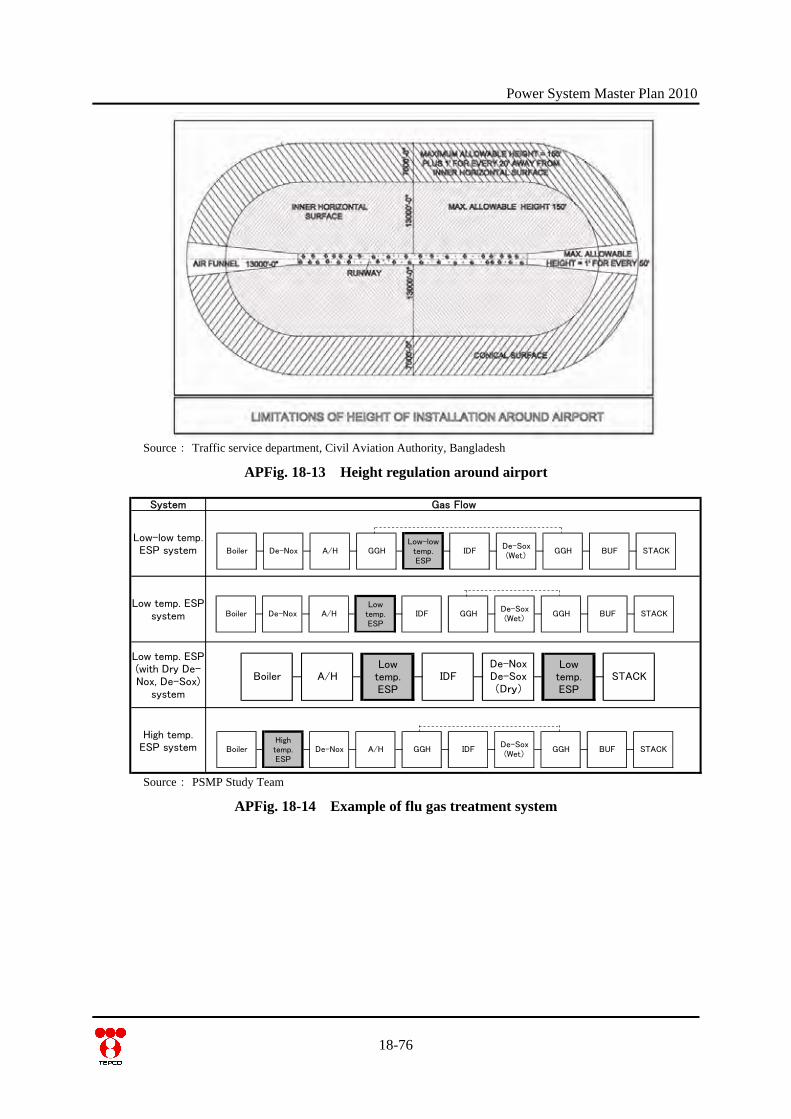
Power System Master Plan 2010
Source: Traffic service department, Civil Aviation Authority, Bangladesh
APFig. 18-13 Height regulation around airport
System Gas Flow
Low-low temp.ESP system
Low temp. ESPsystem
Low temp. ESP(with Dry De-Nox, De-Sox)
system
High temp.ESP system
GGH BUF STACKBoiler De-Nox A/H GGHLow-low
temp.ESP
IDFDe-Sox(Wet)
GGH BUF STACKBoiler De-Nox A/H GGHLowtemp.ESP
IDFDe-Sox(Wet)
IDFDe-NoxDe-Sox(Dry)
Lowtemp.ESP
Boiler A/HLowtemp.ESP
STACK
GGH BUF STACKBoiler De-Nox A/H GGHHightemp.ESP
IDFDe-Sox(Wet)
Source: PSMP Study Team
APFig. 18-14 Example of flu gas treatment system
18-76
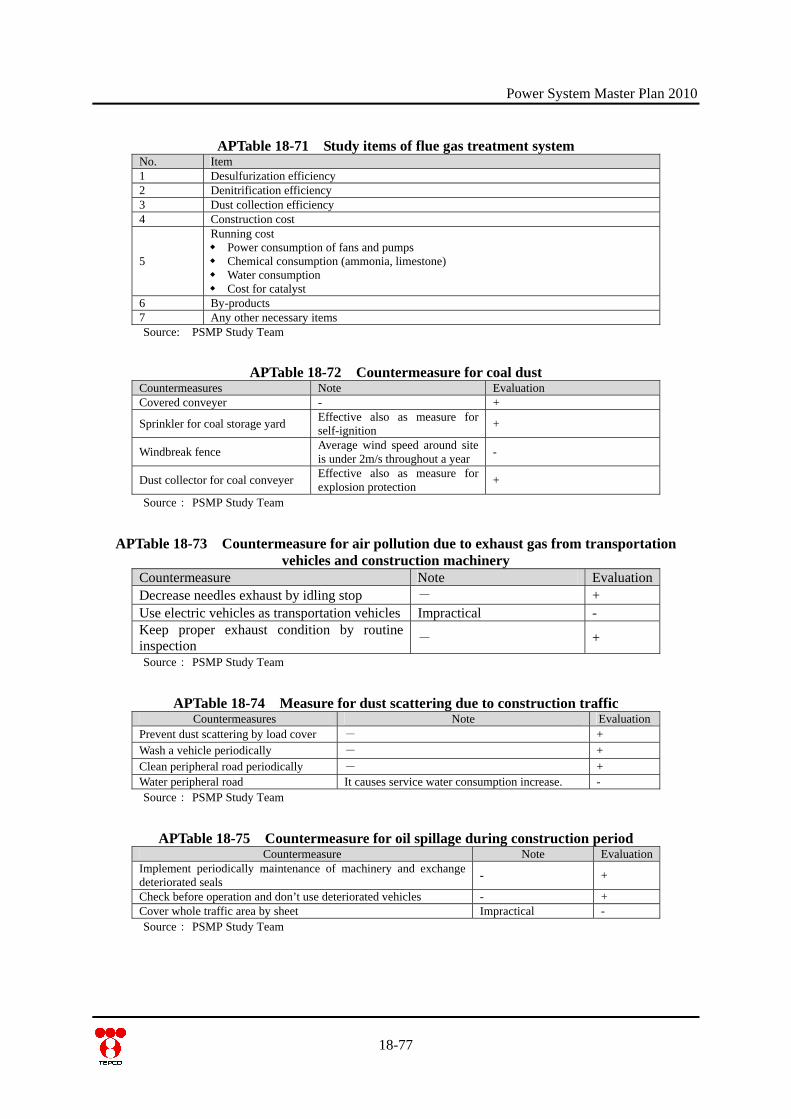
Power System Master Plan 2010
APTable 18-71 Study items of flue gas treatment system No. Item 1 Desulfurization efficiency 2 Denitrification efficiency 3 Dust collection efficiency 4 Construction cost
5
Running cost Power consumption of fans and pumps Chemical consumption (ammonia, limestone) Water consumption Cost for catalyst
6 By-products 7 Any other necessary items Source: PSMP Study Team
APTable 18-72 Countermeasure for coal dust Countermeasures Note Evaluation Covered conveyer - +
Sprinkler for coal storage yard Effective also as measure for self-ignition +
Windbreak fence Average wind speed around site is under 2m/s throughout a year -
Dust collector for coal conveyer Effective also as measure for explosion protection +
Source: PSMP Study Team
APTable 18-73 Countermeasure for air pollution due to exhaust gas from transportation vehicles and construction machinery
Countermeasure Note Evaluation Decrease needles exhaust by idling stop - + Use electric vehicles as transportation vehicles Impractical - Keep proper exhaust condition by routine inspection - +
Source: PSMP Study Team
APTable 18-74 Measure for dust scattering due to construction traffic Countermeasures Note Evaluation
Prevent dust scattering by load cover - + Wash a vehicle periodically - + Clean peripheral road periodically - + Water peripheral road It causes service water consumption increase. - Source: PSMP Study Team
APTable 18-75 Countermeasure for oil spillage during construction period Countermeasure Note Evaluation
Implement periodically maintenance of machinery and exchange deteriorated seals - +
Check before operation and don’t use deteriorated vehicles - + Cover whole traffic area by sheet Impractical - Source: PSMP Study Team
18-77

Power System Master Plan 2010
APTable 18-76 Countermeasure for Noise and Vibration during construction period Countermeasure Note Evaluation
Level construction process and limit number of operation machinery at the same time - +
Use low-noise machinery ( silencer, muffler ) Effective though it costs + Lower vehicle speed when passing inhabitant neighborhood such as residential area - -
Put temporary sound barrier work place surroundings Impractical - Source: PSMP Study Team
APTable 18-77 Examples of by-product recycling By-product Examples of recycling
Coal ash (Fly ash) Cement mixture material, Soil improvement material, brick, tile
Gypsum Cement material, Gypsum board Source: PSMP Study Team
APTable 18-78 Air cooled condenser precedents to 600MW class thermal power plants in China
Plant Name Capacity Zangshan Electric Power 2unit of 600MW Datong Second plant 2unit of 660MW Yanshan Lake power plant 2unit of 600MW Source: PSMP Study Team
APTable 18-79 Items of environmental consideration regarding coal mine development
18-78
No. Item Content Example
Topsoil management
Scrap the topsoil prior to drilling and blasting Scraped topsoil should be used immediately for
plantation/agriculture If it is not possible to use the topsoil immediately,
then it should be stacked at a designated area. The topsoil heap’s height should not exceed more
than 6 meters. Storage must be done in a pyramidal form, with garland drains all around.
If the topsoil is to be stored for a long duration, it should have a vegetal cover of leguminous species.
Overburden management
Backfilling de-coaled areas Proper stacking and waste water treatment in the case
of internal overburden dump 1 Land Use
Land subsidence management
Planned subsidence by considering surface structures and human lives
Simultaneous backfilling de-coaled area Fencing of the subsidence zone during active mining
operation Filling of surface cracks and leveling of the area Preparing a subsidence monitoring program that
covers the impact of subsidence on surface and ground water and its management
Compensation to and rehabilitation of the affected people
2 Water Use Water conservation Plan the mines in such a way that the impact on water bodies as well the surface drainage system remain minimal
The area of influence of the cone of depression of groundwater should be estimated beforehand and the affected settlements should be provided with alternate
Power System Master Plan 2010
water supply Reinjection of prior drainage of the aquifer
Water pollution prevention
Reuse of mine seepage water to mining operation Effluents from the colony and the workshop should
be treated
3 Air environment
Air pollution prevention
Drills should be provided with dust extractors Water spray before blasting Covering of the trucks to avoid spillage Provision water sprinklers on haul roads Use covered crusher unloading point, the crusher
should be fitted with bag filter Closed conveyor transportation Put green belt around coal stock pile
4 Biodiversity Biodiversity conservation
Conduct sufficient biodiversity assessment at planning stage
If it necessary, biodiversity conservation and relocation or rehabilitation of protected species are conducted.
If the mining activity exercises high adverse impacts, then ‘No Mining’ is the best alternative.
5 Noise and vibration
Impact mitigation of noise and vibration to surrounding area and workers
Use of controlled and advanced blasting techniques Conducting blasting only during the day time, as per a
predetermined time schedule Reducing the exposure time of workers by practicing
work rotation Noise attenuation by green belt
6 Mine closure Proper mine closure plan
Plan of environmental pollution prevention after mine closure
Settling on final closure plan to create productive and sustainable land use of the mined area and accept the plan by stakeholders
Safety measure of drilling
Reduce workers exposure to noise and dust Wearing helmets, groves, earplugs, and masks Setting safety zone Prevent overburden collapse Prevent mine inundation (under ground mine)
Mine fires revention p
Organize initial fire fighting system Implement fire fighting training
Roof collapse prevention (applicable in underground mine)
Proper roof support design Mechanization of loading operations
7 Occupational health and safety issue
Worker’s health surveillance
Health survey programs for workers and local community
Regular training and awareness of employees Source:EIA Guidelines for Coal Mining 2009.3 DoE
18.6 Outline of simple diffusion calculation
(1) Summary A simple diffusion calculation regarding the SOX, SPM was conducted for the purpose of a rough impact analysis of the air environment by a 600MW coal-fired power plant based on this MP. Detailed diffusion calculation should be conducted after deciding on the site and the arrangements and specification of equipment appropriate to the site location’s climate are conducted.
(2) Methodology
(a) Fuel specification Two kinds of fuels, domestic coal and imported coal are selected as fuel. The specifications of domestic coal are determined from the analysis results of sample coal which were acquired from
18-79
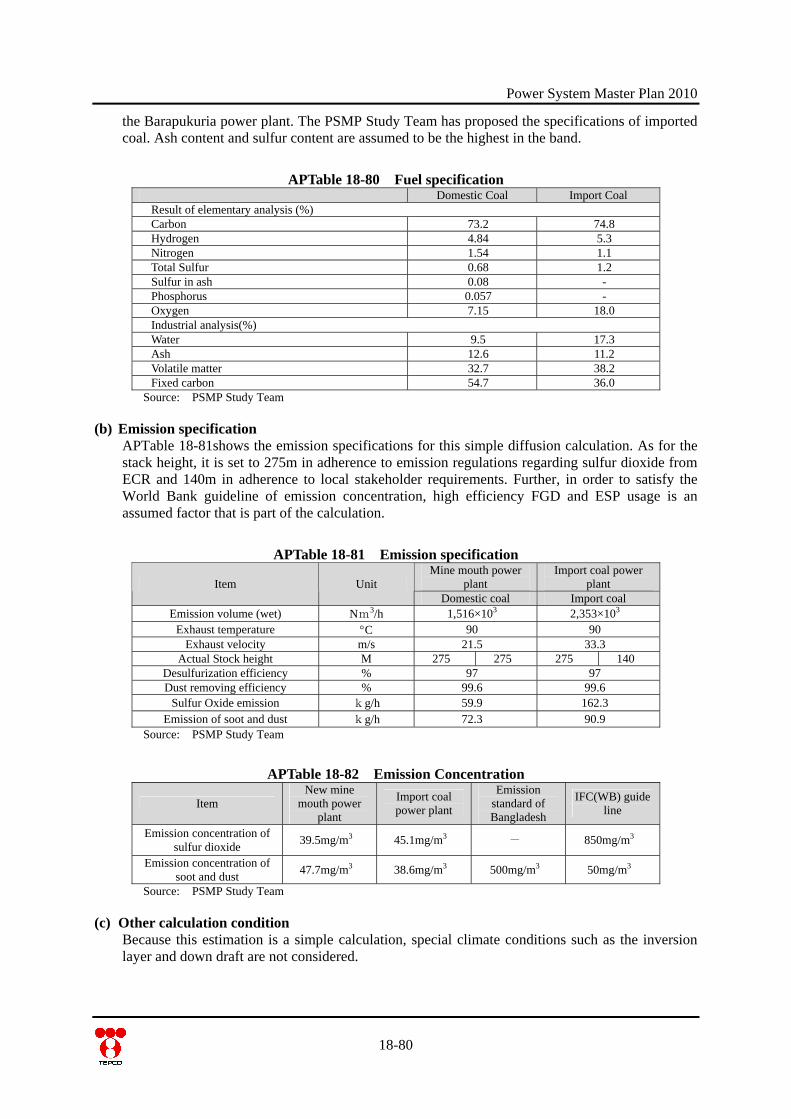
Power System Master Plan 2010
the Barapukuria power plant. The PSMP Study Team has proposed the specifications of imported coal. Ash content and sulfur content are assumed to be the highest in the band.
APTable 18-80 Fuel specification Domestic Coal Import Coal
Result of elementary analysis (%) Carbon 73.2 74.8 Hydrogen 4.84 5.3 Nitrogen 1.54 1.1 Total Sulfur 0.68 1.2 Sulfur in ash 0.08 - Phosphorus 0.057 - Oxygen 7.15 18.0 Industrial analysis(%) Water 9.5 17.3 Ash 12.6 11.2 Volatile matter 32.7 38.2 Fixed carbon 54.7 36.0
Source: PSMP Study Team
(b) Emission specification APTable 18-81shows the emission specifications for this simple diffusion calculation. As for the stack height, it is set to 275m in adherence to emission regulations regarding sulfur dioxide from ECR and 140m in adherence to local stakeholder requirements. Further, in order to satisfy the World Bank guideline of emission concentration, high efficiency FGD and ESP usage is an assumed factor that is part of the calculation.
APTable 18-81 Emission specification Mine mouth power
plant Import coal power
plant Item Unit Domestic coal Import coal
Emission volume (wet) Nm3/h 1,516×103 2,353×103 Exhaust temperature C 90 90
Exhaust velocity m/s 21.5 33.3 Actual Stock height M 275 275 275 140
Desulfurization efficiency % 97 97 Dust removing efficiency % 99.6 99.6
Sulfur Oxide emission kg/h 59.9 162.3 Emission of soot and dust kg/h 72.3 90.9
Source: PSMP Study Team
APTable 18-82 Emission Concentration
Item New mine
mouth power plant
Import coal power plant
Emission standard of Bangladesh
IFC(WB) guide line
Emission concentration of sulfur dioxide 39.5mg/m3 45.1mg/m3 - 850mg/m3
Emission concentration of soot and dust 47.7mg/m3 38.6mg/m3 500mg/m3 50mg/m3
Source: PSMP Study Team
(c) Other calculation condition Because this estimation is a simple calculation, special climate conditions such as the inversion layer and down draft are not considered.
18-80
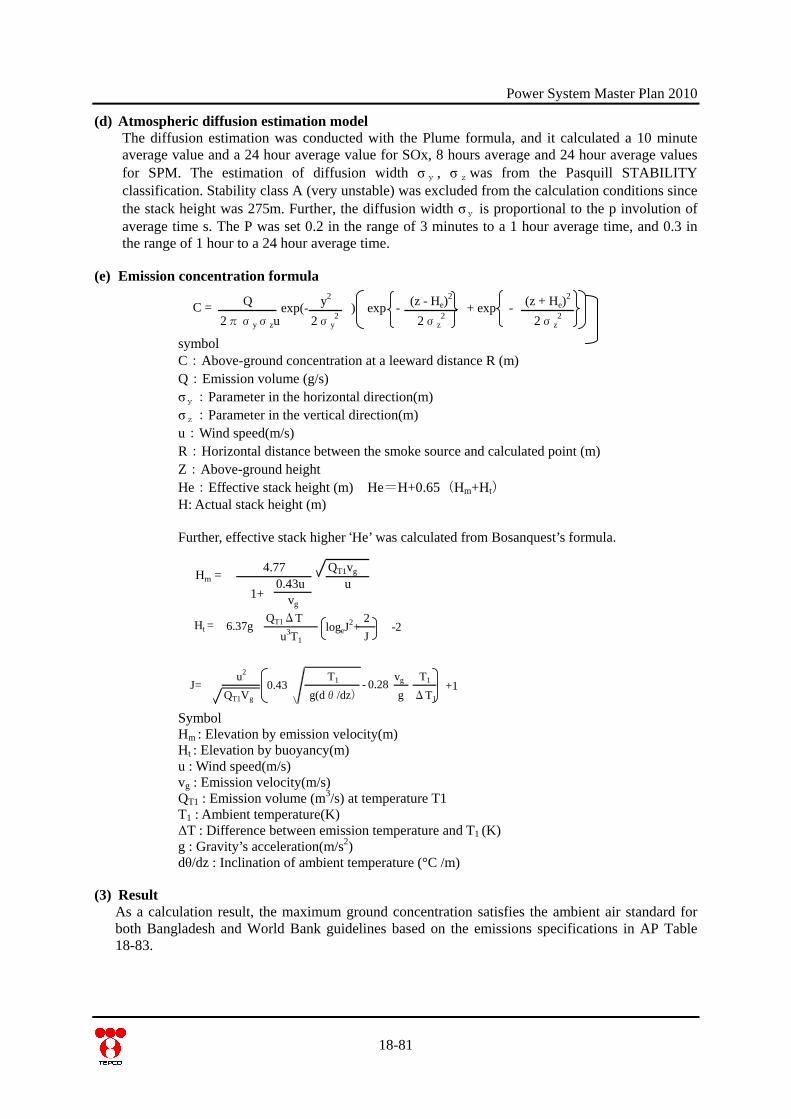
Power System Master Plan 2010
(d) Atmospheric diffusion estimation model The diffusion estimation was conducted with the Plume formula, and it calculated a 10 minute average value and a 24 hour average value for SOx, 8 hours average and 24 hour average values for SPM. The estimation of diffusion width σy , σzwas from the Pasquill STABILITY classification. Stability class A (very unstable) was excluded from the calculation conditions since the stack height was 275m. Further, the diffusion width σy is proportional to the p involution of average time s. The P was set 0.2 in the range of 3 minutes to a 1 hour average time, and 0.3 in the range of 1 hour to a 24 hour average time.
(e) Emission concentration formula
symbol C:Above-ground concentration at a leeward distance R (m) Q:Emission volume (g/s) σy:Parameter in the horizontal direction(m) σz:Parameter in the vertical direction(m) u:Wind speed(m/s) R:Horizontal distance between the smoke source and calculated point (m) Z:Above-ground height He:Effective stack height (m) He=H+0.65(Hm+Ht) H: Actual stack height (m) Further, effective stack higher ‘He’ was calculated from Bosanquest’s formula.
Symbol Hm : Elevation by emission velocity(m) Ht : Elevation by buoyancy(m) u : Wind speed(m/s) vg : Emission velocity(m/s) QT1 : Emission volume (m3/s) at temperature T1 T1 : Ambient temperature(K) ΔT : Difference between emission temperature and T1 (K) g : Gravity’s acceleration(m/s2) dθ/dz : Inclination of ambient temperature (°C /m)
Q y2 (z - He)2 (z + He)
2
2πσyσzu 2σy2 2σz
2 2σz2
C = exp(- ) exp - + exp -
QT1vg
0.43u uvg
4.77
1+Hm =
QT1ΔT 2u3T1 J
Ht = 6.37g logeJ2+ -2
u2 T1 vg T1
QT1Vg g(dθ/dz) g ΔT1 J= 0.43 - 0.28 +1
(3) Result As a calculation result, the maximum ground concentration satisfies the ambient air standard for both Bangladesh and World Bank guidelines based on the emissions specifications in AP Table 18-83.
18-81
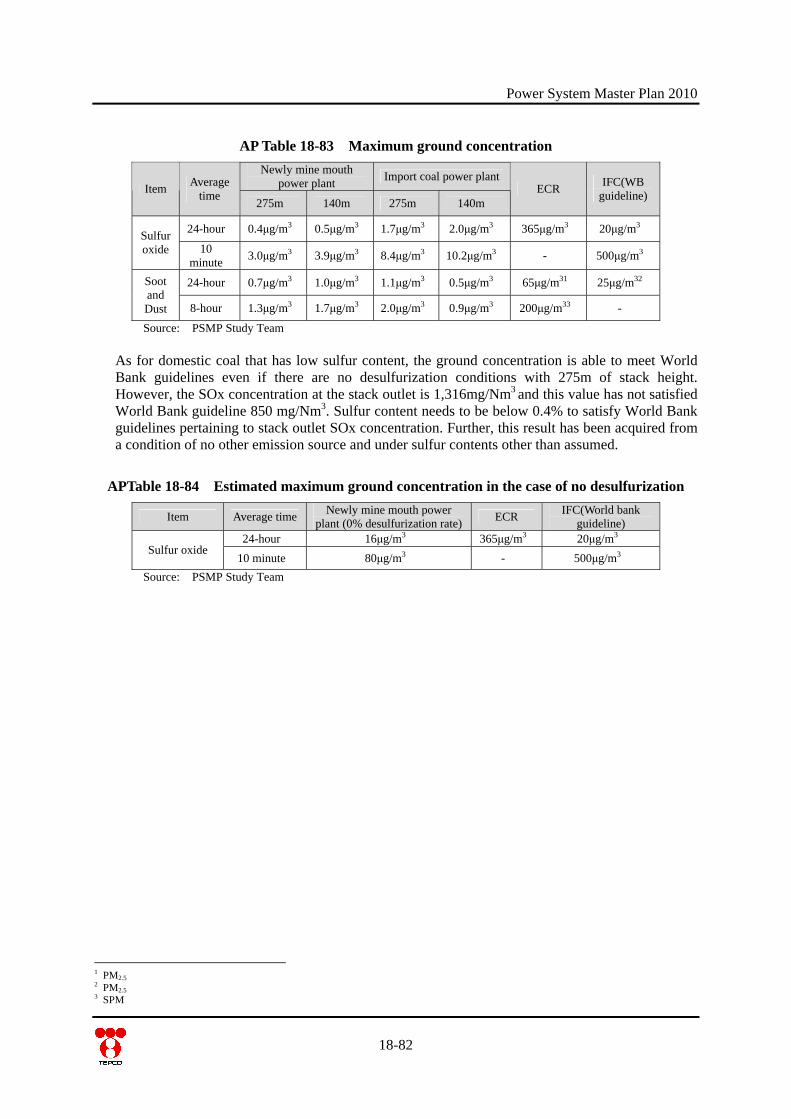
Power System Master Plan 2010
18-82
AP Table 18-83 Maximum ground concentration Newly mine mouth
power plant Import coal power plantItem Average
time 275m 140m 275m 140m ECR IFC(WB
guideline)
24-hour 0.4μg/m3 0.5μg/m3 1.7μg/m3 2.0μg/m3 365μg/m3 20μg/m3 Sulfur oxide 10
minute 3.0μg/m3 3.9μg/m3 8.4μg/m3 10.2μg/m3 - 500μg/m3
24-hour 0.7μg/m3 1.0μg/m3 1.1μg/m3 0.5μg/m3 65μg/m31 25μg/m32 Soot and Dust 8-hour 1.3μg/m3 1.7μg/m3 2.0μg/m3 0.9μg/m3 200μg/m33 -
Source: PSMP Study Team As for domestic coal that has low sulfur content, the ground concentration is able to meet World Bank guidelines even if there are no desulfurization conditions with 275m of stack height. However, the SOx concentration at the stack outlet is 1,316mg/Nm3 and this value has not satisfied World Bank guideline 850 mg/Nm3. Sulfur content needs to be below 0.4% to satisfy World Bank guidelines pertaining to stack outlet SOx concentration. Further, this result has been acquired from a condition of no other emission source and under sulfur contents other than assumed.
APTable 18-84 Estimated maximum ground concentration in the case of no desulfurization
Item Average time Newly mine mouth power plant (0% desulfurization rate) ECR IFC(World bank
guideline) 24-hour 16μg/m3 365μg/m3 20μg/m3
Sulfur oxide 10 minute 80μg/m3 - 500μg/m3
Source: PSMP Study Team
1 PM2.5 2 PM2.5 3 SPM
Power System Master Plan 2010
18.7 Terms of Reference for Resettlement Action Plan (DRAFT) Table of Contents Definition of Terms Introduction Scope of Land Acquisition and Resettlement Measures to minimize Land Acquisition and Losses Resettlement Policy and Entitlement Resettlement Site Income Restoration Program Implementation Arrangement Implementation Schedule Participation and Consultation Monitoring and Supervision Grievance Redress Cost Estimate Definition of Terms Resettlement Plan is a time-bound action plan with resettlement strategy, objectives, impact, entitlement, socio-economic survey, policy framework, legal framework, measures to minimize impacts, resettlement site, compensation, income restoration, resettlement implementation arrangement, resettlement schedule, participation and consultation, grievance redresses, monitoring and evaluation, monitoring and evaluation, and possibly indigenous people development plan. Project Affected Persons (PAPs) indicates any juridical person being as it may an individual, a household, a firm or a private or public who, on account of the execution of the project, or any of its components or sub-projects or parts thereof would have their: right, title or interest in any house, land or any other asset acquired or possessed, in full or in part; or business, occupation, work, place of residence or habitat adversely affected; or standard of living adversely affected. Compensation means payment in cash or n kind to replace losses of land, housing, income, and other assets caused by a project. Entitlement defines a right to receive mitigation measures such as compensation, income restoration, relocation assistance, and other support. Income restoration/Livelihood restoration/Rehabilitation means the process to restore income earning capacity, production levels and living standards in a longer term. Replacement cost is the method of valuation of assets that helps determine the amount sufficient to replace lost assets and cover transaction costs. For agricultural land, it is the pre-project or pre-displacement, whichever is higher, market value of land of equal productive potential or use located in the vicinity of the affected land, plus the cost of preparing the land to levels similar to those of the affected land, plus the cost of any registration and transfer taxes. For land in urban areas, it is the pre-displacement market value of land of equal size and use, with similar or improved public infrastructure facilities and services and located in the vicinity of the affected land, plus the cost of any registration and transfer taxes. For houses and other structures, it is the market cost of the materials to build a replacement structure with an area and quality similar to or better than those of the affected structure, or to repair a partially affected structure, plus the cost of transporting building materials to the construction site, plus the cost of any labor
18-83
Power System Master Plan 2010
and contractors' fees, plus the cost of any registration and transfer taxes. In determining the replacement cost, depreciation of the asset and the value of salvage materials are not taken into account, nor is the value of benefits to be derived from the project deducted from the valuation of an affected asset. Census is a data collection technique of completing enumeration of all PAPs and their assets through household questionnaire. Census’s objectives are (i) to prepare a complete inventory of PAPs and their assets as a basis for compensation, (ii) to identify non-entitled persons, and (iii) to minimize impact of later influx of “outsiders” to project area. Socio-economic survey is carried out in order to prepare profile of PAPs and to prepare for Basic Resettlement Plan. About 20 percent sample of PAPs population is surveyed through household questionnaire. The survey result is used (i) to assess incomes, identify productive activities, and plan for income restoration, (ii) to develop relocation options, and (iii) to develop social preparation phase for vulnerable groups. Cut-off date determine eligibility for entitlement. It is normally the date census begins. The cut-off date could also be the date the project area was delineated, prior to the census, provided that there has been an effective public dissemination of information on the area delineated, and systematic and continuous dissemination subsequent to the delineation to prevent further population influx. Vulnerable group is defined as the indigenous people, ethnic minorities, the poorest, women, children, the aged, the disabled, and other socially/economically vulnerable groups who would be adversely affected from a project. Grievance Redress procedures set out the time frame and mechanisms for resolutions of complaints about resettlement from PAPs. Grievance redress can be provided through informally-constituted local committees with representation from key stakeholder groups. Grievances can also be addressed through formal channels, with unresolved grievances being dealt with at progressively higher levels. Introduction Project Scope Project background Objectives of the project Project Scope Project location map 1.2 Objectives of Resettlement Land acquisition and resettlement principles and objectives Consideration under the “JBIC Guidelines for Confirmation of Environmental and Social Considerations (2002. 4)” Legal framework Scope of Land Acquisition and Resettlement Land acquisition Map of the area and villages affected by land acquisition Total land area acquired for the project Population/households affected from land acquisition and resettlement Total number of PAPs Size of relocation (number of population/households to be relocated) Size of those who lose their assets Size of those whose business, occupation, work are adversely affected Socio-economic profiles of PAPs Size, gender, age, number of school children of each household Occupation and means of livelihood Income level and economic activities of PAPs, including vulnerable groups Race, language, religion
18-84
Power System Master Plan 2010
Social support system, infrastructure of the community Needs of PAPs regarding the income restoration program and relocation Perception towards the project and resettlement, etc. Census and Inventory of losses Demographic, education, income and occupational profiles of PAPs Land type and land use(agricultural, residential, commercial land) Type of crops and trees Buildings type (size, materials used) Inventory of common property resources Inventory of assets to be acquired Existing civic facilities and infrastructure, etc. Information on those without legal title to land or assets Measures to minimize Land Acquisition and Losses Actions and measures to be conducted for minimizing impact Consideration of alternatives with special attention to avoid and minimize involuntary resettlement Resettlement Policy and Entitlement Compensation policy Eligibility for compensation/assistance/rehabilitation Entitlement Matrix Assistance, support, compensation options Cut-off date Compensation/assistance policy towards those who without legal title Resettlement Site Method of site selection and site alternatives Location, layout, and design of resettlement site Resettlement site development (infrastructure, social service, etc.) Income Restoration Program Background of Income Restoration Objective and policy of income restoration Income Restoration Program Constraints and opportunities for income generation Analysis of needs, capacity, and existing skills of PAPs Analysis of economic activities of PAPs and communities Consultation and participation process On-going income-generating or livelihood development programs (e.g., poverty alleviation) in the project area Provisions for group-specific, targeted income restoration plans (e.g., microcredit or small development) Income restoration options Financial source of income restoration plans Implementing arrangement of the program (e.g., assistance from government agencies, community organizations, NGO, or CBO) Consideration of vulnerable people Program implementing schedule Monitoring Implementation Arrangement Responsibilities and roles of related organization (organizations in charge of Basic Resettlement Plan preparation, resettlement execution, land acquisition, monitoring, consultation, resettlement site preparation, income restoration, etc.) Description of cooperation between related organization (e.g., coordination between an executing agency and NGO/CBO.
18-85
Power System Master Plan 2010
Implementation Schedule Schedule of resettlement-related activities (see attachment for sample schedule form) Participation and Consultation Policy of participation and consultation Place, timing, method, topics, meeting memorandum of public consultation meeting held in the past (including PAPs’ opinion regarding the project and resettlement) Plan of participation and consultation Leaflet of resettlement distributed to PAPs, including followings: Objectives of the Project Service area of the Project and Project site Cost estimation and sources of capital Project Implementation Planning (i.e., F/S, EIA, and Basic Resettlement Plan preparation) Project Impact Definition of Eligibility Resettlement and compensation principles Compensation policy Subsidize allowances Settling complain (Grievance Redress procedure) Note: Leaflet should be attached in the Annexes. Monitoring and Supervision Monitoring of flowing aspects: Performance monitoring: physical progress against milestones established in the Resettlement Plan Impact monitoring: assessment for the effects of resettlement (effectiveness of the Resettlement Plan and its implementation in meeting the needs of the PAPs) Internal performance monitoring process (method, indicators, period, frequency, implementation arrangement of the monitoring) Methodology of for external monitoring Frequency of reporting and content for internal and external monitoring Evaluation method of monitoring result Process for integrating feedback from internal monitoring into implementation Grievance Redress Step-by-step process for registering and addressing grievances and specific details regarding a cost-free process for registering complaints, response time, and communication modes Mechanism for appeal Provisions for approaching civil courts if other options fail Cost Estimate Statement of financial responsibility and authority Source of funds and the flow of funds Estimated budget, by cost and by item, for all resettlement costs including planning and implementation, management and administration, monitoring and evaluation and contingencies Provisions to account for physical and price contingencies
18.8 Terms of Reference for Environmental Impact Assessment (DRAFT)
18.8.1 Objective: To conduct an EIA study regarding the coal-fired power project (600MW 2-3units) planned in PSMP2010.
18-86
Power System Master Plan 2010
18-87
18.8.2 Scope of Work The scope of work covers mainly the EIA study of proposed project. The study should specifically include the following: A review of the findings of the IEE study concentrating on important environmental components which are likely to be impacted from the project. To collect baseline environmental and social condition data from both primary and secondary data. To conduct a detailed air quality assessment To conduct ambient noise monitoring To conduct a surface water and ground water laboratory analysis. To implement Thermal Plume modeling regarding the proposed coal fired power plant To conduct a laboratory analysis of the dredged river, sea or pond material To conduct an ecological survey To review Bangladesh’s cyclonic storms To conduct a road and river traffic survey To implement a detailed land-use survey conducted utilizing an appropriate method (e.g. spatial decision support system) To assess environmental and social impacts and study mitigation or avoidance measures To prepare an environmental management plan (EMP) which should include mitigation measures, enhancement measures compensation measures and an environmental monitoring plan
18.8.3 Content of EIA study report EIA study report should include following: Policy and Legislation related to environmental issues in Bangladesh The role of the Department of Environment in the institutional analysis A detailed study on the potential impacts, mitigation measures and environmental
management plan Environmental monitoring reports and final evaluation report of the project Identification and Analysis of Potential Impacts Analysis and Description of the Mitigation Measures A detailed technical and financial proposal shall be operated by the proponent’s own
resources (equipments and expertise) Other necessary information