Chapter 1. A forward-looking assessment of social protection ...
47
CHAPTER 1. A FORWARD-LOOKING ASSESSMENT OF SOCIAL PROTECTION NEEDS │ 21 SOCIAL PROTECTION SYSTEM REVIEW OF KYRGYZSTAN © OECD 2018 Chapter 1. A forward-looking assessment of social protection needs Following the shock of the collapse of the Soviet Union and the disruption caused by the rapid transition to a market economy, Kyrgyzstan is enjoying a period of economic and political stability. However, the decline in income poverty has slowed over the past decade and certain measures of broader deprivation are alarmingly high, reflecting the challenge of improving services in a context of severe fiscal constraints. Tight labour market conditions are resulting in high levels of international migration, which is a boon for the Kyrgyz economy but socially disruptive. Major long-term threats related to demographics and climate change are on the horizon.
-
Upload
khangminh22 -
Category
Documents
-
view
0 -
download
0
Transcript of Chapter 1. A forward-looking assessment of social protection ...
CHAPTER 1. A FORWARD-LOOKING ASSESSMENT OF SOCIAL PROTECTION NEEDS │ 21
SOCIAL PROTECTION SYSTEM REVIEW OF KYRGYZSTAN © OECD 2018
Chapter 1. A forward-looking assessment of social protection needs
Following the shock of the collapse of the Soviet Union and the disruption caused by the
rapid transition to a market economy, Kyrgyzstan is enjoying a period of economic and
political stability. However, the decline in income poverty has slowed over the past
decade and certain measures of broader deprivation are alarmingly high, reflecting the
challenge of improving services in a context of severe fiscal constraints. Tight labour
market conditions are resulting in high levels of international migration, which is a boon
for the Kyrgyz economy but socially disruptive. Major long-term threats related to
demographics and climate change are on the horizon.
22 │ CHAPTER 1. A FORWARD-LOOKING ASSESSMENT OF SOCIAL PROTECTION NEEDS
SOCIAL PROTECTION SYSTEM REVIEW OF KYRGYZSTAN © OECD 2018
Since the collapse of the Union of Soviet Socialist Republics (USSR) in 1991,
Kyrgyzstan has undergone fundamental political, economic and social changes. Its rapid
transition to a market economy initially compounded the economic shock caused by the
fall of the USSR, on which Kyrgyzstan had relied heavily both as trade partner and
provider of fiscal subsidies. Further shocks in the 1990s and 2000s – internal and
external, political and economic – disrupted Kyrgyzstan’s emergence as an independent
state. However, since 2010, the country has enjoyed a prolonged period of political and
economic stability, attaining middle-income status in 2014.
Social protection has been at the centre of government policy before and since
independence. It is the single-largest component of public spending – exceeding
expenditure on health and education expenditure combined – and comprises a large range
programmes to cover a wide array of risks. However, social protection is still
transitioning from a Soviet-era system, premised on full employment, to one appropriate
for Kyrgyzstan’s current population.
This Chapter discusses the current context of social protection policy in Kyrgyzstan and
assesses how it might evolve in the future. It examines the dynamics and determinants of
poverty and inequality, explores how basic services have responded to dramatic
reductions in resources since the collapse of the USSR and conducts a forward-looking
analysis of the risks confronting different groups at different stages of the lifecycle and
the economy as a whole.
Decline in poverty stalled after 2008 but resumed in 2016
Poverty is a long-standing challenge for Kyrgyzstan, though its position on major
international trade routes has allowed it to benefit from the economic might of its
neighbours throughout its history. Natural resources, particularly gold and water, make
important contributions to the economy but are either not as abundant as in some
neighbouring countries or are far harder to access due to Kyrgyzstan’s mountainous
terrain.
Kyrgyzstan was among the poorest republics when the Soviet Union collapsed. Although
Soviet authorities were not transparent regarding poverty levels in the USSR, Goskomstat
(the state statistical agency) calculated that 33% of the Kyrgyz population was
“underprovisioned” in 1989 – roughly the same rate as in 2015 (Pomfret, 1999[1]).
The collapse of the Soviet Union led to successive and dramatic contractions in
Kyrgyzstan’s economy in the early 1990s. A rapid increase in poverty was compounded
by the shock liberalisation of the economy, which exacerbated the collapse in
employment, and by the abrupt termination of transfers from the Soviet Union.
Having undergone the most rapid transition of any former republic (Hoen, 2010[2]), the
economy stabilised towards the middle of the decade, with foreign lenders providing
substantial support. The situation worsened dramatically with the 1998 Russian financial
crisis. The economy was more stable in the 2000s, although growth rates still fluctuated.
CHAPTER 1. A FORWARD-LOOKING ASSESSMENT OF SOCIAL PROTECTION NEEDS │ 23
SOCIAL PROTECTION SYSTEM REVIEW OF KYRGYZSTAN © OECD 2018
Box 1.1. National and international poverty measures and terms used in this report
Monetary or income poverty: Poverty status based on either household
consumption or income as household welfare metrics.
Overall poverty line (OPL): This poverty line is monetary and calculated
using data from the Kyrgyz Integrated Household Survey, drawing upon
expenditures for food, non-food items, services, and durable goods. For
2015, the value of a bundle of food and non-food goods and services that
ensure a certain minimum level of consumption yielding the general
national per capita monthly poverty line was KGS 2 631, equivalent to
USD 40.80 per capita (current USD).
Vulnerability line: The vulnerability line is equal to 1.5 times the
national poverty line.
Extreme poverty line (EPL): The monetary equivalent of food needed to
ensure 2100 kcal per person per day as per the World Health
Organization’s minimum caloric intake requirements for transitional
economies. In general, the value of the extreme poverty line is set at
approximately two times less than that of the OPL.
Subsistence minimum (SM): The value of a minimum bundle of food
and non-food goods and services necessary for livelihood and for
maintaining health, including mandatory taxes and duties. The subsistence
minimum is estimated quarterly on per capita basis for the following
population groups: total population; able-bodied population (female, male,
altogether); population of retirement age; and children (0-7, 7-14,
14-17 years old, and altogether). Each of these thresholds is calculated at
the national level and separately for its seven oblasts and Bishkek.
Global poverty lines: Poverty lines defined by the World Bank based on the
15 poorest countries in 2005. Until 2015, the poverty line was set at
USD 1.25/day; in 2005 Purchasing Power Parity (PPP, computed on the basis
of price data across the world), with an upper poverty line set at USD 2/day.
Following an update of 2011 prices, the poverty line is now set at
USD 1.90/day in 2011 PPP, with an upper poverty line set at USD 3.20/day.
Multi-dimensional or non-income poverty: Poverty status based on deprivations
of a household in areas beyond monetary poverty.
The Oxford Poverty and Human Development Initiative (OPHI) multi-
dimensional Poverty Index (MPI) covers three areas: education, health
and standard of living through 10 indicators. The indicators are weighted
to create a deprivation score: a deprivation score of 33.3% indicates multi-
dimensional poverty, a score of 50% or more indicates severe multi-
dimensional poverty, and a score between 20-33.3% indicates near multi-
dimensional poverty.
The United Nations Development Programme (UNDP) Human
Development Index (HDI) covers three areas: health, education and
standard of living. It is a summary measure based on the geometric mean
of normalised indices for each dimension (life expectancy at birth, average
and expected years of schooling, gross national income per capita).
24 │ CHAPTER 1. A FORWARD-LOOKING ASSESSMENT OF SOCIAL PROTECTION NEEDS
SOCIAL PROTECTION SYSTEM REVIEW OF KYRGYZSTAN © OECD 2018
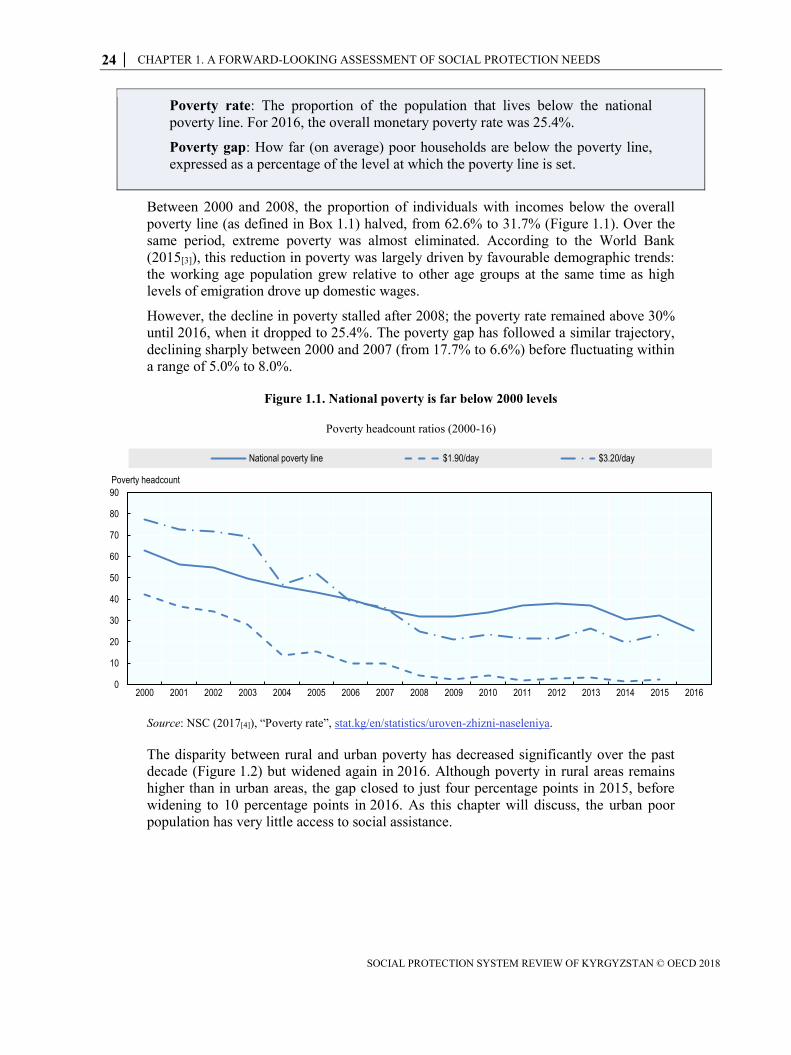
Poverty rate: The proportion of the population that lives below the national
poverty line. For 2016, the overall monetary poverty rate was 25.4%.
Poverty gap: How far (on average) poor households are below the poverty line,
expressed as a percentage of the level at which the poverty line is set.
Between 2000 and 2008, the proportion of individuals with incomes below the overall
poverty line (as defined in Box 1.1) halved, from 62.6% to 31.7% (Figure 1.1). Over the
same period, extreme poverty was almost eliminated. According to the World Bank
(2015[3]), this reduction in poverty was largely driven by favourable demographic trends:
the working age population grew relative to other age groups at the same time as high
levels of emigration drove up domestic wages.
However, the decline in poverty stalled after 2008; the poverty rate remained above 30%
until 2016, when it dropped to 25.4%. The poverty gap has followed a similar trajectory,
declining sharply between 2000 and 2007 (from 17.7% to 6.6%) before fluctuating within
a range of 5.0% to 8.0%.
Figure 1.1. National poverty is far below 2000 levels
Poverty headcount ratios (2000-16)
Source: NSC (2017[4]), “Poverty rate”, stat.kg/en/statistics/uroven-zhizni-naseleniya.
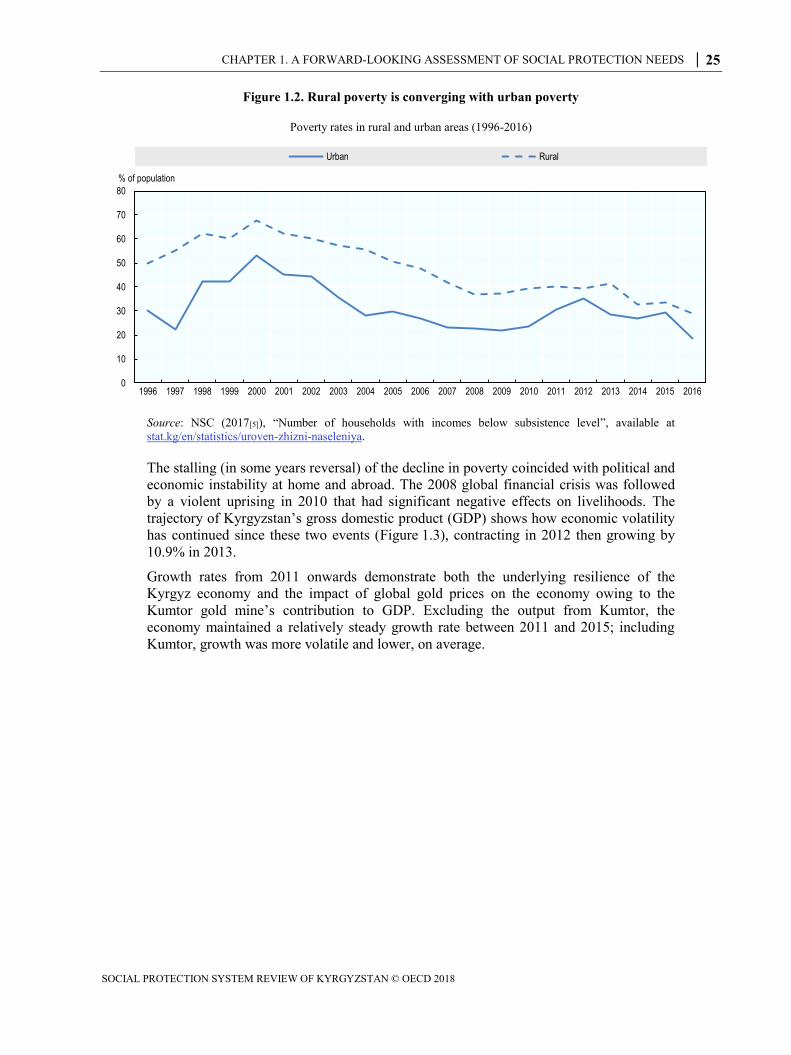
The disparity between rural and urban poverty has decreased significantly over the past
decade (Figure 1.2) but widened again in 2016. Although poverty in rural areas remains
higher than in urban areas, the gap closed to just four percentage points in 2015, before
widening to 10 percentage points in 2016. As this chapter will discuss, the urban poor
population has very little access to social assistance.
0
10
20
30
40
50
60
70
80
90
2000 2001 2002 2003 2004 2005 2006 2007 2008 2009 2010 2011 2012 2013 2014 2015 2016
Poverty headcount
National poverty line $1.90/day $3.20/day
CHAPTER 1. A FORWARD-LOOKING ASSESSMENT OF SOCIAL PROTECTION NEEDS │ 25
SOCIAL PROTECTION SYSTEM REVIEW OF KYRGYZSTAN © OECD 2018
Figure 1.2. Rural poverty is converging with urban poverty
Poverty rates in rural and urban areas (1996-2016)
Source: NSC (2017[5]), “Number of households with incomes below subsistence level”, available at
stat.kg/en/statistics/uroven-zhizni-naseleniya.
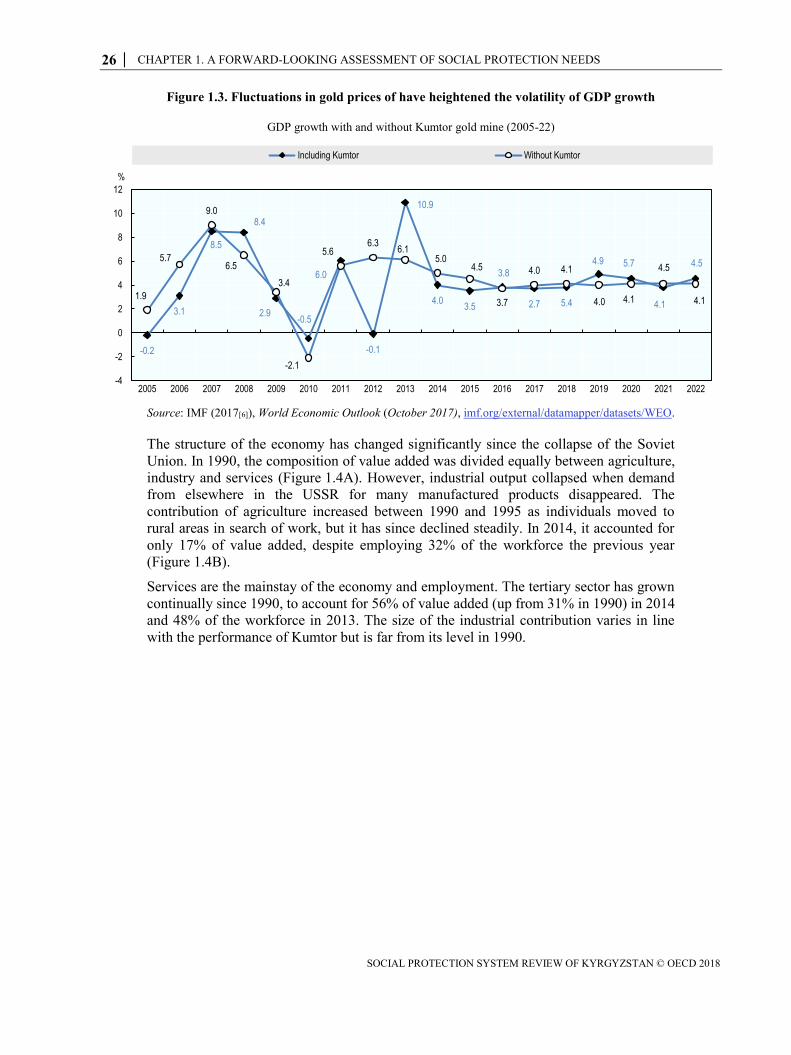
The stalling (in some years reversal) of the decline in poverty coincided with political and
economic instability at home and abroad. The 2008 global financial crisis was followed
by a violent uprising in 2010 that had significant negative effects on livelihoods. The
trajectory of Kyrgyzstan’s gross domestic product (GDP) shows how economic volatility
has continued since these two events (Figure 1.3), contracting in 2012 then growing by
10.9% in 2013.
Growth rates from 2011 onwards demonstrate both the underlying resilience of the
Kyrgyz economy and the impact of global gold prices on the economy owing to the
Kumtor gold mine’s contribution to GDP. Excluding the output from Kumtor, the
economy maintained a relatively steady growth rate between 2011 and 2015; including
Kumtor, growth was more volatile and lower, on average.
0
10
20
30
40
50
60
70
80
1996 1997 1998 1999 2000 2001 2002 2003 2004 2005 2006 2007 2008 2009 2010 2011 2012 2013 2014 2015 2016
% of population
Urban Rural
26 │ CHAPTER 1. A FORWARD-LOOKING ASSESSMENT OF SOCIAL PROTECTION NEEDS
SOCIAL PROTECTION SYSTEM REVIEW OF KYRGYZSTAN © OECD 2018
Figure 1.3. Fluctuations in gold prices of have heightened the volatility of GDP growth
GDP growth with and without Kumtor gold mine (2005-22)
Source: IMF (2017[6]), World Economic Outlook (October 2017), imf.org/external/datamapper/datasets/WEO.
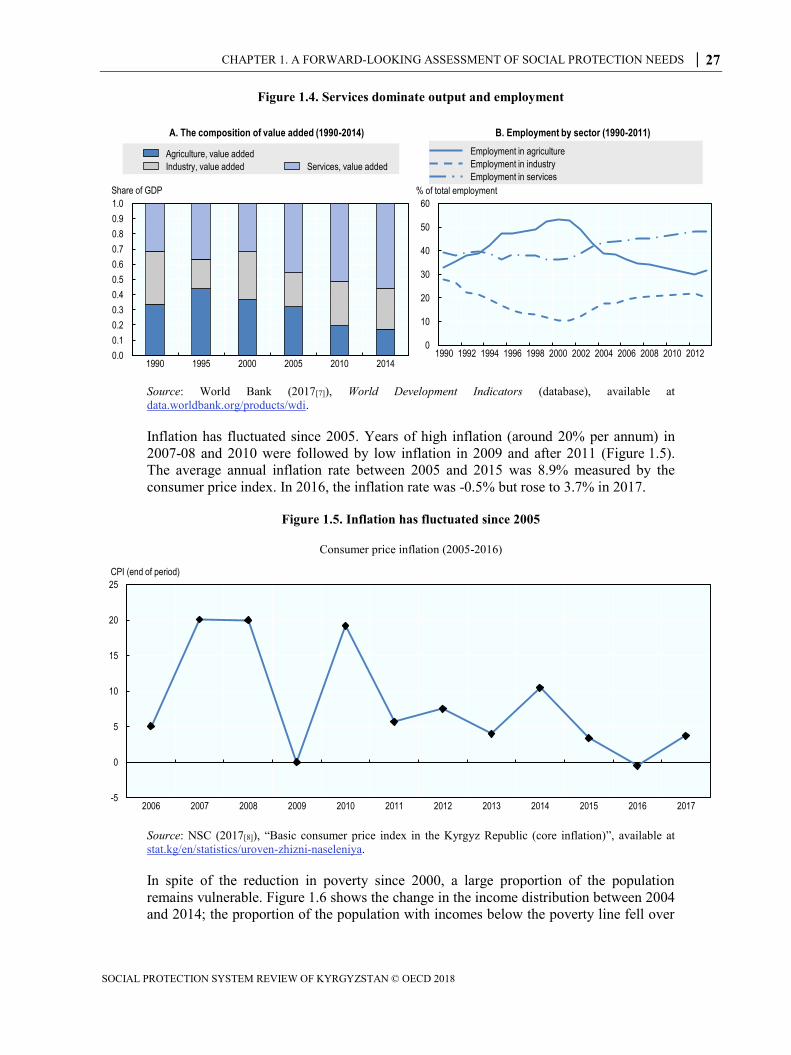
The structure of the economy has changed significantly since the collapse of the Soviet
Union. In 1990, the composition of value added was divided equally between agriculture,
industry and services (Figure 1.4A). However, industrial output collapsed when demand
from elsewhere in the USSR for many manufactured products disappeared. The
contribution of agriculture increased between 1990 and 1995 as individuals moved to
rural areas in search of work, but it has since declined steadily. In 2014, it accounted for
only 17% of value added, despite employing 32% of the workforce the previous year
(Figure 1.4B).
Services are the mainstay of the economy and employment. The tertiary sector has grown
continually since 1990, to account for 56% of value added (up from 31% in 1990) in 2014
and 48% of the workforce in 2013. The size of the industrial contribution varies in line
with the performance of Kumtor but is far from its level in 1990.
-0.2
3.1
8.5
8.4
2.9-0.5
6.0
-0.1
10.9
4.03.5
3.8
2.7 5.4
4.9 5.7 4.5 4.5
1.9
5.7
9.0
6.5
3.4
-2.1
5.66.3
6.15.0
4.5
3.7
4.0 4.1
4.0 4.14.1 4.1
-4
-2
0
2
4
6
8
10
12
2005 2006 2007 2008 2009 2010 2011 2012 2013 2014 2015 2016 2017 2018 2019 2020 2021 2022
%
Including Kumtor Without Kumtor
CHAPTER 1. A FORWARD-LOOKING ASSESSMENT OF SOCIAL PROTECTION NEEDS │ 27
SOCIAL PROTECTION SYSTEM REVIEW OF KYRGYZSTAN © OECD 2018
Figure 1.4. Services dominate output and employment
Source: World Bank (2017[7]), World Development Indicators (database), available at
data.worldbank.org/products/wdi.
Inflation has fluctuated since 2005. Years of high inflation (around 20% per annum) in
2007-08 and 2010 were followed by low inflation in 2009 and after 2011 (Figure 1.5).
The average annual inflation rate between 2005 and 2015 was 8.9% measured by the
consumer price index. In 2016, the inflation rate was -0.5% but rose to 3.7% in 2017.
Figure 1.5. Inflation has fluctuated since 2005
Consumer price inflation (2005-2016)
Source: NSC (2017[8]), “Basic consumer price index in the Kyrgyz Republic (core inflation)”, available at
stat.kg/en/statistics/uroven-zhizni-naseleniya.
In spite of the reduction in poverty since 2000, a large proportion of the population
remains vulnerable. Figure 1.6 shows the change in the income distribution between 2004
and 2014; the proportion of the population with incomes below the poverty line fell over
0.0
0.1
0.2
0.3
0.4
0.5
0.6
0.7
0.8
0.9
1.0
1990 1995 2000 2005 2010 2014
A. The composition of value added (1990-2014)
Share of GDP
Agriculture, value added
Industry, value added Services, value added
0
10
20
30
40
50
60
1990 1992 1994 1996 1998 2000 2002 2004 2006 2008 2010 2012
B. Employment by sector (1990-2011)
% of total employment
Employment in agriculture
Employment in industry
Employment in services
-5
0
5
10
15
20
25
2006 2007 2008 2009 2010 2011 2012 2013 2014 2015 2016 2017
CPI (end of period)
28 │ CHAPTER 1. A FORWARD-LOOKING ASSESSMENT OF SOCIAL PROTECTION NEEDS
SOCIAL PROTECTION SYSTEM REVIEW OF KYRGYZSTAN © OECD 2018
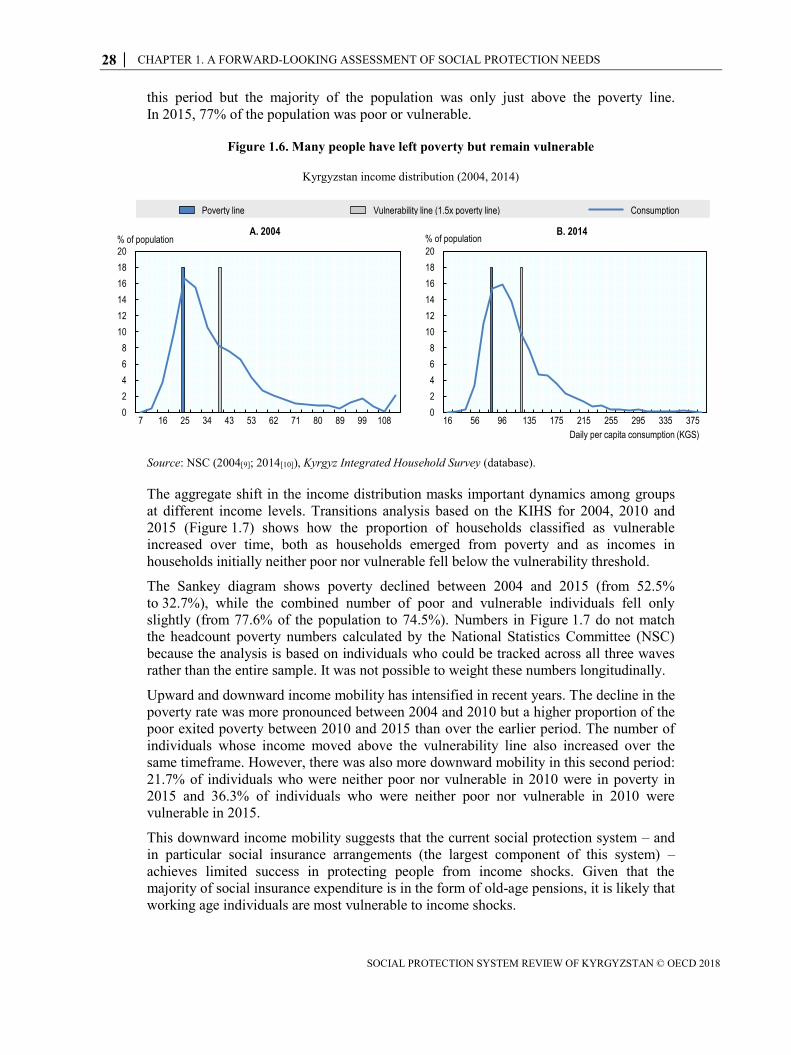
this period but the majority of the population was only just above the poverty line.
In 2015, 77% of the population was poor or vulnerable.
Figure 1.6. Many people have left poverty but remain vulnerable
Kyrgyzstan income distribution (2004, 2014)
Source: NSC (2004[9]; 2014[10]), Kyrgyz Integrated Household Survey (database).
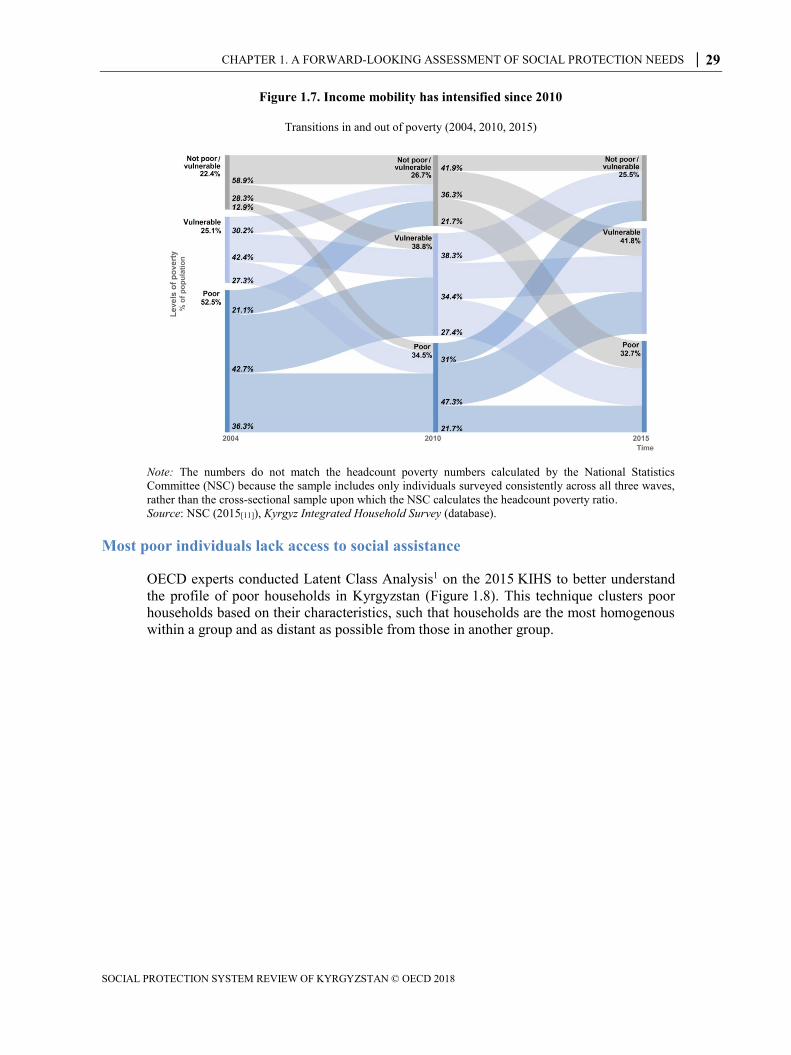
The aggregate shift in the income distribution masks important dynamics among groups
at different income levels. Transitions analysis based on the KIHS for 2004, 2010 and
2015 (Figure 1.7) shows how the proportion of households classified as vulnerable
increased over time, both as households emerged from poverty and as incomes in
households initially neither poor nor vulnerable fell below the vulnerability threshold.
The Sankey diagram shows poverty declined between 2004 and 2015 (from 52.5%
to 32.7%), while the combined number of poor and vulnerable individuals fell only
slightly (from 77.6% of the population to 74.5%). Numbers in Figure 1.7 do not match
the headcount poverty numbers calculated by the National Statistics Committee (NSC)
because the analysis is based on individuals who could be tracked across all three waves
rather than the entire sample. It was not possible to weight these numbers longitudinally.
Upward and downward income mobility has intensified in recent years. The decline in the
poverty rate was more pronounced between 2004 and 2010 but a higher proportion of the
poor exited poverty between 2010 and 2015 than over the earlier period. The number of
individuals whose income moved above the vulnerability line also increased over the
same timeframe. However, there was also more downward mobility in this second period:
21.7% of individuals who were neither poor nor vulnerable in 2010 were in poverty in
2015 and 36.3% of individuals who were neither poor nor vulnerable in 2010 were
vulnerable in 2015.
This downward income mobility suggests that the current social protection system – and
in particular social insurance arrangements (the largest component of this system) –
achieves limited success in protecting people from income shocks. Given that the
majority of social insurance expenditure is in the form of old-age pensions, it is likely that
working age individuals are most vulnerable to income shocks.
0
2
4
6
8
10
12
14
16
18
20
7 16 25 34 43 53 62 71 80 89 99 108
A. 2004% of population
0
2
4
6
8
10
12
14
16
18
20
16 56 96 135 175 215 255 295 335 375
Daily per capita consumption (KGS)
B. 2014% of population
Poverty line Vulnerability line (1.5x poverty line) Consumption
CHAPTER 1. A FORWARD-LOOKING ASSESSMENT OF SOCIAL PROTECTION NEEDS │ 29
SOCIAL PROTECTION SYSTEM REVIEW OF KYRGYZSTAN © OECD 2018
Figure 1.7. Income mobility has intensified since 2010
Transitions in and out of poverty (2004, 2010, 2015)
Note: The numbers do not match the headcount poverty numbers calculated by the National Statistics
Committee (NSC) because the sample includes only individuals surveyed consistently across all three waves,
rather than the cross-sectional sample upon which the NSC calculates the headcount poverty ratio.
Source: NSC (2015[11]), Kyrgyz Integrated Household Survey (database).
Most poor individuals lack access to social assistance
OECD experts conducted Latent Class Analysis1 on the 2015 KIHS to better understand
the profile of poor households in Kyrgyzstan (Figure 1.8). This technique clusters poor
households based on their characteristics, such that households are the most homogenous
within a group and as distant as possible from those in another group.
30 │ CHAPTER 1. A FORWARD-LOOKING ASSESSMENT OF SOCIAL PROTECTION NEEDS
SOCIAL PROTECTION SYSTEM REVIEW OF KYRGYZSTAN © OECD 2018
Figure 1.8. Few poor households receive social assistance
Latent Class Analysis clusters (2015)
Source: Author’s calculations based on NSC (2015[11]), Kyrgyz Integrated Household Survey (database).
LCA creates clusters of poor individuals based on a large number of variables, including
economic activity of the head of the household in which they reside (employed, disabled
pensioner, old-age pensioner, unemployed or inactive), presence of elderly dependants or
children in the household, marital status of the household head, place of residence (rural,
urban or Bishkek) and receipt of social protection benefits or private remittances. The
social protection category distinguishes between recipients of pensions, social assistance
or compensations for privileges.
The model identifies five household clusters:
The largest cluster of households (representing 45% of the poor) is predominantly
headed by young employed men who attended secondary school. Among this
cluster, 27% of household heads are aged 38 and under. The average household
size is 5.4 members. Upwards of 95% contain children under age 16, 41% contain
children under age 3 and just 2% contain elderly people. This group of
households is almost as likely to live in urban areas as in rural areas, with 24% in
Bishkek alone.
The second-largest cluster (representing 19% of the poor) is predominantly
headed by men receiving old age pensions (44%) or disability pensions (20%).
The average household size of this cluster (6.1 members) is the largest of the five
groups; 88% of these households contain children under the age of 16. Household
heads are not young: some 69% of them are aged 54 and above. Some 75% are in
rural areas, with the rest in urban areas outside Bishkek.
Among the third-largest cluster, representing 17% of the poor, 66% are headed by
women, and two-thirds of household heads are widows. Some 91% of household
heads are aged 54 and above, 75% receive old-age pensions, and 32% have low
Cluster 2:Largest households, old age and disability pensioners, outside Bishkek
Cluster 5:Smallest households, female-headed, pensioners, urban and rural
Cluster 4:Youngest families, high social assistance receipt, high dependency ratios, mostlyrural
Cluster 3:Households headed by female old age pensioners, some social assistance
Cluster 1: Working age, young families, no social benefits, urban and rural
CHAPTER 1. A FORWARD-LOOKING ASSESSMENT OF SOCIAL PROTECTION NEEDS │ 31
SOCIAL PROTECTION SYSTEM REVIEW OF KYRGYZSTAN © OECD 2018
education levels (primary or less). These households are second largest in size
(5.9 members) and are mostly in rural areas (67%).
Among households in the fourth-largest cluster, representing 14% of the poor,
97% are headed by men. This is the youngest cohort, with 32% of household
heads aged 38 and under. Although 80% of household heads are employed, this
cluster is by far the most likely to receive state benefits (64% receive some form
of social assistance). These households have the highest dependency ratios and
are the most likely to contain children under age 3 (46%). Some 87% are in rural
areas.
The fifth-largest cluster, representing 5% of the poor, is the oldest: 72% of
household heads are aged 64 and above. Household heads are overwhelmingly
women (85%), pensioners (100%) and widowed (85%). Education levels are the
lowest: 35% of household heads attained primary or less. Although 56% of
households have 5 members or more, this cluster has the smallest household size
on average (4.9 members) and is the least likely to contain children. This cluster is
the most urban, with 57% in cities (mostly Bishkek).
LCA demonstrates a major gap in the social protection system. Over 95% of households
in cluster 1, by far the largest cluster of poor households, do not receive either social
assistance or social insurance. Although they have young children, only a small
proportion is deemed eligible for the MBPF – the only poverty-targeted state benefit. On
the other hand, cluster 4, which is much smaller, is well covered by social assistance. This
disparity in coverage rates indicates a rural bias in the MBPF (discussed in Chapter 2).
Another key result related to social protection is a preponderance of poor households
receiving pensions. Pension coverage is universal in the three clusters where the
household head is elderly, equating to 40% of the poor population. While this might raise
questions about the adequacy of pension levels, the analysis also suggests the poverty-
alleviating impact of pensions is diminished by the number of individuals within a
household relying on this income.
Pensions appear, therefore, to be a vital source of income for both the elderly and for
other clusters with low income potential. Given the age of household heads, children
under age 16 are surprisingly numerous in households in the elderly clusters. LCA does
not identify three-generation or skip-generation (children living with grandparents)
households receiving pensions, but it does demonstrate pensions are a key source of
income for children as well as retirees.
Unemployment rates among household heads in the two younger clusters are 13.2% and
14.8%, respectively – above the average for the population as a whole but not by a wide
margin. In both cases, informality is the norm: 73% and 74% of household heads are in
informal employment in clusters 1 and 2, respectively. These household heads are
typically well educated: 79% of the more urban cluster attended secondary school, and
14% received some tertiary education, while 92% of the more rural cluster attended
secondary school. Nevertheless, it appears that the employment income of household
heads is not high enough to keep these households out of poverty.
Importantly, very few poor households receive remittances: less than 10% of households,
on average, across the five clusters. This finding should mitigate concerns that public
transfers crowd out private transfers. Remittances can also be seen be a crucial means of
keeping households out of poverty. The prevalence of working poverty and the low
coverage by remittances make a strong push case for emigration, incentivising poor rural
and urban households alike to send workers abroad to alleviate household poverty.
32 │ CHAPTER 1. A FORWARD-LOOKING ASSESSMENT OF SOCIAL PROTECTION NEEDS
SOCIAL PROTECTION SYSTEM REVIEW OF KYRGYZSTAN © OECD 2018
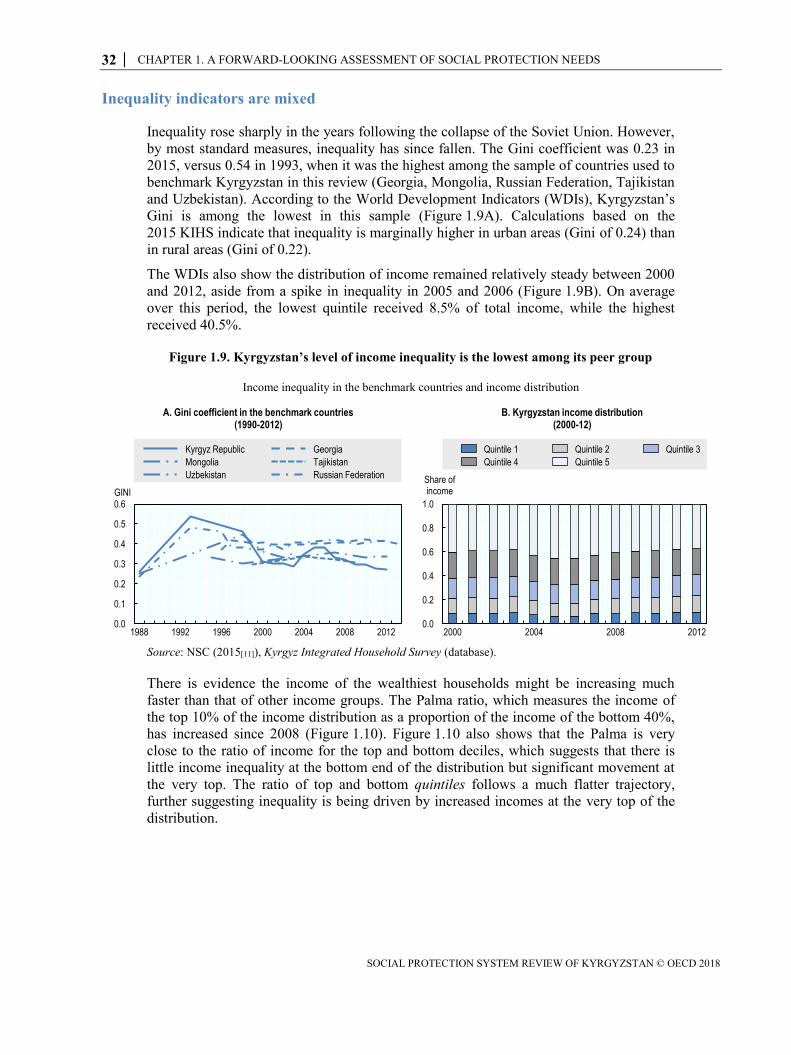
Inequality indicators are mixed
Inequality rose sharply in the years following the collapse of the Soviet Union. However,
by most standard measures, inequality has since fallen. The Gini coefficient was 0.23 in
2015, versus 0.54 in 1993, when it was the highest among the sample of countries used to
benchmark Kyrgyzstan in this review (Georgia, Mongolia, Russian Federation, Tajikistan
and Uzbekistan). According to the World Development Indicators (WDIs), Kyrgyzstan’s
Gini is among the lowest in this sample (Figure 1.9A). Calculations based on the
2015 KIHS indicate that inequality is marginally higher in urban areas (Gini of 0.24) than
in rural areas (Gini of 0.22).
The WDIs also show the distribution of income remained relatively steady between 2000
and 2012, aside from a spike in inequality in 2005 and 2006 (Figure 1.9B). On average
over this period, the lowest quintile received 8.5% of total income, while the highest
received 40.5%.
Figure 1.9. Kyrgyzstan’s level of income inequality is the lowest among its peer group
Income inequality in the benchmark countries and income distribution
Source: NSC (2015[11]), Kyrgyz Integrated Household Survey (database).
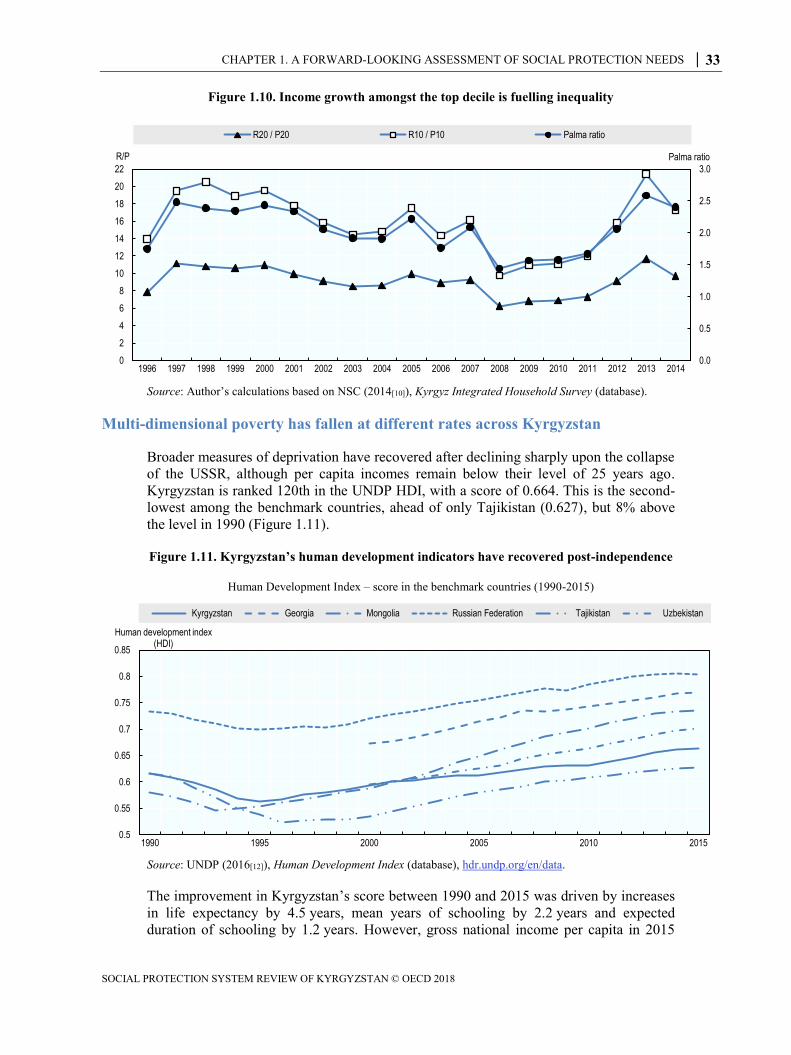
There is evidence the income of the wealthiest households might be increasing much
faster than that of other income groups. The Palma ratio, which measures the income of
the top 10% of the income distribution as a proportion of the income of the bottom 40%,
has increased since 2008 (Figure 1.10). Figure 1.10 also shows that the Palma is very
close to the ratio of income for the top and bottom deciles, which suggests that there is
little income inequality at the bottom end of the distribution but significant movement at
the very top. The ratio of top and bottom quintiles follows a much flatter trajectory,
further suggesting inequality is being driven by increased incomes at the very top of the
distribution.
0.0
0.1
0.2
0.3
0.4
0.5
0.6
1988 1992 1996 2000 2004 2008 2012
GINI
A. Gini coefficient in the benchmark countries (1990-2012)
Kyrgyz Republic Georgia
Mongolia Tajikistan
Uzbekistan Russian Federation
0.0
0.2
0.4
0.6
0.8
1.0
2000 2004 2008 2012
Share of income
B. Kyrgyzstan income distribution (2000-12)
Quintile 1 Quintile 2 Quintile 3
Quintile 4 Quintile 5
CHAPTER 1. A FORWARD-LOOKING ASSESSMENT OF SOCIAL PROTECTION NEEDS │ 33
SOCIAL PROTECTION SYSTEM REVIEW OF KYRGYZSTAN © OECD 2018
Figure 1.10. Income growth amongst the top decile is fuelling inequality
Source: Author’s calculations based on NSC (2014[10]), Kyrgyz Integrated Household Survey (database).
Multi-dimensional poverty has fallen at different rates across Kyrgyzstan
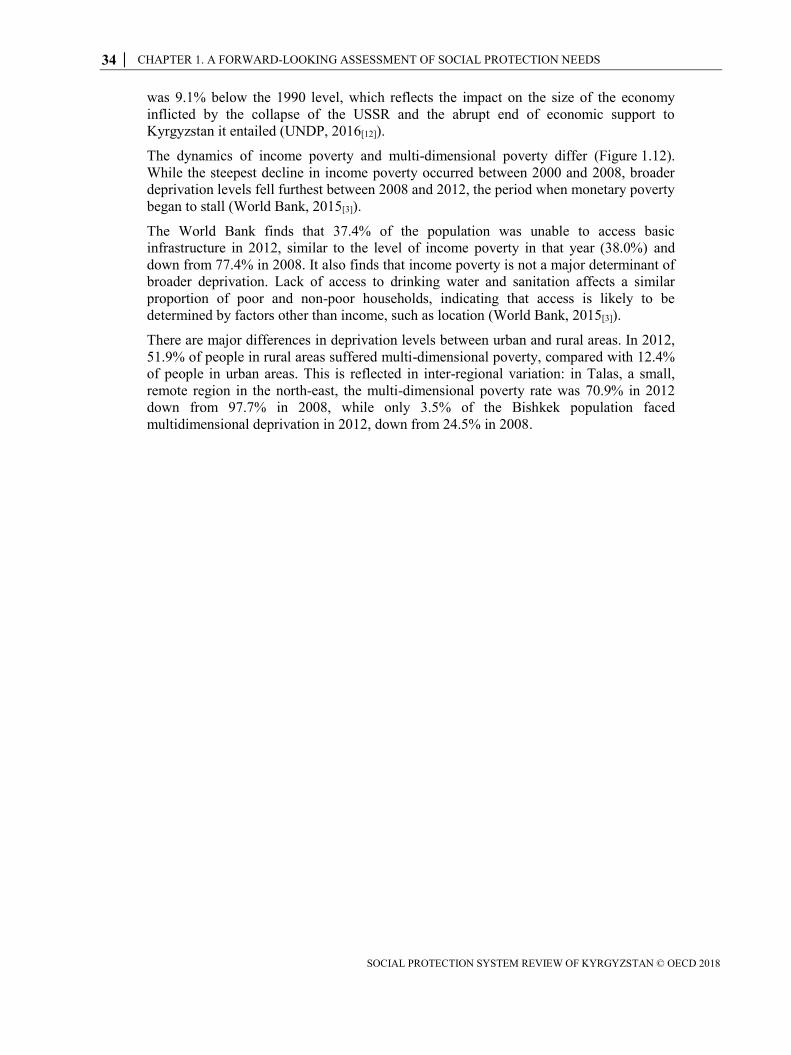
Broader measures of deprivation have recovered after declining sharply upon the collapse
of the USSR, although per capita incomes remain below their level of 25 years ago.
Kyrgyzstan is ranked 120th in the UNDP HDI, with a score of 0.664. This is the second-
lowest among the benchmark countries, ahead of only Tajikistan (0.627), but 8% above
the level in 1990 (Figure 1.11).
Figure 1.11. Kyrgyzstan’s human development indicators have recovered post-independence
Human Development Index – score in the benchmark countries (1990-2015)
Source: UNDP (2016[12]), Human Development Index (database), hdr.undp.org/en/data.
The improvement in Kyrgyzstan’s score between 1990 and 2015 was driven by increases
in life expectancy by 4.5 years, mean years of schooling by 2.2 years and expected
duration of schooling by 1.2 years. However, gross national income per capita in 2015
0.0
0.5
1.0
1.5
2.0
2.5
3.0
0
2
4
6
8
10
12
14
16
18
20
22
1996 1997 1998 1999 2000 2001 2002 2003 2004 2005 2006 2007 2008 2009 2010 2011 2012 2013 2014
Palma ratioR/P
R20 / P20 R10 / P10 Palma ratio
0.5
0.55
0.6
0.65
0.7
0.75
0.8
0.85
1990 1995 2000 2005 2010 2015
Human development index (HDI)
Kyrgyzstan Georgia Mongolia Russian Federation Tajikistan Uzbekistan
34 │ CHAPTER 1. A FORWARD-LOOKING ASSESSMENT OF SOCIAL PROTECTION NEEDS
SOCIAL PROTECTION SYSTEM REVIEW OF KYRGYZSTAN © OECD 2018
was 9.1% below the 1990 level, which reflects the impact on the size of the economy
inflicted by the collapse of the USSR and the abrupt end of economic support to
Kyrgyzstan it entailed (UNDP, 2016[12]).
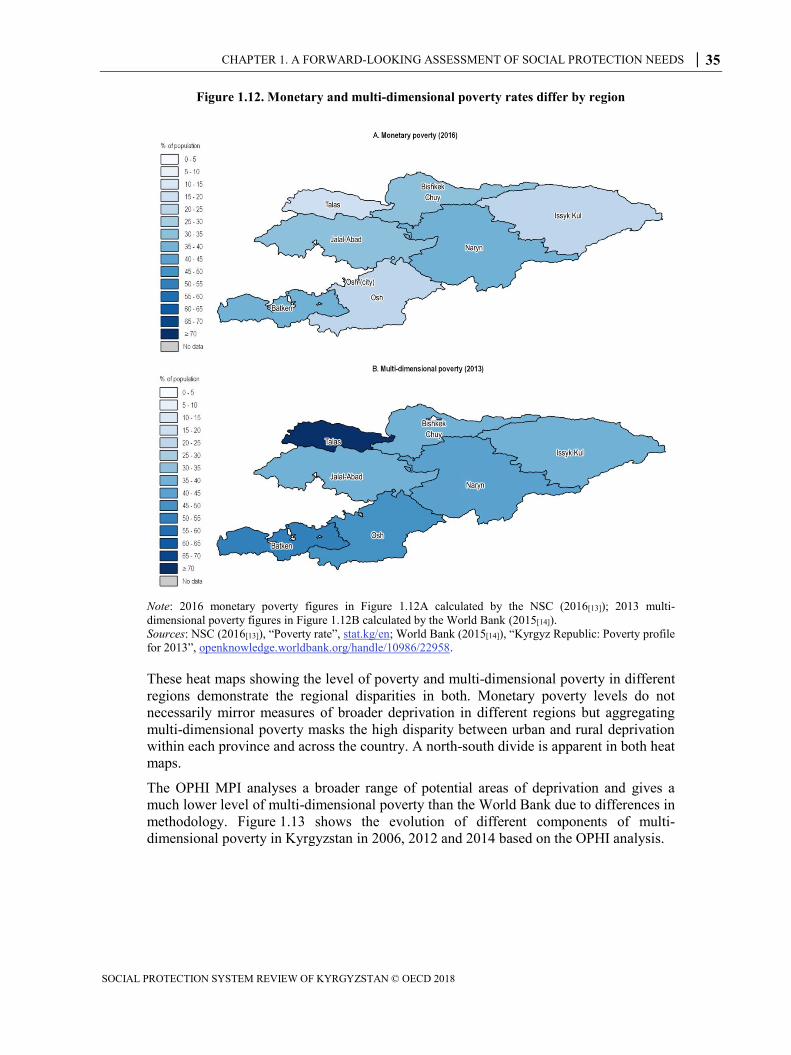
The dynamics of income poverty and multi-dimensional poverty differ (Figure 1.12).
While the steepest decline in income poverty occurred between 2000 and 2008, broader
deprivation levels fell furthest between 2008 and 2012, the period when monetary poverty
began to stall (World Bank, 2015[3]).
The World Bank finds that 37.4% of the population was unable to access basic
infrastructure in 2012, similar to the level of income poverty in that year (38.0%) and
down from 77.4% in 2008. It also finds that income poverty is not a major determinant of
broader deprivation. Lack of access to drinking water and sanitation affects a similar
proportion of poor and non-poor households, indicating that access is likely to be
determined by factors other than income, such as location (World Bank, 2015[3]).
There are major differences in deprivation levels between urban and rural areas. In 2012,
51.9% of people in rural areas suffered multi-dimensional poverty, compared with 12.4%
of people in urban areas. This is reflected in inter-regional variation: in Talas, a small,
remote region in the north-east, the multi-dimensional poverty rate was 70.9% in 2012
down from 97.7% in 2008, while only 3.5% of the Bishkek population faced
multidimensional deprivation in 2012, down from 24.5% in 2008.
CHAPTER 1. A FORWARD-LOOKING ASSESSMENT OF SOCIAL PROTECTION NEEDS │ 35
SOCIAL PROTECTION SYSTEM REVIEW OF KYRGYZSTAN © OECD 2018
Figure 1.12. Monetary and multi-dimensional poverty rates differ by region
Note: 2016 monetary poverty figures in Figure 1.12A calculated by the NSC (2016[13]); 2013 multi-
dimensional poverty figures in Figure 1.12B calculated by the World Bank (2015[14]).
Sources: NSC (2016[13]), “Poverty rate”, stat.kg/en; World Bank (2015[14]), “Kyrgyz Republic: Poverty profile
for 2013”, openknowledge.worldbank.org/handle/10986/22958.
These heat maps showing the level of poverty and multi-dimensional poverty in different
regions demonstrate the regional disparities in both. Monetary poverty levels do not
necessarily mirror measures of broader deprivation in different regions but aggregating
multi-dimensional poverty masks the high disparity between urban and rural deprivation
within each province and across the country. A north-south divide is apparent in both heat
maps.
The OPHI MPI analyses a broader range of potential areas of deprivation and gives a
much lower level of multi-dimensional poverty than the World Bank due to differences in
methodology. Figure 1.13 shows the evolution of different components of multi-
dimensional poverty in Kyrgyzstan in 2006, 2012 and 2014 based on the OPHI analysis.
36 │ CHAPTER 1. A FORWARD-LOOKING ASSESSMENT OF SOCIAL PROTECTION NEEDS
SOCIAL PROTECTION SYSTEM REVIEW OF KYRGYZSTAN © OECD 2018
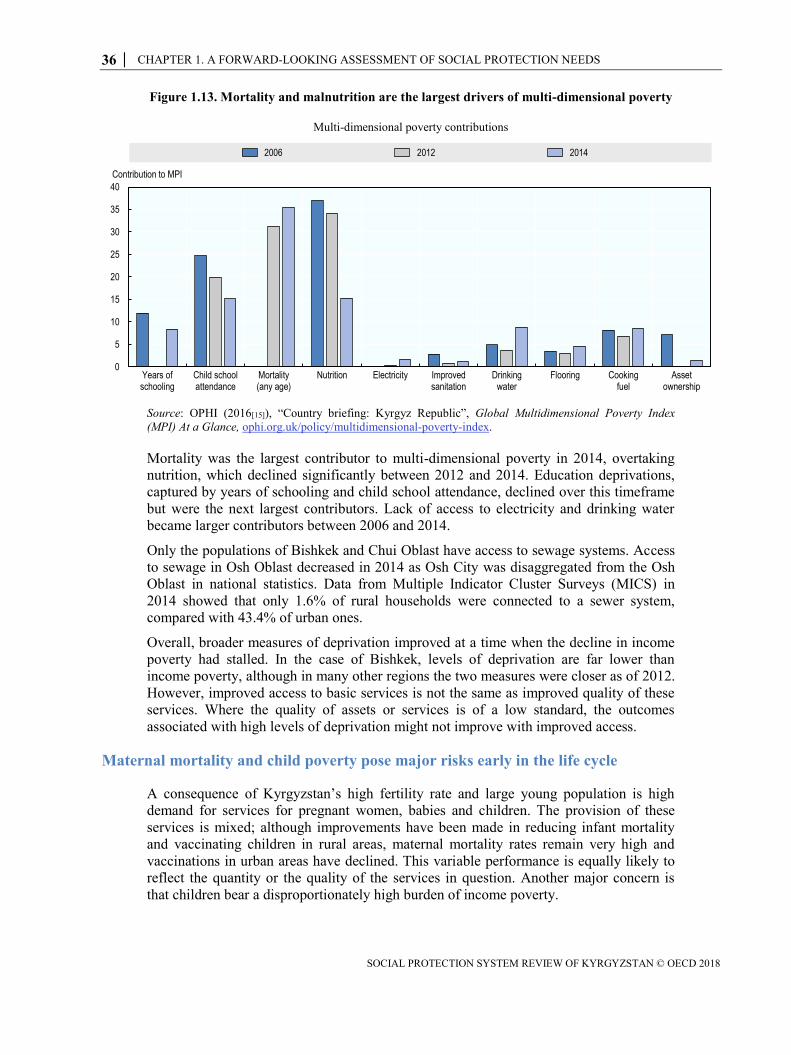
Figure 1.13. Mortality and malnutrition are the largest drivers of multi-dimensional poverty
Multi-dimensional poverty contributions
Source: OPHI (2016[15]), “Country briefing: Kyrgyz Republic”, Global Multidimensional Poverty Index
(MPI) At a Glance, ophi.org.uk/policy/multidimensional-poverty-index.
Mortality was the largest contributor to multi-dimensional poverty in 2014, overtaking
nutrition, which declined significantly between 2012 and 2014. Education deprivations,
captured by years of schooling and child school attendance, declined over this timeframe
but were the next largest contributors. Lack of access to electricity and drinking water
became larger contributors between 2006 and 2014.
Only the populations of Bishkek and Chui Oblast have access to sewage systems. Access
to sewage in Osh Oblast decreased in 2014 as Osh City was disaggregated from the Osh
Oblast in national statistics. Data from Multiple Indicator Cluster Surveys (MICS) in
2014 showed that only 1.6% of rural households were connected to a sewer system,
compared with 43.4% of urban ones.
Overall, broader measures of deprivation improved at a time when the decline in income
poverty had stalled. In the case of Bishkek, levels of deprivation are far lower than
income poverty, although in many other regions the two measures were closer as of 2012.
However, improved access to basic services is not the same as improved quality of these
services. Where the quality of assets or services is of a low standard, the outcomes
associated with high levels of deprivation might not improve with improved access.
Maternal mortality and child poverty pose major risks early in the life cycle
A consequence of Kyrgyzstan’s high fertility rate and large young population is high
demand for services for pregnant women, babies and children. The provision of these
services is mixed; although improvements have been made in reducing infant mortality
and vaccinating children in rural areas, maternal mortality rates remain very high and
vaccinations in urban areas have declined. This variable performance is equally likely to
reflect the quantity or the quality of the services in question. Another major concern is
that children bear a disproportionately high burden of income poverty.
0
5
10
15
20
25
30
35
40
Years ofschooling
Child schoolattendance
Mortality(any age)
Nutrition Electricity Improvedsanitation
Drinkingwater
Flooring Cookingfuel
Assetownership
Contribution to MPI
2006 2012 2014
CHAPTER 1. A FORWARD-LOOKING ASSESSMENT OF SOCIAL PROTECTION NEEDS │ 37
SOCIAL PROTECTION SYSTEM REVIEW OF KYRGYZSTAN © OECD 2018
Pre-natal and birth
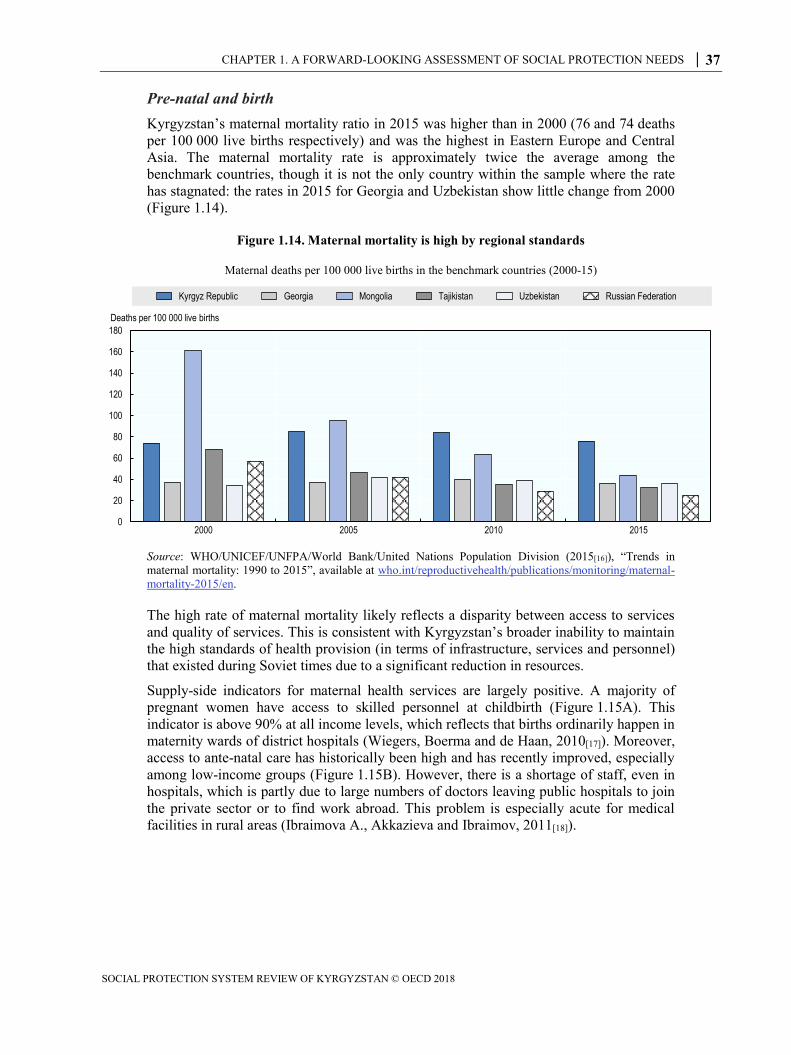
Kyrgyzstan’s maternal mortality ratio in 2015 was higher than in 2000 (76 and 74 deaths
per 100 000 live births respectively) and was the highest in Eastern Europe and Central
Asia. The maternal mortality rate is approximately twice the average among the
benchmark countries, though it is not the only country within the sample where the rate
has stagnated: the rates in 2015 for Georgia and Uzbekistan show little change from 2000
(Figure 1.14).
Figure 1.14. Maternal mortality is high by regional standards
Maternal deaths per 100 000 live births in the benchmark countries (2000-15)
Source: WHO/UNICEF/UNFPA/World Bank/United Nations Population Division (2015[16]), “Trends in
maternal mortality: 1990 to 2015”, available at who.int/reproductivehealth/publications/monitoring/maternal-
mortality-2015/en.
The high rate of maternal mortality likely reflects a disparity between access to services
and quality of services. This is consistent with Kyrgyzstan’s broader inability to maintain
the high standards of health provision (in terms of infrastructure, services and personnel)
that existed during Soviet times due to a significant reduction in resources.
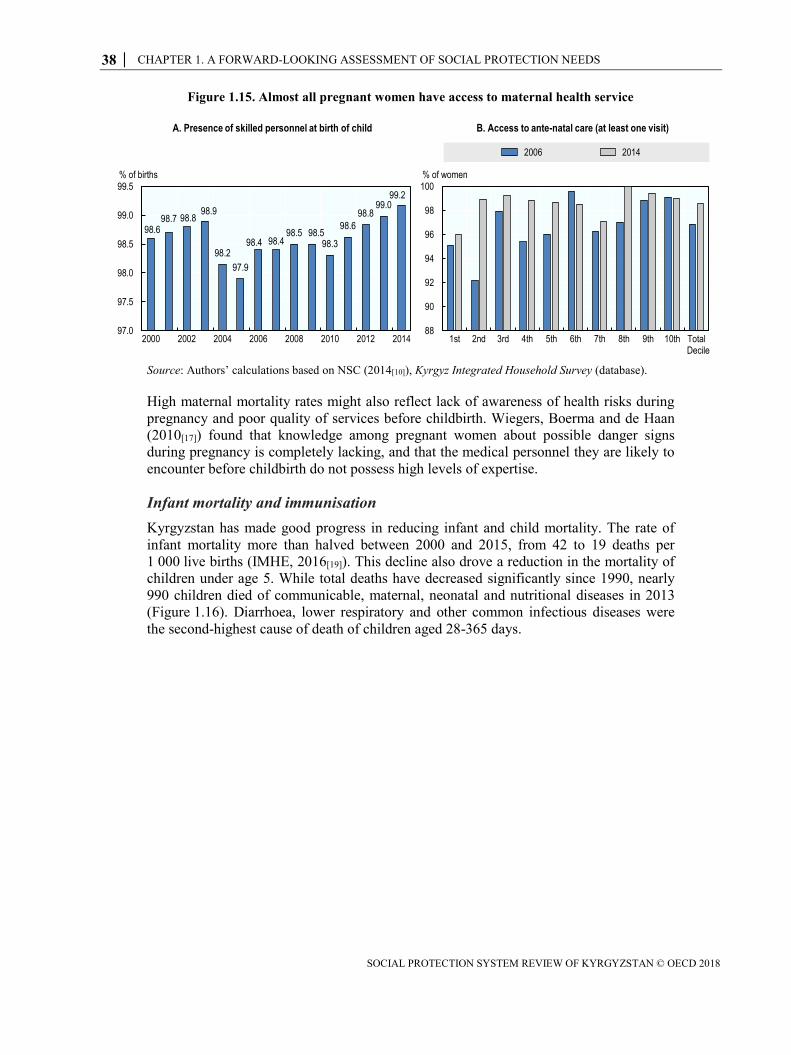
Supply-side indicators for maternal health services are largely positive. A majority of
pregnant women have access to skilled personnel at childbirth (Figure 1.15A). This
indicator is above 90% at all income levels, which reflects that births ordinarily happen in
maternity wards of district hospitals (Wiegers, Boerma and de Haan, 2010[17]). Moreover,
access to ante-natal care has historically been high and has recently improved, especially
among low-income groups (Figure 1.15B). However, there is a shortage of staff, even in
hospitals, which is partly due to large numbers of doctors leaving public hospitals to join
the private sector or to find work abroad. This problem is especially acute for medical
facilities in rural areas (Ibraimova A., Akkazieva and Ibraimov, 2011[18]).
0
20
40
60
80
100
120
140
160
180
2000 2005 2010 2015
Deaths per 100 000 live births
Kyrgyz Republic Georgia Mongolia Tajikistan Uzbekistan Russian Federation
38 │ CHAPTER 1. A FORWARD-LOOKING ASSESSMENT OF SOCIAL PROTECTION NEEDS
SOCIAL PROTECTION SYSTEM REVIEW OF KYRGYZSTAN © OECD 2018
Figure 1.15. Almost all pregnant women have access to maternal health service
Source: Authors’ calculations based on NSC (2014[10]), Kyrgyz Integrated Household Survey (database).
High maternal mortality rates might also reflect lack of awareness of health risks during
pregnancy and poor quality of services before childbirth. Wiegers, Boerma and de Haan
(2010[17]) found that knowledge among pregnant women about possible danger signs
during pregnancy is completely lacking, and that the medical personnel they are likely to
encounter before childbirth do not possess high levels of expertise.
Infant mortality and immunisation
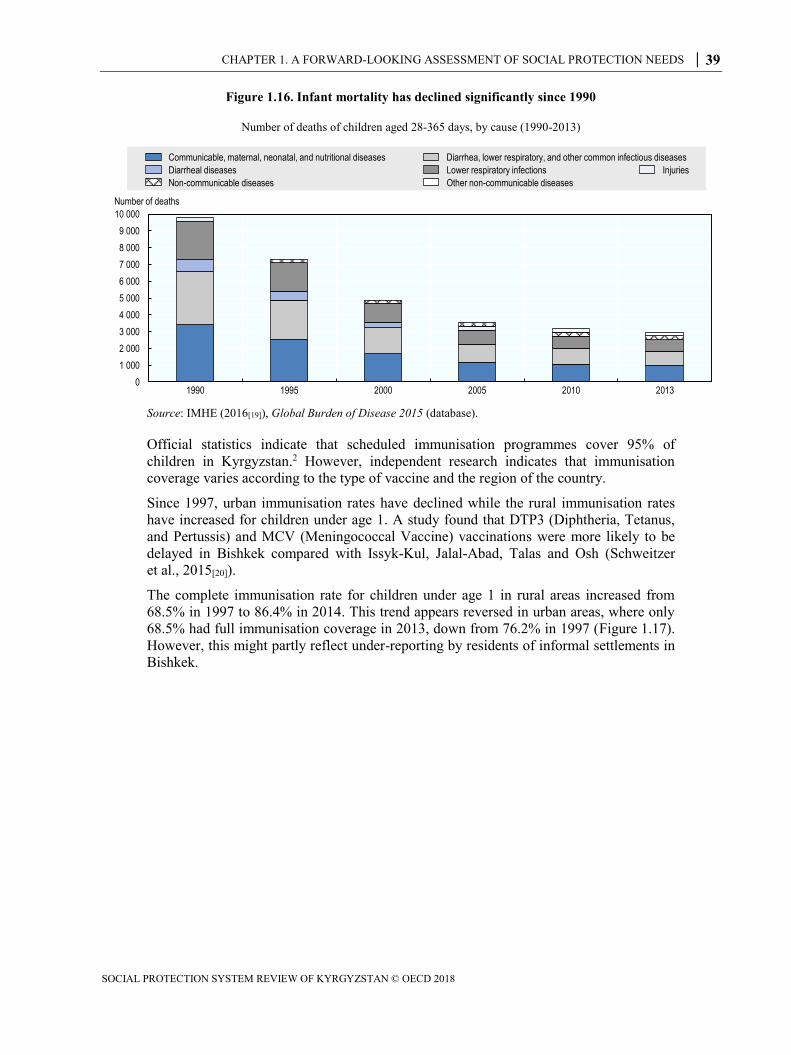
Kyrgyzstan has made good progress in reducing infant and child mortality. The rate of
infant mortality more than halved between 2000 and 2015, from 42 to 19 deaths per
1 000 live births (IMHE, 2016[19]). This decline also drove a reduction in the mortality of
children under age 5. While total deaths have decreased significantly since 1990, nearly
990 children died of communicable, maternal, neonatal and nutritional diseases in 2013
(Figure 1.16). Diarrhoea, lower respiratory and other common infectious diseases were
the second-highest cause of death of children aged 28-365 days.
98.698.7 98.8
98.9
98.2
97.9
98.4 98.498.5 98.5
98.3
98.6
98.899.0
99.2
97.0
97.5
98.0
98.5
99.0
99.5
2000 2002 2004 2006 2008 2010 2012 2014
% of births
A. Presence of skilled personnel at birth of child
88
90
92
94
96
98
100
1st 2nd 3rd 4th 5th 6th 7th 8th 9th 10th Total
% of women
Decile
B. Access to ante-natal care (at least one visit)
2006 2014
CHAPTER 1. A FORWARD-LOOKING ASSESSMENT OF SOCIAL PROTECTION NEEDS │ 39
SOCIAL PROTECTION SYSTEM REVIEW OF KYRGYZSTAN © OECD 2018
Figure 1.16. Infant mortality has declined significantly since 1990
Number of deaths of children aged 28-365 days, by cause (1990-2013)
Source: IMHE (2016[19]), Global Burden of Disease 2015 (database).
Official statistics indicate that scheduled immunisation programmes cover 95% of
children in Kyrgyzstan.2 However, independent research indicates that immunisation
coverage varies according to the type of vaccine and the region of the country.
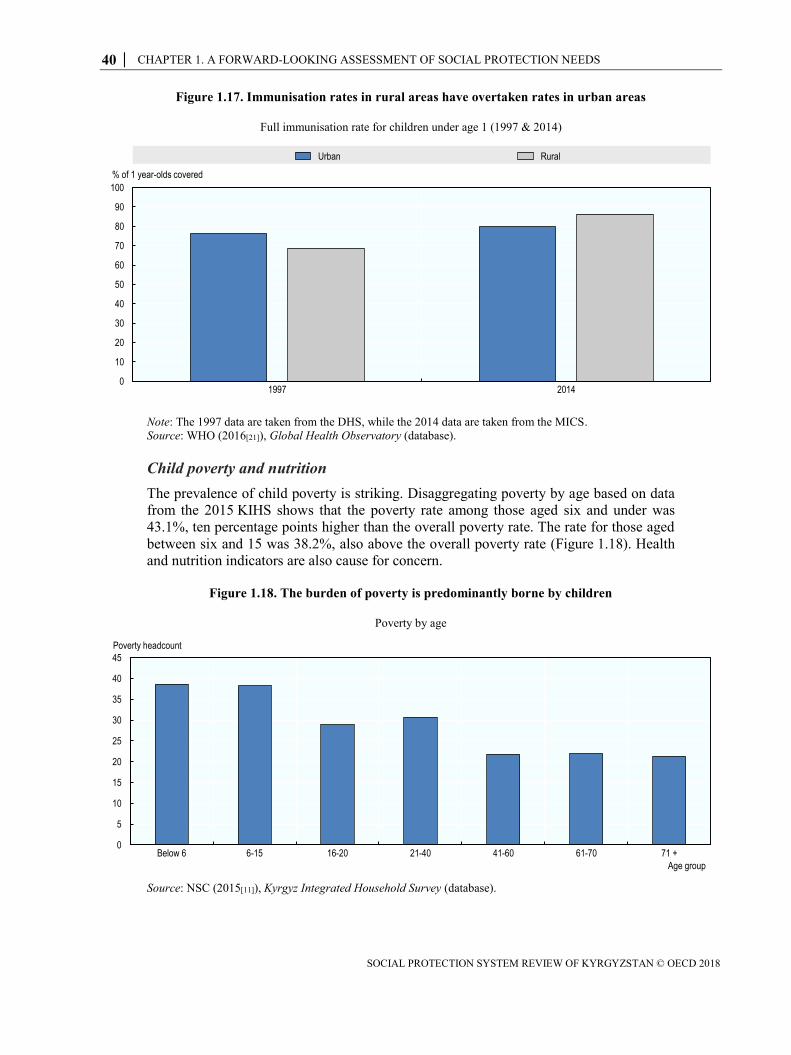
Since 1997, urban immunisation rates have declined while the rural immunisation rates
have increased for children under age 1. A study found that DTP3 (Diphtheria, Tetanus,
and Pertussis) and MCV (Meningococcal Vaccine) vaccinations were more likely to be
delayed in Bishkek compared with Issyk-Kul, Jalal-Abad, Talas and Osh (Schweitzer
et al., 2015[20]).
The complete immunisation rate for children under age 1 in rural areas increased from
68.5% in 1997 to 86.4% in 2014. This trend appears reversed in urban areas, where only
68.5% had full immunisation coverage in 2013, down from 76.2% in 1997 (Figure 1.17).
However, this might partly reflect under-reporting by residents of informal settlements in
Bishkek.
0
1 000
2 000
3 000
4 000
5 000
6 000
7 000
8 000
9 000
10 000
1990 1995 2000 2005 2010 2013
Number of deaths
Communicable, maternal, neonatal, and nutritional diseases Diarrhea, lower respiratory, and other common infectious diseases
Diarrheal diseases Lower respiratory infections Injuries
Non-communicable diseases Other non-communicable diseases
40 │ CHAPTER 1. A FORWARD-LOOKING ASSESSMENT OF SOCIAL PROTECTION NEEDS
SOCIAL PROTECTION SYSTEM REVIEW OF KYRGYZSTAN © OECD 2018
Figure 1.17. Immunisation rates in rural areas have overtaken rates in urban areas
Full immunisation rate for children under age 1 (1997 & 2014)
Note: The 1997 data are taken from the DHS, while the 2014 data are taken from the MICS.
Source: WHO (2016[21]), Global Health Observatory (database).
Child poverty and nutrition
The prevalence of child poverty is striking. Disaggregating poverty by age based on data
from the 2015 KIHS shows that the poverty rate among those aged six and under was
43.1%, ten percentage points higher than the overall poverty rate. The rate for those aged
between six and 15 was 38.2%, also above the overall poverty rate (Figure 1.18). Health
and nutrition indicators are also cause for concern.
Figure 1.18. The burden of poverty is predominantly borne by children
Poverty by age
Source: NSC (2015[11]), Kyrgyz Integrated Household Survey (database).
0
10
20
30
40
50
60
70
80
90
100
1997 2014
% of 1 year-olds covered
Urban Rural
0
5
10
15
20
25
30
35
40
45
Below 6 6-15 16-20 21-40 41-60 61-70 71 +
Poverty headcount
Age group

CHAPTER 1. A FORWARD-LOOKING ASSESSMENT OF SOCIAL PROTECTION NEEDS │ 41
SOCIAL PROTECTION SYSTEM REVIEW OF KYRGYZSTAN © OECD 2018
The rate of stunting, or low height-for-age, is a major concern across the income
distribution. According to MICS data, 12.8% of children under age 5 were affected
in 2014. Children in the lowest decile were more than twice as likely to be affected, with
a stunting rate of 18.9% versus 9.1% in the richest wealth decile but this latter figure is
surprisingly high (Figure 1.19A). Although rates decreased nationally between 2006 and
2014, there was a sharp increase in stunting in 2012, possibly as a result of a spike in food
prices during that year (Figure 1.19B). The prevalence of stunting, wasting and
underweight was higher in rural areas than in urban areas, except in 2012.
Figure 1.19. Stunting affects children across the income distribution but is more common in
rural areas
Stunting by decile and place of residence (2006, 2012 and 2014)
Source: Authors’ calculations based on NSC (2014[10]), Kyrgyz Integrated Household Survey (database).
Schooling outcomes are uneven
Free access to public primary and secondary school is guaranteed by the Constitution.
Compulsory education lasts nine years, from the age of 7 to 15 years old, and enrolment
is nearly universal up to age 15. Pre-school and upper secondary enrolment is much lower
but increasing for both, although growth varies by region.
High enrolment is not the same as high attendance and high attendance is not the same as
good-quality outcomes. As with health services, the education sector has suffered from
severe budget cuts since Soviet times, resulting in a deterioration of infrastructure
(especially a lack of heating and electricity), as well as a decline in the number of
qualified teachers and a lack of learning materials.
Pre-school
Pre-school enrolment fell dramatically with the collapse of the USSR but has partially
recovered since the early 2000s. Between 1990 and 1995, the number of pre-school
institutions fell from 1 696 to 456 and enrolment dropped from 33.9% to 9.3%. The
situation has improved since the early 2000s, particularly since 2010 (Figure 1.20B).
0
5
10
15
20
25
1st 2nd 3rd 4th 5th 6th 7th 8th 9th 10th Total
Decile
A. Stunting by decile
2006 2012 2014
% of stunted children
0
2
4
6
8
10
12
14
16
18
20
2006 2012 2014
B. Stunting by place of residence
Urban Rural
% of stunted children
42 │ CHAPTER 1. A FORWARD-LOOKING ASSESSMENT OF SOCIAL PROTECTION NEEDS
SOCIAL PROTECTION SYSTEM REVIEW OF KYRGYZSTAN © OECD 2018
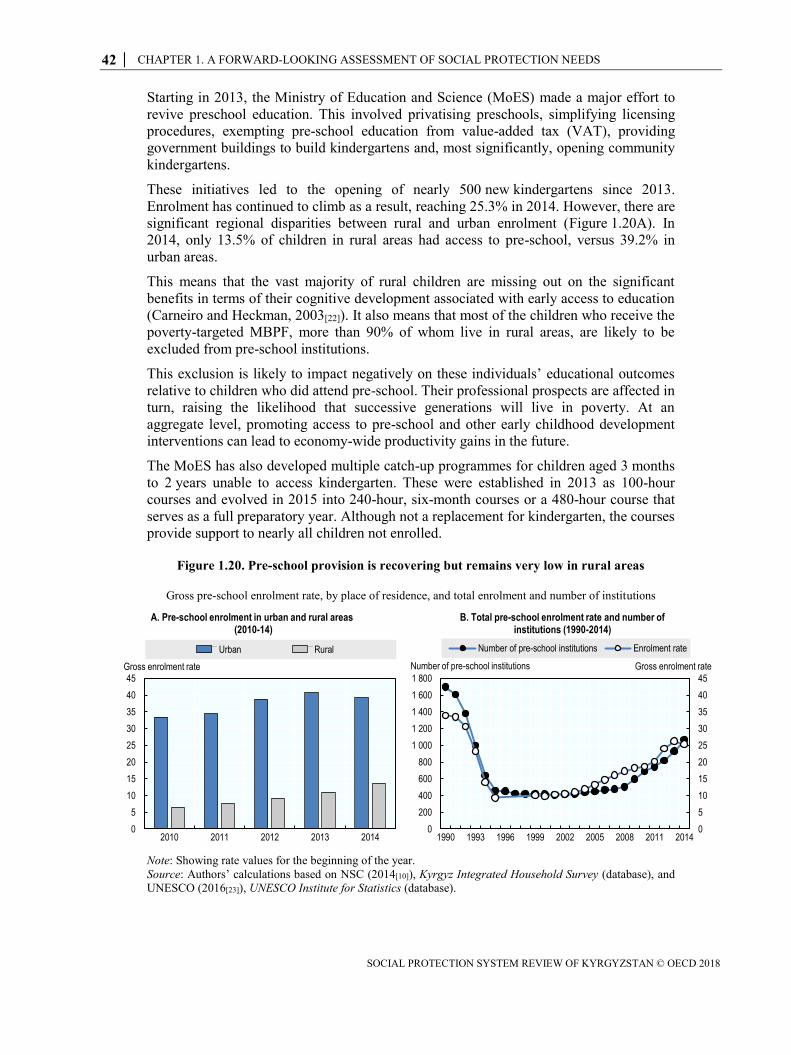
Starting in 2013, the Ministry of Education and Science (MoES) made a major effort to
revive preschool education. This involved privatising preschools, simplifying licensing
procedures, exempting pre-school education from value-added tax (VAT), providing
government buildings to build kindergartens and, most significantly, opening community
kindergartens.
These initiatives led to the opening of nearly 500 new kindergartens since 2013.
Enrolment has continued to climb as a result, reaching 25.3% in 2014. However, there are
significant regional disparities between rural and urban enrolment (Figure 1.20A). In
2014, only 13.5% of children in rural areas had access to pre-school, versus 39.2% in
urban areas.
This means that the vast majority of rural children are missing out on the significant
benefits in terms of their cognitive development associated with early access to education
(Carneiro and Heckman, 2003[22]). It also means that most of the children who receive the
poverty-targeted MBPF, more than 90% of whom live in rural areas, are likely to be
excluded from pre-school institutions.
This exclusion is likely to impact negatively on these individuals’ educational outcomes
relative to children who did attend pre-school. Their professional prospects are affected in
turn, raising the likelihood that successive generations will live in poverty. At an
aggregate level, promoting access to pre-school and other early childhood development
interventions can lead to economy-wide productivity gains in the future.
The MoES has also developed multiple catch-up programmes for children aged 3 months
to 2 years unable to access kindergarten. These were established in 2013 as 100-hour
courses and evolved in 2015 into 240-hour, six-month courses or a 480-hour course that
serves as a full preparatory year. Although not a replacement for kindergarten, the courses
provide support to nearly all children not enrolled.
Figure 1.20. Pre-school provision is recovering but remains very low in rural areas
Gross pre-school enrolment rate, by place of residence, and total enrolment and number of institutions
Note: Showing rate values for the beginning of the year.
Source: Authors’ calculations based on NSC (2014[10]), Kyrgyz Integrated Household Survey (database), and
UNESCO (2016[23]), UNESCO Institute for Statistics (database).
0
5
10
15
20
25
30
35
40
45
2010 2011 2012 2013 2014
A. Pre-school enrolment in urban and rural areas(2010-14)
Urban Rural
Gross enrolment rate
0
5
10
15
20
25
30
35
40
45
0
200
400
600
800
1 000
1 200
1 400
1 600
1 800
1990 1993 1996 1999 2002 2005 2008 2011 2014
B. Total pre-school enrolment rate and number of institutions (1990-2014)
Number of pre-school institutions Enrolment rate
Number of pre-school institutions Gross enrolment rate
CHAPTER 1. A FORWARD-LOOKING ASSESSMENT OF SOCIAL PROTECTION NEEDS │ 43
SOCIAL PROTECTION SYSTEM REVIEW OF KYRGYZSTAN © OECD 2018
Primary and secondary school
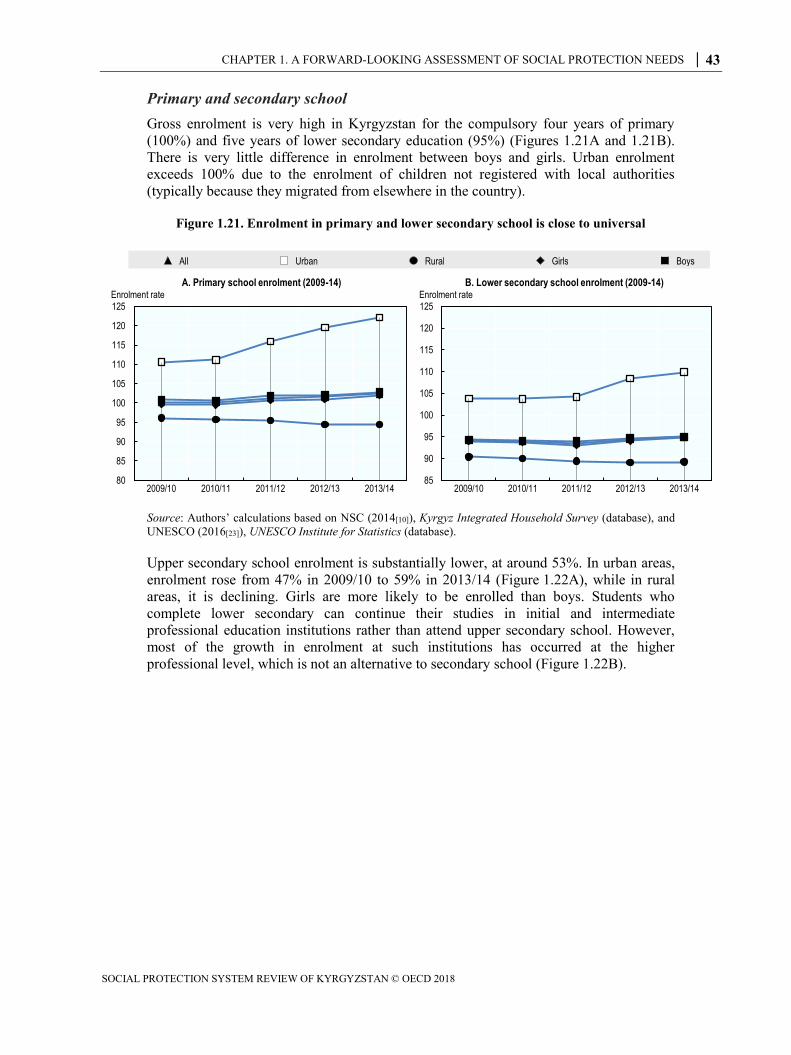
Gross enrolment is very high in Kyrgyzstan for the compulsory four years of primary
(100%) and five years of lower secondary education (95%) (Figures 1.21A and 1.21B).
There is very little difference in enrolment between boys and girls. Urban enrolment
exceeds 100% due to the enrolment of children not registered with local authorities
(typically because they migrated from elsewhere in the country).
Figure 1.21. Enrolment in primary and lower secondary school is close to universal
Source: Authors’ calculations based on NSC (2014[10]), Kyrgyz Integrated Household Survey (database), and
UNESCO (2016[23]), UNESCO Institute for Statistics (database).
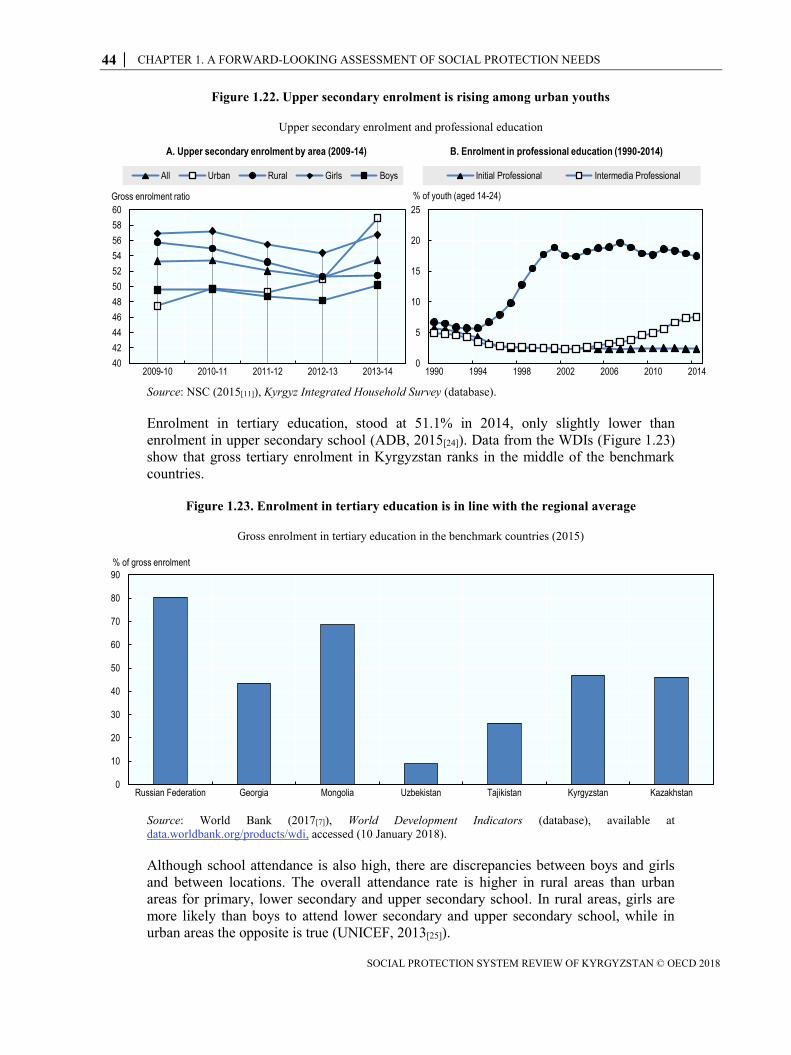
Upper secondary school enrolment is substantially lower, at around 53%. In urban areas,
enrolment rose from 47% in 2009/10 to 59% in 2013/14 (Figure 1.22A), while in rural
areas, it is declining. Girls are more likely to be enrolled than boys. Students who
complete lower secondary can continue their studies in initial and intermediate
professional education institutions rather than attend upper secondary school. However,
most of the growth in enrolment at such institutions has occurred at the higher
professional level, which is not an alternative to secondary school (Figure 1.22B).
80
85
90
95
100
105
110
115
120
125
2009/10 2010/11 2011/12 2012/13 2013/14
A. Primary school enrolment (2009-14) Enrolment rate
85
90
95
100
105
110
115
120
125
2009/10 2010/11 2011/12 2012/13 2013/14
B. Lower secondary school enrolment (2009-14)Enrolment rate
All Urban Rural Girls Boys
44 │ CHAPTER 1. A FORWARD-LOOKING ASSESSMENT OF SOCIAL PROTECTION NEEDS
SOCIAL PROTECTION SYSTEM REVIEW OF KYRGYZSTAN © OECD 2018
Figure 1.22. Upper secondary enrolment is rising among urban youths
Upper secondary enrolment and professional education
Source: NSC (2015[11]), Kyrgyz Integrated Household Survey (database).
Enrolment in tertiary education, stood at 51.1% in 2014, only slightly lower than
enrolment in upper secondary school (ADB, 2015[24]). Data from the WDIs (Figure 1.23)
show that gross tertiary enrolment in Kyrgyzstan ranks in the middle of the benchmark
countries.
Figure 1.23. Enrolment in tertiary education is in line with the regional average
Gross enrolment in tertiary education in the benchmark countries (2015)
Source: World Bank (2017[7]), World Development Indicators (database), available at
data.worldbank.org/products/wdi, accessed (10 January 2018).
Although school attendance is also high, there are discrepancies between boys and girls
and between locations. The overall attendance rate is higher in rural areas than urban
areas for primary, lower secondary and upper secondary school. In rural areas, girls are
more likely than boys to attend lower secondary and upper secondary school, while in
urban areas the opposite is true (UNICEF, 2013[25]).
40
42
44
46
48
50
52
54
56
58
60
2009-10 2010-11 2011-12 2012-13 2013-14
A. Upper secondary enrolment by area (2009-14)
All Urban Rural Girls Boys
Gross enrolment ratio
0
5
10
15
20
25
1990 1994 1998 2002 2006 2010 2014
B. Enrolment in professional education (1990-2014)
Initial Professional Intermedia Professional
% of youth (aged 14-24)
0
10
20
30
40
50
60
70
80
90
Russian Federation Georgia Mongolia Uzbekistan Tajikistan Kyrgyzstan Kazakhstan
% of gross enrolment
CHAPTER 1. A FORWARD-LOOKING ASSESSMENT OF SOCIAL PROTECTION NEEDS │ 45
SOCIAL PROTECTION SYSTEM REVIEW OF KYRGYZSTAN © OECD 2018
Attendance is not the same as receiving a quality education. While public spending on
education has risen in recent years, there are major systemic problems, including teacher
shortages, the low quality of teacher training, outdated curricula and shortages of teaching
materials. Learning outcomes are suffering as a consequence: Kyrgyzstan was ranked last
in maths, science and reading among nations that participated in the 2006 and 2009
rounds of the Program for International Student Assessment (PISA), (OECD, 2010[26]).
The National Sample-Based Achievement Test showed similar results (Hou, 2011[27]).
The result is that many school leavers lack basic skills when they enter the labour market
(UNICEF, 2013). This in turn leads to a skills mismatch in the economy that constrains
productivity. PISA evaluations also show that urban students tend to perform better at
school even after accounting for socio-economic characteristics; the performance gap
between rural and urban students is estimated at 80 points, which is equivalent to two
years of schooling (OECD, 2010[26]).
Child employment
Child labour is widespread in Kyrgyzstan, although numbers have decreased in recent
years. The majority of children in employment also attend school and not all child
employment constitutes child labour: forms of employment that pose no physical, mental
or developmental harm and that do not deprive children of educational opportunities, are
admissible under Kyrgyz labour law.
According to the 2007 Child Labour Force Survey, 672 000 children aged 5-17 were in
some form of employment, representing 45.8% that age group and 21.9% of working
individuals (ILO, 2008[28]). Labour participation rises with age: 32.6% of children aged
5-11 are in some form of employment compared with 62.3% of those aged 15-17. The
overwhelming majority (95%) were employed in agriculture and produce for home
consumption. By 2014/15, the number of employed children had fallen to 414 246, or
39.0% of the total population aged 5-17 (ILO, 2016[29]).
An increase in hazardous labour accompanied this drop in employment: the percentage of
children working in dangerous jobs rose from 12.5% to 18.6% between 2007 and 2014.
An additional 9.3% of children worked in non-acceptable forms of labour, meaning they
were not at risk of physical harm but worked an excessive number of hours and/or did not
attend school. Children in poor households, particularly those with low parental education
levels, are at greatest risk of child labour (ILO/NSC, 2016[30]).
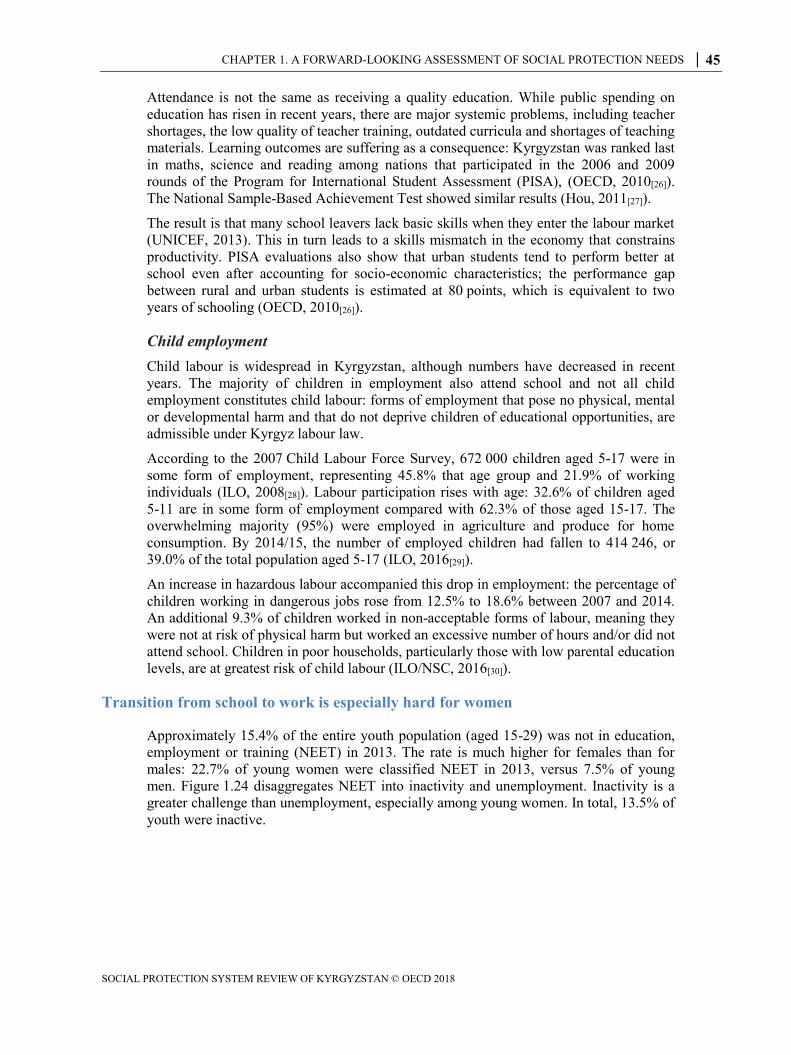
Transition from school to work is especially hard for women
Approximately 15.4% of the entire youth population (aged 15-29) was not in education,
employment or training (NEET) in 2013. The rate is much higher for females than for
males: 22.7% of young women were classified NEET in 2013, versus 7.5% of young
men. Figure 1.24 disaggregates NEET into inactivity and unemployment. Inactivity is a
greater challenge than unemployment, especially among young women. In total, 13.5% of
youth were inactive.
46 │ CHAPTER 1. A FORWARD-LOOKING ASSESSMENT OF SOCIAL PROTECTION NEEDS
SOCIAL PROTECTION SYSTEM REVIEW OF KYRGYZSTAN © OECD 2018
Figure 1.24. Young women are more likely to be NEET
Share of total youth population (aged 15-29) not in employment, education, or training by gender (2013)
Source: ILO (2013[31]), School-to-Work Transition Survey: Kyrgyzstan (2013) (database), available at
ilo.org/employment/areas/WCMS_234860.
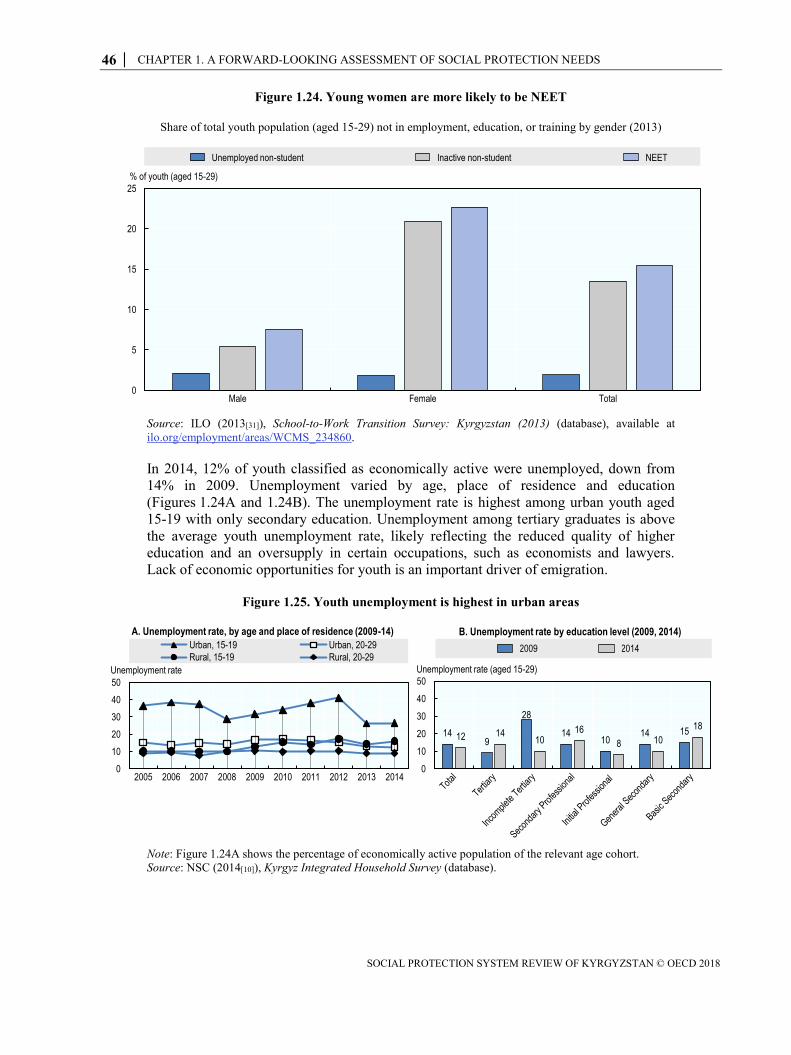
In 2014, 12% of youth classified as economically active were unemployed, down from
14% in 2009. Unemployment varied by age, place of residence and education
(Figures 1.24A and 1.24B). The unemployment rate is highest among urban youth aged
15-19 with only secondary education. Unemployment among tertiary graduates is above
the average youth unemployment rate, likely reflecting the reduced quality of higher
education and an oversupply in certain occupations, such as economists and lawyers.
Lack of economic opportunities for youth is an important driver of emigration.
Figure 1.25. Youth unemployment is highest in urban areas
Note: Figure 1.24A shows the percentage of economically active population of the relevant age cohort.
Source: NSC (2014[10]), Kyrgyz Integrated Household Survey (database).
0
5
10
15
20
25
Male Female Total
% of youth (aged 15-29)
Unemployed non-student Inactive non-student NEET
0
10
20
30
40
50
2005 2006 2007 2008 2009 2010 2011 2012 2013 2014
Urban, 15-19 Urban, 20-29
Rural, 15-19 Rural, 20-29
Unemployment rate
A. Unemployment rate, by age and place of residence (2009-14)
149
28
1410
14 1512 14
1016
8 10
18
0
10
20
30
40
50
B. Unemployment rate by education level (2009, 2014)
2009 2014
Unemployment rate (aged 15-29)
CHAPTER 1. A FORWARD-LOOKING ASSESSMENT OF SOCIAL PROTECTION NEEDS │ 47
SOCIAL PROTECTION SYSTEM REVIEW OF KYRGYZSTAN © OECD 2018
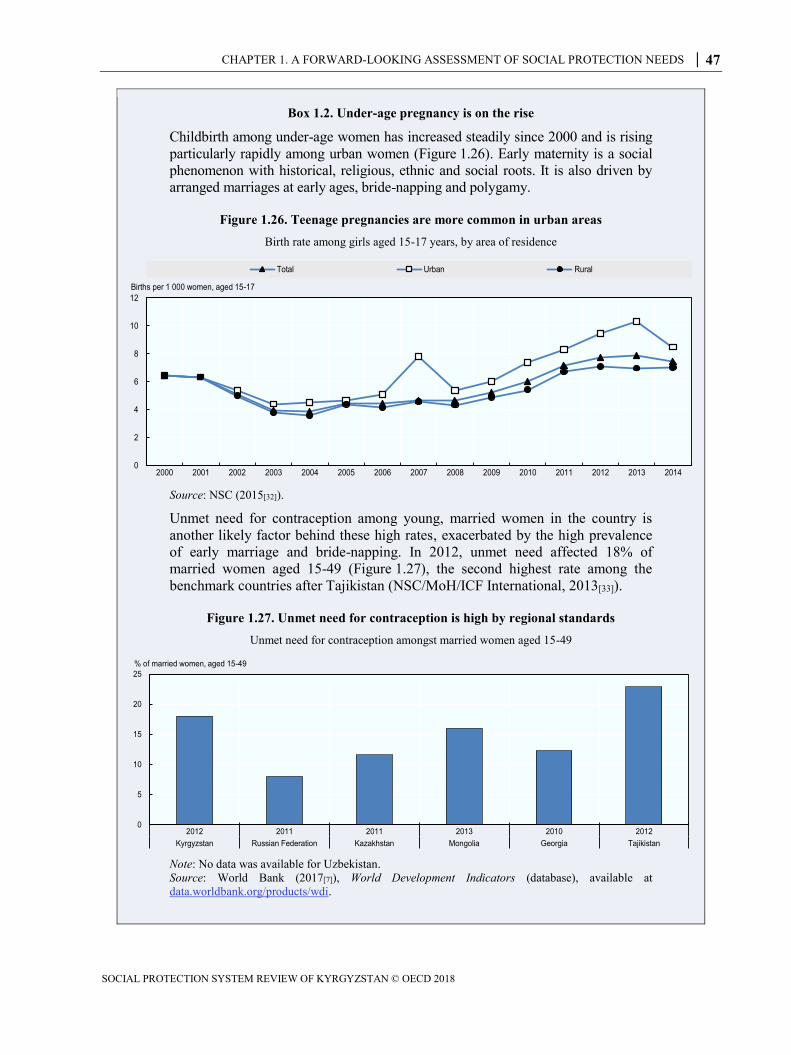
Box 1.2. Under-age pregnancy is on the rise
Childbirth among under-age women has increased steadily since 2000 and is rising
particularly rapidly among urban women (Figure 1.26). Early maternity is a social
phenomenon with historical, religious, ethnic and social roots. It is also driven by
arranged marriages at early ages, bride-napping and polygamy.
Figure 1.26. Teenage pregnancies are more common in urban areas
Birth rate among girls aged 15-17 years, by area of residence
Source: NSC (2015[32]).
Unmet need for contraception among young, married women in the country is
another likely factor behind these high rates, exacerbated by the high prevalence
of early marriage and bride-napping. In 2012, unmet need affected 18% of
married women aged 15-49 (Figure 1.27), the second highest rate among the
benchmark countries after Tajikistan (NSC/MoH/ICF International, 2013[33]).
Figure 1.27. Unmet need for contraception is high by regional standards
Unmet need for contraception amongst married women aged 15-49
Note: No data was available for Uzbekistan.
Source: World Bank (2017[7]), World Development Indicators (database), available at
data.worldbank.org/products/wdi.
0
2
4
6
8
10
12
2000 2001 2002 2003 2004 2005 2006 2007 2008 2009 2010 2011 2012 2013 2014
Total Urban Rural
Births per 1 000 women, aged 15-17
0
5
10
15
20
25
2012 2011 2011 2013 2010 2012
Kyrgyzstan Russian Federation Kazakhstan Mongolia Georgia Tajikistan
% of married women, aged 15-49
48 │ CHAPTER 1. A FORWARD-LOOKING ASSESSMENT OF SOCIAL PROTECTION NEEDS
SOCIAL PROTECTION SYSTEM REVIEW OF KYRGYZSTAN © OECD 2018
Unmet need likely contributes to the high maternal mortality rate and worsening
labour market outcomes. Evidence from 144 countries shows that risk of death
from pregnancy is nearly one third higher for women aged 15-19 than those aged
20-24 (Nove et al., 2014[34]). Moreover, giving birth at an early age has been
shown to negatively affect women’s future wages.
Working lives are characterised by unemployment, informality and migration
Individuals aged 30-60 accounted for 67% of Kyrgyzstan’s population in 2014.
Approximately 80% of the adult population was economically active, down from 84% in
2005 (Figure 1.28A). The decline reflects lower labour force participation among women
aged 15 and above, which fell from 56% in 2000 to 49% in 2015 (Figure 1.28B). This
runs counter to elsewhere in East and Central Asia, where the gap between male and
female participation has decreased (ILO, 2016[35]).
The decline in female participation has been attributed to legal barriers, such as laws
prohibiting women from performing certain types of work, limiting the number of jobs
pregnant women can hold and allowing women with young children to refuse to
undertake tasks outside normal working hours (Dubashov, Kruse and Ismailakhunova,
2015[36]). While these regulations are intended to protect women and balance their
professional and family lives, the effect is to segregate women and potentially prompt
employers to discriminate against them amid perceptions they are less flexible than their
male counterparts. The pay gap between men and women stood at 29% in 2014, up from
22% in 2011 but below an average of 35% between 2000 and 2010 (NSC, 2014[10]).
Figure 1.28. Female labour force participation has declined significantly
Labour force participation
Source: NSC (2017[37]), “Economically active and inactive population”; ILO (2016[35]), Key Indicators of the
Labour Market, 9th edition (database).
Unemployment
The unemployment rate increased during the first decade of the 2000s. Despite sustained
and relatively robust economic growth, the economy was not able to accommodate rapid
growth in the supply of labour even though migration mitigated this growth to a certain
75
76
77
78
79
80
81
82
83
84
85
1 400
1 500
1 600
1 700
1 800
1 900
2 000
2005 2008 2011 2014
A. Population, total and economically active, aged 30-60 (2005-14)
Population size (aged 30-60)
Population, thousand Active population (%)
40
45
50
55
60
65
70
75
80
2000 2003 2006 2009 2012 2015
B. Labour force participation aged 15 or higher, by gender (2000-15)
Female labour force participation rate
Participation rate (aged 15+)
CHAPTER 1. A FORWARD-LOOKING ASSESSMENT OF SOCIAL PROTECTION NEEDS │ 49
SOCIAL PROTECTION SYSTEM REVIEW OF KYRGYZSTAN © OECD 2018
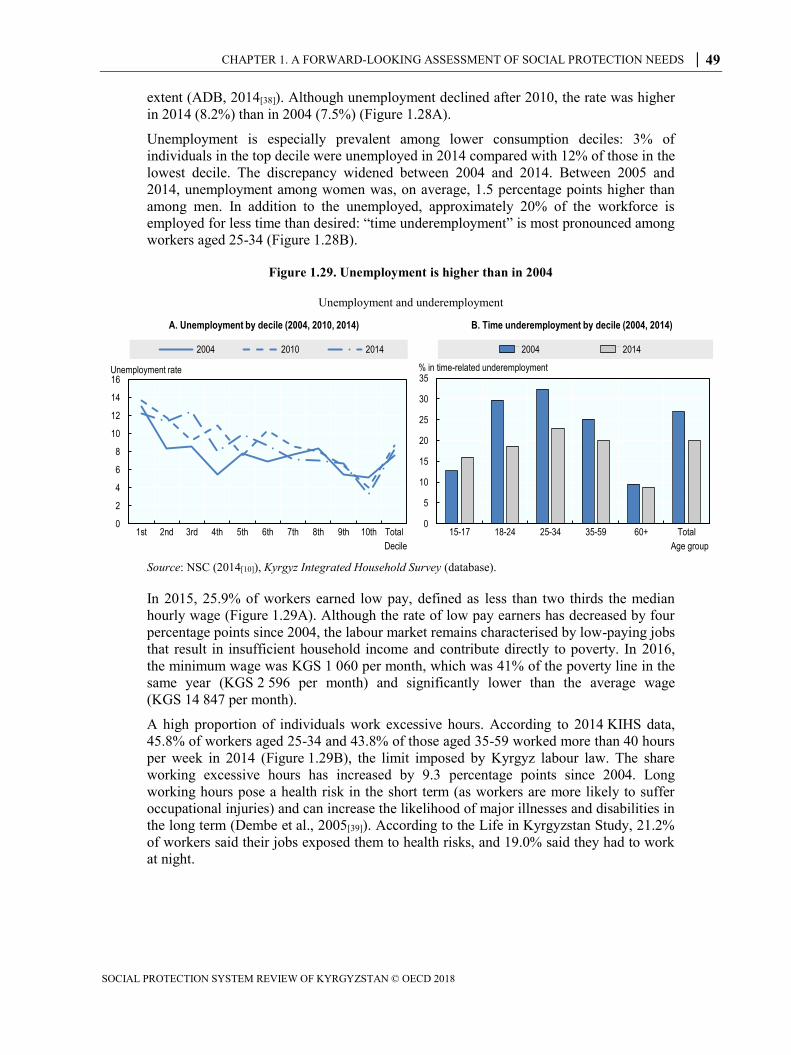
extent (ADB, 2014[38]). Although unemployment declined after 2010, the rate was higher
in 2014 (8.2%) than in 2004 (7.5%) (Figure 1.28A).
Unemployment is especially prevalent among lower consumption deciles: 3% of
individuals in the top decile were unemployed in 2014 compared with 12% of those in the
lowest decile. The discrepancy widened between 2004 and 2014. Between 2005 and
2014, unemployment among women was, on average, 1.5 percentage points higher than
among men. In addition to the unemployed, approximately 20% of the workforce is
employed for less time than desired: “time underemployment” is most pronounced among
workers aged 25-34 (Figure 1.28B).
Figure 1.29. Unemployment is higher than in 2004
Unemployment and underemployment
Source: NSC (2014[10]), Kyrgyz Integrated Household Survey (database).
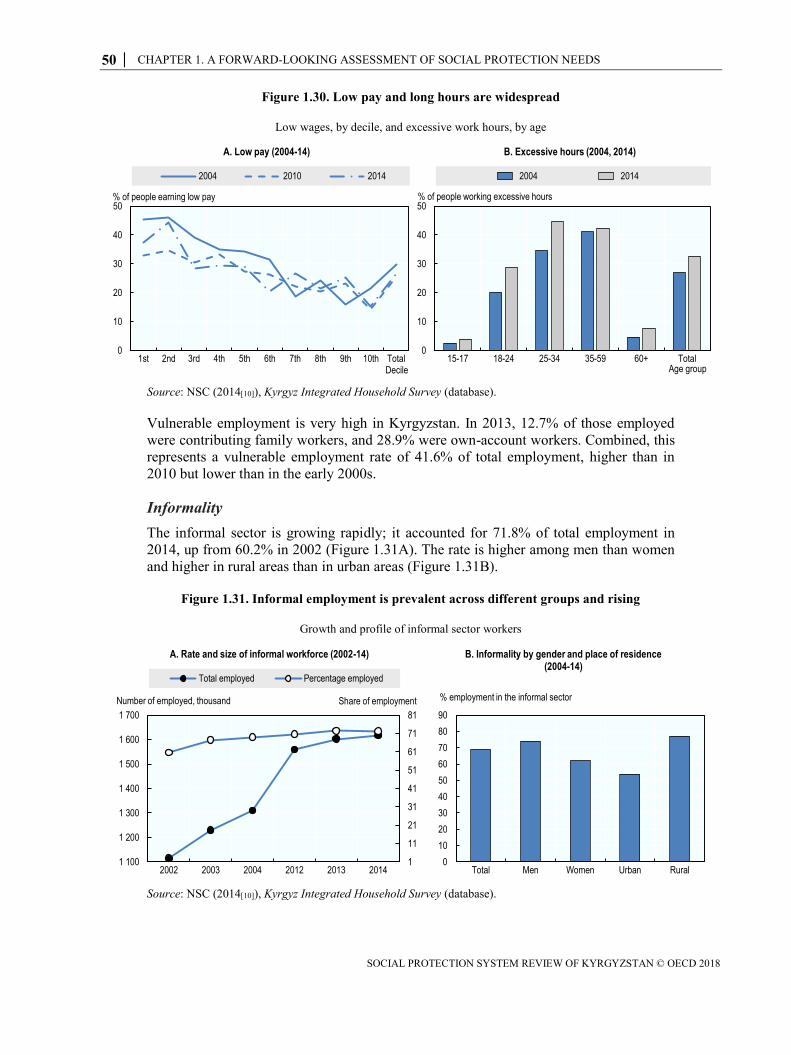
In 2015, 25.9% of workers earned low pay, defined as less than two thirds the median
hourly wage (Figure 1.29A). Although the rate of low pay earners has decreased by four
percentage points since 2004, the labour market remains characterised by low-paying jobs
that result in insufficient household income and contribute directly to poverty. In 2016,
the minimum wage was KGS 1 060 per month, which was 41% of the poverty line in the
same year (KGS 2 596 per month) and significantly lower than the average wage
(KGS 14 847 per month).
A high proportion of individuals work excessive hours. According to 2014 KIHS data,
45.8% of workers aged 25-34 and 43.8% of those aged 35-59 worked more than 40 hours
per week in 2014 (Figure 1.29B), the limit imposed by Kyrgyz labour law. The share
working excessive hours has increased by 9.3 percentage points since 2004. Long
working hours pose a health risk in the short term (as workers are more likely to suffer
occupational injuries) and can increase the likelihood of major illnesses and disabilities in
the long term (Dembe et al., 2005[39]). According to the Life in Kyrgyzstan Study, 21.2%
of workers said their jobs exposed them to health risks, and 19.0% said they had to work
at night.
0
2
4
6
8
10
12
14
16
1st 2nd 3rd 4th 5th 6th 7th 8th 9th 10th Total
Decile
A. Unemployment by decile (2004, 2010, 2014)
2004 2010 2014
Unemployment rate
0
5
10
15
20
25
30
35
15-17 18-24 25-34 35-59 60+ Total
Age group
B. Time underemployment by decile (2004, 2014)
2004 2014
% in time-related underemployment
50 │ CHAPTER 1. A FORWARD-LOOKING ASSESSMENT OF SOCIAL PROTECTION NEEDS
SOCIAL PROTECTION SYSTEM REVIEW OF KYRGYZSTAN © OECD 2018
Figure 1.30. Low pay and long hours are widespread
Low wages, by decile, and excessive work hours, by age
Source: NSC (2014[10]), Kyrgyz Integrated Household Survey (database).
Vulnerable employment is very high in Kyrgyzstan. In 2013, 12.7% of those employed
were contributing family workers, and 28.9% were own-account workers. Combined, this
represents a vulnerable employment rate of 41.6% of total employment, higher than in
2010 but lower than in the early 2000s.
Informality
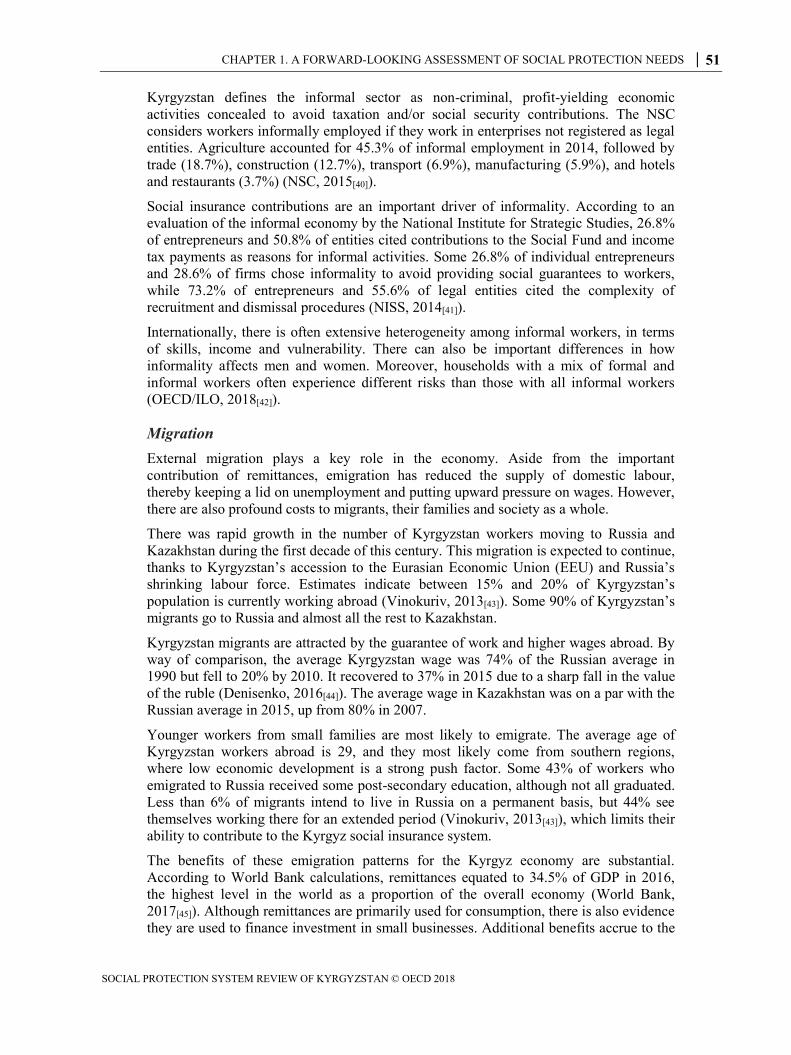
The informal sector is growing rapidly; it accounted for 71.8% of total employment in
2014, up from 60.2% in 2002 (Figure 1.31A). The rate is higher among men than women
and higher in rural areas than in urban areas (Figure 1.31B).
Figure 1.31. Informal employment is prevalent across different groups and rising
Growth and profile of informal sector workers
Source: NSC (2014[10]), Kyrgyz Integrated Household Survey (database).
0
10
20
30
40
50
1st 2nd 3rd 4th 5th 6th 7th 8th 9th 10th TotalDecile
A. Low pay (2004-14)
2004 2010 2014
% of people earning low pay
0
10
20
30
40
50
15-17 18-24 25-34 35-59 60+ TotalAge group
B. Excessive hours (2004, 2014)
2004 2014
% of people working excessive hours
1
11
21
31
41
51
61
71
81
1 100
1 200
1 300
1 400
1 500
1 600
1 700
2002 2003 2004 2012 2013 2014
A. Rate and size of informal workforce (2002-14)
Total employed Percentage employed
Number of employed, thousand Share of employment
0
10
20
30
40
50
60
70
80
90
Total Men Women Urban Rural
B. Informality by gender and place of residence (2004-14)
% employment in the informal sector
CHAPTER 1. A FORWARD-LOOKING ASSESSMENT OF SOCIAL PROTECTION NEEDS │ 51
SOCIAL PROTECTION SYSTEM REVIEW OF KYRGYZSTAN © OECD 2018
Kyrgyzstan defines the informal sector as non-criminal, profit-yielding economic
activities concealed to avoid taxation and/or social security contributions. The NSC
considers workers informally employed if they work in enterprises not registered as legal
entities. Agriculture accounted for 45.3% of informal employment in 2014, followed by
trade (18.7%), construction (12.7%), transport (6.9%), manufacturing (5.9%), and hotels
and restaurants (3.7%) (NSC, 2015[40]).
Social insurance contributions are an important driver of informality. According to an
evaluation of the informal economy by the National Institute for Strategic Studies, 26.8%
of entrepreneurs and 50.8% of entities cited contributions to the Social Fund and income
tax payments as reasons for informal activities. Some 26.8% of individual entrepreneurs
and 28.6% of firms chose informality to avoid providing social guarantees to workers,
while 73.2% of entrepreneurs and 55.6% of legal entities cited the complexity of
recruitment and dismissal procedures (NISS, 2014[41]).
Internationally, there is often extensive heterogeneity among informal workers, in terms
of skills, income and vulnerability. There can also be important differences in how
informality affects men and women. Moreover, households with a mix of formal and
informal workers often experience different risks than those with all informal workers
(OECD/ILO, 2018[42]).
Migration
External migration plays a key role in the economy. Aside from the important
contribution of remittances, emigration has reduced the supply of domestic labour,
thereby keeping a lid on unemployment and putting upward pressure on wages. However,
there are also profound costs to migrants, their families and society as a whole.
There was rapid growth in the number of Kyrgyzstan workers moving to Russia and
Kazakhstan during the first decade of this century. This migration is expected to continue,
thanks to Kyrgyzstan’s accession to the Eurasian Economic Union (EEU) and Russia’s
shrinking labour force. Estimates indicate between 15% and 20% of Kyrgyzstan’s
population is currently working abroad (Vinokuriv, 2013[43]). Some 90% of Kyrgyzstan’s
migrants go to Russia and almost all the rest to Kazakhstan.
Kyrgyzstan migrants are attracted by the guarantee of work and higher wages abroad. By
way of comparison, the average Kyrgyzstan wage was 74% of the Russian average in
1990 but fell to 20% by 2010. It recovered to 37% in 2015 due to a sharp fall in the value
of the ruble (Denisenko, 2016[44]). The average wage in Kazakhstan was on a par with the
Russian average in 2015, up from 80% in 2007.
Younger workers from small families are most likely to emigrate. The average age of
Kyrgyzstan workers abroad is 29, and they most likely come from southern regions,
where low economic development is a strong push factor. Some 43% of workers who
emigrated to Russia received some post-secondary education, although not all graduated.
Less than 6% of migrants intend to live in Russia on a permanent basis, but 44% see
themselves working there for an extended period (Vinokuriv, 2013[43]), which limits their
ability to contribute to the Kyrgyz social insurance system.
The benefits of these emigration patterns for the Kyrgyz economy are substantial.
According to World Bank calculations, remittances equated to 34.5% of GDP in 2016,
the highest level in the world as a proportion of the overall economy (World Bank,
2017[45]). Although remittances are primarily used for consumption, there is also evidence
they are used to finance investment in small businesses. Additional benefits accrue to the
52 │ CHAPTER 1. A FORWARD-LOOKING ASSESSMENT OF SOCIAL PROTECTION NEEDS
SOCIAL PROTECTION SYSTEM REVIEW OF KYRGYZSTAN © OECD 2018
Kyrgyz economy when migrants return home with the money, know-how and networks to
set up businesses.
However, there are also extensive costs to emigration. The legal rights of Kyrgyzstan
migrants to Russia and Kazakhstan are not always respected, and they confront
challenges in assimilating into Russian society, as well as accessing accommodation and
utilities. Kyrgyzstan’s accession to the EEU in August 2015 has simplified certain
administrative procedures for migrants to Russia, but such workers are still not entitled to
the same rights as Russian workers.
Access to social protection is a major concern for migrant workers. Although a treaty on
pension coverage for migrant workers in EEU member states is currently under
discussion, Kyrgyzstan workers are currently unable to access social protection
programmes either in their own country or abroad. This renders migrants and their
families vulnerable to an income shock and places them at high risk of poverty in old age.
It also threatens the sustainability of Kyrgyzstan’s pay-as-you-go pension arrangement,
which is currently experiencing financing challenges due to the low proportion of the
current workforce making contributions (discussed later in the report).
Meanwhile, large-scale emigration is associated with various social problems at home,
including growing demographic disparities among regions and family breakdowns. It is
also associated with social orphanhood (children with one or both living parents who are
unable or unwilling to care for them), which is driving continued demand for residential
institutions (discussed in Chapter 2).
Internal migration is also an important phenomenon in Kyrgyzstan, reflecting the
country’s uneven economic development. Changes in the structure of the economy have
caused (and continue to cause) significant movement of people between urban areas and
between rural and urban areas. Yet this process is not administratively straightforward:
internal migrants need an official permit to settle in a new municipality. Individuals
without a permit cannot apply for local services, including social protection.
Kyrgyzstan faces a double disease burden
Kyrgyzstan suffers from a double burden of disease. Infectious diseases, such as
tuberculosis (TB) and (increasingly) HIV/AIDS, are a persistent problem, but non-
communicable diseases have become an even greater challenge. Demand for health
services and the profile of disability are changing to reflect these burdens.
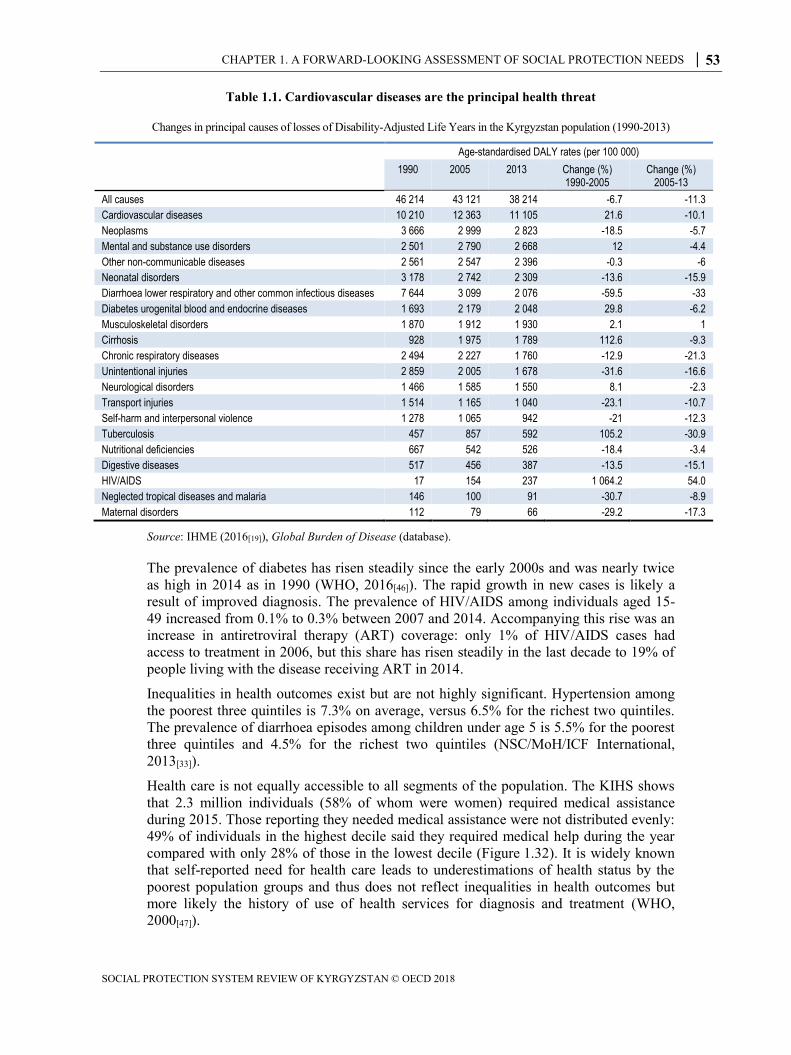
Table 1.1 indicates the main health challenges facing Kyrgyzstan. Disability-Adjusted
Life Years (DALYs), a linear sum of potential years of healthy life lost due to premature
mortality and disability, for most conditions rose between 1990 and 2005 but fell
thereafter. Cardiovascular diseases are the largest contributor to years of healthy life lost:
11 105 per 100 000 in 2013, up from 10 210 in 1990 but down from 12 363 in 2005. HIV
is a growing concern, with a 54% increase in DALY rates between 2005 and 2013,
although the absolute number remains low. The burden of infectious diseases, maternal
disorders, nutritional deficiencies and neonatal diseases has dropped since 1990.
Cardiovascular diseases are the leading cause of death for individuals of working age and
account for 33% of all deaths (NSC, 2015[11]). Cancer accounts for 11%, while trauma,
poisoning and other external factors account for 9%. Respiratory diseases account for 6%
of deaths, the most common being TB. Over 70% of individuals who die from TB are
men; 90% of men affected are of working age.
CHAPTER 1. A FORWARD-LOOKING ASSESSMENT OF SOCIAL PROTECTION NEEDS │ 53
SOCIAL PROTECTION SYSTEM REVIEW OF KYRGYZSTAN © OECD 2018
Table 1.1. Cardiovascular diseases are the principal health threat
Changes in principal causes of losses of Disability-Adjusted Life Years in the Kyrgyzstan population (1990-2013)
Age-standardised DALY rates (per 100 000)
1990 2005 2013 Change (%) 1990-2005
Change (%) 2005-13
All causes 46 214 43 121 38 214 -6.7 -11.3
Cardiovascular diseases 10 210 12 363 11 105 21.6 -10.1
Neoplasms 3 666 2 999 2 823 -18.5 -5.7
Mental and substance use disorders 2 501 2 790 2 668 12 -4.4
Other non-communicable diseases 2 561 2 547 2 396 -0.3 -6
Neonatal disorders 3 178 2 742 2 309 -13.6 -15.9
Diarrhoea lower respiratory and other common infectious diseases 7 644 3 099 2 076 -59.5 -33
Diabetes urogenital blood and endocrine diseases 1 693 2 179 2 048 29.8 -6.2
Musculoskeletal disorders 1 870 1 912 1 930 2.1 1
Cirrhosis 928 1 975 1 789 112.6 -9.3
Chronic respiratory diseases 2 494 2 227 1 760 -12.9 -21.3
Unintentional injuries 2 859 2 005 1 678 -31.6 -16.6
Neurological disorders 1 466 1 585 1 550 8.1 -2.3
Transport injuries 1 514 1 165 1 040 -23.1 -10.7
Self-harm and interpersonal violence 1 278 1 065 942 -21 -12.3
Tuberculosis 457 857 592 105.2 -30.9
Nutritional deficiencies 667 542 526 -18.4 -3.4
Digestive diseases 517 456 387 -13.5 -15.1
HIV/AIDS 17 154 237 1 064.2 54.0
Neglected tropical diseases and malaria 146 100 91 -30.7 -8.9
Maternal disorders 112 79 66 -29.2 -17.3
Source: IHME (2016[19]), Global Burden of Disease (database).
The prevalence of diabetes has risen steadily since the early 2000s and was nearly twice
as high in 2014 as in 1990 (WHO, 2016[46]). The rapid growth in new cases is likely a
result of improved diagnosis. The prevalence of HIV/AIDS among individuals aged 15-
49 increased from 0.1% to 0.3% between 2007 and 2014. Accompanying this rise was an
increase in antiretroviral therapy (ART) coverage: only 1% of HIV/AIDS cases had
access to treatment in 2006, but this share has risen steadily in the last decade to 19% of
people living with the disease receiving ART in 2014.
Inequalities in health outcomes exist but are not highly significant. Hypertension among
the poorest three quintiles is 7.3% on average, versus 6.5% for the richest two quintiles.
The prevalence of diarrhoea episodes among children under age 5 is 5.5% for the poorest
three quintiles and 4.5% for the richest two quintiles (NSC/MoH/ICF International,
2013[33]).
Health care is not equally accessible to all segments of the population. The KIHS shows
that 2.3 million individuals (58% of whom were women) required medical assistance
during 2015. Those reporting they needed medical assistance were not distributed evenly:
49% of individuals in the highest decile said they required medical help during the year
compared with only 28% of those in the lowest decile (Figure 1.32). It is widely known
that self-reported need for health care leads to underestimations of health status by the
poorest population groups and thus does not reflect inequalities in health outcomes but
more likely the history of use of health services for diagnosis and treatment (WHO,
2000[47]).
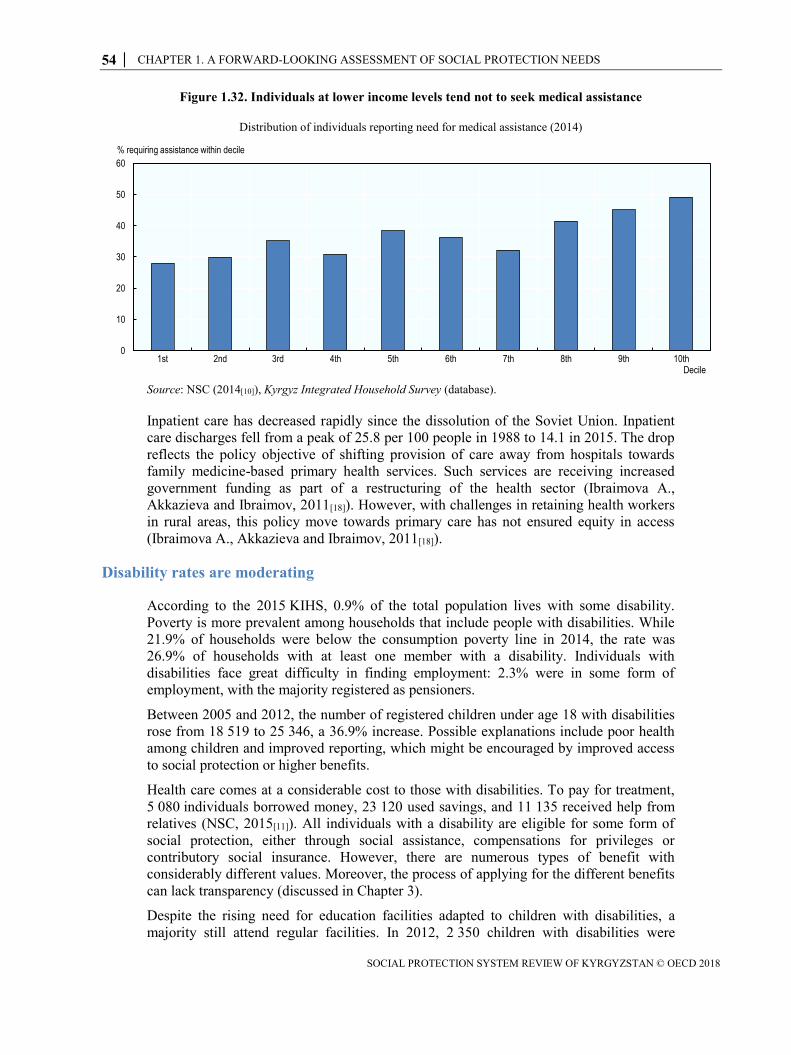
54 │ CHAPTER 1. A FORWARD-LOOKING ASSESSMENT OF SOCIAL PROTECTION NEEDS
SOCIAL PROTECTION SYSTEM REVIEW OF KYRGYZSTAN © OECD 2018
Figure 1.32. Individuals at lower income levels tend not to seek medical assistance
Distribution of individuals reporting need for medical assistance (2014)
Source: NSC (2014[10]), Kyrgyz Integrated Household Survey (database).
Inpatient care has decreased rapidly since the dissolution of the Soviet Union. Inpatient
care discharges fell from a peak of 25.8 per 100 people in 1988 to 14.1 in 2015. The drop
reflects the policy objective of shifting provision of care away from hospitals towards
family medicine-based primary health services. Such services are receiving increased
government funding as part of a restructuring of the health sector (Ibraimova A.,
Akkazieva and Ibraimov, 2011[18]). However, with challenges in retaining health workers
in rural areas, this policy move towards primary care has not ensured equity in access
(Ibraimova A., Akkazieva and Ibraimov, 2011[18]).
Disability rates are moderating
According to the 2015 KIHS, 0.9% of the total population lives with some disability.
Poverty is more prevalent among households that include people with disabilities. While
21.9% of households were below the consumption poverty line in 2014, the rate was
26.9% of households with at least one member with a disability. Individuals with
disabilities face great difficulty in finding employment: 2.3% were in some form of
employment, with the majority registered as pensioners.
Between 2005 and 2012, the number of registered children under age 18 with disabilities
rose from 18 519 to 25 346, a 36.9% increase. Possible explanations include poor health
among children and improved reporting, which might be encouraged by improved access
to social protection or higher benefits.
Health care comes at a considerable cost to those with disabilities. To pay for treatment,
5 080 individuals borrowed money, 23 120 used savings, and 11 135 received help from
relatives (NSC, 2015[11]). All individuals with a disability are eligible for some form of
social protection, either through social assistance, compensations for privileges or
contributory social insurance. However, there are numerous types of benefit with
considerably different values. Moreover, the process of applying for the different benefits
can lack transparency (discussed in Chapter 3).
Despite the rising need for education facilities adapted to children with disabilities, a
majority still attend regular facilities. In 2012, 2 350 children with disabilities were
0
10
20
30
40
50
60
1st 2nd 3rd 4th 5th 6th 7th 8th 9th 10thDecile
% requiring assistance within decile
CHAPTER 1. A FORWARD-LOOKING ASSESSMENT OF SOCIAL PROTECTION NEEDS │ 55
SOCIAL PROTECTION SYSTEM REVIEW OF KYRGYZSTAN © OECD 2018
enrolled in regular pre-school while only 1 674 attended special facilities for this age-
group. The disparity grows for school-age children: 2 477 children attended boarding
schools specialised for disability care, while 9 945 children with disabilities were
registered at regular schools (UNICEF, 2012[48]).
Old-age poverty is low thanks to the pension system
The contributory pension system acts as a crucial buffer against poverty. As discussed in
Chapters 2 and 3, pension coverage among the current elderly population is nearly
universal – a legacy of near-full employment before the collapse of the USSR. The
average pension benefit in 2014 was KGS 4 710 per month, equivalent to 106% of the
subsistence minimum calculated for pensioners, almost twice the overall poverty line
(KGS 2 485 in 2014) and more than triple the EPL (KGS 1 466).
However, this average masks significant variations in incomes among the elderly.
Pension levels are much lower for those who did not belong to the Social Fund
throughout their careers or whose contribution rates were very low. Workers who did not
contribute to the Social Fund at all are entitled to a very low monthly income from the
MSB, a non-contributory arrangement.
Approximately 20% of individuals aged 60 and above are economically active.
According to NSC figures, approximately 60% of those employed in this age group are in
the informal sector. The elderly amount to 3% of the employed population, and
unemployment among the elderly is lower than among the workforce as a whole.
Older people face challenges affording necessities, especially health care. The 2013 Life
in Kyrgyzstan Study showed that 29.6% of individuals over 59 could not afford
treatment, while 19.8% reported borrowing money to make health payments (DIW/SIPRI,
2014[49]). Similarly, 52.6% of respondents in the 2015 KIHS over 59 reported moderate
difficulties in paying for health services and 11.9% reported great difficulty. Some 27.7%
who required medical assistance self-medicated.
Skip-generation households consisting of older people and children face particular
hardships. They often report insufficient income, especially in winter, and reliance on
credit. These households prioritise food and heating, frequently at the expense of
children’s education (HelpAge International, 2009[50]).
Subjective well-being indicators are mixed
Different surveys provide different evidence of the subjective well-being of Kyrgyzstan’s
population. Gallup’s nationally representative survey of individuals aged 15 and above
indicates the population is among the least positive of the benchmark countries. Life
satisfaction (on a scale of 10) declined between 2013 and 2015 (Figure 1.33) after
increasing between 2006 and 2009, and the average has remained steady at around 5, in
contrast to the fluctuations in other benchmark countries.
Local surveys tell a more positive story. The 2014 MICS showed that 70.8% of women
aged 15-24 believed their lives improved in the year before the survey, while 95.3%
believed their lives would improve in the upcoming year. Overall, 96.1% were satisfied
with their lives, 93.1% with their family lives and 95.5% with their health, although only
77.7% reported satisfaction with their income level.
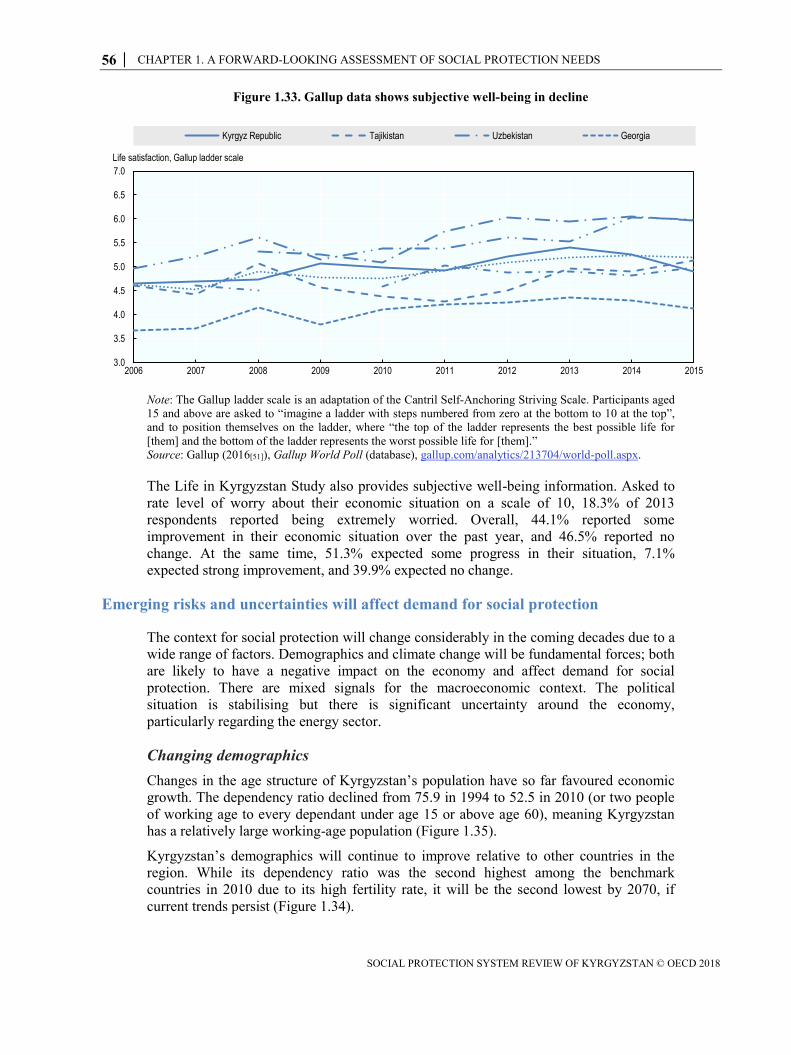
56 │ CHAPTER 1. A FORWARD-LOOKING ASSESSMENT OF SOCIAL PROTECTION NEEDS
SOCIAL PROTECTION SYSTEM REVIEW OF KYRGYZSTAN © OECD 2018
Figure 1.33. Gallup data shows subjective well-being in decline
Note: The Gallup ladder scale is an adaptation of the Cantril Self-Anchoring Striving Scale. Participants aged
15 and above are asked to “imagine a ladder with steps numbered from zero at the bottom to 10 at the top”,
and to position themselves on the ladder, where “the top of the ladder represents the best possible life for
[them] and the bottom of the ladder represents the worst possible life for [them].”
Source: Gallup (2016[51]), Gallup World Poll (database), gallup.com/analytics/213704/world-poll.aspx.
The Life in Kyrgyzstan Study also provides subjective well-being information. Asked to
rate level of worry about their economic situation on a scale of 10, 18.3% of 2013
respondents reported being extremely worried. Overall, 44.1% reported some
improvement in their economic situation over the past year, and 46.5% reported no
change. At the same time, 51.3% expected some progress in their situation, 7.1%
expected strong improvement, and 39.9% expected no change.
Emerging risks and uncertainties will affect demand for social protection
The context for social protection will change considerably in the coming decades due to a
wide range of factors. Demographics and climate change will be fundamental forces; both
are likely to have a negative impact on the economy and affect demand for social
protection. There are mixed signals for the macroeconomic context. The political
situation is stabilising but there is significant uncertainty around the economy,
particularly regarding the energy sector.
Changing demographics
Changes in the age structure of Kyrgyzstan’s population have so far favoured economic
growth. The dependency ratio declined from 75.9 in 1994 to 52.5 in 2010 (or two people
of working age to every dependant under age 15 or above age 60), meaning Kyrgyzstan
has a relatively large working-age population (Figure 1.35).
Kyrgyzstan’s demographics will continue to improve relative to other countries in the
region. While its dependency ratio was the second highest among the benchmark
countries in 2010 due to its high fertility rate, it will be the second lowest by 2070, if
current trends persist (Figure 1.34).
3.0
3.5
4.0
4.5
5.0
5.5
6.0
6.5
7.0
2006 2007 2008 2009 2010 2011 2012 2013 2014 2015
Kyrgyz Republic Tajikistan Uzbekistan Georgia
Life satisfaction, Gallup ladder scale
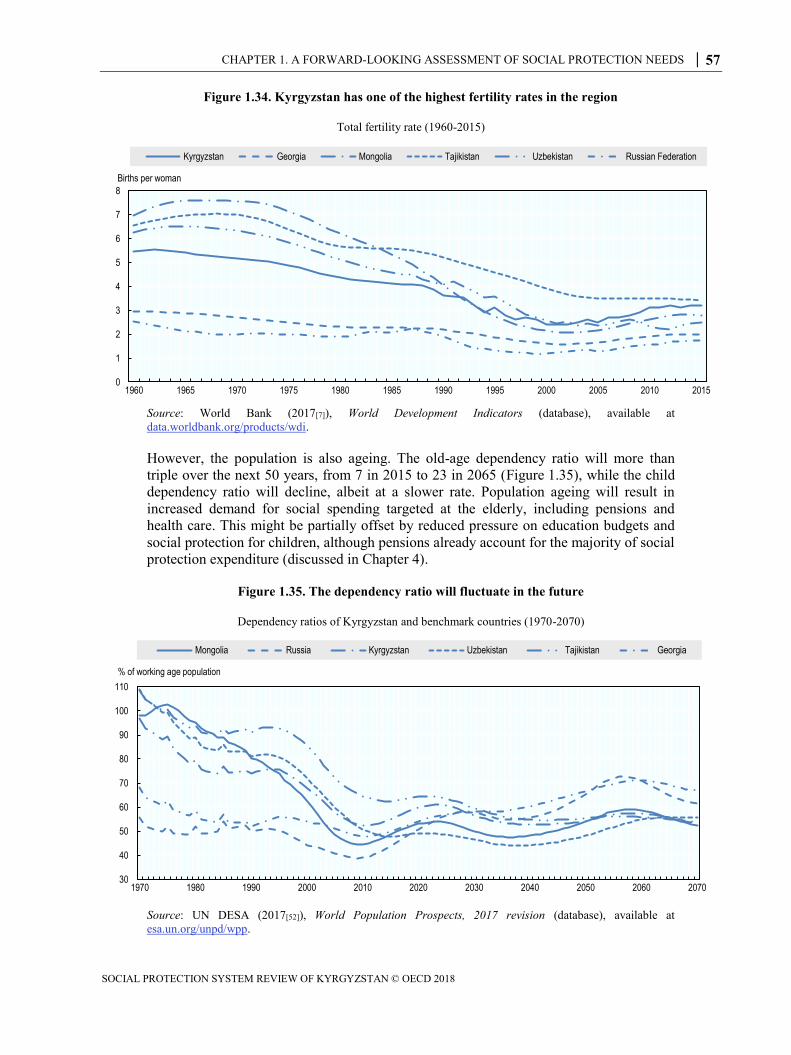
CHAPTER 1. A FORWARD-LOOKING ASSESSMENT OF SOCIAL PROTECTION NEEDS │ 57
SOCIAL PROTECTION SYSTEM REVIEW OF KYRGYZSTAN © OECD 2018
Figure 1.34. Kyrgyzstan has one of the highest fertility rates in the region
Total fertility rate (1960-2015)
Source: World Bank (2017[7]), World Development Indicators (database), available at
data.worldbank.org/products/wdi.
However, the population is also ageing. The old-age dependency ratio will more than
triple over the next 50 years, from 7 in 2015 to 23 in 2065 (Figure 1.35), while the child
dependency ratio will decline, albeit at a slower rate. Population ageing will result in
increased demand for social spending targeted at the elderly, including pensions and
health care. This might be partially offset by reduced pressure on education budgets and
social protection for children, although pensions already account for the majority of social
protection expenditure (discussed in Chapter 4).
Figure 1.35. The dependency ratio will fluctuate in the future
Dependency ratios of Kyrgyzstan and benchmark countries (1970-2070)
Source: UN DESA (2017[52]), World Population Prospects, 2017 revision (database), available at
esa.un.org/unpd/wpp.
0
1
2
3
4
5
6
7
8
1960 1965 1970 1975 1980 1985 1990 1995 2000 2005 2010 2015
Births per woman
Kyrgyzstan Georgia Mongolia Tajikistan Uzbekistan Russian Federation
30
40
50
60
70
80
90
100
110
1970 1980 1990 2000 2010 2020 2030 2040 2050 2060 2070
% of working age population
Mongolia Russia Kyrgyzstan Uzbekistan Tajikistan Georgia
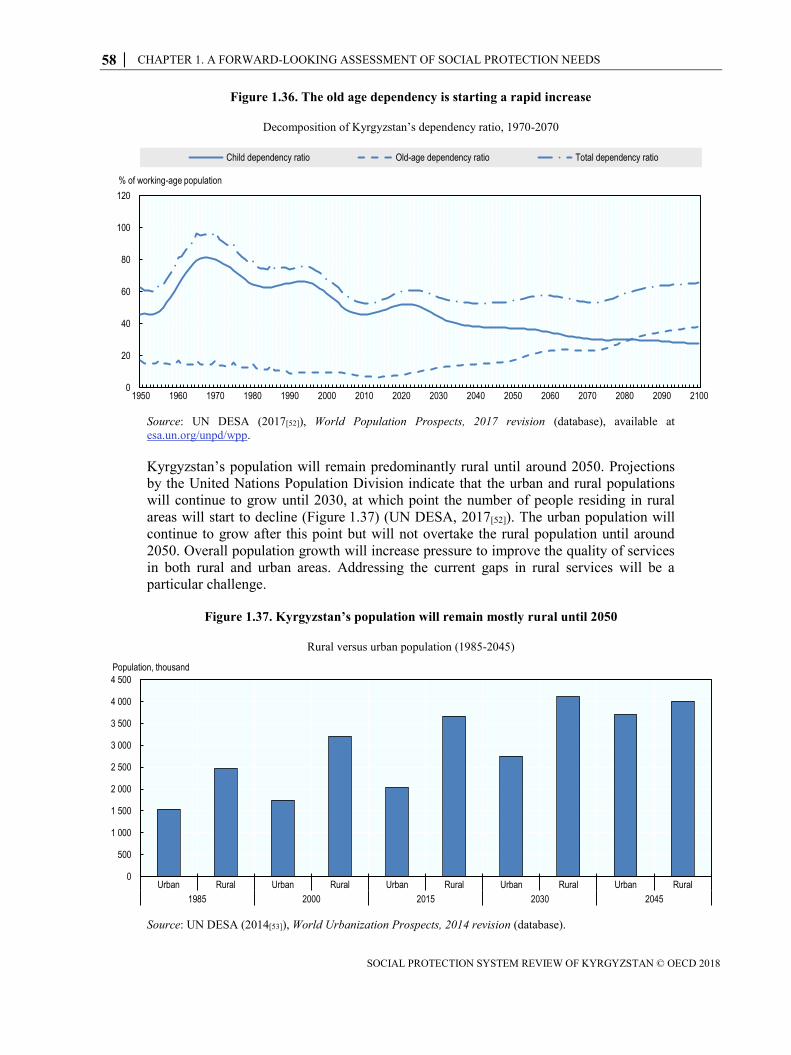
58 │ CHAPTER 1. A FORWARD-LOOKING ASSESSMENT OF SOCIAL PROTECTION NEEDS
SOCIAL PROTECTION SYSTEM REVIEW OF KYRGYZSTAN © OECD 2018
Figure 1.36. The old age dependency is starting a rapid increase
Decomposition of Kyrgyzstan’s dependency ratio, 1970-2070
Source: UN DESA (2017[52]), World Population Prospects, 2017 revision (database), available at
esa.un.org/unpd/wpp.
Kyrgyzstan’s population will remain predominantly rural until around 2050. Projections
by the United Nations Population Division indicate that the urban and rural populations
will continue to grow until 2030, at which point the number of people residing in rural
areas will start to decline (Figure 1.37) (UN DESA, 2017[52]). The urban population will
continue to grow after this point but will not overtake the rural population until around
2050. Overall population growth will increase pressure to improve the quality of services
in both rural and urban areas. Addressing the current gaps in rural services will be a
particular challenge.
Figure 1.37. Kyrgyzstan’s population will remain mostly rural until 2050
Rural versus urban population (1985-2045)
Source: UN DESA (2014[53]), World Urbanization Prospects, 2014 revision (database).
0
20
40
60
80
100
120
1950 1960 1970 1980 1990 2000 2010 2020 2030 2040 2050 2060 2070 2080 2090 2100
% of working-age population
Child dependency ratio Old-age dependency ratio Total dependency ratio
0
500
1 000
1 500
2 000
2 500
3 000
3 500
4 000
4 500
Urban Rural Urban Rural Urban Rural Urban Rural Urban Rural
1985 2000 2015 2030 2045
Population, thousand
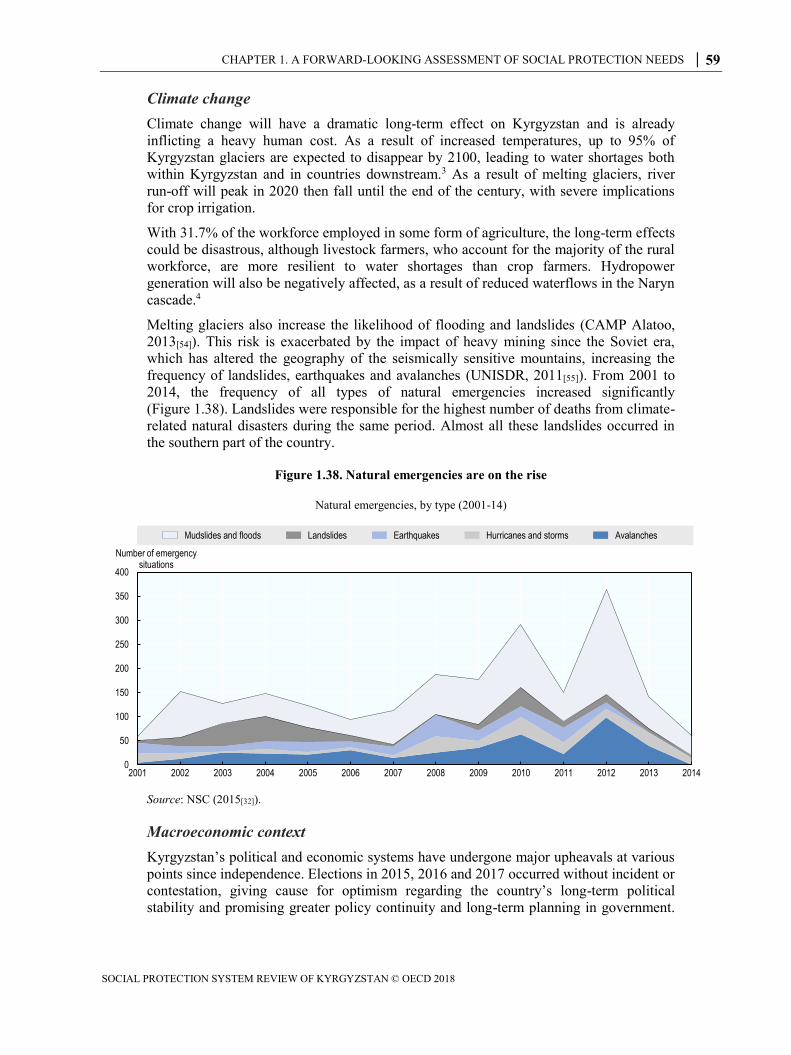
CHAPTER 1. A FORWARD-LOOKING ASSESSMENT OF SOCIAL PROTECTION NEEDS │ 59
SOCIAL PROTECTION SYSTEM REVIEW OF KYRGYZSTAN © OECD 2018
Climate change
Climate change will have a dramatic long-term effect on Kyrgyzstan and is already
inflicting a heavy human cost. As a result of increased temperatures, up to 95% of
Kyrgyzstan glaciers are expected to disappear by 2100, leading to water shortages both
within Kyrgyzstan and in countries downstream.3 As a result of melting glaciers, river
run-off will peak in 2020 then fall until the end of the century, with severe implications
for crop irrigation.
With 31.7% of the workforce employed in some form of agriculture, the long-term effects
could be disastrous, although livestock farmers, who account for the majority of the rural
workforce, are more resilient to water shortages than crop farmers. Hydropower
generation will also be negatively affected, as a result of reduced waterflows in the Naryn
cascade.4
Melting glaciers also increase the likelihood of flooding and landslides (CAMP Alatoo,
2013[54]). This risk is exacerbated by the impact of heavy mining since the Soviet era,
which has altered the geography of the seismically sensitive mountains, increasing the
frequency of landslides, earthquakes and avalanches (UNISDR, 2011[55]). From 2001 to
2014, the frequency of all types of natural emergencies increased significantly
(Figure 1.38). Landslides were responsible for the highest number of deaths from climate-
related natural disasters during the same period. Almost all these landslides occurred in
the southern part of the country.
Figure 1.38. Natural emergencies are on the rise
Natural emergencies, by type (2001-14)
Source: NSC (2015[32]).
Macroeconomic context
Kyrgyzstan’s political and economic systems have undergone major upheavals at various
points since independence. Elections in 2015, 2016 and 2017 occurred without incident or
contestation, giving cause for optimism regarding the country’s long-term political
stability and promising greater policy continuity and long-term planning in government.
0
50
100
150
200
250
300
350
400
2001 2002 2003 2004 2005 2006 2007 2008 2009 2010 2011 2012 2013 2014
Number of emergency situations
Mudslides and floods Landslides Earthquakes Hurricanes and storms Avalanches
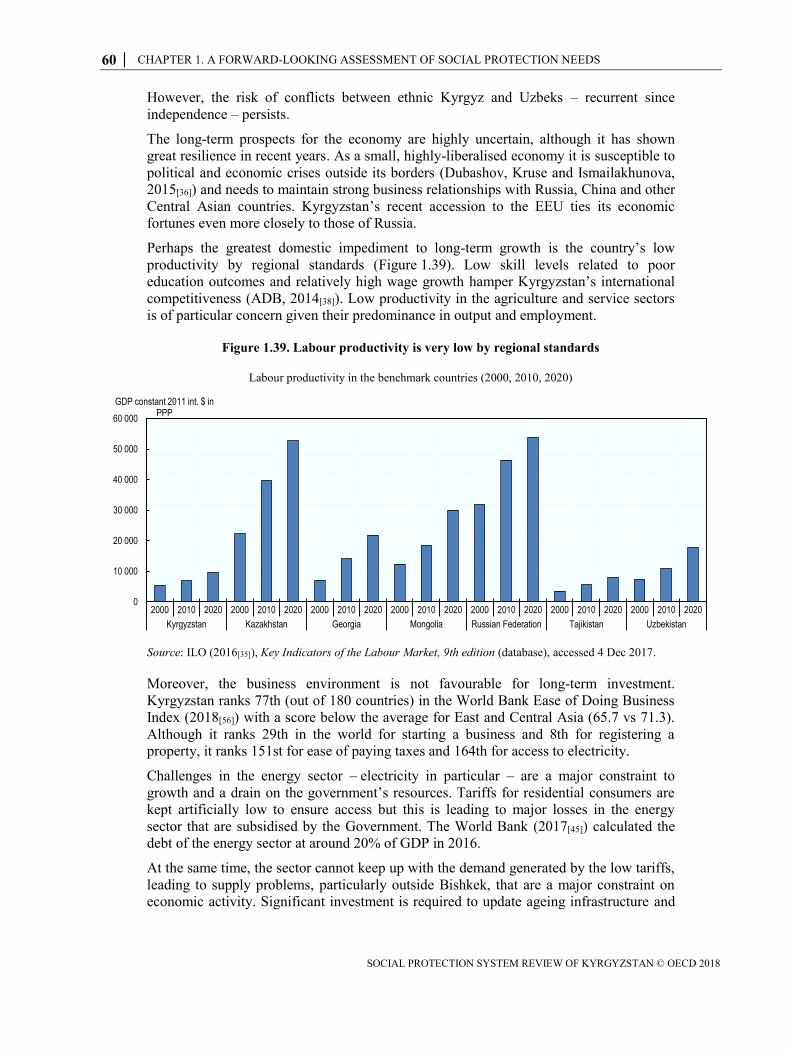
60 │ CHAPTER 1. A FORWARD-LOOKING ASSESSMENT OF SOCIAL PROTECTION NEEDS
SOCIAL PROTECTION SYSTEM REVIEW OF KYRGYZSTAN © OECD 2018
However, the risk of conflicts between ethnic Kyrgyz and Uzbeks – recurrent since
independence – persists.
The long-term prospects for the economy are highly uncertain, although it has shown
great resilience in recent years. As a small, highly-liberalised economy it is susceptible to
political and economic crises outside its borders (Dubashov, Kruse and Ismailakhunova,
2015[36]) and needs to maintain strong business relationships with Russia, China and other
Central Asian countries. Kyrgyzstan’s recent accession to the EEU ties its economic
fortunes even more closely to those of Russia.
Perhaps the greatest domestic impediment to long-term growth is the country’s low
productivity by regional standards (Figure 1.39). Low skill levels related to poor
education outcomes and relatively high wage growth hamper Kyrgyzstan’s international
competitiveness (ADB, 2014[38]). Low productivity in the agriculture and service sectors
is of particular concern given their predominance in output and employment.
Figure 1.39. Labour productivity is very low by regional standards
Labour productivity in the benchmark countries (2000, 2010, 2020)
Source: ILO (2016[35]), Key Indicators of the Labour Market, 9th edition (database), accessed 4 Dec 2017.
Moreover, the business environment is not favourable for long-term investment.
Kyrgyzstan ranks 77th (out of 180 countries) in the World Bank Ease of Doing Business
Index (2018[56]) with a score below the average for East and Central Asia (65.7 vs 71.3).
Although it ranks 29th in the world for starting a business and 8th for registering a
property, it ranks 151st for ease of paying taxes and 164th for access to electricity.
Challenges in the energy sector – electricity in particular – are a major constraint to
growth and a drain on the government’s resources. Tariffs for residential consumers are
kept artificially low to ensure access but this is leading to major losses in the energy
sector that are subsidised by the Government. The World Bank (2017[45]) calculated the
debt of the energy sector at around 20% of GDP in 2016.
At the same time, the sector cannot keep up with the demand generated by the low tariffs,
leading to supply problems, particularly outside Bishkek, that are a major constraint on
economic activity. Significant investment is required to update ageing infrastructure and
0
10 000
20 000
30 000
40 000
50 000
60 000
2000 2010 2020 2000 2010 2020 2000 2010 2020 2000 2010 2020 2000 2010 2020 2000 2010 2020 2000 2010 2020
Kyrgyzstan Kazakhstan Georgia Mongolia Russian Federation Tajikistan Uzbekistan
GDP constant 2011 int. $ in PPP
CHAPTER 1. A FORWARD-LOOKING ASSESSMENT OF SOCIAL PROTECTION NEEDS │ 61
SOCIAL PROTECTION SYSTEM REVIEW OF KYRGYZSTAN © OECD 2018
build new generating capacity but this is not forthcoming given the perilous financial
state of the energy sector.
Measures adopted under the Medium-Term Tariff Policy 2014-17 have improved the
situation. However, it will not be possible to balance supply and demand without
residential consumers paying more for their electricity. Given the reliance on electricity,
especially in bitterly cold winter months, a price shock of this nature could push the large
vulnerable population into poverty.
Thus, the tariffs, while highly regressive, are politically contentious. Previous attempts to
increase tariffs contributed directly to the turmoil in 2010 (discussed in Chapter 2), in
spite of the administration’s attempt to compensate for the increase with higher social
protection benefits.
Notes
1 Latent Class Analysis has been employed in various fields, ranging from marketing to
epidemiology. For LCA applied in a similar context, please see the Cambodia SPSR
(OECD, 2017[57]), Latent Class Analysis of the Out-of-Work Population in Greece, 2007–
11 (World Bank, 2015[58]) and Profile of the Disabled Population in Albania (Ferré,
Galanxhi and Dhono, 2015[59]).
2 Currently, the mandatory prophylactic immunisation programme includes vaccines
against ten infections: Polio, TB, Diphtheria, Pertussis, Tetanus, Measles, Mumps,
Rubella, Hepatitis B and Haemophilus Influenza.
3 These projections are taken from the Agreement between the Republic of Kazakhstan,
Kyrgyzstan, the Republic of Tajikistan, Turkmenistan and the Republic of Uzbekistan on
Cooperation in the Field of Joint Management on Utilisation and Protection of Water
Resources, signed in 1992.
4 These projections are taken from the Agreement between the Republic of Kazakhstan,
Kyrgyzstan, the Republic of Tajikistan, Turkmenistan and the Republic of Uzbekistan on
Cooperation in the Field of Joint Management on Utilisation and Protection of Water
Resources, signed in 1992.
References
ADB (2015), Assessment of higher education: Kyrgyz Republic, Asian Development Bank,
Manila, https://www.adb.org/documents/assessment-higher-education-kyrgyz-republic.
[24]
ADB (2014), The Kyrgyz Republic: Strategic Assessment of the Economy, Asian Development
Bank, Manila, http://, https://www.adb.org/publications/kyrgyz-republic-strategic-
assessment-economy.
[38]
CAMP Alatoo (2013), Testing of Climate Risk Assessment Methodology in Kyrgyzstan, CAMP
Alatoo, UNDP Central Asia Climate Risk Management Program, https://cdkn.org/wp-
content/uploads/2013/08/Climate-Risk-Profile-Fin-clear.pdf.
[54]
62 │ CHAPTER 1. A FORWARD-LOOKING ASSESSMENT OF SOCIAL PROTECTION NEEDS
SOCIAL PROTECTION SYSTEM REVIEW OF KYRGYZSTAN © OECD 2018
Carneiro, P. and J. Heckman (2003), “Human Capital Policy”, Discussion Paper, No. 821,
Institute for the Study of Labor (IZA), Bonn.
[22]
Dembe, A. et al. (2005), “The impact of overtime and long work hours on occupational
injuries and illnesses: new evidence from the United States”, Occupational and
Environmental Medicine, Vol. 62/9, pp. 588-598.
[39]
Agnieszka Pikulicka-Wilczewska Greta Uehling (ed.) (2016), Migration to Russia and the
Current Economic Crisis, E-International Relations Publishing, Bristol.
[44]
DIW/SIPRI (2014), Life in Kyrgyzstan Study, 2011-2013, Version 1.0, German Institute for
Economic Research (DIW Berlin) and Stockholm International Peace Research Institute
(SIPRI), http://dx.doi.org/10.15185/izadp.7055.1.
[49]
Dubashov, B., A. Kruse and S. Ismailakhunova (2015), Kyrgyz Republic - Biannual economic
update: resilience amid turbulence - special focus: meeting the jobs challenge, World
Bank, Washington DC.
[36]
Ferré, C., E. Galanxhi and O. Dhono (2015), Profile of the disabled population in Albania,
United Nations Support to Social Inclusion in Albania Programme, United Nations
Development Programme (UNDP) in Albania,
http://al.undp.org/content/albania/en/home/library/profile-of-the-disabled-population-in-
albania.html..
[59]
Gallup (2016), Gallup World Poll, http://gallup.com/analytics/213704/world-poll.aspx. [51]
HelpAge International (2009), Constant Crisis: Perceptions of vulnerability and social
protection in the Kyrgyz Republic, HelpAge International, Bishkek.
[50]
Hoen, H. (2010), “Transition strategies in Central Asia: is there such a thing as “shock-versus-
gradualism”?”, Economic and Environmental Studies, Vol. 10/2, pp. 229-245.
[2]
Hou, D. (2011), “Education Reform in the Kyrgyz Republic - Lessons from PISA”, Europe
and Central Asia Knowledge Brief, No. 40, World Bank, Washington, DC.
[27]
Ibraimova A., B. Akkazieva and A. Ibraimov (2011), Kyrgyzstan: Health System Review,
European Observatory on Health Systems and Policies, Brussels.
[18]
ILO (2016), Key Indicators of the Labour Market, 9th edition,
http://ilo.org/employment/areas/WCMS_234860.
[35]
ILO (2016), Results of National Child Labour Survey presented in Bishkek, International
Labour Organization, Geneva, http://ilo.org/moscow/news/WCMS_449678/lang--
en/index.htm.
[29]
ILO (2013), School-to-Work Transition Survey: Kyrgyzstan (2013), International Labour
Organization, Geneva, http://ilo.org/employment/areas/WCMS_234860.
[31]
ILO (2008), “Working Children in Kyrgyzstan: Results of the 2007 Child Labour Force
Survey”, International Labour Organization, Bishkek.
[28]
CHAPTER 1. A FORWARD-LOOKING ASSESSMENT OF SOCIAL PROTECTION NEEDS │ 63
SOCIAL PROTECTION SYSTEM REVIEW OF KYRGYZSTAN © OECD 2018
ILO/NSC (2016), Working children in the Kyrgyz Republic: Child Labour Survey 2014-2015,
International Labour Organization (ILO) and National Statistical Committee of the Kyrgyz
Republic, Bishkek, http://ilo.org/wcmsp5/groups/public/---europe/---ro-geneva/---sro-
moscow/documents/publication/wcms_533504.pdf.
[30]
IMF (2017), World Economic Outlook, http://imf.org/external/datamapper/datasets/WEO
(accessed on 01 April 2017).
[6]
IMHE (2016), Global Burden of Disease 2015, Institute for Health Metrics and Evaluation,
Seattle.
[19]
NISS (2014), Informal Employment in Kyrgyzstan, National Institute for Strategic Studies of
the Kyrgyz Republic, Bishkek.
[41]
Nove, A. et al. (2014), “Maternal mortality in adolescents compared with women of other
ages: evidence from 144 countries”, The Lancet Global Health, Vol. 2/3, pp. 155-164,
http://dx.doi.org/10.1016/S2214-109X(13)70179-7.
[34]
NSC (2017), Basic consumer price index in the Kyrgyz Republic (core inflation),
http://stat.kg/en/statistics/uroven-zhizni-naseleniya.
[8]
NSC (2017), Economically active and inactive population, National Statistics Committee of
the Kyrgyz Republic, Bishkek, http://stat.kg/en/statistics/uroven-zhizni-naseleniya.
[37]
NSC (2017), Number of households with incomes below subsistence level,
http://stat.kg/en/statistics/uroven-zhizni-naseleniya.
[5]
NSC (2017), Poverty rate, National Statistics Committee of the Kyrgyz Republic, Bishkek,
http://stat.kg/en/statistics/uroven-zhizni-naseleniya.
[4]
NSC (2016), Poverty rate, National Statistics Committee of the Kyrgyz Republic, Bishkek,
http://stat.kg/en/statistics/uroven-zhizni-naseleniya.
[13]
NSC (2015), Employment and Unemployment. The Results of Integrated Survey of Household
Budgets and Labor Force in 2014, National Statistics Committee of the Kyrgyz Republic,
Bishkek.
[40]
NSC (2015), Kyrgyz Integrated Household Survey, National Statistics Committee of the
Kyrgyz Republic, Bishkek.
[11]
NSC (2015), Living Standards of Population in the Kyrgyz Republic, 2010-2014, National
Statistics Committee of the Kyrgyz Republic, Bishkek.
[32]
NSC (2014), Kyrgyz Integrated Household Survey, National Statistics Committee of the
Kyrgyz Republic, Bishkek.
[10]
NSC (2004), Kyrgyz Integrated Household Survey, National Statistics Committee of the
Kyrgyz Republic, Bishkek.
[9]
64 │ CHAPTER 1. A FORWARD-LOOKING ASSESSMENT OF SOCIAL PROTECTION NEEDS
SOCIAL PROTECTION SYSTEM REVIEW OF KYRGYZSTAN © OECD 2018
NSC/MoH/ICF International (2013), Kyrgyz Republic Demographic and Health Survey 2012,
National Statistical Committee of the Kyrgyz Republic, Ministry of Health of the Kyrgyz
Republic, and ICF International, http://dhsprogram.com/publications/publication-FR283-
DHS-Final-Reports.cfm.
[33]
OECD (2017), Social Protection System Review of Cambodia, OECD Publishing, Paris,
http://dx.doi.org/10.1787/9789264282285-en.
[57]
OECD (2010), Reviews of National Policies for Education: Kyrgyz Republic 2010: Lessons
from PISA, OECD Publishing, Paris, http://dx.doi.org/10.1787/9789264088757-en.
[26]
OECD/ILO (2018), Tackling vulnerability in informality: a household perspective, OECD
Publishing, Parss.
[42]
OPHI (2016), Country briefing 2016: Kyrgyzstan, Multidimensional Poverty Index (MPI) At a
Glance, Oxford Poverty & Human Development Initiative,
http://ophi.org.uk/policy/multidimensional-poverty-index.
[15]
Pomfret, R. (1999), “Living Standards in Central Asia”, MOCT-MOST Economic Policy in
Transitional Economics, Vol. 9/4, pp. 395-421.
[1]
Schweitzer, A. et al. (2015), “Improved coverage and timing of childhood vaccinations in two
post-Soviet countries, Armenia and Kyrgyzstan”, BMC Public Health , Vol. 15, pp. 1-9,
https://doi.org/10.1186/s12889-015-2091-9.
[20]
UN DESA (2017), World Population Prospects: The 2017 Revision, United Nations
Department of Economic and Social Affairs, New York,
http://un.org/en/development/desa/population/publications.
[52]
UN DESA (2014), World Urbanization Prospects: The 2014 Revision, United Nations
Department of Economic and Social Affairs, New York, http://esa.un.org/unpd/wup.
[53]
UNDP (2016), Human Development for Everyone: Briefing note for countries on the 2016
Human Development Report, United Nations Development Programme, New York,
http://hdr.undp.org/sites/all/themes/hdr_theme/country-notes/KGZ.pdf.
[12]
UNESCO (2016), UNESCO Institute for Statistics, United Nations Educational, Scientific and
Cultural Organization.
[23]
UNICEF (2013), Situation analysis of children in the Kyrgyz Republic, United Nations
Children’s Fund, Bishkek, http://unicef.org/kyrgyzstan/sitan_eng.pdf.
[25]
UNICEF (2012), Childcare services in Kyrgyzstan, United Nations Children’s Fund, Bishkek,
http://unicef.org/ceecis/KY_Country_profile_eng_29July_FINALproofed.pdf.
[48]
UNISDR (2011), “Emerging Risks”, in Global Assessment Report on Disaster Risk Reduction,
United Nations International Strategy for Disaster Reduction,
http://preventionweb.net/english/hyogo/gar/2011/en/what/drivers.html.
[55]
CHAPTER 1. A FORWARD-LOOKING ASSESSMENT OF SOCIAL PROTECTION NEEDS │ 65
SOCIAL PROTECTION SYSTEM REVIEW OF KYRGYZSTAN © OECD 2018
Vinokuriv, E. (2013), “The Art of survival: Kyrgyz labor migration, human capital, and social
networks”, Central Asia Economic Paper 7,
http://papers.ssrn.com/sol3/papers.cfm?abstract_id=2741639, pp. 1-9.
[43]
WHO (2016), Diabetes country profiles, Kyrgyzstan, World Health Organization, Geneva,
http://who.int/diabetes/country-profiles/kgz_en.pdf.
[46]
WHO (2016), Global Health Observatory, World Health Organization, Geneva. [21]
WHO (2000), The world health report 2000 - Health systems: improving performance, World
Health Organization, Geneva, http://who.int/whr/2000/en/whr00_en.pdf?ua=1.
[47]
WHO/UNICEF/UNFPA/World Bank Group/United Nations Population Division (2015),
Trends in maternal mortality: 1990 to 2015 – Estimates by WHO, UNICEF, UNFPA,
World Bank Group and the United Nations Population Division, World Health
Organization, Geneva, http://who.int/reproductivehealth/publications/monitoring/maternal-
mortality-2015/en.
[16]
Wiegers, T., W. Boerma and O. de Haan (2010), “Maternity care and birth preparedness in
rural Kyrgyzstan and Tajikistan”, Sexual & reproductive healthcare: official journal of the
Swedish Association of Midwives, Vol. 1/4, pp. 189-194,
http://dx.doi.org/10.1016/j.srhc.2010.08.004.
[17]
World Bank (2018), Doing Business 2018: Reforming to Create Jobs, World Bank,
Washington DC.
[56]
World Bank (2017), Kyrgyz Republic Economic Update, Spring 2017: A Resilient Economy…
on a Slow Growth Trajectory, World Bank, Washington DC,
http://openknowledge.worldbank.org/handle/10986/27523.
[45]
World Bank (2017), World Development Indicators, http://data.worldbank.org/products/wdi
(accessed on 01 June 2017).
[7]
World Bank (2015), Kyrgyz Republic: Poverty profile for 2013, World Bank, Washington DC. [14]
World Bank (2015), Latent Class Analysis of the Out-of-Work Population in Greece,
2007−2011, World Bank, Washington DC,
http://documents.worldbank.org/curated/en/837771468246370480/pdf/918830WP0P14360
240PoLME0Full0Report.pdf.
[58]
World Bank (2015), Poverty and economic mobility in the Kyrgyz Republic - Some insights
from the “Life in Kyrgyzstan Survey", World Bank, Washington DC.
[3]

From:Social Protection System Review of Kyrgyzstan
Access the complete publication at:https://doi.org/10.1787/9789264302273-en
Please cite this chapter as:
OECD (2018), “A forward-looking assessment of social protection needs”, in Social Protection SystemReview of Kyrgyzstan, OECD Publishing, Paris.
DOI: https://doi.org/10.1787/9789264302273-5-en
This work is published under the responsibility of the Secretary-General of the OECD. The opinions expressed and argumentsemployed herein do not necessarily reflect the official views of OECD member countries.
This document and any map included herein are without prejudice to the status of or sovereignty over any territory, to thedelimitation of international frontiers and boundaries and to the name of any territory, city or area.
You can copy, download or print OECD content for your own use, and you can include excerpts from OECD publications,databases and multimedia products in your own documents, presentations, blogs, websites and teaching materials, providedthat suitable acknowledgment of OECD as source and copyright owner is given. All requests for public or commercial use andtranslation rights should be submitted to [email protected]. Requests for permission to photocopy portions of this material forpublic or commercial use shall be addressed directly to the Copyright Clearance Center (CCC) at [email protected] or theCentre français d’exploitation du droit de copie (CFC) at [email protected].