Taking Stock and Looking Forward on Domestic Support ...
146
I Taking Stock and Looking Forward on Domestic Support under the WTO Agreement on Agriculture Lars Brink and David Orden April 2020 IATRC Commissioned Paper 23 Commissioned Paper
-
Upload
khangminh22 -
Category
Documents
-
view
2 -
download
0
Transcript of Taking Stock and Looking Forward on Domestic Support ...
I
Taking Stock and Looking Forward on Domestic Support under the WTO Agreement on Agriculture
Lars Brink and David Orden
April 2020 IATRC Commissioned Paper 23
Commissioned Paper
II
International Agricultural Trade Research Consortium
Commissioned Paper No. 23
Taking Stock and Looking Forward on Domestic Support
under the WTO Agreement on Agriculture
This Commissioned Paper was co-authored by Lars Brink and David Orden, who responded to a call for
Commissioned Papers from the Executive Committee of the IATRC.
Lars Brink
Independent Advisor
Canada
David Orden
Director, Global Issues Initiative, Institute for Society, Culture and Environment (ISCE)
Virginia Polytechnic Institute and State University
United States
The views expressed should not be taken to represent those of the institutions to which the authors are
attached, nor to the IATRC and its funding agencies. Correspondence regarding the content of the paper
should be directed to the author(s).
The International Agricultural Trade Research Consortium (IATRC) is an organization of more than 200
economists from 28 different countries, interested in research, policy analysis, and current developments
in international agricultural trade. It is supported by the United States Department of Agriculture (ERS,
FAS, and OCE), Agriculture and Agri-Food Canada, and the participating organizations. Funding for this
commissioned paper comes from the USDA Foreign Agricultural Service and Agriculture and Agri-Food
Canada.
III
Taking Stock and Looking Forward on Domestic Support
under the WTO Agreement on Agriculture
St. Paul, Minnesota: University of Minnesota, Department of Applied Economics, International
Agricultural Trade Research Consortium
Copies of this paper and other IATRC Publications are available on the website
www.iatrcweb.org
This volume contains information which was presented at an
International Agricultural Trade Research Consortium Annual Meeting,
which was held December 8-10, 2019 in Washington, DC.
IV
Taking Stock and Looking Forward on Domestic Support
under the WTO Agreement on Agriculture
IATRC Commissioned Paper 23
ABSTRACT
This paper reviews the domestic support rules of the WTO Agreement on Agriculture (AoA) and
evaluates the space they generate for different members to provide different kinds and levels of support
subject to and exempt from limits. Economic analysis of support is reviewed, focused on direct payments
to producers and market price support (MPS) measured in the AoA compared to economic price support.
A global overview presents the major changes in members’ domestic support as revealed by their
notifications to the WTO Committee on Agriculture (CoA) for 1995-2016, complemented by selected
subsequent information. Key results are a shift toward less-distorting support (recent support in the
United States since 2018 one exception), concentration of support among a small number of members,
and the rise of China and India as top support providers, along with the European Union, the United
States and Japan.
The paper summarizes discussion within the CoA over the notified information and other questions about
members’ domestic support. It examines the measurement of MPS for wheat and rice in the recent dispute
China ‒ Agricultural Producers and for several products for India, including in three ongoing disputes
India ‒ Measures Concerning Sugar and Sugarcane. Our assessments highlight the problematic aspects
of the AoA measurement. China’s MPS, when measured in line with the dispute settlement ruling, can be
accommodated within its limits while hardly constraining its economic support. Conversely, some
measurements of India’s MPS are far greater than the economic support provided. Such divergences
underlie contention about the consequences of applying the AoA rules. An alternative is considered that
more closely tracks economic support by using lagged international border prices as a reference price.
Members continue to debate domestic support options. Whether progress can be made is uncertain as they
hold fast to longstanding positions on such issues as the rules and limits applying to domestic support as a
whole, to cotton support and to the consequences of acquisition at administered prices of public stocks for
food security purposes. New policy priorities have gained prominence, most notably climate change, but
related also to productivity growth, biosecurity, water management and biodiversity. Governments have
the option to address these and other priorities through green box support exempt from limit. More
explicit green box specifications might clarify what support policies in the area of mitigating climate
change would qualify for exemption.
The paper concludes by assessing how the diverse pressures for change affect the potential of the AoA to
contribute to a fair and market-oriented agricultural trading system. We summarize the major problematic
aspects of the AoA and from these insights suggest options to improve and strengthen the WTO rules and
commitments on domestic support.
Keywords: Agreement on Agriculture, domestic support, price support, payments, notifications, disputes,
negotiations, climate change, Committee on Agriculture, World Trade Organization
JEL Codes: F13, F55, K33, Q17, Q18
V
Taking Stock and Looking Forward on Domestic Support
under the WTO Agreement on Agriculture
IATRC Commissioned Paper 23
ACKNOWLEDGEMENTS
The authors thank David Blandford, J. R. Deep Ford, Christian Häberli, Douglas D. Hedley, Ulla Kask,
Alan Matthews, Fabian Nilsson, Zhong Funing and others for helpful comments on an earlier draft. We
have also benefited from presentations and discussions related to parts of the paper at the 2019 WTO
Public Forum (October), the 2019 IAAE-NAU Inter-conference Symposium (November), the 2019
IATRC annual meeting (December) and seminars at Nanjing Agricultural University (November 2018
and November 2019). Responsibility for the final version of the paper remains with the authors.
ABOUT THE AUTHORS
Lars Brink was Senior Advisor at Agri-Food and Agriculture Canada. He is a Fellow and past president
of the Canadian Agricultural Economics Society and works with national governments, international
organizations and other groups on domestic support matters in agriculture.
David Orden is Director, Global Issues Initiative, Institute for Society, Culture and Environment (ISCE)
at Virginia Polytechnic Institute and State University and from 2002-2016 was Senior Research Fellow at
the International Food Policy Research Institute (IFPRI). He is a former Chair of the IATRC.
CONTACT INFORMATION
Lars Brink, Independent Advisor
4 Brink Road, Chelsea, Quebec
J9B 2C6 Canada
Phone: +1 819-827-0456; Email: [email protected]
David Orden
Institute for Society, Culture and Environment (ISCE)
Virginia Tech Research Center
900 N. Glebe Road
Arlington, VA 22203 USA
Phone: +1 202 386-1964; Email: [email protected]
© Lars Brink and David Orden
VI
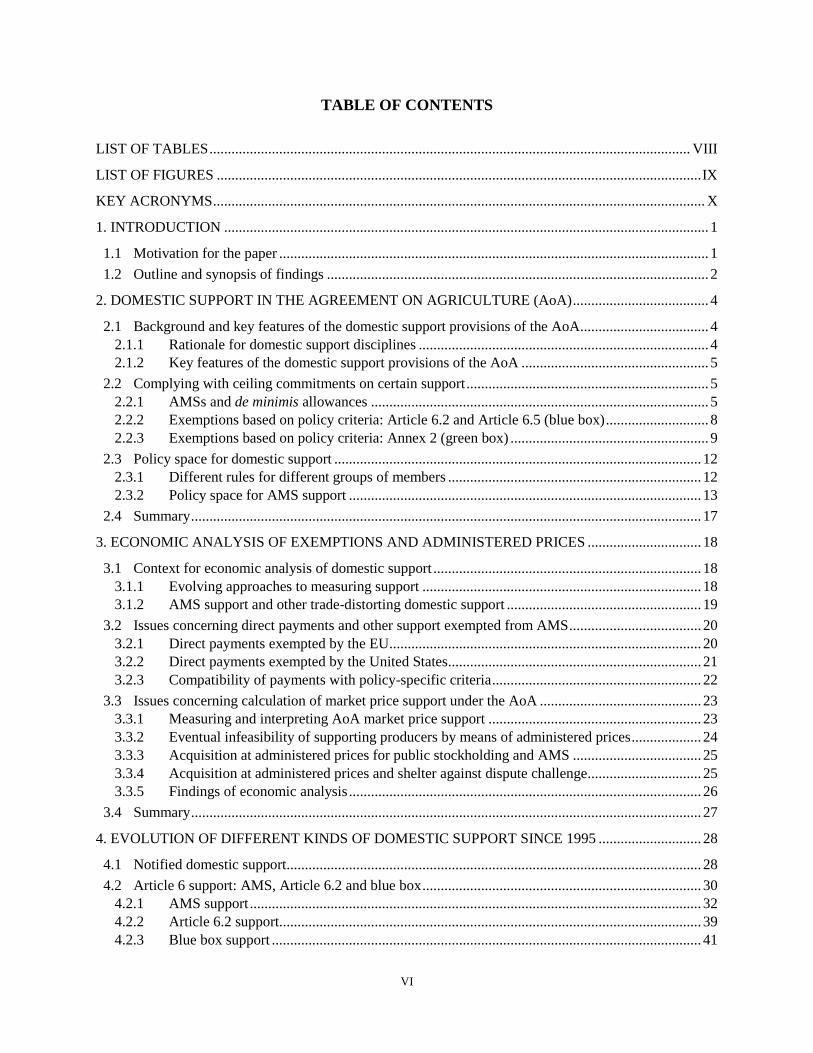
TABLE OF CONTENTS
LIST OF TABLES ................................................................................................................................... VIII
LIST OF FIGURES .................................................................................................................................... IX
KEY ACRONYMS ...................................................................................................................................... X
1. INTRODUCTION .................................................................................................................................... 1
1.1 Motivation for the paper ..................................................................................................................... 1
1.2 Outline and synopsis of findings ........................................................................................................ 2
2. DOMESTIC SUPPORT IN THE AGREEMENT ON AGRICULTURE (AoA) ..................................... 4
2.1 Background and key features of the domestic support provisions of the AoA ................................... 4 2.1.1 Rationale for domestic support disciplines ............................................................................... 4 2.1.2 Key features of the domestic support provisions of the AoA ................................................... 5
2.2 Complying with ceiling commitments on certain support .................................................................. 5 2.2.1 AMSs and de minimis allowances ............................................................................................ 5 2.2.2 Exemptions based on policy criteria: Article 6.2 and Article 6.5 (blue box) ............................ 8 2.2.3 Exemptions based on policy criteria: Annex 2 (green box) ...................................................... 9
2.3 Policy space for domestic support .................................................................................................... 12 2.3.1 Different rules for different groups of members ..................................................................... 12 2.3.2 Policy space for AMS support ................................................................................................ 13
2.4 Summary ........................................................................................................................................... 17
3. ECONOMIC ANALYSIS OF EXEMPTIONS AND ADMINISTERED PRICES ............................... 18
3.1 Context for economic analysis of domestic support ......................................................................... 18 3.1.1 Evolving approaches to measuring support ............................................................................ 18 3.1.2 AMS support and other trade-distorting domestic support ..................................................... 19
3.2 Issues concerning direct payments and other support exempted from AMS .................................... 20 3.2.1 Direct payments exempted by the EU ..................................................................................... 20 3.2.2 Direct payments exempted by the United States ..................................................................... 21 3.2.3 Compatibility of payments with policy-specific criteria ......................................................... 22
3.3 Issues concerning calculation of market price support under the AoA ............................................ 23 3.3.1 Measuring and interpreting AoA market price support .......................................................... 23 3.3.2 Eventual infeasibility of supporting producers by means of administered prices ................... 24 3.3.3 Acquisition at administered prices for public stockholding and AMS ................................... 25 3.3.4 Acquisition at administered prices and shelter against dispute challenge............................... 25 3.3.5 Findings of economic analysis ................................................................................................ 26
3.4 Summary ........................................................................................................................................... 27
4. EVOLUTION OF DIFFERENT KINDS OF DOMESTIC SUPPORT SINCE 1995 ............................ 28
4.1 Notified domestic support ................................................................................................................. 28
4.2 Article 6 support: AMS, Article 6.2 and blue box ............................................................................ 30 4.2.1 AMS support ........................................................................................................................... 32 4.2.2 Article 6.2 support................................................................................................................... 39 4.2.3 Blue box support ..................................................................................................................... 41
VII
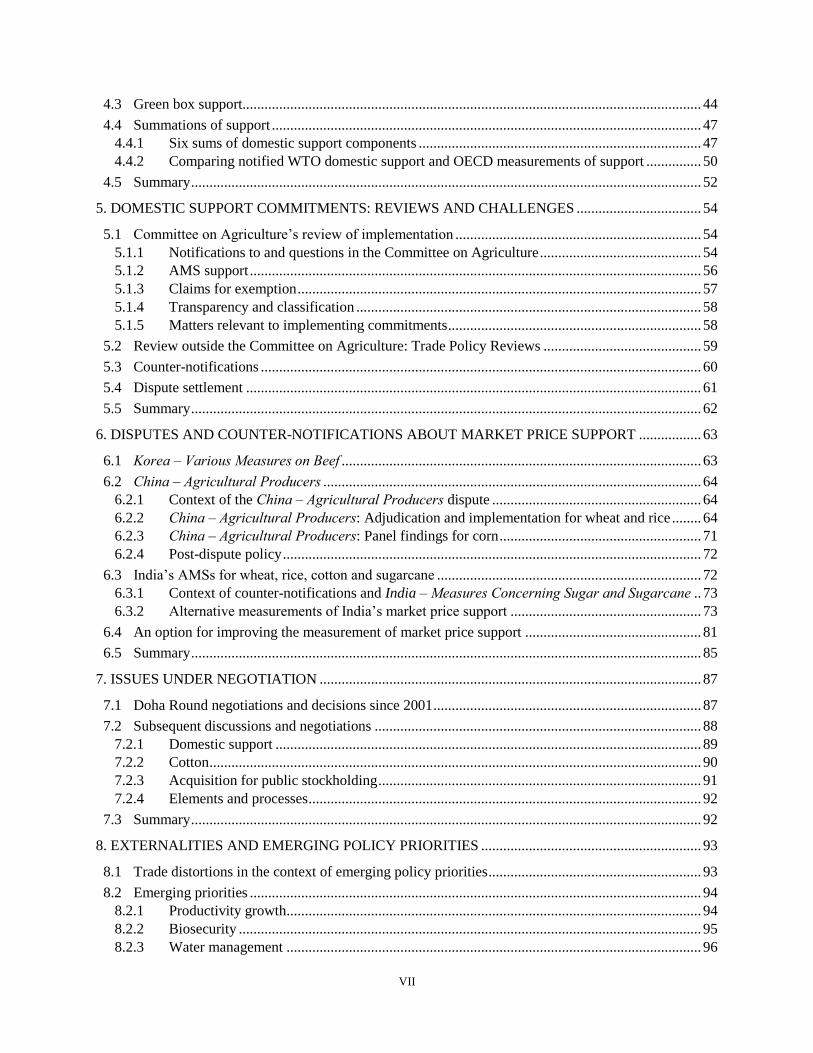
4.3 Green box support............................................................................................................................. 44
4.4 Summations of support ..................................................................................................................... 47 4.4.1 Six sums of domestic support components ............................................................................. 47 4.4.2 Comparing notified WTO domestic support and OECD measurements of support ............... 50
4.5 Summary ........................................................................................................................................... 52
5. DOMESTIC SUPPORT COMMITMENTS: REVIEWS AND CHALLENGES .................................. 54
5.1 Committee on Agriculture’s review of implementation ................................................................... 54 5.1.1 Notifications to and questions in the Committee on Agriculture ............................................ 54 5.1.2 AMS support ........................................................................................................................... 56 5.1.3 Claims for exemption .............................................................................................................. 57 5.1.4 Transparency and classification .............................................................................................. 58 5.1.5 Matters relevant to implementing commitments ..................................................................... 58
5.2 Review outside the Committee on Agriculture: Trade Policy Reviews ........................................... 59
5.3 Counter-notifications ........................................................................................................................ 60
5.4 Dispute settlement ............................................................................................................................ 61
5.5 Summary ........................................................................................................................................... 62
6. DISPUTES AND COUNTER-NOTIFICATIONS ABOUT MARKET PRICE SUPPORT ................. 63
6.1 Korea ‒ Various Measures on Beef .................................................................................................. 63
6.2 China ‒ Agricultural Producers ....................................................................................................... 64 6.2.1 Context of the China ‒ Agricultural Producers dispute ......................................................... 64 6.2.2 China ‒ Agricultural Producers: Adjudication and implementation for wheat and rice ........ 64 6.2.3 China ‒ Agricultural Producers: Panel findings for corn ....................................................... 71 6.2.4 Post-dispute policy .................................................................................................................. 72
6.3 India’s AMSs for wheat, rice, cotton and sugarcane ........................................................................ 72 6.3.1 Context of counter-notifications and India ‒ Measures Concerning Sugar and Sugarcane .. 73 6.3.2 Alternative measurements of India’s market price support .................................................... 73
6.4 An option for improving the measurement of market price support ................................................ 81
6.5 Summary ........................................................................................................................................... 85
7. ISSUES UNDER NEGOTIATION ........................................................................................................ 87
7.1 Doha Round negotiations and decisions since 2001 ......................................................................... 87
7.2 Subsequent discussions and negotiations ......................................................................................... 88 7.2.1 Domestic support .................................................................................................................... 89 7.2.2 Cotton ...................................................................................................................................... 90 7.2.3 Acquisition for public stockholding ........................................................................................ 91 7.2.4 Elements and processes ........................................................................................................... 92
7.3 Summary ........................................................................................................................................... 92
8. EXTERNALITIES AND EMERGING POLICY PRIORITIES ............................................................ 93
8.1 Trade distortions in the context of emerging policy priorities .......................................................... 93
8.2 Emerging priorities ........................................................................................................................... 94 8.2.1 Productivity growth................................................................................................................. 94 8.2.2 Biosecurity .............................................................................................................................. 95 8.2.3 Water management ................................................................................................................. 96
VIII
8.2.4 Biodiversity ............................................................................................................................. 97 8.2.5 Climate change mitigation ...................................................................................................... 98
8.3 Summary ......................................................................................................................................... 101
9. LESSONS FROM TWENTY-FIVE YEARS OF IMPLEMENTATION EXPERIENCE ................... 102
9.1 Overview considerations ................................................................................................................ 102
9.2 Problematic dimensions of the AoA rules and limits ..................................................................... 104 9.2.1 Concentration of support ....................................................................................................... 104 9.2.2 Bound Total AMS ................................................................................................................. 104 9.2.3 De minimis limits and thresholds .......................................................................................... 105 9.2.4 Product-specific versus non-product-specific support .......................................................... 106 9.2.5 Market price support ............................................................................................................. 106 9.2.6 Article 6.2 ............................................................................................................................. 107 9.2.7 Article 6.5 (blue box) ............................................................................................................ 108 9.2.8 Annex 2 (green box) ............................................................................................................. 108
9.3 Addressing the problematic dimensions of the AoA ...................................................................... 109 9.3.1 Balancing and reducing Article 6 support ............................................................................. 109 9.3.2 Improving the measurement of market price support ........................................................... 110
9.4 Managing domestic support in the era of Covid-19 ....................................................................... 111
9.5 Final remark .................................................................................................................................... 111
REFERENCES ......................................................................................................................................... 112
APPENDIX A. PROVISIONS MOST RELEVANT TO DOMESTIC SUPPORT IN THE AGREEMENT
ON AGRICULTURE ................................................................................................................................ 125
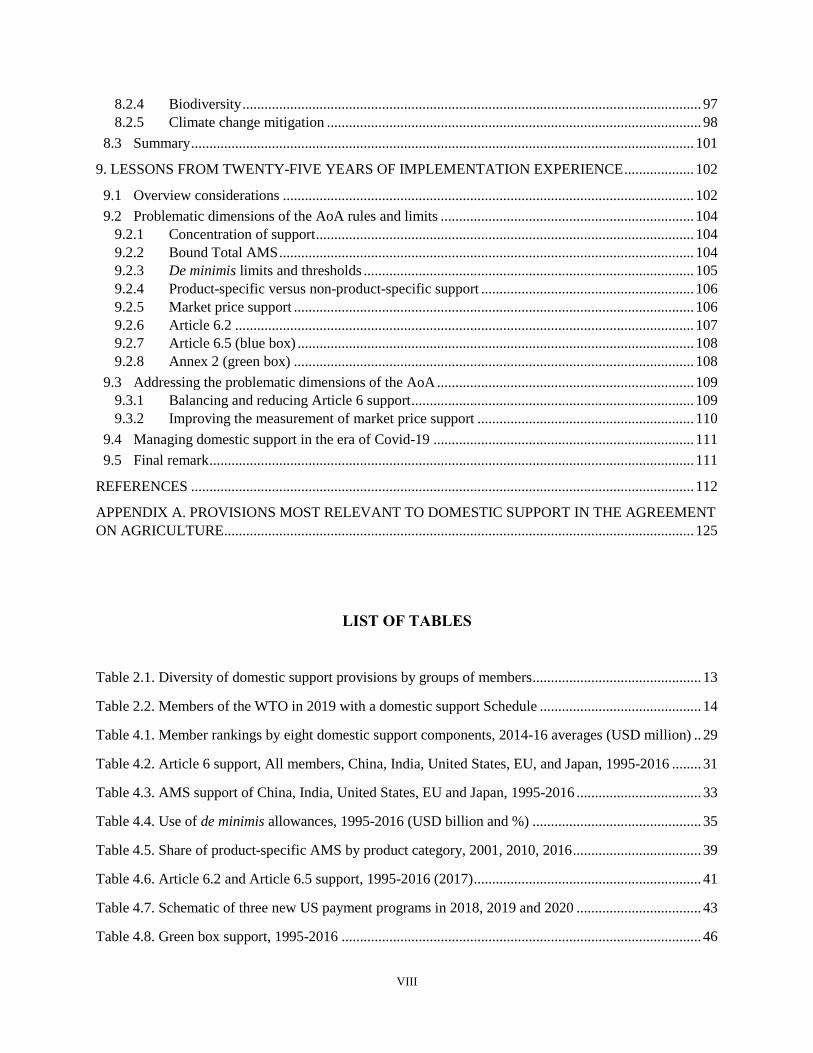
LIST OF TABLES
Table 2.1. Diversity of domestic support provisions by groups of members .............................................. 13
Table 2.2. Members of the WTO in 2019 with a domestic support Schedule ............................................ 14
Table 4.1. Member rankings by eight domestic support components, 2014-16 averages (USD million) .. 29
Table 4.2. Article 6 support, All members, China, India, United States, EU, and Japan, 1995-2016 ........ 31
Table 4.3. AMS support of China, India, United States, EU and Japan, 1995-2016 .................................. 33
Table 4.4. Use of de minimis allowances, 1995-2016 (USD billion and %) .............................................. 35
Table 4.5. Share of product-specific AMS by product category, 2001, 2010, 2016 ................................... 39
Table 4.6. Article 6.2 and Article 6.5 support, 1995-2016 (2017) .............................................................. 41
Table 4.7. Schematic of three new US payment programs in 2018, 2019 and 2020 .................................. 43
Table 4.8. Green box support, 1995-2016 .................................................................................................. 46
IX
Table 4.9. Six summations of domestic support components, 1995-2016 .................................................. 48
Table 5.1. Questions on domestic support in the Committee on Agriculture, 1995-2019 .......................... 55
Table 5.2. Counter-notifications regarding market price support in India .................................................. 60
Table 5.3. WTO disputes regarding domestic support ................................................................................ 62
Table 6.1. Panel determination of China's AMSs for wheat and rice, 2012-15 .......................................... 66
Table 6.2. Alternative calculations of China's %MPS for wheat, 2012-15 ................................................. 67
Table 6.3. Alternative calculations of China's %MPS for rice, 2012-15 .................................................... 69
Table 6.4. Alternative measurements of India’s %MPS for wheat, rice, cotton and sugarcane, 2010-17 .. 77
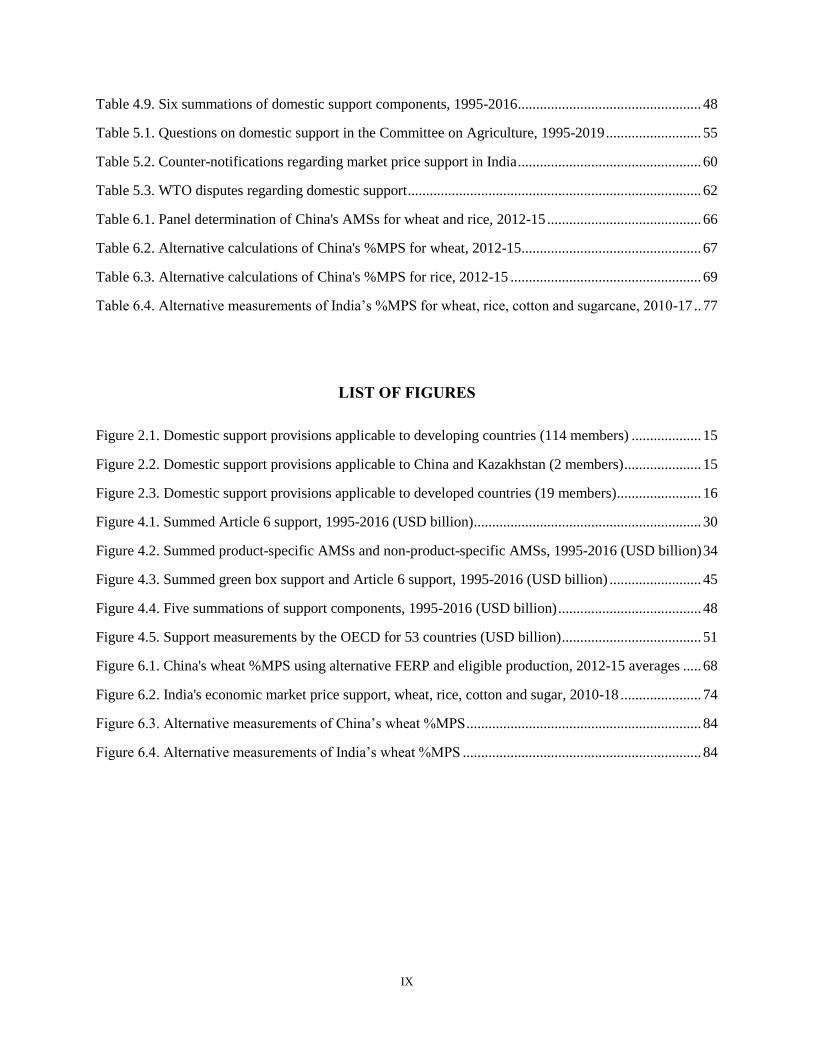
LIST OF FIGURES
Figure 2.1. Domestic support provisions applicable to developing countries (114 members) ................... 15
Figure 2.2. Domestic support provisions applicable to China and Kazakhstan (2 members) ..................... 15
Figure 2.3. Domestic support provisions applicable to developed countries (19 members)....................... 16
Figure 4.1. Summed Article 6 support, 1995-2016 (USD billion) .............................................................. 30
Figure 4.2. Summed product-specific AMSs and non-product-specific AMSs, 1995-2016 (USD billion) 34
Figure 4.3. Summed green box support and Article 6 support, 1995-2016 (USD billion) ......................... 45
Figure 4.4. Five summations of support components, 1995-2016 (USD billion) ....................................... 48
Figure 4.5. Support measurements by the OECD for 53 countries (USD billion) ...................................... 51
Figure 6.1. China's wheat %MPS using alternative FERP and eligible production, 2012-15 averages ..... 68
Figure 6.2. India's economic market price support, wheat, rice, cotton and sugar, 2010-18 ...................... 74
Figure 6.3. Alternative measurements of China’s wheat %MPS ................................................................ 84
Figure 6.4. Alternative measurements of India’s wheat %MPS ................................................................. 84
X
KEY ACRONYMS
AAP Applied Administered Price
AB Appellate Body
AMS Aggregate Measurement of Support
AoA Agreement on Agriculture
ASCM Agreement on Subsidies and Countervailing Measures
BTAMS Bound Total AMS
CoA Committee on Agriculture
CNY Chinese yuan
CoAgSS Committee on Agriculture in Special Session
CTAMS Current Total AMS
DDA Doha Development Agenda
DSB Dispute Settlement Body
DSU Dispute Settlement Understanding
EC European Communities; European Commission
EU European Union
EUR Euro
FAO Food and Agriculture Organization of the United Nations
FAOSTAT Statistics Division of the FAO
FBTAMS Final Bound Total AMS
FERP Fixed External Reference Price
GATT General Agreement on Tariffs and Trade
GHG Greenhouse gases
GSSE General Services Support Estimate
IATRC International Agricultural Trade Research Consortium
INR Indian rupee
MPS Market Price Support
NPS Non-product-specific
OECD Organization for Economic Cooperation and Development
PODS Producer-oriented Domestic Support
PS Product-specific
PSE Producer Support Estimate (earlier Producer Subsidy Equivalent)
TPR Trade Policy Review
US United States
USD United States dollar
VoP Value(s) of production
WTO World Trade Organization
1
1. INTRODUCTION
1.1 Motivation for the paper
Domestic support in agriculture is one of three major policy areas subject to the rules and
commitments of the Agreement on Agriculture (AoA) of the World Trade Organization (WTO). While
the other two areas – market access and export competition – concern policy measures applying at the
border, domestic support concerns the amount of support provided through policy measures applying
inside the border. Indeed, during the Uruguay Round of trade negotiations in 1986-94 the discussions of
what became the domestic support provisions of the AoA sometimes identified them as internal support
provisions. The AoA imposes a limit on some domestic support without applying an injury test. The
inclusion of such provisions in a trade agreement was novel.
As part of the AoA the domestic support provisions seek to correct and prevent restrictions and
distortions in world agricultural markets. This is to be achieved by substantial progressive reductions in
agricultural support and protection while having regard to what the AoA calls non-trade concerns, which
include food security and the need to protect the environment, as well as other concerns (Preamble AoA,
WTO 1994a). In the absence of a conclusive Doha Round (Doha Development Agenda) of subsequent
negotiations, the rules and commitments of the AoA remain the obligations of the WTO’s members.
The International Agricultural Trade Research Consortium (IATRC) played a significant role in
informing the discussions of domestic support in the Uruguay Round, both in capitals where countries
developed their positions and in formal and informal negotiating sessions among countries in Geneva and
elsewhere. Examples of this ground-breaking work include the series of “Bringing Agriculture into the
GATT” papers, particularly Bredahl et al. (1988), Abbott et al. (1988), Barichello et al. (1988), Ballenger
et al. (1990), Magiera et al. (1990), Bredahl et al. (1990), and Bredahl et al. (1991). They also include the
evaluation by Josling et al. (1994) as well as a large number of writings by many of the same and other
authors in a variety of forms during and after the negotiations. With a few years of experience with the
AoA and looking towards the Doha Round of negotiations, the IATRC arranged a series of papers to
examine the issues and options, where Kennedy et al. (2001) focused on domestic support.
Although the inconclusive Doha Round negotiations have essentially faltered since 2008, some of
the few issues that have been the subject of continued WTO negotiations relate to domestic support.
Adjudication under the WTO dispute settlement process in 2000 (Korea ‒ Various Measures on Beef,
DS161, DS169), in 2019 (China ‒ Agricultural Producers, DS511), and ongoing in 2020 (India ‒
Measures Concerning Sugar and Sugarcane, DS579, DS580, DS581) are clarifying the interpretation of
the AoA provisions concerning measurement of the market price support (MPS) component of domestic
support. These and other domestic support rules and their interpretation remain in play.
The global landscape of applied domestic support subject to WTO rules also has changed
drastically in the more than twenty-five years since the AoA negotiations were completed. New members
have acceded to the WTO, members have significantly raised or reduced the amounts of domestic support
they provide, and members have changed the nature of their policies providing such support. Numerous
new policy priorities have emerged or gained more prominence, including, most notably, climate change,
involving mitigation and adaptation, as well as productivity growth, biosecurity, water management,
biodiversity, and sustainability and food security in the context of the United Nations development goals.
Thus, while the AoA remains an instrument for reining in trade distortions associated with
domestic support, there is a complex concurrence of changes in the global landscape of applied domestic
2
support, findings of recent and ongoing dispute settlement, continuing discussions and partial
negotiations, and emergent policy priorities. This motivates the present paper to take stock of the current
situation and to look forward on domestic support in agriculture under the WTO rules and commitments.
While domestic support by itself continues to be a high-profile issue both in implementing and
renegotiating the AoA, governments’ domestic support policies in agriculture operate in a complex and
dynamic context of other policy pressures within and beyond agriculture. There are broad calls for reform
of the WTO. Challenges to the WTO as an institution have risen to the critical point of paralyzing its
dispute settlement appeals process since December 2019. This larger context also includes the growing
question of what role any distinction between developing and developed country members would play in
the continued negotiations and the eventual result. These and other dimensions of the context make it
uncertain when, or even whether, a substantive and systematic renegotiation of the AoA including its
domestic support provisions might occur. It is also uncertain whether incremental progress can be made
on the issues that have remained under discussion, such as the rules and limits applying to domestic
support as a whole, to cotton support, and to the consequences of developing-country acquisition at
administered prices of public stocks for food security purposes. Reaching an outcome on any of these
issues will depend not only on what changes may be agreed in the domestic support provisions by
themselves but also in other provisions in the AoA and in wider negotiations in the WTO.
A second and more imminent challenge has arisen since January 2020 from the Covid-19
pandemic and the consequent deep global economic downturn. While our analysis was completed largely
before the pandemic emerged, many of the issues addressed become even more germane with its onset. In
the near term, agricultural and food production and distribution have been disrupted. Pressure is rising to
support farmers and food processors as part of unprecedented policy responses. Whether WTO domestic
support rules and commitments will help guide this support into least-distorting channels remains to be
seen. Longer term, the pandemic has exposed the fragility of the integrated world economy. Stronger
international institutions and cooperation will be needed to help counter tendencies in some countries to
forgo the benefits of integration. Reinvigorated engagement through the WTO to guide global trade
relations may prevail in this setting but cannot be taken for granted. Forward-looking initiatives would
need to include revisiting the rules and commitments in agriculture, including those for domestic support.
1.2 Outline and synopsis of findings
The paper is organized as follows. The next section reviews the rules of the AoA and how they
generate the space that different members of the WTO can use for different kinds of domestic support in
agriculture. Support subject to and exempt from limits and differences in the support options and
commitments among members are key distinctions in this regard. The third section discusses several of
the major issues where economic analysis has illuminated the working of the AoA rules, with a two-part
focus on direct payments to producers in the European Union (EU) and the United States and MPS as
measured in the AoA compared to economic price support.
The fourth section of the paper provides a global overview of the major changes over time in
members’ domestic support of different kinds as revealed by their notifications to the WTO Committee
on Agriculture (CoA) covering the years 1995-2016 on which data is available from a large share of the
members. This is complemented by selected observations for several key members for subsequent years.
Three main results are a shift toward less-distorting support (increased support by the United States since
2018 is one recent exception), the concentration of support among a small number of members, and the
notable rise of China and India among the top five support providers, along with the EU, the United
States and Japan, each with different designs of support policies and programs.
3
The fifth section provides discussion of different understandings of the AoA rules and members’
commitments as expressed in the CoA. Of the more than 3,300 questions about domestic support raised
through 2019, most concern members’ measurement of non-exempt support and exemption claims under
the AoA’s Annex 2 (green box). The section presents a summary of recent formal counter-notifications to
the CoA and the WTO disputes that have concerned domestic support. The first such counter-notifications
were submitted in 2018 and 2019, focused on India’s MPS for five crops: wheat, rice, cotton, sugarcane
and pulses (WTO 2018a,h,i; WTO 2019a). Of the nine disputes initiated about domestic support since
1995, three have advanced to having a report adopted by the Dispute Settlement Body. Arguments are
currently being marshalled in the disputes initiated in 2019, by Australia, Brazil and Guatemala,
concerning India’s support for sugarcane and alleged export subsidies for sugar.
The sixth section of the paper analyses the MPS component of domestic support in China, as
assessed in 2019 by the dispute panel (WTO 2019c), and in India, as assessed in the notifications,
counter-notifications and a submission in the ongoing sugarcane disputes (DFAT 2020). The analysis
highlights the problematic aspects of the AoA measurement. China’s recent support for wheat and rice,
when measured in line with the dispute panel ruling on MPS in 2012-15, can be accommodated within
China’s limits while constraining its economic support only modestly. India notifies MPSs within its
limits under the AoA (rice in 2018 is a recent exception), while the measurement of India’s MPSs as
counter-notified and in Australia’s first submission on sugarcane are far greater than notified by India or
measured as economic support. Such divergences underlie much of the contention that has built up over
the years about applying the AoA rule. We evaluate an alternative measurement of MPS that more closely
tracks economic support by using lagged international border prices as a reference price.
The negotiations on updating the AoA are also proceeding in piecemeal fashion. The seventh
section reviews the domestic support issues which figured prominently in these discussions as members
prepared for the 12th WTO ministerial conference originally planned for 2020. Some members consider
that current negotiations must incorporate earlier progress included in 2008 draft modalities of the Doha
Round, others consider that the context for negotiations has changed such that the earlier progress is now
out of date. Members generally hold fast to their longstanding positions on key issues.
Many of the pressures governments face today in agriculture are different from those when the
AoA was negotiated, and the policies that provide domestic support in favour of agricultural producers
are addressing evolving priorities. The eighth section of the paper discusses the potential to accommodate
support in the areas of productivity growth, biosecurity, water management, biodiversity and mitigation of
climate change within the AoA domestic support provisions. Governments have the option of addressing
these and other priorities through green box policies under which support is not subject to limit. This
offers unlimited room for support, whether expenditures on general services or direct payments to
producers, through policies that meet certain requirements and criteria. The requirements and criteria are
open-ended and can thus accommodate policies addressing many kinds of priorities. There may be a need
to clarify, through particular criteria and conditions beyond those in the current green box, what kind of
support policies in the area of mitigating climate change would qualify for exemption from limit.
The paper concludes, in the ninth section, by integrating across the descriptive material and
analysis presented to take stock and assess how the diverse pressures for change affect potential to reach
the objective, as stated in the AoA, of “establish[ing] a fair and market-oriented agricultural trading
system” (WTO 1994a). We summarize what we conclude have proven to be the major problematic
aspects of the AoA and those less so. From these insights, we make several suggestions about where
trade-offs or improvements might be found that would strengthen the rules and commitments and keep
the AoA relevant to today’s trade and policy context.
4
2. DOMESTIC SUPPORT IN THE AGREEMENT ON AGRICULTURE (AOA)
This section summarizes the motivation for and development of discipline on domestic support. It
reviews the AoA provisions involving limits on domestic support provided under certain kinds of policies
and the exemptions available for different groups of members. This underpins a discussion of the
unlimited policy space for some support, the interpretation of the exemption rules, and the magnitude of
the policy space for support that is subject to limit. The section elaborates upon the numerous previous
descriptions and assessments of the AoA domestic support rules, including on the WTO website, those of
the IATRC, and in a series of previous assessments by the authors (e.g., Brink 2009; Orden et al. 2011;
Brink 2018a).
2.1 Background and key features of the domestic support provisions of the AoA
2.1.1 Rationale for domestic support disciplines
The motivation for including rules on domestic support in agriculture in a trade agreement,
otherwise concerned about border measures, was articulated already by Haberler (GATT 1958) as chair of
a panel of experts set up by the contracting parties of the General Agreement on Tariffs and Trade
(GATT). While the 1947 GATT agreement and the subsequent three rounds of negotiations had made
overall progress in liberalizing trade in general, the panel was to examine, among other issues, a
“widespread resort to agricultural protection”. The Haberler report distinguished between measures that
directly discourage imports and encourage exports, i.e., border measures, from measures that “directly
encourage home production”. This distinction was the seed for what eventually in the Uruguay Round of
GATT negotiations became the domestic support provisions of the 1994 WTO AoA.
Finding agreement on disciplines on support and protection in agriculture eluded negotiators in
many GATT rounds. Discussion of the use and effects of policy measures other than border measures in
agriculture was complicated by the diversity of such measures. For example, two of the major adversaries
in agricultural trade policy in the 1970s and 1980s – the European Communities (EC) and the United
States – supported their agricultural producers differently. In stylized terms, the EC relied more on price
policy and the United States relied more on producer payments.
Under the aegis of the Food and Agriculture Organization of the United Nations (FAO) and
inspired by Max Corden’s writings, Tim Josling had developed quantitative estimates of the size of the
policy support provided to agricultural producers in the EC, the United States and several other countries
(FAO 1973, 1975).1 This indicator, labelled a Producer Subsidy Equivalent and later renamed the
Producer Support Estimate (PSE), essentially summed the support provided through payments and
through price policy, with the latter being measured using the gap between the domestic price and an
international reference price. A country’s measured support for a product thus derived from both domestic
policies (payments and price policies) and any border protection policies that enabled the domestic price
to exceed the corresponding international price at the border.
Following further development of the PSE by Josling, the Organization for Economic
Cooperation and Development (OECD), the U.S. Department of Agriculture, and other organizations
1 The development of these estimates was in line with the Haberler recommendation that “the GATT and the FAO
should be asked to make a detailed joint study to establish such measurements of the degrees of agricultural
protectionism” (GATT 1958). The “such measurements” phrase refers to measurement of “the percentage by which
the price (including any subsidy) received by the domestic producer exceeded” the border price.
5
elaborated on versions of the PSE indicator around the 1986 start of the Uruguay Round negotiations
(OECD 1987; USDA 1987). These developments were to a large extent driven by the desire to have
economically meaningful and comparable indicators of producer support, whether delivered through
border measures or through price policies or producer payments, for use in economic modelling and
assessment of alternative scenarios in the Uruguay Round negotiations.
2.1.2 Key features of the domestic support provisions of the AoA
The Uruguay Round negotiations eventually resulted in the AoA, with separate provisions for
border measures in agriculture concerning market access and export competition and for domestic support
in agriculture. On domestic support the AoA identifies the ceiling limit or limits to which certain kinds of
domestic support are subject, gives criteria for the policies under which support is not subject to limit or
limits, and lays down rules for measuring the limited domestic support against commitments to reduce
support from its base period level.2 The AoA also establishes the Committee on Agriculture and
articulates its role, and specifies the relationship between the AoA and other agreements of the WTO,
including the Dispute Settlement Understanding (DSU). Members agreed to initiate one year before the
year 2000 a process for continued negotiation of substantial progressive reductions in support and
protection. These negotiations were later made part of the Doha Round negotiations and are conducted in
the Committee on Agriculture in Special Session (CoAgSS).
Although the AoA rules for measuring some domestic support trace their conceptual origin to the
PSE as developed by Josling, they deviate from its economic rationale in several ways.3 Most
importantly, the measurement of the price-gap based support under the AoA uses a policy-determined
applied administered price (AAP), not the actual producer price, and it uses a constant instead of the
current reference price at the border, with the base period for this fixed external reference price (FERP)
dating back to 1986-88 for the original WTO members. In the AoA measurement of support, this price
gap is multiplied by a policy-determined quantity entitled to receive the administered price, which is not
necessarily the total production, to calculate what is called market price support (MPS) as set out in
Annex 3. Thus, the variables in the AoA measurement of price support are only domestic policy variables
even though a government needs also to operate certain border policies in order for producers to receive
the administered price. This reliance on policy variables responded to some governments’ reluctance
(voiced particularly by the EC) to take legally binding ceiling commitments on support that was measured
using variables which they could not control. This has proven problematic, as discussed in Section 3 and
elsewhere in this paper.
2.2 Complying with ceiling commitments on certain support
2.2.1 AMSs and de minimis allowances
Each member of the WTO has a legally binding Schedule of Concessions and Commitments,
which for many members comprises hundreds of pages. In the Schedule, the one-page Part IV, Section I,
gives the member’s bound commitment level in domestic support, expressed as a “Total AMS
Commitment”. It is referred to here as the Bound Total Aggregate Measurement of Support (BTAMS). A
member is not allowed to provide a yearly amount of domestic support, measured as a Current Total
2 Appendix A of this paper presents those parts of the AoA that relate most directly to domestic support, including
its Annexes 2, 3, and 4.
3 The path from Josling’s PSE (FAO 1973; 1975) to the measurements enshrined in the AoA and their use was not
direct or straightforward (see, e.g., Legg and Blandford 2019 and Brink 2011).
6
Aggregate Measurement of Support (CTAMS), larger than its BTAMS (Art. 3.2) and is in compliance if
it does not do so (Art. 6.3).4 While most members’ Schedules show a nil, zero or blank for the BTAMS,
the Schedules of 15 developed countries and 17 developing countries show a positive amount of
BTAMS).
The AoA imposes “reduction commitments” on domestic support, meaning that the annual
BTAMS was reduced over a number of years.5 Original members of the WTO carried out this reduction
from 1995 to 2000 (developed countries) or to 2004 (developing countries).6 Seven of the 36 members
that have acceded to the WTO after 1995 scheduled reduction commitments over some years down to
their BTAMS and have completed these reductions. Developing countries include least-developed
countries (LDCs), which under WTO rules are those countries which have been designated as such by the
United Nations. They were exempt from reduction commitments in the Uruguay Round.
A member’s AoA commitment on domestic support applies to its “domestic support measures in
favour of agricultural producers” (Art. 6.1). Support under policies that meet the requirements and criteria
of Annex 2 (often called the green box) is not subject to the commitment. All other domestic support is
therefore, in strict terms, included in a number of Aggregate Measurements of Support (AMSs) (Art.
1(a)).
Under its AoA definition an AMS for each product measures the support provided “in favour of
the producers of the basic agricultural product”, except for green box support (Art. 1(a)). This is usually
called a product-specific AMS and is “calculated on a product-specific basis for each basic agricultural
product receiving market price support, non-exempt direct payments, or any other subsidy not exempted
from the reduction commitment” (para. 1, Annex 3). A “basic agricultural product” is defined as the
product as close as possible to the first point of sale, relying on certain formal WTO documentation (Art.
1(b)). Product-specific AMSs are thus not necessarily calculated for the products identified in Annex 1 of
the AoA with reference to HS chapters, codes and headings. In addition to the product-specific AMSs, the
AoA defines an AMS that measures “non-product-specific support provided in favour of agricultural
producers in general” (Art. 1(a)). It is often called the non-product-specific AMS of which only one is
calculated, understood under the rules of Annex 3, to include non-exempt direct payments and any other
subsidy not exempted from the reduction commitment.
While MPS, calculated using the gap between the FERP and the AAP, is one of the components
of a product’s AMS, budgetary payments to maintain this price gap are not included in the AMS (Annex
3). An AMS accounts for both national and sub-national support. The non-exempt direct payments in the
4 In this paper, Art. x refers to an Article in the AoA if not otherwise indicated. Members of the WTO are referred to
as members in the WTO context, not countries. China refers to the People’s Republic of China, Russia refers to the
Russian Federation, and the United States refers to the United States of America. Currency abbreviations are the
three-letter codes of ISO 4217.
5 Members who reduced their bound commitment level from their Base Total Aggregate Measurement of Support
were subject to a declining BTAMS in each year of the reduction process before reaching the final BTAMS. For
simplicity this paper uses BTAMS, rather than Final BTAMS or FBTAMS, to refer to the “final bound commitment
level” of Art. 6.3.
6 The contracting parties of the GATT who participated in the 1994 conclusion of the Uruguay Round negotiations
are original members of the WTO. Thirty-six additional members had by 2019 acceded to the WTO under Art. XII
of the Marrakesh Agreement Establishing the World Trade Organization (WTO 1994b). They are often called Art.
XII members. Accession negotiations for 23 countries were underway as of March 2020.
7
AMS are measured using budgetary outlays or, if the payments depend on a price gap, using the same
method as for MPS. Input subsidies and other non-exempt measures, such as marketing-cost reduction
measures, are measured using budgetary outlays or a price gap method.
The calculation of an AMS can include negative components such as a negative MPS resulting
from a policy of setting the AAP below the FERP or resulting from managing the calculation of the
underlying price gap in particular ways (discussed in Section 6). Moreover, specific agricultural levies or
fees must be deducted in the AMS calculation (Annex 3). If the negative components outweigh the
positive components, the calculated AMS is negative. MPSs have generated negative AMSs for some
members but levies, fees or similar negative policy components have generally not been large enough to
make the calculated AMSs negative. Since a negative AMS means the opposite of an AMS being support
“in favour of” producers as defined in Art. 1(a), its role under the AoA is unclear. Members tend to treat it
as nil such that it does not offset positive AMSs in summing AMSs to form CTAMS. Negative
components may become more significant in the context of mitigating climate change (discussed in
Section 7).
While in strict terms all support other than green box support is accounted for in the AMSs, in
practice, as discussed below, members also claim support under policies conforming to Art. 6.2 (for
developing countries only) and Art. 6.5 (often called the blue box) as exempt from AMS calculations.
This paper generally follows the convention of this common practice. Unless otherwise noted, in the
paper AMS support refers to the residual support other than Art. 6.2 support, blue box support, and green
box support. Art. 6 support (sometimes called non-green-box support) is used to refer to the sum of AMS
support (whether included in CTAMS or not), Art. 6.2 support and Art. 6.5 (blue box) support.
The AoA also defines Equivalent Measurements of Support (EMSs). These measurements
correspond to product-specific AMSs but are calculated for products for which “the AMS methodology is
impracticable” (Art. 1(d)). The main reason for introducing EMSs along with AMSs was that in some
cases the policies supporting producers of fruit and vegetables in the EC did not involve parameters that
could be used in AMS calculations. EMSs were used by only few members for only few products already
from 1995 and these numbers have continued to dwindle.
Compliance with the ceiling commitment on BTAMS requires the year’s applied support that is
not exempted from commitment, i.e., AMS support, not to exceed the BTAMS (Art. 6.3). To enable the
comparison, all product-specific AMSs and the non-product-specific AMS are summed to generate the
CTAMS. However, although this sum is labelled “Total”, some AMSs can be left out of the summation
(Art. 6.4). Any product-specific AMS that is no larger than a given percentage of the product’s total value
of production (VoP) can be left out of CTAMS.7 Likewise, the CTAMS may exclude the non-product-
specific AMS if it is no larger than the given percentage of the member’s value of total agricultural
production.
Three given percentages apply, called de minimis percentages: 5% for developed countries, 8.5%
for China and Kazakhstan, and 10% for developing countries.8 The de minimis exemption of one or more
AMSs recognizes that AMS support in relatively low amounts may be of less concern than larger
amounts of AMS support in the context of reducing support and protection. For most members the
7 VoP in the context of AoA domestic support is usually calculated at domestic prices, including price support. VoP
is a less economically meaningful measurement of the size of a sector than its value-added.
8 Art. 6.4 specifies the 5% and 10%. The 8.5% results from China’s and Kazakhstan’s WTO accession negotiations.
8
BTAMS is nil, and the member’s CTAMS must thus be nil. It follows that for these members no single
AMS is allowed to exceed its de minimis level – any larger AMS would enter the CTAMS and make it
exceed nil. If an AMS is larger than its de minimis level, the whole AMS, not just the excess, enters
CTAMS.
The yearly de minimis allowance for each AMS is calculated using the 5%, 8.5% or 10%
applicable to the particular member. The situation of a member with no BTAMS commitment, i.e., a
BTAMS of nil, is recognized also in Art. 7.2(b). It stipulates that the de minimis allowances are ceilings
on individual AMSs. While the de minimis allowances for the AMSs of members with nil BTAMS thus
operate as limits, for members with a positive BTAMS they operate as thresholds: an AMS may exceed
its de minimis allowance but is then added into the CTAMS. Whether operating as a limit or a threshold,
the de minimis allowance allows the provision of relatively small AMSs as a percentage of VoP without
further consequences.
All limits and measurements of domestic support in the AoA are expressed as amounts of
support, such as millions of currency units, not as percentages or other rates of support.9 It is sometimes
convenient, however, to express them as percentages in order to facilitate a comparison against the de
minimis percentages. The expression of limits and measurements as monetary amounts in domestic
support is in contrast to border protection, where tariff bindings and applied tariffs are rates expressed ad
valorem (percentage) or in specific terms (such as currency units per tonne). It is also in contrast to
quantitative economic analysis, where percentage rate expressions are the norm.
2.2.2 Exemptions based on policy criteria: Article 6.2 and Article 6.5 (blue box)
Developing countries are able to exempt from CTAMS some support that developed countries
must include in CTAMS (Art. 6.2). The reason for this exemption is that the negotiating parties in the
Uruguay Round saw special and differential treatment for developing countries as an integral element of
the negotiations (Preamble AoA, WTO 1994a). They agreed that “government measures of assistance,
whether direct or indirect, to encourage agricultural and rural development are an integral part of the
development programs of developing countries” (Art. 6.2). This support includes investment subsidies
generally available to agriculture and input subsidies generally available to low-income or resource-poor
producers. It also includes support to encourage diversification from growing illicit narcotic crops. While
Art. 6.2 is explicit about exempting these types of support only from CTAMS, in practice developing
countries exempt the support from individual AMSs, as noted above. By exempting support in a way not
found in the strict interpretation of Art. 6.2, the practice erodes the discipline on AMSs: it makes an AMS
smaller than it would otherwise be.10 For developing countries with a nil BTAMS this makes an AMSs
less likely to exceed its de minimis limit.
This erosion of discipline applies in a similar way also to the 17 developing country members
with a positive BTAMS. Consider a de minimis AMS containing only a dollars of support. Now include
in that AMS also b dollars of Art. 6.2 support, which makes the AMS (a+b) exceed its de minimis
9 Art. 1(a) defines an AMS in monetary terms. A CTAMS is therefore also expressed in monetary terms. Members
with a positive BTAMS in their Schedules express this commitment level as a number of currency units.
10 If a product receives support only through Art. 6.2 or blue box policies, there is no product-specific AMS to which
the practice applies (para. 1, Annex 3). Where a product receives support also through policies other than Art. 6.2 or
blue box policies, the practice makes a difference. It also makes a difference for the discipline on the non-product-
specific AMS, which must be calculated whether the policies providing non-product-specific support are exemptible
or not (para. 1, Annex 3).
9
threshold. It therefore becomes fully counted in CTAMS. After subtracting Art. 6.2 support of b from the
CTAMS, the a dollars of support remains in CTAMS. In contrast, the common practice excludes the b
dollars of Art. 6.2 support from the AMS, such that the AMS (now only a) stays below its de minimis
threshold, and the a dollars does not become part of the CTAMS. The CTAMS under the common
practice is therefore smaller in this case than it would be under a literal application of Art. 6.2, which
makes it easier for a member with a positive BTAMS to comply with this commitment.
Regarding the Art. 6.2 exemption, the AoA uses different wording for the general availability of
investment subsidies (“generally available to agriculture”) and input subsidies (“generally available to
low-income or resource-poor producers”). The implications are not totally clear. Both subsidies need to
be generally available in some sense. A subsidy that is generally available to agriculture is also generally
available to low-income or resource-poor producers. Legal interpretation might infer, however, that the
specification of “low-income or resource-poor producers” for input subsidies requires a more specific and
explicit targeting for input subsidies than for investment subsidies in the member’s legal instrument that
authorizes the subsidies. This hypothesis has not been examined from a legal perspective under the DSU.
Members who claim the exemption do not usually make a distinction between subsidies being generally
available to agriculture and being generally available to low-income or resource-poor producers.
The Art. 6.5 (blue box) exemption for “direct payments under production-limiting programmes”
traces its origin to the time of negotiating the AoA in the early 1990s, when the EU (EC at the time) and
the United States were two of the major parties involved. The EU was in the process of shifting much of
its farm support from price support to direct crop payments based on fixed area and yields and to
livestock payments (such as beef cattle and sheep) based on a fixed number of head. Some crop payments
involved a set-aside of arable land. The United States made crop payments involving annual acreage set-
aside requirements and based the payments on no more than 85% of a farm’s administratively established
“base acres”. The EU and the United States agreed that support under their respective payment programs
of this nature would be exempt from the CTAMS, and these provisions were subsequently accepted by
the other parties in the negotiations. As a result, the EU and the United States would not face the risk that
possibly large producer payments under their respective blue box programs, along with other support,
would make their CTAMS exceed their BTAMS.
Under the blue box, direct payments to producers under production-limiting programs must, if
they meet certain criteria, be exempted from the CTAMS. It remains unclear what constitutes a
production-limiting program and in what way, if at all, that label relates to the specified criteria. The EU
and US land set-aside provisions, while operating differently, would by themselves have limited or even
reduced production at the time. The criteria for exemption require the payments to be based on fixed area
or yields, or to be made on 85% or less of the base level of production, or, for livestock payments, to be
made on a fixed number of head. In practice, the handful of members using the blue box exemption (some
with, some without a positive BTAMS) do not exempt the support from the CTAMS but from individual
AMSs. In the same way as for Art. 6.2 support, this practice erodes the discipline that otherwise would
govern the Art. 6 support of members.
2.2.3 Exemptions based on policy criteria: Annex 2 (green box)
The Uruguay Round negotiators recognized that agricultural support provided through some
types of policies has no or at most minimal effects on production and trade and exempted that support
from counting in an AMS. The AoA exemption of some support from being subject to the scheduled limit
therefore extends not only to support under policies that meet the criteria of Art. 6.2 and the blue box but
10
also to support under certain policies that meet the fundamental requirement stated in the AoA “that they
have no, or at most minimal, trade-distorting effects or effects on production” (para. 1, Annex 2).
Art. 6.1 explicitly exempts Annex 2 (green box) support from the domestic support that is subject
to commitment, i.e., green box support is exempted from any AMS and therefore also from CTAMS. This
is a more elementary exemption than the exemption only from CTAMS calculations that applies to Art.
6.2 support and blue box support without being strictly followed in practice. Only support under policies
that meet the fundamental requirement of minimal distortion can be green-box exempt. This is in contrast
to the exemptions under Art. 6.2 and the blue box, which do not require the exempted support to be at
most minimally trade distorting. It is sometimes said that Art. 6.2 support and blue box support is exempt
from commitment because such support does not distort production or trade. However, such support is in
fact exempt from commitment even when it distorts production or trade in the sense of encouraging
production more than minimally, albeit in some cases less so than other support.
A green-box exempt policy must meet the basic criteria of being publicly-funded and not involve
transfers from consumers, and the policy must “not have the effect of providing price support to
producers” (para. 1, Annex 2). Moreover, the policy must meet one of twelve sets of policy-specific
criteria and conditions. These stipulations are introduced with the word “Accordingly”. Understanding the
role of this word is critical to understanding the interplay of the fundamental requirement and the basic
and policy-specific criteria. Its role in para. 1 of Annex 2 is not straightforward. One possibility is that the
fundamental requirement about non-distorting effects simply motivates the need to meet the basic and
policy-specific criteria. Another possibility is that meeting the basic and policy-specific criteria
automatically satisfies in legal terms the fundamental requirement about non-distorting effects or effects
on production. Although either of the alternative readings could be crucial in determining whether a
policy provides support that can exempted from AMSs, the wording has not been clarified through WTO
dispute settlement.11
The green box distinguishes among three kinds of policies that provide exemptible support (see
Appendix A of this paper): 1) expenditures on general services, 2) expenditures on public stockholding
for food security purposes and domestic food aid, and 3) direct payments to producers.12
The General services category (para. 2, Annex 2) involves government expenditures (or revenue
forgone) for services to agriculture or the rural community. The category rules out direct payments. The
headings of the general services for which the green box specifies details include research, pest and
disease control, training services, extension and advisory services, inspection services, marketing and
promotion services, and infrastructural services. The list of exemptible general services is open-ended,
such that other general services that meet the criteria can also be exempted.13
11 In the WTO dispute United States – Subsidies on Upland Cotton (DS267), the panel discussed the role of the
fundamental requirement in relation to the policy-specific criteria but did not decide whether it is a “freestanding
obligation” or not (para. 7.412, WTO 2004b). This dispute, referring to the Agreement on Subsidies and
Countervailing Measures (ASCM), did not concern compliance with the BTAMS commitment under the AoA.
12 Direct payments to producers is a heading in Annex 2 (green box). This is not to be confused with the US
payment program named Direct Payments, authorized in 2002 and 2008 US farm legislation and repealed in 2014
legislation.
13 The 2013 WTO ministerial decision to exempt also expenditures under a general services category essentially
concerned with land reform in developing countries is discussed in Section 7.
11
While its fundamental requirement is that measures have no, or at most minimal, trade-distorting
effects or effects on production, the green box nevertheless accommodates and exempts from limit
various public expenditures under General services that raise agricultural productivity and thus have
positive effects on production. The implied rationale is that these expenditures do not distort individual
producer incentives. A more contextual reading of the AoA relates to General services expenditures
having no trade-distorting effects or effects on production for a given resource base and technology.
Shifts in productivity and hence in comparative advantage and trade inherently arise over time from such
expenditures. Indeed, enhanced productivity is essential to meeting global food security objectives.
Under the heading Public stockholding for food security purposes (para. 3), the green box allows
expenditures for the accumulation and holding of stocks to be exempted from AMS under certain
conditions. The necessary conditions require purchases and sales to be made at market prices and require
financial transparency. If purchases are made at administered prices the resulting MPS must be accounted
for in an AMS. The requirement to acquire stocks at market prices and not at administered prices, or if
acquired at administered prices to calculate MPS, underlies an ongoing controversy in the context of
revising the AoA, as discussed in Sections 3 and 7. Similar conditions as for public stockholding apply to
the exemption of expenditures on domestic food aid (para. 4) to sections of the population in need, but
there is no allowance to purchase at administered prices.
An open-ended paragraph with the heading Direct payments to producers (para. 5, Annex 2) and
eight other paragraphs (paras. 6-13) with specific headings give criteria for payments made to producers
to be exemptible. The specific headings are: Decoupled income support (para. 6), Government financial
participation in income insurance and income safety-net programs (para. 7), Payments (made either
directly or by way of government financial participation in crop insurance schemes) for relief from
natural disasters (para. 8), Structural adjustment assistance provided through producer retirement
programs (para.9), Structural adjustment assistance provided through resource retirement programs
(para. 10), Structural adjustment assistance provided through investment aids (para. 11), Payments under
environmental programs (para. 12), and Payments under regional assistance programs (para. 13). Under
each such heading there are between two and six sub-paragraphs articulating the criteria that apply.
The heading Direct payments to producers is open-ended in the sense that it allows the exemption
of any existing or new type of direct payment in addition to those specified under the particular headings.
The criteria for exempting such direct payments are identical to most of the criteria for exempting
payments under Decoupled income support. They seek to ensure that the exempted direct payments are
not related to current production, prices or factors of production (i.e., after a defined and fixed base
period). While the criteria under the other headings of direct payments are expressed in various ways, the
underlying idea is the same, viz., that the exemptible direct payments are those that stimulate current
production no more than minimally while, similar to General services, in some cases contributing to
raising agricultural productivity.
While the green box refers to trade-distorting effects or effects on production, it is not clear
whether these include the effects of policies that reduce production, or only those that increase
production. It may have been obvious at the time of drafting that policy-induced increases in production
were the distortions of concern.14 Today’s emerging policy priorities highlight the need also to consider
14 The criteria under two of the direct payment headings relate to the removal of land or other resources from
marketable agricultural production, likely reducing output. However, certain payments that are likely to increase
output in the medium- and long-run are also exemptible, such as payments under programs to assist the restructuring
of operations in response to demonstrated structural disadvantages. The Haberler phrase “directly encourage home
12
the green box requirements with regard to policies that reduce production. This is not an entirely new
issue. Environmental policies, such as long-term land idling for conservation purposes that members have
notified as green-box exempt, have historically had production-reducing effects. Some climate change
mitigation policies can have similar effects, as discussed in Section 7.
Policies claimed to meet the criteria for exemption, whether under Art. 6.2., the blue box or the
green box are the most common policies that members report to the CoA (see Section 4). Some members
exempt or have exempted very large amounts under each one of these provisions. This includes India
under Art. 6.2, China under the blue box and various headings of the green box, the EU under the blue
box and para. 6 (Decoupled income support) of the green box, and the United States under para. 4
(Domestic food aid) of the green box. The magnitude of the exempted amounts has fuelled discussions in
the CoA and in academic and public circles about the legitimacy of the exemptions in several respects:
should certain categories of support be exempted, and for categories where an exemption is agreed do the
policies for which exemptions are claimed actually meet the criteria? While the discussions have
highlighted some differences in interpreting the wording of the provisions for exemption, there has been
almost no litigation of the members’ exemptions. The only case of a WTO domestic support dispute
involving the classification of a policy as exempt under the AoA is the complaint against the United
States in 2007 by Canada and Brazil, but the case has not been pursued (see Section 5).
2.3 Policy space for domestic support
2.3.1 Different rules for different groups of members
Altogether the provisions of the AoA on domestic support enable governments to support
agricultural producers by unlimited amounts of support of certain kinds and by limited AMS support.15
The unlimited support includes support exempted under Art. 6.2, the blue box and the green box. The
residual support that cannot be exempted, i.e., AMS support, is subject to a member-specific limit or
limits.
The combination of certain exemptions, limits and thresholds on domestic support applies
differently to five distinct groups of members. Table 2.1 shows the five combinations of a member being
eligible or not for the Art. 6.2 exemption, having a positive BTAMS or not, and the given de minimis
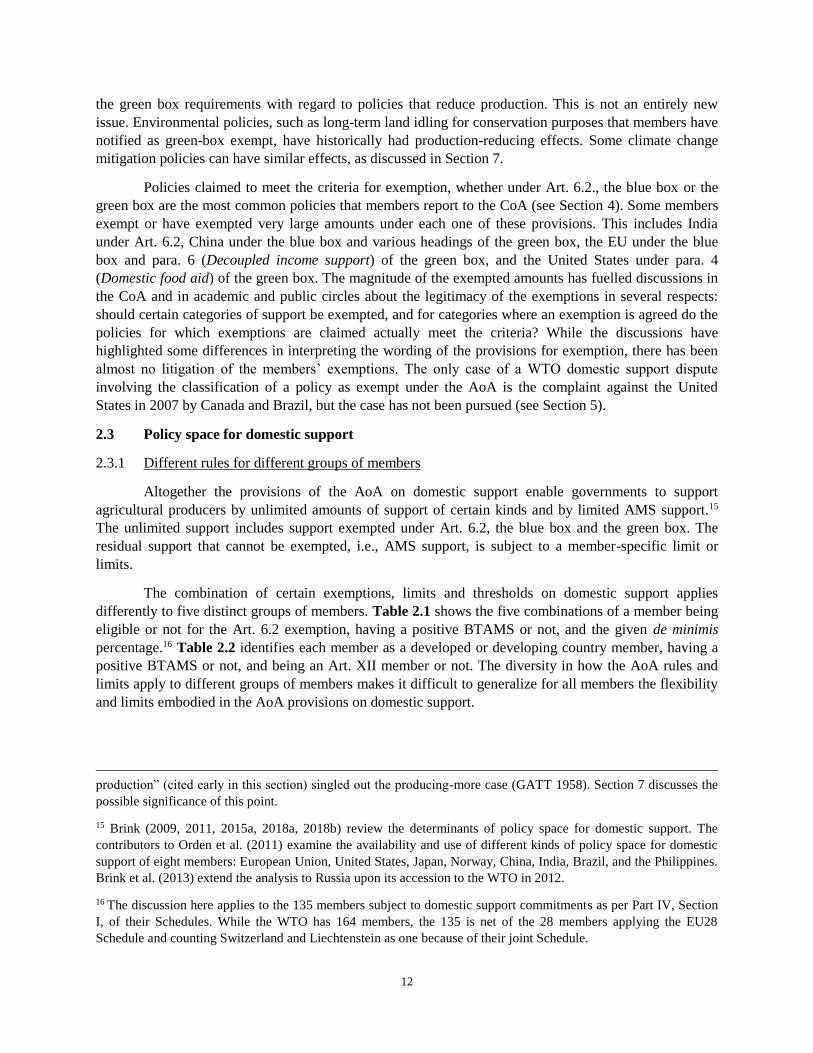
percentage.16 Table 2.2 identifies each member as a developed or developing country member, having a
positive BTAMS or not, and being an Art. XII member or not. The diversity in how the AoA rules and
limits apply to different groups of members makes it difficult to generalize for all members the flexibility
and limits embodied in the AoA provisions on domestic support.
production” (cited early in this section) singled out the producing-more case (GATT 1958). Section 7 discusses the
possible significance of this point.
15 Brink (2009, 2011, 2015a, 2018a, 2018b) review the determinants of policy space for domestic support. The
contributors to Orden et al. (2011) examine the availability and use of different kinds of policy space for domestic
support of eight members: European Union, United States, Japan, Norway, China, India, Brazil, and the Philippines.
Brink et al. (2013) extend the analysis to Russia upon its accession to the WTO in 2012.
16 The discussion here applies to the 135 members subject to domestic support commitments as per Part IV, Section
I, of their Schedules. While the WTO has 164 members, the 135 is net of the 28 members applying the EU28
Schedule and counting Switzerland and Liechtenstein as one because of their joint Schedule.

13
Table 2.1. Diversity of domestic support provisions by groups of members
The diversity in the application of the AoA provisions is illustrated in Figures 2.1 to 2.3.
Figure 2.1 shows the situation for developing countries, all of which are eligible for the Art. 6.2
exemption. Ninety-seven of these members lack a positive BTAMS, which means a single AMS in excess
of its de minimis limit implies a violation of the member’s AoA obligations. For the 17 developing
country members with a positive BTAMS, individual AMSs may exceed their de minimis limits, which
results in violation only if the CTAMS exceeds BTAMS. The situation of China and Kazakhstan in
Figure 2.2 shows their non-eligibility for the Art. 6.2 exemption, their particular de minimis percentage of
8.5% and their nil BTAMS. Figure 2.3 shows the situation of developed countries (four with a nil
BTAMS and 15 with a positive BTAMS) that differs from developing countries in Figure 2.1 by the non-
eligibility for the Art. 6.2 exemption and the 5% de minimis percentage.
2.3.2 Policy space for AMS support
Most members face limits on individual AMSs. This applies to the 103 members with no or a nil
BTAMS, of which 97 are developing countries, a set of 2 comprises China and Kazakhstan, and 4 are
developed countries, as shown in Table 2.2. The limits on AMS support of these members are a de
minimis percentage of the nominal VoPs of individual products or the agriculture sector. Since nominal
VoPs tend to increase over time, the corresponding AMS limits also increase.
The VoPs in agriculture of the 103 members with no or a nil BTAMS sum to about United States
dollars (USD) 2,245 billion.17 Applying each member’s de minimis percentage to its total agricultural
VoP generates the limit on its non-product-specific AMS, which sum to USD 206 billion for the 103
members. Since the value of total agricultural production (VoP of the agriculture sector) is also by
definition the sum of the values of production of all individual products, the full amount of AMS support
that could theoretically be accommodated within the de minimis limits of these 103 members is USD 412
billion. This AMS space is a theoretical maximum – unreachable in practice – since it would mean
managing AMS support perfectly for all individual products in a member’s agriculture sector just up to
the year’s de minimis limit on each product’s AMS and also on the non-product-specific AMS.
17 The VoPs used in this and the following paragraphs are from FAOSTAT (Gross production value in USD) for
almost all members and from notified data for some. The values for most members are from 2016 (some from 2015
or earlier). Some sums are slightly underestimated since VoPs were not available from FAOSTAT for several
members (Bahrain, Djibouti, Dominica, Eswatini, Gabon, Guatemala, Haiti, Lesotho, Liberia, Macao, Mauritania,
Montenegro, Papua New Guinea, Solomon Islands, Tonga, Uganda, and United Arab Emirates).
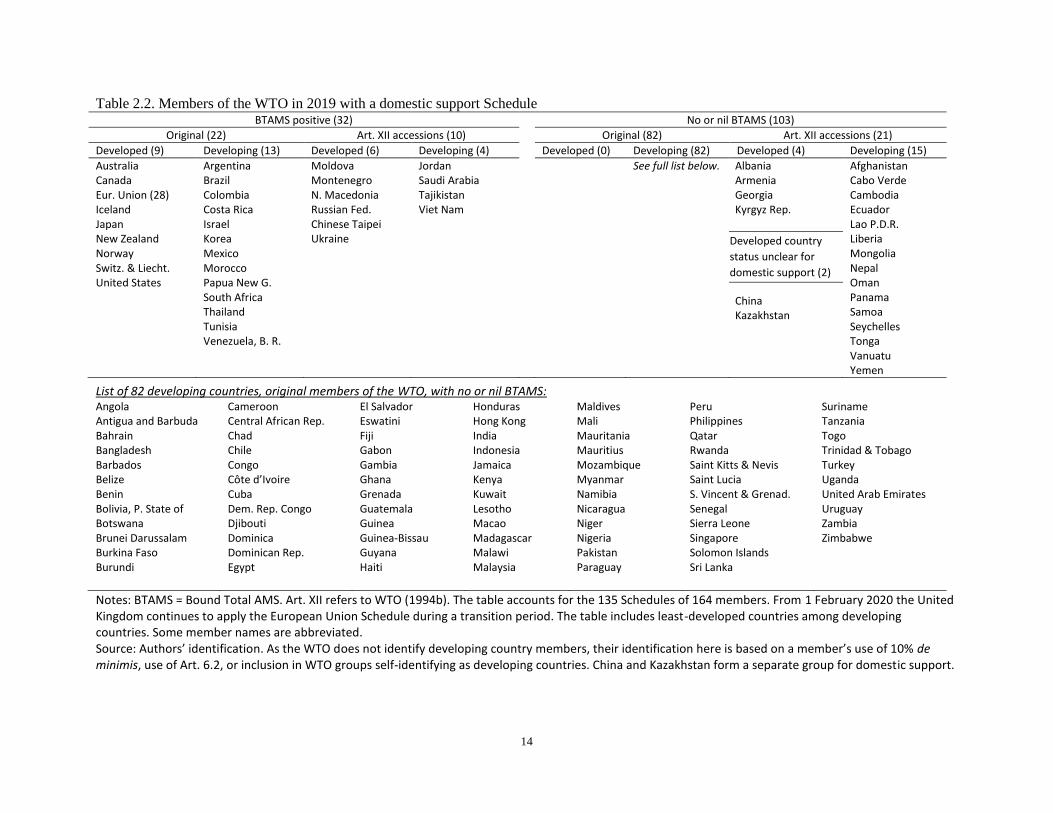
14
Table 2.2. Members of the WTO in 2019 with a domestic support Schedule BTAMS positive (32) No or nil BTAMS (103)
Original (22) Art. XII accessions (10) Original (82) Art. XII accessions (21)
Developed (9) Developing (13) Developed (6) Developing (4) Developed (0) Developing (82) Developed (4) Developing (15)
Australia Canada Eur. Union (28) Iceland Japan New Zealand Norway Switz. & Liecht. United States
Argentina Brazil Colombia Costa Rica Israel Korea Mexico Morocco Papua New G. South Africa Thailand Tunisia Venezuela, B. R.
Moldova Montenegro N. Macedonia Russian Fed. Chinese Taipei Ukraine
Jordan Saudi Arabia Tajikistan Viet Nam
See full list below. Albania Armenia Georgia Kyrgyz Rep.
Developed country
status unclear for
domestic support (2)
China Kazakhstan
Afghanistan Cabo Verde Cambodia Ecuador Lao P.D.R. Liberia Mongolia Nepal Oman Panama Samoa Seychelles Tonga Vanuatu Yemen
List of 82 developing countries, original members of the WTO, with no or nil BTAMS: Angola Antigua and Barbuda Bahrain Bangladesh Barbados Belize Benin Bolivia, P. State of Botswana Brunei Darussalam Burkina Faso Burundi
Cameroon Central African Rep. Chad Chile Congo Côte d’Ivoire Cuba Dem. Rep. Congo Djibouti Dominica Dominican Rep. Egypt
El Salvador Eswatini Fiji Gabon Gambia Ghana Grenada Guatemala Guinea Guinea-Bissau Guyana Haiti
Honduras Hong Kong India Indonesia Jamaica Kenya Kuwait Lesotho Macao Madagascar Malawi Malaysia
Maldives Mali Mauritania Mauritius Mozambique Myanmar Namibia Nicaragua Niger Nigeria Pakistan Paraguay
Peru Philippines Qatar Rwanda Saint Kitts & Nevis Saint Lucia S. Vincent & Grenad. Senegal Sierra Leone Singapore Solomon Islands Sri Lanka
Suriname Tanzania Togo Trinidad & Tobago Turkey Uganda United Arab Emirates Uruguay Zambia Zimbabwe
Notes: BTAMS = Bound Total AMS. Art. XII refers to WTO (1994b). The table accounts for the 135 Schedules of 164 members. From 1 February 2020 the United Kingdom continues to apply the European Union Schedule during a transition period. The table includes least-developed countries among developing countries. Some member names are abbreviated. Source: Authors’ identification. As the WTO does not identify developing country members, their identification here is based on a member’s use of 10% de minimis, use of Art. 6.2, or inclusion in WTO groups self-identifying as developing countries. China and Kazakhstan form a separate group for domestic support.
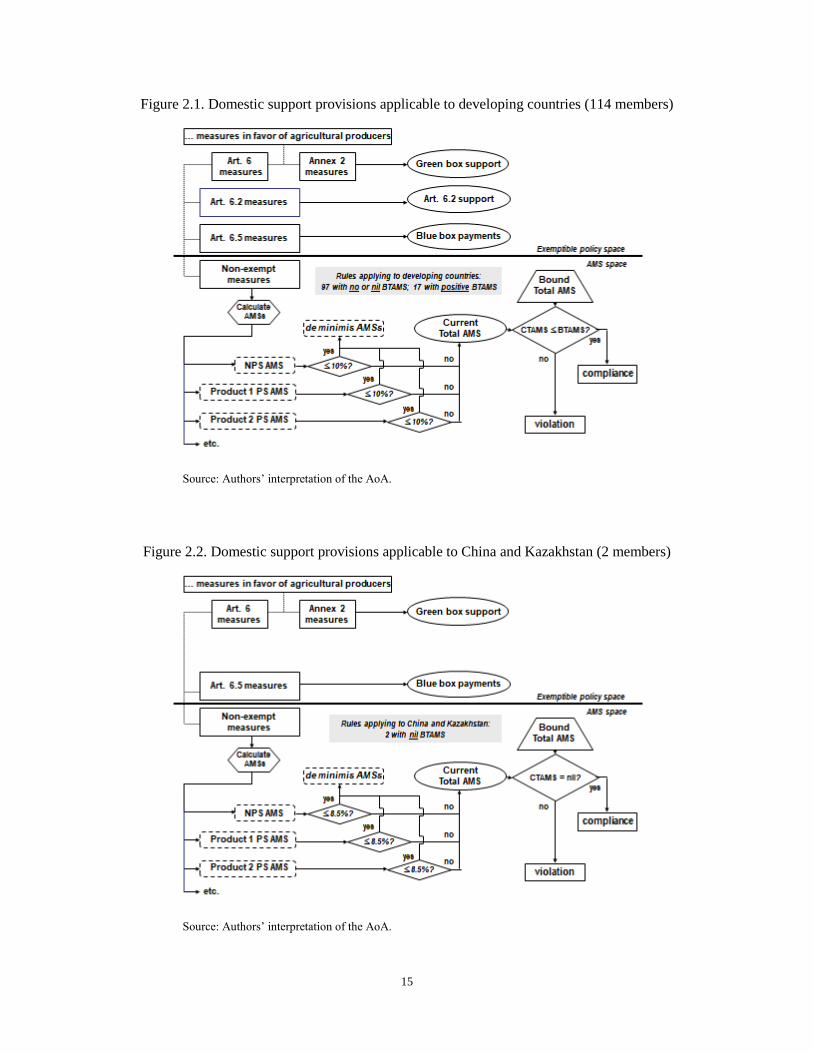
15
Figure 2.1. Domestic support provisions applicable to developing countries (114 members)
Source: Authors’ interpretation of the AoA.
Figure 2.2. Domestic support provisions applicable to China and Kazakhstan (2 members)
Source: Authors’ interpretation of the AoA.
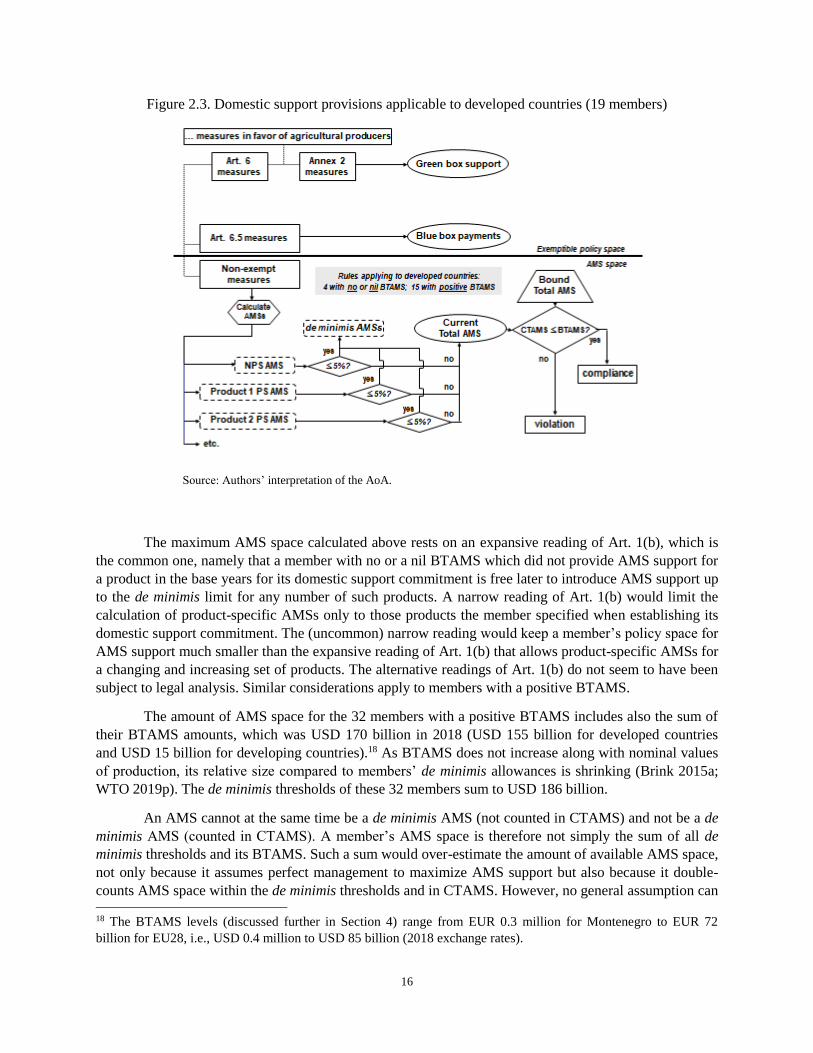
16
Figure 2.3. Domestic support provisions applicable to developed countries (19 members)
Source: Authors’ interpretation of the AoA.
The maximum AMS space calculated above rests on an expansive reading of Art. 1(b), which is
the common one, namely that a member with no or a nil BTAMS which did not provide AMS support for
a product in the base years for its domestic support commitment is free later to introduce AMS support up
to the de minimis limit for any number of such products. A narrow reading of Art. 1(b) would limit the
calculation of product-specific AMSs only to those products the member specified when establishing its
domestic support commitment. The (uncommon) narrow reading would keep a member’s policy space for
AMS support much smaller than the expansive reading of Art. 1(b) that allows product-specific AMSs for
a changing and increasing set of products. The alternative readings of Art. 1(b) do not seem to have been
subject to legal analysis. Similar considerations apply to members with a positive BTAMS.
The amount of AMS space for the 32 members with a positive BTAMS includes also the sum of
their BTAMS amounts, which was USD 170 billion in 2018 (USD 155 billion for developed countries
and USD 15 billion for developing countries).18 As BTAMS does not increase along with nominal values
of production, its relative size compared to members’ de minimis allowances is shrinking (Brink 2015a;
WTO 2019p). The de minimis thresholds of these 32 members sum to USD 186 billion.
An AMS cannot at the same time be a de minimis AMS (not counted in CTAMS) and not be a de
minimis AMS (counted in CTAMS). A member’s AMS space is therefore not simply the sum of all de
minimis thresholds and its BTAMS. Such a sum would over-estimate the amount of available AMS space,
not only because it assumes perfect management to maximize AMS support but also because it double-
counts AMS space within the de minimis thresholds and in CTAMS. However, no general assumption can 18 The BTAMS levels (discussed further in Section 4) range from EUR 0.3 million for Montenegro to EUR 72
billion for EU28, i.e., USD 0.4 million to USD 85 billion (2018 exchange rates).
17
be made about which products are supported only up to their de minimis thresholds and which are the
products whose AMSs sum to the BTAMS. Properly describing the AMS space for members with a
positive BTAMS needs to be member-specific, account separately for the AMS thresholds and the
BTAMS, and recognize the interdependence that follows from the all-or-nothing nature of the AoA
provision on de minimis AMSs. Brink (2006) discusses these issues with examples of “maximum usable
components”.
Acknowledging that it overestimates the room for AMS support, the sum of all members’
imputed de minimis allowances (USD 412 billion for 103 members and USD 186 billion for 32 members)
and 32 BTAMS levels (USD 170 billion) is USD 768 billion. The sum of BTAMS levels accounts for
22% of this total, leaving 78% as the room for AMS support within the de minimis limits and thresholds.
Even with a nil BTAMS, the member with the largest room for AMS support is China, with USD 209
billion in 2016. This derives from its large VoP in agriculture (about one-third of the world total) and its
8.5% de minimis percentage (doubled to 17% for this calculation). The EU has the second largest VoP in
agriculture and also has a BTAMS of USD 85 billion. The sum of the EU BTAMS and 10% of the VoP in
2016 was USD 120 billion, i.e., considerably less than the amount calculated for China. Likewise, the
combination of a fairly large total agricultural VoP in India and a higher de minimis percentage yields
more room for AMS support (USD 72 billion; 20% of VoP) than for the United States (USD 52 billion;
10% of VoP and BTAMS of USD 19.1 billion). While instructive in terms of calculated theoretical limits,
these amounts do not capture that the EU and United States, because of their positive BTAMS, have
greater flexibility than China and India in managing AMS support.
2.4 Summary
The AoA rules and limits on domestic support trace a lineage back to the 1950s. Countries’
policy concerns played perhaps a larger role than economic rationale in their eventual formulation. Limits
apply to some domestic support measured in a particular way, i.e., AMS support. Support provided under
certain types of policies (Art. 6.2 and the blue box) is exempt from CTAMS and in practice is not counted
as AMS support and is unlimited. While the Art. 6.2 exemption for certain kinds of subsidies is available
only to developing countries, blue box and green box compliant support is exemptible for all members.
Different groups of members use different de minimis percentages to calculate the current year’s
limit or limits on AMS support. In contrast to the majority of members, which face de minimis limits on
individual AMSs, 32 (almost one quarter of the members) have a positive BTAMS in their Schedule,
which gives them greater flexibility in managing the provision of AMS support. As de minimis limits
derive from nominal values of production, they generally increase over time. Members with larger
agriculture sectors can accommodate larger amounts of AMS support within their limits and any BTAMS.
Thus, China and India, without a positive BTAMS but with large VoPs in agriculture, have more room
for AMS support than the EU and the United States, each with a positive BTAMS but with a lower de
minimis percentage and a lower VoP.
18
3. ECONOMIC ANALYSIS OF EXEMPTIONS AND ADMINISTERED PRICES
While the AoA is part of a legally binding international agreement, not an economic blueprint,
the economic dimensions of how it is implemented link closely to the achievement of the AoA’s ambition
of substantial reductions in agricultural support and protection. Following a few additional comments on
the context for analyzing domestic support and its trade distorting potential in economic terms, this
section discusses the two major areas where members’ policy options in relation to the domestic support
provisions of the AoA have attracted particular analytical interest. They relate to the exemption of
payments from AMS calculation on green box grounds particularly by the EU and the United States, and
the measurement of market price support under the AoA (AoA MPS) compared to economic analysis.
Key insights on these issues contributed by economic analysis are highlighted and some of the questions
that remain to be addressed are identified.
3.1 Context for economic analysis of domestic support
3.1.1 Evolving approaches to measuring support
Prior to the 1986 launch of the Uruguay Round negotiations, countries wished to explore the
effects of possible outcomes of the upcoming negotiations on their agricultural sector and whole
economy. This interest led to model-based economic analysis using the wedge between a product’s border
price and the effective domestic producer price (producer revenue per unit), which resulted from the
combination of border measures, price regulations and government payments to producers.19 In the lead-
up to the Uruguay Round, early analysis using indicators that combine measurements of price support and
producer payments were reported in, for example, OECD (1987), Abbott et al. (1988) and Roningen and
Dixit (1989). This work was done before the AoA rules on measuring domestic support had been
finalized. The price support component was therefore an economic measurement deriving from border
measures, not the AoA MPS measurement calculated from domestic policy settings. The interest in
indicators of economic price support and payment support in many countries led to the development of
data bases such as those eventually published by the OECD as its PSEs and by other international
organizations and national governments.
Economic analysis of domestic support undertaken in the years following the 1995 establishment
of the WTO has met a need to understand the potential effectiveness of members’ WTO commitments in
reining in the amount of domestic support or encouraging shifts towards less distorting forms of domestic
support. Carried out by national governments, academics and interest groups, the analysis draws on such
sources as members’ notifications to the CoA and the expanding data sets of the OECD and other
institutions on agricultural policy support and associated monitoring and evaluation.20 A series of major
policy changes, in particular in the EU and the United States, has contributed to the interest in analyzing
the effects of different kinds of domestic support. This involves mainly the EU producer payments
exempted first under the blue box and later the EU and US payments exempted as Decoupled income
support under the green box. The launch of the Doha Round negotiations in 2001 induced exploration of 19 The intellectual debt the development of this approach owes to the initiatives of Tim Josling and the FAO is
acknowledged in Section 2.
20 The International Organisations Consortium for Measuring the Policy Environment for Agriculture includes the
Food and Agriculture Organization of the United Nations (FAO), Inter-American Development Bank (IDB),
International Food Policy Research Institute (IFPRI), OECD, and the World Bank Group (http://www.ag-
incentives.org/).
19
the effects of possible outcomes of those negotiations. Impetus for analysis also came from the accession
to the WTO of China in 2001 and other countries with large or increasing agricultural production such as
Russia in 2012.
Further current context for analysis of domestic support in economic terms comes from the
ongoing negotiations. In the absence of a comprehensive new agreement from the Doha Round, the
negotiations have taken the form of seeking to settle a few specific domestic support issues in a series of
WTO ministerial meetings. The limits and exemptions for various forms of domestic support are one area
of interest. A second area of interest relates to the measurement of MPS, which has come to the fore in
recent counter-notifications and disputes. Within this context, rules for the acquisition at administered
prices of public stocks for food security purposes continues to be a major negotiating concern of some
members. So far only an interim arrangement has been agreed upon, as discussed in this section and
Section 7.
3.1.2 AMS support and other trade-distorting domestic support
AMS support and trade-distorting domestic support are not synonyms, in spite of often being so
portrayed not only in media but also in analytical writing. As the review of the AoA in Section 2 makes
clear, most or perhaps all AMS support is likely to distort trade and is subject to limit. However, the
implication that non-AMS support in the form of Art. 6.2 and blue box support does not distort trade and
for that reason is not subject to limit is unfounded.21 The basis on which Art. 6.2 support and blue box
support are exempt from limit is compliance with the negotiated criteria in the respective articles, with no
requirement that it be non-distorting. The exemption of green box support from limit rests on meeting the
explicit stated requirement of having at most minimal trade-distorting effects or effects on production, as
well as meeting the policy-specific criteria. Yet, some green box support clearly raises productivity and
affects production and trade over time.
Moreover, a distinction between only AMS support as trade-distorting and all other support as not
trade-distorting is contrary to the results of economic analysis. The OECD identifies some of the
categories of support that are included in its PSE as “potentially most distorting”. That designation is
based on stylized analysis such as OECD (2001), Dewbre et al. (2001) and Martini (2011). The analysis
ranks different categories of PSE support in terms of the trade distortion they generate, relative to the
trade distortion from the same amount of economic MPS (the distortion generated by MPS is the
numéraire).
Economic MPS, payments based on output, and payments based on unconstrained use of variable
inputs have significantly higher potential to distort agricultural production and trade than payments based
on other criteria (OECD 2001). Economic MPS and payments based on output are similar in terms of
distorting trade. Payments based on the unconstrained use of variable inputs distort trade more than
economic MPS: the ratio of the trade effects of such input subsidies to the trade effects of MPS is roughly
1.3 to 1 (Dewbre et al. 2001).22
21 The 2004 introduction of the idea of a measurement of Overall Trade-Distorting Support (OTDS), of which AMS
support is part, recognizes the difference but without counting Art. 6.2 support as trade-distorting (WTO 2004a).
This measurement is discussed in Section 4.
22 Part of the explanation of this result is that the elasticity of supply of the subsidized inputs is assumed to be
greater than the elasticity of supply of other factors of production. Similar issues, including the subsidization of
inputs, are examined in Hertel (1989) and through more sophisticated modelling in, e.g., Dimaranan et al. (2003).
20
While the categories of support in the referenced analysis are those of the OECD PSE
measurements, they map in several ways onto the AoA categories of domestic support. For example,
members have exempted some of the area-based payments as meeting the blue box criteria. Output
payments and MPS are usually part of members’ AMSs. What is measured under the label MPS differs
between PSE and AMS, but the domestic price levels in both cases result from policy choices. While
some members include in their AMSs the support based on unconstrained use of variable inputs, such as
fertilizer, fuel or water, others claim them as exempt under Art. 6.2. The analytical findings help to clarify
that what members label as AMS support is only one part of trade-distorting domestic support. Thus, all
Art. 6 support is sometimes referred to as trade-distorting support, as well as being referred to as non-
green-box support.
3.2 Issues concerning direct payments and other support exempted from AMS
Much domestic support analysis has focused on the direct payments members exempt as blue box
or green box support based on their compliance with the policy-specific criteria or their effect on
production and trade (e.g., Meléndez-Ortiz et al. 2009). Corresponding analysis of support exempted
under Art. 6.2 is surprisingly scarce in view of the increasing amounts of such support. The analysis of
blue box and green box payments has paid particular attention to the EU and the United States, since
these members have exempted the largest amounts of such payments. Analysts have also examined the
rules and criteria of Annex 2 (green box) from the perspective of changes that might be pursued in
subsequent negotiations.
A particular area of interest for economic analysis has been the potential for certain direct
payments to have more than minimally distorting effects in spite of meeting the policy-specific criteria of
the green box (Rude 2001). The findings of the analysis could, if they pointed at significant trade
distortions, be used to support arguments in the CoA that a member improperly exempts certain direct
payments from AMS limits. This argument could also be made in a WTO dispute claim, but no domestic
support dispute has come to a conclusion on such a matter. Additionally, analysis could show that a given
direct payment does not meet the policy-specific criteria under a particular heading of the green box and
therefore would not be exemptible. Policy measures exempted under paragraph 6, titled Decoupled
income support, have been analyzed in terms of possibly distorting trade. The compatibility of given
policies with that paragraph and with paragraph 12, titled Payments under environmental programs, has
also been of analytical interest.
3.2.1 Direct payments exempted by the EU
Investigating the degree of decoupling of the then newly introduced so-called compensatory
payments in the EU, Cahill (1993, 1997) found that the concerns about those payments distorting
production and trade ought to be re-evaluated. Although those payments pre-dated the AoA, the analysis
foreshadowed questions that later came to be relevant in evaluating the role of the blue box and paragraph
6 of the green box as the provisions under which the EU has exempted large amounts of direct payments.
The later payments under the Single Payment Scheme in the EU were found to provide less production
incentives and be less trade distorting than the previous compensatory payments (Rude 2008), although
the magnitudes of these differences are not necessarily clear (Moro and Sckokai 2013).
Matthews et al. (2017) provide a thorough review of the large literature on decoupling and trade
effects of the payments referred to in EU regulations as decoupled, most of which the EU exempts as
Decoupled income support under the green box (what EU regulations call decoupled payments are not
21
necessarily the same as payments meeting the criteria of paragraph 6 of the green box).23 Their report
reviews the channels through which direct payments, primarily those exempted under paragraph 6, might
influence production and hence trade. The review covers the impact of direct payments on labour use,
land use, investment behaviour, and farm productivity. The conclusion is guarded, referring to “the
possibility that even decoupled payments in the EU may have production and thus trade effects” (p. 61).
The review also points out that the assumptions about how to incorporate decoupled payments in
analytical models are responsible for the results, and there is no empirically-grounded justification for
handling decoupled payments in one way rather than another (p. 65).
3.2.2 Direct payments exempted by the United States
From 1996 through 2014 the United States exempted about USD 5 billion per year under the
green box heading Decoupled income support. This included mainly Production Flexibility Contract
(PFC) payments (or Agricultural Market Transition Act payments) and Direct Payments under successive
farm legislation.24 Although the payment amounts were not as large as in the case of the EU, much
analysis focused on estimating the possible effects on production and trade of these US payments by
themselves and along with other payments not claimed as green-box exempt. For example, Goodwin and
Mishra (2006) found that the distortions brought about by the exempted payments, although statistically
significant in some cases, were very modest.
Abler and Blandford (2005) reviewed the literature at the time, concluding that PFC payments
and certain non-exempted payments had some impact on production relative to a case of no such
payments, but in general the estimated impacts were small. In contrast, de Gorter (2009) argued that US
payments exempted as Decoupled income support caused production distortions that could in theory be
greater than those of an equivalent amount of fully coupled subsidies. This would result from cross-
subsidization and exit deterrence, the extent of which would depend on the distribution of farm sizes and
cost structures. The literature reviewed by, for example, O’Donoghue and Whitaker (2010) reveals the
diversity of findings regarding any connection between payments exempted as Decoupled income support
and increased production. Under the 2002 and 2008 farm legislation producers could update some
parameters determining the size of their payments, which could add production stimulus. However, for
corn and soybeans any such effect would be relatively small because of the characteristics of the cropping
alternatives (Hendricks and Sumner 2014).
The United States no longer exempts large direct payments as green box Decoupled income
support, and the urgency of gauging any production and trade effects of such payments has faded. That
said, in addition to reviewing the literature in recent years, Tong et al. (2019) estimate the effects on US
agricultural exports (including livestock) of producer payments in 1999 to 2011. The analysis usefully
separates the payments the United States exempts as Decoupled income support from other green box
payments, such as disaster payments, and from payments that are not exempted on green box grounds.
They conclude that the effects on US exports of PFC payments and Direct Payments were negligible,
consistent with theoretical arguments by Chambers and Voica (2016). This would satisfy the green box
23 In recent years the EU exempts payments under its Basic Payment Scheme (BPS) under paragraph 6 as Decoupled
income support and payments under its Single Area Payment Scheme (SAPS) under paragraph 5 as Other direct
payments, claimed as meeting the criteria 6(b) to 6(e) of paragraph 6.
24 As noted above, Direct payments to producers is a heading in Annex 2 (green box). The US payment program
named Direct Payments was authorized in 2002 and 2008 US farm legislation and repealed in 2014 legislation.
22
fundamental requirement of at most minimal trade-distorting effects and the payments would on this basis
qualify for green box classification.
Relatively much effort has gone into evaluating the effects or compatibility of direct payments
exempted by the EU and the United States compared to similar analysis for other members. In contrast to
analysis only of payments exempted as Decoupled income support, Banga (2014) considered all green
box payments as well as green box expenditures on General services, Public stockholding for food
security purposes and Domestic food aid and found positive effects on agricultural productivity and
technical efficiency associated with the change in green box support between 1995 and 2007 in some of
the 26 countries studied. In later years some members have increased the amounts they exempt on green
box grounds. China and India, for example, tripled their green box exempted expenditures between 2007
and, respectively, 2016 and 2017, as discussed in Section 4. Analysis for later years of all support that
members exempt from AMS calculations may in due course provide additional insight.
3.2.3 Compatibility of payments with policy-specific criteria
Apart from the question of payments claimed as Decoupled income support having significant
trade effects or not, analysts have examined the compatibility of EU and US direct payments with the
policy-specific criteria of paragraph 6 of the green box. A particular concern is whether the payment
meets criterion 6(b), which requires the amount of payment not to be related to or based on the type or
volume of production. Failing to meet this criterion would disqualify the payment from being exempted
from AMS. Swinbank and Tranter (2005) suggested that the EU Single Payment Scheme failed to meet
this criterion in two ways: the land on which the payment was claimed could not be used to produce fruit
and vegetables and the land must be kept in “good agricultural and environmental condition”. However,
EU policy changes in 2007 made fruit and vegetable land eligible for payments, which might overcome at
least part of the problem (Swinbank 2008, 2009; EC 2007). While payments remain conditional on an
agricultural activity being carried out on agricultural areas, more recent EU policy changes clarify that
this activity does not require the production, rearing or growing of agricultural products (it can, for
example, consist of removing unwanted scrub vegetation). In the dispute United States – Upland Cotton
(DS267), the WTO Appellate Body (AB) found that the US PFC and Direct Payments did not meet the
type-of-production criterion in paragraph 6(b) because of restrictions on what could be produced on
eligible land (WTO 2005).25 Later US farm legislation eased these restrictions.
Paragraph 12 in the green box, titled Payments under environmental programs, lists only few
criteria. While they were the relevant ones at the time of negotiating the AoA, members’ environmental
programs have since evolved. New types of programs are being developed and implemented in which
payments are based on environmental performance instead of certain producer practices. This raises
questions about the compatibility of the payments with paragraph 12 as a whole and with particular
wording in it, such as payments being dependent on fulfilling “conditions related to production methods
or inputs.” A strict examination of the programs under which direct payments are exempted as being
made under environmental programs could also find that claims for exemption relate more to the
environmental objective of the program than to the criteria for making the payments.
25 The dispute concerned violations of US obligations under the WTO Agreement on Subsidies and Countervailing
Measures (ASCM), not excessive AMS support. However, the question of PFC and Direct Payments being
compatible or not with paragraph 6(b) mattered for a key calculation under Art. 13 of the AoA (see, e.g., Sumner
2005).
23
Analysts have drawn attention to a variety of aspects regarding payments under paragraph 12,
such as the positive correlation between the site-specificity of payments and their transaction costs, the
trade-off between efficiency and cost effectiveness, the possibility that result-based and value-based
payments are not only compatible with paragraph 12 but are also more efficient than traditional
management-based or cost-based payments, and the potential compatibility with paragraph 12 (and the
fundamental requirement of paragraph 1 about minimal trade-distorting effects) of payments based on
farmer’s willingness to accept or based on results related to the social value of the amenities provided
(Swinbank 2009; Steenblik and Tsai 2009; Hasund and Johansson 2016; Bureau 2017). Paragraph 12 on
Payments under environmental programs could be seen as a potential subject for overhaul, as discussed
in Section 7 on emerging policy priorities.
3.3 Issues concerning calculation of market price support under the AoA
3.3.1 Measuring and interpreting AoA market price support
The measurement of MPS in the AoA differs from economic MPS as a result of negotiations in
the Uruguay Round. The domestic price, the reference price and the quantity used to calculate the amount
of support can all be, and usually are, different in the two measurements. The following two formulas
show the different variables involved in the calculations of MPS.
AoA MPSt = [AAPt – FERPfixed years] × [Eligible Productiont]
Economic MPSt = [Domestic Pricet – Border Pricet] × [Total Productiont]
where AAP is the applied administered price, FERP is the fixed external reference price, fixed years are
1986-88 for original members or some later period for Art. XII accession members, and t is the current
year.
The variables defining AoA MPS are those of Annex 3, para. 8. The AAP is a policy variable,
while the domestic price can be an observed price or a calculated average market price, which will often
track but need not equal the AAP. The FERP is constant over time, while the border price varies from
year to year with international market conditions (in practice the border price is often adjusted with
margins to correspond to the farm level domestic price). The eligible production is the quantity of
production eligible to receive the AAP, while the calculation of economic MPS uses total production.
The economic MPS represents an often major part of the policy-induced economic incentive to
produce. The AoA seeks to rein in this incentive, which makes it important to assess how complying with
a member’s domestic support commitment, which involves the AoA MPS, affects the economic MPS.
The differences among members in terms of their commitments and policies, as well as the parameters
and data to use in calculating AoA MPS, favour member-specific assessments. For example, the
contributors to Orden et al. (2011) examine through an economic lens the policy choices of eight
members in relation to their domestic support commitments. Section 6 of this paper analyzes how
domestic support rules and commitments may affect domestic policy settings and resulting economic
support in the context of the dispute China ‒ Agricultural Producers (DS511), recent notifications and
counter-notifications about India’s MPS and the ongoing dispute India ‒ Measures Concerning Sugar and
Sugarcane (DS580).
The different components of the support that make up AoA domestic support are difficult to
represent in economic analysis. Border protection is represented in economic analysis by a relative price
gap, or the combination of border protection and producer payments can be represented by a nominal rate
of assistance (e.g., Anderson 2009). The AoA, however, calculates MPS as required by Annex 3 by using
24
a price gap that differs from border protection and a quantity that need not be total production. The AoA
also expresses the limit on domestic support and measures the applied support as nominal amounts.
Modelling AoA domestic support or its components as variables separate from those relating to border
protection therefore requires the introduction of variables usually not seen in economic models.
In an analysis that represents the economic support provided by border policies separately from
budgetary transfers, accounting also for the MPS calculated under Annex 3 would add little to the
analytical results in economic terms. The complexity in modelling AoA domestic support and the limit or
limits applying in different ways for different members in different years to the AMS part of domestic
support may also help to explain why economic analysis often accounts only for the budgetary transfer
component of domestic support and separately for the border protection. The results of economic analysis
referring to domestic support need to be interpreted with care, since what the analysis accounts for as
domestic support may in fact be only the budgetary transfers part of the AoA domestic support.26 The
need for care is particularly relevant if the economic analysis concerns compliance with the limits
(BTAMS or AMS limits) identified by the AoA or other domestic support scenarios.
The architecture of the AoA may be redundant as far as MPS in domestic support is concerned,
given the AoA provisions on market access and export competition. This redundancy may be behind what
is sometimes expressed as a concern about double-counting of MPS. However, a member’s domestic
support commitments are distinct from its commitments on border measures, and the applied variables
that are subject to the respective commitments are different. In market access the applied tariff must not
exceed the bound tariff, and in domestic support the measured amount of non-exempt support must not
exceed its limit, whether an AMS limit or the BTAMS. The fact that market access commitments and
domestic support commitments are distinct from each other requires a separate accounting of what is
subject to each kind of commitment and avoids double-counting.
3.3.2 Eventual infeasibility of supporting producers by means of administered prices
The calculation of AoA MPS is a contentious subject in the CoA, ongoing negotiations and
disputes, as discussed in Sections 5 and 6. The size of the measured MPS under AoA rules can make the
resulting product-specific AMS exceed its limit or threshold in spite of economic MPS being small or nil.
This can arise for both developed and developing countries. The incidence of the issue varies among
members since it depends on changes in the AAP compared to the FERP, the member having no or a nil
BTAMS or a positive BTAMS, its de minimis percentage, and the fact that most VoPs are rising in
nominal terms while BTAMS is fixed.
A product’s MPS can increase more rapidly than its de minimis allowance increases (Matthews
2015). Assume that the administered price applies to all production and for simplicity the quantity of
eligible production remains unchanged when the administered price is raised. When the administered
price is raised by a dollars per tonne, the gap in the MPS calculation also increases by a dollars per tonne.
This larger gap is multiplied by the quantity of eligible production to generate a proportionately larger
amount of MPS. However, although the producer price used to calculate VoP may also rise by a dollars
per tonne, only a percentage of that additional VoP is added to the de minimis allowance (5%, 8.5% or
10% as applicable).
26 For example, the widely used GTAP database uses budgetary transfers to represent domestic support (Huang
2013; Aguiar et al. 2019). Boulanger et al. (2015) and Urban et al. (2016) consider advances in the representation in
the GTAP database of direct payments under EU agricultural policy but do not extend the work to the MPS
component of domestic support.
25
Over time the increases in the administered price will therefore generate MPS large enough to
exceed the product’s de minimis AMS allowance even if only keeping pace with inflation. This happens
even though the allowance increases as the VoP increases. The problem is aggravated when the FERP is
based on prices observed as long ago as in 1986-88 as the AoA stipulates for the original WTO members.
The reference price from more than 30 years ago usually makes the MPS larger than when using a more
recent reference price. Most Art. XII accession members have used data for more recent years in their
accession documents. In the case of China, a dispute settlement panel concluded that the more recent base
years from the accession documents should determine the FERP for calculating MPS (see Section 6).
There is little disagreement from an economic perspective that the calculation of AoA MPS has
elements that need changing. The Uruguay Round negotiators of the AoA may have wished to limit the
support provided through an administered price but not to make it impossible to use an administered price
as a policy instrument. Negotiators clearly had in mind a path towards revising the AoA a few years after
1994, as set out in Art. 20. Negotiations started in 1999 and were then folded into the Doha Round
negotiations. The base years for the FERP could have been updated but this did not become a focus in the
negotiations. An update would in many cases have led to a higher FERP, a smaller price gap and
continued feasibility of supporting producers by means of an administered price. The eventual
impossibility of using an administered price may be a consequence of the ongoing negotiations not having
set a more recent base period for the external reference price. At the same time it is an achievement in
terms of prompting greater market orientation: an administered price is not a market price.
3.3.3 Acquisition at administered prices for public stockholding and AMS
The calculation and treatment of MPS with regard to the rules in paragraph 3 of the green box,
titled Public stockholding for food security purposes is a major unresolved issue in the ongoing
negotiations. The paragraph allows the exemption from AMS of a government’s expenditures in relation
to the accumulation and holding of stocks as an integral part of a food security program. One of the
conditions for the exemption is that government food purchases shall be made at current market prices.
The issue for analysis has been the paragraph’s footnote 5, which allows developing countries to exempt
the expenditures even if they acquire the stocks at administered prices. However, the exemption is
conditional on the member calculating MPS in the normal AoA manner when using administered prices
and including that amount in the product’s AMS.
The original WTO members acquiring stocks at an administered price must use the difference
between the acquisition price and the FERP from 1986-88 in calculating current MPS. The resulting price
gap is therefore large for many products, and including MPS calculated in accordance with the AoA in the
product’s AMS can give an AMS in excess of a member’s limit, even when the AAP is close to the
current market price. The conditionality formulated in footnote 5 in effect inhibits excessive producer
support measured as an AMS by means of buying at an administered price without impeding the
acquisition of stocks for food security purposes at market prices.
3.3.4 Acquisition at administered prices and shelter against dispute challenge
As part of the ongoing negotiations, the WTO ministerial meeting in Bali in 2013 and a decision
by the WTO’s General Council in 2014 produced text to address the negotiating proposals of those
developing country members who wish to revise part of footnote 5. These decisions are designed to
address the pressures that led earlier negotiating text to suggest amending AoA footnote 5. The pressures
stem from some members’ desire to be permitted to provide unlimited amounts of MPS without threat of
challenge in a WTO dispute over domestic support when stocks are acquired for food security purposes or
from low-income or resource-poor producers with the objective of fighting hunger and rural poverty.
26
Other members worry about the consequences of some members being free to provide these unlimited
amounts of support.
The decisions essentially enable developing countries to exceed their AMS limits or BTAMS
without risking a challenge under WTO dispute settlement rules, as long as the excessive AMS support
results from accounting for the price gaps as per the green box footnote 5. The shelter against challenge is
in place until a permanent solution is agreed and adopted. Conditions related to transparency and guarding
against trade distortions are attached to this shelter. The decisions apply to programs that existed when the
2013 decision was taken and only to support for traditional food staple crops.
The analysis in relation to footnote 5 has to a large extent addressed questions about level of
stocks in relation to the food availability dimension of food security rather than questions about producer
price support and related trade distortions. It is not clear, for example, what would be the effects on the
ability of stockholding programs to meet their consumer-oriented objectives, such as making certain
quantities of food available to targeted segments of the population at policy-determined prices, if the
necessary quantities were procured at market prices instead of administered prices. An analysis by OECD
(2018) goes some way in clarifying the complex relationships involved in designing effective
stockholding programs, specifically in the case of rice in Asia, without going into depth on the question of
using market prices instead of administered prices as acquisition prices.
While policies to increase food availability can help to increase food security and be justified
politically, acquisition at administered prices may not be the only or the best avenue to increase food
security. This is particularly the case if a country’s inadequate food security is the result of segments of its
population not having the disposable income to obtain sufficient food. High administered producer prices
can raise consumer prices, but the acquired stocks can be used to provide food to segments of the
population at lower prices. Many complex relationships are thus involved in analyzing policies for food
security. For example, India is a leading proponent of needing to address the consequences of acquisition
at administered prices in the ongoing negotiations and is the only member to date to have claimed shelter
under the interim decision (for rice in 2018), and is also one of the world’s top exporters of foodstuffs
such as rice, sugar and bovine meat. Producers and exporters in other countries are therefore wary of the
role that government purchases at administered prices may play in stimulating production or in building
exportable stocks.
3.3.5 Findings of economic analysis
Several analyses has considered how the rules of the AoA on MPS calculations might be revised
through negotiations to become more economically meaningful. Such analysis includes that of Díaz-
Bonilla (2017), Galtier (2015, 2017), Glauber (2016), Hoda and Gulati (2013), ICTSD (2016), Josling
(2015), Konandreas and Mermigkas (2014), and Matthews (2014, 2015). Also, Montemayor (2014)
explored for five unnamed developing countries, with reference to wheat and rice in some year in the
2008 to 2011 time span, the effects on MPS under different scenarios representing modified rules for
calculating MPS. The scenarios included six definitions of the reference price and three definitions of
eligible production. The scenarios generated a large number of combinations for a given country, which
were used to examine how much administered prices or eligible production would need to change in order
for the product’s AMS to fit within its limit. The conclusion was that applying the rules for MPS
calculation to most of the studied scenarios would lead the countries to exceed their de minimis limits for
product-specific AMSs.
Recognizing the problems associated with calculating MPS in conjunction with footnote 5 of the
green box, Díaz-Bonilla (2017) suggested that the footnote be revised such that when the AAP is set at a
27
level no higher than the domestic price corresponding to the border price plus any wedge resulting from
legitimate import or export measures, the relevant price gap is nil, and no MPS be calculated. However,
MPS would be calculated in a situation where the domestic market price for some reason was lower than
the AAP and food stocks were being exported. Including MPS in AMS could then lead to the member’s
compliance with its AMS limit being challenged.
Analysis has focussed on ways to acquire stocks for a stockholding program at an administered
price without the resulting producer support being constrained by AMS limits. Analysis of the effects on
production and trade if a member shifted from acquiring the needed stocks at an administered price to
acquiring them at the market price is more scarce. Such a shift would eliminate the need to calculate AoA
MPS, and acquisition for public stockholding would not be constrained by AMS limits. OECD (2018)
lays out a framework that allows an evaluation of the differences between buying at market prices and
buying at administered prices. Results are expected to be reported in Deuss and Adenäuer (forthcoming).
Among the eight Asian countries included in the OECD (2018) analysis of public stockholding for rice,
only two make publicly available the kind of stocks data that would facilitate economic analysis of a shift
to acquisition at market prices. This may be part of the explanation for the dearth of such analysis.
3.4 Summary
AMS support and trade-distorting support are not synonymous: Art 6 support is a more
comprehensive measurement of trade-distorting support. Analysis of domestic support with regard to the
rules of the AoA has focused on the potential of green-box exempted direct payments to distort
production and trade and compliance of such support with the policy-specific exemption criteria. MPS
calculated under the AoA, which differs from economic MPS, has come to the fore in negotiations and
WTO dispute settlement. Issues arise about compliance with members’ domestic support commitments,
about the eventual infeasibility of providing support by means of administered prices within those
commitments, and whether MPS resulting from acquisition of public stocks for food security purposes
will be included in AMS. Many dimensions of domestic support under AoA rules offer scope for further
analysis to underpin members’ policy choices.
28
4. EVOLUTION OF DIFFERENT KINDS OF DOMESTIC SUPPORT SINCE 1995
Members’ notify domestic support information to the CoA under Art. 18 of the Agreement on
Agriculture. This section reviews members’ support based on the notified data and outlines trends and
patterns over time between 1995 and 2016 both for all notifying members together and for selected key
members. The review considers AMS support and exempted Art. 6.2, blue box and green box support of
different kinds, recognizing that many notifications are still outstanding for the most recent years. It
evaluates six summations of support and compares the notified WTO domestic support with
measurements of support reported by the OECD.
4.1 Notified domestic support
The review draws on a data base of members’ own annual (or biennial) notifications to the CoA
of their support in 1995-2018 under Art. 18.2, for which WTO (1995) specifies notification requirements
and formats.27 The notified data of the 36 Art. XII accession members starts with their first full year as
members, and their domestic support data for earlier years used in the process of accession is not
reviewed here. Amounts of support, limits and values of production are converted to United States dollars
(USD) from the various currencies members use in their notifications and are expressed in nominal terms
unless otherwise indicated (nominal annual average exchange rates from IMF (2019)). Following the
AoA, the review expresses support amounts also as percentages of value of production (VoP) in
agriculture at domestic prices rather than VoP at international prices or as percentages of value added in
agriculture. Since many members’ notifications do not give VoP, yearly values of production are gross
production value in current USD from FAOSTAT (available only through 2016).28
Members’ notifications relate to the implementation of their commitments as enshrined in their
Schedules of Concessions and Commitments. The number of members in the review is therefore the same
as the number of Schedules applying to domestic support, i.e., 135. Domestic support for 2016 had been
notified by 49 members by December 2019 and five more members had notified nil support. Most of the
outstanding notifications for 2016 and earlier years are those of lower-support members. Even fewer
members had notified for 2017 and fewer still for 2018. Notified support (as of December 2019) other
than Art. 6.2 drops off sharply for 2017, with little support of any kind notified for 2018. The figures in
this section therefore do not show these last two years. Most tables show members’ notified support in
five-year intervals from 1995 to 2015 and in 2016.
The review first considers Art. 6 support and its three components (AMS support, Art. 6.2
support, and blue box support), followed by green box support. It focuses on individual years or certain
periods, complemented by references to the 2014-16 rankings of a sub-set of members which provided
27 The data base relies on the WTO Agriculture Information Management System (Ag-IMS at wto.agims.com) for
data notified until 2015. Data from individual members’ notifications circulated after 2015 and other information
complements the Ag-IMS data for later years for this paper. A revised Ag-IMS data base, drawing on a new
notification system and expected to lend itself more easily to analysis, is being made public in 2020. For ease of
reading, only the first part of members’ split years is shown (such as fiscal year, financial year, or marketing year).
Thus 2014 corresponds to 2014-15 or 2014/15, etc.
28 VoP in agriculture as an indicator of the size of a member’s agriculture sector is not measured uniformly among
members in their notifications (mostly from national sources) and in different international data bases. Brink (2012)
highlights differences in definitions and sources of the measurement a selection of members choose to represent
their VoP in agriculture.
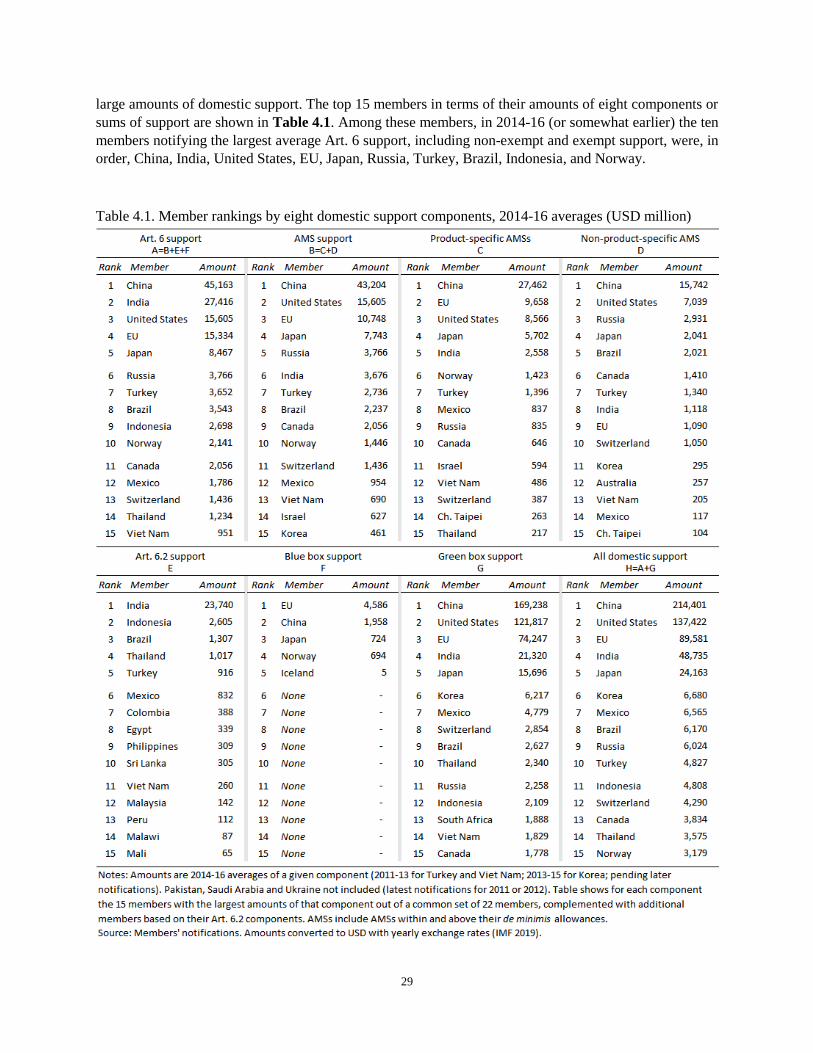
29
large amounts of domestic support. The top 15 members in terms of their amounts of eight components or
sums of support are shown in Table 4.1. Among these members, in 2014-16 (or somewhat earlier) the ten
members notifying the largest average Art. 6 support, including non-exempt and exempt support, were, in
order, China, India, United States, EU, Japan, Russia, Turkey, Brazil, Indonesia, and Norway.
Table 4.1. Member rankings by eight domestic support components, 2014-16 averages (USD million)
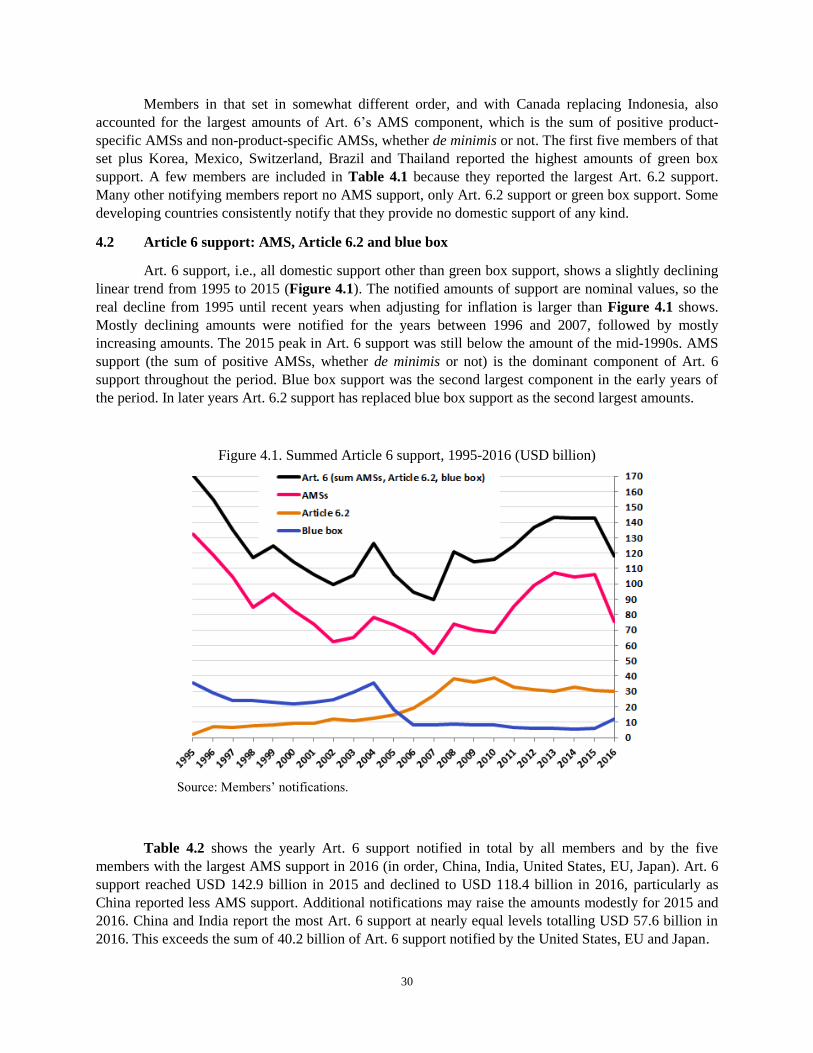
30
Members in that set in somewhat different order, and with Canada replacing Indonesia, also
accounted for the largest amounts of Art. 6’s AMS component, which is the sum of positive product-
specific AMSs and non-product-specific AMSs, whether de minimis or not. The first five members of that
set plus Korea, Mexico, Switzerland, Brazil and Thailand reported the highest amounts of green box
support. A few members are included in Table 4.1 because they reported the largest Art. 6.2 support.
Many other notifying members report no AMS support, only Art. 6.2 support or green box support. Some
developing countries consistently notify that they provide no domestic support of any kind.
4.2 Article 6 support: AMS, Article 6.2 and blue box
Art. 6 support, i.e., all domestic support other than green box support, shows a slightly declining
linear trend from 1995 to 2015 (Figure 4.1). The notified amounts of support are nominal values, so the
real decline from 1995 until recent years when adjusting for inflation is larger than Figure 4.1 shows.
Mostly declining amounts were notified for the years between 1996 and 2007, followed by mostly
increasing amounts. The 2015 peak in Art. 6 support was still below the amount of the mid-1990s. AMS
support (the sum of positive AMSs, whether de minimis or not) is the dominant component of Art. 6
support throughout the period. Blue box support was the second largest component in the early years of
the period. In later years Art. 6.2 support has replaced blue box support as the second largest amounts.
Figure 4.1. Summed Article 6 support, 1995-2016 (USD billion)
Source: Members’ notifications.
Table 4.2 shows the yearly Art. 6 support notified in total by all members and by the five
members with the largest AMS support in 2016 (in order, China, India, United States, EU, Japan). Art. 6
support reached USD 142.9 billion in 2015 and declined to USD 118.4 billion in 2016, particularly as
China reported less AMS support. Additional notifications may raise the amounts modestly for 2015 and
2016. China and India report the most Art. 6 support at nearly equal levels totalling USD 57.6 billion in
2016. This exceeds the sum of 40.2 billion of Art. 6 support notified by the United States, EU and Japan.
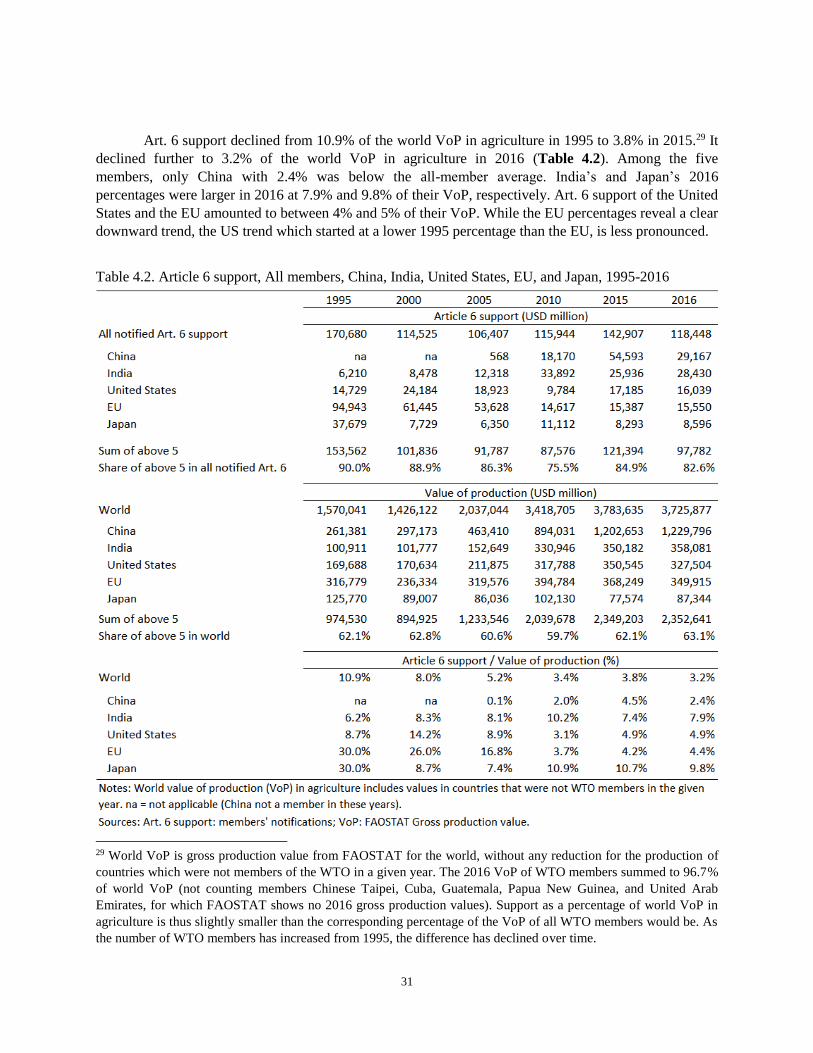
31
Art. 6 support declined from 10.9% of the world VoP in agriculture in 1995 to 3.8% in 2015.29 It
declined further to 3.2% of the world VoP in agriculture in 2016 (Table 4.2). Among the five
members, only China with 2.4% was below the all-member average. India’s and Japan’s 2016
percentages were larger in 2016 at 7.9% and 9.8% of their VoP, respectively. Art. 6 support of the United
States and the EU amounted to between 4% and 5% of their VoP. While the EU percentages reveal a clear
downward trend, the US trend which started at a lower 1995 percentage than the EU, is less pronounced.
Table 4.2. Article 6 support, All members, China, India, United States, EU, and Japan, 1995-2016
29 World VoP is gross production value from FAOSTAT for the world, without any reduction for the production of
countries which were not members of the WTO in a given year. The 2016 VoP of WTO members summed to 96.7%
of world VoP (not counting members Chinese Taipei, Cuba, Guatemala, Papua New Guinea, and United Arab
Emirates, for which FAOSTAT shows no 2016 gross production values). Support as a percentage of world VoP in
agriculture is thus slightly smaller than the corresponding percentage of the VoP of all WTO members would be. As
the number of WTO members has increased from 1995, the difference has declined over time.
32
4.2.1 AMS support
Since 1995 only 45, i.e., one third, of the 135 members, have notified AMS support in at least one
year. They include members from seven of the eight combinations of the following categories: developed
and developing country members, original and Art. XII members, and members with no or a nil BTAMS
and those with a positive BTAMS (no developed original member has a nil BTAMS). Twenty-six
members had by December 2019 notified 2016 AMS support. Other members have notified only other
support than AMS support, notified nil support, or not notified at all. AMS support in total in recent years
will be somewhat larger than shown once more members notify.
AMS support followed a declining trend until about 2007, and then increased although not yet
reaching the levels of the mid-1990s. The pattern of AMS support drives the corresponding trends in Art.
6 support. The start of an upward trend in AMS support in 2008 coincides with the sharp rise in world
prices of many agricultural products and production inputs at that time. The yearly totals also include
support from the growing number of Art. XII members.
The yearly AMS support reported in total by all notifying members and by the five members with
the largest AMS support in 2016 (in order, China, United States, EU, Japan, and India), is shown in
Table 4.3. This is the sum of positive de minimis AMSs and non-de minimis AMSs. AMS support is more
concentrated among only a few members than is VoP in agriculture. The five members notifying the most
AMS support in 2016 reported over 80% of all AMS support in various years (not in 2010), while they
accounted for closer to 60% of world agricultural VoP. On the basis of the average amount of AMS
support in 2014-16, the ten members with the largest AMS support include the five members mentioned
plus Russia, Turkey, Brazil, Canada and Norway (Switzerland falls just slightly outside that set)
(Table 4.1). These ten members accounted for almost all, or 98.8%, of the AMS support in 2016
(Turkey’s AMS support is for 2013, pending its 2016 notification). However, they represented only
72.4% of world VoP and 74.9% of the VoP of all WTO members. Additional notifications to be
submitted will likely show little AMS support, which means the concentration of AMS support will
remain pronounced.
Among the WTO’s original members those reporting the largest amounts of AMS support remain
the same when comparing 2016 to 1995 although their relative ranking has changed, partly explained by
policy changes. China became a WTO member only in 2001 but has become the member reporting the
largest AMS support in recent years. This creates a very substantial shift in AMS support away from
developed members on which domestic support attention earlier focused and toward emerging-market
members asserting developing-member status.
Putting the amount of AMS support in relation to a member’s VoP in agriculture gives an
indication of the emphasis the member puts on supporting producers by means of AMS support, as
distinct from other categories of support. Between 1995 and 2016 AMS support by the five members
reporting the most such support in 2016, expressed in percent of VoP, declined after 1995 or 2000 and
stayed stable or increased somewhat since 2010. The trends in AMS support as a percentage of VoP
follow from changes in policy, in reporting practice, or in the VoP in agriculture.
China’s AMS support in 2016 exceeded the level of any other member but, at 1.9% of China’s
agricultural VoP in 2016, it is a relatively low percentage in the group of five. Comparing 2016 to 1995,
the AMS support reported by the United States about doubled (after showing substantial variation) but so
did its agricultural VoP. The percentage changed only little. In contrast, the AMS support in the EU
declined multifold and so did the percentage although the VoP rose only modestly. Japan’s AMS support
has changed little since 2000 while its agricultural VoP is trending down, contributing to a higher
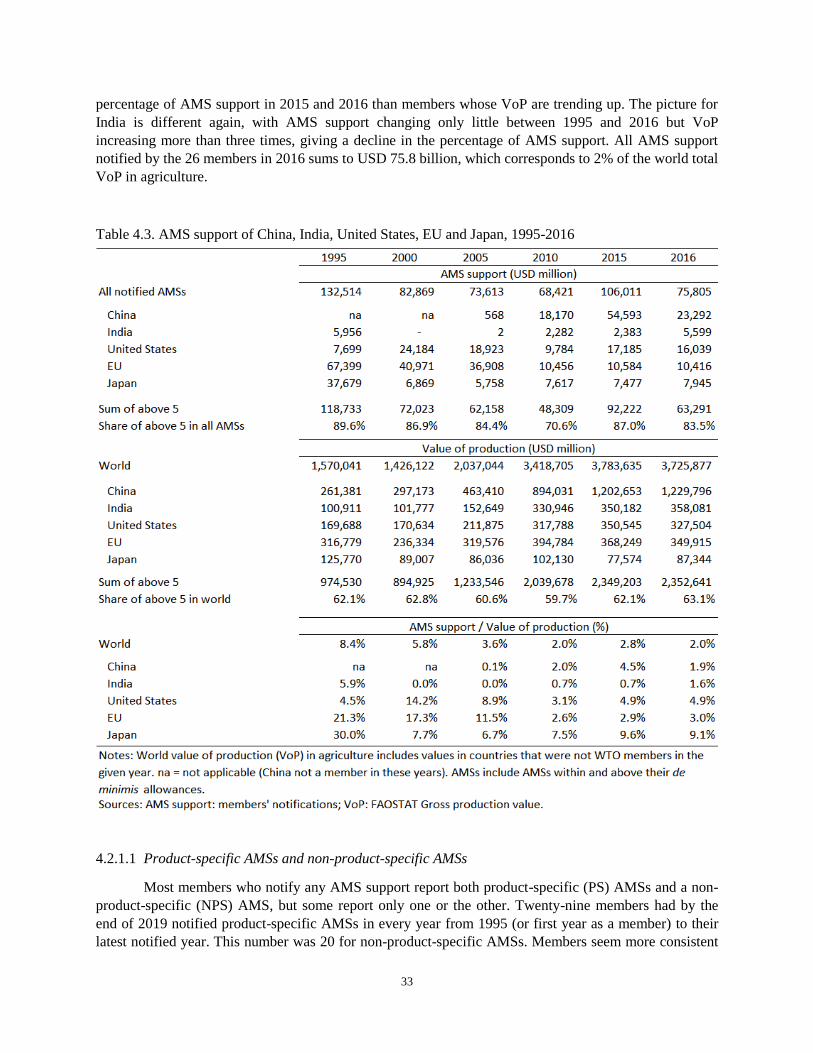
33
percentage of AMS support in 2015 and 2016 than members whose VoP are trending up. The picture for
India is different again, with AMS support changing only little between 1995 and 2016 but VoP
increasing more than three times, giving a decline in the percentage of AMS support. All AMS support
notified by the 26 members in 2016 sums to USD 75.8 billion, which corresponds to 2% of the world total
VoP in agriculture.
Table 4.3. AMS support of China, India, United States, EU and Japan, 1995-2016
4.2.1.1 Product-specific AMSs and non-product-specific AMSs
Most members who notify any AMS support report both product-specific (PS) AMSs and a non-
product-specific (NPS) AMS, but some report only one or the other. Twenty-nine members had by the
end of 2019 notified product-specific AMSs in every year from 1995 (or first year as a member) to their
latest notified year. This number was 20 for non-product-specific AMSs. Members seem more consistent
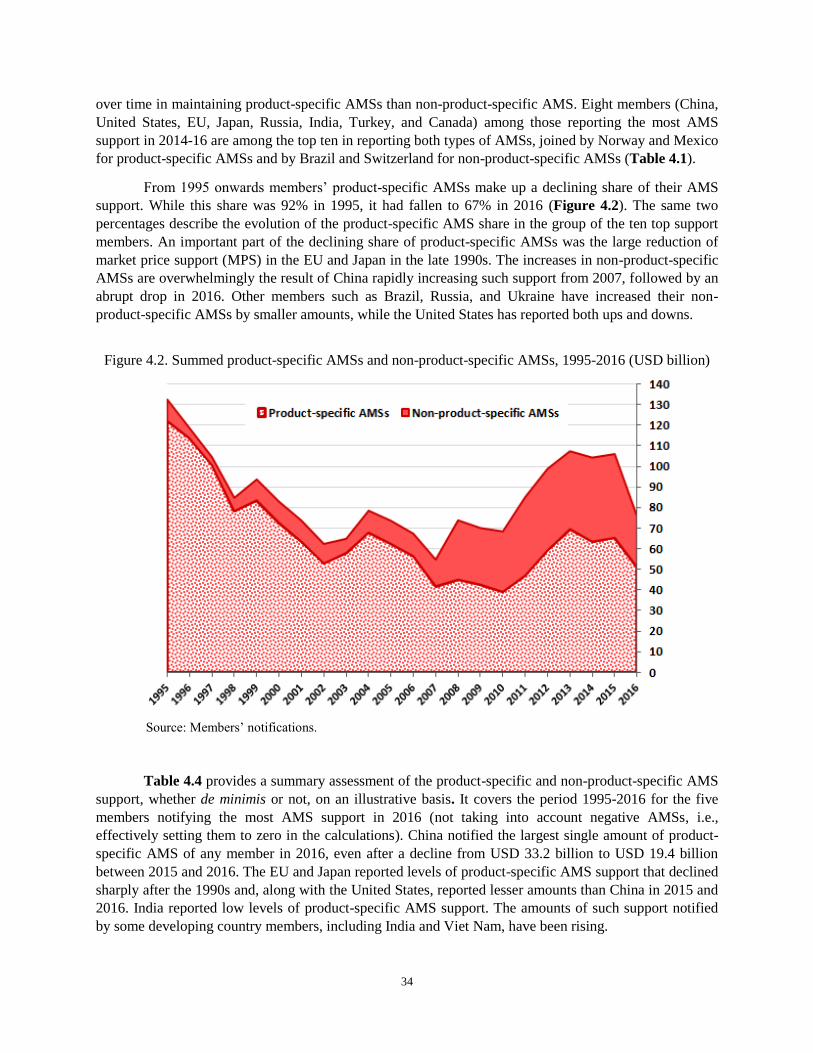
34
over time in maintaining product-specific AMSs than non-product-specific AMS. Eight members (China,
United States, EU, Japan, Russia, India, Turkey, and Canada) among those reporting the most AMS
support in 2014-16 are among the top ten in reporting both types of AMSs, joined by Norway and Mexico
for product-specific AMSs and by Brazil and Switzerland for non-product-specific AMSs (Table 4.1).
From 1995 onwards members’ product-specific AMSs make up a declining share of their AMS
support. While this share was 92% in 1995, it had fallen to 67% in 2016 (Figure 4.2). The same two
percentages describe the evolution of the product-specific AMS share in the group of the ten top support
members. An important part of the declining share of product-specific AMSs was the large reduction of
market price support (MPS) in the EU and Japan in the late 1990s. The increases in non-product-specific
AMSs are overwhelmingly the result of China rapidly increasing such support from 2007, followed by an
abrupt drop in 2016. Other members such as Brazil, Russia, and Ukraine have increased their non-
product-specific AMSs by smaller amounts, while the United States has reported both ups and downs.
Figure 4.2. Summed product-specific AMSs and non-product-specific AMSs, 1995-2016 (USD billion)
Source: Members’ notifications.
Table 4.4 provides a summary assessment of the product-specific and non-product-specific AMS
support, whether de minimis or not, on an illustrative basis. It covers the period 1995-2016 for the five
members notifying the most AMS support in 2016 (not taking into account negative AMSs, i.e.,
effectively setting them to zero in the calculations). China notified the largest single amount of product-
specific AMS of any member in 2016, even after a decline from USD 33.2 billion to USD 19.4 billion
between 2015 and 2016. The EU and Japan reported levels of product-specific AMS support that declined
sharply after the 1990s and, along with the United States, reported lesser amounts than China in 2015 and
2016. India reported low levels of product-specific AMS support. The amounts of such support notified
by some developing country members, including India and Viet Nam, have been rising.
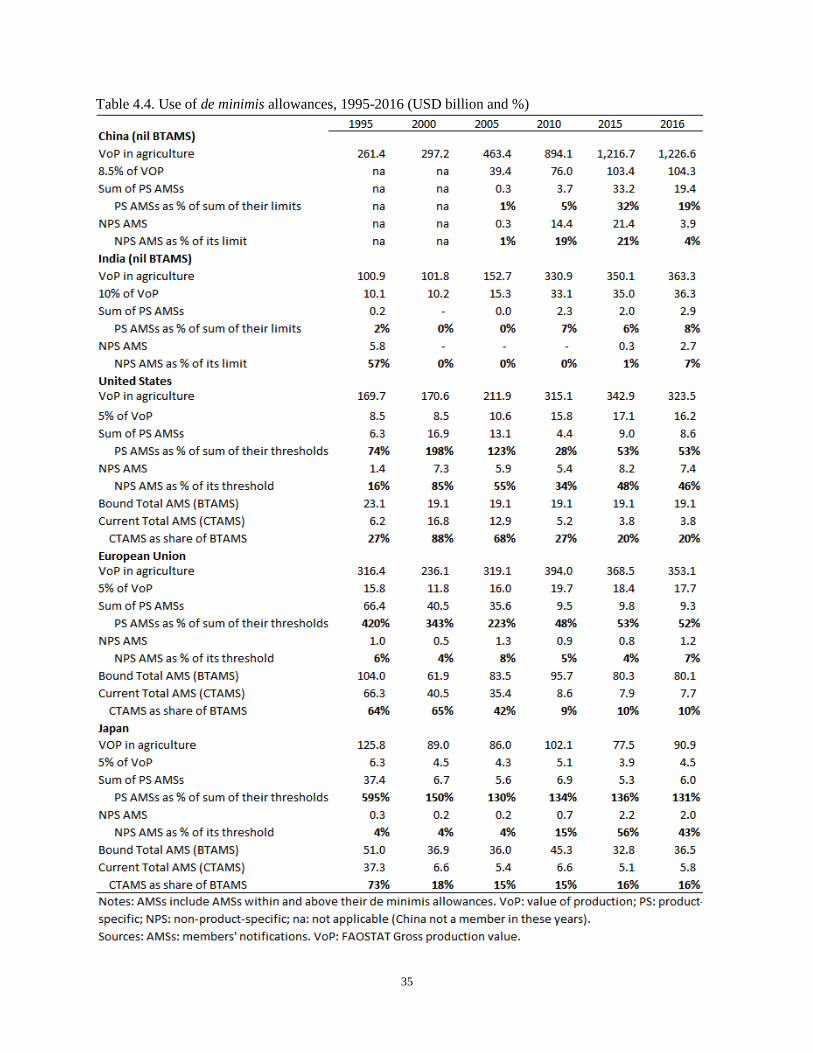
35
Table 4.4. Use of de minimis allowances, 1995-2016 (USD billion and %)
36
MPS (not shown separately in Table 4.4) accounted for a large part of product-specific AMSs in
the early years of the WTO, as was the case in the 1986-88 data submitted when concluding the Uruguay
Round. The EU and Japan reported the largest amounts of such support in 1995 (USD 44.4 billion and
USD 34.8 billion, respectively), followed by the United States (USD 6.2 billion). MPS also made up a
large share of the smaller product-specific AMS support of members such as Norway and Iceland.
EU price policy changes made its MPS decline to USD 7.4 billion in 2016, measured for only
three products (butter, skimmed milk powder, common wheat). This reduced the EU product-specific
AMS to one-seventh of its 1995 level. Japan’s elimination of its support price for rice resulted in a sharp
drop in AMS for rice even though producer prices of rice did not decline significantly. Japan continued to
report MPS for beef and pork, amounting to USD 4.2 billion in 2016. While the United States revised its
domestic dairy policy and no longer reports MPS for dairy, its MPS for sugar amounted to USD 1.5
billion in 2016. China’s product-specific AMS support dropped in 2016 primarily as MPS for corn, cotton
and rice was eliminated or reduced. China’s measurement of MPS was found in a WTO dispute to have
been too low during 2012-15 (see Section 6). Measuring China’s MPS correctly would thus increase
product-specific AMSs, which would reinforce China’s top rank.
Regarding non-product-specific AMS, the United States consistently reported the largest single
such AMS in the 1995-2006 period. An exception is India in 1995 before it started to exempt large
amounts of Art. 6.2 support. China then for a period notified a larger non-product-specific AMS than any
other member, but it fell from USD 21.4 billion to USD 3.9 billion between 2015 and 2016 due to
declining non-product-specific input subsidies. This again made the United States’ non-product-specific
AMS of USD 7.4 billion in 2016, including payments under the Agriculture Risk Coverage (ARC) and
Price Loss Coverage (PLC) programs, larger than any other member’s.
While China emerged to become the member reporting the largest amounts of both product-
specific and non-product-specific AMS support by 2015, its policy changes made it less dominant by
2016, especially in non-product-specific AMS. The EU and Japan have reported relatively low levels of
non-product-specific AMSs. India has over the years reported less AMS support than the other four top
supporting members, but it raised both its product-specific and non-product-specific AMS support
increased in recent years through larger MPS and larger premium subsidies on insurance subsidies.
Canada’s and Russia’s non-product-specific AMSs (not shown in Table 4.4) have declined from a peak
in 2011 and from WTO accession in 2012, respectively. Other members are also changing their product-
specific or non-product-specific AMS support in recent years, whether increasing or decreasing, but the
amounts involved are much less than in the case of China.
Comparing AMS support to other categories of support, the reporting by the EU, Japan, the
United States and more recently by China of smaller amounts of MPS over time coincided with a shift to
blue box and green box payments (discussed below). Given that MPS is one of the most distorting forms
of support, the reduction or elimination of such support is in line with the market-oriented objective of the
AoA. Changing policy to support producers through blue box or green box compliant payments instead of
MPS is thus a positive kind of box shifting, contrary to the negative sense sometimes given to this term.
4.2.1.2 De minimis AMSs and CTAMS
While the above analysis pertains to all AMSs whether they are de minimis or not, an AMS’s de
minimis status matters in two ways. For most members the de minimis level is a limit on an AMS. For
other members, with a positive BTAMS, an AMS can exceed its de minimis threshold but is then included
in CTAMS. A member’s whole amount of AMS support is thus by itself of modest relevance for
determining compliance with the member’s limit or limits on AMS support: compliance depends also on
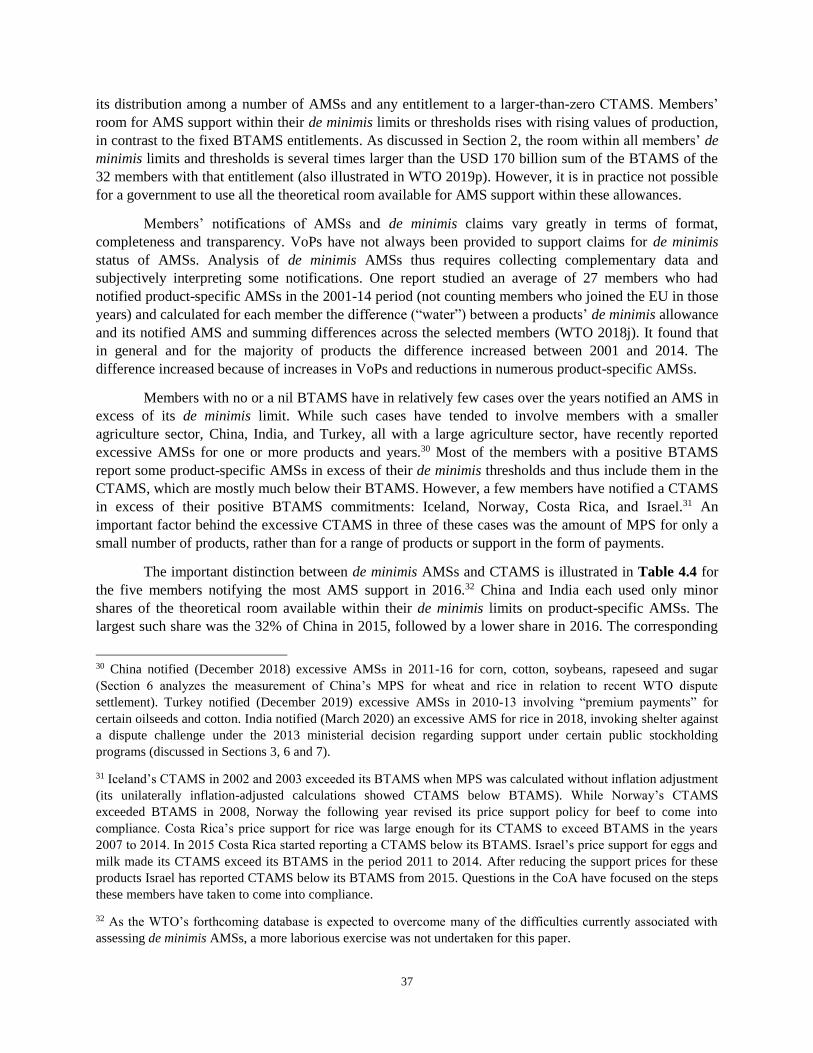
37
its distribution among a number of AMSs and any entitlement to a larger-than-zero CTAMS. Members’
room for AMS support within their de minimis limits or thresholds rises with rising values of production,
in contrast to the fixed BTAMS entitlements. As discussed in Section 2, the room within all members’ de
minimis limits and thresholds is several times larger than the USD 170 billion sum of the BTAMS of the
32 members with that entitlement (also illustrated in WTO 2019p). However, it is in practice not possible
for a government to use all the theoretical room available for AMS support within these allowances.
Members’ notifications of AMSs and de minimis claims vary greatly in terms of format,
completeness and transparency. VoPs have not always been provided to support claims for de minimis
status of AMSs. Analysis of de minimis AMSs thus requires collecting complementary data and
subjectively interpreting some notifications. One report studied an average of 27 members who had
notified product-specific AMSs in the 2001-14 period (not counting members who joined the EU in those
years) and calculated for each member the difference (“water”) between a products’ de minimis allowance
and its notified AMS and summing differences across the selected members (WTO 2018j). It found that
in general and for the majority of products the difference increased between 2001 and 2014. The
difference increased because of increases in VoPs and reductions in numerous product-specific AMSs.
Members with no or a nil BTAMS have in relatively few cases over the years notified an AMS in
excess of its de minimis limit. While such cases have tended to involve members with a smaller
agriculture sector, China, India, and Turkey, all with a large agriculture sector, have recently reported
excessive AMSs for one or more products and years.30 Most of the members with a positive BTAMS
report some product-specific AMSs in excess of their de minimis thresholds and thus include them in the
CTAMS, which are mostly much below their BTAMS. However, a few members have notified a CTAMS
in excess of their positive BTAMS commitments: Iceland, Norway, Costa Rica, and Israel.31 An
important factor behind the excessive CTAMS in three of these cases was the amount of MPS for only a
small number of products, rather than for a range of products or support in the form of payments.
The important distinction between de minimis AMSs and CTAMS is illustrated in Table 4.4 for
the five members notifying the most AMS support in 2016.32 China and India each used only minor
shares of the theoretical room available within their de minimis limits on product-specific AMSs. The
largest such share was the 32% of China in 2015, followed by a lower share in 2016. The corresponding
30 China notified (December 2018) excessive AMSs in 2011-16 for corn, cotton, soybeans, rapeseed and sugar
(Section 6 analyzes the measurement of China’s MPS for wheat and rice in relation to recent WTO dispute
settlement). Turkey notified (December 2019) excessive AMSs in 2010-13 involving “premium payments” for
certain oilseeds and cotton. India notified (March 2020) an excessive AMS for rice in 2018, invoking shelter against
a dispute challenge under the 2013 ministerial decision regarding support under certain public stockholding
programs (discussed in Sections 3, 6 and 7).
31 Iceland’s CTAMS in 2002 and 2003 exceeded its BTAMS when MPS was calculated without inflation adjustment
(its unilaterally inflation-adjusted calculations showed CTAMS below BTAMS). While Norway’s CTAMS
exceeded BTAMS in 2008, Norway the following year revised its price support policy for beef to come into
compliance. Costa Rica’s price support for rice was large enough for its CTAMS to exceed BTAMS in the years
2007 to 2014. In 2015 Costa Rica started reporting a CTAMS below its BTAMS. Israel’s price support for eggs and
milk made its CTAMS exceed its BTAMS in the period 2011 to 2014. After reducing the support prices for these
products Israel has reported CTAMS below its BTAMS from 2015. Questions in the CoA have focused on the steps
these members have taken to come into compliance.
32 As the WTO’s forthcoming database is expected to overcome many of the difficulties currently associated with
assessing de minimis AMSs, a more laborious exercise was not undertaken for this paper.
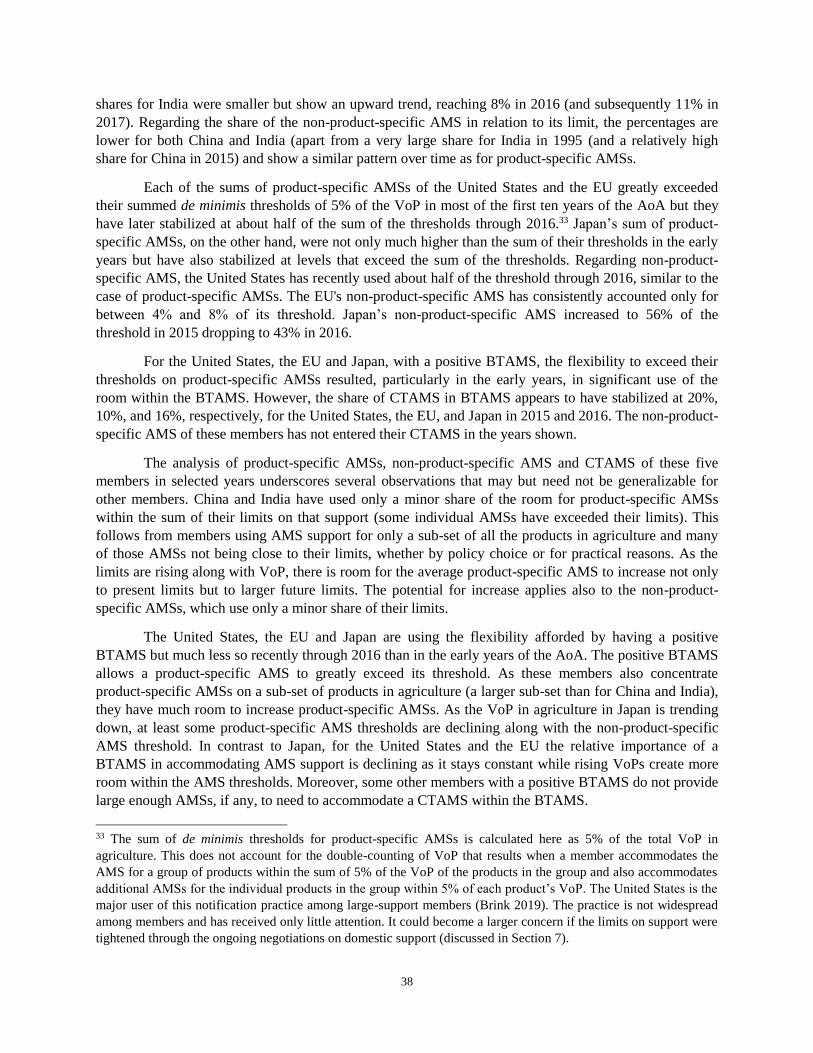
38
shares for India were smaller but show an upward trend, reaching 8% in 2016 (and subsequently 11% in
2017). Regarding the share of the non-product-specific AMS in relation to its limit, the percentages are
lower for both China and India (apart from a very large share for India in 1995 (and a relatively high
share for China in 2015) and show a similar pattern over time as for product-specific AMSs.
Each of the sums of product-specific AMSs of the United States and the EU greatly exceeded
their summed de minimis thresholds of 5% of the VoP in most of the first ten years of the AoA but they
have later stabilized at about half of the sum of the thresholds through 2016.33 Japan’s sum of product-
specific AMSs, on the other hand, were not only much higher than the sum of their thresholds in the early
years but have also stabilized at levels that exceed the sum of the thresholds. Regarding non-product-
specific AMS, the United States has recently used about half of the threshold through 2016, similar to the
case of product-specific AMSs. The EU's non-product-specific AMS has consistently accounted only for
between 4% and 8% of its threshold. Japan’s non-product-specific AMS increased to 56% of the
threshold in 2015 dropping to 43% in 2016.
For the United States, the EU and Japan, with a positive BTAMS, the flexibility to exceed their
thresholds on product-specific AMSs resulted, particularly in the early years, in significant use of the
room within the BTAMS. However, the share of CTAMS in BTAMS appears to have stabilized at 20%,
10%, and 16%, respectively, for the United States, the EU, and Japan in 2015 and 2016. The non-product-
specific AMS of these members has not entered their CTAMS in the years shown.
The analysis of product-specific AMSs, non-product-specific AMS and CTAMS of these five
members in selected years underscores several observations that may but need not be generalizable for
other members. China and India have used only a minor share of the room for product-specific AMSs
within the sum of their limits on that support (some individual AMSs have exceeded their limits). This
follows from members using AMS support for only a sub-set of all the products in agriculture and many
of those AMSs not being close to their limits, whether by policy choice or for practical reasons. As the
limits are rising along with VoP, there is room for the average product-specific AMS to increase not only
to present limits but to larger future limits. The potential for increase applies also to the non-product-
specific AMSs, which use only a minor share of their limits.
The United States, the EU and Japan are using the flexibility afforded by having a positive
BTAMS but much less so recently through 2016 than in the early years of the AoA. The positive BTAMS
allows a product-specific AMS to greatly exceed its threshold. As these members also concentrate
product-specific AMSs on a sub-set of products in agriculture (a larger sub-set than for China and India),
they have much room to increase product-specific AMSs. As the VoP in agriculture in Japan is trending
down, at least some product-specific AMS thresholds are declining along with the non-product-specific
AMS threshold. In contrast to Japan, for the United States and the EU the relative importance of a
BTAMS in accommodating AMS support is declining as it stays constant while rising VoPs create more
room within the AMS thresholds. Moreover, some other members with a positive BTAMS do not provide
large enough AMSs, if any, to need to accommodate a CTAMS within the BTAMS.
33 The sum of de minimis thresholds for product-specific AMSs is calculated here as 5% of the total VoP in
agriculture. This does not account for the double-counting of VoP that results when a member accommodates the
AMS for a group of products within the sum of 5% of the VoP of the products in the group and also accommodates
additional AMSs for the individual products in the group within 5% of each product’s VoP. The United States is the
major user of this notification practice among large-support members (Brink 2019). The practice is not widespread
among members and has received only little attention. It could become a larger concern if the limits on support were
tightened through the ongoing negotiations on domestic support (discussed in Section 7).
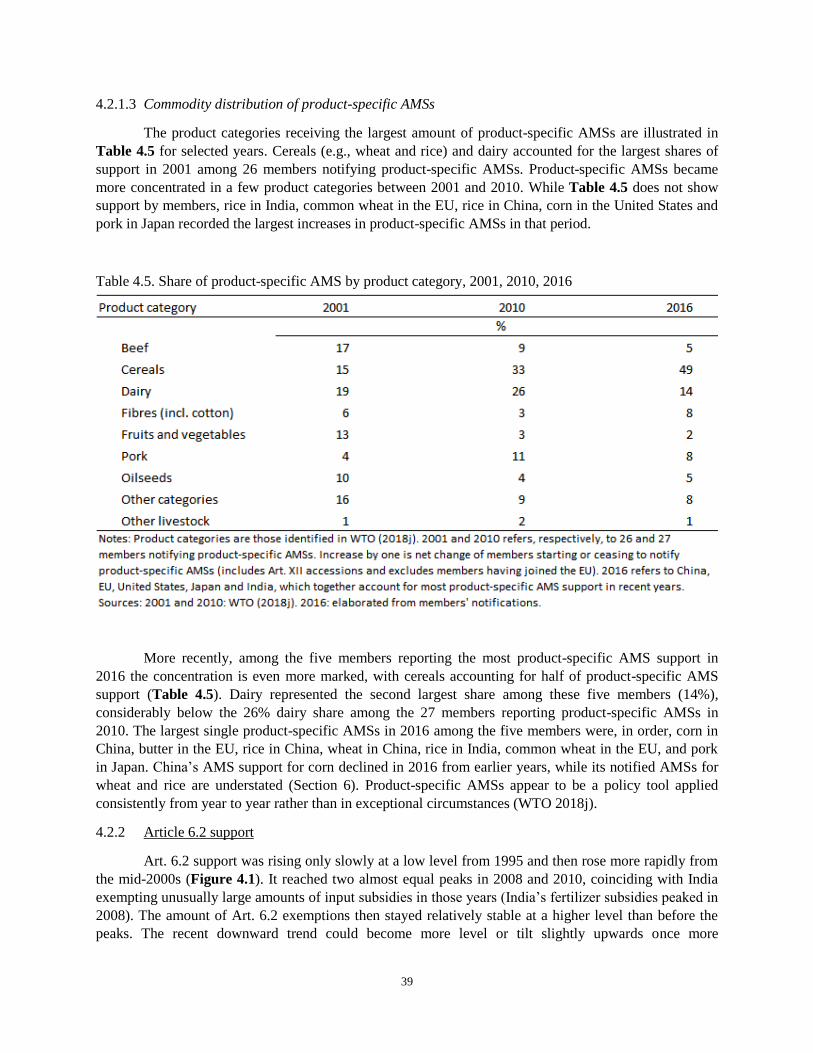
39
4.2.1.3 Commodity distribution of product-specific AMSs
The product categories receiving the largest amount of product-specific AMSs are illustrated in
Table 4.5 for selected years. Cereals (e.g., wheat and rice) and dairy accounted for the largest shares of
support in 2001 among 26 members notifying product-specific AMSs. Product-specific AMSs became
more concentrated in a few product categories between 2001 and 2010. While Table 4.5 does not show
support by members, rice in India, common wheat in the EU, rice in China, corn in the United States and
pork in Japan recorded the largest increases in product-specific AMSs in that period.
Table 4.5. Share of product-specific AMS by product category, 2001, 2010, 2016
More recently, among the five members reporting the most product-specific AMS support in
2016 the concentration is even more marked, with cereals accounting for half of product-specific AMS
support (Table 4.5). Dairy represented the second largest share among these five members (14%),
considerably below the 26% dairy share among the 27 members reporting product-specific AMSs in
2010. The largest single product-specific AMSs in 2016 among the five members were, in order, corn in
China, butter in the EU, rice in China, wheat in China, rice in India, common wheat in the EU, and pork
in Japan. China’s AMS support for corn declined in 2016 from earlier years, while its notified AMSs for
wheat and rice are understated (Section 6). Product-specific AMSs appear to be a policy tool applied
consistently from year to year rather than in exceptional circumstances (WTO 2018j).
4.2.2 Article 6.2 support
Art. 6.2 support was rising only slowly at a low level from 1995 and then rose more rapidly from
the mid-2000s (Figure 4.1). It reached two almost equal peaks in 2008 and 2010, coinciding with India
exempting unusually large amounts of input subsidies in those years (India’s fertilizer subsidies peaked in
2008). The amount of Art. 6.2 exemptions then stayed relatively stable at a higher level than before the
peaks. The recent downward trend could become more level or tilt slightly upwards once more
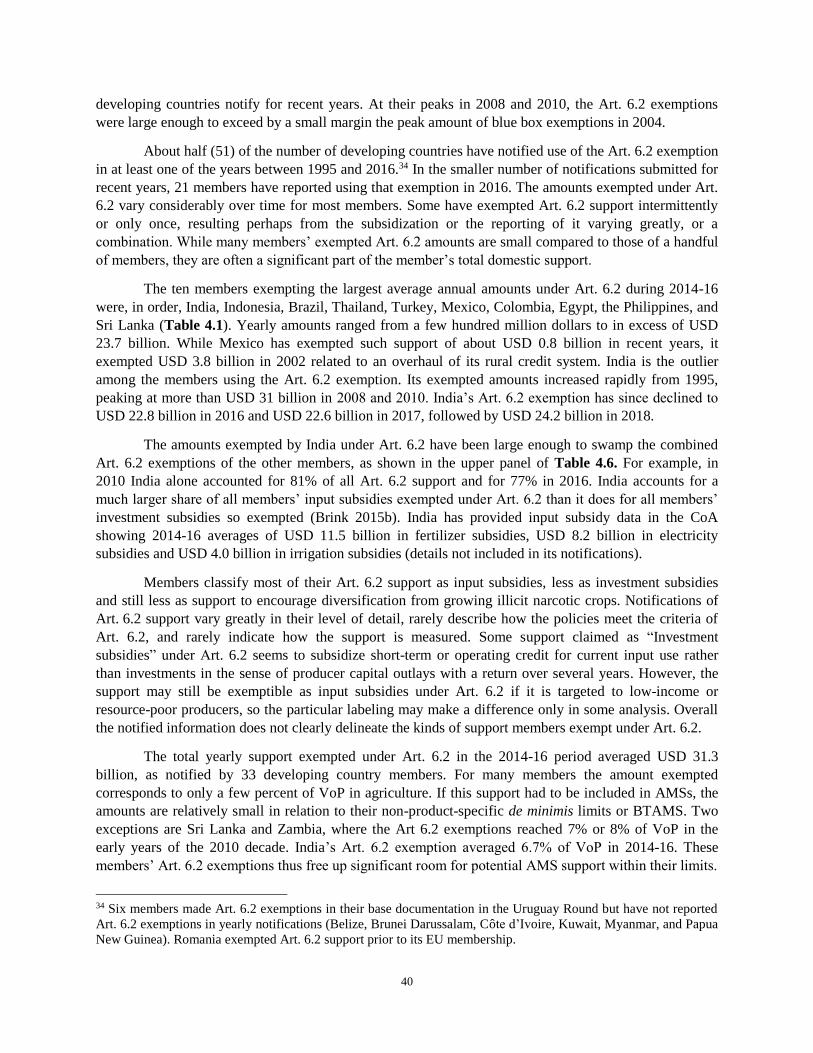
40
developing countries notify for recent years. At their peaks in 2008 and 2010, the Art. 6.2 exemptions
were large enough to exceed by a small margin the peak amount of blue box exemptions in 2004.
About half (51) of the number of developing countries have notified use of the Art. 6.2 exemption
in at least one of the years between 1995 and 2016.34 In the smaller number of notifications submitted for
recent years, 21 members have reported using that exemption in 2016. The amounts exempted under Art.
6.2 vary considerably over time for most members. Some have exempted Art. 6.2 support intermittently
or only once, resulting perhaps from the subsidization or the reporting of it varying greatly, or a
combination. While many members’ exempted Art. 6.2 amounts are small compared to those of a handful
of members, they are often a significant part of the member’s total domestic support.
The ten members exempting the largest average annual amounts under Art. 6.2 during 2014-16
were, in order, India, Indonesia, Brazil, Thailand, Turkey, Mexico, Colombia, Egypt, the Philippines, and
Sri Lanka (Table 4.1). Yearly amounts ranged from a few hundred million dollars to in excess of USD
23.7 billion. While Mexico has exempted such support of about USD 0.8 billion in recent years, it
exempted USD 3.8 billion in 2002 related to an overhaul of its rural credit system. India is the outlier
among the members using the Art. 6.2 exemption. Its exempted amounts increased rapidly from 1995,
peaking at more than USD 31 billion in 2008 and 2010. India’s Art. 6.2 exemption has since declined to
USD 22.8 billion in 2016 and USD 22.6 billion in 2017, followed by USD 24.2 billion in 2018.
The amounts exempted by India under Art. 6.2 have been large enough to swamp the combined
Art. 6.2 exemptions of the other members, as shown in the upper panel of Table 4.6. For example, in
2010 India alone accounted for 81% of all Art. 6.2 support and for 77% in 2016. India accounts for a
much larger share of all members’ input subsidies exempted under Art. 6.2 than it does for all members’
investment subsidies so exempted (Brink 2015b). India has provided input subsidy data in the CoA
showing 2014-16 averages of USD 11.5 billion in fertilizer subsidies, USD 8.2 billion in electricity
subsidies and USD 4.0 billion in irrigation subsidies (details not included in its notifications).
Members classify most of their Art. 6.2 support as input subsidies, less as investment subsidies
and still less as support to encourage diversification from growing illicit narcotic crops. Notifications of
Art. 6.2 support vary greatly in their level of detail, rarely describe how the policies meet the criteria of
Art. 6.2, and rarely indicate how the support is measured. Some support claimed as “Investment
subsidies” under Art. 6.2 seems to subsidize short-term or operating credit for current input use rather
than investments in the sense of producer capital outlays with a return over several years. However, the
support may still be exemptible as input subsidies under Art. 6.2 if it is targeted to low-income or
resource-poor producers, so the particular labeling may make a difference only in some analysis. Overall
the notified information does not clearly delineate the kinds of support members exempt under Art. 6.2.
The total yearly support exempted under Art. 6.2 in the 2014-16 period averaged USD 31.3
billion, as notified by 33 developing country members. For many members the amount exempted
corresponds to only a few percent of VoP in agriculture. If this support had to be included in AMSs, the
amounts are relatively small in relation to their non-product-specific de minimis limits or BTAMS. Two
exceptions are Sri Lanka and Zambia, where the Art 6.2 exemptions reached 7% or 8% of VoP in the
early years of the 2010 decade. India’s Art. 6.2 exemption averaged 6.7% of VoP in 2014-16. These
members’ Art. 6.2 exemptions thus free up significant room for potential AMS support within their limits.
34 Six members made Art. 6.2 exemptions in their base documentation in the Uruguay Round but have not reported
Art. 6.2 exemptions in yearly notifications (Belize, Brunei Darussalam, Côte d’Ivoire, Kuwait, Myanmar, and Papua
New Guinea). Romania exempted Art. 6.2 support prior to its EU membership.
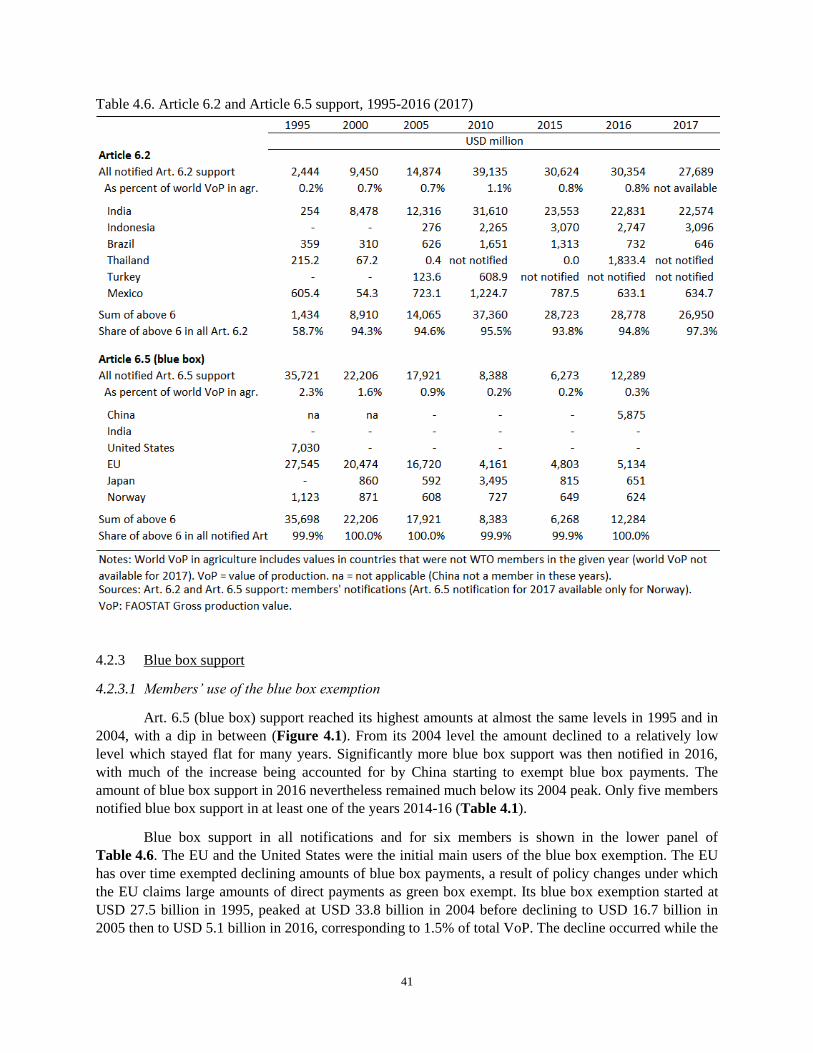
41
Table 4.6. Article 6.2 and Article 6.5 support, 1995-2016 (2017)
4.2.3 Blue box support
4.2.3.1 Members’ use of the blue box exemption
Art. 6.5 (blue box) support reached its highest amounts at almost the same levels in 1995 and in
2004, with a dip in between (Figure 4.1). From its 2004 level the amount declined to a relatively low
level which stayed flat for many years. Significantly more blue box support was then notified in 2016,
with much of the increase being accounted for by China starting to exempt blue box payments. The
amount of blue box support in 2016 nevertheless remained much below its 2004 peak. Only five members
notified blue box support in at least one of the years 2014-16 (Table 4.1).
Blue box support in all notifications and for six members is shown in the lower panel of
Table 4.6. The EU and the United States were the initial main users of the blue box exemption. The EU
has over time exempted declining amounts of blue box payments, a result of policy changes under which
the EU claims large amounts of direct payments as green box exempt. Its blue box exemption started at
USD 27.5 billion in 1995, peaked at USD 33.8 billion in 2004 before declining to USD 16.7 billion in
2005 then to USD 5.1 billion in 2016, corresponding to 1.5% of total VoP. The decline occurred while the
42
number of EU member states increased through EU enlargement. The United States exempted blue box
payments only in 1995, in the amount of USD 7.0 billion, having ended its deficiency payments in 1996.
Only a small number of other members have taken advantage of the blue box exemption. Croatia,
Czech Republic, Estonia, Slovak Republic and Slovenia reported blue box exemptions prior to becoming
members of the EU. Iceland has exempted only modest amounts. Norway has exempted blue box
payments since 1995, declining to an average of USD 0.6 billion in 2015-17 (corresponding to 17% of
VoP in agriculture). When Japan changed its price support policy for rice in 1998 it began making
payments that it exempted from CTAMS as blue box, amounting to USD 0.7 billion in 2016. The
program was ended after making payments for 2017 rice (according to Japan’s answer to a question in the
CoA in 2017). In 2016 China’s policy changes led it to designate USD 5.9 billion (0.4% of VoP in
agriculture) in blue box payments to corn producers (9.0% of corn VoP).
The blue box exemption is thus currently of importance to Norway and China but much less so to
the EU, Iceland and Japan. The EU has much room within its BTAMS, which reduces the need to exempt
payments from its AMSs. When blue box payments are product-specific, being able to exempt them can
be significant for a member facing potentially binding limits on product-specific AMSs as China does. In
view of the known elimination (Japan) and introduction (China) of exempted blue box payments in recent
years, blue box exemptions might be claimed in 2019 only by China, the EU, Iceland, and Norway.
4.2.3.2 Potential for US use of blue box exemption in 2019
One uncertainty relating to blue box exemptions is the possibility of a US return to claiming
substantial payments as blue box exempt. In 2018 and 2019 the United States operated two differently
designed new payment programs. They were designed to compensate producers for export revenue
declines resulting from retaliation by other countries in response to tariffs imposed unilaterally by the
United States starting in 2017 (Orden 2020). These programs were titled, respectively, the 2018 and the
2019 Market Facilitation Program (MFP) (Table 4.7).
Under the MFP support to US farmers jumped by USD 9.5 billion in 2018, primarily in payments
to soybean producers. These added payments quadruple, to about USD 13 billion, the US product-specific
AMS support included in CTAMS compared to 2017, but CTAMS would remain below the US BTAMS
of USD 19.1 billion (Glauber 2019; Schnepf 2019). For 2019, the payments of USD 14.5 billion are more
widely distributed with the bulk of the payments going to major (non-specialty) crops based on past
planted acres not current production. If the United States includes the 2019 payments along with other
payments in product-specific AMSs, the CTAMS would likely exceed the BTAMS: an estimate in late
2019 put the CTAMS in this case at USD 20.2 billion (Glauber 2019).
If the United States includes the 2019 payments along with other payments in the non-product-
specific AMS, the sum of the product-specific AMSs that enter the CTAMS remains below BTAMS. This
is because not including MFP payments in product-specific AMSs not only leaves them smaller (e.g.,
cotton and wheat) but also means fewer of them (e.g., corn and soybeans) exceed their 5% thresholds.
However, the non-product-specific AMS would come close in this case to its de minimis threshold of 5%
of agricultural VoP in 2019. Glauber and Schnepf in late 2019 estimated non-product specific AMS at
USD 18.3 billion and USD 18.9 billion, respectively, just below 5% of their estimates of VoP. Depending
on the final 2019 VoP and size of other payments in the non-product-specific AMS, it could exceed the
threshold. If so, the 2019 CTAMS including non-de minimis product-specific AMSs and the non-product-
specific AMS would exceed BTAMS.

43
Table 4.7. Schematic of three new US payment programs in 2018, 2019 and 2020
If the 2019 MFP payments are part of the non-product-specific AMS, a 2019 CTAMS exceeding
BTAMS seemed more likely in spring 2020 than was estimated in late 2019. This follows from the sharp
price declines in March-April 2020, and projected subsequent lower prices, resulting from the global
Covid-19 pandemic and related economic downturn. Lower prices in 2020 imply higher non-product-
specific payments for 2019 crops under the US Price Loss Coverage (PLC) and Agriculture Risk
Coverage (ARC) programs than projected in fall 2019. This might add USD 1-3 billion to the 2019 non-
product-specific AMS. A lower VoP would reduce the de minimis threshold. Both effects make it more
likely that the non-product-specific AMS would exceed its 5% threshold and make CTAMS exceed
BTAMS if 2019 MFP payments are categorized as non-product-specific AMS support.
Additional payments of USD 16 billion to crops and livestock producers under the new
Coronavirus Food Assistance Program (CFAP) were announced in April 2020 in pandemic circumstances
(Table 4.7). These payments are reportedly targeted to specific products (regulations for distribution of
the payments were not available at time of this writing). The United States notifies support to the CoA on
a marketing year basis, which for livestock products and many specialty crops corresponds to the calendar
year. Most of the CFAP payments can thus be anticipated to be included in the 2020 notification. This
will increase CTAMS for 2020 although not necessarily pushing it above BTAMS. For crops for which
the 2019 marketing year extends into calendar year 2020 (e.g., corn, cotton, soybeans, wheat), the CFAP
payments may be notified as support in 2019 (if applied to the crops harvested in 2019) or as support in
44
2020 (if applied to the crops planted in spring 2020).35 Overall, due to MFP and CFAP payments, US
AMS support increases sharply compared to recent years through 2017.
The above considerations could motivate the United States to claim that the 2019 MFP payments,
possibly some of the 2020 CFAP payments, or other new future payments are exempt from CTAMS as
blue box payments.36 In order to exempt them on blue box grounds the United States would need to
ensure the payments meet the Art. 6.5 criteria regarding area and yields or base level of production or
head of livestock and that the program is “production-limiting” in the sense of Art. 6.5. The interpretation
of production-limiting, in particular, has not been tested in dispute proceedings and remains unclear. A
US argument that the 2019 MFP is production-limiting, in contrast to the 2018 program, might be based
on its stipulation that “A producer’s total payment-eligible plantings cannot exceed total 2018 plantings”
(USDA 2019). One issue could be whether this sentence means a producer can only receive payments on
acreage up to total 2018 plantings even if additional acres are planted to the covered crops, or whether the
sentence means that a producer who plants acreage in excess of the 2018 total is ineligible for any 2019
MFP payments. The former interpretation would seem to limit payments but not production. The latter
less plausible interpretation would arbitrarily exclude producers who before the first MFP payment
announcement on 23 May 2019 had already planted more than they did in 2018.
However these decisions are finalized, the increased US support deviates from recent years
through 2017 and leaves it poorly positioned to endorse tighter multilateral commitments on domestic
support as discussed in the continuing negotiations. While that is a uniquely US situation in terms of the
MFP payments, the Covid-19 pandemic is likely to lead to expanded farm support worldwide in the
immediate term and for some time into the future.
4.3 Green box support
Almost all members who have notified domestic support to the CoA have reported some green
box support, at least in the form of expenditure on General services (para. 2, Annex 2). Figure 4.3 shows
all green box support and the part delivered as direct payments (paras. 5-13, Annex 2). Members
exempted a total of USD 447.8 billion as green box support in 2016, including USD 167.6 billion in
direct payments, even with numerous notifications still outstanding. Green box support started at USD
129.3 billion in 1995, very close to Art. 6 support at that time. It then increased from about 2001 through
increased direct payments and even more through other expenditures. All years through 2016 saw an
increase, despite the declining number of notifications. The continued increases made green box support
in 2015 and 2016 more than three times larger than Art. 6 support in those years, shown for comparison in
Figure 4.3. Green box support rose from 8.2% of world VoP in 1995 to 12.0% in 2016 (Table 4.8).
This evolution resulted from several factors. China’s green box support rose fast from the already
relatively large USD 30.5 billion it reported for 2002 as its first full year as a member. This was a 27%
increase over the USD 111.3 billion notified for 2001 by all other members. China subsequently increased
its green box support by USD 167.2 billion from 2002 to 2016, making it the largest single contributor to
the total green box increase. Other members increased green box support more than Art. 6 support or they
made policy changes that substituted green box support for earlier non-green-box support. 35 Categorizing CFAP crop payments as 2019 marketing year product-specific AMS support would add to CTAMS,
already estimated by Glauber (2019) to exceed BTAMS if 2019 MFP payments are notified as product-specific.
36 The discussion here is analytically speculative. The CoA requires “new or modified” programs claimed to be
exempt from AMS calculation, such as blue box payments, to be notified within 30 days of adoption (WTO 1995).
The 2018 and 2019 MFP are new programs. To date, the United States has claimed neither as exempt.
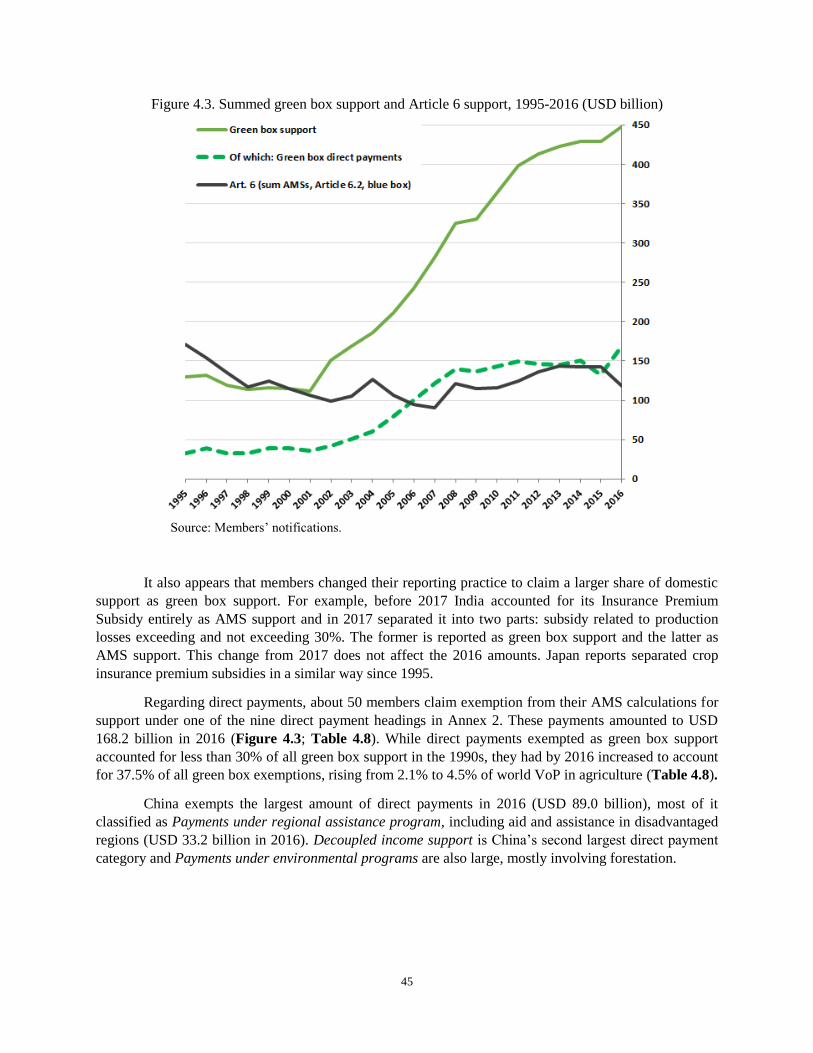
45
Figure 4.3. Summed green box support and Article 6 support, 1995-2016 (USD billion)
Source: Members’ notifications.
It also appears that members changed their reporting practice to claim a larger share of domestic
support as green box support. For example, before 2017 India accounted for its Insurance Premium
Subsidy entirely as AMS support and in 2017 separated it into two parts: subsidy related to production
losses exceeding and not exceeding 30%. The former is reported as green box support and the latter as
AMS support. This change from 2017 does not affect the 2016 amounts. Japan reports separated crop
insurance premium subsidies in a similar way since 1995.
Regarding direct payments, about 50 members claim exemption from their AMS calculations for
support under one of the nine direct payment headings in Annex 2. These payments amounted to USD
168.2 billion in 2016 (Figure 4.3; Table 4.8). While direct payments exempted as green box support
accounted for less than 30% of all green box support in the 1990s, they had by 2016 increased to account
for 37.5% of all green box exemptions, rising from 2.1% to 4.5% of world VoP in agriculture (Table 4.8).
China exempts the largest amount of direct payments in 2016 (USD 89.0 billion), most of it
classified as Payments under regional assistance program, including aid and assistance in disadvantaged
regions (USD 33.2 billion in 2016). Decoupled income support is China’s second largest direct payment
category and Payments under environmental programs are also large, mostly involving forestation.
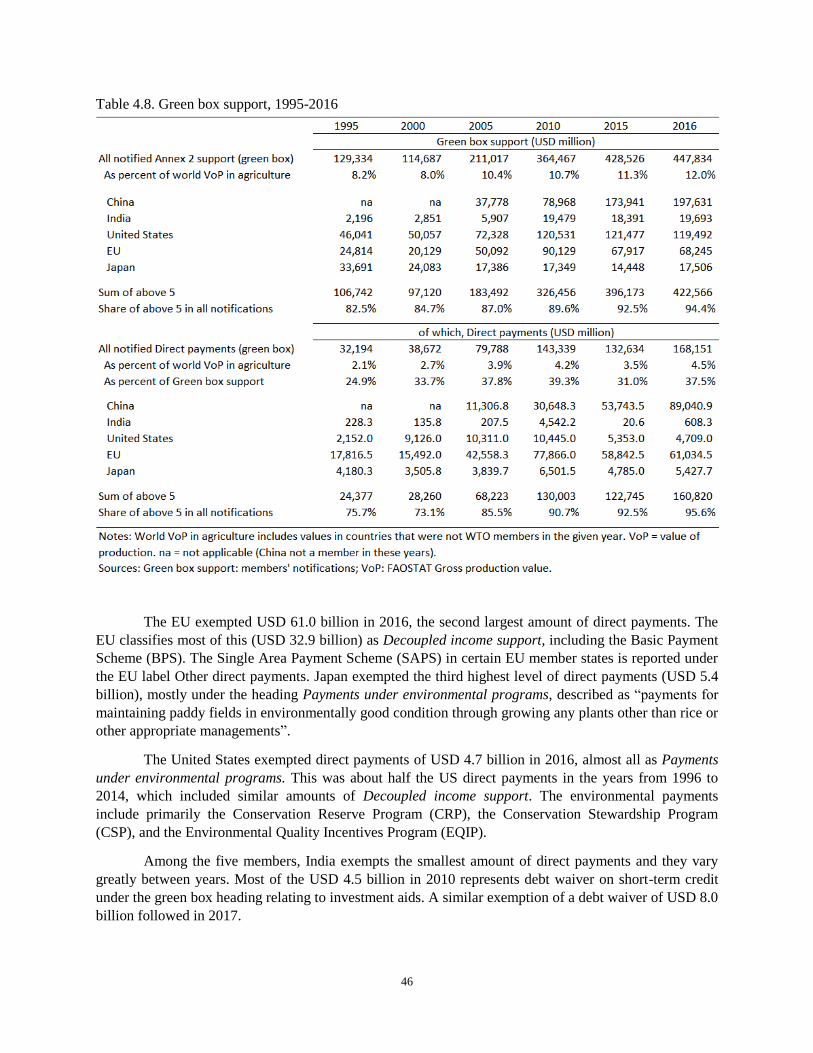
46
Table 4.8. Green box support, 1995-2016
The EU exempted USD 61.0 billion in 2016, the second largest amount of direct payments. The
EU classifies most of this (USD 32.9 billion) as Decoupled income support, including the Basic Payment
Scheme (BPS). The Single Area Payment Scheme (SAPS) in certain EU member states is reported under
the EU label Other direct payments. Japan exempted the third highest level of direct payments (USD 5.4
billion), mostly under the heading Payments under environmental programs, described as “payments for
maintaining paddy fields in environmentally good condition through growing any plants other than rice or
other appropriate managements”.
The United States exempted direct payments of USD 4.7 billion in 2016, almost all as Payments
under environmental programs. This was about half the US direct payments in the years from 1996 to
2014, which included similar amounts of Decoupled income support. The environmental payments
include primarily the Conservation Reserve Program (CRP), the Conservation Stewardship Program
(CSP), and the Environmental Quality Incentives Program (EQIP).
Among the five members, India exempts the smallest amount of direct payments and they vary
greatly between years. Most of the USD 4.5 billion in 2010 represents debt waiver on short-term credit
under the green box heading relating to investment aids. A similar exemption of a debt waiver of USD 8.0
billion followed in 2017.
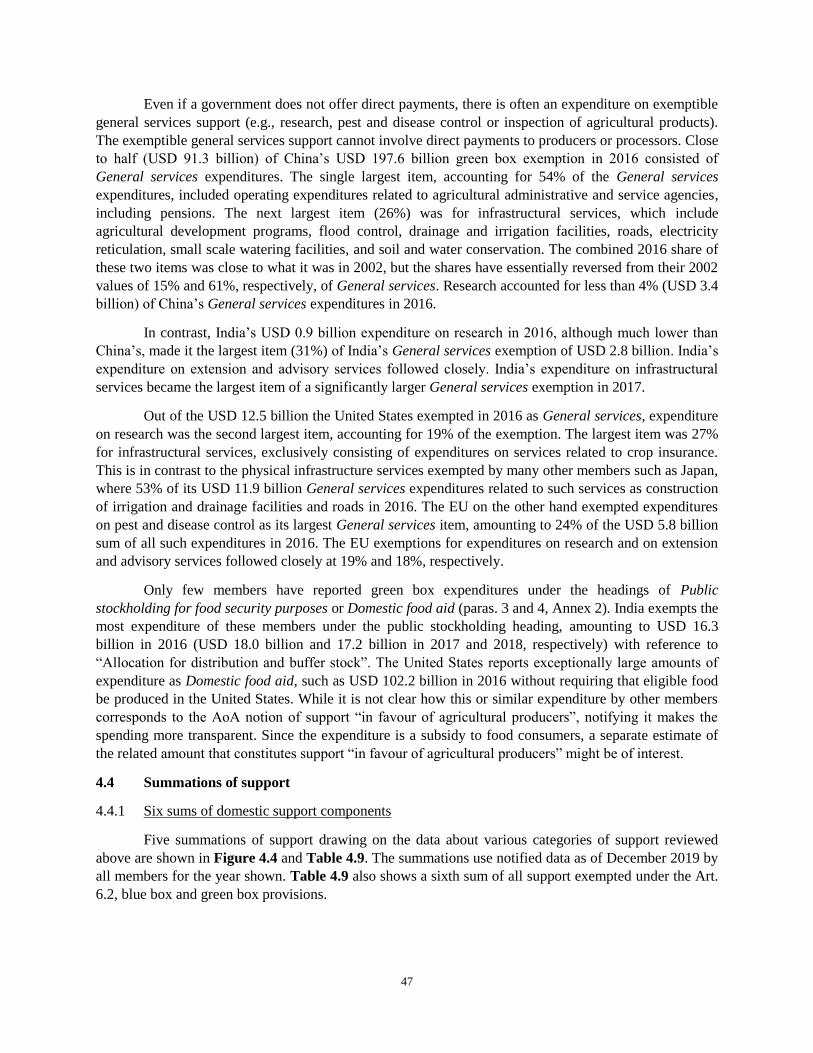
47
Even if a government does not offer direct payments, there is often an expenditure on exemptible
general services support (e.g., research, pest and disease control or inspection of agricultural products).
The exemptible general services support cannot involve direct payments to producers or processors. Close
to half (USD 91.3 billion) of China’s USD 197.6 billion green box exemption in 2016 consisted of
General services expenditures. The single largest item, accounting for 54% of the General services
expenditures, included operating expenditures related to agricultural administrative and service agencies,
including pensions. The next largest item (26%) was for infrastructural services, which include
agricultural development programs, flood control, drainage and irrigation facilities, roads, electricity
reticulation, small scale watering facilities, and soil and water conservation. The combined 2016 share of
these two items was close to what it was in 2002, but the shares have essentially reversed from their 2002
values of 15% and 61%, respectively, of General services. Research accounted for less than 4% (USD 3.4
billion) of China’s General services expenditures in 2016.
In contrast, India’s USD 0.9 billion expenditure on research in 2016, although much lower than
China’s, made it the largest item (31%) of India’s General services exemption of USD 2.8 billion. India’s
expenditure on extension and advisory services followed closely. India’s expenditure on infrastructural
services became the largest item of a significantly larger General services exemption in 2017.
Out of the USD 12.5 billion the United States exempted in 2016 as General services, expenditure
on research was the second largest item, accounting for 19% of the exemption. The largest item was 27%
for infrastructural services, exclusively consisting of expenditures on services related to crop insurance.
This is in contrast to the physical infrastructure services exempted by many other members such as Japan,
where 53% of its USD 11.9 billion General services expenditures related to such services as construction
of irrigation and drainage facilities and roads in 2016. The EU on the other hand exempted expenditures
on pest and disease control as its largest General services item, amounting to 24% of the USD 5.8 billion
sum of all such expenditures in 2016. The EU exemptions for expenditures on research and on extension
and advisory services followed closely at 19% and 18%, respectively.
Only few members have reported green box expenditures under the headings of Public
stockholding for food security purposes or Domestic food aid (paras. 3 and 4, Annex 2). India exempts the
most expenditure of these members under the public stockholding heading, amounting to USD 16.3
billion in 2016 (USD 18.0 billion and 17.2 billion in 2017 and 2018, respectively) with reference to
“Allocation for distribution and buffer stock”. The United States reports exceptionally large amounts of
expenditure as Domestic food aid, such as USD 102.2 billion in 2016 without requiring that eligible food
be produced in the United States. While it is not clear how this or similar expenditure by other members
corresponds to the AoA notion of support “in favour of agricultural producers”, notifying it makes the
spending more transparent. Since the expenditure is a subsidy to food consumers, a separate estimate of
the related amount that constitutes support “in favour of agricultural producers” might be of interest.
4.4 Summations of support
4.4.1 Six sums of domestic support components
Five summations of support drawing on the data about various categories of support reviewed
above are shown in Figure 4.4 and Table 4.9. The summations use notified data as of December 2019 by
all members for the year shown. Table 4.9 also shows a sixth sum of all support exempted under the Art.
6.2, blue box and green box provisions.
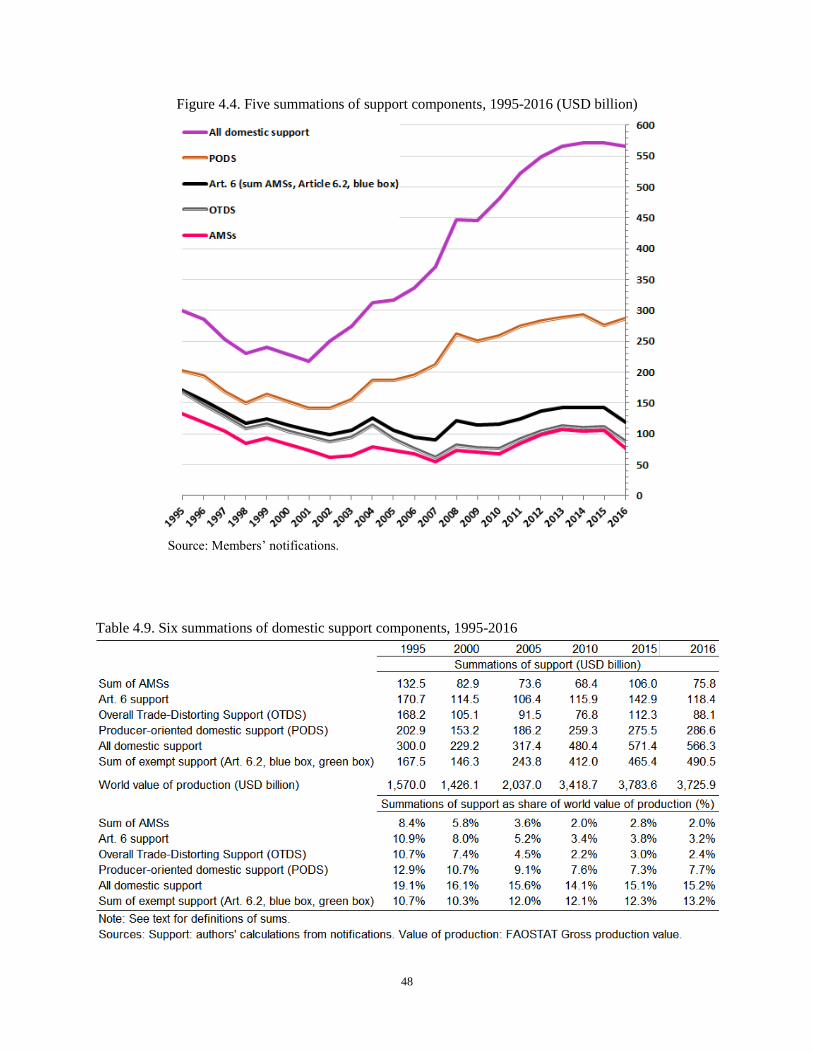
48
Figure 4.4. Five summations of support components, 1995-2016 (USD billion)
Source: Members’ notifications.
Table 4.9. Six summations of domestic support components, 1995-2016
49
Two of the five summations have been displayed in Figure 4.1 and discussed above. The first of
these summations in Figure 4.4 is AMS support: the measurement that is subject to limits under the AoA
that apply differently to different members. The second summation also shown previously is Art. 6
support: all support that is not exemptible on grounds of meeting the green box criteria.
The third summation in Figure 4.4 and Table 4.9, falling between AMS support and Art. 6
support, adds blue box support to the AMS support. In the Doha Round negotiators often denoted this
sum as the Overall Trade-Distorting Support (OTDS) in spite of not including Art 6.2 support. Capping
and reducing the OTDS of many members were proposed but were not agreed upon. Because members’
blue box exemptions have declined, the difference between AMS support and the OTDS narrows through
2015 and then increases with China’s exemption of blue box payments in 2016. Increasing Art. 6.2
exemptions cause OTDS to fall further below Art. 6 support over time, especially since 2005.
The fourth support summation is a still more-inclusive indicator of the support that goes most
directly to producers. The measurement of Producer-Oriented Domestic Support (PODS) is defined here
as the sum of Art. 6 support (AMS support, Art. 6.2 support and blue box support) and direct payments in
the green box (paras. 5-13, Annex 2). PODS thus comprises all types of producer-oriented support
without distinguishing between support with more and with less distorting effects. It is a more inclusive
measurement than the OTDS by including all Art. 6 support. PODS also includes green box direct
payments on the rationale that, even though the green box allows the exemption of some direct payments
to producers from commitment, such payments are nevertheless support “in favour of agricultural
producers” (Art. 6.1). In contrast, green box expenditures on General Services, Public stockholding for
food security purposes and Domestic food aid is often not conceptually associated with producer support
or “farm subsidies” in a direct way.37
Through 2000, PODS exceeds Art. 6 support by a stable amount of less than USD 40 billion.
Subsequently, the increasing direct payments in the green box made PODS rise correspondingly rapidly,
creating a large gap between PODS and Art. 6 support. Direct payments in the green box are the largest
component of PODS since 2010. In the last few years the yearly amount of PODS has reached levels
above USD 275 billion.
The fifth summation is the sum of all Art. 6 and green box domestic support notified by
members—thus all non-exempted and exempted support. This total summation gives the broadest
perspective on the evolution of support. It exceeds AMS support by the sum of all exempted support
(Art. 6.2, blue box and green box support). The total summation exceeds PODS by the notified amounts
of green box expenditures on General services, Public stockholding for food security purposes and
Domestic food aid.
The sum of all domestic support rose from USD 300.0 billion in 1995 to USD 566.3 billion in
2016. While AMS support subject to limit has shown some variation and decline over time, the variation
and trend are minor compared to the nearly doubling of total notified support. Total support has also
37 The OECD measurements of policy support, albeit calculated with different methods than in the AoA, illustrate
one of several possible concepts of producer orientation (OECD 2016). The OECD’s PSE includes most direct
payments, while expenditures on many of the kinds of general services identified in paragraph 2 of Annex 2, as well
as the cost of public stockholding, are included in the OECD’s General Services Support Estimate (GSSE).
Domestic food aid of several kinds is accounted for in the OECD’s Consumer Support Estimate (CSE), including
several US nutrition assistance programs.
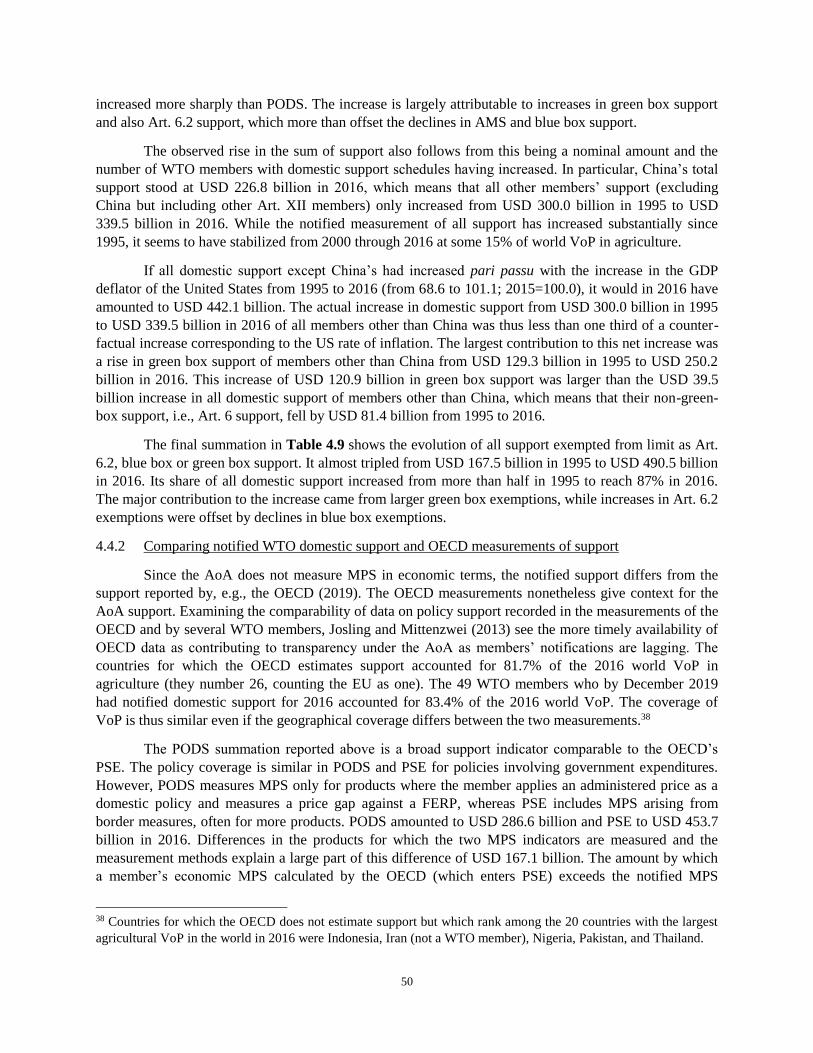
50
increased more sharply than PODS. The increase is largely attributable to increases in green box support
and also Art. 6.2 support, which more than offset the declines in AMS and blue box support.
The observed rise in the sum of support also follows from this being a nominal amount and the
number of WTO members with domestic support schedules having increased. In particular, China’s total
support stood at USD 226.8 billion in 2016, which means that all other members’ support (excluding
China but including other Art. XII members) only increased from USD 300.0 billion in 1995 to USD
339.5 billion in 2016. While the notified measurement of all support has increased substantially since
1995, it seems to have stabilized from 2000 through 2016 at some 15% of world VoP in agriculture.
If all domestic support except China’s had increased pari passu with the increase in the GDP
deflator of the United States from 1995 to 2016 (from 68.6 to 101.1; 2015=100.0), it would in 2016 have
amounted to USD 442.1 billion. The actual increase in domestic support from USD 300.0 billion in 1995
to USD 339.5 billion in 2016 of all members other than China was thus less than one third of a counter-
factual increase corresponding to the US rate of inflation. The largest contribution to this net increase was
a rise in green box support of members other than China from USD 129.3 billion in 1995 to USD 250.2
billion in 2016. This increase of USD 120.9 billion in green box support was larger than the USD 39.5
billion increase in all domestic support of members other than China, which means that their non-green-
box support, i.e., Art. 6 support, fell by USD 81.4 billion from 1995 to 2016.
The final summation in Table 4.9 shows the evolution of all support exempted from limit as Art.
6.2, blue box or green box support. It almost tripled from USD 167.5 billion in 1995 to USD 490.5 billion
in 2016. Its share of all domestic support increased from more than half in 1995 to reach 87% in 2016.
The major contribution to the increase came from larger green box exemptions, while increases in Art. 6.2
exemptions were offset by declines in blue box exemptions.
4.4.2 Comparing notified WTO domestic support and OECD measurements of support
Since the AoA does not measure MPS in economic terms, the notified support differs from the
support reported by, e.g., the OECD (2019). The OECD measurements nonetheless give context for the
AoA support. Examining the comparability of data on policy support recorded in the measurements of the
OECD and by several WTO members, Josling and Mittenzwei (2013) see the more timely availability of
OECD data as contributing to transparency under the AoA as members’ notifications are lagging. The
countries for which the OECD estimates support accounted for 81.7% of the 2016 world VoP in
agriculture (they number 26, counting the EU as one). The 49 WTO members who by December 2019
had notified domestic support for 2016 accounted for 83.4% of the 2016 world VoP. The coverage of
VoP is thus similar even if the geographical coverage differs between the two measurements.38
The PODS summation reported above is a broad support indicator comparable to the OECD’s
PSE. The policy coverage is similar in PODS and PSE for policies involving government expenditures.
However, PODS measures MPS only for products where the member applies an administered price as a
domestic policy and measures a price gap against a FERP, whereas PSE includes MPS arising from
border measures, often for more products. PODS amounted to USD 286.6 billion and PSE to USD 453.7
billion in 2016. Differences in the products for which the two MPS indicators are measured and the
measurement methods explain a large part of this difference of USD 167.1 billion. The amount by which
a member’s economic MPS calculated by the OECD (which enters PSE) exceeds the notified MPS
38 Countries for which the OECD does not estimate support but which rank among the 20 countries with the largest
agricultural VoP in the world in 2016 were Indonesia, Iran (not a WTO member), Nigeria, Pakistan, and Thailand.
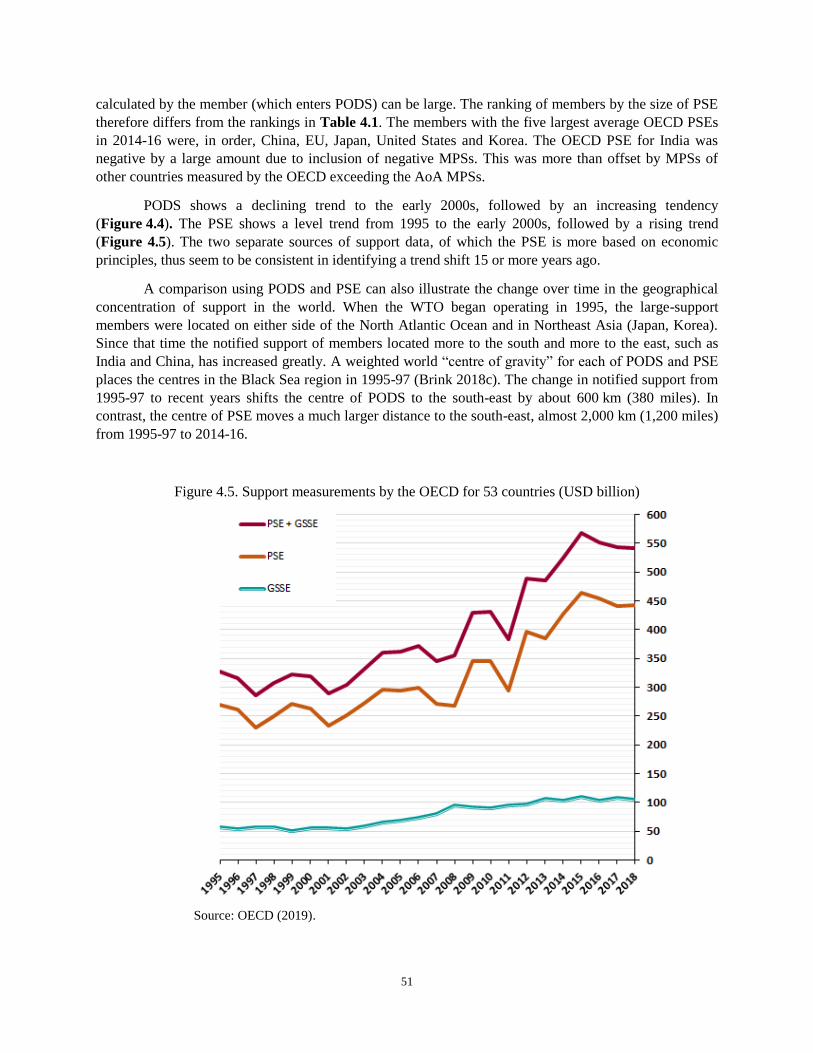
51
calculated by the member (which enters PODS) can be large. The ranking of members by the size of PSE
therefore differs from the rankings in Table 4.1. The members with the five largest average OECD PSEs
in 2014-16 were, in order, China, EU, Japan, United States and Korea. The OECD PSE for India was
negative by a large amount due to inclusion of negative MPSs. This was more than offset by MPSs of
other countries measured by the OECD exceeding the AoA MPSs.
PODS shows a declining trend to the early 2000s, followed by an increasing tendency
(Figure 4.4). The PSE shows a level trend from 1995 to the early 2000s, followed by a rising trend
(Figure 4.5). The two separate sources of support data, of which the PSE is more based on economic
principles, thus seem to be consistent in identifying a trend shift 15 or more years ago.
A comparison using PODS and PSE can also illustrate the change over time in the geographical
concentration of support in the world. When the WTO began operating in 1995, the large-support
members were located on either side of the North Atlantic Ocean and in Northeast Asia (Japan, Korea).
Since that time the notified support of members located more to the south and more to the east, such as
India and China, has increased greatly. A weighted world “centre of gravity” for each of PODS and PSE
places the centres in the Black Sea region in 1995-97 (Brink 2018c). The change in notified support from
1995-97 to recent years shifts the centre of PODS to the south-east by about 600 km (380 miles). In
contrast, the centre of PSE moves a much larger distance to the south-east, almost 2,000 km (1,200 miles)
from 1995-97 to 2014-16.
Figure 4.5. Support measurements by the OECD for 53 countries (USD billion)
Source: OECD (2019).
52
The sum of expenditures exempted under the AoA headings of General services, Public
stockholding for food security purposes and Domestic food aid (paras. 2, 3 and 4; Annex 2) can be
compared to the support in the OECD’s GSSE (General Services Support Estimate). The general services
policies covered by those measurements are largely the same. In 2016 the expenditures notified under
these three paragraphs reached USD 279.7 billion, while GSSE amounted to USD 102.6 billion. The large
difference is partly explained by the United States’ inclusion of USD 102.2 billion as Domestic food aid,
which is not part of GSSE. Another part of the explanation is the difference between India’s notified USD
16.2 billion as expenditure on Public stockholding for food security purposes and its USD 1.1 billion as
Cost of public stockholding in GSSE.
The notified expenditures under these three paragraphs of Annex 2 grew slowly from 1995 and
started to grow faster from about 2008. This growth is shown implicitly by the difference between green
box support and green box direct payments alone in Figure 4.3 and Table 4.8, or equivalently by the
difference between all domestic support and PODS in Figure 4.4 and Table 4.9. GSSE increased more
slowly (Figure 4.5), i.e., the increases have not been as large as for the notified expenditures under
paragraphs 2, 3 and 4 (which include the US Domestic food aid). The patterns of these expenditures and
GSSE are not directly contradictory but they underscore the differences in the policies and associated
support that are represented in the notified measurements and in the GSSE measurement.
4.5 Summary
As few as ten members account for more than 90% of recent notified Art. 6 support that cannot
be exempted on green box grounds. While in the early years of the WTO the EU, the United States and
Japan reported the largest amounts of Art. 6 support, in more recent years China and India have reported
the largest amounts. The responsibility of only a small number of members for so much of the Art. 6
support, and the shifting composition of that group, may have implications for the consideration of new or
updated rules and commitments on domestic support, as discussed in this paper’s conclusions (Section 9).
Notified AMS support followed a downward trend for many years and then turned upward. From
the mid-2000s more members are exempting Art. 6.2 support, which is not required to have no or at most
minimal distorting effects, and in increasing amounts. India’s share greatly exceeds the total share of
other developing country members that exempt such support. The significance of blue box support has
declined from the early years, and China has replaced Japan as one of the few members exempting blue
box support. Green box support, which many members report as the only form of support, has increased
continuously from 2001 and dominates the notified support in recent years. Direct payments in the green
box have also increased and continue to account for some 30% to 40% of all green box support.
The notified support as reviewed does not represent the support provided by all WTO members,
since many notifications are still outstanding. However, most members who have not met the notification
requirement for years through 2016 are members who provide no or little domestic support. The notified
support through 2016 is therefore expected to be close to what the total would be if all members had
notified. Little notification information is available at the end of 2019 for 2017 and 2018.
While all 135 members with a domestic support Schedule are entitled to certain levels of AMS
support, only some 30 members have notified AMS support on an ongoing basis in recent years. Product-
specific AMSs account for much more of this support than non-product-specific AMSs. Since the product
sectors enjoying the largest product-specific AMSs tend to be sectors with high values of production,
much AMS support is reported as remaining within the respective de minimis allowances. There is much
53
room for most members to introduce or increase AMS support up to their de minimis allowances or up to
their BTAMS limit. The de minimis allowances increase in nominal value as values of production
increase, but operating near them still requires astute management of yearly support.
Among the top five large-support members, China and India are more prone to leave unused
room within their limits on AMSs than are the EU, the United States and Japan with a positive BTAMS.
This may be related to the practical difficulty of managing support close to the limits and for many
products and it reflects the flexibility conferred by having a positive BTAMS. The large-support members
with a positive BTAMS use only in the range of 10% to 20% of their BTAMS in recent years through
2016. Some members with BTAMS do not use it to accommodate any AMS support at all.
Despite the ample room for increasing trade-distorting domestic support, whether subject to or
not subject to limit, stepping back and taking a broad view of the data through 2016 shows a remarkable
development. The objective of the AoA is to reduce trade-distorting support and protection and to enable
members to shift their support toward less distorting policy measures. The notification data reviewed
shows in broad terms a very substantial shift in this direction. While attention has focused on China’s
rising Art. 6 support, China makes an even larger contribution to the increasing green box support. The
AMS support of the United States, in contrast to the observed shift through 2016, increased sharply in
2018 and has the potential to exceed the US BTAMS in 2019. Other members may also increase support
associated with the Covid-19 pandemic. Whether the rules and commitments of the AoA will help guide
this increased support into least distorting channels remains to be seen.
54
5. DOMESTIC SUPPORT COMMITMENTS: REVIEWS AND CHALLENGES
This section describes the review in the Committee on Agriculture (CoA) of the implementation
of domestic support commitments and the information available to the CoA in the form of notifications. It
assesses the information generated in the review process of the CoA from 1995 through 2019. The section
then outlines the steps a member can take in the committee or through dispute settlement when it does not
agree with another member’s interpretation of the AoA or the notification requirements. The section ends
with a summary of the counter-notifications and formal disputes initiated at the WTO concerning
domestic support.
5.1 Committee on Agriculture’s review of implementation
5.1.1 Notifications to and questions in the Committee on Agriculture
A member’s commitment on Total AMS (BTAMS) in its Schedule is an integral part of the
GATT 1994 which along with the AoA are integral parts of the Marrakesh Agreement Establishing the
World Trade Organization (Art. 3.1; also Art. II, WTO 1994b). A member is thus legally bound to follow
the provisions of the AoA, which include keeping its CTAMS no larger than its BTAMS, whether this is
nil or positive (Art. 6.3) or, in the absence of a BTAMS, keeping any AMS within its de minimis limit
(Art. 7.2(b)). All members have an interest in seeing that other members follow the AoA in classifying
and measuring support and meeting their commitments. The AoA established the WTO CoA, mandating
it to review members’ progress in implementing their commitments under the AoA (Art. 17; Art. 18.1).
A major part of the information on which the CoA bases its review are the notifications that
members submit as well as material prepared by the WTO Secretariat (Art. 18.2). In a 1995 decision the
CoA adopted notification formats and requirements, including the timing of notifications (WTO 1995).
Although the CoA decision refers to Art. 18.2, the decision is not part of the AoA and may thus not have
the legal authority of the AoA itself. Members are required to submit regular notifications of their
domestic support every year (every two years for least developed countries). There is a permissible delay
for notifications to be submitted until 90 days (in some cases 120 days) after the end of the notified year.
Members are also required promptly to submit notifications regarding new or modified programs they
exempt from limits, i.e., programs they claim as meeting the criteria of Art. 6.2, Art. 6.5 (blue box) or
Annex 2 (green box) and therefore exempt from their AMSs or CTAMS. The WTO makes all
notifications public shortly after they are submitted.
Most members fail to meet the deadlines for submitting regular notifications, and relatively few
members submit notifications of their new or modified programs. For the period 1995-2018 only 24
members had fully satisfied the regular notification requirements by 10 March 2020 and 29 members had
submitted no regular notifications, such that about one-third of all regular domestic support notifications
were still outstanding in early 2020 (WTO 2020i). For the year 2017 only 39 members had submitted
their regular notifications by 10 March 2020. Members with outstanding 2017 notifications by that date
included, for example, Argentina, Canada, China, the EU, Japan, Korea, Turkey and the United States.
Some of these members (not Korea and Turkey) were up to date with their 2016 notifications, as were
almost all of the 39 members (some with an up to date 2016 notification had a notification outstanding for
one or more earlier years). Some members whose notifications have been outstanding for many years
have recently brought their notifications more up to date, partly as a result of Secretariat efforts. The
information on the support many members have recently provided, such as how they classify their
policies and how they measure their support, is nevertheless not up to date. This lack of transparency has
been a frequent topic for questions in the CoA.
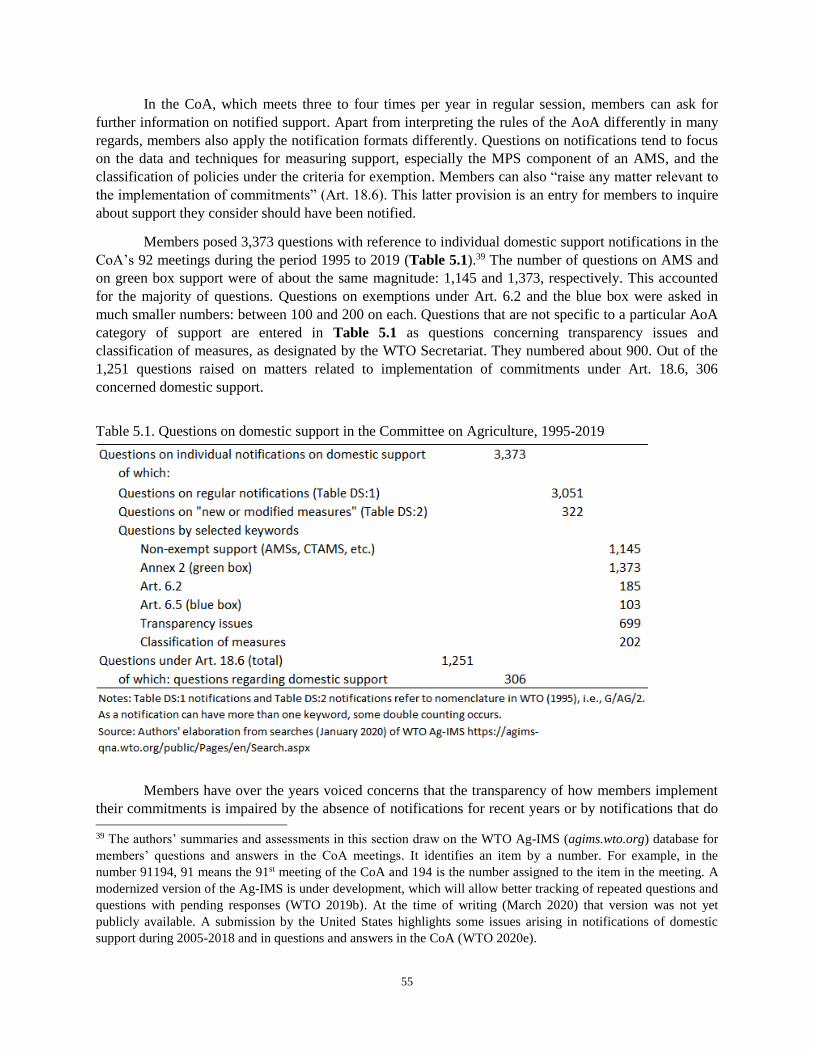
55
In the CoA, which meets three to four times per year in regular session, members can ask for
further information on notified support. Apart from interpreting the rules of the AoA differently in many
regards, members also apply the notification formats differently. Questions on notifications tend to focus
on the data and techniques for measuring support, especially the MPS component of an AMS, and the
classification of policies under the criteria for exemption. Members can also “raise any matter relevant to
the implementation of commitments” (Art. 18.6). This latter provision is an entry for members to inquire
about support they consider should have been notified.
Members posed 3,373 questions with reference to individual domestic support notifications in the
CoA’s 92 meetings during the period 1995 to 2019 (Table 5.1).39 The number of questions on AMS and
on green box support were of about the same magnitude: 1,145 and 1,373, respectively. This accounted
for the majority of questions. Questions on exemptions under Art. 6.2 and the blue box were asked in
much smaller numbers: between 100 and 200 on each. Questions that are not specific to a particular AoA
category of support are entered in Table 5.1 as questions concerning transparency issues and
classification of measures, as designated by the WTO Secretariat. They numbered about 900. Out of the
1,251 questions raised on matters related to implementation of commitments under Art. 18.6, 306
concerned domestic support.
Table 5.1. Questions on domestic support in the Committee on Agriculture, 1995-2019
Members have over the years voiced concerns that the transparency of how members implement
their commitments is impaired by the absence of notifications for recent years or by notifications that do 39 The authors’ summaries and assessments in this section draw on the WTO Ag-IMS (agims.wto.org) database for
members’ questions and answers in the CoA meetings. It identifies an item by a number. For example, in the
number 91194, 91 means the 91st meeting of the CoA and 194 is the number assigned to the item in the meeting. A
modernized version of the Ag-IMS is under development, which will allow better tracking of repeated questions and
questions with pending responses (WTO 2019b). At the time of writing (March 2020) that version was not yet
publicly available. A submission by the United States highlights some issues arising in notifications of domestic
support during 2005-2018 and in questions and answers in the CoA (WTO 2020e).
56
not follow the formats adopted by the CoA. A group of five (later expanding to ten) members proposed
that the WTO’s notifications requirements and formats, including for the AoA, be updated (WTO 2019d;
2020h).40 They also proposed that if a member failed to notify within certain deadlines it would face a
variety of consequences, including not being nominated to preside over WTO bodies or being assessed
additional contributions to the WTO budget Some developing countries and analysts, in contrast, are
concerned by what they see as the burden of meeting WTO notification requirements, including those in
domestic support in agriculture (Kwa and Lunenborg 2019; TWN 2017). Regarding the interval for
notifications after the end of a year, Norway has been clear in expressing its view that the 90 (or 120) day
interval is unrealistically short and revising it could reduce delays in notifications (presumably by making
a more realistic interval more difficult for a member to ignore) and increase transparency (WTO 2018e).
5.1.2 AMS support
Members’ 1,145 questions about AMS support in the CoA were directed mostly to those
members with the largest amounts of such support, although in total they were directed to as many as 53
members. Members do not submit notifications of new or modified measures that provide AMS support,
only for support they claim as exempt. Many questions therefore seek information on the functioning of
the policies providing AMS support. The questions focus on the measurement of MPS, with relatively
less attention to payment support. Members’ interest in the calculation of MPS is foremost a matter of
seeking reassurance that the rules of the AoA are being followed. The underlying driver of this interest is
in many cases an expectation that by making sure a member follows the rules of the AoA, the market
effects of the member’s producer support are minimized.
Measuring MPS can be contentious because members interpret differently the AoA provisions on
the applied administered price, fixed external reference price and eligible production. Members also
understand differently the need for members in the CoA’s review process to give “due consideration to
the influence of excessive rates of inflation on the ability of any Member to abide by its support
commitments” (Art. 18.4). In recent years a large share of AMS questions have gone to China and India,
seemingly related to the initiation of domestic support disputes with China in 2016 and India in 2019 and
the submission of counter-notifications in the CoA on India’s MPS (see sections 5.3 and 5.4). The
counter-notifications show much larger MPSs than India calculates, which would make India’s AMSs
exceed their limits and give India a higher rank among the largest providers of AMS support. Members
have also raised questions about the negative AMSs resulting from negative MPSs calculated by Brazil,
China, the EU, India, Pakistan, Switzerland and Tunisia (Canada and Norway have faced questions about
their use of fees, levies or other policy components to reduce AMSs without making them negative, while
the reporting of fees or levies by, for example, the United States does not seem to have been questioned).
The formats for domestic support notifications do not explicitly require the submission of values
of production to support a member’s claim for de minimis exclusion of an AMS from CTAMS or for
showing compliance with a de minimis limit, i.e., calculating the amount corresponding to 5%, 8.5% or
10% of a VoP. Many questions over the years have sought such elementary VoP data, with the result that
many members have started giving these values in their notifications if they did not already do so. While
India’s notifications still lack this information, India now provides these values in its answers in the CoA.
40 Several other submissions by members, including the United States, have for some years pursued the question of
weak transparency under the AoA. Some submissions are in the form of “room documents”, which are not publicly
available.
57
5.1.3 Claims for exemption
Most of the 1,373 questions asked about green box support are addressed to those members who
claim the largest amounts as exempt from commitment on the basis of green box compatibility, such as
the EU, the United States, China and India. The majority of questions relate to policy classification, i.e.,
how a member’s claim for green box classification is compatible with the requirement and criteria of
Annex 2. Measurement issues do not arise often for green box exemptions, since measuring expenditures
and direct payments is usually more straightforward than measuring other kinds of support.
Many of the green box questions seek further information than the often scanty information given
in a notification. Some questions and answers confirm that a full and timely notification of the policy as a
“new or modified” policy would have avoided the need for an exchange in the CoA. Other answers take
the form of claiming green box compatibility by assertion. Some questions seem designed to learn from
another member’s experience in designing policies that can be claimed as green box compliant, which
may aid members in moving toward less-distorting policies.
The questions reveal a general concern that many direct payment policies do not meet the
fundamental requirement of having at most minimal distorting effects on trade or production or do not
satisfy the policy-specific criteria, particularly the policy-specific criteria for direct payments. In some
cases this concern relates to only small amounts of support, for which disallowing the green box claim
would not make any difference in terms of the member honoring its commitment on AMS support. This
line of questioning essentially signals to all members that their green box claims are being watched and
that members do not hesitate to identify what they consider questionable classifications.
There are instances where a member has retracted its green box claim for a policy but this is not
common. One reason for members not to change their policy classification is that usually the only
consequence for a member of making an invalid green box claim is to be questioned about it in the CoA.
If disallowing an invalid green box exemption were to generate a violation of a member’s domestic
support commitment, it could become a matter to be challenged, possibly escalating to a WTO dispute.
Only two WTO disputes have ever been initiated over a green box claim and they did not generate any
findings concerning domestic support commitments.41
Between 1995 and 2019 members asked a relatively small number of questions (185) about Art.
6.2 exemptions, directed to about two-thirds of the members claiming the exemption. The number of
Art. 6.2 questions includes repeated questions that had not received an answer, even after several years. In
spite of India’s dominance in the amount of support exempted under Art. 6.2, especially as input
subsidies, as few as 40 questions were directed to India. Brazil received 22 such questions. In recent years
(2017, 2018 and 2019) Art. 6.2 questions were directed to numerous users of this exemption, including
Korea, Bahrain, Botswana, Cuba, Egypt, Guatemala, India, Indonesia, Mali, Mexico, the Philippines, Sri
Lanka, Thailand, Togo, Turkey, and Zambia. The largest numbers of these questions were addressed to
India and Egypt. The questions often seek more description of the wide diversity of exempted policy
measures and how they conform to the criteria of Art. 6.2, as well as explanations of significant increases
of Art. 6.2 support in general or under particular policies such as input subsidization.
41 In two WTO disputes initiated in 2007, Canada (DS357) and Brazil (DS365) contended that Production Flexibility
Contract (PFC) payments and Direct Payments (DP) in the United States did not qualify for green box exemption
(WTO 2007a; 2007b; see Table 5.3)). In the WTO dispute US – Upland Cotton (DS267) the Appellate Body in 2005
upheld the panel finding that US PFC and DP did not meet the relevant policy-specific green box criteria for
exemption (WTO 2005). This dispute did not concern any violation of the US domestic support commitment.
58
Many Art. 6.2 questions concern a member’s definition of low-income or resource-poor
producers and its targeting of input subsidies to this group only. In response to several questions on this
topic, India has held that Art. 6.2 does not require such targeting (Ag-IMS 87117, agims.wto.org).
Information on members’ distinction between investment subsidies and input subsidies under Art. 6.2 has
also been sought. In a similar vein, Mexico’s exemption of premium subsidies for many kinds of
insurance, including crop insurance, under the heading of Investment subsidies has been questioned (Ag-
IMS 87153, agims.wto.org).
Among the small number of questions (103) concerning members’ claims for blue box
exemptions, the largest share (29 questions) was directed to the EU. Many of the rest of these questions
were addressed to certain members before they joined the EU. Members have been particularly interested
in understanding the basis for attaching the label “production-limiting” to the payment programs,
particularly regarding the EU payments. Large year-to-year changes in the amount of payments have also
attracted members’ attention.
5.1.4 Transparency and classification
As many as 901 questions concerned what the Secretariat labels as transparency issues or
classification of measures in domestic support. This includes a wide range of questions that are not
specific enough to be uniquely connected to any particular domestic support category of the AoA. Some
of these questions simply concern missing notifications, while others seek more information about
support exempted from AMS calculations or the sources of such information.
Questions in the category of transparency and classification are often open-ended and invite
thorough explanations of a claim for particular classification of a policy, including policies that are not
explicitly identified in a notification. A few examples of questions reveal the range covered under the
label transparency and classification in recent years (see footnote).42
5.1.5 Matters relevant to implementing commitments
In addition to the questions members ask in the CoA with reference to individual notifications,
they can raise questions on any matter relevant to the implementation of commitments (Art. 18.6). The
early years’ questions tended to concern border measures, especially market access, but domestic support
questions have increased in later years. In the 1,251 total only a minority (306) explicitly concerned
domestic support. These questions tend to relate to policy measures introduced or revised so recently that
they have not yet been included in a notification to the CoA. The United States has been the respondent to
42 Australia asked Malaysia for information about the subsidy available to each producer and the eligibility
requirements under its paddy price subsidy program, notified as green box direct payments (Ag-IMS 90124). The
response mentioned low-income and resource-poor paddy farmers and did not lead to a request for more detail.
Russia inquired about an apparent shift in EU green box support between two years, in response to which the answer
referred to funding under specific headings having changed between two multi-year budget cycles and to the time
lag between the last year of implementing a payment program and the year the last payment was made (Ag-IMS
91079). In 2019, following up on a 2018 question which had not been answered, the United States asked India about
its short-term crop loans at a subsidized rate of interest (Ag-IMS 88107; Ag-IMS 91147). India’s answer referred to
the main website of its department of agriculture, cooperation and farmers’ welfare and an indication that a response
would be provided in due course. Later in 2019 the United States asked for a more specific website location and
inquired whether the program was included in India’s notification and, if so, where and on what basis (Ag-IMS
92010). The question was repeated in early 2020 without eliciting any further information at that time (Ag-IMS
93012).
59
the largest number (53) of Art. 18.6 questions. The EU faced 46 questions and India 41. The lower
number (14) of questions directed to China is partially influenced by China having been a WTO member
for a shorter time than the other members reporting large domestic support. Japan has been asked only a
handful of Art. 18.6 questions.
Members often seek the most recent information on such measures in order to evaluate the
possible effects on trade. The responding member is not always able or willing to provide more
information than what is available from other sources, such as government websites and media. Questions
about classification of a measure as exempt or not and about measurement of support often receive an
answer that such information will be seen in a future notification.
Some information that members seek through questions is publicly available from member
governments themselves or from international organizations such as the OECD or the FAO. However, in
view of the CoA’s remit to review the implementation of WTO commitments, members prefer to receive
information directly from another government and in the context of the WTO. This may be the reason
why some questions are formulated as seeking confirmation of a policy description or a policy parameter
publicized in media. That said, the questions and answers in the CoA often do give information that
otherwise would not be available and helps to assess a member’s compliance with its commitments.
To summarize, although there have been many constructive exchanges, throughout the reviews
within the CoA numerous questions have remained unanswered. This relates to the large numbers of
questions about AMS support and about policies being eligible for exemption under green box criteria
and for the smaller numbers of questions about Art. 6.2 or blue box criteria. A similar lack of answers is
evident of questions asked about transparency, clarification and matters relevant to implementing
commitments. Members’ answers are in many cases unrelated to the question or do not provide the
information sought. Some of this may be explained by a member’s reluctance to reveal information that
might undermine its preferred way of classifying policies and measuring support or to articulate a
rationale for its measurement when doing so is at its discretion. The lack of answers is to the detriment of
the CoA’s ability to deliver on its responsibility to review progress in the implementation of members’
commitments. There is thus much to be desired in terms of the transparency that could result from the
CoA’s attention to members’ notifications.
5.2 Review outside the Committee on Agriculture: Trade Policy Reviews
Outside of the review in the CoA, the WTO circulates for each member a Trade Policy Review
(TPR), which is essentially a peer-group assessment. The frequency of the TPR is three, five or seven
years, depending on the member’s share of world trade.43 A TPR consists of a report prepared by the
WTO Secretariat, with input from the reviewed member, and a report prepared by the reviewed member
itself. The Secretariat report usually has a chapter examining the member’s trade policies and practices in
agriculture, including domestic support. It draws on the member’s domestic support notifications,
complemented with both official and unofficial information.
Since preparing the TPR involves thorough discussions with the member concerned, a certain
level of authority attaches to the information and assessments documented in a TPR. This adds some
transparency to how members are meeting their domestic support commitments, especially in terms of
describing the policies providing domestic support. In the finalization of the TPR members may pose 43 Since 2016 TPRs are scheduled less frequently than before. In March 2020 the latest TPR for five major members
were 2018 for China, 2020 for the European Union, 2015 for India, 2017 for Japan, and 2018 for the United States.
TPRs for some of these members are planned for 2020 and 2021.
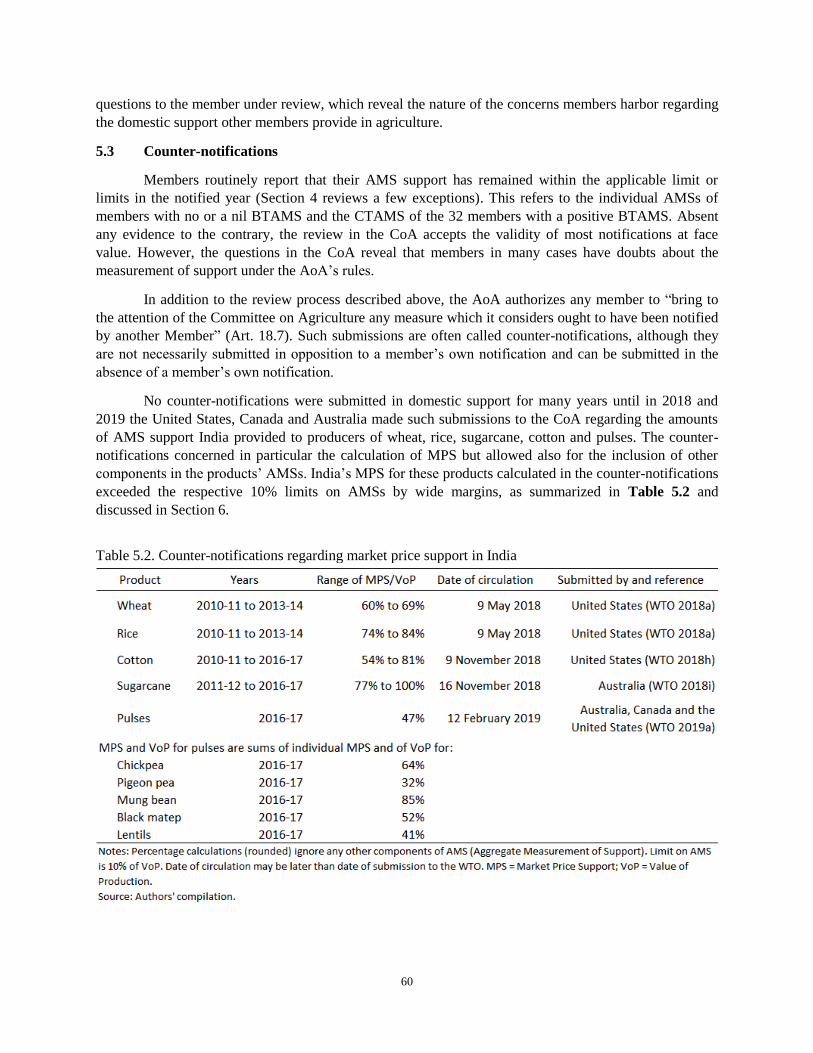
60
questions to the member under review, which reveal the nature of the concerns members harbor regarding
the domestic support other members provide in agriculture.
5.3 Counter-notifications
Members routinely report that their AMS support has remained within the applicable limit or
limits in the notified year (Section 4 reviews a few exceptions). This refers to the individual AMSs of
members with no or a nil BTAMS and the CTAMS of the 32 members with a positive BTAMS. Absent
any evidence to the contrary, the review in the CoA accepts the validity of most notifications at face
value. However, the questions in the CoA reveal that members in many cases have doubts about the
measurement of support under the AoA’s rules.
In addition to the review process described above, the AoA authorizes any member to “bring to
the attention of the Committee on Agriculture any measure which it considers ought to have been notified
by another Member” (Art. 18.7). Such submissions are often called counter-notifications, although they
are not necessarily submitted in opposition to a member’s own notification and can be submitted in the
absence of a member’s own notification.
No counter-notifications were submitted in domestic support for many years until in 2018 and
2019 the United States, Canada and Australia made such submissions to the CoA regarding the amounts
of AMS support India provided to producers of wheat, rice, sugarcane, cotton and pulses. The counter-
notifications concerned in particular the calculation of MPS but allowed also for the inclusion of other
components in the products’ AMSs. India’s MPS for these products calculated in the counter-notifications
exceeded the respective 10% limits on AMSs by wide margins, as summarized in Table 5.2 and
discussed in Section 6.
Table 5.2. Counter-notifications regarding market price support in India
61
Submitting an Art. 18.7 counter-notification documents a concern more formally than does
submitting a written question for a meeting of the CoA. It can alert a member more strongly that another
member disagrees with its reporting of domestic support and lead to extended discussion in the CoA. For
instance, the US counter-notifications on India’s MPS for wheat, rice and cotton refer to future discussion
with India and other members about the significance of this support for India’s and world markets (WTO
2018a; 2018h). In the case of sugarcane India asserted that the counter-notification was “based on
incorrect assumptions, faulty interpretations and flawed analysis, leading to erroneous conclusions”, using
similar wording about other counter-notifications (Permanent Mission of India to the WTO 2018).
5.4 Dispute settlement
The AoA foresees the possibility that members will use the rules of the WTO Dispute Settlement
Understanding (DSU) for consultations and the settlement of disputes (Art. 19). The outcome of dispute
settlement is more powerful and can have greater consequences than the information exchange in the
CoA, including counter-notifications. The DSU recognizes good offices, conciliation and mediation,
possibly engaging the Director-General of the WTO, as steps to settle a dispute before it escalates. If it is
not settled, the complaining member can request consultations with the responding member. If they fail to
resolve the dispute, the complainant can request the Dispute Settlement Body (DSB) to establish a panel
to examine the matter at issue and generate findings to assist that body in making recommendations to the
disputing members (once the panel is established, the appointment of panelists constitutes its
composition). The disputing parties can appeal the panel report on issues of law, in which case the
Appellate Body (AB) can uphold, modify or reverse the legal findings and conclusions of the panel.44
If the panel or the AB concludes that the respondent has violated its obligations under an
agreement such as the AoA, it recommends that the respondent bring its measures into conformity with its
obligations under that agreement. The DSB’s adoption of the report of the panel or the AB makes the
recommendations effective. The DSU specifies procedures to follow if there is disagreement over a
member’s implementation of the recommendations within a reasonable period of time. They could lead to
a “suspension of concessions”, which can mean permission for the complainant to temporarily raise tariffs
on imports from the respondent. The two parties may also agree on some sort of compensation.
Very few of the disputes initiated at the WTO have involved domestic support in agriculture. Out
of a total of 593 over the period of 1995 to 2019 only nine such disputes have been initiated (Table 5.3).
Three of these disputes (DS161 and DS169, adjudicated jointly as Korea – Various Measures on Beef,
and DS511 China – Agricultural Producers concerning MPS for wheat, rice and corn) have advanced to
having a report adopted by the DSB. Three disputes are at a standstill: either a dispute panel was never
composed (DS357 and DS365) or the dispute did not proceed past a request for consultations (DS507).
Three disputes were launched in 2019, all concerning India’s sugarcane support and the three panels were
identically composed on 28 September 2019. Counter-notifications in the CoA are not necessarily a step
in the chain of events leading to the establishment of a dispute panel, although this was the case regarding
the 2019 disputes about India’s support for sugarcane. The earlier disputes about domestic support were
not preceded by any counter-notifications, although numerous questions had been raised about the
disputed measures in the CoA.
44 This describes the role of the AB as defined in the DSU. In 2019, the United States blocked the appointment of
new AB judges, leaving the AB in December 2019 without a quorum to hear cases. Building on a 2016 initiative, 20
members had by April 2020 agreed to develop an interim agreement to effectively mirror the AB (WTO 2020m).
Some large agricultural trading countries such as the United States, Japan, Korea and India were not parties to the
agreement. At time of this writing (April 2020) the AB impasse was not resolved (see Orden 2020).
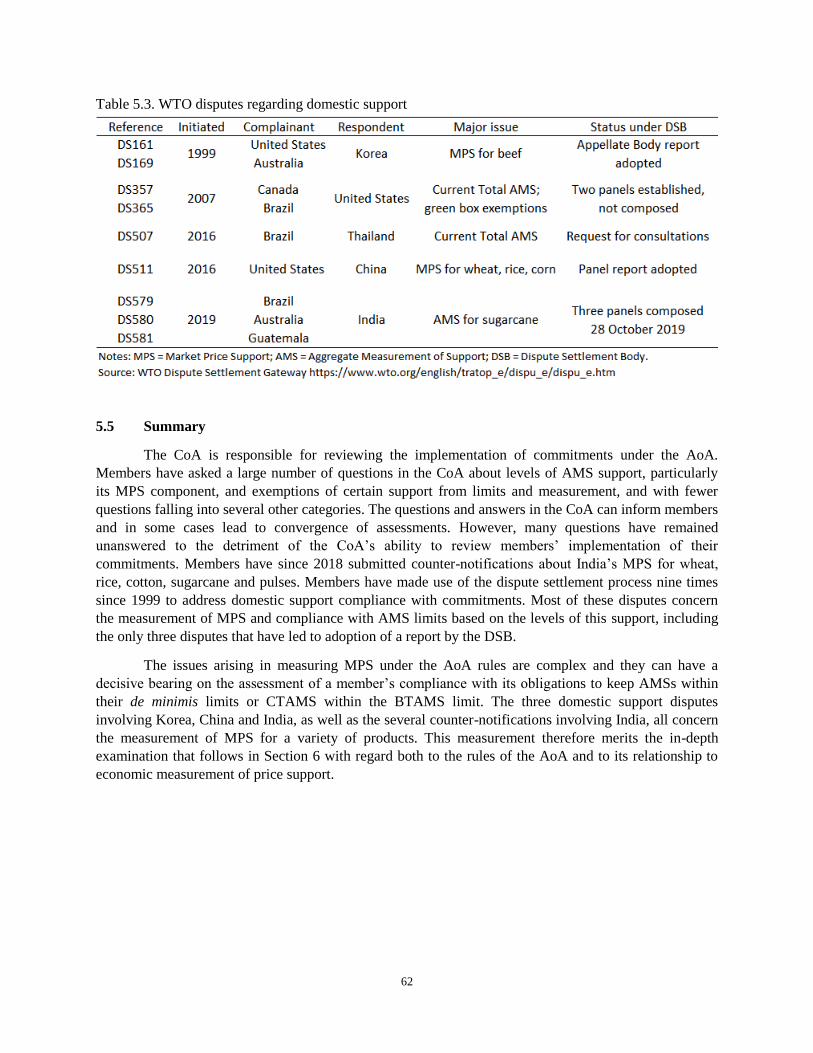
62
Table 5.3. WTO disputes regarding domestic support
5.5 Summary
The CoA is responsible for reviewing the implementation of commitments under the AoA.
Members have asked a large number of questions in the CoA about levels of AMS support, particularly
its MPS component, and exemptions of certain support from limits and measurement, and with fewer
questions falling into several other categories. The questions and answers in the CoA can inform members
and in some cases lead to convergence of assessments. However, many questions have remained
unanswered to the detriment of the CoA’s ability to review members’ implementation of their
commitments. Members have since 2018 submitted counter-notifications about India’s MPS for wheat,
rice, cotton, sugarcane and pulses. Members have made use of the dispute settlement process nine times
since 1999 to address domestic support compliance with commitments. Most of these disputes concern
the measurement of MPS and compliance with AMS limits based on the levels of this support, including
the only three disputes that have led to adoption of a report by the DSB.
The issues arising in measuring MPS under the AoA rules are complex and they can have a
decisive bearing on the assessment of a member’s compliance with its obligations to keep AMSs within
their de minimis limits or CTAMS within the BTAMS limit. The three domestic support disputes
involving Korea, China and India, as well as the several counter-notifications involving India, all concern
the measurement of MPS for a variety of products. This measurement therefore merits the in-depth
examination that follows in Section 6 with regard both to the rules of the AoA and to its relationship to
economic measurement of price support.
63
6. DISPUTES AND COUNTER-NOTIFICATIONS ABOUT MARKET PRICE SUPPORT
This section examines the measurement issues about market price support (MPS) that have arisen
in the disputes and counter-notifications concerning AMS support, in particular as they affect whether the
member’s MPS enables it to comply with its AMS commitments. The analysis draws on the outcomes of
the three disputes that have generated panel reports, viz. Korea ‒ Various Measures on Beef (DS161 and
DS169) and China ‒ Agricultural Producers (DS511), on the counter-notifications of India’s support for
wheat, rice, cotton and sugarcane, and on Australia’s first written submission in India ‒ Measures
Concerning Sugar and Sugarcane (DS580) (DFAT 2020).
The AoA stipulates that an AMS be “calculated in accordance with the provisions of Annex 3 of
this Agreement and taking into account the constituent data and methodology used in the tables of
supporting material incorporated by reference in Part IV of the Member’s Schedule” (Art.1(a)(ii)).45 A
product’s AMS includes its MPS and is calculated for basic agricultural products “as close as possible to
the point of first sale as specified in a Member’s Schedule and in the related supporting material” (para. 7,
Annex 3). The nominal value of a product’s MPS is calculated by multiplying the gap between an applied
administered price (AAP) and a fixed external reference price (FERP) by the quantity of production
eligible to receive the AAP (para. 8, Annex 3, see equations in Section 3.3 of this paper). The AoA
stipulates that the FERP must be based on the years 1986 to 1988 and “may be adjusted for quality
differences as necessary” (para. 9, Annex 3). The AoA does not elaborate on what constitutes an AAP nor
the quantity of production eligible to receive the AAP, often called the eligible production.
The MPS calculated under AoA rules to determine compliance with AMS commitments differs
conceptually from the economic MPS reported in OECD PSE or the measurement of border protection
widely used in economic analysis. In contrast to the AoA measurement of MPS, an economic
measurement is based on the gap between the domestic market price and a contemporaneous international
reference border price, and on the full quantity of national production to which this price gap applies. This
raises the question of what calculation parameters and circumstances can make the AoA commitments
instrumental in constraining economic support that distorts markets or, in the words of the AoA,
correcting and preventing “restrictions and distortions in world agricultural markets” (WTO 1994a).
6.1 Korea ‒ Various Measures on Beef
The Korea ‒ Various Measures on Beef dispute (WTO 2000a; 2000b) provided some clarification
of the measurement of MPS under the AoA. Although the Appellate Body (AB) concluded it could not be
determined from the evidence presented to the panel whether Korea’s MPS exceeded its AMS
commitment, several of the panel and AB arguments are often referenced. First, the AB concluded that
“in accordance with” the AoA reflects a more rigorous standard than “taking into account” the constituent
data and methodology. Second, both the panel and AB expressed their views on what constitutes eligible
production. The panel considered that eligible production comprises “the total marketable production…
even though the proportion of production which is actually purchased by a government agency may be
relatively small or even nil” (WTO 2000a). The AB concluded that eligible production refers to
production that is “fit or entitled” to be purchased rather than the quantity actually purchased (WTO
2000b). In its beef support program Korea had announced a maximum intervention quantity it would
purchase. The AB concluded that a government is able to define and to limit eligible production. Thus,
the AB determined that the maximum quantity Korea had announced it would purchase was the quantity
45 These tables carry the code AGST for each original member and are usually called the member’s AGST tables.
64
of eligible production, even though Korea actually purchased a lesser quantity. Finally, the panel
determined that prices of closely-matched qualities of beef must be used for AAPs and FERPs.
6.2 China ‒ Agricultural Producers
6.2.1 Context of the China ‒ Agricultural Producers dispute
The dispute about beef in Korea was the only adjudication on MPS until the United States
initiated its complaint over China’s price support for wheat, rice and corn in September 2016, titled China
‒ Agricultural Producers (DS511, full title China ‒ Domestic Support for Agricultural Producers). The
panel found that China’s MPSs for wheat and rice (evaluated separately for Indica and Japonica varieties)
had by themselves exceeded China’s AMS limits of 8.5% of VoP in each of the years 2012 through 2015
(WTO 2019c; Brink et al. 2019). The panel recommended that China bring its measures into conformity
with its obligations. As the report was not appealed, the DSB adopted it in April 2019. China agreed to
bring its measures into conformity by 31 March 2020. In early 2020 China undertook to do so “in due
course” and then “at the earliest date” (WTO 2020a; 2020b). Subsequently, the parties agreed to extend
the deadline to 30 June 2020 to allow time for the United States to evaluate China’s actions (WTO 2020l).
A related dispute, China ‒ TRQs (DS517, full title China ‒ Tariff Rate Quotas for Certain
Agricultural Products), was initiated by the United States in December 2016. This dispute concerned
China’s administration of TRQs for wheat, rice and corn. The panel found that China had failed to ensure
that its administration of TRQs would not inhibit the filling of each TRQ (WTO 2019e; Orden et al.
2019). The DSB adopted also this panel report. While China claims that it had fully implemented the
recommendations and rulings of the DSB by 31 December 2019, the parties later agreed to extend the
deadline for doing so until 29 May 2020 to allow time for the United States to evaluate China’s
compliance (WTO 2020d; 2020j).
The two disputes were initiated under circumstance of increasing economic MPS as China raised
AAPs. Starting in 2012, this provided a floor under domestic market prices at a time when world market
prices fell back from their high levels during 2007-11. The OECD (2019) estimates of China’s economic
MPS at the farm level averaged 32.2% of VoP at domestic prices for wheat, 32.0% for rice and 22.6% for
corn during 2012-15. Economic support can be expressed alternatively as the percentage by which the
domestic farm level price exceeds the international reference border price, adjusted to farm level (equal to
the percentage by which the VoP at domestic prices exceeds its value at the adjusted border prices since
all output receives the economic MPS). The border protection averaged 47.7% for wheat, 47.2% for rice
and 30.0% for corn during 2012-15 using the OECD data. The increased economic MPS and associated
border protection coincided with declining US exports to China of these grains and growing Chinese
grain stocks. The two disputes were initiated simultaneously to seek reduced market distortions and
improved access to China’s markets. The panel ruling that China exceeded its AMS commitments along
with the panel ruling on TRQ administration form a context where the AoA as interpreted in a dispute
could constrain economic MPS and facilitate expanded grain trade.
6.2.2 China ‒ Agricultural Producers: Adjudication and implementation for wheat and rice
6.2.2.1 Panel considerations
The China ‒ Agricultural Producers panel examined three key measurement issues (while corn is
included in early discussion of the dispute issues, the panel’s different approach to corn is discussed in
Section 6.2.3). First, the United States argued that China’s eligible production of wheat, rice and corn,
respectively, was production in the provinces and regions where the support programs operated. For

65
wheat and rice this covered nearly 80% of national production and for corn about 45% during 2012-15. In
contrast, China used the smaller quantities purchased by the government under the support programs,
which was the measurement it had used in its WTO accession.
Second, the United States argued that China’s FERPs for wheat, rice and corn should be based on
the three-year averages of 1986-88 world prices, as specified in the AoA. In contrast, China used the
much higher 1996-98 prices as it had in its accession. For example, the FERP for wheat is 1,698
CNY/tonne if based on 1996-98 versus 431 CNY/tonne if based on 1986-88. The 1996-98 FERP results
in considerably smaller price gaps and MPSs than using 1986-88.
Third, the parties agreed that the AAP and FERP for rice must be assessed at the same level of
processing (although not part of the panel’s considerations, China had in its notifications to the CoA
through 2010 used an AAP for unmilled rice but a FERP for milled rice, a higher-priced processed
product, which reduced its notified MPS). The United States and China disagreed on whether to measure
MPS for unmilled or for milled rice and on the appropriate conversion factor between prices at the two
levels of processing.
The different interpretations resulted in vastly different MPSs. The United States held that
China’s MPSs exceeded its summed AMS limits for wheat, rice and corn by an average of CNY 604
billion (USD 97 billion) per year during 2012-15. China claimed it was within its wheat and rice limits
and did not calculate corn AMSs. China argued it had terminated the corn price support program in March
2016 and thus evaluating AMSs for corn in 2012-15 was outside the panel’s terms of reference. This
argument became a fourth issue in the dispute.
The panel established that eligible production was production in the relevant provinces and
regions because the legal instruments for implementing China’s price support program did not explicitly
or implicitly impose any cap on the quantities eligible for the support price. The panel made a minor
adjustment for ineligible grain of low-quality but did not reduce eligible production because the program
operated only part of the year or some grain was consumed on-farm. The panel also found that the MPS
must be measured for unmilled rice but accepted China’s 0.7 conversion factor (price of unmilled equals
0.7 times the price of milled) not the 0.6 factor proposed by the United States. This resulted in lower
calculated MPSs than had the US factor been used.
The panel determined that the FERPs from the years 1996-98 used in China’s accession
documents to calculate MPSs for its Base Total AMS were appropriate for calculating China’s subsequent
MPSs. Thus, the panel rejected the US argument that FERP be determined by the years 1986-88 as
stipulated in the AoA, a stipulation that the panel reasoned needed to be read in proper context and in
light of the objectives and purpose of the agreement. The panel found that use of later years than 1986-88
to determine the Base Total AMS of all but one of the other members that had acceded to the WTO since
1995 provided important context for its decision. The panel also concluded that using a member’s Base
Total AMS as the basis for reduction commitments under the AoA implied a need for consistency in the
way base period AMSs and subsequent AMSs were calculated and that this consideration was relevant
even where no reduction from Base Total AMS was required, as in the case of China. The panel
determined that to maintain this consistency the same FERP as used in the base period should be used to
calculate the subsequent MPSs, but that this did not mean the data and methodologies in the base period
and subsequent calculations had to be identical in every respect.
Drawing on these determinations, the panel found that China exceeded its AMS limits for wheat
and Indica and Japonica rice in each year 2012-15 and therefore was not in compliance with its
obligations under Art. 3.2 and Art. 6.3 of the AoA that require a member’s CTAMS not to exceed its
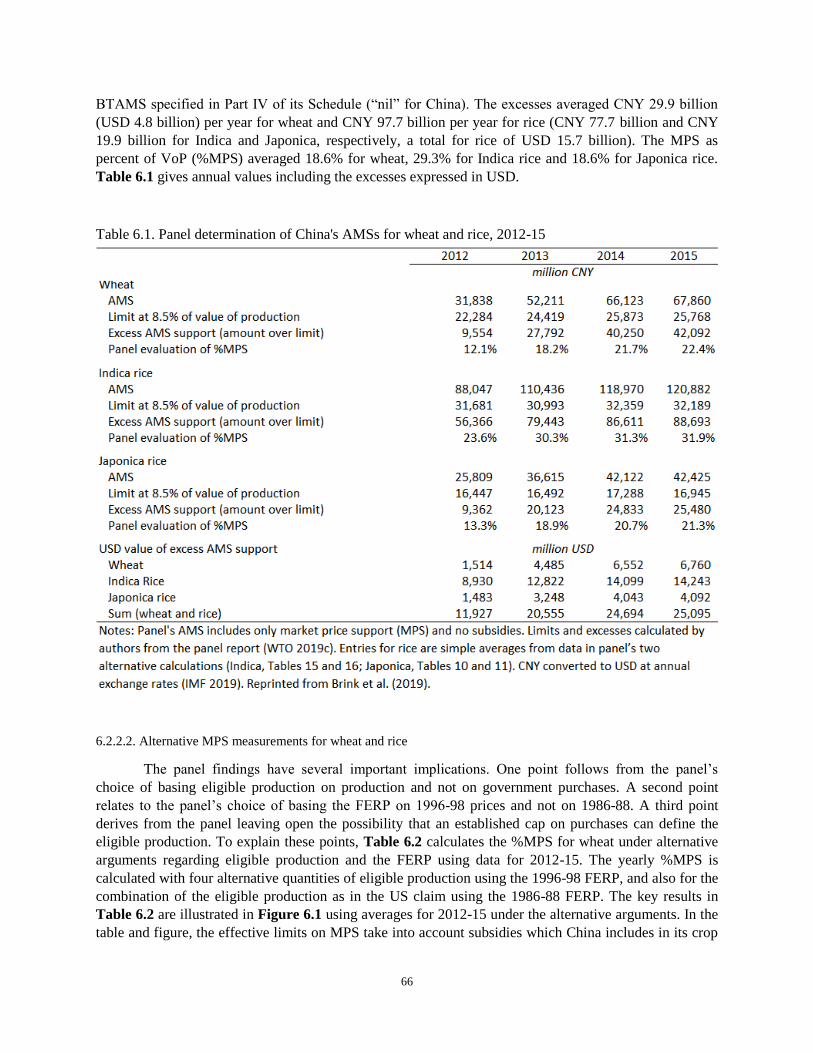
66
BTAMS specified in Part IV of its Schedule (“nil” for China). The excesses averaged CNY 29.9 billion
(USD 4.8 billion) per year for wheat and CNY 97.7 billion per year for rice (CNY 77.7 billion and CNY
19.9 billion for Indica and Japonica, respectively, a total for rice of USD 15.7 billion). The MPS as
percent of VoP (%MPS) averaged 18.6% for wheat, 29.3% for Indica rice and 18.6% for Japonica rice.
Table 6.1 gives annual values including the excesses expressed in USD.
Table 6.1. Panel determination of China's AMSs for wheat and rice, 2012-15
6.2.2.2. Alternative MPS measurements for wheat and rice
The panel findings have several important implications. One point follows from the panel’s
choice of basing eligible production on production and not on government purchases. A second point
relates to the panel’s choice of basing the FERP on 1996-98 prices and not on 1986-88. A third point
derives from the panel leaving open the possibility that an established cap on purchases can define the
eligible production. To explain these points, Table 6.2 calculates the %MPS for wheat under alternative
arguments regarding eligible production and the FERP using data for 2012-15. The yearly %MPS is
calculated with four alternative quantities of eligible production using the 1996-98 FERP, and also for the
combination of the eligible production as in the US claim using the 1986-88 FERP. The key results in
Table 6.2 are illustrated in Figure 6.1 using averages for 2012-15 under the alternative arguments. In the
table and figure, the effective limits on MPS take into account subsidies which China includes in its crop
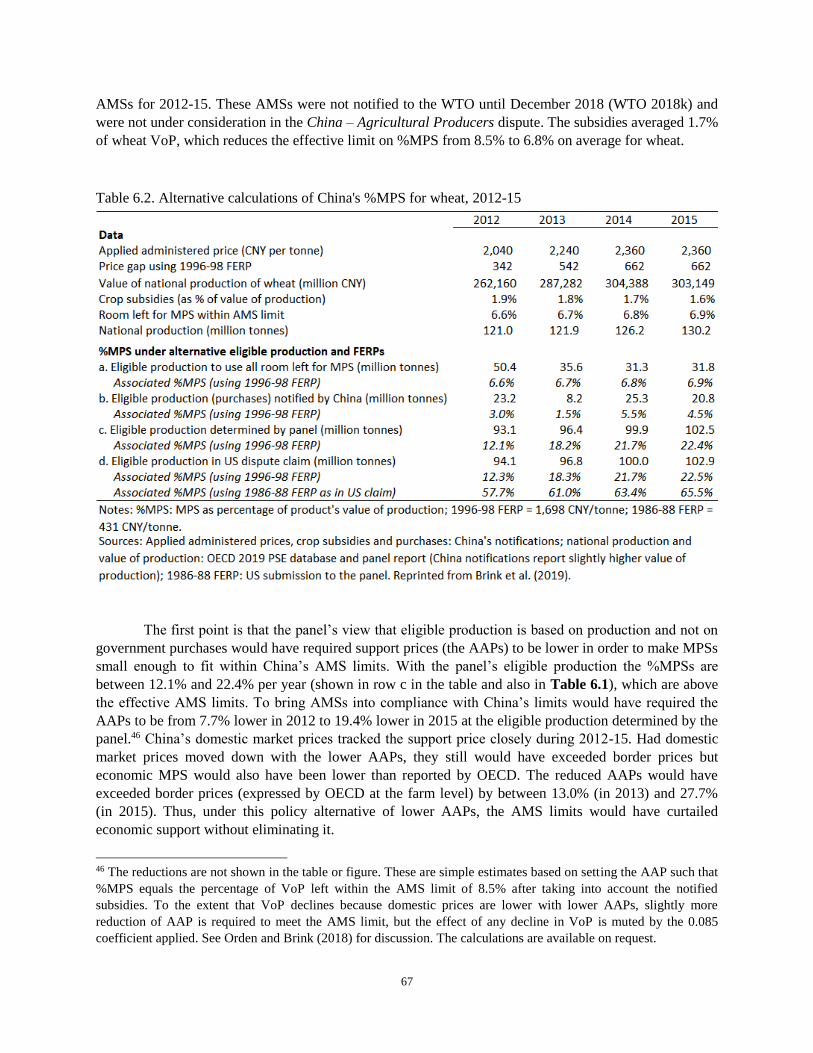
67
AMSs for 2012-15. These AMSs were not notified to the WTO until December 2018 (WTO 2018k) and
were not under consideration in the China ‒ Agricultural Producers dispute. The subsidies averaged 1.7%
of wheat VoP, which reduces the effective limit on %MPS from 8.5% to 6.8% on average for wheat.
Table 6.2. Alternative calculations of China's %MPS for wheat, 2012-15
The first point is that the panel’s view that eligible production is based on production and not on
government purchases would have required support prices (the AAPs) to be lower in order to make MPSs
small enough to fit within China’s AMS limits. With the panel’s eligible production the %MPSs are
between 12.1% and 22.4% per year (shown in row c in the table and also in Table 6.1), which are above
the effective AMS limits. To bring AMSs into compliance with China’s limits would have required the
AAPs to be from 7.7% lower in 2012 to 19.4% lower in 2015 at the eligible production determined by the
panel.46 China’s domestic market prices tracked the support price closely during 2012-15. Had domestic
market prices moved down with the lower AAPs, they still would have exceeded border prices but
economic MPS would also have been lower than reported by OECD. The reduced AAPs would have
exceeded border prices (expressed by OECD at the farm level) by between 13.0% (in 2013) and 27.7%
(in 2015). Thus, under this policy alternative of lower AAPs, the AMS limits would have curtailed
economic support without eliminating it.
46 The reductions are not shown in the table or figure. These are simple estimates based on setting the AAP such that
%MPS equals the percentage of VoP left within the AMS limit of 8.5% after taking into account the notified
subsidies. To the extent that VoP declines because domestic prices are lower with lower AAPs, slightly more
reduction of AAP is required to meet the AMS limit, but the effect of any decline in VoP is muted by the 0.085
coefficient applied. See Orden and Brink (2018) for discussion. The calculations are available on request.
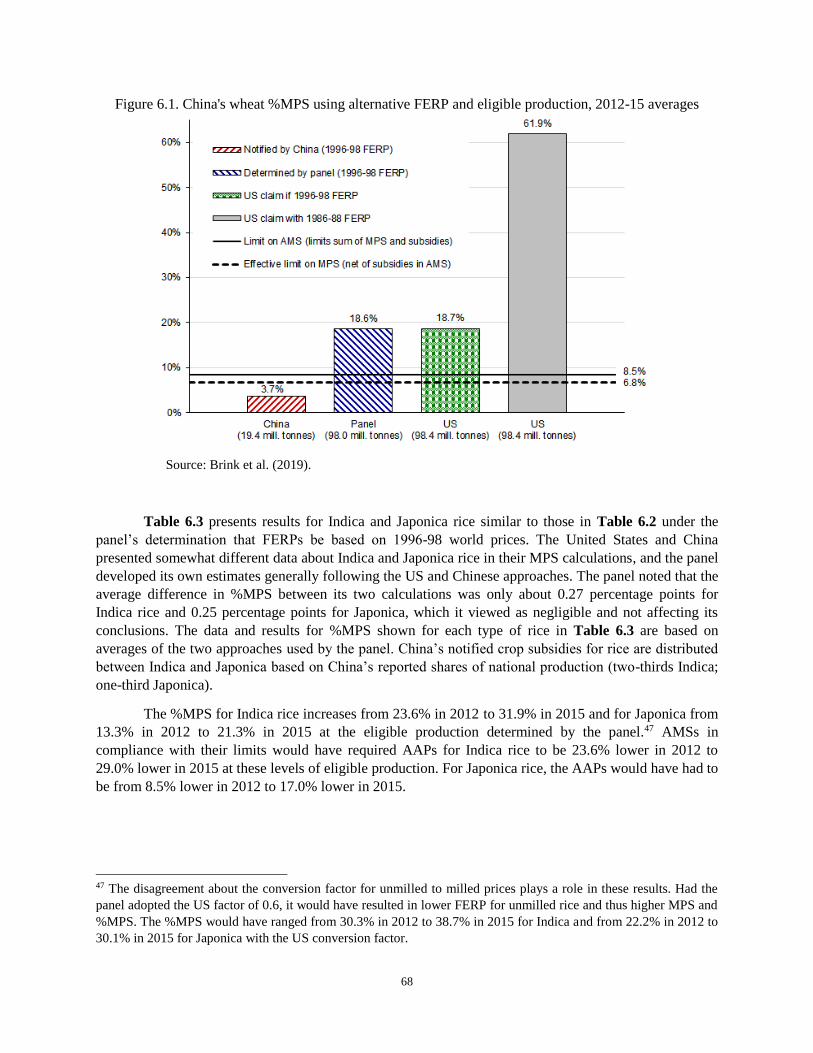
68
Figure 6.1. China's wheat %MPS using alternative FERP and eligible production, 2012-15 averages
Source: Brink et al. (2019).
Table 6.3 presents results for Indica and Japonica rice similar to those in Table 6.2 under the
panel’s determination that FERPs be based on 1996-98 world prices. The United States and China
presented somewhat different data about Indica and Japonica rice in their MPS calculations, and the panel
developed its own estimates generally following the US and Chinese approaches. The panel noted that the
average difference in %MPS between its two calculations was only about 0.27 percentage points for
Indica rice and 0.25 percentage points for Japonica, which it viewed as negligible and not affecting its
conclusions. The data and results for %MPS shown for each type of rice in Table 6.3 are based on
averages of the two approaches used by the panel. China’s notified crop subsidies for rice are distributed
between Indica and Japonica based on China’s reported shares of national production (two-thirds Indica;
one-third Japonica).
The %MPS for Indica rice increases from 23.6% in 2012 to 31.9% in 2015 and for Japonica from
13.3% in 2012 to 21.3% in 2015 at the eligible production determined by the panel.47 AMSs in
compliance with their limits would have required AAPs for Indica rice to be 23.6% lower in 2012 to
29.0% lower in 2015 at these levels of eligible production. For Japonica rice, the AAPs would have had to
be from 8.5% lower in 2012 to 17.0% lower in 2015.
47 The disagreement about the conversion factor for unmilled to milled prices plays a role in these results. Had the
panel adopted the US factor of 0.6, it would have resulted in lower FERP for unmilled rice and thus higher MPS and
%MPS. The %MPS would have ranged from 30.3% in 2012 to 38.7% in 2015 for Indica and from 22.2% in 2012 to
30.1% in 2015 for Japonica with the US conversion factor.
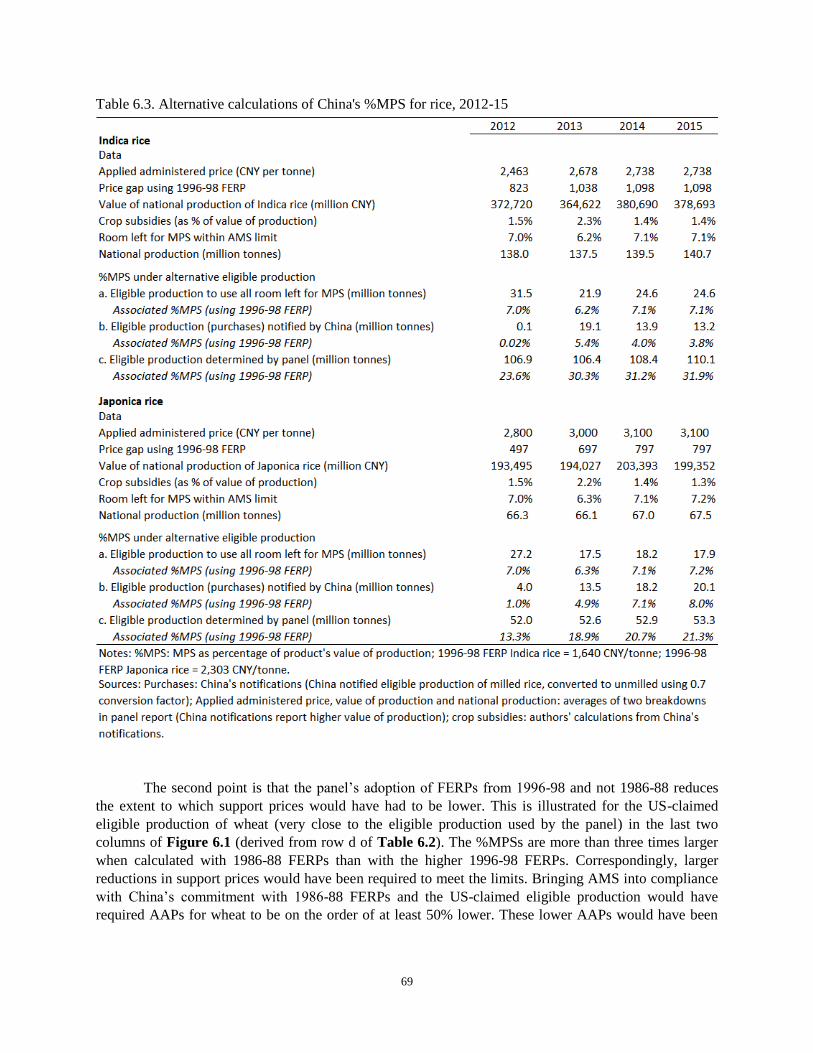
69
Table 6.3. Alternative calculations of China's %MPS for rice, 2012-15
The second point is that the panel’s adoption of FERPs from 1996-98 and not 1986-88 reduces
the extent to which support prices would have had to be lower. This is illustrated for the US-claimed
eligible production of wheat (very close to the eligible production used by the panel) in the last two
columns of Figure 6.1 (derived from row d of Table 6.2). The %MPSs are more than three times larger
when calculated with 1986-88 FERPs than with the higher 1996-98 FERPs. Correspondingly, larger
reductions in support prices would have been required to meet the limits. Bringing AMS into compliance
with China’s commitment with 1986-88 FERPs and the US-claimed eligible production would have
required AAPs for wheat to be on the order of at least 50% lower. These lower AAPs would have been
70
below border prices and precluded any economic support through administered prices. Use of 1986-88
FERPs has similar effects (not shown) for rice.
The third point about the dispute outcome is that the panel left open the possibility that including
a cap on purchases at the support price in a program’s legal framework may define the eligible production
under the AoA. This is significant because it enables a government to manage the combination of eligible
production and support price such that a product’s AMS stays within each year’s limit.
China’s maximum quantities of eligible production within its AMS limits at the announced
AAPs, 1996-98 FERPs and accounting for the subsidies included in the AMSs, averaged 37.3 million
tonnes for wheat during 2012-15 (Table 6.2, row a). China’s notified purchases of wheat at support prices
averaged 19.4 million tonnes (row b), yielding a %MPS each year that was below the effective AMS limit
taking subsidies into account. Thus, China potentially could have complied with its AMS limits during
2012-15 without reducing support prices or procurements. This could have been accomplished by
including in its legal framework numerical caps, or rules to generate caps, on the quantities of eligible
production such that these quantities were less than the quantities exhausting the effective AMS limits,
but larger than the quantities of wheat actually procured. For Indica rice the results are similar. The
required caps on eligible production average 25.6 million tonnes, while China’s procurements average
11.6 million tonnes and are below the caps each year (upper rows a and b in Table 6.3). For Japonica rice,
the required caps exceed China’s procurements in 2012 and 2013 (lower rows a and b in Table 6.3).
However, the caps would have been binding in 2014 and 2015 when China’s procurements rise to 18.2
and 20.1 million tonnes, respectively. At these procurements AMS exceeds its limit when %MPS and the
limit are calculated using VoP of Japonica rice from the panel’s assessment and crop subsidies are
included in the AMSs.48
6.2.2.3. China’s compliance decisions
In 2016 China began reducing its wheat and rice support prices. By 2018, the support price for
wheat had been reduced by 5.1% (to 2,240 CNY/tonne), Indica rice by 9.9% (to 2,460 CNY/tonne
averaged over early and mid-to-late varieties) and Japonica rice by 16.1% (to 2,600 CNY/tonne). Support
prices were maintained at these levels in 2019. For Japonica rice the reduction of the support price was
essentially sufficient, (16.1%/17.0%), had the lower AAPs been applied during 2012-15, to bring MPS
within China’s limit with eligible production measured as determined by the panel. For wheat and Indica
rice, the price reductions alone were not sufficient to have brought support into compliance if they had
been applied during 2012-15 with the panel’s measurement of eligible production. The reductions of
AAPs, for example, were only about one-quarter for wheat and one-third for Indica rice of the reductions
that would have brought AMSs within limits in 2015 (5.1%/19.4% and 9.9%/29.0%, respectively).
Economic %MPS rose for wheat in 2016 (to 45.1%) then declined (falling to 26.1% in 2018) as
international reference prices first fell then increased while the support prices were maintained with only
a slight reduction. For rice, economic %MPS declined each year from 2015-18, as international prices
rose and support prices were reduced more substantially.
In October 2019 China announced further steps to bring its wheat support into compliance with
its AMS limit. Specifically, China indicated it would use a combination of support price and maximum
procurement parameters to meet its AMS commitment for wheat. The support price would be maintained
at the 2019 level and a cap of 37 million tonnes would be imposed on the quantity to be procured in 2020
48 China’s notifications calculate MPS separately for Indica and Japonica rice but evaluate AMS for rice in total
which, including the subsidies, is notified as remaining below the AMS limit.

71
(NDRC 2019). The level of the cap was above past procurements and anticipated 2020 procurements but
low enough that China’s 2020 AMS could be expected to be below its limit. With VoP estimated by
assuming that domestic prices are at the level of the 2020 AAP and using recent 2018 production as a
simple estimate of production in 2020, the %MPS with eligible production of 37 million tonnes is around
6.9% of VoP (a higher cap of 46.2 million tonnes would give a %MPS at the AMS limit of 8.5%).
Monitoring procedures were announced to ensure that the cap would not be exceeded: authority
to purchase 33.3 million tonnes would be allocated across provinces and autonomous regions initially,
then the remaining 3.7 million tonnes would be assigned to certain areas if needed. Similar steps to ensure
compliance with the limit for rice were announced in February 2020 (NDRC 2020). The Indica AAPs
were raised by just 20 CNY compared to 2019 and Japonica AAP held at the 2019 level. Procurement
caps were set at 20 million tons for Indica rice and 30 million tonnes for Japonica. Again, these caps
exceed past procurements and with the announced AAPs imply %MPSs around 5% of VoP if fully
utilized. The monitoring associated with caps on procurement of wheat and rice will increase
transparency about China’s price support programs. China has in the past made such information
available in domestic support notifications only with long time lags.
China’s utilization of a cap on procurements to define eligible production breaks the
correspondence of the quantity variable in the AoA legal assessment of MPS and the economic
measurement of MPS. China’s decision to utilize such announced caps to limit eligible production of
wheat and rice below total production in the provinces and regions in which the support program operates
thus weakens the constraint the panel decisions otherwise impose on China’s economic support. China
can choose a combination of AAP and a cap on procurements anywhere on a compliance level curve
where the combination meets the product’s AMS limit.
For the range of AAPs applied since 2012, China can set the caps well above actual procurements
that have been made at those prices, except in the case of Japonica rice in some years. Thus, only modest
constraint is placed by the outcome of the dispute China ‒ Agricultural Producers on China’s levels of
AAPs and, through this constraint, on its levels of economic MPS. This modest outcome is analogous to
the manner in which BTAMS have generally proven to have placed only loose constraints on the AMS
support provided by WTO members, as described in Section 4. It is, nonetheless, a legal constraint
clarified by a dispute ruling ‒ on the compliance level curve an AAP can be raised only if the cap on
procurements is reduced.
Moreover, facing this constraint creates a disincentive for China to provide other AMS subsidies
to wheat and rice, especially if the authorities seek to maintain some latitude between announced caps on
quantities eligible to be procured and actual procurements and between the expected level of AMS at the
cap and its limit. In 2016, China eliminated the crop subsidies it had provided during 2012-15, leaving
more room for MPS within its AMS limits.
6.2.3 China ‒ Agricultural Producers: Panel findings for corn
In its assessment of China’s corn support program the panel agreed with the United States that
MPS for corn during 2012-15 was an issue in the dispute but agreed with China that announcement of
support prices for corn had expired in 2016. The panel reasoned that a domestic support program can be
challenged in dispute settlement even after it has lapsed. The panel did not, however, evaluate corn MPS
during 2012-15. After concluding that corn price support had expired, the panel considered whether a
ruling on corn MPS was nevertheless required in the dispute but found this was not so. The panel
indicated that a significant drop in producer prices of corn in China in 2016 helped it reach its conclusions
and that it found no compelling evidence that a corn price support program would be reintroduced.
72
The OECD PSE indicates that China’s domestic corn prices at the farm level fell by 18.3%
between 2015 and 2016 and economic %MPS fell from 26.7% to 17.6% (OECD 2019).49 This is
consistent with the panel’s assessment. Subsequently, corn prices in China moved upward with rising
international reference border prices and economic %MPS remained around 17% in 2017 and 2018. This
indicates that border measures have allowed China to sustain corn prices above international levels in the
absence of administered prices. The panel considered this possibility and concluded that its determination
was not whether domestic prices were free of any government intervention but more narrowly whether
there was a price support program with an administered price resulting in MPS in excess of China’s limit.
6.2.4 Post-dispute policy
If China continues to finds ways to keep domestic prices for grains above corresponding world
price levels while meeting its AMS obligations, then US and other exporters will have a keen interest in
China providing the low-tariff access opportunities that it agreed to in its accession commitments on TRQ
levels in conjunction with its obligations on TRQ administration. This would create opportunities for
increased exports of wheat, rice and corn to China given the outcome of the China ‒ TRQs dispute that
China had failed to ensure that its administration of TRQs would not inhibit the filling of each TRQ.
With higher imports, maintaining AAPs for wheat and rice at any given level becomes more difficult and
China might choose to meet its AMS commitments through further support price reductions. These are
important outcomes in terms of using WTO dispute settlement to ensure that members fulfill their
obligations.
Whether the United States or other exporters draw benefits from such opportunities may be
overshadowed by resolution of the larger trade frictions that arose between the United States and China in
the period in which the China ‒ Agricultural Producers and China ‒ TRQs disputes were being
adjudicated. As previously noted, the United States initiated a new dimension of trade controversy in
2017 by imposing substantial new tariffs on imports from China under US trade laws that had rarely been
applied since the WTO was established in 1995 (Orden 2020). This led to escalating bilateral tariffs being
imposed by the United States and China and challenges to these tariffs at the WTO. Under a bilateral
trade agreement signed in January 2020, China committed to expanding its imports of agricultural
products from the United States to levels well above previous years (USTR 2020; Orden 2020).
If China allows over-quota imports of grains at the in-quota tariff rate, import quantities
consistent with the January 2020 agreement could be larger than the maximum quantities China would
import after bringing its measures into conformity with its obligations as determined in the China ‒
Agricultural Producers and China ‒ TRQs disputes. However, reportedly China did not agree to increase
its wheat, rice or corn import quantities at in-quota tariffs above the TRQ quantities. In that case, China’s
total levels of imports of these grains from the United States and elsewhere in the coming years will
depend on the policy changes China undertakes to come into compliance with the WTO dispute
outcomes.
6.3 India’s AMSs for wheat, rice, cotton and sugarcane
India is the second large agricultural producer for which members have challenged its recent
levels of domestic support. Members have submitted counter-notifications for four products and a product
group and initiated disputes about India’s AMS support for sugarcane, as shown in Table 5.2 and
49 Earlier preliminary estimates by OECD showed a sharper drop in domestic prices and economic %MPS after 2015
(%MPS down to only 5.4% in 2017) as replicated in Orden and Brink (2018) and Brink et al. (2019).

73
Table 5.3. This sub-section assesses alternative measurements of India’s MPS for four products subject to
counter-notifications: wheat, rice, cotton and sugarcane. For wheat and rice, the ministerial decision on
public stockholding for food security purposes may preclude a dispute challenge of India’s MPS. For
sugarcane, at time of this writing Australia’s counter-notification and its first written submission to the
dispute panel provide information about the issue being raised.
6.3.1 Context of counter-notifications and India ‒ Measures Concerning Sugar and Sugarcane
The economic context for the counter-notifications on India’s MPS for wheat, rice and cotton
differs from that of the recent dispute about MPS in China for wheat, rice and corn, while the economic
context for sugarcane is similar. Differences in economic context are important for understanding the role
the AoA measurement and commitments on domestic support can have in limiting economic support.
Specifically, China provided substantial positive economic MPS for wheat, rice and corn during 2012-15
as calculated by OECD and described above. In contrast, India provided negative economic MPS for
wheat, rice and cotton as calculated by OECD throughout the 14-year period 2005-18, which includes
years before, during and after the periods covered in the counter-notifications.
The evolution of economic MPS as estimated by OECD is similar for wheat and rice in India
(Figure 6.2). Economic %MPS averaged -47.2% for wheat and -30.4% for rice during 2010-13 for which
the United States has submitted a counter-notification. India’s producer prices for both wheat and rice
were kept well below the border prices (adjusted to farm-gate level) during the years when international
prices rose sharply in the late 2000s and early 2010s (the figure shows only the resultant %MPS levels).
The border prices then remained higher than they had been before the international price increases, but
India’s producer prices increased to largely close the gap and MPS became less severely negative ‒ it
temporarily turned positive for wheat in 2016 and averaged above -10.0% for rice during 2014-18. For
cotton, economic MPS was negative throughout 2010-18. Disprotection that averaged -22.9% for the two
years 2010 and 2011 resulted from the border price rising sharply in 2010.
Economic MPS as estimated by OECD for sugar is positive, in contrast to the negative economic
MPS for wheat, rice and cotton. Evaluating farm-level support on a refined sugar basis, OECD estimates
positive MPS starting in 2012 and increasing sharply in 2017 and 2018. This may explain why a dispute
has been initiated for sugarcane. The counter-notifications provide a basis for discussion in the CoA and
can highlight trends towards possible positive future economic MPS for wheat, rice and cotton.
Dispute outcomes over WTO compliance for sugarcane may result in policy changes involving
the use of administered prices and the quantities eligible for those prices. If the panel report recommends
that India make policy changes it resists making, an assessment of the possible changes will need to
consider India’s strategy regarding any appeal of the panel findings. The absence of a functioning
Appellate Body has made the choices open to members in such a situation difficult to foresee.
6.3.2 Alternative measurements of India’s market price support
India’s MPS calculations and those in the counter-notifications by the United States (wheat, rice,
cotton), Australia, Canada and the United States (pulses) and Australia (sugarcane) differ in two
fundamental ways.50 First, India uses annual procured quantities as eligible production to calculate MPS, 50 India has been tardy in submitting notifications but has more recently provided more timely information. It
submitted notifications for marketing years 2004 to 2010 on 10 September 2014, for 2011 to 2013 on 13 July 2017,
for 2014 and 2015 on 1 May 2018, for 2016 on 20 July 2018, for 2017 on 29 March 2019, and for 2018 on 30 March
2020. The United States’ counter-notification on India’s support for rice and wheat from 2010 through 2013 was
circulated on 9 May 2018 (days after, but not addressing, India’s notification for 2014 and 2015).
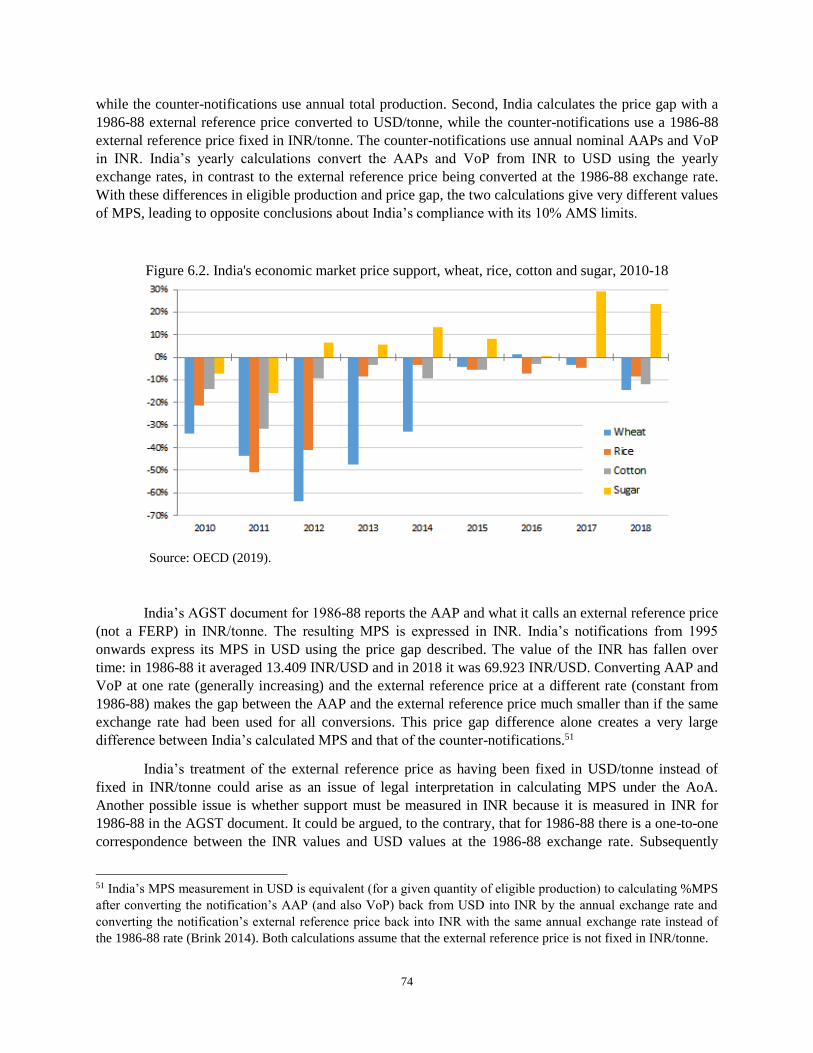
74
while the counter-notifications use annual total production. Second, India calculates the price gap with a
1986-88 external reference price converted to USD/tonne, while the counter-notifications use a 1986-88
external reference price fixed in INR/tonne. The counter-notifications use annual nominal AAPs and VoP
in INR. India’s yearly calculations convert the AAPs and VoP from INR to USD using the yearly
exchange rates, in contrast to the external reference price being converted at the 1986-88 exchange rate.
With these differences in eligible production and price gap, the two calculations give very different values
of MPS, leading to opposite conclusions about India’s compliance with its 10% AMS limits.
Figure 6.2. India's economic market price support, wheat, rice, cotton and sugar, 2010-18
Source: OECD (2019).
India’s AGST document for 1986-88 reports the AAP and what it calls an external reference price
(not a FERP) in INR/tonne. The resulting MPS is expressed in INR. India’s notifications from 1995
onwards express its MPS in USD using the price gap described. The value of the INR has fallen over
time: in 1986-88 it averaged 13.409 INR/USD and in 2018 it was 69.923 INR/USD. Converting AAP and
VoP at one rate (generally increasing) and the external reference price at a different rate (constant from
1986-88) makes the gap between the AAP and the external reference price much smaller than if the same
exchange rate had been used for all conversions. This price gap difference alone creates a very large
difference between India’s calculated MPS and that of the counter-notifications.51
India’s treatment of the external reference price as having been fixed in USD/tonne instead of
fixed in INR/tonne could arise as an issue of legal interpretation in calculating MPS under the AoA.
Another possible issue is whether support must be measured in INR because it is measured in INR for
1986-88 in the AGST document. It could be argued, to the contrary, that for 1986-88 there is a one-to-one
correspondence between the INR values and USD values at the 1986-88 exchange rate. Subsequently
51 India’s MPS measurement in USD is equivalent (for a given quantity of eligible production) to calculating %MPS
after converting the notification’s AAP (and also VoP) back from USD into INR by the annual exchange rate and
converting the notification’s external reference price back into INR with the same annual exchange rate instead of
the 1986-88 rate (Brink 2014). Both calculations assume that the external reference price is not fixed in INR/tonne.
75
using the 1986-88 exchange rate for one of the elements in calculating a current price gap could be argued
to be a way of taking India’s constituent data and methodology into account. There has been no dispute
panel ruling on this question.
However a panel might rule on the proper measurement of India’s MPS, India’s conversions of
AAP and VoP from INR to USD at yearly exchange rates can be interpreted as incorporating three
adjustment components compared to the 1986-88 period. First, the conversions adjust for the inflation
occurring in India after 1986-88 to the extent it is offset by an exactly corresponding depreciation of the
INR.52 This means the calculated MPS does not increase by AAPs being raised simply in line with
inflation in India. Second, inflation also occurs in the United States and, if the INR/USD exchange rate
adjusts in purchasing power parity terms, its increase reflects the excess of rates of inflation in India
compared to the United States, not the full extent of inflation in India. Finally, an exchange rate change
deviates from a pure monetary adjustment, whether real (inflation adjusted) appreciation or depreciation.
This real exchange rate movement compared to the real 1986-88 exchange rate is also incorporated in the
AAPs and VoP when they are converted from INR to USD at yearly exchange rates. None of these
adjustment components applies to the external reference price when it stays converted at the 1986-88
exchange rate also in later years.
In addition to the differences between India and some members about eligible production and
currency conversions, differences arise about the products for which to calculate MPS and some of the
technical conversions factors between unprocessed and processed products. The product coverage issue
arises for sugarcane. India calculates MPS only for products and years where government agencies buy an
agricultural product from producers. Indian sugar mills, not government agencies, buy sugarcane from
producers subject to government-set minimum prices. Because a government agency is not the buyer of
sugarcane, India argues that the quantity of sugarcane eligible to receive the AAP is nil and therefore does
not calculate sugarcane MPS. The fact that the government sometimes subsidizes the payment of arrears
when sugar mills fail to pay the support prices does not negate this stance. In contrast, Australia asserts
that the government-set price for sugarcane is an administered price and calculates MPS. There may also
be differing views regarding the significant quantities of sugarcane that are not bought by sugar mills but
are used to produce sweeteners through other processes than sugar milling.
Similarly, India has not notified MPS for cotton in 2010 or 2016 because there were no
procurements in those years, whereas the United States contends MPS was provided. An issue of different
conversion factors arises in calculating cotton MPS, where India uses a lower seed cotton-to-lint
conversion factor than the United States. Conversion factor issues may also arise in evaluating sugarcane
support in dispute settlement.
India’s %MPS calculated in the notifications and counter-notifications for wheat, rice, cotton and
sugarcane, and in Australia’s first submission to the sugarcane dispute panel, are assessed below. The
comparison for wheat and rice is extended with calculations for 2014-17 similar to the US counter-
notifications.
Our first two measurements compare the %MPS for wheat, rice and cotton as notified by India
(external reference price fixed in USD/tonne; administered prices and VoP in USD using annual exchange
rates; eligible production equal to procurement) and counter-notified by the United States (external
52 The Annex 3 rules on calculating AMS are silent on any adjustment for inflation. Some members interpret the
responsibility given by Art. 18.4 to members in the CoA review process to give due consideration to the influence of
excessive rates inflation as permission for a member to unilaterally adjust for all inflation in calculating AMSs.
76
reference price fixed in INR/tonne; administered prices and VoP in INR; eligible production equal to total
production). Since India does not notify any procured quantities or MPS for sugarcane, only Australia’s
counter-notified and first-submission %MPS are presented. VoP for calculating %MPS are generally
those India has reported to the CoA.
We also consider two alternative measurements. The first of these calculates MPS using the price
gap notified by India and total production as eligible production. It combines the panel reasoning of the
China ‒ Agricultural Producers dispute regarding eligible production when no maximum procurement
levels are announced with an assumption, on an untested issue, that India’s currency conversions to
USD/tonne are consistent with the AoA. India’s USD price gap for wheat is small enough, even with total
production as eligible production, to keep India’s %MPS below 10% of VoP. This is not the case for rice.
The outcomes for cotton depend on the seed cotton-to-lint conversion factor. The sugarcane %MPS,
measured using the kind of price gap India notifies for other crops and with total production as eligible
production, exceeds 10% of VoP in all years.
The second alternative measurement includes an adjustment to offset the effect of inflation in
India by expressing AAP, FERP and VoP in INR and deflating the nominal AAPs and VoP using an
indicator of India’s overall price level since 1986-88 (this analysis is independent of whether or not Art.
18.4 allows a member to unilaterally adjust for excessive inflation). The interpretation is that increases in
AAP that support the price of a product in constant terms compared to other prices in the economy would
not increase the measured MPS. India’s measurement of MPS in USD encompasses this adjustment (the
first of the three adjustments discussed above) as offset by US inflation and adjustment for changes in the
real exchange rate. Neither of these measurements adjusts MPS for changes in the relative price of the
product compared to other goods in world markets.
The deflation adjustment results in negative %MPS for wheat for all years and for rice until 2014.
The outcome for cotton again depends on the conversion factor, while the %MPS for sugarcane remains
positive and exceeds 10% of VoP even with the deflation adjustment. Deflation adjustment of the AAP is
the only one among our adjusted MPS measurements that generally for wheat, rice and cotton (depending
on the conversion factor) yields an MPS with the same sign, although different magnitude, as the OECD
economic MPS. This result highlights the significant effect inflation has on %MPS in the US counter-
notification for wheat, rice and cotton. Results are presented in Table 6.4 and discussed by crop, in the
order of wheat, rice, cotton and sugarcane.
6.3.2.1 Wheat
India’s notified measurement results in negative %MPS between 2010 and 2017 for wheat in the
range -0.7% to -3.9% except for positive values of 0.5% in 2011 and 0.6% in 2017 (row W1, Table 6.4).
With total production as eligible production and the price gap as measured by India, negative %MPSs fall
further to a range of -2.8% to -14.6%, while the positive %MPSs rise to 1.6% and 1.9%, respectively,
well below India’s limit (row W4). Reductions of AAPs or caps on eligible production are not required
for India’s notified MPS or this alternative MPS measurement for wheat to comply with its 10% limit.
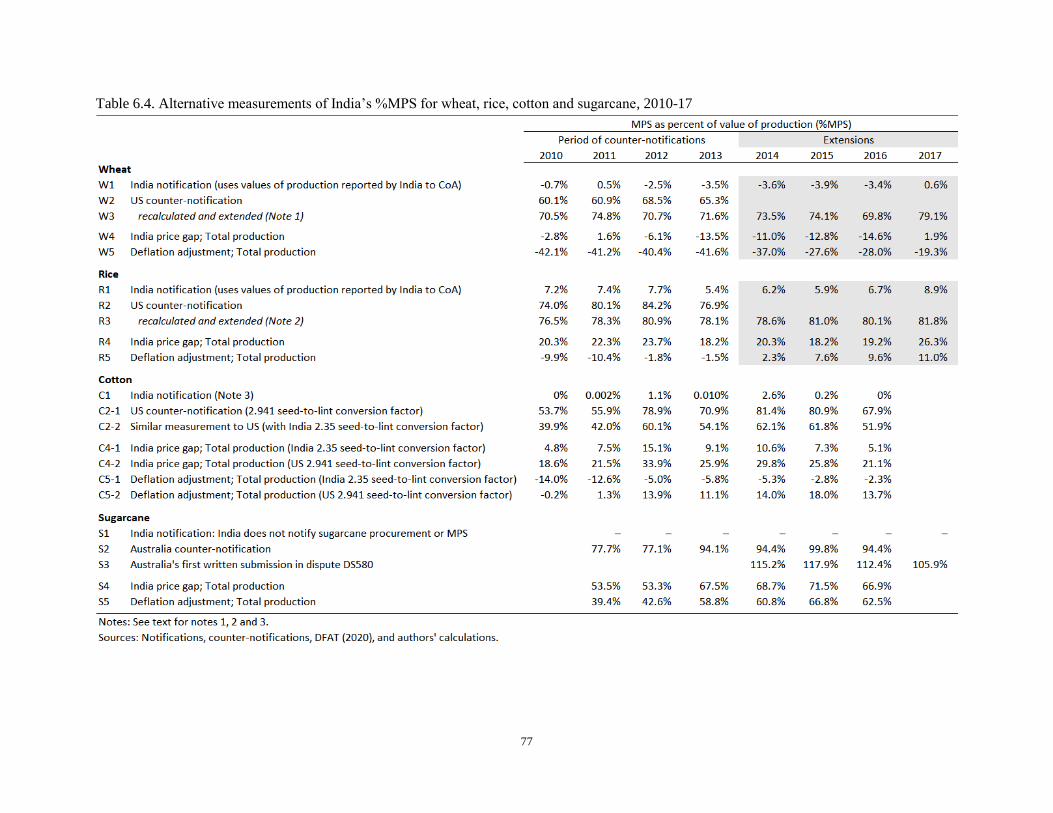
77
Table 6.4. Alternative measurements of India’s %MPS for wheat, rice, cotton and sugarcane, 2010-17
78
In contrast, the US calculation leads to %MPS in the range of 60.1% to 68.5% (row W2).
Recalculating and extending the US type measurement results in %MPS ranging from 69.8% to 79.1%
(row W3).53 At these levels of %MPS, bringing %MPS within 10% of VOP would have required sharp
reductions in AAPs in the range of 60% to 70%. Alternatively, with past AAPs retained India potentially
could have been in compliance if it had established caps on the quantities to be procured at administered
prices at about 15% of total production. India’s wheat procurements have ranged around 25%-40% of
production. If a cap on procurement were to define eligible production at past AAPs, the cap would need
to reduce procurements at administered prices by about half to comply with India’s 10% limit.54
Finally, the deflation adjustment with total production as eligible production results in substantial
negative %MPS for wheat in the range of -42.1% in 2010 rising to -19.3% in 2017 (row W5). Were this
measurement applied, India’s would not face an issue of AMS exceeding its limit.
In the case of the dispute China ‒ Agricultural Producers, the AAPs supported domestic market
prices in the dispute years at levels above the corresponding current border prices. For India, the domestic
prices for wheat also track its AAPs. This suggests the AAPs underpin the domestic prices even though
the AAPs and domestic prices are below the border prices. In the Indian context, lowering the AAPs, or
capping the quantity of production eligible to be procured at administered prices below past
procurements, as would be required to bring India’s MPS measured in the US counter-notification within
the 10% AMS limits, could exacerbate disprotection of farmers. A variety of policies keep India’s wheat
prices below the border prices (OECD/ICRIER 2018). Modifying those policies could benefit farmers
without raising AAPs.
6.3.2.2 Rice
India notifies support for rice at the milled processing level while the US counter-notifies for rice
at the unmilled level. The issue that arose in the China ‒ Agricultural Producers dispute about the
unmilled-to-milled price conversion factor is not an issue in the discussion of India’s rice MPS. India and
the United States express the AAP, external reference price and eligible production in internally
consistent terms. They use a 1.5 unmilled-to-milled conversion factor for both price (unmilled price
equals milled price divided by 1.5) and quantity (unmilled quantity equals 1.5 times milled quantity). Our
recalculations express prices and quantities on equivalent basis using this conversion factor.55
53 In our recalculation, India’s notified AAPs in USD are converted to INR at exchange rates notified by India. They
exceed the US counter-notified AAPs for states without bonuses and give slightly higher %MPS in the overlapping
years than the US counter-notifications including the bonuses. Larger effects that raise the recalculated and extended
US-type %MPS compared to the US counter-notification stem from different annual production quantities reported
by India and the US. India's notified production quantities match OECD for corresponding years (e.g., India reported
for 2010-11 matches OECD for 2010), while the US counter-notification uses the same production quantities but
lagged one year (e.g., inexplicably the US counter-notified production quantity for 2010-11 matches the quantity
notified by India and OECD for 2009). We used the production quantities reported by India and OECD in the
recalculation. Except in 2012 this results in higher quantities of production than in the US counter-notifications.
India nonetheless reports slightly lower VoP than the US in 2010-13 which also raises the recalculated %MPS
compared to the US counter-notifications.
54 Again, neither the AAP reductions needed to meet the 10% limit nor the past procurements and the required
procurement caps are shown in Table 6.4 but are available on request.
55 In the recalculations, India AAPs in USD for milled rice are converted to INR for unmilled at exchange rates
notified by India using the 1.5 unmilled-to-milled conversion used by India and the US. The recalculated AAPS
match AAPs for states without bonuses reported by the US for 2010-13. Bonuses add 1-2 percentage points to US
79
India’s notified %MPS for rice are positive but below 10% in all years 2010 through 2017 (row
R1, Table 6.4). By this measurement, India has modest room to raise AAPs for rice or increase
procurements while remaining within its 10% limit in these years. With a higher AAP and increased
procurements, in its notification for 2018 India acknowledged that its %MPS for rice was 11.5% (not
shown in Table 6.4) which exceeded the 10% AMS limit (WTO 2020k). India acknowledged this
violation and invoked shelter against dispute challenges under the ministerial decision on public
stockholding for food security purposes (discussed in Section 3).
In contrast to India’s calculation of %MPS, the US calculation leads to %MPS at or exceeding
74% in all four years (row R2). Recalculating and extending the US type measurement through 2017
results in %MPS above 75% in all years (row R3). Sharp reductions in AAPs in the range of 65% to 75%
would have been needed for %MPS to remain within 10% for rice. Retaining past AAPs and capping the
rice quantities procured at administered prices at less than 15% of total production could have been an
alternative, similar to wheat. India’s rice procurements have ranged around 30%-35% of production, so if
a cap on procurement at administered prices were to define eligible production, such a cap would again
require reducing procurements at administered prices by about half to ensure compliance with the limit.
Applying India’s price gap in USD to total rice production instead of procured quantities gives
%MPSs in the range of 18.2% to 26.3% (row R4). That is, fixing the external reference price in
USD/tonne and converting AAPs and VoP at a different exchange rate, combined with total production as
eligible production, generates MPSs in excess of the 10% limit. Again, to stay within 10%, India would
have had to lower AAPs or cap the quantities it would procure at past AAPs. Reductions of AAPs ranging
from 8.7% lower in 2013 to 16.9% lower in 2017 would have been required. Caps on eligible production
would have had to be in the range of 54.9% of total production in 2013 down to 38.0% in 2017, which
would not have constrained India’s past procurement levels but would preclude their expansion.
Measuring rice %MPS with deflation adjustment and total production as eligible production
results in negative %MPS through 2013, but it turns to positive 11.0% by 2017 (row R5). Thus even with
deflation adjustment India would not in this case have had room within its 10% limit to raise recent AAPs
for rice fully in step with its rate of inflation. Similar to wheat, India’s domestic market prices for rice
generally track its AAPs suggesting the AAPs are underpinning the domestic market prices. When
measuring MPS as in the US counter-notification, lowering the AAPs or capping procurement to the
extent needed for %MPS to stay within 10% might exacerbate disprotection of rice farmers given the
presence of other price-suppressing policies.
6.3.2.3 Cotton
India measures MPS at the lint processed level while the United States counter-notifies at the
unprocessed seed cotton level, indicating disagreement over what constitutes a basic agricultural product
as defined in Art. 1(b) with respect to measuring an AMS. There is also disagreement about the
appropriate conversion factor for prices and quantities, as there was for the price conversion for rice in the
China dispute, but not about the cotton VoP.56 India uses a seed cotton-to-lint conversion of 2.35, while
the United States argues for a higher conversion factor of 2.941. This coefficient is the tonnes of seed
reported %MPSs. Production quantities reported by India to the CoA, by OECD and by the US are the same when
expressed at the same processing level. The US VoP is similar (within 5% all four years) to the values reported by
India which are used in the recalculation.
56 India has reported cotton VoP for 2011-12 through 2015-16 and 2017-18. US counter notifications report similar
VoP (when expressed in common currency) and are used for missing years 2010-11 and 2016-17.
80
cotton required to produce one tonne of cotton lint. A higher factor means a lower yield of lint from seed
cotton, by weight, in the ginning process. The consequence is that from its support price for seed cotton,
India computes a lower AAP and a smaller MPS for lint than if the US conversion factor were used
(conversely the United States calculates a larger MPS than with India’s conversion factor). Determining
the appropriate conversion factor could be a task for the panel in a WTO dispute, and the size of the factor
could determine the outcome of its compliance assessment. The conversion factors used by India and the
United States in the notifications and counter-notification span the conversion factor of 2.439 which one
government institution in India uses (Government of India 2018).
India’s notified %MPSs for cotton are positive but less than 3% in all years (row C1, Table 6.4),
reaching a maximum of 2.6% in 2014. This derives from procurements of less than 3% of total production
except in 2012 and 2014 when procurements were 7.6% and 25.0%, respectively. The US counter-
notified %MPS ranges from 53.7% to 81.4% of VoP (row C2-1). The %MPSs calculated by the United
States imply that reductions of AAPs in the range of 63% to 74% lower would have been required to
bring India’s %MPS within the 10% limit. Alternatively, caps on eligible production would have had to
be between 18.6% of total production in 2010 and 12.3% in 2014. Except in 2014 these caps would not
have constrained India’s procurements at administered prices.
Because the cotton counter-notification covers recent years, we have not recalculated or extended
the calculations. However, the effect of the difference between the conversion factors of India and the
United States is noticeable for cotton. When the US type measurement of MPS is recalculated with
India’s lower conversion factor, the %MPSs range from 39.9% to 62.1% (row C2-2). Less reduction of
the past AAPs, or higher caps on eligible production, would thus, with the lower conversion factor, have
been adequate to bring past %MPS within the 10% AMS limit.
Multiplying India’s USD price gap by total production makes %MPS exceed the 10% limit in two
of seven years with India’s lower conversion factor (row C4-1), and in all years with the US higher
conversion factor (row C4-2). With the lower factor, to bring %MPS within 10% in the two years when it
is exceeded under this measurement would have required lowering AAPs by 6.8% in 2012 and by 0.7% in
2014. With the higher factor, reductions of AAPs in all years would have been required, ranging from
12.5% in 2010 to 25.6% in 2013. In the case of capping eligible production to bring %MPS within 10%,
the cap would be large enough to exceed India’s procurements with MPS measured using either
conversion factor. Finally, the deflation measurement results in negative estimated cotton %MPS in all
years with India’s lower conversion factor, but positive %MPS exceeding 10% in the years 2012 through
2016 with the higher US conversion factor.
6.3.2.4 Sugarcane
Arguing there is no procurement by government, India has not notified any MPS for sugarcane
since doing so in 1995. Australia’s counter-notification argues that India provides MPS through its
sugarcane price support program and calculates support levels using AAP, FERP and VoP in INR/tonne
and total production as eligible production (WTO 2018i). This gives a %MPS between 77.1% and 99.8%
in the 2011 to 2016 period (row S2). These levels of %MPS imply that reductions of AAPs ranging
between 77% and 84% would have been required to bring %MPS within the 10% AMS limit. Reductions
of these magnitudes would bring AAPs below border prices, precluding any economic MPS through the
price support program. Without acknowledged procurements, the alternative of capping eligible
production would not be an option.
Brazil, Australia and Guatemala initiated disputes over India ‒ Measures Concerning Sugar and
Sugarcane in early 2019, numbered DS579, DS580 and DS581, respectively, followed in July by requests
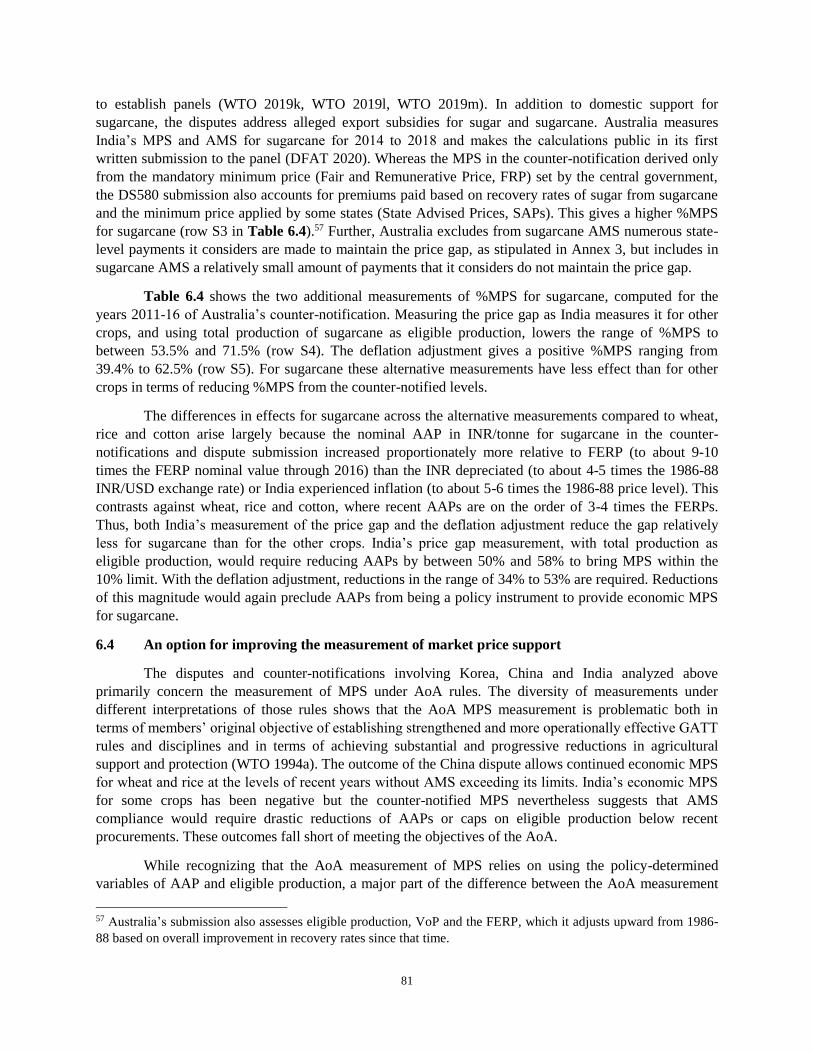
81
to establish panels (WTO 2019k, WTO 2019l, WTO 2019m). In addition to domestic support for
sugarcane, the disputes address alleged export subsidies for sugar and sugarcane. Australia measures
India’s MPS and AMS for sugarcane for 2014 to 2018 and makes the calculations public in its first
written submission to the panel (DFAT 2020). Whereas the MPS in the counter-notification derived only
from the mandatory minimum price (Fair and Remunerative Price, FRP) set by the central government,
the DS580 submission also accounts for premiums paid based on recovery rates of sugar from sugarcane
and the minimum price applied by some states (State Advised Prices, SAPs). This gives a higher %MPS
for sugarcane (row S3 in Table 6.4).57 Further, Australia excludes from sugarcane AMS numerous state-
level payments it considers are made to maintain the price gap, as stipulated in Annex 3, but includes in
sugarcane AMS a relatively small amount of payments that it considers do not maintain the price gap.
Table 6.4 shows the two additional measurements of %MPS for sugarcane, computed for the
years 2011-16 of Australia’s counter-notification. Measuring the price gap as India measures it for other
crops, and using total production of sugarcane as eligible production, lowers the range of %MPS to
between 53.5% and 71.5% (row S4). The deflation adjustment gives a positive %MPS ranging from
39.4% to 62.5% (row S5). For sugarcane these alternative measurements have less effect than for other
crops in terms of reducing %MPS from the counter-notified levels.
The differences in effects for sugarcane across the alternative measurements compared to wheat,
rice and cotton arise largely because the nominal AAP in INR/tonne for sugarcane in the counter-
notifications and dispute submission increased proportionately more relative to FERP (to about 9-10
times the FERP nominal value through 2016) than the INR depreciated (to about 4-5 times the 1986-88
INR/USD exchange rate) or India experienced inflation (to about 5-6 times the 1986-88 price level). This
contrasts against wheat, rice and cotton, where recent AAPs are on the order of 3-4 times the FERPs.
Thus, both India’s measurement of the price gap and the deflation adjustment reduce the gap relatively
less for sugarcane than for the other crops. India’s price gap measurement, with total production as
eligible production, would require reducing AAPs by between 50% and 58% to bring MPS within the
10% limit. With the deflation adjustment, reductions in the range of 34% to 53% are required. Reductions
of this magnitude would again preclude AAPs from being a policy instrument to provide economic MPS
for sugarcane.
6.4 An option for improving the measurement of market price support
The disputes and counter-notifications involving Korea, China and India analyzed above
primarily concern the measurement of MPS under AoA rules. The diversity of measurements under
different interpretations of those rules shows that the AoA MPS measurement is problematic both in
terms of members’ original objective of establishing strengthened and more operationally effective GATT
rules and disciplines and in terms of achieving substantial and progressive reductions in agricultural
support and protection (WTO 1994a). The outcome of the China dispute allows continued economic MPS
for wheat and rice at the levels of recent years without AMS exceeding its limits. India’s economic MPS
for some crops has been negative but the counter-notified MPS nevertheless suggests that AMS
compliance would require drastic reductions of AAPs or caps on eligible production below recent
procurements. These outcomes fall short of meeting the objectives of the AoA.
While recognizing that the AoA measurement of MPS relies on using the policy-determined
variables of AAP and eligible production, a major part of the difference between the AoA measurement
57 Australia’s submission also assesses eligible production, VoP and the FERP, which it adjusts upward from 1986-
88 based on overall improvement in recovery rates since that time.
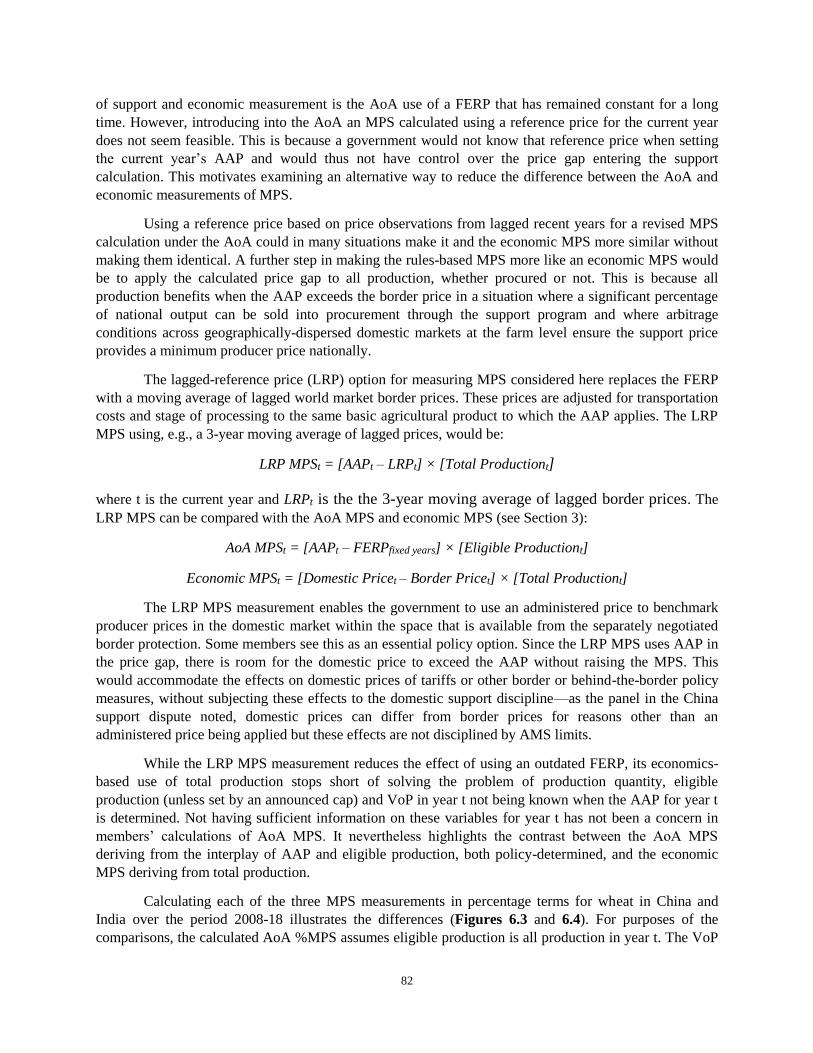
82
of support and economic measurement is the AoA use of a FERP that has remained constant for a long
time. However, introducing into the AoA an MPS calculated using a reference price for the current year
does not seem feasible. This is because a government would not know that reference price when setting
the current year’s AAP and would thus not have control over the price gap entering the support
calculation. This motivates examining an alternative way to reduce the difference between the AoA and
economic measurements of MPS.
Using a reference price based on price observations from lagged recent years for a revised MPS
calculation under the AoA could in many situations make it and the economic MPS more similar without
making them identical. A further step in making the rules-based MPS more like an economic MPS would
be to apply the calculated price gap to all production, whether procured or not. This is because all
production benefits when the AAP exceeds the border price in a situation where a significant percentage
of national output can be sold into procurement through the support program and where arbitrage
conditions across geographically-dispersed domestic markets at the farm level ensure the support price
provides a minimum producer price nationally.
The lagged-reference price (LRP) option for measuring MPS considered here replaces the FERP
with a moving average of lagged world market border prices. These prices are adjusted for transportation
costs and stage of processing to the same basic agricultural product to which the AAP applies. The LRP
MPS using, e.g., a 3-year moving average of lagged prices, would be:
LRP MPSt = [AAPt – LRPt] × [Total Productiont]
where t is the current year and LRPt is the the 3-year moving average of lagged border prices. The
LRP MPS can be compared with the AoA MPS and economic MPS (see Section 3):
AoA MPSt = [AAPt – FERPfixed years] × [Eligible Productiont]
Economic MPSt = [Domestic Pricet – Border Pricet] × [Total Productiont]
The LRP MPS measurement enables the government to use an administered price to benchmark
producer prices in the domestic market within the space that is available from the separately negotiated
border protection. Some members see this as an essential policy option. Since the LRP MPS uses AAP in
the price gap, there is room for the domestic price to exceed the AAP without raising the MPS. This
would accommodate the effects on domestic prices of tariffs or other border or behind-the-border policy
measures, without subjecting these effects to the domestic support discipline—as the panel in the China
support dispute noted, domestic prices can differ from border prices for reasons other than an
administered price being applied but these effects are not disciplined by AMS limits.
While the LRP MPS measurement reduces the effect of using an outdated FERP, its economics-
based use of total production stops short of solving the problem of production quantity, eligible
production (unless set by an announced cap) and VoP in year t not being known when the AAP for year t
is determined. Not having sufficient information on these variables for year t has not been a concern in
members’ calculations of AoA MPS. It nevertheless highlights the contrast between the AoA MPS
deriving from the interplay of AAP and eligible production, both policy-determined, and the economic
MPS deriving from total production.
Calculating each of the three MPS measurements in percentage terms for wheat in China and
India over the period 2008-18 illustrates the differences (Figures 6.3 and 6.4). For purposes of the
comparisons, the calculated AoA %MPS assumes eligible production is all production in year t. The VoP
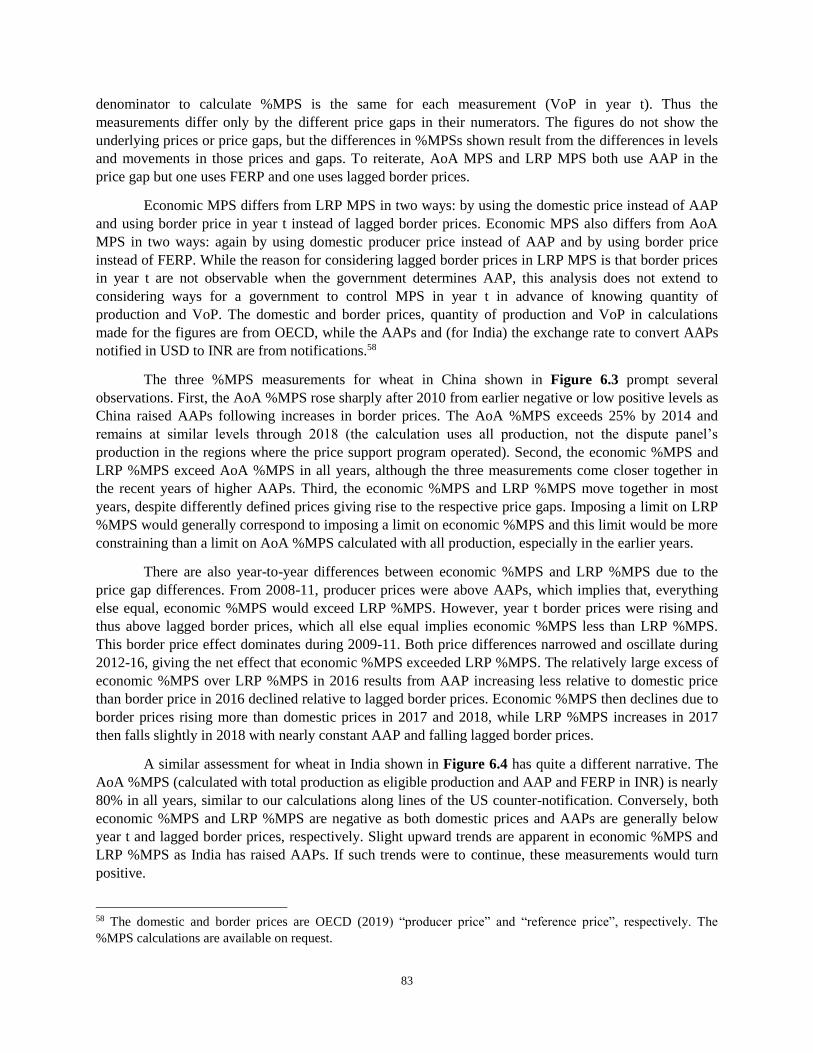
83
denominator to calculate %MPS is the same for each measurement (VoP in year t). Thus the
measurements differ only by the different price gaps in their numerators. The figures do not show the
underlying prices or price gaps, but the differences in %MPSs shown result from the differences in levels
and movements in those prices and gaps. To reiterate, AoA MPS and LRP MPS both use AAP in the
price gap but one uses FERP and one uses lagged border prices.
Economic MPS differs from LRP MPS in two ways: by using the domestic price instead of AAP
and using border price in year t instead of lagged border prices. Economic MPS also differs from AoA
MPS in two ways: again by using domestic producer price instead of AAP and by using border price
instead of FERP. While the reason for considering lagged border prices in LRP MPS is that border prices
in year t are not observable when the government determines AAP, this analysis does not extend to
considering ways for a government to control MPS in year t in advance of knowing quantity of
production and VoP. The domestic and border prices, quantity of production and VoP in calculations
made for the figures are from OECD, while the AAPs and (for India) the exchange rate to convert AAPs
notified in USD to INR are from notifications.58
The three %MPS measurements for wheat in China shown in Figure 6.3 prompt several
observations. First, the AoA %MPS rose sharply after 2010 from earlier negative or low positive levels as
China raised AAPs following increases in border prices. The AoA %MPS exceeds 25% by 2014 and
remains at similar levels through 2018 (the calculation uses all production, not the dispute panel’s
production in the regions where the price support program operated). Second, the economic %MPS and
LRP %MPS exceed AoA %MPS in all years, although the three measurements come closer together in
the recent years of higher AAPs. Third, the economic %MPS and LRP %MPS move together in most
years, despite differently defined prices giving rise to the respective price gaps. Imposing a limit on LRP
%MPS would generally correspond to imposing a limit on economic %MPS and this limit would be more
constraining than a limit on AoA %MPS calculated with all production, especially in the earlier years.
There are also year-to-year differences between economic %MPS and LRP %MPS due to the
price gap differences. From 2008-11, producer prices were above AAPs, which implies that, everything
else equal, economic %MPS would exceed LRP %MPS. However, year t border prices were rising and
thus above lagged border prices, which all else equal implies economic %MPS less than LRP %MPS.
This border price effect dominates during 2009-11. Both price differences narrowed and oscillate during
2012-16, giving the net effect that economic %MPS exceeded LRP %MPS. The relatively large excess of
economic %MPS over LRP %MPS in 2016 results from AAP increasing less relative to domestic price
than border price in 2016 declined relative to lagged border prices. Economic %MPS then declines due to
border prices rising more than domestic prices in 2017 and 2018, while LRP %MPS increases in 2017
then falls slightly in 2018 with nearly constant AAP and falling lagged border prices.
A similar assessment for wheat in India shown in Figure 6.4 has quite a different narrative. The
AoA %MPS (calculated with total production as eligible production and AAP and FERP in INR) is nearly
80% in all years, similar to our calculations along lines of the US counter-notification. Conversely, both
economic %MPS and LRP %MPS are negative as both domestic prices and AAPs are generally below
year t and lagged border prices, respectively. Slight upward trends are apparent in economic %MPS and
LRP %MPS as India has raised AAPs. If such trends were to continue, these measurements would turn
positive.
58 The domestic and border prices are OECD (2019) “producer price” and “reference price”, respectively. The
%MPS calculations are available on request.
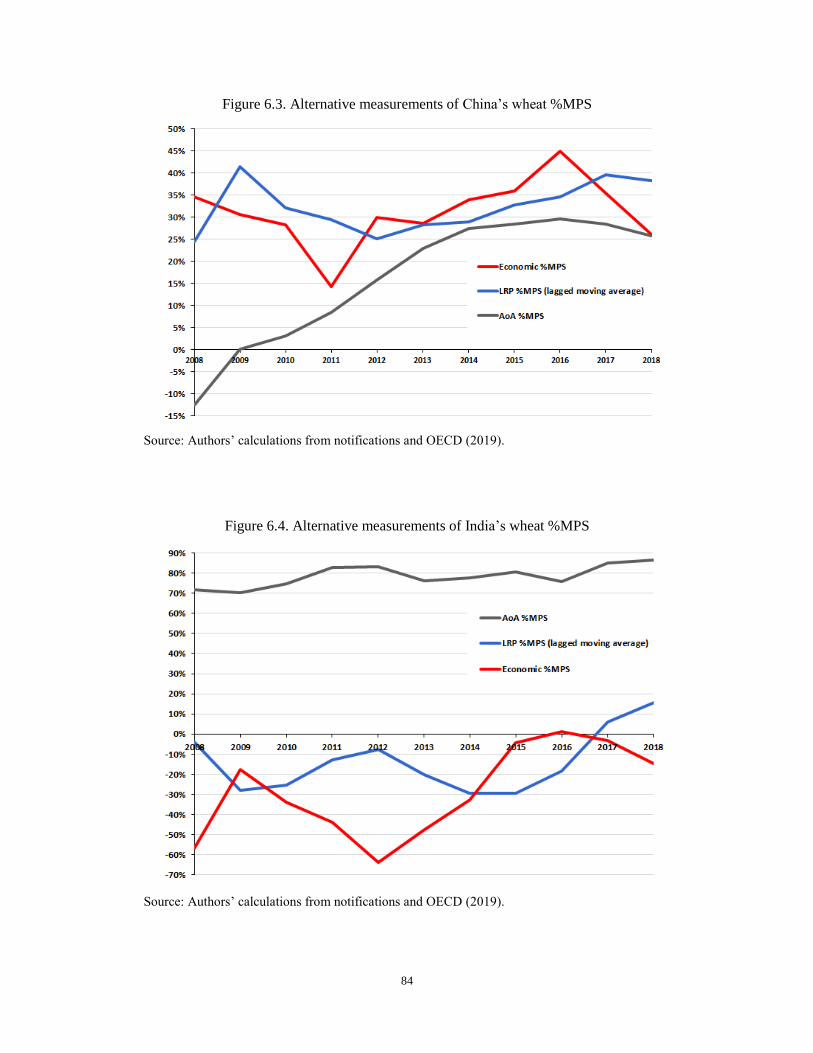
84
Figure 6.3. Alternative measurements of China’s wheat %MPS
Source: Authors’ calculations from notifications and OECD (2019).
Figure 6.4. Alternative measurements of India’s wheat %MPS
Source: Authors’ calculations from notifications and OECD (2019).
85
The key observation for India is the large difference between the AoA %MPS and the LRP
%MPS. Under the AoA %MPS, India would need to lower support prices or cap procurements to meet its
AMS limit, as discussed in Section 6.3. Under the LRP %MPS India is not under such pressure, which is
more consistent with its negative economic %MPS. An approach like this may help to resolve the tension
about the consequences of accounting or not accounting for MPS in the AMS when a developing country
acquires stocks for public stockholding at administered prices (see Section 3 and discussed further in
Section 7). Lessening the contention about measuring MPS would allow members to turn more attention
to other areas as they seek to strengthen the global regime of domestic support rules.
A second observation for India is that economic %MPS and LRP %MPS move along a common
track in the period observed, although less closely so than for China and with differences in individual
years. The largest difference occurs in 2012, with economic %MPS more negative than LRP %MPS. This
results primarily from the 2012 border price increasing to exceed lagged border prices, reinforced by
producer prices being below the AAP. The subsequent increasing trend of economic %MPS, i.e.,
becoming less negative, comes from domestic prices increasing while border prices fall. LRP %MPS
declines to become more negative through 2016 as rising AAPs are more than offset by rising lagged
border prices.
The point of the above comparisons is to raise the idea that an improved measurement of MPS
under the AoA could bring the effect of the AoA discipline on AMS closer to what it would be if applied
to an AMS including the economic MPS. Since the LRP MPS uses AAP in the price gap, there is room
for the domestic price to exceed the AAP without subjecting these effects to the domestic support
discipline. Using a moving average of lagged border prices to calculate the reference price is not ideal
compared to using the current border price. However, it allows the reference price in many situations to
be closer to the current border price than using a FERP based on increasingly distant past years. The use
of a moving average reference price in MPS calculations was discussed already in the Uruguay Round,
and the idea of a fixed reference price being fixed only for five years was also mooted (GATT 1989).
Although neither of those ideas has received substantial attention in the Doha Round or ongoing
negotiations (Montemayor 2014 is an exception), the experience gained over time of implementing price
policies and applying the rules of the AoA warrants consideration and further analysis of the idea of using
a moving average of lagged border prices instead of a FERP to calculate MPS.
6.5 Summary
From 2012 to 2015 China’s administered prices for wheat, rice and corn were above world
market border prices. The outcome of the dispute China ‒ Agricultural Producers imposes only modest
constraints on China’s support prices for wheat and rice, with the corn price support program having
ended in 2016. The modest effects result from a combination of three decisions by the panel. The decision
that eligible production during 2012-15 was the quantity of production in the provinces and regions in
which the support programs operated generated higher levels of MPS under the AoA than using only
procured quantities. However, the decision to base the FERP on 1996-98 border prices gave smaller price
gaps in the MPS calculations than had 1986-88 FERP been required. Moreover, the constraint on AAP
levels from needing to keep AMSs within their limits is lessened by the panel leaving open the option that
a cap on purchases at the support price in a program’s legal framework can set a ceiling on eligible
production under the AoA.
China has indicated that, given these panel decisions, it intends to comply with its AMS
commitments using a combination of support price and maximum procurement parameters. For wheat in
2020, the support price has been lowered by about 5% after 2015, whereas a drop of about 20% would be

86
required to comply with the limit using 2020 eligible production determined in line with the panel ruling.
A cap was set at 37 million tonnes on the production that could be procured, contributing to achieving
compliance for 2020. This cap exceeds procurements in recent years and anticipated for 2020. It will have
little economic effect at least in the short run. Likewise for Indica and Japonica rice, China announced
caps on procurements (20 million tonnes and 30 million tonnes, respectively). This allows AAPs to be
higher than those AAPs which, in combination with levels of eligible production determined as in the
panel ruling, would generate MPSs consistent with AMSs remaining within their limits. Thus, the
outcome falls short in terms of the dispute leading China to constrain its wheat and rice support compared
to what would be required if capping procurements was not a way to limit eligible production in
calculating MPS.
The notifications and counter-notifications of India’s MPS for wheat, rice, cotton and sugarcane
underscore different complexities than for China in using the AoA to constrain AMS support. For wheat,
rice and cotton, economic MPS has been negative in India according to the OECD. As an original WTO
member, India’s FERP are based on 1986-88 world prices. India has in most years since 2010 notified
negative MPS for wheat and positive MPS for rice and cotton within its AMS limits. This resulted from
converting its external reference price into USD/tonne at a fixed exchange rate, converting AAP and VoP
to USD at subsequent yearly exchange rates, and using only procured quantities as eligible production.
India’s method nevertheless gave a 2018 AMS for rice in excess of its limit. For sugarcane, economic
price support has been positive but India does not notify MPS. The counter-notifications calculate MPSs
far larger than 10% of VoP for all four crops, despite the negative economic support for wheat, rice and
cotton. Australia’s first submission in the DS580 dispute shows an even higher %MPS for sugarcane. It
uses AAP and FERP in INR/tonne, production values expressed in INR and total production as eligible
production. Alternative measurements demonstrate the key influence of inflation in India on the MPS
calculated in the counter-notifications, especially for wheat, rice and cotton.
The differences between notified and counter-notified MPS for wheat and rice in India illuminate
the tension among members over the potential consequences of MPS calculation under the AoA. MPS is
included in the product’s AMS but a developing country’s AMS in excess of its limit is on an interim
basis sheltered against dispute challenge if the MPS results from acquisition at administered prices under
public stockholding programs for food security purposes and if given conditions are met. When notifying
its 2018 AMS for rice in excess of 10% of VoP India claimed this shelter. In its absence and if India were
to calculate MPS as in counter-notifications, keeping %MPS within 10% would require much lower
AAPs or procurement caps set at levels below past procurement. This would preclude India’s price
support programs from operating as today, which may explain India joining with members seeking to
permanently shelter certain excessive AMSs.
Overall, the difficulties encountered for quite different reasons in using the rules of the AoA to
constrain economic price support in a meaningful fashion for either China or India underscore the need to
update these rules through negotiations. While this is unlikely to be achieved in the near term, as
discussed in the following section, we calculate an alternative measurement of MPS (LRP MPS) based on
a price gap between an AAP and a moving average of lagged border prices and total production as
eligible production. For wheat in China and India between during 2008-18, the LRP MPS tracks
economic MPS more closely than the AoA MPS.
87
7. ISSUES UNDER NEGOTIATION
This section reviews the domestic support issues raised in the negotiations that have continued
from the year 2000 to revise the disciplines of the AoA. As members failed to reach agreement based on
the agriculture draft modalities of 2008 in the Doha Round negotiations and there are different views
about their relevance for negotiations in 2020, this section includes only a brief summary of those
modalities and the few related decisions that have been made through 2015. The section then highlights
the domestic support issues pursued in the discussions leading toward the ministerial conference
originally planned for June 2020 in Nur-Sultan and for which the timing and format are uncertain at time
of this writing due to the Covid-19 pandemic.
7.1 Doha Round negotiations and decisions since 2001
As required under Art. 20, titled Continuation of the Reform Process, negotiations that could
update the AoA were initiated in 2000. From 2001 they were continued in the Doha Round aiming,
among other things, at “substantial reductions in trade-distorting domestic support” (WTO 2001). Special
and differential treatment for developing countries is an integral part of the negotiation mandate, to be
embodied in the schedules of concessions and commitments and as appropriate in the rules and
disciplines to be negotiated in agriculture. The negotiations, taking into account so-called non-trade
concerns such as environmental protection, food security, and rural development, would conclude by
1 January 2005, later becoming the end of 2006. Major steps in the Doha Round process included
agreeing on certain formulas and other modalities for domestic support in 2004 and in 2006.
In 2008 the Chair of the negotiations on agriculture prepared detailed draft modalities for
domestic support, which became the subject of much analysis but were not adopted (WTO 2008). In
addition to proposing reductions of existing limits and new limits on various kinds of domestic support
for different groups of members, the draft suggested revised wording for many paragraphs of Annex 2
(green box). It set out considerably more specific rules for the contents of notifications to the CoA, for its
monitoring of compliance with commitment and disciplines and for its surveillance of progress towards a
fair and market-oriented agricultural trading system. However, members failed to reach an agreement to
conclude the Doha Round despite efforts that continued in subsequent years. 59
In absence of a new agreement, the preparations for regular WTO ministerial conferences, most
recently in 2013, 2015 and 2017 and as originally planned for 2020, have included consideration of issues
in domestic support in agriculture. Some members consider that current negotiations must incorporate
earlier progress in the Doha Round, others consider that the context for negotiations has changed such
that the earlier progress is now out of date. While discussions at a technical level take place in the
Committee on Agriculture in Special Session (CoAgSS), ministers’ decisions and declarations express
what members have agreed at the conference. The legal authority of a ministers’ formal decision has not
been tested in comparison to the authority of an amendment of the AoA resulting from a prescribed
process (Art. X, WTO 1994b). The AoA has not been amended.
The ministerial conference in 2013 (Bali) generated decisions on General services, on Cotton, and
on Public stockholding for food security purposes. The decision on General services, which relates to
59 Orden et al. (2011) provide in-depth discussion of the domestic support proposals discussed in the Doha Round.
Martin and Mattoo (2011) provides discussion of issues that remained unresolved across all negotiating areas.
Glauber et al. (2020) examine the policies and support of a dozen members with a focus on potential changes in the
rules and commitments on domestic support.
88
proposals made by the African Group in 2006 and by the G-33 group of developing countries, makes it
explicit that expenditures on land reform and rural livelihood security can be exempted if they meet the
green box requirements (WTO 2013a). These expenditure programs can include land rehabilitation, soil
conservation and resource management, drought management and flood control, rural employment
programs, issuance of property titles, and farmer settlement programs. The decision says that subject to
Annex 2 of the AoA, these “types of programs could be considered as falling within the scope of the non-
exhaustive list of general services programmes in Annex 2”.
The 2015 ministerial conference (Nairobi) made further decisions on acquisition for public
stockholding (see Section 3) and on cotton. The preparations for the 2017 ministerial conference (Buenos
Aires) saw members submitting a variety of proposals both on public stockholding and cotton and on
other dimensions of domestic support, but ministers did not take any decisions on these topics. In
preparing for the originally planned 2020 ministerial conference, members have provided input through
the CoAgSS under the headings of domestic support, cotton, and public stockholding (in addition to input
related to border measures). All three headings involve domestic support issues and have been reported as
the most frequently mentioned priority issues in CoAgSS (WTO 2019f).
Although relating to the export competion pillar of the AoA, a decision at the 2015 ministerial
conference has an important implication for domestic price support programs. Ministers decided that
members shall eliminate their scheduled export subsidy entitlements within given time frames. A member
whose policies keep prices above world levels must manage any resulting accumulation of stocks within
its domestic market rather than dispose of those stocks internationally using export subsidies. This may,
however, motivate the member to seek other ways than explicit export subsidization to dispose of
accumulated stocks through international markets. For this and other reasons, implicit export
subsidization remains an issue.
7.2 Subsequent discussions and negotiations
Although negotiating progress has been scant, agriculture remains a high-profile issue in the
preparations for the next ministerial conference, along with fisheries subsidies, WTO reform, trade and
development, and other issues. Much of members’ early input on domestic support expressed ideas on the
preferred ways to proceed to negotiations. As 2020 approached members offered additional analysis and
proposals regarding domestic support, largely related to the limits that would apply to different kinds of
support provided by different groups of members and in what circumstances. The CoAgSS has thus been
able to engage in exchanging views on some of the technical details in domestic support that would be
part of “doable elements” for the ministerial conference (a term sometimes used by the chair of CoAgSS).
The complexity and interactions of the rules contemplated for different components of domestic
support can be daunting as was shown in the 2008 draft modalities. Some members seek better
information on which to base their assessment of what is proposed in negotiations, calling for enhanced
transparency regarding members’ policies and the associated domestic support of different kinds. This
concerns both the timeliness of the information members submit to the CoA and the contents of what they
submit. Some see greater transparency as a sine qua non for negotiations although it would not by itself
ensure a negotiated outcome. Others see notification requirements as burdensome, although the basis for
doing so is not clear, given the size of the transfers involved compared to overall government budgets and
the rules for financial accountability governments commonly follow.
Since 2008 the pattern of which members support agricultural producers in which ways has
changed drastically, and further experience has been gained with regard to members’ different
interpretations of the AoA rules. Combining this with the need to look forward, to have regard to special
89
and differential treatment for developing countries (which has become controversial for the largest and
highest-income developing country members) and to recognize that designing rules on domestic support
is not independent of changing other disciplines of the AoA makes for a significant challenge in preparing
for the next ministerial conference and afterwards to achieve substantial reductions in trade-distorting
domestic support.
7.2.1 Domestic support
In preparing for the ministerial conference originally planned for 2020, discussions under the
heading Domestic support relate to only a subset of the issues that fall within the AoA rules on domestic
support. Suggestions under the Domestic support heading focus on whether and how to further limit
support within BTAMS and in de minimis AMSs, limit product-specific support, and limit support
currently exempted from limit, such as Art. 6.2 support and blue box support. Beyond an interest in the
pattern of past support, members increasingly pay attention to other members’ future entitlements to
certain kinds of support, which puts the negotiations in a more forward-looking setting. Issues relating to
domestic support in the AoA sense are discussed also under the headings of Cotton, where domestic
support is a key negotiating concern, and Public stockholding for food security purposes, which concerns
implications under some Annex 2 rules.
Members summarize and analyze information under rubrics such as trends in global trade-
distorting support, analysis and observations on product-specific support, next steps towards reform, and
domestic support options (e.g., WTO 2018b; 2018d; 2018g; 2019j; 2020c). This includes noting that 90%
of all notified Art. 6 support is notified by only ten members, corroborating the quantification in Section 4
of this paper. Going beyond evaluating historical levels of support, members of the Cairns Group
highlight and project into the future the total of all members’ entitlements to support that is subject to
limit, i.e., de minimis allowances and BTAMS (WTO 2019p; noted in Section 2).60 Paraguay (WTO
2019h) provides analysis of product-specific support (possibly only AMSs) which may explain the
interest in stronger rules on such support identified by China, India and Cairns Group members.
China and India would reduce some members’ entitlement to provide product-specific AMSs
beyond de minimis levels, aiming to eliminate such excess AMS support (WTO 2018c). Those reductions
and the eventual elimination would apply to developed country members only; a discipline incorporating
special and differential treatment would apply for the 17 developing countries with a positive BTAMS.
While the proposal seeks to address the asymmetry between developed country members and most
developing country members, it is silent on, for example, the asymmetry between the de minimis
percentages that would govern members’ AMSs after eliminating the entitlement to product-specific
AMSs beyond their de minimis thresholds. As the China and India suggestion seems to stop short of
earlier suggestions to eliminate the BTAMS entitlement for the 15 developed country members with a
positive BTAMS, it could enable the use of that entitlement only and entirely for the non-product-specific
AMS. However, if a member’s non-product-specific de minimis threshold is already larger than its
BTAMS, it would see no advantage in doing so.
While Cairns Group members call for a focus on product-specific support, they point at the same
time to other forms of trade-distorting support, including non-product-specific support (this could also
include Art. 6.2 support, blue box support and perhaps green box support). Seeing all Art. 6 support as
trade-distorting, these members caution against setting limits on such support only for some of the major
60 The Cairns Group of WTO members identifies itself as pushing for liberalization of global trade in agricultural
exports. https://cairnsgroup.org/pages/default.aspx.
90
providers of it – they see a need for all members to set limits on Art. 6 support and reduce those limits.
The Cairns Group would cap and reduce “trade- and production-distorting domestic support
entitlements”, taking into consideration all forms of such support under Art. 6 (WTO 2020c). This would
include the currently unlimited entitlements to Art. 6.2 and blue box support. Each member’s reduction
would be proportionate to its current entitlements and their potential impact on markets (this would seem
to presuppose some underlying economic analysis). The wording hints at unspecified forms of flexibility.
The outcome would be to cut 2020 global entitlements (presumably the sum for all members) in half by
2030.61
The African Group proposes to rule out product-specific AMSs larger than de minimis levels for
members with a positive BTAMS (WTO 2019r). As in the proposal by China and India, non-product-
specific AMS would not be subject to this stricture. The blue box exemption would be eliminated, and
direct payments exempted on green box grounds would be capped and be subject to stricter criteria.
Russia proposes reducing AMS support from a base period amount over a number of multi-year stages
(WTO 2019q; 2020g). The formula for the reduction would use negotiated coefficients that take into
account changes in support and imports over time.
Members see a need for clarification of some AoA rules, such as calculation methodologies for
MPS and definition of non-product-specific support. They seek enhanced transparency, especially in
notifications, where the provision of VoP data would become a requirement. It has been noted that
showing the relevant tariff codes for products with product-specific support would also increase
transparency.
7.2.2 Cotton
Domestic support is a major issue under the Cotton heading. It has been part of the Doha Round
negotiations from the early years, along with concerns about market access and export subsidies. The
2013 ministerial decision on cotton reaffirmed earlier commitments to address cotton “ambitiously,
expeditiously and specifically”. This would involve agreeing on substantial reductions in domestic
support for cotton, specifically reducing distorting subsidies for cotton by more than for other products.
Since the size of any cuts for other products have not been agreed, the corresponding reductions in cotton
support have not been agreed. The “Cotton Four” (Benin, Burkina Faso, Chad and Mali), who champion
the cotton issue, propose differentiated reductions in cotton AMS for developed countries and developing
countries with a positive BTAMS and in blue box support for cotton, along with changes in the de
minimis provisions (WTO 2018f; WTO 2019i; WTO 2019n). This can be in contrast to the interests of
other members, who bring additional points of view. Monitoring and transparency of green box support
would be enhanced.
The cotton discussions are supported by material prepared by the WTO Secretariat. This includes
cotton-related data from notifications and from replies to a questionnaire, showing the extent to which the
picture of members’ domestic support for cotton has changed from 1995 onwards (WTO 2019g). It
includes an evolving data set, showing disbursements of cotton-specific development assistance along
61 The proposal is silent on how this arithmetic would work. Current entitlements to Art. 6.2 and blue box support
are without limit, i.e., they are infinite. Half of infinity is also infinity. An artificial 2020 base level might need to be
devised.
91
with agriculture and infrastructure-related development assistance over some years valued at many
hundreds of millions of US dollars (WTO 2019o).62
7.2.3 Acquisition for public stockholding
The treatment of MPS calculated under the rules in paragraph 3 of the green box, titled Public
stockholding for food security purposes, is a major unresolved issue in the negotiations (see Section 3).
To recall the main points, developing countries’ expenditures on accumulating and holding stocks can be
exempted even if the stocks are acquired and released at administered prices. However, this requires
accounting for “the difference between the acquisition and the external reference price in the AMS”. The
calculated MPS can be large even if the acquisition expenditure is small, and including it in the product’s
AMS can make AMS large enough to exceed its de minimis limit or the BTAMS (see Sections 3 and 6).
Some members have therefore sought to remove the requirement to include the MPS in an AMS when
acquiring public stocks for food security purposes at administered prices or to sidestep the consequence of
exceeding an AMS limit when acquiring such stocks at administered prices. The 2008 draft modalities
(WTO 2008) had proposed that in certain circumstances, involving support for low-income or resource-
poor producers or fighting hunger and rural poverty, the acquisition expenditure would be exemptible
without accounting for MPS in the AMS.
The 2013 ministerial conference decided as an interim solution that a developing country, which
exempts expenditure on acquisition at administered prices and includes MPS in the AMS, would not face
a challenge under the WTO dispute settlement rules even if the inclusion of that MPS makes an AMS
exceed its limit (WTO 2013b).63 This was followed up in a decision by the WTO General Council in 2014
and in a ministerial decision of 2015 (WTO 2015). When India in March 2020 notified an excessive AMS
for rice in 2018, it was the first member to invoke shelter against a dispute challenge under these
decisions. Members’ reaction to this claim and its supporting information is not known at the time of
writing. The flexibility provided by these decisions remains an interim solution, which so far only India
has utilized. While ministers decided to make efforts to agree and adopt a permanent solution, the interim
solution is in place until a permanent solution is found. To that end, members have provided input for a
solution intended to be reached at the next ministerial conference. This material is mostly not public,
although material such as WTO news releases give an idea of the issues at play. The differences among
members concern the type of solution, coverage in terms of products, programs and members,
transparency, and safeguards to prevent excess procured stocks from being offloaded on global markets.
While some members see a need to address urgently the acquisition for public stockholding issue
as a means to alleviate concerns both about an increasingly severe food security situation and rural
development needs, others fail to see how relaxing domestic support disciplines would help in this regard.
It has been argued that Art. 6 offers space for many kinds of support and that expanding the room for
unlimited price support will create more trade distortion. Members disagree on whether acquisition at
administered prices for public stockholding for food security purposes could be trade distorting. The
62 Receiving members report little, if any, of these funds in their domestic support notifications. This gives the
impression, possibly misleading, that the funds are not used as support in favour of agricultural producers. The AoA
and the notification requirements do not exempt any support on the basis of the origin of the funds.
63 This opening to offer price support to producers without any constraint under the AoA is subject to certain
conditions relating to notification and transparency with regard to the CoA, anti-circumvention/safeguards to ensure
that the procured stocks do not distort trade or adversely affect the food security of other members, availability for
consultations, and monitoring by the CoA.
92
discussion at the end of 2019 was not as vigorous as earlier, leading the Chair to suggest a need for more
flexibility and creative ideas.
7.2.4 Elements and processes
The Chair of CoAgSS in early 2020 identified the elements and processes for a possible outcome
at the ministerial conference (WTO 2020f). On domestic support he singled out enhanced transparency in
notifications as a critical element and recognized members’ submissions on establishing a new overall
limit, eliminating AMS entitlements above de minimis, further limiting the categories of the AoA, using a
formula reduction, limiting product-specific support, and setting a cap on and halving the sum of
members’ entitlements to trade-distorting domestic support between 2020 and 2030. He recognized that
members diverge on addressing Art. 6 support or only some of its sub-categories. On cotton the Chair
recognized suggestions to impose a limit on trade-distorting support expressed as a percentage of cotton
VoP, address first the AMS granted to cotton beyond the de minimis level before tackling other issues,
and limit cotton trade-distorting support expressed as a fixed monetary value, and the draft modalities
proposed by the Cotton Four. On public stockholding for food security purposes the Chair suggested
members work on core provisions, product coverage, program coverage, transparency, anti-circumvention
and safeguards, and monitoring, without ruling out other initiatives and possibly treating some country
groups or some programs differently.
The Chair later invited the submission of additional proposals in all areas of the agriculture
negotiations by 15 April 2020, with a view to circulating them to members.
7.3 Summary
The continued negotiations on domestic support have prepared input for decisions by ministers at
conferences held every few years. Ministers have reached a final decision on only one domestic support
issue: expenditures related to land reform and rural livelihood security in developing countries are now
explicitly exemptible as General services under the green box. Ministers have decided on an interim
solution regarding the expansion of the room for developing countries to provide MPS under the heading
of Public stockholding for food security purposes. Contingent on the member meeting a number of
conditions and requirements, it shelters against the threat of challenge under the WTO dispute settlement
rules when MPS makes an AMS or CTAMS exceed its limit. It remains a priority issue for many
members for the ministerial conference originally planned for 2020. In preparing for the conference,
members have continued to bring forward a variety of ideas on what kinds of new constraints, if any,
would apply to different kinds of domestic support and different groups of members. Reaching a
negotiated outcome on domestic support for cotton is a priority for many members.
93
8. EXTERNALITIES AND EMERGING POLICY PRIORITIES
The continued negotiations on domestic support have evolved from the 2008 draft modalities
along with the recognition that some members are making large changes in their amounts of support of
different kinds. Changes in agricultural policy priorities are changing the composition of the domestic
support governments offer in favour of agricultural producers. A forward-looking perspective in the
negotiations could be more explicit about the capacity of the AoA to accommodate policy efforts to
address emerging priorities and consider changes in the AoA to facilitate that accommodation while
hewing to the negotiating objective of substantial reductions in trade-distorting domestic support.
This section reviews a selection of the policy priorities in agriculture that have gained profile in
recent years and the accommodation of associated support within the AoA rules on domestic support. The
selection includes productivity growth, biosecurity, water management, biodiversity, and mitigation of
climate change. Food security as distinct from self-sufficiency is a continuing policy priority for many
members and has gained more prominence as part of the United Nations Sustainable Development Goal
relating to zero hunger. One of the targets for that goal is to correct and prevent trade restrictions and
distortions in world agricultural markets. As this overlaps with the Doha Round objective in agriculture,
which remains in play in the ongoing negotiations, it is therefore not discussed as such here. Addressing
the new priorities may prompt a reconsideration of the balance between addressing them and addressing
trade distortions while also strengthening the trading system as it adapts to the changing world.
8.1 Trade distortions in the context of emerging policy priorities
The AoA allows green box support to be exempted from the AMS. To qualify for the green box
exemption the policy providing the support must “have no, or at most minimal trade-distorting effects or
effects on production” (para. 1, Annex 2), in addition to meeting other requirements and criteria. Trade-
distorting effects of domestic support, i.e., larger exports or smaller imports, are most easily understood as
resulting from effects on production. At the time of negotiating the text of Annex 2 in the early 1990s, the
policy-induced effects of the most ‒ or perhaps only ‒ concern were positive effects on production: the
increase in production beyond the level that would have been observed in the absence of support. The
possibility of production effects being negative was not a prevalent concern even if such effects can be
substantial compared to a production level not affected by policy.
Some policies developed in the context of past concerns and today’s emerging priorities can have
or are designed to have production-reducing effects. This is often the case where a policy requires the
producer to bear the cost that the production imposes on others, i.e., policies that require the
internalization of externalities. Some examples include appropriate pricing of or limits on irrigation water
used on farms, requirements to quarantine or destroy a livestock herd to avoid spreading disease, and
levies on the use of fertilizer and pesticides (such policies can generate negative components of support,
as discussed in Section 2). Policies that provide positive support conditional on the internalization of
externalities would in a formalistic reading of the green box requirement not be exemptible from the AMS
calculation since they have an effect on production, albeit negative. This could concern, for example,
payments to compensate producers for the loss of a diseased and destroyed herd, or payments that are
conditional on producers not cultivating strips of land near water courses to avoid water pollution or
covering manure storage in particular ways to reduce greenhouse gas emissions. Since the government
payment offsets producers’ cost of internalization, the externality cost is effectively not internalized by
producers, but the conditions the producers need to meet in order to receive the payment achieve the
internalizing effect and may have a negative effect on production.
94
The lack of coherence between the view that negative effects on production would disqualify a
policy from the green box exemption and the reality that policy initiatives in pursuit of certain policy
priorities can have or require negative effects on production has not been a concern in implementing the
AoA or in deliberations behind the ongoing negotiations on domestic support. In part, this is a tacit
acknowledgement that correcting for externalities by means of policy is not a distortion in terms of
achieving economic social welfare. Moreover, since the existing agricultural production structure of many
members is a result of years of domestic support provided in various ways, the reference point for
observing a negative effect on production is not production in the absence of policy support. The
reference point is rather the production level as distorted by existing production-increasing support, which
may also be exacerbating an externality. A negative effect on production from a policy addressing the
externality would result in less distortion of production and trade from the existing support policies and
less externality. The distribution of policy support across products also plays a role. Making production of
one product less remunerative – a negative effect on production – can make it more attractive to produce
more of other products, i.e., a positive effect on production. Settling on new or revised domestic support
provisions in the AoA is likely to depend crucially on balancing the needs to reduce trade distortions and
to address emerging priorities.
8.2 Emerging priorities
From a domestic support in agriculture perspective the priorities now emerging are very large in
number ‒ from a broader perspective the number is even larger. The following sub-sections discuss a
selection of the emerging priorities in agricultural policy in terms of their fit under the rules on domestic
support of the AoA.
8.2.1 Productivity growth
While continued productivity growth in agriculture is neither a new nor an emerging policy
priority, it can be expected that governments will in the coming years increase their efforts to maintain or
accelerate the ability to produce more with the same or fewer inputs. This follows from the direct role of
productivity growth in pursuing priorities such as food security and climate change mitigation. Increased
production contributes to the food availability dimension of food security; the other dimensions of food
access, utilization and stability also remain critical. Producing more while using the same or less inputs
means emitting less greenhouse gases per unit of output, which can be significant in mitigating climate
change. Some research specifically seeks ways to reduce greenhouse gas emissions in agricultural
production. Research, training, extension and advice can also help producers adapt to climate change.
Agricultural policies delivering support that is subject to limit, such as price support and some
producer payments, are generally not designed to directly increase productivity on the farm. The
additional revenue obtained by such instruments may give some producers an additional incentive to
develop and adopt practices and technologies that increase yield or reduce cost. An indirect increase in
productivity would thus result from policy support that is subject to limit, especially when such support is
sustained over time. While the motivation for limiting such support is the direct distortion of a member’s
agricultural production and trade, the concomitant indirect growth in productivity is not seen as a problem
but is welcomed as an element of economic development. Many governments, especially those providing
support that is subject to limit, purposefully also support agricultural productivity growth by means of
expenditures on research, training, extension and advice. This lowers producers’ costs and can increase
production over time, which strictly speaking is contrary to the green box requirement that they have at
most minimal “effects on production”. However, such expenditures tend to provide “services or benefits
to agriculture”, in the words of the green box, rather than support in favour of individual producers. This
95
helps to explain the lack of controversy about exempting from AoA limits those expenditures designed to
raise productivity as long as they meet the very generally phrased green box conditions relating to
research, training services, and extension and advisory services (paras. 2(a), (c) and (d), Annex 2).
8.2.2 Biosecurity
Vigilance against the spread of pests and diseases among crops and livestock has long been a
priority for governments. The 1987 confirmation of the presence of bovine spongiform
encephalopathy (BSE) in the United Kingdom made such vigilance a greater government priority as the
Uruguay Round negotiations were getting underway. Concerns about human, animal or plant life or
health have on many later occasions garnered policy attention, especially if they relate to human health.64
Any of the various ways to manipulate genetic material can be of enough concern to some groups to raise
it on the policy agenda. The expenditures a member makes on pest and disease control, such as early-
warning systems, quarantine and eradication, and on inspection services, including inspection for health
and safety, can be exempted from AoA limits under paragraphs 2(b) and (e) of Annex 2. It could even be
in the interest of every member to see other members spend more on some forms of pest and disease
control, so as to reduce the risk of transmission to others.
A possible problem with the green box conditions for expenditures on pest and disease control is
that, as expenditures on general services, they cannot involve direct payments to producers (para. 2,
Annex 2). Producers who are not paid compensation or, in their view, are paid too little may have an
incentive not to report the pest or disease in question, which makes the government’s control measures
less effective. In the interest of encouraging producers to report as early as possible the presence of a pest
or disease, which facilitates counter-measures, a government may wish to make payments to producers
large enough to compensate for the destruction of a crop or the culling of animals. Such payments would
need to either meet the criteria of paragraph 8 concerning relief from natural disasters or be included in
the AMS calculations and be subject to limit.
The criteria of paragraph 8 do not explicitly address controlling or preventing pest and disease,
they do not refer to the destruction of crops or livestock in that context or to any related compensation,
and they require the production loss to be larger than 30% of a moving average of past production. This
narrows the scope for exempting a biosecurity-related payment from limit. The 2008 draft modalities
expanded in several ways the circumstances in which the payment could be exemptible in the case of
controlling or preventing certain pests, diseases, disease-carrying organisms, or disease-causing
organisms (WTO 2008). The payment could be exemptible when related to the destruction of animals or
crops and this even if the loss was less than 30% of an average. While this by itself may only show that
members’ interest in making the AoA accommodate certain expenditures related to biosecurity increased
between 1994 and 2008, their biosecurity interest is not likely to have waned over the last decade.65 As
64 Animal, plant and human health and safety concerns resulted in the Uruguay Round generating the Agreement on
the Application of Sanitary and Phytosanitary Measures (the SPS agreement) and the Agreement on Technical
Barriers to Trade (the TBT agreement). These agreements are beyond the scope of this paper. See Grant and Arita
(2017) for review of issues that have been addressed within these committees as specific trade concerns (STCs)
under the SPS agreement and Cororaton and Orden (2019) for review of agri-food STCs addressed under the TBT
agreement.
65 Some 2019 examples of biosecurity issues include policy concerns about antimicrobial resistance from using
antibiotics in livestock production; spread of African swine fever; China blocking of imports of canola from Canada
citing “harmful organisms”, and the WTO dispute India ‒ Agricultural Products concerning prohibition of imports
of poultry products from the United States because of alleged concerns related to avian influenza.
96
negotiations proceed, members may therefore be in a position to enshrine changes in paragraph 8 of the
green box like those formulated in the 2008 draft modalities.
8.2.3 Water management
Water is critical for agricultural production and climate change profoundly affects the sources of
water supply. Concerns about the food availability dimension of food security and about agriculture’s
adaptation to climate change combine to heighten the interest in shaping appropriate policies in the area
of water and agriculture. Such policies have long been a priority for governments in dry regions of the
world and are now gaining priority elsewhere. They operate in many different ways, such as government
responsibility for institutions that manage the allocation of water among users, government support for
capital investment in dams and canals, and subsidies for farmers’ use of water.
Analysis of emerging policy issues in water and agriculture tends to emphasize the need for
redesign or development of appropriate policy institutions. Rosegrant (2019) underlines improving the
governance of water resources through effective institutions, allocating water more efficiently through
pricing, regulations and subsidy reform, improving productivity per unit of water through agricultural
research, technology and extension, diversifying agriculture to reduce the demand for water, and
increasing the supply of water and the irrigated area through investment in infrastructure. Tyagi and
Shortle (2019) see policy issues arising in water use in agriculture and also in the impacts of agriculture
on water quality, with the critical challenge in both cases being one of institutional design. Gruère and Le
Boëdec (2019) highlight charging for water use in agriculture, removing subsidies that negatively impact
water resources, regulating groundwater use, and addressing nonpoint source pollution. To take India as
one example of countries facing water management issues, Gulati et al. (2019) see improved allocation
and efficient use of water as essential for achieving farm income objectives and outline possible enabling
changes in institutional design and practice.
WTO members exempt much of their water policy support for agricultural producers from limit
by claiming that it falls under the General services heading of infrastructural services (para. 2(g), Annex
2. It includes capital expenditures on water supply facilities, dams and drainage schemes. While the
paragraph is clear about not exempting subsidies to inputs, operating costs, or preferential user charges, it
is not always clear that members apply this distinction. Developing countries can, in addition, exempt
input subsidies generally available to low-income or resource-poor producers under Art. 6.2. The many
kinds of input subsidies thus exempted include support in the form of preferential user charges.
Emerging policy priorities in water and agriculture may require larger government expenditure on
institutions that set the rules for and facilitate the exchange of rights to use water. While the green box of
the AoA does not explicitly mention expenditures on institutions, the exemption for expenditures on
water institutions as part of infrastructural services has not been contentious. Other policy priorities in
water and agriculture involve research, training services, extension and advisory services, which are all
identified in paragraph 2 of the green box. There is also the possibility that some water expenditures in
developing countries, such as expenditures relating to soil conservation and resource management,
drought management and flood control, and possibly also issuance of property titles, can be exempted
from limit under the new green box paragraph decided by ministers in 2013 (WTO 2013a). Paragraph 2 is
open-ended: any other general service expenditures (i.e., not direct payments) are exemptible if they meet
the fundamental requirement of having no more than minimal trade-distorting effects or effects on
production and the basic criteria of being publicly funded and not providing price support.
While reducing or eliminating subsidies for agricultural producers’ use of water is a common
theme in discussions of water policy priorities, progress on the completion of such initiatives has been
97
slow. As long as Art. 6.2 allows unlimited support, developing countries can continue to exempt some
irrigation subsidies as input subsidies for water and some as subsidies for investment in on-farm irrigation
facilities. Developed countries are required to include those water-related subsidies not meeting the green
box criteria in their AMSs. Water policy reform may involve compensating producers when water
subsidies are withdrawn, perhaps in the form of payments or making water supplies more reliable as the
price of water increases. A government may also pay the holder of water rights not to use a given amount
of available water. This touches the boundary between agricultural producers and other holders of water
rights, which is decisive in terms of the applicability of the domestic support rules of the AoA. It also
raises the question of whether a payment for not using an input meets the green box requirement of at
most minimal trade-distorting effects or effects on production even when the effect of the payment is to
reduce production. The concern behind the green box requirement may have been one of subsidy-induced
increases in production, not decreases, but this is not clear from the green box requirement.
8.2.4 Biodiversity
There are many definitions of biodiversity, generally having to do with the number or diversity of
species in a given area and encompassing organisms of many kinds. Agricultural policies have typically
in the past not explicitly sought to maintain or increase biodiversity, but the notion is embedded in policy
objectives concerned with such outcomes as ecosystem services and environmental sustainability.66 Some
members have for many years implemented policies under an environmental title or with an
environmental component. Their desire not to have certain direct payments become limited by domestic
support commitments in the Uruguay Round negotiations led to Payments under environmental programs
being a green box paragraph heading (para. 12, Annex 2), with certain criteria needing to be met for the
payment to be exemptible.67
The payments members exempt under the Environmental programs heading have in many cases
increased greatly as governments have put increased priority on environmental stewardship in a broad
sense. The green box criteria require the payments to be made under an “environmental or conservation”
program. While some members are moving towards using such terms as eco-schemes, ecosystem services
or biodiversity instead of environmental when characterizing their programs, it can be assumed that the
AoA’s environmental or conservation wording is sufficient to embrace also the newer vocabulary. The
green box criteria require a producer’s eligibility for payments to depend on fulfilling specific conditions
under the program, including conditions related to production methods or inputs. It is unclear whether this
means that the program must include such conditions or that, if the program includes such conditions,
fulfilling them is enough to establish the producer’s eligibility for payment. An additional criterion for a
66 See, e.g., Henderson and Lankoski (2019) and Blandford (2019) for discussions of biodiversity in the context of
agricultural policies. Preserving biodiversity is an explicit part of one of the objectives in the development of the EU
Common Agricultural Policy (EC 2018).
67 Members’ understanding of “environmental programs” when drafting paragraph 12 was informed by the
information they prepared for the base years of 1986-88 for domestic support commitments. A selection of members
exempted direct payments under environmental programs essentially as follows. United States: agricultural
conservation programs, conservation operations, Great Plains conservation program, resource conservation and
development; EU: protection of the environment, preservation of the countryside, control of soil erosion,
extensification, aid for environmentally sensitive areas; India: soil conservation and watershed management in
certain areas, fodder grassland and pasture development, and desert development; Japan: payments for conversion
from rice production. China later exempted 1996-98 payments for afforestation, desert control and prevention, water
resources protection, water and soil conservation.
98
payment to be exemptible as an environmental payment is that it must not exceed the extra cost or loss of
income of complying with the program. This guards against a government making payments so large that
they incentivize additional production with associated trade effects. Situations may nevertheless arise
where a payment-induced move towards the environmental target results in larger production of some
products. For example, shifting land use from arable crops to pasture can increase ruminant livestock
production.
Some members are moving from paying producers for choosing certain production and land use
practices towards paying for achieving measurable results in terms of environmental outcomes. These
value-based or results-based payments remunerate the producer for the delivery of a given environmental
outcome, such as a measured level of biodiversity on a given area of land. The methods for measuring
biodiversity and other types of desirable environmental features and for attaching a value to biodiversity
and other features are not yet well advanced but progress is being made.68 Matthews (2019) warns about
the risk of such payments becoming instruments also for income support and thus being set at a higher
level than the value of the environmental outcome being paid for. Lichtenberg (2019) recognizes these
competing features with regard to environmental or conservation payments under US agricultural policy.
The government’s calculated value of the environmental outcome compared to the status quo
may be higher than the producer’s extra cost or loss of income. However, the payment that is exemptible
can be no larger than the difference between producer’s income before and the lower income after taking
the action that generates the targeted environmental outcome on the given area of land. The producer may
choose not to produce anything, yielding nil income from production, and receive a payment equal to the
full income loss. If the payment is larger, it may be possible to account for the excess in an AMS, a
possibility contemplated by, e.g., Bureau (2017). Payments in this situation might also be exemptible
under the green box paragraphs headed Direct payments to producers, Decoupled income support or
Structural adjustment assistance provided through resource retirement programs (paras. 5, 6 and 11,
Annex 2).
Another dimension of this issue is whether value-based or results-based payments would even be
“support for an agricultural product in favour of the producers of the basic agricultural product”, as in the
definition of a product-specific AMS (Art. 1(a)). If the payments do not need to be included in a product’s
AMS anyway, there is no need to exempt them under the green box criteria. Alternatively, the payments
might be seen as “non-product-specific support provided in favour of agricultural producers in general”
and thus be part of the non-product-specific AMS (Matthews 2019). The delineation in this case between
seeing the payment as support or as a calibrated remuneration for delivering a measured environmental
outcome is not clear. Considerations like these are fairly novel in the context of interpreting the AoA but
are becoming increasingly relevant when members seek compatibility between agricultural policy design
and the rules of the AoA. While the exemptions under the green box were designed for the environmental
programs in place at the time of the Uruguay Round negotiations, they still seem able to accommodate
exemptions also for many payments under the programs in place or being contemplated today.
8.2.5 Climate change mitigation
Policies relating to climate change and agricultural producers, whether involving mitigation of or
adaptation to climate change, have come to the fore in the decades after the green box provisions of the
AoA were drafted. Some important dimensions of climate change policy are highlighted by Häberli
(2018), who examines the compatibility of many kinds of agricultural policy initiatives regarding climate
68 See, e.g., Ansell et al. (2016), Chaplin et al. (2019), Gundimeda et al. (2018) and Hasund and Johansson (2016).
99
change with a broad set of international trade rules and pays particular attention to the developing country
dimension. Blandford (2018) analyzes the role of border measures as another dimension of climate
change policies in relation to agriculture.
Producers adapting to climate change effects derive private benefits from doing so, in contrast to
the social benefits generated by climate change mitigation. Support provided to facilitate adaptation can
postpone the need for agricultural producers to adapt or even lead to maladaptation in the sense of their
adaptation worsening the impact of climate change on society (Hassapoyannes and Blandford (2019),
drawing on McCarl et al. (2016)). The green box offers many avenues for exempting expenditures or
direct payments for a sector or for producers continually adapting to changing circumstances, including
those brought about by climate change. Other adaptation support will fall into AMSs.
The need to mitigate climate change has become clearer over time and was articulated, for
example, in the 2015 Paris Agreement among nations to strengthen the global response to the threat of
climate change. Climate change mitigation policies in agriculture respond to the role of crop and livestock
production as the largest contributor to emissions of methane and nitrous oxide. Mitigation policies also
respond to the use of land in agriculture (e.g., tillage) and conversion of land from other uses into
agriculture (e.g., deforestation, drainage of organic soils) as the second largest contributor to emissions of
carbon dioxide (Blandford 2019, citing the Intergovernmental Panel on Climate Change). Mitigation
policies seeking to reduce the emission of greenhouse gases (GHGs) can take the form of subsidizing the
cost of reducing emissions, regulating the amount of GHGs that can be emitted, or increasing the cost of
emitting GHGs (taxing emissions). Mitigation policies also seek in corresponding ways to increase the
withdrawal of carbon dioxide from the atmosphere and the sequestration of it, for example as soil carbon.
The green box provisions of the AoA are relevant to policy choices to reduce emissions and increase the
sequestration of carbon because they may make expenditures and direct payments exemptible from limit.
Government expenditures in the area of reducing GHG emissions and increasing carbon
sequestration, and also those relating to climate change more generally, can be exemptible from limit
under the open-ended green box heading of General services (para. 2, Annex 2). Expenditures on
research, training services and extension and advisory services are explicitly named as exemptible.
Governments can, for example, exempt expenditures on research and information dissemination about
reducing ruminants’ emission of methane or on soil management practices that increase carbon uptake
and sequestration. Expenditures on productivity-enhancing research, which allows greater output quantity
without increasing emissions from production, may also be exemptible.
Subsidizing the cost of reducing GHG emissions could be exemptible as direct payments under
the open-ended Direct payments headings (paras. 5-13, Annex 2). Subsidies for the reduction of GHGs
are “often linked to the adoption of practices that are associated with reduced emissions (e.g.,
management of animal waste, minimum tillage, restoration of degraded soils, retirement of carbon-rich
soils from agricultural production, sustainable forest management)” (Hassapoyannes and Blandford
2019). The reason for this indirect way of reducing emissions with the help of subsidies is the difficulty in
targeting the subsidy and calibrating its size to achieve a specific desired outcome. The difficulty suggests
a need for research to find ways to more directly tie a payment to a producer’s actual achievement in
terms of reduced emissions and increased carbon sequestration rather than subsidizing practices more or
less strongly associated with these outcomes.69 This would parallel the move under environmental policy
69 A producer’s continuation of a practice that emits less GHGs than the producer’s earlier practice does not reduce
emissions: the reduction took place when switching to the low emission practice. An ongoing payment that
subsidizes the continuation of the producer’s low emission practice may enable the producer not to go back to the
100
towards results-based and value-based payments. Progress in this area seems increasingly desirable as the
urgency of countering excessive climate change grows.
No green box paragraph refers explicitly to climate change but Payments under environmental
programs (para. 12, Annex 2) may be a category for some payments under programs designed to reduce
GHG emissions or increase the sequestration of carbon. Many types of payments under such programs
would depend on the producer meeting conditions related to production methods or inputs, which means
they would seem to meet the eligibility criterion in paragraph 12(a). The extra cost a producer incurs (or
the producer’s loss of income) by reducing emissions or sequestering more carbon would be covered by
the amount of the payment in the same way as for other payments exempted under the environment
heading of the green box. Payments in excess of incurred costs or loss of income would raise similar
issues to those discussed for environmental programs.
Although the criteria under the policy-specific headings in paragraphs 5-13 specify what is
required for a payment to be exemptible, most of them do not define the policies included under the
heading. This leaves room for a member to design a payment for climate change mitigation such that it
meets the criteria under some other heading than Payments under environmental programs, such as
paragraphs 5, 6, or 11 (mentioned with regard to biodiversity above). A member might also consider that,
if the same payment is offered also to, say, landowners other than agricultural producers in the case of a
payment for carbon sequestration, it might not be a “domestic support measure in favour of agricultural
producers” and is therefore not even a measure or policy to which the AoA limits on support apply.
If members’ understanding of "environmental programs” does not include climate change
mitigation programs, they might contemplate introducing through negotiations an additional green box
heading for direct payments under climate change mitigation programs. The criteria for exempting
payments under such a heading would operate in conjunction with the green box fundamental requirement
that the payment have at most minimal trade-distorting effects or effects on production. This could make
it difficult to incorporate an exemption for payments under climate change mitigation programs in the
green box, since such payments could lead producers to reduce the production of some products and
switch to producing more of others. The introduction of an explicit exemption for certain payments under
climate change mitigation programs, whether in the green box (Annex 2) or as a different kind of
exemption in the AoA, would thus need to consider the balance between the priorities of reducing trade
distortions and mitigating climate change.
The taxing of emissions does not have an obvious home in the green box. Taxing the GHG
emissions of agricultural producers less heavily (lower tax rate) than the same emissions of other
producers could conceivably be seen as providing domestic support in favour of agricultural producers.
That support would take the form of government “revenue foregone” (para. 5, Annex 2), which could be
exemptible from the AMS calculation if it satisfies one of paragraphs 5-13 of the green box (e.g.,
satisfying criteria 6(b)-(e) as specified in paragraph 5). Taxing only agricultural producers for their GHG
emissions would be negative support in the economic sense. It would enter the calculation of an AMS as a
negative component, offset positive components in the calculation and make the AMS smaller. If it was
larger in absolute value than the sum of positive components of that AMS, it would make the AMS equal
earlier practice and thus increase emissions but it does not induce a further reduction of emissions. It is unclear how
governments are addressing questions like these when contemplating policies to mitigate climate change. In the
same vein, it is unclear how governments are able to target and calibrate payments so as to induce a producer to
make a change, as distinct from subsidizing a change that the producer would have made anyway ‒ the question of
additionality (Glauber 2018; Pannell and Claassen 2020).
101
to zero. This follows from an AMS being defined as support in favour of agricultural producers (see
Section 2).70 Similar arguments as for direct taxing of GHG emissions would seem to apply in the case of
indirect taxing of GHG emissions in the form of cap and trade schemes.71
It thus appears that the green box can accommodate many kinds of payments designed to reduce
GHG emissions and increase the sequestration of carbon, especially on the understanding that
environmental programs encompass also climate change mitigation programs. Other avenues may also be
open for the exemption of payments under climate change mitigation programs. The lack of a direct link
between the amount of payment and the measured outcome in terms of climate change mitigation is a
problem. Payments have tended to target production practices, not the emission or sequestration
outcomes. This means there is a large role for research to advance the understanding of how to measure
and value such outcomes and to establish baselines from which emission reductions or sequestration
increases are to be remunerated. With such knowledge it would be possible to design instruments that
more directly provide a payment to a producer in exchange for and calibrated to the delivery of a
measured outcome that contributes to climate change mitigation.
Direct payments to agricultural producers in exchange for delivering climate change mitigation
could emerge as an unprecedented new kind of revenue stream for agricultural producers. This revenue
would help to offset any associated loss of revenue from sales of basic agricultural products in the sense
of the AoA. Depending on how society values the mitigation of climate change by agricultural producers,
how that value translates into the rate of payment a producer receives, and the producer’s ability to deliver
a reduction in emissions or an increase in sequestration, the new revenue stream may even exceed any
loss of revenue from sales of basic agricultural products. An agricultural producer would no longer be a
producer and seller only of quantities of basic agricultural products but also a producer and seller of the
less tangible quantities of reductions in GHG emissions and increases in carbon sequestration.
8.3 Summary
In recent years the need for policies to address such concerns as productivity growth, biosecurity,
water management, biodiversity, and climate change mitigation has generally become a higher
government priority. While policies addressing these priorities may increase the amounts of domestic
support, designing policy instruments to be green box compatible allows the support to be exempted from
AoA limits on support in favour of agricultural producers. The mitigation of climate change is perhaps the
overriding emerging priority and there may be some doubt about direct payments for reducing GHG
emissions and increasing carbon sequestration being exemptible under green box requirements and
criteria. This could lead to an interest in crafting additional AoA provisions relating to climate change
mitigation while retaining the objective of achieving substantial reductions in trade-distorting domestic
support.
70 With a priority on mitigating climate change, considerations such as these could lead to interest in letting an AMS
become negative as a result of a tax on GHG emissions and thus offset positive AMSs in the summation to CTAMS.
71 A cap and trade scheme might allow a producer to offset the cost of acquiring the needed quantity of emission
entitlements by the value of GHG not emitted into the atmosphere when, for example, the producer converts animal
waste into biogas. This could raise the value of animal waste and stimulate the production of more livestock. If the
value of this policy-based credit were to be treated as a direct payment (especially if acquired from the government),
it is unclear how it would relate to the green box fundamental requirement of at most minimal effects on production.
102
9. LESSONS FROM TWENTY-FIVE YEARS OF IMPLEMENTATION EXPERIENCE
This paper has reviewed the AoA rules concerning domestic support in agriculture and evaluated
the space they generate that the governments of different members of the WTO can use for different kinds
of policies and support. Domestic support by itself continues to be a high-profile issue both in
implementing and renegotiating the AoA. Governments’ domestic support policies in agriculture also
operate in a complex and dynamic environment of other policy pressures within and beyond agriculture.
The paper has not attempted to fully address the place of domestic support rules and limits in that broader
context ‒ it keeps a tighter focus.
After reviewing the AoA domestic support rules, the paper reviews economic analysis regarding
key components of support. It presents a global overview of the major changes over time in members’
domestic support of different kinds as revealed by their notifications to the WTO Committee on
Agriculture (CoA) for the years 1995-2016 on which data is available for a large share of the members.
This is complemented by selected observations about several key members for subsequent years. The
paper summarizes exchanges within the CoA through 2019 over the notified information and other
questions about members’ support. It examines the measurement of market price support (MPS) in the
dispute China ‒ Agricultural Producers (DS511), in notifications and counter-notifications of India’s
support, and in the ongoing dispute India ‒ Measures Concerning Sugar and Sugarcane (DS580). The
paper reviews the options members are debating in the continuing but piecemeal negotiations about
domestic support. Finally, it assesses the capacity of the domestic support rules of the AoA to
accommodate policy priorities related to productivity growth, biosecurity, water management,
biodiversity and mitigation of climate change that have gained prominence since the agreement was
finalized in 1994.
This concluding section draws upon and integrates across the descriptive material and analysis
presented in preceding sections to draw conclusions from twenty-five years of experience under the AoA
and to assess how the diverse pressures for change affect its potential to reach the objective of
establishing a fair and market-oriented agricultural trading system. The AoA was intended to be the first
step toward further negotiations and agreements to discipline both border measures and the agricultural
domestic support of members within the framework of the WTO to achieve substantial progressive
reductions in support and protection. What emerges is that many issues need to be addressed in the area of
domestic support if the AoA is to contribute to curbing excessive support and achieving further reductions
in trade-distorting protection and support on a systematic, rules-based and multilateral basis.
9.1 Overview considerations
We start with several general observations. First, the AoA is a multilateral agreement. Domestic
support disciplines are rarely if ever observed in plurilateral or regional trade agreements. While a
participant’s border policies can be targeted to benefit other participants in a plurilateral or regional
agreement, this is not possible with domestic support policies. The benefits of domestic support
disciplines in a plurilateral or regional agreement would accrue not only to the parties themselves but also
to many others who have not taken on the same obligations. This makes the AoA unique in terms of
including domestic support disciplines.
Second, while the AoA is an agreement designed to limit some of the trade-distorting protection
and support that adversely affect other members, it bears acknowledgement that each member is the
primary stakeholder affected by its own policies. The rules and limits with which members are obliged to
comply under the AoA have served to nudge domestic support policies in certain directions, but the AoA
103
is far short of a blueprint for efficient and non-distorting policy design. The policy measures members use
remain diverse. Beyond the most general level, a convergence of the policies utilized by different
members is not evident. Thus, the AoA will have to continue to discipline in a mutually-effective manner
a diverse set of support policies. Members are certainly watching other members’ compliance with their
domestic support commitments, as the recent counter-notifications, disputes and ongoing monitoring and
negotiations demonstrate.
Third, as we have noted at various points, complex broad challenges and calls for reform of the
WTO both in its negotiation and dispute settlement functions cast a shadow over the reinvigoration of
negotiations to revise the AoA. These challenges have risen, for example, to the critical point of
paralyzing the dispute settlement appeals process in December 2019. Some of the pressures underlying
these broad challenges are evident when reviewing domestic support ‒ the emergence of China as the
member notifying the most Art. 6 support, for instance ‒ but the broad challenges cannot be resolved in
negotiations about a single sector. The larger context includes the growing question of what role any
distinction between developing and developed country members would play in the continued negotiations
and the eventual result. These and other dimensions of the context make it uncertain when, or even
whether, a substantive and systematic renegotiation of the AoA including its domestic support provisions
might occur. It is also uncertain whether incremental progress can be made on the issues that have
remained under discussion on domestic support rules and limits, cotton support, and the consequences of
developing-country acquisition at administered prices of public stocks for food security purposes.
Reaching an outcome on any of these issues will depend not only on what changes may be agreed in the
domestic support provisions by themselves but also in other provisions in the AoA and in wider
negotiations in the WTO.
A second and more imminent challenge has arisen since January 2020 from the Covid-19
pandemic sweeping the world and the consequent deep economic downturn. While our analysis was
completed largely before the pandemic emerged, many of the issues we address become even more
germane in its wake. In the immediate term, agricultural and food production and distribution have been
disrupted. Pressure is rising world-wide to support farmers and food processors as part of countries’
unprecedented policy responses. Whether WTO domestic support rules and commitments will help guide
this support into least-distorting channels remains to be seen. Longer term, the pandemic has exposed the
fragility of the integrated world economy. Stronger international institutions and cooperation will be
needed to help counter tendencies in some countries to forgo the benefits of integration. Reinvigorated
engagement through the WTO to guide global trade relations may prevail in this setting but cannot be
taken for granted. Forward-looking initiatives would need to include revisiting the rules and commitments
for agriculture, including those for domestic support.
Beyond these essential points of broad context, it is noteworthy that at a cursory level the trends
of support among different categories defined by the AoA have shifted significantly from 1995 through
2014-16 in the direction the AoA was intended to induce. At the global level, the trade-distorting Art. 6
support has fallen nominally and as a percentage of world value of production (VoP) in agriculture. This
has occurred despite the growing entitlements of members to provide such support under the AoA de
minimis provisions. Conversely, green box support, including China’s substantially increased
expenditures, has risen both nominally and as a percentage of world agricultural VoP. Entitlements to
further increases are unbounded. A casual observer might even conclude that the problem of excessive
trade-distorting support that the Uruguay Round sought to address had largely been solved.
A closer observation finds much that remains to be addressed. An observer of the discussions on
domestic support in the CoAgSS in recent years may see both hopeful signs of progress and areas where
104
members’ preferred processes or contents of the discussions seem less conducive to progress. Members’
penchant for using terminology that deviates both from the AoA and that used by other members makes it
more difficult both for others to embrace constructive ideas about complex rules and relationships and for
anyone to estimate the consequences for the policies of individual members. Putting these difficulties
aside, other concerns come to the fore.
9.2 Problematic dimensions of the AoA rules and limits
The AoA was a major innovation by creating rules and limits in domestic support to which
members committed adherence. The starting point was fitted to the diversity of kinds and levels of
support members provided at the time of the Uruguay Round negotiations. Agreeing on the rules and
limits involved concessions and political compromises.
Many aspects of the resulting agreement have proven problematic and others less problematic
than might have been expected. Herein we summarize what we conclude have proven to be the major
problematic aspects of the AoA and those less so. Not surprisingly, some of the problematic aspects of the
AoA have been the focus of members’ engagement in continued negotiations. We draw on these
discussions and our other observations for some insight about where changes are needed to strengthen the
AoA’s role in achieving the long-term objective of ensuring substantial progressive reductions in
agricultural support and protection. From these insights, we make several suggestions about where trade-
offs or improvements might be found that would strengthen the rules and commitments.
9.2.1 Concentration of support
Among the 135 members with an applicable WTO schedule, only a small number are responsible
for providing both the vast bulk of domestic support and the overwhelming majority of Art. 6 support
i.e., the sum of AMS support (whether de minimis AMSs or not), Art. 6.2 support and blue box support.
While not necessarily problematic in its own right, this concentration of support highlights that
renegotiation of the AoA would involve intense discussions among a small group of members with large
stakes in the outcome but diverse support policies. Negotiating limits to apply uniformly among those
members who have recently provided the largest amounts of Art. 6 support would run counter to special
and differential treatment for China, India and possibly several other developing country members
providing large amounts of support. It would be consistent with the call from some members for a
structural reform under which more advanced and larger developing country members forgo some
dimensions of such treatment and take on greater responsibility.
Since the amounts of Art. 6 support of most members in recent years have been small compared
to the support of the five or ten members with the largest amounts, relatively little effect on the amount of
support in the world would be achieved by applying the same limitations for all other members as for the
selected members. However, the tendency to let members’ AoA support of different categories in the past
guide the development of new rules can have unforeseen consequences. Using only information from the
past may say little about the future. The fact that many members have not circulated information about the
most recent years through notifications to the CoA exacerbates the problem of designing new rules.
9.2.2 Bound Total AMS
The AoA commitments based on levels of support in the 1986-88 base period gave members with
the highest levels of support at that time the space to maintain support for one or more products or non-
product-specific support above the de minimis level. This created a problematic bifurcation of members
that persists to this day. Members with a positive Bound Total AMS (BTAMS) are rightly seen by other
105
members to have more flexibility, especially in supporting certain products, than members with no
BTAMS or bound at nil. For members providing the most support within their BTAMS the amount of
support was well below that limit during 2014-16. Re-setting limits based on the observed lower amounts
of support in those years would require a negotiated concession from members having the BTAMS
flexibility. It would reduce the scope of the problem in empirical terms but not eliminate the problematic
structural bifurcation unless BTAMS of all members were brought to nil. The less ambitious suggestions
in the Doha Round negotiations and subsequent discussion to reduce the flexibility a positive BTAMS
provides by capping product-specific AMSs have not been endorsed by all. The United States’ support
has increased since 2018 within and possibly exceeding its BTAMS, in contrast to the decline observed
on a longer-term and broader basis. This makes negotiating tighter constraints more difficult. Responses
to the Covid-19 pandemic may lead to a new period of higher support among other members for some
duration of time, which also complicates discussion of domestic support rules.
9.2.3 De minimis limits and thresholds
When the AoA was first being implemented, the levels of support of members with no or a nil
BTAMS were generally low but these support levels have increased in recent years. This raises two
potentially problematic aspects of the de minimis allowances, whether limits or thresholds.
First, since the de minimis allowances grow with VoP, they provide space for increased AMSs
over time. The de minimis allowances give all members higher support entitlements if production values
increase. The sum of just ten major members’ de minimis allowances could approach USD 1,000 billion
in 2030 (linear trend estimate based on WTO 2019p). Growth in support becomes evident especially
when members raise their AMSs within the de minimis allowances while the VoP determining those
limits is also growing, as has been the case for China and India. The growing space for de minimis AMSs
makes the fixed BTAMS (summing to USD 170 billion for all members) less important over time,
although a positive BTAMS still affords a member flexibility in supporting some products at higher than
de minims levels.
A view that the growth of support within the de minimis allowances is problematic is tempered by
recognizing that the AMS for any product (and non-product-specific AMS) remains at or below the de
minimis level as a percentage of VoP. Any given AMS level in percentage terms applied to a larger
quantity of output results in more induced production. Still, if an AMS corresponding to a given de
minimis percentage of VoP is deemed to be not too distorting of production or trade, then that assessment
should not change as the AMS rises but remains within its de minimis percentage. The rising AMSs
provided within de minimis allowances may suggest the de minimis percentages in the AoA should be
reduced. The alternative of fixing de minimis allowances in nominal terms would imply that the
allowances fall as a percentage of increasing VoPs over time. Fixing nominal allowances runs the risk of
creating problems as have occurred with measuring the price gap in MPS using a fixed external reference
price (FERP). For example, a member may face difficulty staying within its allowance if it raises support
amounts in line with inflation. The same concern arises about BTAMS but empirically this has not been
problematic since members with positive BTAMS have mostly kept Current Total AMS (CTAMS) well
below this limit even with the experience of inflation over twenty-five years.
The increased AMSs of China within its de minimis limits during the 2010s highlights the second
problematic aspect of these limits. Members support only certain products within their agricultural
sectors. As a member expands the number of products supported, while keeping support for each product
within its de minimis allowance, the member’s summed AMS support in favor of agricultural producers
106
increases. Is it sufficient for other members not be too concerned because each product’s support is within
a de minimis allowance, or is this a concern that should be addressed in a renegotiated AoA?
9.2.4 Product-specific versus non-product-specific support
The AoA definition of an AMS makes a binary distinction between support in favour of the
producers of a basic agricultural product and support in favour of agricultural producers in general (Art.
1(a)). Some members report AMS support not only for the individual products but also for a set of some
of the same products. For example, the United States reports an AMS for orchards, vineyards, nursery at
the same time as it reports other AMS support for the individual products, such as for apples and for
peaches. Similarly, a product-specific livestock AMS is reported at the same time as individual AMSs are
reported for beef cattle and calves, bison, goats and hogs and pigs. The consequence is that the VoPs of
the individual products are counted twice and generate double de minimis allowances. This effectively
increases the room for AMS support that does not have to be included in the member’s CTAMS.
The practice of double-counting VoP may occur because a program provides support for a group
of products without distinguishing among them and the collection of product-specific data is not feasible.
This practicality does not, however, negate that double-counting occurs. While the double-counting may
not have been a critical issue in the past, the practice might be exploited on a greater scale in a situation
where declining limits on product-specific AMSs were to apply.
A parallel issue is the interpretation of “agricultural producers in general” as it applies to the non-
product-specific AMS. The definition of what constitutes non-product-specific AMS support may be
important not only in a situation of declining limits on product-specific AMSs. One reading might find
that the support would need to be in favour of all producers, another in favour of producers of a group of
products, such as certain crops. In either case a member could see an advantage in labelling more of its
AMS support as non-product-specific and thus make the product-specific allowances less constraining.
The total agricultural VoP is used to determine the non-product-specific de minimis allowance. This
allows what is in fact product-specific support for the producers of each of several individual products in
excess of each product’s de minimis allowance to be fitted within the non-product-specific de minimis
allowance.
9.2.5 Market price support
Measuring MPS under the AoA has proven problematic. In the case of China, the AoA
measurement as adjudicated in China ‒ Agricultural Producers (DS511) has imposed only very modest
constraint on the economic price support for wheat and rice. In the case of India, the AoA measurement,
as calculated in recent counter-notifications for wheat, rice, cotton and pulses, and in counter-notifications
and a submission in the dispute India ‒ Measures Concerning Sugar and Sugarcane (DS580), is much
larger than the economic price support. The AoA measurement of MPS is a prime candidate for
renegotiation.
There are two underlying problems with MPS as calculated under the AoA. The first is the use of
a very out-of-date reference price in calculating the price gap that enters the calculation. In many cases
the resulting gap generates a large amount of AoA MPS even if there is only little or no support in
economic terms. Allowing eligible production to be defined by legislated caps on procurements also
distances the AoA MPS from an economic measurement, in this case allowing less support to be
calculated than if total production were used.
107
Thus, the AoA measurement of MPS often misrepresents the actual amount of support. Economic
effects in the form of production and trade distortions do not derive from the AoA measurement of MPS
but from the MPS measured through economic methods. The rationale for designing new limits based on
the amount of MPS members have calculated using the AoA measurement is not obvious. Designing new
limits without addressing the real source of distortions, i.e., economic support, would invite members to
design future policies to comply with AoA limits without necessarily reducing their distorting support.
China has recently taken such steps to reduce AoA MPS for wheat and rice so as to comply with AoA
limits with little need to reduce support in economic terms.
The 2018 counter-notifications about India’s AoA MPS for wheat and rice claim that India’s use
of administered prices makes those measurements greatly exceed India’s limits. Yet India’s administered
prices in the past have exceeded international prices only by small margins, if at all. This casts doubt on
what a successful challenge on wheat and rice could accomplish in terms of reducing distortions (the
situation for sugarcane is different). If new rules for domestic support are to be effective, they need be
designed on the basis of economic realities, not merely on the often misleading information generated by
AoA measurements. WTO decisions on challenging an excessive AMS in the context of developing-
country acquisition of stocks at administered prices for food security purposes reduce the likelihood of
India’s compliance with its AoA commitments being challenged for wheat and rice. But this does not
resolve the problematic divergence between the AoA MPS and economic support.
In view of the large profile members have given to the issue of developing-country acquisition at
administered prices of public food stocks it is surprising in general what a minor role any economic
analysis plays in the discussions. There is, for example, a dearth of analysis of the difference between
acquiring stocks at market prices and acquiring at administered prices. Since much of the discussions
seems to assume that the only way to accumulate public stocks is to procure at administered prices,
economic analysis of all the pros and cons for a stockholding scheme of procuring at market prices and at
administered prices could be useful for finding a permanent solution as envisaged in the 2013 ministerial
decision and subsequent decisions.
A re-specification of the calculation of MPS also could have a salutary effect on the impasse that
characterizes the discussion about the consequences of acquisition at administered prices of public stocks
for food security purposes. With a more economically meaningful measurement of MPS some of the
stress underlying calls for exemption from effective limit would dissipate, allowing negotiators more
latitude to find an agreed decision.
9.2.6 Article 6.2
The Art. 6.2 exemption from limit of certain investment and input subsidies in developing
countries was at the time a significant concession to those members. India has exempted vastly larger
amounts of support than other members under this provision since 1995 so pragmatically any constraints
placed on Art. 6.2 support starting from the current standpoint would mainly affect India. India’s
exemption of increasingly large amounts of Art. 6.2 support drove a wedge between a more inclusive
measurement of support on which limits were being negotiated in the Doha Round, but in which Art. 6.2
support remained unconstrained, and India’s Art. 6 support. At the time momentum toward reaching a
Doha Round agreement was weakening, in part because of such exceptions. Art. 6.2 remains a potentially
problematic avenue for large amounts of trade-distorting support to be exempted from limits by other
developing country members, even if moderately used so far. Placing constraints on Art. 6.2 support
based on levels of past use would close off this possibility.
108
9.2.7 Article 6.5 (blue box)
Agreement to define and include the blue box exemption in the AoA by the EU and the United
States was a crucial step in concluding the Uruguay Round. The blue box exemption was then a stepping
stone in the subsequent EU policy transition from mostly Art. 6 to mostly green box support, while the
United States used it for only one year. Both the EU and the United States have thus moved away from
relying on this exemption. The blue box exemption has therefore not proven as problematic as it might
have been if large payments had continued to be exempted under it. The requirements that blue box
programs be production-limiting and that payments be made on a fixed base likely make blue box
payments less distorting than AMS price support or input subsidies.
Compliance with the blue box requirements merits monitoring in the context of China having
begun to exempt blue box payments in 2016 and its potential use by other members. Potential renewed
use of the blue box exemption by the United States in particular needs to be monitored. Members may
also seek to address emerging priorities, such as climate change mitigation, by means of payments
exempted on blue box grounds. Compliance monitoring would be more effective if it was clear what
meaning attaches to “production-limiting programs”. Including blue box payments under a cap on, for
example, all Art. 6 support might further incentivize members to use the green box exemption so that blue
box payments continue to be low and used by only few members. However, a more inclusive cap on
support that was set so high that past blue box payments would be accommodated would then effectively
leave a few members with relatively more room than other members for distorting forms of support.
9.2.8 Annex 2 (green box)
Green box exemptions have grown substantially during the twenty-five years of the AoA.
Increases in general services expenditures have merit because public goods are provided that improve
market performance and enhance long-term productivity. These are positive outcomes in terms of
efficient resource use and sustainably meeting future world food demand. Growth in green box direct
payments has also been substantial, including large payments in the EU and China. Economic research on
green box direct payments indicates that in most circumstances such payments are less production or
trade distorting than Art. 6 support. While receiving much attention, the direct payments exempted on
green box grounds do not seem too problematic in terms of achieving the objectives of the AoA. There is
thus less reason to be concerned than is sometimes expressed about the amounts of direct payments being
exempted from limit under the green box. Monitoring of compliance with the green box criteria remains
important.
Many of the pressures governments face today in agriculture are different from those when the
AoA was negotiated, and the policies that provide domestic support in favour of agricultural producers
are addressing evolving priorities. Among these, the paper discusses the potential for accommodating
support in the areas of productivity growth, biosecurity, water management, biodiversity and mitigation of
climate change within the AoA domestic support provisions. Governments have the option of addressing
these and other priorities through policies under which support is not subject to limit. The green box
(Annex 2) offers unlimited room for support, whether expenditures on general services or direct payments
to producers, through policies that meet certain requirements and criteria. The requirements and criteria
are open-ended and can thus accommodate policies addressing many kinds of priorities. There may be a
need to clarify, through particular criteria and conditions beyond those in the current green box, what kind
of support policies in the area of mitigating climate change would qualify for exemption from limit.
109
9.3 Addressing the problematic dimensions of the AoA
Taking the above observations into account, we conclude discussion of twenty-five years of
implementing experience with a focus on two approaches to addressing the problematic aspects of the
domestic support rules and limits: balancing and reducing the amount of Art. 6 support and improving the
measurement of MPS within Art. 6.
9.3.1 Balancing and reducing Article 6 support
The long-term objective should be more consistency of the rules among different groups of
members and lower levels of Art. 6 support. Some members prioritize reducing or eliminating BTAMS,
i.e., eventually making it impossible for any AMS of any member to exceed its de minimis level.
Reducing or eliminating BTAMS is one important element of levelling the future playing field but cannot
by itself do as much to improve market orientation as it would in combination with making sure that all
forms of distorting support are subject to limit and, eventually, cutting back on all members’ de minimis
allowances.
Under the objective of reducing the amount of Art. 6 support provided globally, one way forward
would be to focus on those members that provide the largest amounts of support. Eliminating over time
the entitlements to large or unlimited amounts of support other than green box support of a small number
of members would go a long way towards reducing the large amounts of Art. 6 support these members
could otherwise provide in the future.
Product-specific support has been reported to be regularly cited by members as the most
distorting form of support in agricultural trade (WTO 2019j). This likely refers to product-specific AMSs.
The analytical basis for this selection of the most distorting form of support is not clear. Economic
analysis supports the view that product-specific MPS, appropriately measured, is part of the potentially
most distorting support. But analysis also shows that on a per currency-unit basis subsidies for the
unconstrained use of variable inputs distort as much as or more than price support. Some input support
has escaped AoA limits by means of the Art. 6.2 exemption. Singling out only product-specific AMSs as
the most distorting form of support would therefore reduce the effectiveness of future rules in reducing
trade-distorting support.
Comprehensive reductions of Art. 6 support could take the form of eliminating the entitlements to
AMS support above de minimis limits (i.e., eliminating the BTAMS) and eliminating the exemption of
Art. 6.2 support and blue box support not only from the calculation of CTAMS but also from the
calculation of individual AMSs. This would result in only green box support then being exempt from
limit. A member’s de minimis limits would apply not only to AMS support but to the sum of all
categories of Art. 6 support. To achieve this outcome, concession by members with positive BTAMS
under the AoA would be offset by concession from members with entitlement to Art. 6.2 exemptions and
by leveling of the de minimis limits between developed and developing country members. The first
concession would have been impossible from the starting point of AMS support levels preceding the
Uruguay Round but is more plausible from the lower levels of support during 2014-16. The second
concessions are likely impossible as long as some members retain the advantage of a positive BTAMS.
The joint outcome would reflect the realities of constraining today’s Art. 6 support, where the highest
levels are seen in both developed and developing country members, not just developed country members.
A focus on leveling the playing field among those members providing the most support leaves
open the question of what rules would apply to other members. Since the amount of Art. 6 support of
most members in recent years has been small compared to the support of a few members, relatively little
110
effect on the amount of support in the world would be achieved by applying the same limits for all other
members as for the selected members. All other members could, for example, be exempted from the
elimination of entitlements to BTAMS and the Art. 6.2 and blue box exemptions. If it was seen as crucial
to eliminate or reduce Art. 6 support beyond de minimis limits for all members, the rules could be
designed to be implemented over a longer period or to apply differently to different groups of members.
Eliminating BTAMS and including Art. 6.2 support and blue box support in the AMS
calculations of five or ten selected members would result in their Art. 6 support being bounded by their de
minimis limits. This would allow the specific and more ambitious outcome with regard to cotton to take
the form of reducing the de minimis percentage for the limit on Art. 6 cotton support. Alternatively, if
there was agreement to reduce all de minimis percentages for Art. 6 support, the percentage for cotton
could be reduced by more than the other percentages.
As an interim step in moving in these directions, more openness in the discussions among
members to considering alternative scenarios for the support which the major agricultural producers of the
future might provide could open the door to new rules that are more effective in countering distortions.
This transparency would need to be combined with strengthened monitoring of compliance and the
institutionalization of a process to review and update the rules as the world changes.
9.3.2 Improving the measurement of market price support
Measuring MPS under the AoA is fraught with problems as articulated throughout the paper. As
an alternative to the AoA MPS, an LRP MPS is examined that retains the AAP in the measured price gap
but replaces the FERP with a moving average of lagged border prices. Requiring also that all production
be counted as eligible production, the resulting LRP MPS would often differ less from the economic MPS
than does the AoA MPS. This is illustrated for wheat in China and India during 2008-18.
The LRP MPS measurement enables the government to use an administered price to benchmark
producer prices in the domestic market within the space that is available from the separately negotiated
border protection. Some members see this as an essential policy option. Use of AAP in the price gap of
the LRP also allows room for the domestic price to exceed the AAP without raising the MPS. This would
accommodate the effects on domestic prices of tariffs or other border or behind-the-border policy
measures without making these effects subject to the domestic support discipline. This flexibility is
important to some. The use in the LRP MPS of a moving average of lagged border prices to calculate the
reference price is not ideal compared to using the current border price. However, it allows the reference
price in many situations to be closer to the current border price than using a FERP based on increasingly
distant past years.
Such an improved measurement of MPS under the AoA could bring the effect of the AoA
discipline on AMS closer to what it would be if applied to an AMS including the economic MPS. The use
of a moving average reference price in MPS calculations was discussed in the Uruguay Round
negotiations along with the idea of a FERP being fixed only for five years (GATT 1989). Although
neither of these ideas has received substantial subsequent attention, the experience gained over time of
implementing price policies and applying the rules of the AoA suggest consideration is warranted of the
idea of using a moving average of lagged border prices instead of a FERP to calculate MPS. An approach
like this may be the key to resolving the tension about the MPS associated with developing-country
acquisition at administered prices of stocks for food security purposes in the AMS. Lessening the
contention that has surrounded the consequences of the AoA measurement of MPS would allow members
to turn more attention in the CoA and in negotiations to other areas where their efforts could enhance the
global regime of domestic support policies.

111
9.4 Managing domestic support in the era of Covid-19
As described throughout this paper and synthesized above, many challenges face the WTO as its
members seek to maintain and strengthen a multilateral framework of rules and limits for domestic
support in agriculture. In bringing this paper to closure in April 2020, a further brief comment merits
inclusion on the challenges moving forward in the era of Covid-19. The pandemic spread globally in the
first few months of 2020. Among its devastating impacts, the pandemic’s morbidity and mortality, and
the economic effects of containment measures required to cope with its virulence, have disrupted
agriculture and food markets throughout the world. There remains great uncertainty about how severe the
pandemic will be and over what duration of years. Thus medium-term and long-term impacts, including
on agricultural markets, cannot yet be known. World market agricultural prices dropped sharply in March
2020 for many products and are projected to be much lower for the next two or three years than was
earlier anticipated. Supply disruptions are also possible, with consumer food price spikes a possibility.
In this context, we have noted the increase in support payments in the United States since 2018.
The initial increases in 2018 and 2019 resulted from a new Market Facilitation Program (MFP) argued to
offset lower prices that were a consequence of trade policies the United States pursued unilaterally. These
payments have been sufficiently large that the United States may exceed its BTAMS for 2019, an
outcome more likely with the declining prices resulting from the Covid-19 pandemic. This will weaken
the interest of the United States in further curbs on the domestic support of some kinds that members may
choose to provide in the future.
The United States has also enacted new payments in 2020 related directly to market conditions
resulting from the Covid-19 pandemic. Further payments are likely to be legislated. Other members may
also expand support in this context. Some of this support may meet the green box criteria for exemption
but increased non-green-box support is also likely. Here governments need to balance two concerns:
maintaining and finding ways to strengthen the multilateral rules and limits while also managing the
extraordinary situation the Covid-19 pandemic has created. Pragmatism going forward will be needed,
along with keeping a focus on long-term goals and the role the WTO can play.
9.5 Final remark
We have presented evidence and analysis in this IATRC Commissioned Paper to take stock on
domestic support in agriculture as it has been disciplined under the rules and commitments of the AoA
and to examine what rules and commitments might in the future be agreed upon through the WTO.
Gaining the benefits of less distorted trade, governed by multilaterally agreed and systematic rules, has
been hindered by the dissensions that have prevented the negotiations on agriculture from reaching
commitments to further reduce trade-distorting protection and support. The faltering of the Doha Round
has not meant a continuation of the status quo. Rather, a crisis of commitment engulfs the multilateral
trade system under a changing global policy landscape, findings in dispute settlement that we have
assessed with reference to domestic support in particular, a lack of progress in negotiations, and emergent
policy priorities. Tensions are likely to be exacerbated by the Covid-19 pandemic. Perhaps a new sense of
crisis will motivate new appreciation of the value members derive from the global trade system with the
WTO its central institution. That could lead to substantial changes in the WTO and renewal of its
relevance. Agricultural negotiations will have to be part of any endeavor to revitalize members’
commitments. This necessity is what motivates taking stock and looking forward on domestic support
under the WTO Agreement on Agriculture.
112
REFERENCES
Abbott, P., B. Johnston, D. Blandford, M. Kilkenny, H. Bochniarz, S. Magiera, P. Dixit, R. McGregor, K.
Frohberg, S. Robinson, T. Hickenbotham, V. Roningen, and R. House. 1988. Bringing agriculture
into the GATT: Assessing the benefits of trade liberalization. Commissioned Paper No. 2.
International Agricultural Trade Research Consortium (IATRC).
Abler, D. and D. Blandford. 2005. Decoupling – Policy implications. AGR/CA/APM(2005)22/FINAL,
Working Party on Agricultural Policies and Markets, Committee for Agriculture, Organisation for
Economic Co-operation and Development.
http://www.oecd.org/officialdocuments/publicdisplaydocumentpdf/?cote=AGR/CA/APM(2005)2
2/FINAL&docLanguage=En
Aguiar, A., M. Chepeliev, E. Corong, R. McDougall, and D. van der Mensbrugghe. 2019. The GTAP data
base: Version 10. Journal of Global Economic Analysis 4(1) 1-27.
https://www.jgea.org/resources/jgea/ojs/index.php/jgea/article/view/77/96
Anderson, K (ed). 2009. Distortions to Agricultural Incentives: A Global Perspective, 1955 to 2007.
Washington DC: The World Bank.
https://elibrary.worldbank.org/doi/abs/10.1596/978-0-8213-7665-2
Ansell, D., F. Gibson and D. Salt (eds.). 2016. Learning from Agri-Environment Schemes in Australia:
Investing in Biodiversity and Other Ecosystem Services on Farms. Acton, Australia: ANU Press.
https://press.anu.edu.au/publications/books?search=ansell&sort=
Banga, R. 2014. Impact of green box subsidies on agricultural productivity, production and international
trade. Background Paper No. RVC-11, United Nations Conference on Trade and Development
(UNCTAD). https://unctad.org/en/pages/PublicationWebflyer.aspx?publicationid=941
Ballenger, N., D. McClatchy, F. de Filippis, S. Mercier, P. Dixit, W. Miner, H. Guyomard, T. Roe, T.
Hertel, E. Rossmiller, M. Johnson, J. Sharples, T. Josling, M. Tsigas, and L. Mahé. 1990.
Commissioned Paper No. 5. International Agricultural Trade Research Consortium (IATRC).
Barichello, R. D. Harvey, P. Barkley, S. Offutt, D. Blandford, J. Sutton, H. de Gorter, A. Webb, B.
Gardner, and S.-E. Webb. 1988. Bringing agriculture into the GATT: Designing acceptable
agricultural policies. Commissioned Paper No. 3. International Agricultural Trade Research
Consortium (IATRC).
Blandford, D. 2019. Policy challenges in the management of natural resources. In Global Challenges for
Future Food and Agricultural Policies, ed. D. Blandford and K. Hassapoyannes. Singapore:
World Scientific.
Blandford, D. 2018. Border and related measures in the context of adaptation and mitigation to climate
change. Background paper, The State of Agricultural Commodity Markets (SOCO). Rome: FAO.
http://www.fao.org/3/CA2343EN/ca2343en.pdf.
Boulanger, P., G. Philippidis and H. Jensen. 2015. EU agricultural domestic support in GTAP: A proposal
for an alternative approach. Paper prepared for the 18th Annual Conference on Global Economic
Analysis "Information for the Policy Maker: Practical Economic Modelling for Tomorrow",
Melbourne, Australia.
https://www.gtap.agecon.purdue.edu/resources/res_display.asp?RecordID=4702
113
Bredahl, M., B. Chattin, B. Johnston, T. Josling, R. Landes, S. Langley, C. Mabbs-Zeno, S. Magiera, K.
Meilke, W. Miner, E. Rossmiller, F. Sanderson, N. Schwartz, S. Tangermann, and T.K. Warley.
1988. Negotiating a framework for action. Commissioned Paper No. 1. International Agricultural
Trade Research Consortium (IATRC).
https://iatrc.umn.edu/category/publications/trade-issues-papers-and-commissioned-papers/
Bredahl, M. T. Josling, W. Miner, E. Rossmiller, S. Tangermann, T.K. Warley. 1990. Bringing
agriculture into the GATT: The comprehensive proposals for negotiations in agriculture.
Commissioned Paper No. 7. International Agricultural Trade Research Consortium (IATRC).
Bredahl, M., T. Josling, A. McCalla, K. Meilke, W. Miner, S. Tangermann, A. Tutwiler, T.K. Warley.
1991. Bringing agriculture into the GATT: Reviving the GATT negotiations on agriculture.
Commissioned Paper No. 8. International Agricultural Trade Research Consortium (IATRC).
Brink, L. 2019. Product-specific, non-product-specific or in between: Practices and consequences
under the WTO Agreement on Agriculture. (Powerpoint). Presented at annual meeting,
International Agricultural Trade Research Consortium (IATRC), 8-10 December.
https://drive.google.com/file/d/1K7EmGwrnRnTR_gIIZ5M_G0Exw6WtlEp9/view
Brink, L. 2018a. Farm support, domestic policies, and the WTO rules: The world is changing. In
Volume III: International Trade Rules for Food and Agricultural Products, Handbook of
International Food and Agricultural Policies, ed. K. Meilke and T. Josling. Singapore: World
Scientific Publishing Co. Pte. Ltd.
Brink, L. 2018b. Two indicators, little in common, same name: Market Price Support. CAP Reform, 29
August. http://capreform.eu/two-indicators-little-in-common-same-name-market-price-support/
Brink, L. 2018c . The domestic support landscape in agriculture: policy trends and emerging patterns.
Presentation at symposium Agriculture Policy Landscape, World Trade Organization, 13-14
June, Geneva.
www.wto.org/english/tratop_e/agric_e/symposium_ag_policy_landscape_e/s4_brink.pdf
Brink, L. 2015a. Policy space in agriculture under the WTO rules on domestic support. Working Paper
#15-01, International Agricultural Trade Research Consortium (IATRC).
ageconsearch.umn.edu/bitstream/207090/2/WP15-01%20Brink.pdf
Brink, L. 2015b. Investment and input subsidies: A growing category of farm support exempted from
WTO limits. (Powerpoint). Presented at annual meeting, International Agricultural Trade
Research Consortium (IATRC), 13-15 December. https://ageconsearch.umn.edu/record/229234
Brink, L. 2014. Support to agriculture in India in 1995-2013 and the rules of the WTO. Working Paper
#14-01, International Agricultural Trade Research Consortium (IATRC).
ageconsearch.umn.edu/bitstream/166343/2/WP%2014-01%20Brink.pdf
Brink, L. 2012. Value of production in agriculture: Meaning, measurement and implications in a WTO
context. (Powerpoint). Presented at annual meeting, International Agricultural Trade Research),
9-11 December. https://ageconsearch.umn.edu/record/143176
Brink, L. 2011. The WTO disciplines on domestic support. In WTO Disciplines on Agricultural Support,
ed. D. Orden, D. Blandford and T. Josling. Cambridge UK: Cambridge University Press.
Brink, L. 2009. WTO constraints on domestic support in agriculture: Past and future. Canadian Journal
of Agricultural Economics 57(1):1-21. https://doi.org/10.1111/j.1744-7976.2008.01135.x
114
Brink, L. 2006. WTO constraints on U.S. and EU domestic support in agriculture: The October 2005
proposals. The Estey Centre Journal of International Law and Trade Policy 7(1): 96-115.
https://ageconsearch.umn.edu/record/23822?ln=en
Brink, L., D. Orden and G. Datz. 2013. BRIC agricultural policies through a WTO lens. Journal of
Agricultural Economics 64(1): 197-216. DOI: 10.1111/1477-9552.12008
Brink, L., D. Orden and C. Zulauf. 2019. WTO dispute panel report on China’s agricultural support.
farmdoc daily (9):40, Department of Agricultural and Consumer Economics, University of
Illinois at Urbana-Champaign, March 6.
https://farmdocdaily.illinois.edu/2019/03/wto-dispute-panel-report-on-chinas-agricultural-
support.html
Bureau, J.-C. 2017. Does the WTO discipline really constrain the design of CAP payments? CAP
Reform blog, 23 October. http://capreform.eu/does-the-wto-discipline-really-constrain-the-
design-of-cap-payments/
Cahill, S. 1997. Calculating the rate of decoupling for crops under CAP/Oilseeds reform. Journal of
Agricultural Economics 48(3): 349-378.
https://onlinelibrary.wiley.com/doi/pdf/10.1111/j.1477-9552.1997.tb01159.x
Cahill, S. 1993. CAP reform: How decoupled are the compensatory payments? Working Paper 11/93,
Economic Analysis Division, Policy Branch, Agriculture Canada.
https://ageconsearch.umn.edu/record/244085?ln=en
Chambers, R. and D. Voica. 2016. “Decoupled” farm program payments are really decoupled: The
theory. American Journal of Agricultural Economics 99(3): 773-782.
Chaplin, S., V. Robinson, A. Le Page, H. Keep, J. Le Cocq, D. Ward, D. Hicks, E-M Scholz. 2019. Pilot
results-based payment approaches for agri-environment schemes in arable and upland grassland
systems in England. Final Report to the European Commission. Natural England and Yorkshire
Dales National Park Authority.
http://publications.naturalengland.org.uk/publication/6331879051755520
Coppess, J., N. Paulson, G. Schnitkey, K. Swanson, and C. Zulauf. 2020. Payments or purchases:
questions for USDA on priorities in a pandemic. farmdoc daily (10):76, Department of
Agricultural and Consumer Economics, University of Illinois at Urbana-Champaign, 24 April.
https://farmdocdaily.illinois.edu/2020/04/payments-or-purchases-questions-for-usda-onpriorities-
in-a-pandemic.html
Cororaton, C. and D. Orden. 2019. The importance of technical barriers to agri-food trade: Evidence from
the TBT Specific Trade Concerns raised at the WTO. GII-ISCE Working Paper No. 2019-1,
Virginia Tech, 15 June.
https://www.researchgate.net/publication/333703909_The_Importance_of_Technical_Barriers_to
_Agri-Food_Trade_Evidence_from_the_TBT_Specific_Trade_Concerns_Raised_at_the_WTO
de Gorter, H. 2009. The distributional structure of U.S. green box subsidies. In Agricultural Subsidies in
the WTO Green Box – Ensuring Coherence with Sustainable Development Goals, ed. R.
Meléndez-Ortiz, C. Bellman, and J. Hepburn. Cambridge, UK: Cambridge University Press.
DFAT (Department of Foreign Affairs and Trade). 2020. India Measures concerning sugar and
sugarcane (DS580). Australia’s First Written Submission. 16 January.
https://www.dfat.gov.au/trade/organisations/wto/wto-disputes/Pages/summary-of-australias-
involvement-in-disputes-currently-before-the-world-trade-organization
115
Deuss, A. and M. Adenäuer (forthcoming). China’s grain reserves, price support and import policies:
examining the medium-term market impacts of alternative scenarios. No. xxx, OECD Food,
Agriculture and Fisheries Papers. Paris: OECD Publishing.
Dewbre, J., J. Antón, and W. Thompson. 2001. The transfer efficiency and trade effects of direct
payments. American Journal of Agricultural Economics 83(5): 1204-1214.
Díaz-Bonilla, E. 2017. Food security stocks and the WTO legal framework. In Agriculture, development,
and the global trading system: 2000–2015, ed. A. Bouët and D. Laborde Debucquet. Washington,
D.C.: International Food Policy Research Institute (IFPRI).
https://doi.org/10.2499/9780896292499_
Dimaranan, B., T. Hertel and R. Keeney. 2003. OECD domestic support and the developing countries.
GTAP Working Paper No. 19.
https://www.gtap.agecon.purdue.edu/resources/working_papers.asp
EC (European Commission). 2018. Future of the common agricultural policy.
https://ec.europa.eu/info/food-farming-fisheries/key-policies/common-agricultural-policy/future-
cap#latest
EC. 2007. CAP reform: Fruit and vegetable reform will raise competitiveness, promote consumption, ease
market crises and improve environmental protection. Press release IP/07/810, 12 June.
https://europa.eu/rapid/press-release_IP-07-810_en.htm
FAO (Food and Agriculture Organization of the United Nations). 1975. Agricultural protection and
stabilization policies: a framework of measurement in the context of agricultural adjustment.
Conference, C 75/LIM/2. http://www.fao.org/3/ca4660en/ca4660en.pdf
FAO. 1973. Agricultural protection: Domestic policy and international trade. Conference, C 73/LIM/9.
http://www.fao.org/3/ca4658en/ca4658en.pdf
Galtier, F. 2017. Looking for a permanent solution on public stockholding programmes at the WTO:
Getting the right metrics on the support provided. The E15 Initiative: Strengthening the Global
Trade and Investment System for Sustainable Development. Geneva: International Centre for
Sustainable Development (ICTSD) and World Economic Forum.
http://e15initiative.org/publications/looking-for-a-permanent-solution-on-public-stockholding-
programmes-at-the-wto-getting-the-right-metrics-on-the-support-provided/
Galtier, F. 2015. Identifying, estimating and correcting the biases in WTO rules on public stocks. A
proposal for the post-Bali food security agenda. Working Paper MOISA 2015-5, UMR Marchés,
organisations, institutions et stratégies d’acteurs. Montpellier, France: CIRAD.
https://hal.archives-ouvertes.fr/hal-01295403/document
GATT (General Agreement on Tariffs and Trade). 1958. Trends in International Trade - Report by a
Panel of Experts. Sales No. GATT/1958-3. Geneva: The Contracting Parties to the General
Agreement on Tariffs and Trade.
GATT. 1989. Summary of the main points raised at the fourteenth meeting of the Negotiating Group on
Agriculture. MTN.GNG/NG5/W/103. Negotiating Group on Agriculture, Multilateral Trade
Negotiations The Uruguay Round. 4 September.
https://www.wto.org/gatt_docs/English/SULPDF/92080038.pdf
Glauber, J. 2019. Agricultural trade aid: Implications and consequences for US global trade relationships
in the context of the World Trade Organization. American Boondoggle, American Enterprise
Institute, November. https://www.aei.org/category/american-boondoggle/
116
Glauber, J. 2018. Domestic support measures in the context of adaptation / mitigation to climate change.
Background Paper, The State of Agricultural Commodity Markets (SOCO) 2018. Rome: FAO.
2018. http://www.fao.org/3/CA2422EN/ca2422en.pdf
Glauber, J. 2016. After Nairobi: Public stockholding for food security. In Evaluating Nairobi: What Does
the Outcome Mean for Trade in Food and Farm Goods?, ed. J. Hepburn and C. Bellmann,
ICTSD Programme on Agricultural Trade and Sustainable Development. Geneva: International
Centre for Trade and Sustainable Development (ICTSD).
http://www.ictsd.org/sites/default/files/research/Evaluating%20Nairobi%20-
%20What%20Does%20the%20Outcome%20Mean%20for%20Trade%20in%20Food%20and%2
0Farm%20Goods.pdf
Glauber, J. J. Hepburn, D. Laborde and S. Murphy. 2020. What national farm policy trends could mean
for efforts to update WTO rules on domestic support. IISD Report. International Institute for
Sustainable Development. April. https://www.iisd.org/library/national-farm-policy-trends
Goodwin, B. and A. Mishra. 2006. Are “decoupled” farm program payments really decoupled? An
empirical evaluation. American Journal of Agricultural Economics 88(1): 73-89.
Government of India. 2018. Price Policy for Kharif Crops – Marketing Season 2017-18 (and later years).
Commission for Agricultural Costs and Prices, Ministry of Agriculture and Farmers’ Welfare.
https://cacp.dacnet.nic.in/KeyBullets.aspx?pid=39
Grant, J. and S. Arita. 2017. Sanitary and phytosanitary measures: Assessment, measurement and impact.
Commissioned Paper No. 21, International Agricultural Trade Research Consortium (IATRC),
May. https://ageconsearch.umn.edu/record/259417?ln=en
Gruère, G. and H. Le Boëdec. 2019. Navigating pathways to reform water policies in agriculture. OECD
Food, Agriculture and Fisheries Papers, No. 128. Paris: OECD Publishing.
.http://dx.doi.org/10.1787/906cea2b-en
Gulati, A., D. Kapur and M. Bouton. 2019. Reforming Indian agriculture. CASI Working Paper, Center
for the Advanced Study of India (CASI) and Indian Council for Research on International
Economic Relations (ICRIER), August.
https://casi.sas.upenn.edu/sites/default/files/research/REFORMING%20INDIAN%20AGRICUL
TURE%20-%20CASI%20WP%20-%20Gulati%2C%20Kapur%2C%20Bouton_0.pdf
Gundimeda, H., A. Markandya and A. M. Bassi. 2018. TEEBAgriFood methodology: an overview of
evaluation and valuation methods and tools. In TEEB for Agriculture & Food: Scientific and
Economic Foundations. Chapter 7. Geneva: UN Environment. http://teebweb.org/agrifood/wp-
content/uploads/2018/11/Ch7.pdf
Häberli, C. 2018. Potential conflicts between agricultural trade rules and climate change treaty
commitments. Background paper, The State of Agricultural Commodity Markets (SOCO) 2018.
Rome: FAO. http://www.fao.org/3/CA2345EN/ca2345en.pdf
Hassapoyannes, K. and D. Blandford. 2019. Agriculture and climate change: National and international
policy response. In Global Challenges for Future Food and Agricultural Policies, ed. D.
Blandford and K. Hassapoyannes. Singapore: World Scientific.
Hasund, K. and M. Johansson. 2016. Paying for environmental results is WTO compliant. EuroChoices
15(3): 33-38. https://onlinelibrary.wiley.com/toc/1746692x/2016/15/3
117
Henderson, B. and J. Lankoski.2019. Evaluating the environmental impact of agricultural policies. OECD
Food, Agriculture and Fisheries Papers, No. 130, OECD Publishing, Paris.
http://dx.doi.org/10.1787/add0f27c-en
Hendricks, N. and D. Sumner. 2014. The effects of policy expectations on crop supply, with an
application to base updating. American Journal of Agricultural Economics 96(3): 903-923.
https://academic.oup.com/ajae/article-abstract/96/3/903/52831
Hertel, T. 1989. Negotiating reduction in agricultural support: Implications of technology and factor
mobility. American Journal of Agricultural Economics 71(3): 559-572.
Hoda, A. and A. Gulati. 2013. India’s agricultural trade policy and sustainable development. Issue Paper
No. 49, ICTSD Programme on Agricultural Trade and Sustainable Development, September.
https://www.ictsd.org/sites/default/files/event/2013/09/indias-agricultural-trade-policy-and-
sustainable-development-goals1.pdf
Huang, H. 2013. Agricultural domestic support. In Global Trade, Assistance, and Production: The
GTAP 8 Data Base, ed. B. N. G. Walmsley, A. Aguiar, and R. McDougall. Center for Global
Trade Analysis, Department of Agricultural Economics, Purdue University, West Lafayette, IN.
https://www.gtap.agecon.purdue.edu/resources/res_display.asp?RecordID=4296
ICTSD (International Centre for Trade and Sustainable Development. 2016. Public stockholding for food
security purposes: Options for a permanent solution. Issue Paper, November. Geneva:
International Centre for Trade and Sustainable Development.
https://www.ictsd.org/sites/default/files/research/public_stockholding_for_food_security_purpose
s_options_for_a_permanent_solution.pdf
IMF (International Monetary Fund). 2019. Exchange Rates, National Currency per U.S. Dollar, Period
Average, Rate. International Financial Statistics.
http://data.imf.org/?sk=4C514D48-B6BA-49ED-8AB9-52B0C1A0179B&sId=1390030341854.
Accessed 11 June 2019.
Josling, T. 2015. Rethinking the rules for agricultural subsidies. Think Piece. E15 Initiative. Geneva:
International Centre for Trade and Sustainable Development (ICTSD) and World Economic
Forum. http://e15initiative.org/wp-content/uploads/2015/09/E15-Subsidies-Josling-Final.pdf
Josling, T., M. Honma, J. Lee, D. MacLaren, B. Miner, D. Sumner, S. Tangermann, Stefan, and A.
Valdes. 1994. Bringing agriculture into the GATT: The Uruguay Round Agreement on
Agriculture, an evaluation. Commissioned Paper No. 9. International Agricultural Trade Research
Consortium (IATRC).
Josling, T. and K. Mittenzwei. 2013. Transparency and timeliness: the monitoring of agricultural policies
in the WTO using OECD data. World Trade Review 12(3): 533-547.
https://doi.org/10.1017/S1474745612000535
Kennedy, L., L. Brink, J. Dyck, and D. MacLaren. 2001. Agriculture in the WTO: Domestic support:
Issues and options in the agricultural negotiations. Commissioned Paper No. 16. International
Agricultural Trade Research Consortium (IATRC).
Konandreas, P. and G. Mermigkas. 2014. WTO domestic support disciplines: options for alleviating
constraints to stockholding in developing countries in the follow-up to Bali. FAO Commodity
and Trade Policy Research Working Paper No. 45, Food and Agriculture Organization of the
United Nations. http://www.fao.org/3/a-i3819e.pdf
118
Kwa, A. and P. Lunenborg. 2019. Notification and transparency issues in the WTO and the US’
November 2018 communication. Research Paper 92, South Centre, March.
https://www.southcentre.int/wp-content/uploads/2019/03/RP92_Notification-and-Transparency-
Issues-in-the-WTO-and-the-US-November-2018-Communication_EN.pdf
Legg, W. and D. Blandford. 2019. The role of international organizations in agricultural policy analysis.
In Global Challenges for Future Food and Agricultural Policies, ed. D. Blandford and K.
Hassapoyannes. Singapore: World Scientific.
Lichtenberg, E. 2019. Conservation and the environment in US farm legislation. EuroChoices 18: 49-55.
http://www.choicesmagazine.org/choices-magazine/theme-articles/3rd-quarter-
2014/conservation-the-farm-bill-and-us-agri-environmental-policy
Magiera, S., M. Bredahl, K. Meilke, T.K. Warley, and N. Ballenger. 1990. Bringing agriculture into the
GATT: Reinstrumentation of agricultural policies. Commissioned Paper No. 6. International
Agricultural Trade Research Consortium (IATRC).
Martin, W. and A. Mattoo (eds.). 2011. Unfinished business? The WTO’s Doha agenda. Washington,
DC: World Bank and Centre for Economic Policy Research.
http://documents.worldbank.org/curated/en/466951468316137751/pdf/654560PUB0mart0ness0D
oha00CEPR02011.pdf
Martini, R. 2011. Long term trends in agricultural policy impacts. No. 45, OECD Food, Agriculture and
Fisheries Papers. Paris: OECD Publishing. http://dx.doi.org/10.1787/5kgdp5zw179q-en
Matthews, A. 2019. Introducing a development policy perspective into CAP strategic plans. TEP
Working Paper No. 0319, Trinity Economics Papers, Trinity College Dublin, March.
https://ideas.repec.org/p/tcd/tcduee/tep0319.html
Matthews, A. 2015. Food security, developing countries and multilateral trade rules. Background Paper
prepared for The State of Agricultural Commodity Markets 2015-16, Food and Agriculture
Organization of the United Nations (FAO). http://www.fao.org/3/a-i5133e.pdf
Matthews, A. 2014. Food security and WTO domestic support disciplines post-Bali. Issue Paper 53,
ICTSD Programme on Agricultural Trade and Sustainable Development, June.
https://www.ictsd.org/sites/default/files/research/Food%20Security%20and%20WTO%20Domest
ic%20Support%20Disciplines%20post-Bali.pdf
Matthews, A., L. Salvatici and M. Scoppola. 2017. Trade impacts of agricultural support in the EU.
IATRC Commissioned Paper 19, International Agricultural Trade Research Consortium
(IATRC), January. https://ageconsearch.umn.edu/record/252767/?ln=en
McCarl, B. A., A. W. Thayer, and J. P. H. Jones. 2016. The challenge of climate change adaptation for
agriculture: An economically oriented review. Journal of Agricultural and Applied Economics
48(4): 321–344.
Meléndez-Ortiz, R., C. Bellman, and J. Hepburn (eds.). 2009. Agricultural Subsidies in the WTO Green
Box – Ensuring Coherence with Sustainable Development Goals. Cambridge, UK: Cambridge
University Press.
119
Montemayor, R. 2014. Public stockholding for food security purposes: Scenarios and options for a
permanent solution. Issue Paper No. 51, ICTSD Programme on Agricultural Trade and
Sustainable Development, June.
https://www.ictsd.org/sites/default/files/research/Public%20Stockholding%20for%20Food%20Se
curity%20Purposes%20Scenarios%20and%20Options.pdf
Moro, D. and P. Sckokai. 2013. The impact of decoupled payments on farm choices: Conceptual and
methodological challenges. Food Policy, 41:28-38. https://doi.org/10.1016/j.foodpol.2013.04.001
NDRC (National Development and Reform Commission). 2020. Notice on announcement of 2020
minimum purchase prices for rice. 2 February (translation by Economic Research Service,
USDA).
NDRC. 2019. Notice on improvement of policies related to minimum price purchases of wheat. 12
October (translation by Economic Research Service, USDA).
O’Donoghue, E. and J. Whitaker. 2010. Do Direct Payments distort producers' decisions? An examination
of the Farm Security and Rural Investment Act of 2002. Applied Economic Perspectives and
Policy 32(1): 170–193. https://academic.oup.com/aepp/article/32/1/170/7984
OECD (Organization for Economic Cooperation and Development). 2019. Country data, Agricultural
Policy Monitoring and Evaluation.
http://www.oecd.org/agriculture/topics/agricultural-policy-monitoring-and-evaluation/
OECD. 2018. The Economic Effects of Public Stockholding Policies for Rice in Asia. Paris: OECD
Publishing. https://doi.org/10.1787/9789264305366-en
OECD. 2016. OECD’s Producer Support Estimate and related indicators of agricultural support –
Concepts, calculations, interpretation and use (The PSE Manual). Trade and Agriculture
Directorate, March. http://www.oecd.org/agriculture/topics/agricultural-policy-monitoring-and-
evaluation/documents/producer-support-estimates-manual.pdf
OECD. 2001. Market Effects of Crop Support Measures. Paris: OECD Publishing.
https://doi.org/10.1787/9789264195011-en.
OECD. 1987. National Policies and Agricultural Trade. Paris: OECD.
Orden, D. 2020 (forthcoming). Multilateral rules for food and agricultural trade. In Current Issues in
Global Agricultural and Trade Policy: A Tribute to the Work of Timothy Josling, ed. D.
Blandford and S. Tangermann. London: World Scientific Publishing Co. Pte. Ltd.
Orden, D., D. Blandford and T. Josling (eds.). 2011. WTO Disciplines on Agricultural Support: Seeking a
Fair Basis for Trade. Cambridge, UK: Cambridge University Press.
Orden, D. and L. Brink. 2018. China’s price support for wheat, rice and corn under dispute at the WTO:
Compliance and economic issues. Selected Paper presented at the 2018 Agricultural & Applied
Economics Association Annual Meeting, Washington, D.C., 5-7 August.
https://www.researchgate.net/publication/325679030_China's_Price_Support_for_Wheat_Rice_a
nd_Corn_under_Dispute_at_the_WTO_Compliance_and_Economic_Issues
120
Orden, D., C. Xie, B. Chen, L. Brink, and C. Zulauf. 2019. WTO dispute panel report on China’s
administration of Tariff Rate Quotas (TRQs) for certain agricultural products. farmdoc daily
(9):84, Department of Agricultural and Consumer Economics, University of Illinois at Urbana-
Champaign, 8 May. https://farmdocdaily.illinois.edu/2019/05/wto-dispute-panel-report-on-
chinas-administration-of-tariff-rate-quotas-trqs-for-certain-agricultural-products.html
Pannell, D. and R. Claassen. 2020. The roles of adoption and behavior change in agricultural policy.
Applied Economic Perspectives and Policy 42(1): 31-41.
https://onlinelibrary.wiley.com/doi/10.1002/aepp.13009
Permanent Mission of India to the WTO. 2018. India’s market price support to sugarcane: Counter
notification by Australia. Statement by India in the WTO Committee on Agriculture meeting held
on 26-27 November 2018. https://www.pmindiaun.gov.in/pages.php?id=1540
Roningen, V. and P. Dixit. 1989. Economic implications of agricultural policy reforms in industrialized
market economies. Staff Report No. AGES 89-36, Economic Research Service, U.S. Department
of Agriculture. https://ageconsearch.umn.edu/record/278843?ln=en
Rosegrant, M. 2019. From scarcity to security: Managing water for a nutritious food future. Chicago:
The Chicago Council on Global Affairs.
https://www.thechicagocouncil.org/publication/scarcity-security-managing-water-nutritious-food-
future
Rude, J. 2008. Production effects of the European Union’s Single Farm Payment. Canadian Journal of
Agricultural Economics 56(4): 457-471.
https://onlinelibrary.wiley.com/doi/pdf/10.1111/j.1744-7976.2008.00141.x
Rude, J. 2001. Under the green box: WTO and farm subsidies. Journal of World Trade 35(5): 1015-1033.
https://www.researchgate.net/publication/268512414_Under_the_green_box_-
_The_WTO_and_Farm_Subsidies
Schnepf, R. 2019. U.S. farm support: Compliance with WTO commitments. CRS Report R45940,
Congressional Research Service. https://crsreports.congress.gov/product/pdf/R/R45940
Steenblik, R. and C. Tsai. 2009. The environmental impact of green box subsidies: exploring the linkages.
In Agricultural Subsidies in the WTO Green Box – Ensuring Coherence with Sustainable
Development Goals, ed. R. Meléndez-Ortiz, C. Bellman, and J. Hepburn. Cambridge, UK:
Cambridge University Press.
Sumner, D. 2005. Boxed in: Conflicts between U.S. farm policies and WTO obligations. Trade Policy
Analysis No. 32, Cato Institute, 5 December.
https://www.cato.org/publications/trade-policy-analysis/boxed-conflicts-between-us-farm-
policies-wto-obligations
Swinbank, A. 2009. The reform of the EU’s Common Agricultural Policy. In Agricultural Subsidies in
the WTO Green Box – Ensuring Coherence with Sustainable Development Goals, ed. R.
Meléndez-Ortiz, C. Bellman, and J. Hepburn. Cambridge, UK: Cambridge University Press.
Swinbank, A. 2008. Potential WTO challenges to the CAP. Canadian Journal of Agricultural Economics
56(4): 445-456. https://onlinelibrary.wiley.com/doi/abs/10.1111/j.1744-7976.2008.00140.x
Swinbank, A. and R. Tranter. 2005. Decoupling EU farm support: Does the new Single Payment Scheme
fit within the green box? The Estey Centre Journal of International Law and Trade Policy 6(1):
47-61. https://ageconsearch.umn.edu/record/23867?ln=en
121
Tong, L., C. Pham, and M. Ulubaşoğlu. 2019. The effects of farm subsidies on farm exports in the United
States. American Journal of Agricultural Economics 101(4): 1277-1304.
https://academic.oup.com/ajae/article-abstract/101/4/1277/5425529
TWN (Third World Network). 2017. US transparency proposal criticised at WTO Goods Council. TWN
Info Service on WTO and Trade Issues, 17 November.
https://www.twn.my/title2/wto.info/2017/ti171116.htm
Tyagi, A. and J. Shortle. 2019. The agriculture – water policy nexus. In Global Challenges for Future
Food and Agricultural Policies, ed. D. Blandford and K. Hassapoyannes. Singapore: World
Scientific.
Urban, K., H. Jensen and M. Brockmeier. 2016. Extending the GTAP database and model to cover
domestic support issues using the EU as example. GTAP Technical Paper No. 35 (revised April
2016). https://www.gtap.agecon.purdue.edu/resources/tech_papers.asp
USDA (United States Department of Agriculture). 2019. USDA issues second tranche of Market
Facilitation Program. Release No. 0180.19, USDA Office of Communications, 15 November.
https://www.usda.gov/media/press-releases/2019/11/15/usda-issues-second-tranche-market-
facilitation-program
USDA. 1987. Government intervention in agriculture: Measurement, evaluation and implications for
trade negotiations. Foreign Agricultural Economic Report No. 229, Economic Research Service,
April.
USTR (United States Trade Representative). 2020. Economic and trade agreement between the
government of the United States of America and the government of the People’s Republic of
China. Washington, DC, 15 January.
https://ustr.gov/sites/default/files/files/agreements/phase%20one%20agreement/Economic_And_
Trade_Agreement_Between_The_United_States_And_China_Text.pdf
WTO (World Trade Organization) documents:
Note that documents are not given an individual URL in this list if they are available through Search at
WTO Documents Online https://docs.wto.org/dol2fe/Pages/FE_Search/FE_S_S001.aspx
WTO. 2020a. China – Domestic support for agricultural producers. Status report regarding the
implementation of the DSB recommendations and rulings by China. WT/DS511/15. 17 January.
WTO. 2020b. China – Domestic support for agricultural producers. Status report regarding the
implementation of the DSB recommendations and rulings by China. Addendum.
WT/DS511/15/Add.1. 18 February.
WTO. 2020c. Framework for negotiations on domestic support. Communication from Argentina,
Australia, Brazil, Canada, Chile, Colombia, Costa Rica, Guatemala, Indonesia, Malaysia, New
Zealand, Pakistan, Paraguay, Peru, the Philippines, Thailand, Ukraine, Uruguay and Viet Nam.
Committee on Agriculture, Special Session. JOB/AG/177. 23 January.
WTO. 2020d. China Tariff rate quotas for certain agricultural products. Status report regarding
implementation of the DSB rulings and recommendations by China. WT/DS517/12. 18 February.
WTO. 2020e. Notification of select domestic support variables in the WTO. Submission by the United
States. Committee on Agriculture, Special Session. JOB/AG/181. 19 February.
122
WTO. 2020f. Elements and processes for a possible outcome in agriculture at MC12. Report by the
Chairman of the Committee on Agriculture in Special Session. Committee on Agriculture,
Special Session. JOB/AG/180. 14 February.
WTO. 2020g. Formula for reduction of trade-distorting support. Submission by the Russian Federation.
Committee on Agriculture, Special Session. JOB/AG/182. 19 February.
WTO. 2020h. Procedures to enhance transparency and strengthen notification requirements under WTO
Agreements. Revision. Communication from Argentina, Australia, Canada, Costa Rica, the
European Union, Israel, Japan, New Zealand, the Separate Customs Territory of Taiwan, Penghu,
Kinmen and Matsu, and the United States. JOB/GC/204/Rev.3. 5 March.
WTO. 2020i. Compliance with notification obligations. Note by the Secretariat. Committee on
Agriculture. G/AG/GEN/86/Rev.37. 13 March.
WTO. 2020j. China Tariff rate quotas for certain agricultural products. Modification of the agreement
under Article 21.3(b) of the DSU. WT/DS517/13. 20 March.
WTO. 2020k. Notification. Committee on Agriculture. G/AG/IND/18. 31 March.
WTO. 2020l. China Domestic support for agricultural producers. Modification of the agreement under
Article 21.3(b) of the DSU. WT/DS511/16. 3 April.
WTO. 2020m. Statement on a mechanism for developing, documenting and sharing practices and
procedures in the conduct of WTO disputes. Addendum. JOB/DSB/1/Add.12. 30 April.
WTO. 2019a. Certain measures of India providing market price support to pulses, including chickpeas,
pigeon peas, black matpe, mung beans and lentils. Communication from Australia, Canada and
the United States of America Pursuant to Article 18.7 of the Agreement on Agriculture.
Committee on Agriculture. G/AG/W/193 (and correction). 12 February (and 5 March 2019).
WTO. 2019b. Members target June for finalizing quota review, examine farm policies of EU, China,
India. News Item, Agriculture: Formal Meeting. 27 February.
WTO. 2019c. China – Domestic support for agricultural producers. Report of the Panel. WT/DS511/R.
28 February.
WTO. 2019d. Procedures to enhance transparency and strengthen notification requirements under WTO
Agreements. Revision. Communication from Argentina, Australia, Canada, Costa Rica, the
European Union, Japan, New Zealand, the Separate Customs Territory of Taiwan, Penghu,
Kinmen and Matsu, and the United States. JOB/GC/204/Rev.1. 1 April.
WTO. 2019e. China Tariff Rate Quotas for certain agricultural products. Report of the Panel.
WT/DS517/R. 18 April.
WTO. 2019f. Agriculture Chair extends working group process, urges move towards negotiation mode.
News Item, Agriculture, 1 May.
https://www.wto.org/english/news_e/news19_e/agri_01may19_e.htm
WTO. 2019g. Cotton. Background paper by the Secretariat. Committee on Agriculture, Special Session,
Sub-Committee on Cotton. TN/AG/GEN/34/Rev.10 and TN/AG/SCC/GEN/13/Rev.10. 24 May.
WTO. 2019h. Interaction between pillars of the Agreement on Agriculture: the relationship between
domestic support and market access. Communication from Paraguay. Committee on Agriculture,
Special Session. JOB/AG/157 (and corrections). 19 June.
123
WTO. 2019i. Negotiations on agriculture. Submission by Chad on behalf of the LDC group. Committee
on Agriculture, Special Session. JOB/AG/159. 9 July.
WTO. 2019j. Domestic support options. Circulated on behalf of the following Cairns Group members:
Argentina, Australia, Brazil, Canada, Chile, Costa Rica, Peru, New Zealand, Thailand and
Uruguay. Committee on Agriculture, Special Session. JOB/AG/160. 11 July.
WTO. 2019k. India – Measures concerning sugar and sugarcane. Request for the establishment of a panel
by Brazil. WT/DS579/7. 12 July.
WTO. 2019l. India – Measures concerning sugar and sugarcane. Request for the establishment of a panel
by Australia. WT/DS580/7. 12 July.
WTO. 2019m. India – Measures concerning sugar and sugarcane. Request for the establishment of a panel
by Guatemala. WT/DS581/8. 12 July.
WTO. 2019n. Agriculture negotiations at the WTO. Communication by the co-sponsors of the sectoral
initiative on cotton. Committee on Agriculture, Special Session, and Sub-Committee on Cotton.
TN/AG/GEN/49/Rev.1 and TN/AG/SCC/GEN/20/Rev.1. 18 September.
WTO. 2019o. Director-general's consultative framework mechanism on cotton. Evolving table – 27th
version. Sub-Committee on Cotton. WT/CFMC/6/Rev.28. 11 November.
WTO. 2019p. Higher and higher – Growth in domestic support entitlements since 2001. Submission from
Australia and New Zealand. Committee on Agriculture, Special Session. JOB/AG/171. 22
November.
WTO. 2019q. Formula for reduction of trade-distorting support. Submission by the Russian Federation.
Committee on Agriculture, Special Session. JOB/AG/172. 25 November.
WTO. 2019r. African Group elements for meaningful development outcomes at the twelfth ministerial
conference. Communication from Benin on behalf of the African Group. Committee on
Agriculture, Special Session. JOB/AG/173. 25 November.
WTO. 2018a. Certain measures of India providing market price support to rice and wheat.
Communication from the United States of America Pursuant to Article 18.7 of the Agreement on
Agriculture. Committee on Agriculture. G/AG/W/174. 9 May.
WTO. 2018b. The way forward. Circulated on behalf of the following Cairns Group Members: Australia,
Argentina, Brazil, Canada, Chile, Colombia, Costa Rica, Guatemala, New Zealand, Pakistan,
Paraguay, Peru, Thailand, Uruguay and Viet Nam (also Malaysia). JOB/AG/134. 17 May.
WTO. 2018c. Elimination of AMS beyond de minimis to reduce distortions in global agricultural trade –
some incremental steps. Submission by China and India. Committee on Agriculture, Special
Session. JOB/AG/137. 22 June.
WTO. 2018d. Domestic Support in the WTO Agreement on Agriculture (AoA). Submission from
Canada, Argentina, Australia, Brazil, Guatemala, New Zealand, Paraguay, Peru and Uruguay.
Committee on Agriculture, Special Session. JOB/AG/138. 11 July.
WTO. 2018e. Revisiting G/AG/2 – Time for review after twenty-three years. Submission by Norway,
Committee on Agriculture. G/AG/W/185. 17 September.
WTO. 2018f. The situation in cotton. Communication from the United States of America. JOB/AG/144.
25 September.
124
WTO. 2018g. Trends in global trade-distorting support. Submission by Australia, Argentina, Canada,
Chile, Colombia, New Zealand, Peru and Viet Nam. Committee on Agriculture, Special Session.
JOB/AG/143. 27 September.
WTO. 2018h. Certain measures of India providing market price support to cotton. Communication from
the United States of America Pursuant to Article 18.7 of the Agreement on Agriculture.
Committee on Agriculture. G/AG/W/188. 9 November.
WTO. 2018i. India’s measures to provide market price support for sugarcane. Communication from
Australia Pursuant to Article 18.7 of the Agreement on Agriculture. Committee on Agriculture.
G/AG/W/189. 16 November.
WTO. 2018j. Analysis and observation on product specific support. Submission by Canada, Argentina,
Australia, Brazil, Chile, Colombia, New Zealand, Paraguay, Peru and Uruguay. Committee on
Agriculture, Special Session. JOB/AG/150. 3 December.
WTO. 2018k. Notification. China’s notifications of domestic support for 2011 to 2016. Committee on
Agriculture. G/AG/N/CHN/42-48 (various dates).
WTO. 2015. Public stockholding for food security purposes. Ministerial Conference: Tenth Session.
WT/MIN(15)/W/46. 19 December.
WTO. 2013a. General services. Ministerial Conference: Ninth Session. WT/MIN(13)/37 and WT/L/912.
11 December.
WTO. 2013b. Public stockholding for food security purposes. Ministerial Conference: Ninth Session.
WT/MIN(13)/38 and WT/L/913. 11 December.
WTO. 2008. Revised draft modalities for agriculture. Committee on Agriculture, Special Session.
TN/AG/W/4/Rev.4. 6 December.
WTO. 2007a. United States – Subsidies and Other Domestic Support for Corn and Other Agricultural
Products. Request for consultations by Canada. WT/DS357/1. 11 January.
WTO. 2007b. United States – Domestic Support and Export Credit Guarantees for Agricultural products.
Request for consultations by Brazil. WT/DS365/1. 17 July.
WTO. 2005. United States – Subsidies on Upland Cotton. AB-2004-5. WT/DS267/AB/R, 3 March.
WTO. 2004a. Decision adopted by the General Council on 1 August 2004. WT/L/579, 2 August.
WTO. 2004b. United States – Subsidies on Upland Cotton. Report of the Panel. WT/DS267/R,
8 September.
WTO. 2001. Ministerial declaration, Doha WTO Ministerial 2001. WT/MIN(01)/DEC/1. 20 November.
WTO. 2000a. Korea – Measures affecting imports of fresh, chilled and frozen beef. Report of the Panel.
WT/DS161/R and WT/DS169/R. 31 July.
WTO. 2000b. Korea – Measures affecting imports of fresh, chilled and frozen beef. AB-2000-8. Report of
the Appellate Body. WT/DS161/AB/R and WT/DS169/AB/R. 11 December.
WTO. 1995. Notification requirements and formats. Committee on Agriculture. G/AG/2. 30 June.
WTO. 1994a. Agreement on Agriculture. https://www.wto.org/english/docs_e/legal_e/14-ag_01_e.htm
WTO. 1994b. Marrakesh Agreement Establishing the World Trade Organization.
https://www.wto.org/english/docs_e/legal_e/04-wto_e.htm
125
APPENDIX A. PROVISIONS MOST RELEVANT TO DOMESTIC SUPPORT IN THE
AGREEMENT ON AGRICULTURE
Note: Provisions of the AoA (WTO 1994a) indicated by an asterisk * have been excluded from this
appendix because they are of less direct relevance to domestic support. All paragraph headings remain in
order to provide context. Part numbering has been deleted. Formatting changes have been made.
AGREEMENT ON AGRICULTURE Members,
Having decided to establish a basis for initiating a process of reform of trade in agriculture in line
with the objectives of the negotiations as set out in the Punta del Este Declaration;
Recalling that their long-term objective as agreed at the Mid-Term Review of the Uruguay Round
"is to establish a fair and market-oriented agricultural trading system and that a reform process should be
initiated through the negotiation of commitments on support and protection and through the establishment
of strengthened and more operationally effective GATT rules and disciplines";
Recalling further that "the above-mentioned long-term objective is to provide for substantial
progressive reductions in agricultural support and protection sustained over an agreed period of time,
resulting in correcting and preventing restrictions and distortions in world agricultural markets";
Committed to achieving specific binding commitments in each of the following areas: market
access; domestic support; export competition; and to reaching an agreement on sanitary and phytosanitary
issues;
Having agreed that in implementing their commitments on market access, developed country
Members would take fully into account the particular needs and conditions of developing country
Members by providing for a greater improvement of opportunities and terms of access for agricultural
products of particular interest to these Members, including the fullest liberalization of trade in tropical
agricultural products as agreed at the Mid-Term Review, and for products of particular importance to the
diversification of production from the growing of illicit narcotic crops;
Noting that commitments under the reform programme should be made in an equitable way
among all Members, having regard to non-trade concerns, including food security and the need to protect
the environment; having regard to the agreement that special and differential treatment for developing
countries is an integral element of the negotiations, and taking into account the possible negative effects
of the implementation of the reform programme on least-developed and net food-importing developing
countries;
Hereby agree as follows:
Article 1
Definition of Terms
In this Agreement, unless the context otherwise requires:
(a) "Aggregate Measurement of Support" and "AMS" mean the annual level of support,
expressed in monetary terms, provided for an agricultural product in favour of the
producers of the basic agricultural product or non-product-specific support provided in
favour of agricultural producers in general, other than support provided under
programmes that qualify as exempt from reduction under Annex 2 to this Agreement,
which is:
126
(i) with respect to support provided during the base period, specified in the relevant
tables of supporting material incorporated by reference in Part IV of a Member's
Schedule; and
(ii) with respect to support provided during any year of the implementation period
and thereafter, calculated in accordance with the provisions of Annex 3 of this
Agreement and taking into account the constituent data and methodology used in
the tables of supporting material incorporated by reference in Part IV of the
Member's Schedule;
(b) "basic agricultural product" in relation to domestic support commitments is defined as the
product as close as practicable to the point of first sale as specified in a Member's
Schedule and in the related supporting material;
(c) "budgetary outlays" or "outlays" includes revenue foregone;
(d) "Equivalent Measurement of Support" means the annual level of support, expressed in
monetary terms, provided to producers of a basic agricultural product through the
application of one or more measures, the calculation of which in accordance with the
AMS methodology is impracticable, other than support provided under programmes that
qualify as exempt from reduction under Annex 2 to this Agreement, and which is:
(i) with respect to support provided during the base period, specified in the relevant
tables of supporting material incorporated by reference in Part IV of a Member's
Schedule; and
(ii) with respect to support provided during any year of the implementation period
and thereafter, calculated in accordance with the provisions of Annex 4 of this
Agreement and taking into account the constituent data and methodology used in
the tables of supporting material incorporated by reference in Part IV of the
Member's Schedule;
(e) "export subsidies" refers to subsidies contingent upon export performance, including the
export subsidies listed in Article 9 of this Agreement;
(f) "implementation period" means the six-year period commencing in the year 1995, except
that, for the purposes of Article 13, it means the nine-year period commencing in 1995;
(g) "market access concessions" includes all market access commitments undertaken
pursuant to this Agreement;
(h) "Total Aggregate Measurement of Support" and "Total AMS" mean the sum of all
domestic support provided in favour of agricultural producers, calculated as the sum of
all aggregate measurements of support for basic agricultural products, all non-product-
specific aggregate measurements of support and all equivalent measurements of support
for agricultural products, and which is:
(i) with respect to support provided during the base period (i.e. the "Base Total
AMS") and the maximum support permitted to be provided during any year of
the implementation period or thereafter (i.e. the "Annual and Final Bound
Commitment Levels"), as specified in Part IV of a Member's Schedule; and
(ii) with respect to the level of support actually provided during any year of the
implementation period and thereafter (i.e. the "Current Total AMS"), calculated
in accordance with the provisions of this Agreement, including Article 6, and
with the constituent data and methodology used in the tables of supporting
material incorporated by reference in Part IV of the Member's Schedule;
127
(i) "year" in paragraph (f) above and in relation to the specific commitments of a Member
refers to the calendar, financial or marketing year specified in the Schedule relating to
that Member.
Article 2*
Product Coverage
This Agreement applies to the products listed in Annex 1 to this Agreement, hereinafter referred
to as agricultural products.
Article 3
Incorporation of Concessions and Commitments
1. The domestic support and export subsidy commitments in Part IV of each Member's Schedule
constitute commitments limiting subsidization and are hereby made an integral part of GATT 1994.
2. Subject to the provisions of Article 6, a Member shall not provide support in favour of domestic
producers in excess of the commitment levels specified in Section I of Part IV of its Schedule.
3.* (export subsidies)
Article 4*
Market Access
Article 5*
Special Safeguard Provisions
Article 6
Domestic Support Commitments
1. The domestic support reduction commitments of each Member contained in Part IV of its
Schedule shall apply to all of its domestic support measures in favour of agricultural producers with the
exception of domestic measures which are not subject to reduction in terms of the criteria set out in this
Article and in Annex 2 to this Agreement. The commitments are expressed in terms of Total Aggregate
Measurement of Support and "Annual and Final Bound Commitment Levels".
2. In accordance with the Mid-Term Review Agreement that government measures of assistance,
whether direct or indirect, to encourage agricultural and rural development are an integral part of the
development programmes of developing countries, investment subsidies which are generally available to
agriculture in developing country Members and agricultural input subsidies generally available to low-
income or resource-poor producers in developing country Members shall be exempt from domestic
support reduction commitments that would otherwise be applicable to such measures, as shall domestic
support to producers in developing country Members to encourage diversification from growing illicit
narcotic crops. Domestic support meeting the criteria of this paragraph shall not be required to be
included in a Member's calculation of its Current Total AMS.
3. A Member shall be considered to be in compliance with its domestic support reduction
commitments in any year in which its domestic support in favour of agricultural producers expressed in
terms of Current Total AMS does not exceed the corresponding annual or final bound commitment level
specified in Part IV of the Member's Schedule.
4. (a) A Member shall not be required to include in the calculation of its Current Total AMS
and shall not be required to reduce:
(i) product-specific domestic support which would otherwise be required to be
included in a Member's calculation of its Current AMS where such support does
not exceed 5 per cent of that Member's total value of production of a basic
agricultural product during the relevant year; and
128
(ii) non-product-specific domestic support which would otherwise be required to be
included in a Member's calculation of its Current AMS where such support does
not exceed 5 per cent of the value of that Member's total agricultural production.
(b) For developing country Members, the de minimis percentage under this paragraph shall
be 10 per cent.
5. (a) Direct payments under production-limiting programmes shall not be subject to the
commitment to reduce domestic support if:
(i) such payments are based on fixed area and yields; or
(ii) such payments are made on 85 per cent or less of the base level of production; or
(iii) livestock payments are made on a fixed number of head.
(b) The exemption from the reduction commitment for direct payments meeting the above
criteria shall be reflected by the exclusion of the value of those direct payments in a
Member's calculation of its Current Total AMS.
Article 7
General Disciplines on Domestic Support
1. Each Member shall ensure that any domestic support measures in favour of agricultural producers
which are not subject to reduction commitments because they qualify under the criteria set out in Annex 2
to this Agreement are maintained in conformity therewith.
2. (a) Any domestic support measure in favour of agricultural producers, including any
modification to such measure, and any measure that is subsequently introduced that
cannot be shown to satisfy the criteria in Annex 2 to this Agreement or to be exempt from
reduction by reason of any other provision of this Agreement shall be included in the
Member's calculation of its Current Total AMS.
(b) Where no Total AMS commitment exists in Part IV of a Member's Schedule, the Member
shall not provide support to agricultural producers in excess of the relevant de minimis
level set out in paragraph 4 of Article 6.
Article 8*
Export Competition Commitments
Article 9*
Export Subsidy Commitments
Article 10*
Prevention of Circumvention of Export Subsidy Commitments
Article 11*
Incorporated Products
Article 12*
Disciplines on Export Prohibitions and Restrictions
Article 13
Due Restraint
During the implementation period, notwithstanding the provisions of GATT 1994 and the
Agreement on Subsidies and Countervailing Measures (referred to in this Article as the “Subsidies Agreement”):
129
(a) domestic support measures that conform fully to the provisions of Annex 2 to this
Agreement shall be:
(i) non-actionable subsidies for purposes of countervailing duties72 (original footnote 4)
(ii) exempt from actions based on Article XVI of GATT 1994 and Part III of the
Subsidies Agreement; and
(iii) exempt from actions based on non-violation nullification or impairment of the
benefits of tariff concessions accruing to another Member under Article II of GATT
1994, in the sense of paragraph 1(b) of Article XXIII of GATT 1994;
(b) domestic support measures that conform fully to the provisions of Article 6 of this
Agreement including direct payments that conform to the requirements of paragraph 5
thereof, as reflected in each Member’s Schedule, as well as domestic support within de
minimis levels and in conformity with paragraph 2 of Article 6, shall be:
(i) exempt from the imposition of countervailing duties unless a determination of injury
or threat thereof is made in accordance with Article VI of GATT 1994 and Part V
of the Subsidies Agreement, and due restraint shall be shown in initiating any
countervailing duty investigations;
(ii) exempt from actions based on paragraph 1 of Article XVI of GATT 1994 or
Articles 5 and 6 of the Subsidies Agreement, provided that such measures do not
grant support to a specific commodity in excess of that decided during the 1992
marketing year; and
(iii) exempt from actions based on non-violation nullification or impairment of the
benefits of tariff concessions accruing to another Member under Article II of GATT
1994, in the sense of paragraph 1(b) of Article XXIII of GATT 1994, provided that
such measures do not grant support to a specific commodity in excess of that
decided during the 1992 marketing year;
(c)* (export subsidies)
Article 14*
Sanitary and Phytosanitary Measures
Article 15*
Special and Differential Treatment
Article 16*
Least-Developed and Net Food-Importing Developing Countries
Article 17
Committee on Agriculture
A Committee on Agriculture is hereby established.
Article 18
Review of the Implementation of Commitments
1. Progress in the implementation of commitments negotiated under the Uruguay Round reform
programme shall be reviewed by the Committee on Agriculture.
72 (original footnote 4) “Countervailing duties” where referred to in this Article are those covered by Article VI of GATT
1994 and Part V of the Agreement on Subsidies and Countervailing Measures.
130
2. The review process shall be undertaken on the basis of notifications submitted by Members in
relation to such matters and at such intervals as shall be determined, as well as on the basis of such
documentation as the Secretariat may be requested to prepare in order to facilitate the review process.
3. In addition to the notifications to be submitted under paragraph 2, any new domestic support
measure, or modification of an existing measure, for which exemption from reduction is claimed shall be
notified promptly. This notification shall contain details of the new or modified measure and its
conformity with the agreed criteria as set out either in Article 6 or in Annex 2.
4. In the review process Members shall give due consideration to the influence of excessive rates of
inflation on the ability of any Member to abide by its domestic support commitments.
5. Members agree to consult annually in the Committee on Agriculture with respect to their
participation in the normal growth of world trade in agricultural products within the framework of the
commitments on export subsidies under this Agreement.
6. The review process shall provide an opportunity for Members to raise any matter relevant to the
implementation of commitments under the reform programme as set out in this Agreement.
7. Any Member may bring to the attention of the Committee on Agriculture any measure which it
considers ought to have been notified by another Member.
Article 19
Consultation and Dispute Settlement
The provisions of Articles XXII and XXIII of GATT 1994, as elaborated and applied by the
Dispute Settlement Understanding, shall apply to consultations and the settlement of disputes under this
Agreement.
Article 20
Continuation of the Reform Process
Recognizing that the long-term objective of substantial progressive reductions in support and protection
resulting in fundamental reform is an ongoing process, Members agree that negotiations for continuing
the process will be initiated one year before the end of the implementation period, taking into account:
(a) the experience to that date from implementing the reduction commitments;
(b) the effects of the reduction commitments on world trade in agriculture;
(c) non-trade concerns, special and differential treatment to developing country Members,
and the objective to establish a fair and market-oriented agricultural trading system, and
the other objectives and concerns mentioned in the preamble to this Agreement; and
(d) what further commitments are necessary to achieve the above mentioned long-term
objectives.
Article 21
Final Provisions
1. The provisions of GATT 1994 and of other Multilateral Trade Agreements in Annex 1A to the
WTO Agreement shall apply subject to the provisions of this Agreement.
2. The Annexes to this Agreement are hereby made an integral part of this Agreement.
ANNEX 1*
PRODUCT COVERAGE
131
ANNEX 2
DOMESTIC SUPPORT: THE BASIS FOR EXEMPTION FROM
THE REDUCTION COMMITMENTS
1. Domestic support measures for which exemption from the reduction commitments is claimed
shall meet the fundamental requirement that they have no, or at most minimal, trade-distorting effects or
effects on production. Accordingly, all measures for which exemption is claimed shall conform to the
following basic criteria:
(a) the support in question shall be provided through a publicly-funded government
programme (including government revenue foregone) not involving transfers from
consumers; and,
(b) the support in question shall not have the effect of providing price support to producers;
plus policy-specific criteria and conditions as set out below.
Government Service Programmes
2. General services
Policies in this category involve expenditures (or revenue foregone) in relation to programmes
which provide services or benefits to agriculture or the rural community. They shall not involve direct
payments to producers or processors. Such programmes, which include but are not restricted to the
following list, shall meet the general criteria in paragraph 1 above and policy-specific conditions where
set out below:
(a) research, including general research, research in connection with environmental
programmes, and research programmes relating to particular products;
(b) pest and disease control, including general and product-specific pest and disease control
measures, such as early-warning systems, quarantine and eradication;
(c) training services, including both general and specialist training facilities;
(d) extension and advisory services, including the provision of means to facilitate the transfer
of information and the results of research to producers and consumers;
(e) inspection services, including general inspection services and the inspection of particular
products for health, safety, grading or standardization purposes;
(f) marketing and promotion services, including market information, advice and promotion
relating to particular products but excluding expenditure for unspecified purposes that
could be used by sellers to reduce their selling price or confer a direct economic benefit
to purchasers; and
(g) infrastructural services, including: electricity reticulation, roads and other means of
transport, market and port facilities, water supply facilities, dams and drainage schemes,
and infrastructural works associated with environmental programmes. In all cases the
expenditure shall be directed to the provision or construction of capital works only, and
shall exclude the subsidized provision of on-farm facilities other than for the reticulation
of generally available public utilities. It shall not include subsidies to inputs or operating
costs, or preferential user charges.
132
3. Public stockholding for food security purposes5 (73: original footnote 5)
Expenditures (or revenue foregone) in relation to the accumulation and holding of stocks of
products which form an integral part of a food security programme identified in national legislation. This
may include government aid to private storage of products as part of such a programme.
The volume and accumulation of such stocks shall correspond to predetermined targets
related solely to food security. The process of stock accumulation and disposal shall be
financially transparent. Food purchases by the government shall be made at current
market prices and sales from food security stocks shall be made at no less than the current
domestic market price for the product and quality in question.
4. Domestic food aid6 (74: original footnote 6)
Expenditures (or revenue foregone) in relation to the provision of domestic food aid to sections of
the population in need.
Eligibility to receive the food aid shall be subject to clearly-defined criteria related to
nutritional objectives. Such aid shall be in the form of direct provision of food to those
concerned or the provision of means to allow eligible recipients to buy food either at
market or at subsidized prices. Food purchases by the government shall be made at
current market prices and the financing and administration of the aid shall be transparent.
5. Direct payments to producers
Support provided through direct payments (or revenue foregone, including payments in kind) to
producers for which exemption from reduction commitments is claimed shall meet the basic criteria set
out in paragraph 1 above, plus specific criteria applying to individual types of direct payment as set out in
paragraphs 6 through 13 below. Where exemption from reduction is claimed for any existing or new type
of direct payment other than those specified in paragraphs 6 through 13, it shall conform to criteria (b)
through (e) in paragraph 6, in addition to the general criteria set out in paragraph 1.
6. Decoupled income support
(a) Eligibility for such payments shall be determined by clearly-defined criteria such as
income, status as a producer or landowner, factor use or production level in a defined and
fixed base period.
(b) The amount of such payments in any given year shall not be related to, or based on, the
type or volume of production (including livestock units) undertaken by the producer in
any year after the base period.
(c) The amount of such payments in any given year shall not be related to, or based on, the
prices, domestic or international, applying to any production undertaken in any year after
the base period.
(d) The amount of such payments in any given year shall not be related to, or based on, the
factors of production employed in any year after the base period.
(e) No production shall be required in order to receive such payments.
73 (original footnote 5) For the purposes of paragraph 3 of this Annex, governmental stockholding programmes for food
security purposes in developing countries whose operation is transparent and conducted in accordance with
officially published objective criteria or guidelines shall be considered to be in conformity with the provisions of this
paragraph, including programmes under which stocks of foodstuffs for food security purposes are acquired and
released at administered prices, provided that the difference between the acquisition price and the external reference
price is accounted for in the AMS.
74 (original footnote 5& 6) For the purposes of paragraphs 3 and 4 of this Annex, the provision of foodstuffs at subsidized
prices with the objective of meeting food requirements of urban and rural poor in developing countries on a regular
basis at reasonable prices shall be considered to be in conformity with the provisions of this paragraph.
133
7. Government financial participation in income insurance and income safety-net programmes
(a) Eligibility for such payments shall be determined by an income loss, taking into account
only income derived from agriculture, which exceeds 30 per cent of average gross
income or the equivalent in net income terms (excluding any payments from the same or
similar schemes) in the preceding three-year period or a three-year average based on the
preceding five-year period, excluding the highest and the lowest entry. Any producer
meeting this condition shall be eligible to receive the payments.
(b) The amount of such payments shall compensate for less than 70 per cent of the producer's
income loss in the year the producer becomes eligible to receive this assistance.
(c) The amount of any such payments shall relate solely to income; it shall not relate to the
type or volume of production (including livestock units) undertaken by the producer; or
to the prices, domestic or international, applying to such production; or to the factors of
production employed.
(d) Where a producer receives in the same year payments under this paragraph and under
paragraph 8 (relief from natural disasters), the total of such payments shall be less than
100 per cent of the producer's total loss.
8. Payments (made either directly or by way of government financial participation in crop insurance
schemes) for relief from natural disasters
(a) Eligibility for such payments shall arise only following a formal recognition by
government authorities that a natural or like disaster (including disease outbreaks, pest
infestations, nuclear accidents, and war on the territory of the Member concerned) has
occurred or is occurring; and shall be determined by a production loss which exceeds
30 per cent of the average of production in the preceding three-year period or a three-year
average based on the preceding five-year period, excluding the highest and the lowest
entry.
(b) Payments made following a disaster shall be applied only in respect of losses of income,
livestock (including payments in connection with the veterinary treatment of animals),
land or other production factors due to the natural disaster in question.
(c) Payments shall compensate for not more than the total cost of replacing such losses and
shall not require or specify the type or quantity of future production.
(d) Payments made during a disaster shall not exceed the level required to prevent or
alleviate further loss as defined in criterion (b) above.
(e) Where a producer receives in the same year payments under this paragraph and under
paragraph 7 (income insurance and income safety-net programmes), the total of such
payments shall be less than 100 per cent of the producer's total loss.
9. Structural adjustment assistance provided through producer retirement programmes
(a) Eligibility for such payments shall be determined by reference to clearly defined criteria
in programmes designed to facilitate the retirement of persons engaged in marketable
agricultural production, or their movement to non-agricultural activities.
(b) Payments shall be conditional upon the total and permanent retirement of the recipients
from marketable agricultural production.
10. Structural adjustment assistance provided through resource retirement programmes
(a) Eligibility for such payments shall be determined by reference to clearly defined criteria
in programmes designed to remove land or other resources, including livestock, from
marketable agricultural production.
(b) Payments shall be conditional upon the retirement of land from marketable agricultural
production for a minimum of three years, and in the case of livestock on its slaughter or
definitive permanent disposal.
134
(c) Payments shall not require or specify any alternative use for such land or other resources
which involves the production of marketable agricultural products.
(d) Payments shall not be related to either the type or quantity of production or to the prices,
domestic or international, applying to production undertaken using the land or other
resources remaining in production.
11. Structural adjustment assistance provided through investment aids
(a) Eligibility for such payments shall be determined by reference to clearly-defined criteria
in government programmes designed to assist the financial or physical restructuring of a
producer's operations in response to objectively demonstrated structural disadvantages.
Eligibility for such programmes may also be based on a clearly-defined government
programme for the reprivatization of agricultural land.
(b) The amount of such payments in any given year shall not be related to, or based on, the
type or volume of production (including livestock units) undertaken by the producer in
any year after the base period other than as provided for under criterion (e) below.
(c) The amount of such payments in any given year shall not be related to, or based on, the
prices, domestic or international, applying to any production undertaken in any year after
the base period.
(d) The payments shall be given only for the period of time necessary for the realization of
the investment in respect of which they are provided.
(e) The payments shall not mandate or in any way designate the agricultural products to be
produced by the recipients except to require them not to produce a particular product.
(f) The payments shall be limited to the amount required to compensate for the structural
disadvantage.
12. Payments under environmental programmes
(a) Eligibility for such payments shall be determined as part of a clearly-defined government
environmental or conservation programme and be dependent on the fulfilment of specific
conditions under the government programme, including conditions related to production
methods or inputs.
(b) The amount of payment shall be limited to the extra costs or loss of income involved in
complying with the government programme.
13. Payments under regional assistance programmes
(a) Eligibility for such payments shall be limited to producers in disadvantaged regions.
Each such region must be a clearly designated contiguous geographical area with a
definable economic and administrative identity, considered as disadvantaged on the basis
of neutral and objective criteria clearly spelt out in law or regulation and indicating that
the region's difficulties arise out of more than temporary circumstances.
(b) The amount of such payments in any given year shall not be related to, or based on, the
type or volume of production (including livestock units) undertaken by the producer in
any year after the base period other than to reduce that production.
(c) The amount of such payments in any given year shall not be related to, or based on, the
prices, domestic or international, applying to any production undertaken in any year after
the base period.
(d) Payments shall be available only to producers in eligible regions, but generally available
to all producers within such regions.
(e) Where related to production factors, payments shall be made at a degressive rate above a
threshold level of the factor concerned.
(f) The payments shall be limited to the extra costs or loss of income involved in
undertaking agricultural production in the prescribed area.
135
ANNEX 3
DOMESTIC SUPPORT:
CALCULATION OF AGGREGATE MEASUREMENT OF SUPPORT
1. Subject to the provisions of Article 6, an Aggregate Measurement of Support (AMS) shall be
calculated on a product-specific basis for each basic agricultural product receiving market price support,
non-exempt direct payments, or any other subsidy not exempted from the reduction commitment ("other
non-exempt policies"). Support which is non-product specific shall be totalled into one non-product-
specific AMS in total monetary terms.
2. Subsidies under paragraph 1 shall include both budgetary outlays and revenue foregone by
governments or their agents.
3. Support at both the national and sub-national level shall be included.
4. Specific agricultural levies or fees paid by producers shall be deducted from the AMS.
5. The AMS calculated as outlined below for the base period shall constitute the base level for the
implementation of the reduction commitment on domestic support.
6. For each basic agricultural product, a specific AMS shall be established, expressed in total
monetary value terms.
7. The AMS shall be calculated as close as practicable to the point of first sale of the basic
agricultural product concerned. Measures directed at agricultural processors shall be included to the
extent that such measures benefit the producers of the basic agricultural products.
8. Market price support: market price support shall be calculated using the gap between a fixed
external reference price and the applied administered price multiplied by the quantity of production
eligible to receive the applied administered price. Budgetary payments made to maintain this gap, such as
buying-in or storage costs, shall not be included in the AMS.
9. The fixed external reference price shall be based on the years 1986 to 1988 and shall generally be
the average f.o.b. unit value for the basic agricultural product concerned in a net exporting country and
the average c.i.f. unit value for the basic agricultural product concerned in a net importing country in the
base period. The fixed reference price may be adjusted for quality differences as necessary.
10. Non-exempt direct payments: non-exempt direct payments which are dependent on a price gap
shall be calculated either using the gap between the fixed reference price and the applied administered
price multiplied by the quantity of production eligible to receive the administered price, or using
budgetary outlays.
11. The fixed reference price shall be based on the years 1986 to 1988 and shall generally be the
actual price used for determining payment rates.
12. Non-exempt direct payments which are based on factors other than price shall be measured using
budgetary outlays.
13. Other non-exempt measures, including input subsidies and other measures such as marketing-cost
reduction measures: the value of such measures shall be measured using government budgetary outlays
or, where the use of budgetary outlays does not reflect the full extent of the subsidy concerned, the basis
for calculating the subsidy shall be the gap between the price of the subsidized good or service and a
representative market price for a similar good or service multiplied by the quantity of the good or service.

136
ANNEX 4
DOMESTIC SUPPORT:
CALCULATION OF EQUIVALENT MEASUREMENT OF SUPPORT
1. Subject to the provisions of Article 6, equivalent measurements of support shall be calculated in
respect of all basic agricultural products where market price support as defined in Annex 3 exists but for
which calculation of this component of the AMS is not practicable. For such products the base level for
implementation of the domestic support reduction commitments shall consist of a market price support
component expressed in terms of equivalent measurements of support under paragraph 2 below, as well as
any non-exempt direct payments and other non-exempt support, which shall be evaluated as provided for
under paragraph 3 below. Support at both national and sub-national level shall be included.
2. The equivalent measurements of support provided for in paragraph 1 shall be calculated on a
product-specific basis for all basic agricultural products as close as practicable to the point of first sale
receiving market price support and for which the calculation of the market price support component of the
AMS is not practicable. For those basic agricultural products, equivalent measurements of market price
support shall be made using the applied administered price and the quantity of production eligible to
receive that price or, where this is not practicable, on budgetary outlays used to maintain the producer
price.
3. Where basic agricultural products falling under paragraph 1 are the subject of non-exempt direct
payments or any other product-specific subsidy not exempted from the reduction commitment, the basis
for equivalent measurements of support concerning these measures shall be calculations as for the
corresponding AMS components (specified in paragraphs 10 through 13 of Annex 3).
4. Equivalent measurements of support shall be calculated on the amount of subsidy as close as
practicable to the point of first sale of the basic agricultural product concerned. Measures directed at
agricultural processors shall be included to the extent that such measures benefit the producers of the
basic agricultural products. Specific agricultural levies or fees paid by producers shall reduce the
equivalent measurements of support by a corresponding amount.
ANNEX 5*
SPECIAL TREATMENT WITH RESPECT TO PARAGRAPH 2 OF ARTICLE 4