
Looking back in wonder
8
Published in Intelligent Environments 2010, Kuala Lumpur, Malaysia © Essex University 2010 1 Looking back in wonder Dana Pavel, Vic Callaghan School of Computer Science and Electronic Engineering University of Essex Wivenhoe, U.K. dmpave, [email protected] Anind K. Dey Human-Computer Interaction Institute Carnegie Mellon University Pittsburgh, PA USA [email protected] Abstract— As computing devices become more pervasive, our daily activities start generating a vast amount of information that could be exploited for helping us better understand ourselves. In this paper we present a system that uses easily available data correlated into a story-based representation aimed, at providing users with a better understanding of their lifestyles. While this work is still in its early phases, we believe that it provides valuable insights into the design of such systems. Our initial findings show that user data generated through a person’s daily activities can reveal a wealth of valuable information which they can use to adjust and improve their lifestyles. Keywords- self-understanding, context awareness I. INTRODUCTION Future intelligent environments will provide a diversity of means for capturing information about users and using that information for various types of adaption, including self-awareness driven lifestyle adaptation. We believe that technologies are crucial for empowering individuals by providing information about their lifestyle which can have a long lasting effect on their wellbeing by enabling self-monitoring, self-awareness and self-understanding. Lifestyle choices have a major impact on people’s health as they can influence many chronic diseases, as shown in this reports from World Health Organization (WHO) [1]. According to WHO estimates, 75% of the total world population lives with one chronic condition and 50% with two or more. Increased self-awareness is essential, as about 75% of all chronic patients are low risk and, with proper lifestyle changes, they could better manage their diseases and avoid further deterioration. Certain self-monitoring technologies, such as those that are fitness-related, have already become very popular, with several available commercial systems combining physiological sensors and various visualization methods to help people better understand their body’s reaction to exercising. Human perception and acceptance is also continuously changing, as younger generations get more used to having technology around, digitally recoding their lives, and sharing it [2]. In this paper we are interested in exploring more than just the physical aspects of our lives and we believe that by collecting, correlating and choosing user friendly visualizations of information we generate, through our usage of computing devices, a more objective overview of our daily experiences. To better understand our vision for the system described in this paper, we introduce a motivating usage scenario. Mary is 53 and she has developed a heart problem. She can still live her life normally but her doctor advised her to take it slow and pay more attention to her lifestyle. To make it easier, Mary is using the PAL system, which can record various activity data from her personal devices and correlate all information into a daily story view, so that she can see how certain activities performed during the day impact her physiological state, especially her heart condition. The system helps her remember what happened during the day and allows her to record her own thoughts regarding the events as well as her reactions. For example, the other evening Mary tried to figure out why she felt unusually tired. By using the PAL system, she could see that she had lots of meetings and skipped lunch. One meeting was especially demanding, as her colleague George kept interrupting her presentation, as usual, which annoyed her. The system not only helps her to better understand her own behavior, but also allows her to access some of the information when she talks to her doctor so together they could identify potential risk factors. The system presented in the scenario is part of the PAL project 1 , focusing on self-monitoring systems for preventive and reactive healthcare. Various other usages can be envisioned for such a system based on the data collected, such as monitoring social interactions, understanding emotional responses to certain events, detecting interest and interruptions, and so on. One further example is presented later in the paper as part of an experiment. The contribution of our paper lies in presenting the current development status and initial data collection and validation of a system that exploits accessible data in order to support self-understanding. The key issues in our system focus on gathering relevant 1 PAL project (http://www.palproject.org.uk) is funded by TSB and EPSRC, project no. TP/AN072C.
Transcript of Looking back in wonder
Published in Intelligent Environments 2010, Kuala Lumpur, Malaysia
© Essex University 2010 1
Looking back in wonder
Dana Pavel, Vic Callaghan
School of Computer Science and Electronic Engineering
University of Essex
Wivenhoe, U.K.
dmpave, [email protected]
Anind K. Dey
Human-Computer Interaction Institute
Carnegie Mellon University
Pittsburgh, PA USA
Abstract— As computing devices become more pervasive, our daily activities start generating a vast amount of information that could
be exploited for helping us better understand ourselves. In this paper we present a system that uses easily available data correlated into
a story-based representation aimed, at providing users with a better understanding of their lifestyles. While this work is still in its early
phases, we believe that it provides valuable insights into the design of such systems. Our initial findings show that user data generated
through a person’s daily activities can reveal a wealth of valuable information which they can use to adjust and improve their lifestyles.
Keywords- self-understanding, context awareness
I. INTRODUCTION
Future intelligent environments will provide a diversity of means for capturing information about users and using that information for various types of adaption, including self-awareness driven lifestyle adaptation. We believe that technologies are crucial for empowering individuals by providing information about their lifestyle which can have a long lasting effect on their wellbeing by enabling self-monitoring, self-awareness and self-understanding. Lifestyle choices have a major impact on people’s health as they can influence many chronic diseases, as shown in this reports from World Health Organization (WHO) [1]. According to WHO estimates, 75% of the total world population lives with one chronic condition and 50% with two or more. Increased self-awareness is essential, as about 75% of all chronic patients are low risk and, with proper lifestyle changes, they could
better manage their diseases and avoid further deterioration.
Certain self-monitoring technologies, such as those that are fitness-related, have already become very popular, with several available commercial systems combining physiological sensors and various visualization methods to help people better understand their body’s reaction to exercising. Human perception and acceptance is also continuously changing, as younger generations get more used to having technology around, digitally recoding their lives, and sharing it [2]. In this paper we are interested in exploring more than just the physical aspects of our lives and we believe that by collecting, correlating and choosing user friendly visualizations of information we generate, through our usage of computing devices, a more objective overview of our daily
experiences. To better understand our vision for the system described in this paper, we introduce a motivating usage scenario.
Mary is 53 and she has developed a heart problem. She can still live her life normally but her doctor advised her to take it slow and pay more attention to her lifestyle. To make it easier, Mary is using the PAL system, which can record various activity data from her personal devices and correlate all information into a daily story view, so that she can see how certain activities performed during the day impact her physiological state, especially her heart condition. The system helps her remember what happened during the day and allows her to record her own thoughts regarding the events as well as her reactions. For example, the other evening Mary tried to figure out why she felt unusually tired. By using the PAL system, she could see that she had lots of meetings and skipped lunch. One meeting was especially demanding, as her colleague George kept interrupting her presentation, as usual, which annoyed her. The system not only helps her to better understand her own behavior, but also allows her to access some of the
information when she talks to her doctor so together they could identify potential risk factors.
The system presented in the scenario is part of the PAL project1, focusing on self-monitoring systems for preventive and
reactive healthcare. Various other usages can be envisioned for such a system based on the data collected, such as monitoring social interactions, understanding emotional responses to certain events, detecting interest and interruptions, and so on. One further
example is presented later in the paper as part of an experiment.
The contribution of our paper lies in presenting the current development status and initial data collection and validation of a system that exploits accessible data in order to support self-understanding. The key issues in our system focus on gathering relevant
1 PAL project (http://www.palproject.org.uk) is funded by TSB and EPSRC, project no. TP/AN072C.

Published in Intelligent Environments 2010, Kuala Lumpur, Malaysia
© Essex University 2010 2
user information, managing and interpreting it and presenting it to the user through interactive and intuitive interfaces. With this
work, we aim to create solutions that allow people to better understand and manage their own wellbeing.
II. RELATED WORK
A rich variety of issues, spanning multiple disciplines, are involved in designing and building systems that empower people to better understand and manage their lives. Such diversity of issues is also reflected in the related research areas, as it spans issues from sensing and data collection systems, such as MyLifeBits [3] to finding natural ways of displaying collected information, such as story-based representations [4]. Our work is strongly motivated and influenced by the Calm Computing vision described by Weiser and Seely Brown in [5], where technologies can enrich our lives by seamlessly capturing what goes on at the periphery (outside our attention focus) and bringing it to the centre (what we are attuned to) when needed. Various work in affective computing (described by Picard in [6]), persuasive technologies (described by Fogg in [7]), and context awareness (as defined by Dey and Abowd in [8]) offer further insights into supporting self-understanding through self-monitoring and, ultimately, driving lifestyle changes. Our view regarding the user’s role within the system is very well represented by Shneiderman in [9], where he saw systems empowering people instead of replacing them, and users being not only consumers of information, but also part of the information gathering and processing. One exemplary project on self-monitoring combined with interfaces that support users’ creativity is the Affective Diary [10]. The main aim of the project was to involve people in the process of information creation while also making them aware of automatically collected personal information. The underlying platform collected and correlated user activity data (e.g., location, messages sent and received, calls made and received, browsing, etc.) from a mobile phone and physiological data (e.g., 2-axis accelerometer, heat flux sensor, a galvanic skin response sensor (GSR), a skin temperature sensor, and a near-body ambient temperature sensor) from a sensing device. The data was then transformed and shown to the users in a user friendly way involving emotion-informed shapes and colours. A user study conducted on the Affective Diary showed that people like to reflect back on their daily activities, much as they would do with a diary. The study also showed that some people became quite attached to the system as it helped them look back and better understand what happened and why. The system however did not provide enough flexibility to its users in terms of user interface (i.e., not everybody could relate to the colours and shapes defined by the system), as well as in terms of access to different levels of information (i.e., some people would have liked to understand how certain high level information was derived by having access to lower level data, e.g., sensor values). Interesting ongoing work is also described by Byrne and Jones in [11] where they explore issues around organizing images and context data from life loggers into story structures that can be presented by users to various audiences. Questions related to organizing collected information into stories are extremely relevant also to our work though we currently look mainly into how machines can tell the stories to their users, especially with the aim of helping them understand relations between events and their emotional response. A look at environments that aim to support users’ creativity, such as Scratch (http://scratch.mit.edu/), give us an insight on what
stories can become in the digital space.
III. SYSTEM DESIGN: AN AGENT VIEW
Building a system as described in our scenario brings multiple challenges. Some of the challenges are technological and involve creating systems that are easy to wear, simple to operate, reliable and able to work in various environments and situations. The vast amount of information produced by such systems poses a huge challenge as it needs to be stored, filtered and interpreted so that it can provide useful human-level information to the users. Other challenges relate to the human side of such systems, where acceptance, understanding benefits and ease of use are essential. Here we present some of the system design challenges clustered
around three main areas of information flow. This categorization will also be used throughout the rest of the paper.
Information gathering: (a) Determine what information is relevant; (b) Find a balance between too much and too little data, i.e., having lots of data requires considerable effort spent on gathering as well as processing; not enough data might render the system useless; (c) Find appropriate sources for data by taking into account what is acceptable for users in terms of integrating the system into their lives, e.g., what is acceptable to wear, to collect, and how much would the system cost; (d) Allow users to control what is
collected; (e) Allow users to add new data into the system.
Information processing: (a) Strike a balance between too much and too little processing: users might derive unexpected information if the system allows them access to lower level data; (b) Create a dynamic and flexible model to represent the information collected as well as new information derived through processing and user involvement; (c) Involve the user in the
information processing: users often possess more information about a situation than is available to the system.
Information presentation: (a) Find appropriate paradigms for showing a wealth of information through simple and easy to understand interfaces; (b) Allow users to interact with the system, either for customizing its interface, for controlling it, for querying and examining the information, or for adding new information; (c) Allow users to understand how data was processed, i.e., what
lower level information was used for deriving higher level information.
The ultimate challenge is to build a system that has a positive impact on people’s lives by allowing them to better understand
and manage their wellbeing. In this paper, we describe the system we have been building to support such applications.
Published in Intelligent Environments 2010, Kuala Lumpur, Malaysia
© Essex University 2010 3
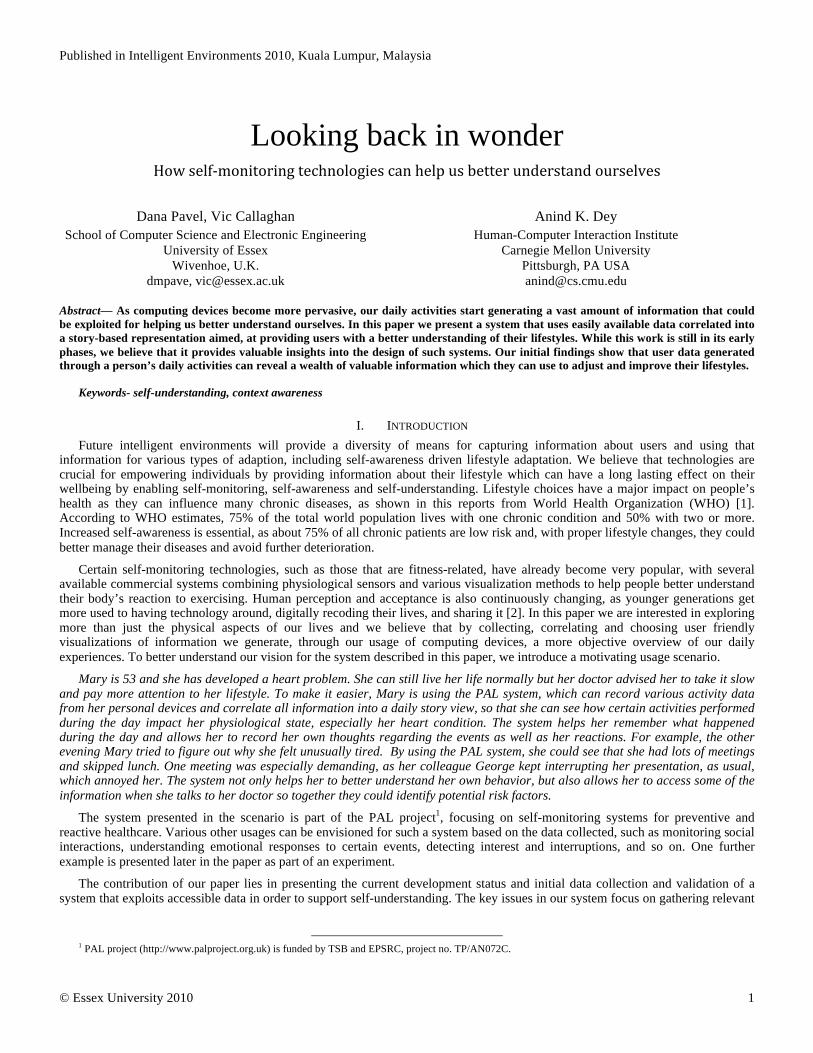
Figure 1 presents a multi-agent view of our system following the information lifecycle. The Data Gathering Agent abstracts all modules that collect input data from the various sources. Currently, the data is collected asynchronously through various means (see Figure 2) as our present scenarios focus mainly on the reflective aspect of looking back and seeing what happened during a certain time period. The Data Transformation Agent performs various operations on input data available in various formats and in multiple local storages, such as: data conversion (e.g., from bytes to values), data categorization, data filtering, data storing into a MySQL
database, database optimization (for time and space), and data model management.
Figure 1. Multi-agent system view
The operations are governed by the Database Model containing information about the structure of the database. The user database is currently centralized to better address potential security and privacy concerns that come with the sensitivity of the
collected data as well as fit the single user centric view of the current system.
Once data is collected into the central database it is processed by the Information Agent through various specialized modules. Various types of information processing are envisioned, such as filtering in order to discard useless or faulty information, aggregation of two or more types of data and interpretation of existing information in order to create higher-level concepts. New information created through these processing means is added to the Information Model. The Presentation Agent has the role of assembling information into a user-friendly format, according to the Story Model (see Section V). The User Interface Agent is responsible for creating various information visualizations. As the system is envisioned as being highly interactive, the User Interface Agent and Interaction Agent need to work together in order to (1) allow the user to see and manage what is being collected; (2) allow the user to query for specific information; (3) allow the user to add new information as either annotations to existing data or new data altogether; (4) take into account certain device capabilities, especially for scenarios that involve remote access to the system; (5) allow the user to customize the user interface to better reflect their personality. It is important to note that Figure 1 includes a larger scope than currently addressed in our implementation, as it also reflects other work planned in the PAL project, such as incorporating privacy policies into all information-related transactions [12] and capturing user concerns through direct and indirect interactions [13]. The Policy Agent is responsible for managing policies related to information usage, as well as various user preferences, and will become increasingly important once other information usages involving external parties (as
described in the scenario) are added to the system.
IV. SYSTEM IMPLEMENTATION AND EXAMPLE
In this section, we describe the information we are collecting as well as what the collection platform entails. It is important to highlight that our choice of collected information and input sources was dictated by: (1) the intended application space (support for users’ self-monitoring and self-understanding); (2) enabling both static and mobile scenarios spanning various spaces and situations; (3) the focus on widely available technologies (PCs, laptops and mobile phones) and (4) using reliable, and unobtrusive
physiological sensing systems.

Published in Intelligent Environments 2010, Kuala Lumpur, Malaysia
© Essex University 2010 4
Figure 2. Data collection platform
Figure 2 shows a platform view of the information collection process. The Data Collection Platform (DCP) component comprises of various modules collecting data from multiple distributed sources, over various technologies (e.g., Bluetooth-BT, USB, IP) and storing it into distributed data storages. Data collected can initially be stored onto sensing devices, sensing gateways (such as phones), personal computers or remote servers. The Data Gathering Agent needs to know where the input data resides,
collect it and give it to the Data Transformation Agent for processing and storing.
Figure 3. Input sources and collected information
Figure 3 shows what information is currently collected from which input sources. The system can collect information from both
physical (raw data) and logical sensors (interpreted data). In terms of data collection we currently have the following input sources:
• Garmin ForeRunner 305 - popular wristwatch-like device used for fitness-related monitoring. The device is capable of providing heart rate and GPS-related information, as raw as well as interpreted data (e.g., distance, speed, etc.). The data is collected on the device itself by using a heart rate monitor belt and then synchronized to a PC. The collected data is stored using Garmin’s own file format, TCX, an XML file using a specific Garmin XML Schema. The files are currently stored
onto the user’s machine over a USB interface.
• Mobile phone data is collected through the NORS platform [15], a mobile Java-based sensing platform that implements various sensor handlers allowing data collection of phone data as well as from attached BT-enabled sensors. The NORS
platform collects data in its own file format. The file can be synchronized with a PC either through BT or IP over GPRS.
• Alive Heart Monitor is a small wearable sensing device developed by Alive Technologies. The device can measure ECG through 2 skin electrodes, as well as 3 axis accelerometer data. It also provides an event button that can be pressed by the user for various purposes, such as annotating certain interesting moments, which can make it easier for the system to look for meaningful events. The data is recorded on an internal SD card. It can also be collected via BT by the NORS platform
Published in Intelligent Environments 2010, Kuala Lumpur, Malaysia
© Essex University 2010 5
on the mobile phone and also directly recorded on a desktop (e.g., for stationary scenarios when the user is as the
computer).
• On the PC side, data collection is performed by using an activity monitoring platform. We tested multiple existing activity platforms and decided to use the ActualSpy platform, because it can record data on the local machine in text as well as HTML format, and it allows for user awareness. The platform records URLs visited (useful to determine web as well as search activity), applications used and associated events (i.e., application window closed, open), user name (helpful to differentiate between multiple users), keystrokes (can be used to search for certain keywords in order to determine interest as well as counted for activity measuring), as well as screenshots (timer-based images that can be used to create a
comprehensive picture of currently used applications).
• External servers are used in order to obtain certain user activity-related information, such as emails sent and received and calendar information. We currently have modules that collect emails from POP3 and IMAP servers, as well as obtain various data from a user’s Google Calendar (assuming such a calendar is used by the user). These modules are used differently from the other data, as we do not fully store emails or calendar data into our user database. Data provided by these modules is obtained on-demand and is used for understanding a user’s social context as well as activities and interest.
Filters for time ranges and keywords have been implemented.
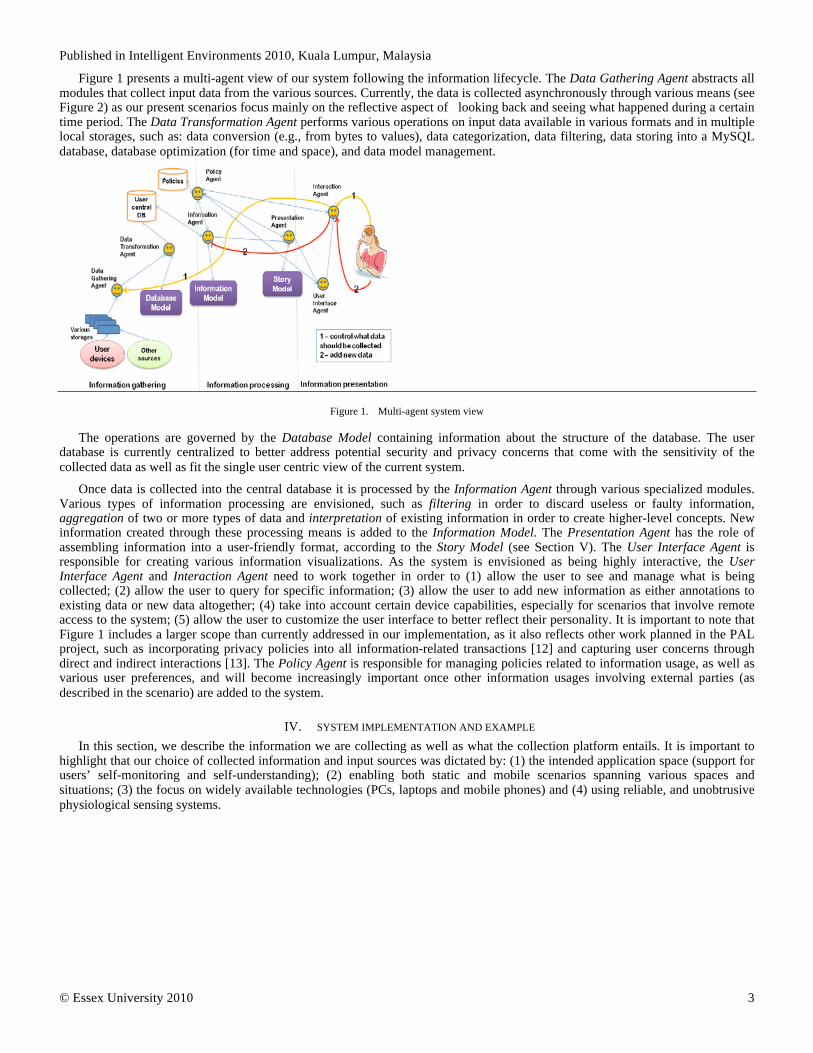
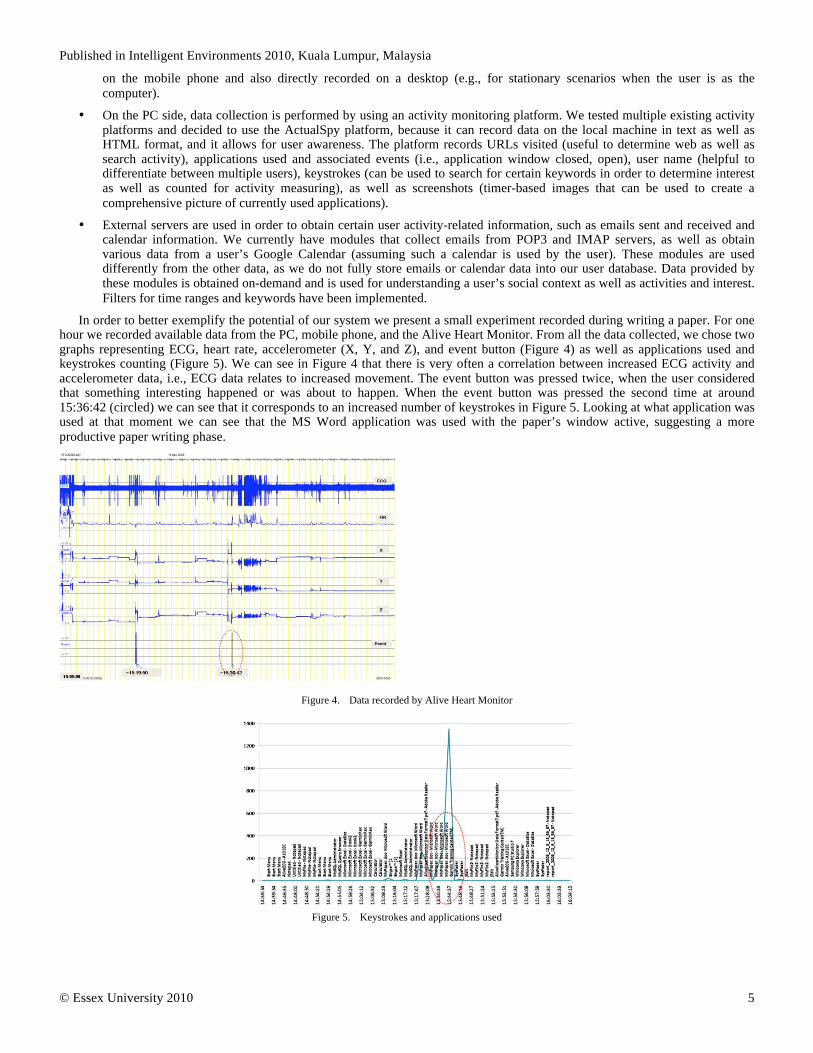
In order to better exemplify the potential of our system we present a small experiment recorded during writing a paper. For one hour we recorded available data from the PC, mobile phone, and the Alive Heart Monitor. From all the data collected, we chose two graphs representing ECG, heart rate, accelerometer (X, Y, and Z), and event button (Figure 4) as well as applications used and keystrokes counting (Figure 5). We can see in Figure 4 that there is very often a correlation between increased ECG activity and accelerometer data, i.e., ECG data relates to increased movement. The event button was pressed twice, when the user considered that something interesting happened or was about to happen. When the event button was pressed the second time at around 15:36:42 (circled) we can see that it corresponds to an increased number of keystrokes in Figure 5. Looking at what application was used at that moment we can see that the MS Word application was used with the paper’s window active, suggesting a more
productive paper writing phase.
Figure 4. Data recorded by Alive Heart Monitor
Figure 5. Keystrokes and applications used

Published in Intelligent Environments 2010, Kuala Lumpur, Malaysia
© Essex University 2010 6
By correlating such data, the system can help users reflect over their productivity over the day and identify stress factors such as interruptions (e.g., chatting programs used or emails sent/received), lack of inspiration, frustration generated by using certain
programs, etc..
Other interesting data (Figure 6), recorded with the mobile phone, shows the number of BT devices (for determining crowd levels by counting BT-enabled phone devices) in the vicinity correlated with surrounding audio levels. It is interesting to see that the increase in BT devices (more than 1, which is user’s laptop), which could mean more people are around (or user having more BT-enabled devices), did not have much effect on the audio level, which means the user did not talk to anybody. Looking at the BT devices collected (using their descriptive names), it can be recognized that they are mostly unknown devices. Given that the user is stationary (seen from the accelerometer data) and that the number of BT devices goes down after a few minutes, we can deduct that
they were just people passing by.
Figure 6. BT vicinity and audio levels
The possibilities are endless and they can offer users an insight into their lives that they might not be able to capture otherwise. In this case, it is easy to imagine that somebody trying to write a paper might be very annoyed by some noisy people that stopped under his window but such situations might not even be recalled by the user later unless they are captured with a system such as
ours.
In building our data collection platform we came across various issues, some of them quite expected and often encountered when building life loggers. One of the main ones is scalability. Some of the data collected, especially from ECG and accelerometer, generate a large amount of information, as they are sampled many times a second (300 for ECG and 75 for accelerometer). Hence, the following data volumes were generated over the hour-long experiment: Alive monitor – 1500KB, mobile phone/NORS – 33KB (no GPS, no attached sensors), PC platform – 20KB (no screenshots). The Alive Heart Monitor stores its data in a binary format but once the values are converted to actual values, the database size increases significantly. Because of that, we optimize the database size by creating binary file repositories for ECG and accelerometer and only store pointers to these files into the relevant databases. Hence, raw data is preserved for further processing (e.g., heart rate determination based on ECG or activity context based on accelerometer data) and database size is substantially reduced. Writing to the database is a very time-consuming operation, especially for data sampled quite frequently. Hence, we use buffered writing operations in order to improve the data storing
performance.
Another important issue is the existence of various formats and synching methods used by our data sources, which requires a considerable effort when building the data gathering modules. Standardization efforts in certain areas (such as the Continua Alliance in health world - http://www.continuaalliance.org/) should improve the situation but it still remains a major issue. Battery lifetime is also important. Although the Alive Heart Monitor can record for a few days before recharging is required, the Garmin device as well as the mobile phone needs a daily recharge when GPS is recorded. Time correlation is also an issue when using multiple devices as their clocks can differ from a few seconds to a few minutes. Special care needs to be taken in keeping them
synchronized.
In our experiments, we have been focusing on a single user recording data in various situations such as at home, at work, or on the go. Our preliminary findings show (1) that it is unrealistic to assume that people would wear or even remember to switch on devices all the time (e.g., Garmin requires an explicit Start/Stop action) (2) the incentive of using such system depends on how eventful the day is expected to be (3) that attaching wearable electronics such as a heart monitor belt is still not comfortable enough to allow for permanent data collection (4) the accuracy of data highly depends on where and how the sensors are placed, a person’s
posture or movement.

Published in Intelligent Environments 2010, Kuala Lumpur, Malaysia
© Essex University 2010 7
V. ONGOING WORK: FROM SENSORS TO USERS
The collected information allows understanding user’s physical context (location obtained through various types of sensors–GPS, cell information, WLAN- at different granularity levels), social context (obtained from sensors-discovery of people through BT- or social communication from emails, calendar, chat programs), emotional & physiological context (obtained through ECG and heart rate monitoring, keyword-based filtering of registered keystrokes), mental context (e.g., interest derived through web activity, applications used, keyword-based filtering of keystrokes, screenshots), activity context (from accelerometer data or applications
used), and environmental context (noise level, battery levels, signal strength, etc.).
An appropriate balance has to be found between having too much abstraction and allowing transparency. Allowing end user access to certain unprocessed or lightly processed data can also generate abstractions that a system designer might not have considered or could not even consider due to incomplete information. With all the advances in emotion recognition, it is still hard to determine with certitude what the user feels, especially when considering real world settings (as opposed to controlled research laboratory experiments), as described by Picard et al. in [16]. For example, in our initial scenario, the system can realize that Mary’s heart rate increased, her voice pitch raised and deduct that she was getting angry. However, Mary’s status could also be a reaction to an increase in room temperature or to being in a crowded environment rather than anger. Some other hidden parameters can have an impact on her emotional status (current or even historical, such as previous experiences related to people present, etc.) and in such situations it would be better to just show to the user through the interface that something unusual happened at a certain moment during the day (e.g., based on her heart rate and voice pitch changes) and let her deduct what exactly happened and why,
by allowing access to other collected information (e.g., who else was there, what else happened around the same time, etc.).
Our exploration of interactive information systems and natural ways of presenting life experiences led us to stories as a means of relating information to humans [17]. Stories offer a way of organizing information as collections of meaningful events brought together either by following a timeline or a certain topic or character, as described by Brooks in [4]. In our system, we plan to explore this type of information presentation from simple to more complex structures enabled by a modeling process that takes
information from the Information Model and arranges it into a story-based representation, according to the Story Model.
Figure 7. Relations between context and story structures
Stories are formulated as a sequence of meaningful events with collected information forming these events. For that, the Presentation Agent and the Information Agent collaboratively determine what could be meaningful. Such event is described through the scenarios: Mary’s meeting, her presentation and her increased heart rate. Through zoom-in functionalities, Mary has access to other related information. She can see notes she previously added to the event, as well as add some more (e.g., explain why she thinks she felt so stressed during the meeting). The annotated information becomes part of the story and will be available to her when she reflects on the information in the future. This makes the story evolve in a subjective, human way, as perception of feelings and explanations can change based on remembering or forgetting things. Also important to note is that the story can change depending on what the user is most interested in (e.g., emotional state vs. spatial movement – as in [14]), as well as based on end users’ identities and their relation to the main user (i.e., the one that most of the collected data refers to). Furthermore, we plan to
explore adding persuasion features into the model, especially when a lifestyle change is desired.
VI. CONCLUSIONS
In this paper, we presented the motivation, design, and current implementation of a system designed to support people in self-monitoring and self-understanding their lifestyle. Our work is divided into three distinct phases, the first being the selection of the input data, the design and development of the data gathering platform and initial tests, which this paper presented. Further input data and sources will be added to the system based on scenarios as well as availability. We are currently working on the next phases, concerning data analysis, processing, modeling, and visualization as well as evaluating the applicability and usefulness of such system. Central to our approach is the presentation of data within a certain story through an interactive process and using a
model that evolves over time based on information processing provided by the system and the users.
We believe that the first results regarding our system’s potential are promising and we intend to further evaluate and report its usefulness in various situations and with multiple users, in order to better understand how such systems can support people in
managing their lifestyle and their wellbeing.

Published in Intelligent Environments 2010, Kuala Lumpur, Malaysia
© Essex University 2010 8
REFERENCES
[1] WHO, “What is the evidence on effectiveness of empowerment to improve health?,” WHO HEN report, February 2006.
[2] Don Tapscott, Grown Up Digital: How the Net generation is changing your world. New York: McGraw-Hill, 2008.
[3] J. Gemmell, G. Bell, L. Gordon, D. Roger, S. Drucker and C. Wong, “MyLifeBits: Fulfilling the Memex Vision,” ACM Multimedia '02, December 1-6,
2002, Juan-les-Pins, France, pp. 235-238.
[4] K. Brooks, “Do story agents use rocking chairs? The theory and implementation of one model for computational narrative,” Proceedings of the 4th ACM Conference on Multimedia, November 1996.
[5] M. Weiser and J. Seely Brown, “The Coming Age of Calm Technology,” Xerox PARC paper, October 1996.
[6] R. W. Picard, Affective computing. Cambridge, MA: MIT Press, 1997.
[7] B.J. Fogg, Persuasive Technology: Using Computers to Change What We Think and Do. San Francisco, CA: Morgan Kaufmann, 2003.
[8] A. K. Dey and G. D. Abowd, “Towards a Better Understanding of Context and Context Awareness,” Proceedings of HUC '99, 1999.
[9] Ben Shneiderman, Leonardo's Laptop: Human Needs and the New Computing Technologies. Cambridge, MA, USA: MIT Press, 2002.
[10] A. Ståhl, K. Höök, M. Svensson, A. Taylor, and M. Combetto, “Experiencing the Affective Diary,” Journal of Personal and Ubiquitous Computing, vol. 13, issue 5, pp. 365–378, June 2009.
[11] D. Byrne and G. J. Jones, “Towards computational autobiographical narratives through human digital memories,” Proceedings of the 2nd ACM international
Workshop on Story Representation, Mechanism and Context, October, 2008.
[12] J. Singh and J. Bacon, “Event-based data dissemination control in healthcare,” Proceedings of eHealth 2008.
[13] M. Ball, V. Callaghan, M. Gardner and D. Trossen, “Exploring Adjustable Autonomy and Addressing User Concerns in Intelligent Environments,” Proceedings of Intelligent Environments, July 2009.
[14] A. Aris, J. Gemmell and R. Lueder, “Exploiting Location and Time for Photo Search and Storytelling in MyLifeBits,” Microsoft Research Technical Report MSR-TR-2004-102, October 2004.
[15] D. Trossen, D. Pavel, “NORS: An Open Source Platform to Facilitate Participatory Sensing with Mobile Phones,” Proceedings of MobiQuitous, 2007.
[16] R. Picard, E. Vyzas, J. Healey, “Toward Machine Emotional Intelligence: Analysis of Affective Physiological State,” IEEE Transactions on Pattern
Analysis and Machine Intelligence, vol 23, issue 10, pp. 1175-1191, October 2001.
[17] J. Bruner, Acts of Meaning, Cambridge, MA: Harvard University Press, 1990.