Changing Paradigm of Indo-Japan Relations: Opportunities and Challenges
39
Changing Paradigm of Indo-Japan Relations: Opportunities and Challenges PG Rajamohan Dil Bahadur Rahut Jabin T Jacob April 2008 INDIAN COUNCIL FOR RESEARCH ON INTERNATIONAL ECONOMIC RELATIONS Working Paper No. 212
-
Upload
ims-master -
Category
Documents
-
view
5 -
download
0
Transcript of Changing Paradigm of Indo-Japan Relations: Opportunities and Challenges

Changing Paradigm of Indo-JapanRelations: Opportunities and
Challenges
PG Rajamohan
Dil Bahadur RahutJabin T Jacob
April 2008
INDIAN COUNCIL FOR RESEARCH ON INTERNATIONAL ECONOMIC RELATIONS
Working Paper No. 212

Contents Foreword .............................................................................................................................. i Abstract ............................................................................................................................... ii Introduction......................................................................................................................... 1 Pre-World War II – Rising Japan and Admiring India ....................................................... 2 Independent India and Japan............................................................................................... 6 The Cold War and India-Japan Relations ........................................................................... 7 Economic Relationship during the Cold War ..................................................................... 7 End of the Cold-War and Re-emerging India-Japan Economic Cooperation................... 10 Japanese ODA................................................................................................................... 10 Foreign Direct Investment ................................................................................................ 11 The Trade Relationship..................................................................................................... 12 Japan’s Exports & Imports................................................................................................ 13 The Rise of Indo-Japan Ties Post-1998............................................................................ 15 Degrees of Separation ....................................................................................................... 15 The “Arc of Freedom and Prosperity” – Joint Action in Afghanistan and Myanmar ...... 17 The Security Relationship................................................................................................. 19 The Way Ahead ................................................................................................................ 21
List of Table Table 1: Japanese Cotton Sales in British India Market (in yen) 1927-1932 ..................... 3 Table 2: Intraregional Trade 1937 and 1948 (in US$ million; freight on board prices)..... 4 Table 3: Japan’s External Trade in 1939 ............................................................................ 5 Table 4: Japanese Cotton Sales in British India Market in 1939........................................ 5 Table 5: Yen Loans offered to India (from September 1973) ............................................ 8 Table 6: Japanese Export-Import to India (Values in units of US$ 1,000)......................... 9 Table 7: GDP and Global Rank in 2006 (in million US$)................................................ 10 Table 8: Country-Wise Technology Transfer Approvals (August 1991 to August 2007) 12 Table 9: Composition of India’s Trade with Japan in 2006.............................................. 14
List of Graph Graph 1 :Share of India’s exports and imports by country (percentage).......................... 13 Graph 2: Share of Japan’s exports and imports by country (percentage) ......................... 14

List of Appendix Appendix I: Indian Merchants in Osaka-Kobe connected with the Match Trade ............ 23 Appendix II: GDP and Global Ranks in 2006 (in million US $)...................................... 24 Appendix III: Share Of Top Investing Countries FDI Equity Inflows (Financial year-wise) .................................................................................................................................. 25 Appendix IV: India's Top 20 Export Destinations (Rank) ............................................... 26 Appendix V: India's Top 20 Import Destination (Rank) .................................................. 27 Appendix VI: India’s External Trade ............................................................................... 28 Appendix VII: Exports from Japan to Top 20 Countries.................................................. 29 Appendix VIII: Imports to Japan from Top 20 Countries ................................................ 30 Appendix IX: Japan's External Trade ............................................................................... 31 Appendix X: Japanese FDI outflows by global region and main host country 1980–2001 (in Yen billion at current prices)....................................................................................... 32

i
Foreword This paper presents an overview of Indo-Japan cooperation since late 18th and early 19th century till date. In the light of the changing paradigm in India-Japan relations over the past several years, including the attempt to build a strategic and global partnership between them, this paper analyzes the opportunities and challenges for cooperation and makes policy recommendations. The paper finds that during the pre-cold era there was a strong economic and cultural tie between the two countries, which remained at low level during cold war period but it strengthened after the cold war. India-Japan relations have over the past several years undergone a paradigmatic shift which has seen the attempt to build a strategic and global partnership between them. Current and future economic and population dynamics in both the countries mean that India-Japan relations will continue to improve not just politically but also in economic terms. This paper is part of the Japan Chair at ICRIER. The Chair was set up at the Indian Council for Research on International Economic Relations (ICRIER), New Delhi with funding from Sasakawa Peace Foundation (SPF) to initiate a wide range of research activities on Indo-Japan bilateral issues and to provide a fill to the existing research gap on Japan in India and help to strengthen ties between the two countries. One of the principal activities of The Japan Chair is to bring together experts and specialists to deliberate on future trends in Indo-Japan relations with focus on the likely role of these two large economies in an increasingly globalized world.
(Rajiv Kumar)
Director & Chief Executive
April 1, 2008

ii
Abstract India’s growing economic strength in recent years has seen it adapting its foreign policy to increase its global influence and status and to meet the challenges of the 21st century. In the past few years, New Delhi has expanded its strategic vision, most noticeably in Asia, and has broadened the definition of its security interests. As a result, India-Japan relations have undergone a paradigmatic shift which has seen an attempt to build a strategic and global partnership between the two countries. India and Japan share a special relationship as fellow democracies without hegemonic interests and with a similar propensity to seek peaceful resolution of conflicts and greater economic engagement in the Asian continent. This paper puts forward the argument that while there are certainly problems of communication and distance between the two countries, the changing international order – including most notably, the rise of China – will see the two countries increasingly thrown together on a variety of issues, some of which have been identified in the present work. Current and future economic and population dynamics in both the countries mean that India-Japan relations will continue to improve not just politically but also in economic terms. _________________________________________ Key words : India, Japan, Trade, FDI, ODA Jel Classifications : F10, F21, F35, F59, N00

1
Introduction In the case of Indo-Japan relations, despite the great complementarity that existed between the two countries both politically – since the end of World War II (WWII) – and economically, since even earlier, physical distance also meant mental distance as neither country figured on each other’s political or economic radars for decades. India’s growing economic strength in recent years has seen it adapting its foreign policy to increase its global influence and status and to meet the challenges of the 21st century. In the past few years, New Delhi has expanded its strategic vision, most noticeably in Asia, and has broadened the definition of its security interests. While focusing on developing special relationships with the US, Russia, China and European countries, the overall thrust of Indian foreign policy has been to seek geopolitical partnerships in multiple directions to serve its national interests. In this context, India and Japan share a special relationship as fellow democracies without hegemonic interests and with a similar propensity to seek peaceful resolution of conflicts and greater economic engagement in the Asian continent. Although cultural ties between Japan and India go back fourteen centuries when Buddhism found its way to Japan in the 7th century AD via China and Korea, the relationship has primarily been indirect. Direct contact between the two countries dates only to the mid-19th century. Until the beginning of WWII both countries enjoyed fairly close economic ties and the Indian and Japanese elites had considerable sympathy for each other’s aspirations. After WWII and India’s independence in 1947, both countries opened a new chapter in their relationship as two independent nations and the largest democracies in Asia. Until recently, however, both countries had remained distant concerns for each other. From the 1960s to the 1980s the bilateral relationship was relatively inactive, mainly because of differing approaches towards international politics and management of the domestic economy. During the Cold War era, if India was guilty of dismissing Japan as a camp follower of the US, the Japanese in turn perceived India as a chaotic, dysfunctional, desperately poor country and not as a potential partner; the persistence of poverty in India and the successful drive for prosperity in Japan had changed the bilateral relationship. With the end of the Cold War, India began its “Look East” policy in the early 1990s that dovetailed with the opening up and liberalization of its economy. However, the Indian nuclear tests of 1998 marked a low point in bilateral relations; Japan suspended all political exchanges and even economic assistance was frozen for nearly three years. In August 2000, however, Japanese Prime Minister Yoshiro Mori made a five-day visit to India that helped propel ties forward. Today, the prolonged economic slump in Japan and the re-emergence of India as an economic power are, among other things, once again redefining bilateral relations. In light of the paradigmatic shift in India-Japan relations over the past several years, including the attempt to build a mutual strategic and global partnership, this paper analyzes the opportunities and challenges for cooperation and makes policy recommendations. This paper argues that India-Japan relations will continue to improve because the circumstances of the post-Cold War era – including, most notably, the rise of China – will reduce the geographical and mental distance between them. Further, we

2
argue that economic ties between India and Japan are likely to strengthen as a result of current and future economic and population dynamics in both countries. Pre-World War II – Rising Japan and Admiring India In the rise of Japan from the late 19th century onwards, other Asian nations and peoples saw the promise of their own revival, hailing both the speed as well as content of Japan’s transformation. During the 1880s and 1890s, the educated class in India particularly the leaders of new religious and spiritual movements in Bengal, like PC Mozoomdar and Swami Vivekananda, admired the Japanese example and were happy to see the dignity and honour of the Japanese character, the enterprise and ceaseless industry of the people, their cleanliness, food habits, dress, etiquette and manners. Swami Vivekananda in a letter during his visit in 1893 noted that “[t]he Japanese seem now to have fully awakened themselves to the necessity of the present times… And they are bent upon making everything they want in their own country.”1 In another letter written on June 1901, he expressed great hope for better relations saying, “The help that Japan will give us will be with great sympathy and respect, whereas that from the West unsympathetic and destructive. Certainly it is very desirable to establish a connection between India and Japan.”2 The victory of Japan over Czarist Russia in 1904 and its skill in modern warfare stimulated nationalist movements in Asia against the colonial powers. As elsewhere in Asia, the event produced great excitement in India, and informed opinion saw in it a decisive turn in Asia’s relations with Europe. It put new confidence in the Indian National Congress of being able to wage and win the struggle against British rule in India. In his autobiography, Jawaharlal Nehru recalled the impact of the news of the Japanese victory. Writing to his daughter in 1932, Nehru noted that “Japan’s victory was seen to be due to her adoption of new industrial methods of the West. These so-called Western ideas and methods thus became more popular all over the East.”3 When the Indian freedom struggle entered the swadeshi phase, Japan was seen as a source of new equipment and machines to increase the supply of home-made goods and displace foreign, mostly British, goods. Simultaneously, the number of Indian students going to Japan for education and industrial training began to increase, because Indian thinking was influenced by Japan’s assistance in education and industrial development. These historical instances indicate patterns of what has moved and will continue to stimulate the bilateral relationship between India and Japan. Japan’s record of not merely adopting Western ideas but also adapting them to the local context and its welcoming of Asian students are still major features of the modern Japanese model. Having eschewed its imperial ambitions, Japan became a trailblazer in economic development and technological innovation, both of which are achievements that developing countries such as India seek. Where India was earlier constrained by colonialism and later self-imposed
1 Speeches and Writings of Swami Vivekananda (Madras: G A Natesan and Co., 1922) p. 753. 2 The Complete Works of Swami Vivekananda, Vol. VIII (Almora: Advaita Ashrama, Mayavati, 1948), pp.
552-53. 3 Jawaharlal Nehru, “Letter No. 117,” Glimpses of World History, Vol. 2 (Allahabad: Kitabistan, 1934),
pp. 726-7.

3
economic and political restraints, today’s rising India is poised to both gain from and contribute to Japan’s new rise in the global order. Trade links have existed between the two countries for more than a century. In the late 19th and early 20th centuries, Indian companies based in Japan exported cotton crepe, cotton yarn, knitwear, silk pieces, buttons, celluloid bangles, bags, fans, toys, purses, matting, umbrellas, willow hampers, matches, wood products, brassware, celluloid-ware, glassware, lacquerware, perfumes, soap, paper, camphor, brushes, lanterns etc. from Japan and imported raw cotton, rubber, ivory, Arabic gum, sheep skins, tapioca, pepper, shellac gum, etc. Appendix 1 shows that several Indian companies and merchants connected with the match trade were based in Japan, which highlights the historical ties between India and Japan. Oishi (2004), for example, shows that Japanese investment in Indian match factories existed as early as 1927. Meanwhile, Japanese foreign investment existed in India from the early 1900s. Historically, Japanese industry depended on the Asian market to sell their goods and for the import of raw material.4 For example, British India was the main market for the Japanese matches and the match trade between Japan and India, dated back to early 1890s. Exports to India from Japan increased greatly during the World War I (WWI), filling the vacuum left by the retreat of matches from Sweden and other European countries. 5 India replaced China as Japan’s main market in 1915, and retained that position until 1925 with cotton goods contributing the most to Japanese exports to India. Table 1 shows that between 1927 and 1932 the total cotton goods exported from Japan to India ranged from 50 per cent to 64 per cent of total Japanese exports to India.6 In 1931, India produced only 79 per cent of its cotton consumption and the balance was imported from Great Britain and Japan, which indicates that Japan had the major share in the huge Indian cotton goods market.
Table 1: Japanese Cotton Sales in British India Market (in yen) 1927-1932
Total Exports to lndia
Cotton yarn Cotton tissues Total Cotton goods
1927 167,580,101 20,040,134 86,126,986 106,367,317 1928 146,006,638 9,181,071 70,185,408 79,366,479 1929 198,056,969 13,449,318 109,138,997 122,587,315 1930 129,262,375 6,575,986 61,216,254 67,802,240 1931 110,367,354 5,592,134 49,866,019 55,458,253 1932 192,491,854 14,343,099 80,653,540 94,996,639
Source: “Memorandum on Anglo-Indian-Japanese Textile Competition,” Vol. 2, No. 17, American Council, Institute of Pacific Relations (New York), 15 September 1933. 4 The Japanese demand for raw cotton, iron ore, mica and manganese ore was mainly met by India. 5 See Takashi Oishi, “Indo-Japan Cooperative Ventures in Match Manufacturing in India: Muslim
Merchant Networks in and beyond the Bengal Bay Region 1900-1930,” International Journal of Asian Studies, Vol. 1‚ No. 1, January 2004.
6 Total exports from Japan to India from 1927 to 1932 ranged between 110.4 million yen to 192.5 million yen.

4
During the early 1930s, trade in Japanese goods other than cotton increased as a result of the Chinese boycott of Japan and the Indian boycott of Great Britain. Of India’s total imports, Japan supplied 9.1 per cent in 1930, 10.2 per cent in 1931 and 14.4 per cent in 1932.7 In the pre-Cold War era, raw cotton, pig iron, manganese ore, shellac and beans were the major export products from India to Japan. In 1937, Japan’s imports from India and China were 7.05 per cent (US$ 69.5 million) and 20.63 per cent (US$ 203.4 million), respectively, of the total imports, whereas its exports to India and China were 6.07 per cent (US$ 72.5 million) and 25.46 per cent (US$ 304.3 million), respectively, of the total exports. During the same period, India’s imports from Japan and China were 0.03 per cent and 0.6 per cent of the total imports, whereas its exports to Japan and China were 9.76 per cent and 1.11 per cent, respectively, of the total exports (see Table 2). These trade figures for Japan and India clearly show that there was historical economic cooperation between the two countries, but it was slightly lower in 1940s as compared to 1920s.
Table 2: Intraregional Trade 1937 and 1948 (in US$ million; freight on board prices)
(Share of trade in parentheses)
Japan’s Import and Exports
1937* 1948* 1937* 1948*
Country Imports Exports
India 69.5 (7.05) 24.1 (4.15) 72.5 (6.07) 16.8 (6.50)
China 203.4 (20.63) 11.3 (1.95) 304.3 (25.46) 2.0 (0.77)
Total 985.7 580.2 1195.3 258.3
India’s Import and Exports
Country Imports Exports
Japan 72.5 (12.42) 16.8 (1.14) 69.5 (9.76) 24.1 (1.61)
China 3.5 (0.60) 6.5 (0.44) 7.9 (1.11) 30.3 (2.02)
Total 583.7 1468.4 712 1499 Adapted from Anthony Y. C. Koo and C. C. Liang, “The Role of Japan in the Intraregional Trade of the Far East,” The Review of Economics and Statistics, Vol. 35, No. 1. February 1953, pp. 31-40. * This statistical table is based on C. C. Liang, “Intraregional Trade of Economic Commission for Asia and the Far East Countries (ECAFE),” International Monetary Fund (mimeographed memorandum 1948) and the Intraregional Trade of the Far East in 1949 as compared with 1937 and 1948, International Monetary Fund (mimeographed memorandum, 1951). 7 “Memorandum on Anglo-Indian-Japanese Textile Competition,” Vol. 2, No. 17, American Council,
Institute of Pacific Relations (New York), 15 September 1933,

5
After 1937, there was a turnaround in the trade between Japan and India. In 1939, India ranked third both as a market for Japanese goods and as a source of imports. In 1939, India’s share of Japanese imports was 6.3 per cent while its share of Japanese exports was 5.9 per cent (see Table 3). During the same year, India’s share of Japanese cotton imports was larger than any other country; by volume it was 33.6 per cent and by value it was 26.2 per cent of total Japanese cotton imports. That year, India supplied 90 per cent of Japan’s imports of mica and in 1936 India was the single largest supplier of pig iron.8 In 1939, India imported cotton yarn worth ¥29 million of the total Japanese exports of cotton yarn worth ¥71 million, rayon worth ¥14 million of the total Japanese exports of rayon worth ¥29 million, and rayon goods worth ¥20 million of total exports of ¥137 million (Table 4).
Table 3: Japan’s External Trade in 1939
Total (world) India’s Share India’s Rank
Imports ¥ 2905 million 6.3 % 3rd
Exports ¥ 3564 million 5.9% 3rd Source: Adapted from Irving S. Friedman, “India and Japan Exchange Key Products,” Far Eastern Survey, Vol. 9, No. 18., 28 August, 1940, pp. 215-216. Table 4: Japanese Cotton Sales in British India Market in 1939
Value of exports (in
million yen) Quantity of exports
Exports to India
Total exports to
world
Exports to India Total exports to world
Cotton tissue ¥73 ¥ 405 46 million sq. yds. 2,445 million sq. yds
Cotton yarn ¥29 ¥ 71 215,000 piculs 630,000 piculs
Rayon yarn ¥14 ¥ 29 147,000 piculs 278,000 piculs
Rayon piece goods
¥20 ¥ 137 50 million sq. yds 310 million sq. yds
Source: Adapted from Irving S. Friedman, “India and Japan Exchange Key Products,” Far Eastern Survey, Vol. 9, No. 18., 28 August, 1940, pp. 215-216. In 1948, there was a drop in regional trade due to WWII, so any inferences would be biased. Despite the shattered Japanese economy, Japan continued its trade links with India. In the pre-Cold War era, India was a major trading partner of Japan, which depended on India not only as an important source of raw material but also as the leading 8 Irving S. Friedman, “India and Japan Exchange Key Products,” Far Eastern Survey, Vol. 9, No. 18., 28
August, 1940, pp. 215-216.

6
market for Japanese products. The pre-Cold War era thus saw great economic cooperation between India and Japan, which was later interrupted by the Cold War. Independent India and Japan Following WWII, during which Indian troops under the British Empire fought Japanese troops and Indians under the Indian National Army fought the British with Japanese support, India played a limited role in the Allied Occupation of Japan from 1945 to 1952. Justice Radha Binod Pal was the lone dissenting voice on the war crimes tribunal set up to try Japanese war criminals, including Prime Minister Hideki Tojo. Once India became independent, it expressed support for Japanese interests; its delegation at the Far Eastern Commission, for example, was sympathetic to Japanese concerns about rebuilding their nation and to encouraging Japanese industry and finance. In 1949, the Indian delegation stopped pressing the question in the Commission regarding its share of reparations from Japan and proposed halting the reparations altogether, noting that the burden of making such payments told heavily on the living standards of the Japanese people.9 India’s interest in Japan’s rapid economic recovery also found expression in other international forums. Further, India welcomed the relaxation of controls on Japan because of the flow of Japanese technical expertise to the rest of Asia. Although 52 nations assembled to sign a peace treaty with Japan at San Francisco in September 1951, India did not participate because of its belief that the Japanese Peace settlement was part of the Cold War and the principal parties to it were more interested in enlisting support for their respective positions than to bringing peace to Asia. India applied two crucial tests to determine whether it was going to participate in the Japanese Peace treaty. First, did the treaty accord Japan a place of honour, equality and contentment in the family of nations? Second, did the treaty contribute to amity and friendship in the Far East? On both counts the treaty was found to fall short of India’s expectations and, therefore, it chose not to participate. Instead, India decided that immediately after Japan regained its independent status India would make a declaration terminating the state of war between the two countries and later negotiate a simple, bilateral treaty with Japan.10 The Japanese public responded favourably to India’s stand, particularly its opposition to linking the peace treaty with a bilateral security arrangement. Given the high esteem in which India, and particularly Nehru, was held by most Japanese in those years, there was appreciation that India had raised its voice and expressed dissatisfaction with the terms of the treaty in so far as they concerned the prospects for peace in Asia. Much of this warmth and high esteem was echoed in more recent times when Japanese Prime Ministers Junichiro Koizumi and Shinzo Abe used them in combination with the new realities of the international order to make a case for improved Indo-Japan ties.
9 See P. A. Narasimha Murthy, India and Japan: Dimensions of Their Relations (New Delhi: ABC
Publishing House, 1986). 10 Parliamentary Debates, Vol. 15, pt. 2, 27 August 1951, col. 1360.

7
The Cold War and India-Japan Relations In the period between World War II and the end of the Cold War, the positive popular perceptions of each other were not sufficient to prevent India and Japan joining the post-WWII community of nations with diametrically opposing political orientations. Non-alignment, peaceful coexistence and recognition of China’s rightful place in the world shaped India’s outlook, whereas Japan based its position on alignment, balance of power and the containment of China. These differences influenced how each nation viewed the other and conditioned their responses to critical world problems. In consequence, they moved slowly and cautiously with respect to each other in political and security terms; their relations remained limited to economic, commercial and cultural matters where relations progressed extremely slowly. Indo-Japanese political connections remained weak despite the exchange of ambassadors, mutual visits by goodwill groups and parliamentary delegations, and the conclusion of trade and other accords. The highlights of the political exchange were the warm receptions accorded to Japanese Prime Minister Kishi Nobusuke during his visit to India in May 1957 and to Indian Prime Minister Jawaharlal Nehru during his visit to Japan later in the year. Following these visits, India received its first Overseas Development Assistance (ODA) in 1958. Soon, however, the exchange of high-level visits descended to mere formality without impacting the content of the bilateral relationship as Japan made rapid economic progress and the harsh realities of the Cold War intervened. The latter was exemplified by the mutual lack of trust, especially where relations with the superpowers were concerned and conflicting perceptions of how the international order should be shaped. On specific international questions such as the Sino-Indian border conflict and the India-Pakistan wars, Japan showed no overt interest either in lending support to India or in opposing it. The Japanese consciously treated India and Pakistan evenhandedly, participating in their economic development programmes without getting drawn into their disputes. A general tilt towards its ‘ally’s ally’ was an unstated assumption behind that policy. During the India-Pakistan conflict, Japan’s diplomatic moves in the UN were not necessarily hostile to India, but its action on the aid front could be interpreted thus. Soon after the US suspended its aid to India, Japan also enforced an embargo on flow of credits and all fresh loans. Economic Relationship during the Cold War Despite the initial enthusiasm and high hopes of the 1950s, the Indo-Japan relationship failed to take off politically and the relationship was essentially dormant from the 1960s to the 1980s. Nevertheless, during the Cold War period Japan became the largest bilateral donor to India. Thus, the relationship was primarily sustained by Japanese ODA, with minor additional support provided by trade. Japan’s position as India’s largest aid donor continues to the present.

8
Table 5: Yen Loans offered to India (from September 1973) Date (Offered) Classification
Months Year
Amount ($million)
1st yen loan Feb. '58 50.00 2nd yen loan Aug. '6I 80.00 2nd yen loan (additional) May '63 15.00 3rd yen loan Oct. '63 65.00 4th yen loan Sep. '64 60.00 5th yen loan Jul. '65 60.00 6th yen loan (in goods) Dec. '66 42.50 1966 debt reschedule Dec. '66 2.50 Emergency food aid Jul. '67 7.00 1967 debt reschedule Aug. '67 6.10 7th yen loan (in goods) Sep. '67 38.90 1968 debt reschedule Aug. '68 16.83 8th yen loan (in goods) Feb. '69 28.17 1969 debt reschedule Jul. '69 19.56 9th yen loan (in goods) Feb. '70 25.44 Yen loan for port expansion project (project aid) Mar. '70 7.00 1970 debt reschedule Jul. '70 25.41 10th yen loan (in goods) Apr. '71 25.39 Yen loan for seabed oil exploration (project aid) Apr. '71 15.40 I 971 debt reschedule Jul. '71 20.60 11th yen loan & special loans Feb. '72 70.96 Total 681.76
Adapted from Zilur R Khan, “Japanese Relations with India, Pakistan and Bangladesh,” Pacific Affairs, Vol. 48, No. 4, Winter 1975-1976, pp. 541-57. Source: M I T I (Ministry of International Trade & Industries, Japan). During the Cold War, there was a certain degree of trade cooperation due to rising demand from changes in the economic structure of both countries. However, there was a change in the major export and import items from the early 1900s. The major traded commodities changed from cotton-related products in the early 1900s to heavy machinery in the 1970s. Table 6 shows that in 1970-72 iron ore became the major item that Japan imported from India and other imports include hemp fabrics, textile products, and precious and semi-precious stones. During the same period heavy industrial products were the major export commodities from Japan besides metal and metal products like iron and steel and steel plates.

9
Table 6: Japanese Export-Import to India (Values in units of US$ 1,000)
Items 1970 1971 1972
Japanese Imports from India Iron ore 198,922.00 205,240.00 218,813.00
Hemp fabrics 3,510.00 4,054.00 7,517.00
Textile products 5,746.00 6,232.00 11,333.00
Precious and semi-precious stones 6,002.00 9,981.00 17,102.00
Japanese Exports to India
Heavy industrial products 91,815.00 186,208.00 217,380.00
Metals and metal products 40,043.00 99,690.00 120,477.00
Iron and Steel 32,356.00 85,090.00 99,952.00
Steel plates 5,552.00 27,612.00 36,438.00 Adapted from Zilur R Khan, “Japanese Relations with India, Pakistan and Bangladesh,” Pacific Affairs, Vol. 48, No. 4, Winter 1975-1976, pp 541-57. Source: White Papers on International Trade Japan, J E T K O (Japan External Trade Organization), 1972 and 1973. As the Cold War wound down, Indo-Japanese relations stepped up. The 1980s marked the beginning of a new phase in Indo-Japan relations. One factor in bringing about a new approach was the first major joint venture between India and Japan – the Maruti-Suzuki plant to manufacture cars in India. The visit of Prime Minister Yasuhiro Nakasone to India in 1984 – the first visit by a Japanese PM in 23 years – followed by the visits of Prime Minister Rajiv Gandhi to Japan in 1985, 1987 and 1988 established a high-level political dialogue. The Science and Technology Agreement signed during Rajiv Gandhi’s visit in November 1985 increased the frequency of exchanges in this area. The stagnation in the relationship was finally broken during the early 1990s when India undertook major economic reforms by liberalizing the country’s economy, and adopted an open-door policy that led to a gradual acceleration of bilateral business relationships. Bilateral trade and Japanese investment in India began to increase, as India began to be seen favourably as a long-term prospect in Japanese business planning. In 1996 direct investment from Japan aggregated to nearly ¥.45 billion and Japan was the second largest destination for India’s exports (see Appendices V and X). However, from the Japanese perspective these figures are hardly flattering. Of the total Japanese global trade, India has a minuscule share and ranks 20th among Japan’s trade partners, well below the US, China, the European Union, and East and Southeast Asian countries (see Appendices IV, V, VII and VIII). The case is similar with regard to Japanese FDI in India.

10
End of the Cold-War and Re-emerging India-Japan Economic Cooperation Immediately after the Cold War, India suffered from a balance of payments crisis in 1991, which provided an opportunity for Japan to extend cooperation.11 India’s adoption of the “Look East” policy and the economic liberalization process in 1991 gave a further impetus to the Indo-Japanese relationship. During 1997, the Government of Japan pledged about Rs.3923 crore to support 10 major projects in India, in areas like power generation and transmission, development of ports, irrigation, afforestation, sericulture, and development of small-scale industries. As India began growing rapidly from the early 1990s, its weight in Asia also began to grow (see Table 7 and Appendix II). Table 7: GDP and Global Rank in 2006 (in million US$)
Rank Country GDP Rank Country PPP GDP 2 Japan 4,340,133 2 China 10,048,026 b 4 China 2,668,071 3 India 4,247,361 c
12 India 906,268 4 Japan 4,131,195 Source: World Development Indicators Database, World Bank, 1 July 2007; Note available. PPP is purchasing power parity; an international dollar has the same purchasing power over GDP as a US dollar has in the United States. Japanese ODA In the post-Cold War era (since the 1990s), Japanese ODA to India increased substantially. Japan provided approximately ¥184.89 billion in loans to India in FY2006. The commitment was an increase of 18.9 per cent over the previous year, and was the highest ever amount of yen loans to India. Since 2003 India has been the largest recipient of Japanese ODA The cumulative amount of Japan’s loans to India adds up to approximately ¥2,817 billion. Until 2006, the cumulative amount of grant aid provided by Japan to India amounted to ¥86.69 billion and loan assistance amounted to ¥2817.166 billion. The deliberate intention to enhance the economic relationship over the last few years is highlighted by the Japanese assistance in building the Delhi-Mumbai industrial corridor among other major projects. The focus areas of Japan’s ODA to India have been as follows: development of physical infrastructure, mainly in the areas of power and transportation; poverty reduction through agricultural and rural development; environmental protection, through afforestation and improvement of water quality; and assisting improvements in health and medical care. Japan’s Country Assistance Program for India was formulated in May 2006 with the following priority areas: i) promotion of economic growth (power and transportation, etc.), ii) improvement in poverty issues (health and sanitation, local development, disaster prevention, development of tourism, etc.), iii) improvement in environmental
11 Japan was foremost in coming to India’s assistance with quick-disbursing bilateral aid as well as through
the ADB, World Bank and IMF.
11
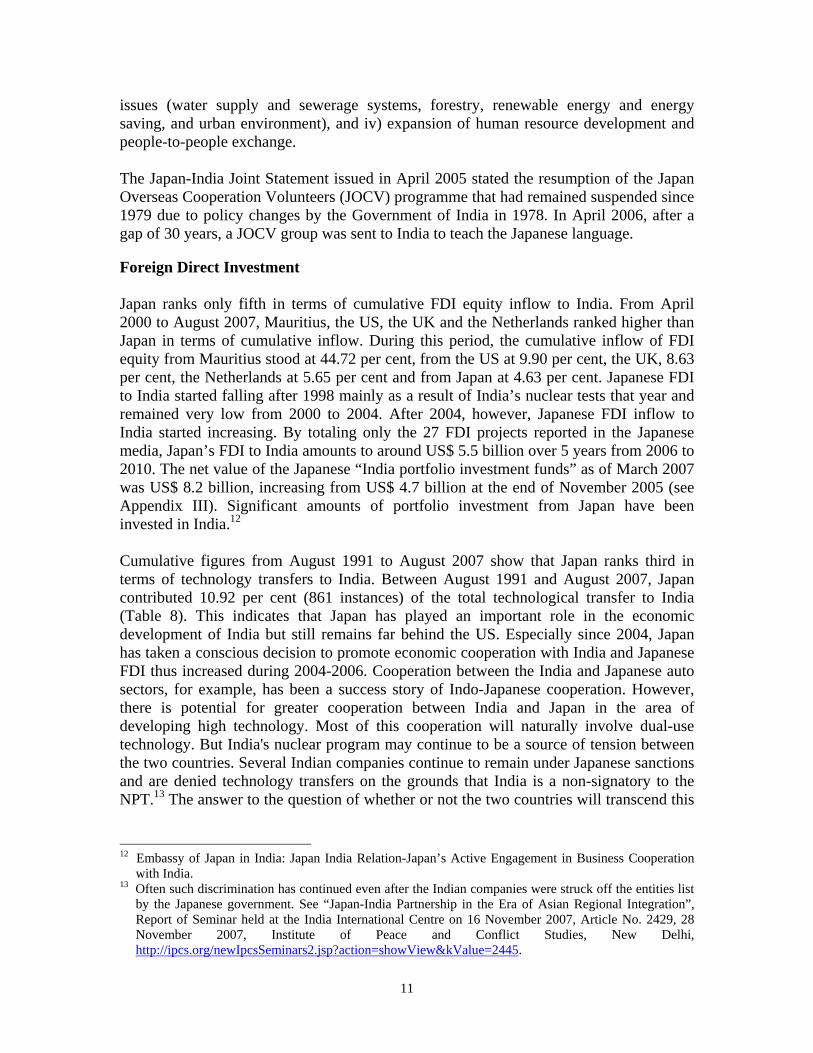
issues (water supply and sewerage systems, forestry, renewable energy and energy saving, and urban environment), and iv) expansion of human resource development and people-to-people exchange. The Japan-India Joint Statement issued in April 2005 stated the resumption of the Japan Overseas Cooperation Volunteers (JOCV) programme that had remained suspended since 1979 due to policy changes by the Government of India in 1978. In April 2006, after a gap of 30 years, a JOCV group was sent to India to teach the Japanese language. Foreign Direct Investment Japan ranks only fifth in terms of cumulative FDI equity inflow to India. From April 2000 to August 2007, Mauritius, the US, the UK and the Netherlands ranked higher than Japan in terms of cumulative inflow. During this period, the cumulative inflow of FDI equity from Mauritius stood at 44.72 per cent, from the US at 9.90 per cent, the UK, 8.63 per cent, the Netherlands at 5.65 per cent and from Japan at 4.63 per cent. Japanese FDI to India started falling after 1998 mainly as a result of India’s nuclear tests that year and remained very low from 2000 to 2004. After 2004, however, Japanese FDI inflow to India started increasing. By totaling only the 27 FDI projects reported in the Japanese media, Japan’s FDI to India amounts to around US$ 5.5 billion over 5 years from 2006 to 2010. The net value of the Japanese “India portfolio investment funds” as of March 2007 was US$ 8.2 billion, increasing from US$ 4.7 billion at the end of November 2005 (see Appendix III). Significant amounts of portfolio investment from Japan have been invested in India.12 Cumulative figures from August 1991 to August 2007 show that Japan ranks third in terms of technology transfers to India. Between August 1991 and August 2007, Japan contributed 10.92 per cent (861 instances) of the total technological transfer to India (Table 8). This indicates that Japan has played an important role in the economic development of India but still remains far behind the US. Especially since 2004, Japan has taken a conscious decision to promote economic cooperation with India and Japanese FDI thus increased during 2004-2006. Cooperation between the India and Japanese auto sectors, for example, has been a success story of Indo-Japanese cooperation. However, there is potential for greater cooperation between India and Japan in the area of developing high technology. Most of this cooperation will naturally involve dual-use technology. But India's nuclear program may continue to be a source of tension between the two countries. Several Indian companies continue to remain under Japanese sanctions and are denied technology transfers on the grounds that India is a non-signatory to the NPT.13 The answer to the question of whether or not the two countries will transcend this
12 Embassy of Japan in India: Japan India Relation-Japan’s Active Engagement in Business Cooperation
with India. 13 Often such discrimination has continued even after the Indian companies were struck off the entities list
by the Japanese government. See “Japan-India Partnership in the Era of Asian Regional Integration”, Report of Seminar held at the India International Centre on 16 November 2007, Article No. 2429, 28 November 2007, Institute of Peace and Conflict Studies, New Delhi, http://ipcs.org/newIpcsSeminars2.jsp?action=showView&kValue=2445.
12
obvious gap in views and interests lies again in the domestic Japanese context and the changing international environment, including the fate of the Indo-US nuclear agreement. Table 8: Country-Wise Technology Transfer Approvals (August 1991 to August 2007)
Rank Country No. of Technical
Collaborations approved Percentage of total
tech. approvals 1. USA 1,750 22.19 2. Germany 1,103 13.99 3. Japan 861 10.92 4. U.K. 856 10.85 5. Italy 484 6.14 6. Other Countries 2,832 35.91 Total of all countries 7,886 100.00
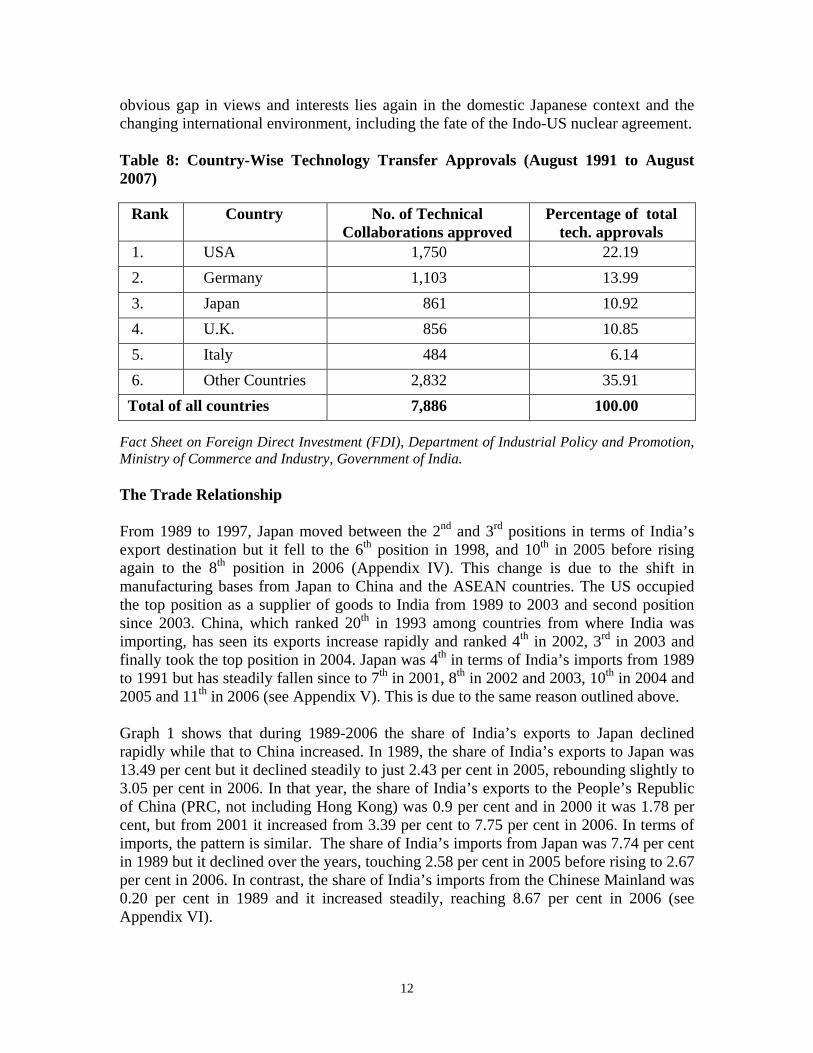
Fact Sheet on Foreign Direct Investment (FDI), Department of Industrial Policy and Promotion, Ministry of Commerce and Industry, Government of India. The Trade Relationship From 1989 to 1997, Japan moved between the 2nd and 3rd positions in terms of India’s export destination but it fell to the 6th position in 1998, and 10th in 2005 before rising again to the 8th position in 2006 (Appendix IV). This change is due to the shift in manufacturing bases from Japan to China and the ASEAN countries. The US occupied the top position as a supplier of goods to India from 1989 to 2003 and second position since 2003. China, which ranked 20th in 1993 among countries from where India was importing, has seen its exports increase rapidly and ranked 4th in 2002, 3rd in 2003 and finally took the top position in 2004. Japan was 4th in terms of India’s imports from 1989 to 1991 but has steadily fallen since to 7th in 2001, 8th in 2002 and 2003, 10th in 2004 and 2005 and 11th in 2006 (see Appendix V). This is due to the same reason outlined above. Graph 1 shows that during 1989-2006 the share of India’s exports to Japan declined rapidly while that to China increased. In 1989, the share of India’s exports to Japan was 13.49 per cent but it declined steadily to just 2.43 per cent in 2005, rebounding slightly to 3.05 per cent in 2006. In that year, the share of India’s exports to the People’s Republic of China (PRC, not including Hong Kong) was 0.9 per cent and in 2000 it was 1.78 per cent, but from 2001 it increased from 3.39 per cent to 7.75 per cent in 2006. In terms of imports, the pattern is similar. The share of India’s imports from Japan was 7.74 per cent in 1989 but it declined over the years, touching 2.58 per cent in 2005 before rising to 2.67 per cent in 2006. In contrast, the share of India’s imports from the Chinese Mainland was 0.20 per cent in 1989 and it increased steadily, reaching 8.67 per cent in 2006 (see Appendix VI).

13
Graph 1 :Share of India’s exports and imports by country (percentage)
India's Exports and Imports
0
2
4
6
8
10
12
14
16
1989
1990
1991
1992
1993
1994
1995
1996
1997
1998
1999
2000
2001
2002
2003
2004
2005
2006
Export to Japan Export to China Import from Japan Import from China
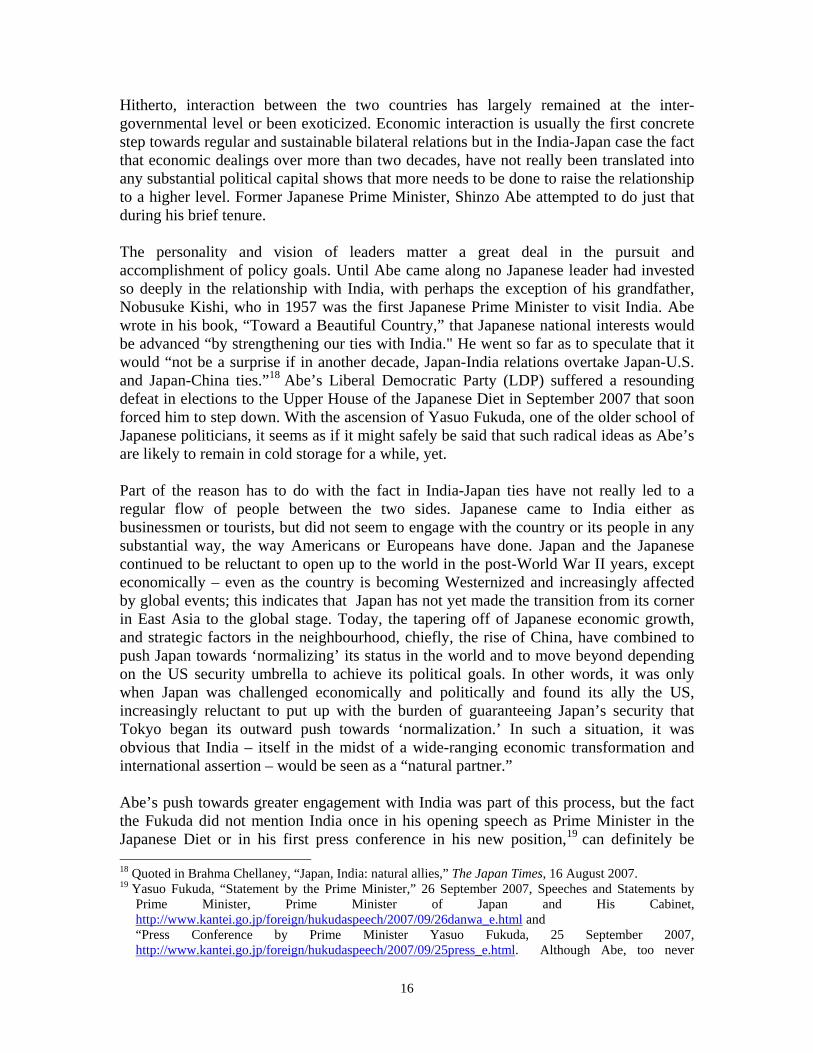
Japan’s Exports & Imports India has never been among Japan’s top 20 export destinations during the period from 1989 to 2006 (see Appendix VII). Instead, the US that was the top export destination of Japan and South Korea fluctuated between the 2nd and 3rd positions. The PRC was the 7th top export destination of Japan in 1989, 11th in 1990, 5th in 1993 and 1995, 4th from 1996 to 1997, and has been 2nd since 2001. India has also never been among the top 20 suppliers to Japan. In 1989, India ranked 23rd, 21st in 1993 and 1994, 28th in 2004, 27th in 2005, and 26th in 2006. The US was again the top exporter to Japan from 1989 to 2001, giving way to China since 2001, which had been ranked 2nd from 1991 to 2001 (see Appendix VIII). This is a clear indication that Japan, US, China are stronger trading partners than India. Graph 2 shows that the share of Japan’s exports to India was always below one per cent and, in fact, declined marginally between 1989 and 2006. On the other hand, the share of Japan’s exports to the Chinese Mainland was 3.09 per cent in 1989, but increased steadily and reached 9.59 per cent in 2002, 12.18 per cent in 2003, 13.06 per cent in 2004, 13.45 per cent in 2005 and 14.35 per cent in 2006. The share of Japan’s imports from India was 0.94 per cent in 1989, but it steadily decreased to 0.71 per cent in 2006. In contrast, the share of Japan’s imports from China was 5.29 per cent in 1989 and it increased steadily to 20.47 per cent (see Appendix IX). Taken together, Graphs 1 and 2 indicate that Indo-Japanese trade relations appear to be weakening, while Indo-China trade relations are strengthening.

14
Graph 2: Share of Japan’s exports and imports by country (percentage)
Japan's Exports and Imports
0
5
10
15
20
25
1989
1990
1991
1992
1993
1994
1995
1996
1997
1998
1999
2000
2001
2002
2003
2004
2005
2006
Export to India Export to China Import from India Import from China
Table 9 shows the major goods traded between India and Japan. There does not appear to have been much change in the composition of trade between India and Japan from 1970 to 2006. In 2006 the major items exported from India include mineral fuels, mineral oil, gems and jewelry, ores, slag and ash, while the major imports include machinery, electrical machinery, and iron and steel. Indo-Japanese business cooperation rapidly fell after India’s nuclear test in 1998 but has picked up since. Table 9: Composition of India’s Trade with Japan in 2006
Major Exports Percentage Share Major Imports Percentage Share
Mineral fuels and Oils 16.98 Machinery 31.97
Gems and Jewelry 15.32 Electrical Machinery 12.83
Ores, Slag and Ash 12.35 Iron and Steel 8.81 In order to strengthen trade cooperation with Japan, India needs to do more. Both governments have made serious efforts to improve economic cooperation and given the changes in the trade structures, population dynamics and economic development in both countries, there are enormous opportunities for cooperation. India and Japan are natural economic partners and are beginning to renew their strong economic relationship of the pre-WWII years. This time there are a larger number of joint ventures and a greater likelihood that the politics of the relationship will not adversely affect economic aspects. In fact, the increasing political comfort levels will lead to greater economic integration between the two countries. Examples include the strong Japanese support for the Indian

15
candidature in the East Asian Summit and for an increased ASEAN+6 economic grouping. The Rise of Indo-Japan Ties Post-1998 Politically and strategically speaking, Japan, like China, only sat up and took serious note of India when the latter decided to reassert its nuclear capabilities in 1998. However, that alone would not have held their attention had not India’s economic growth started producing results and were it not for the fact that the Americans started courting New Delhi as well. While Yoshiro Mori and Atal Behari Vajpayee, set the ball rolling for Indo-Japanese relations in 2000 with the call for “global partnership,” 14 Junichiro Koizumi and Manmohan Singh followed up with the “eight-fold initiative” in 2005.15 During the latter’s visit to Tokyo during the tenure of Shinzo Abe, the two Prime Ministers decided to make the partnership “strategic” as well.16 This latter dimension saw expression in the Quadrilateral Initiative (QI) involving the US, Japan, Australia and India and the Malabar Exercises involving the navies of these countries in addition to that of Singapore, that took place in the Bay of Bengal in September 2007. Earlier, in April the same year, the US, Japan and India had conducted joint naval exercises in the South China Sea. Degrees of Separation It may perhaps be said without much exaggeration that India-Japan ties have not quite followed an obvious or a natural course of growth as would have been expected between two large, democratic nations both situated in Asia and sharing several common strategic interests. It is only in the post-Cold War period and particularly after the Indian nuclear tests of 1998 that the two countries have begun to look at each other seriously in political and strategic terms or begun an engagement along these lines. In addition to the changed global strategic and security environment, there are several factors that have and will have an impact on the relations between the two countries. These factors, ranging from their common democratic traditions to cultural factors, will be examined here. Brahma Chellaney makes the point that democratic traditions make that India and Japan are natural allies.17 But is this really the case? Like the oft-repeated statement that “democracies do not go to war,” there certainly is some truth to Chellaney’s point. However, India and Japan are both young democracies and geographical distance has added to the various degrees of separation that exist between the two countries in historical, cultural, and linguistic spheres. India and Japan are no more natural allies than are India and China, if they do not learn to interact more at the people-to-people level. 14 See “Japan-India Summit Meeting (Summary),” 23 August 2000, Ministry of Foreign Affairs,
Government of Japan, http://www.mofa.go.jp/region/asia-paci/pmv0008/india_s.html. 15 See “Joint Statement, India-Japan Partnership in a New Asian Era: Strategic Orientation of India-Japan
Global Partnership,” 29 April 2005, Ministry of External Affairs, Government of India, http://meaindia.nic.in/.
16 See “Joint Statement Towards India-Japan Strategic and Global Partnership,” 15 December 2006, Ministry of External Affairs, Government of India, http://meaindia.nic.in/.
17 Brahma Chellaney, “Japan, India: natural allies,” The Japan Times, 16 August 2007.
16
Hitherto, interaction between the two countries has largely remained at the inter-governmental level or been exoticized. Economic interaction is usually the first concrete step towards regular and sustainable bilateral relations but in the India-Japan case the fact that economic dealings over more than two decades, have not really been translated into any substantial political capital shows that more needs to be done to raise the relationship to a higher level. Former Japanese Prime Minister, Shinzo Abe attempted to do just that during his brief tenure. The personality and vision of leaders matter a great deal in the pursuit and accomplishment of policy goals. Until Abe came along no Japanese leader had invested so deeply in the relationship with India, with perhaps the exception of his grandfather, Nobusuke Kishi, who in 1957 was the first Japanese Prime Minister to visit India. Abe wrote in his book, “Toward a Beautiful Country,” that Japanese national interests would be advanced “by strengthening our ties with India." He went so far as to speculate that it would “not be a surprise if in another decade, Japan-India relations overtake Japan-U.S. and Japan-China ties.”18 Abe’s Liberal Democratic Party (LDP) suffered a resounding defeat in elections to the Upper House of the Japanese Diet in September 2007 that soon forced him to step down. With the ascension of Yasuo Fukuda, one of the older school of Japanese politicians, it seems as if it might safely be said that such radical ideas as Abe’s are likely to remain in cold storage for a while, yet. Part of the reason has to do with the fact in India-Japan ties have not really led to a regular flow of people between the two sides. Japanese came to India either as businessmen or tourists, but did not seem to engage with the country or its people in any substantial way, the way Americans or Europeans have done. Japan and the Japanese continued to be reluctant to open up to the world in the post-World War II years, except economically – even as the country is becoming Westernized and increasingly affected by global events; this indicates that Japan has not yet made the transition from its corner in East Asia to the global stage. Today, the tapering off of Japanese economic growth, and strategic factors in the neighbourhood, chiefly, the rise of China, have combined to push Japan towards ‘normalizing’ its status in the world and to move beyond depending on the US security umbrella to achieve its political goals. In other words, it was only when Japan was challenged economically and politically and found its ally the US, increasingly reluctant to put up with the burden of guaranteeing Japan’s security that Tokyo began its outward push towards ‘normalization.’ In such a situation, it was obvious that India – itself in the midst of a wide-ranging economic transformation and international assertion – would be seen as a “natural partner.” Abe’s push towards greater engagement with India was part of this process, but the fact the Fukuda did not mention India once in his opening speech as Prime Minister in the Japanese Diet or in his first press conference in his new position,19 can definitely be 18 Quoted in Brahma Chellaney, “Japan, India: natural allies,” The Japan Times, 16 August 2007. 19 Yasuo Fukuda, “Statement by the Prime Minister,” 26 September 2007, Speeches and Statements by
Prime Minister, Prime Minister of Japan and His Cabinet, http://www.kantei.go.jp/foreign/hukudaspeech/2007/09/26danwa_e.html and “Press Conference by Prime Minister Yasuo Fukuda, 25 September 2007, http://www.kantei.go.jp/foreign/hukudaspeech/2007/09/25press_e.html. Although Abe, too never

17
considered a setback and an indication of where India truly stands once exceptional factors, such as Abe are removed from the scene. Another example of where things seem to be cooling off is the QI. Political leadership and personalities can push through ideas and create breakthroughs where matters had until now floundered for lack of interest or vision, but that is still no substitute for durable processes and clear and sustainable goals to help carry forward activities thus initiated. And in the case of the QI, it was obvious from the beginning that it was largely pushed out of the personal interest of a few leaders involved – chiefly, US President George W Bush, Abe and then Australian Prime Minister, John Howard – and did not take adequate steps to deny or ameliorate the anti-China overtones that immediately came into view. As a result, as soon as Abe and Howard exited in 2007, their successors were quick to reiterate that their respective countries viewed the relationship with China as extremely important and were not going to be drawn into anything that hinted otherwise. Fukuda might have made his first official visit as Prime Minister to the US (unlike Abe who made his first visits to China and South Korea) but ended 2007 with a very successful visit to China. Meanwhile, Kevin Rudd, the new Australian Prime Minister, is an ex-diplomat and a fluent Mandarin speaker. The “Arc of Freedom and Prosperity” 20 – Joint Action in Afghanistan and Myanmar In contrast with India’s outlook and role in the Cold War era, Japan remained inward-looking and its international profile remained somewhat subdued. Even where Asia and Asian problems were concerned, Japan moved cautiously and its vision remained restricted to its immediate neighbourhood. In the United Nations, it sympathized with the Afro-Asian group but never fully identified itself with the group’s aspirations and policies. Politically, India can help Japan expand its “diplomatic horizons.” Japan’s “value oriented diplomacy”21 is intended to counter the unease in the rest of East Asia over
mentioned India in his first speech to the Diet his statement that he would “shift to proactive diplomacy that will actively contribute to stalwart solidarity in Asia,” indicates that that India was part of his scheme of things. See “Statement by Prime Minister Shinzo Abe,” 26 September 2006, Speeches and Statements by Prime Minister, Prime Minister of Japan and His Cabinet, http://www.kantei.go.jp/foreign/abespeech/index_e.html. Similarly, in his statement to the cabinet on the “basic policies” to be followed, he declared, “We will provide ODA strategically and make efforts to ensure the stable provision of energy resources.” This was clearly a continuation of the policy of the Koizumi period in which India replaced China as the largest recipient of Japanese ODA. See Shinzo Abe, “Basic Policies,” 26 September 2006, Speeches and Statements by Prime Minister, Prime Minister of Japan and His Cabinet, http://www.kantei.go.jp/foreign/abespeech/2006/09/26houshin_e.html. However, in his first press conference, Abe specifically mentioned India as one of the countries that he wanted Japan to “strengthen” relations with. See “Press Conference by Prime Minister Shinzo Abe,” 26 September 2006, Speeches and Statements by Prime Minister, Prime Minister of Japan and His Cabinet, http://www.kantei.go.jp/foreign/abespeech/2006/09/26press_e.html.
20 This is an expression used by the Japanese Foreign Minister, Taro Aso. See Taro Aso, “Arc of Freedom and Prosperity: Japan’s Expanding Diplomatic Horizons,” Speech at the Japan Institute of International Affairs Seminar, 30 November 2006, Ministry of Foreign Affairs, Government of Japan, http://www.mofa.go.jp/announce/fm/aso/speech0611.html.

18
Japan’s normalization, and parallels in some respects, the way in which the Chinese came up with their theory of “peaceful rise,” later modified to “peaceful development,” to counter the ‘China threat’ theory. India has for long espoused its democratic values in motley groups such as the NAM and the Commonwealth to little effect. Today, it is in a position to work in concert with Japan and the US to ensure that those values hold as much meaning outside its borders as they do within them. India and Japan as part of their declared aim of expanding the “arc of freedom and prosperity” can together play important roles in both Afghanistan and Myanmar, for example. India has huge strategic stakes in both countries and is involved in a balancing game against Pakistan and China respectively. Japan has committed considerable sums for reconstruction in Afghanistan as part of the US campaign against terror. In Myanmar, however, it has followed a policy more independent of the US and has not imposed sanctions against the junta preferring instead a policy of constructive engagement, including providing ODA. As in the case of India, there is here, no doubt, an element of countering China. Both India and Japan can extend their respective engagements in Afghanistan and Myanmar further by putting in place a joint policy in place rather than continuing to operate on their own. However, nether country must look at the other merely as an accomplice in military or political terms to help it maneuver better against its perceived adversaries. Apart from being an unsustainable strategy, this does not win either country any friends in Afghanistan or Myanmar. An India-Japan partnership in these countries faces two potential risks – one arises from the association with the US and another arises from a perceived disassociation from China. India and Japan cannot afford to be perceived as doing the US’s job by proxy. Indian and Japanese reconstruction efforts in Afghanistan must be aimed primarily at winning the hearts and minds of the people before any other strategy can fall into place. The efforts must be similar in Myanmar, where there is the additional challenge of not being seen as ganging up against China. It is, however, no use denying the legitimate security and ideological concerns that Pakistan poses for India in Afghanistan and that China poses for both India and Japan in Myanmar. Neither India nor Japan need be reticent about expressing faith in their democratic systems or timid about seeking to expand democratic freedoms to Afghanistan or Myanmar, even if this might be perceived as anti-Pakistan or anti-China. Where they can do it differently is to do it with greater subtlety and patience than the US has. Sanctions are not the way forward in Myanmar and a refusal to talk to all sections of Afghan society including the Taliban will not bring peace to Afghanistan. India has the political experience and Japan the economic muscle, that can be combined to advance an alternative framework for the resolution of conflicts and tensions in these countries. In the process, they give the countries involved additional choices and opportunities.
21 See Taro Aso, “Arc of Freedom and Prosperity: Japan’s Expanding Diplomatic Horizons,” Speech at the
Japan Institute of International Affairs Seminar, 30 November 2006, Ministry of Foreign Affairs, Government of Japan, http://www.mofa.go.jp/announce/fm/aso/speech0611.html.
19
Ultimately, the idea of the “arc” provides an alternative vision for areas as different as Southeast Asia, Central Asia and now, increasingly Africa, where Chinese influence has been on the ascendant and is likely to clash with a renewed American interest in the continent. The Security Relationship In recent years, Japan has been attempting to ‘normalize’ itself by playing a more active role in international affairs, including military deployment overseas, even if it is in non-combat roles. This process has caused concern not only domestically but also among Japan’s immediate neighbours that bore the brunt of Japanese expansionism and colonialism and which was brought to an end only by its defeat in WWII. That said, ‘normalization’ is likely to move forward incrementally at least, if not rapidly, owing to a number of factors. First, there are voices in the US calling for Japan to take up a greater share of the responsibilities under their bilateral security treaty, especially when the former is engaged in two separate theatres in Afghanistan and Iraq. 22 Second, the rise of China, the concomitant rise in Chinese military spending and the lack of transparency on military issues have stoked Japanese fears about their own level of preparedness and ability to cope with the challenge. Third, Japan has been aware for some time – at least since the first Gulf War in 1991 – that economic might alone is insufficient to gain it respect in the world community. Fourth, the combination of the slowdown of the Japanese economy and the shifting of the world economic growth momentum to other countries in Asia which in turn led to fall of the Japanese “salaryman,” has led Japanese Prime Ministers like Koizumi and Abe to emphasize robust military capability and the willingness to deploy that capability as a means of rejuvenating both the Japanese economy and the Japanese psyche. In this sense, there is a very obvious move to revive and make more visible a sense of Japanese nationalism. All these factors have meant that Article 9 of the so-called Peace Constitution of Japan has come under pressure. While the standard interpretation is that the Article disallows any kind of military buildup by Japan, this has been challenged almost from its inception with the creation of the Japanese Self-Defense Forces (SDF) in 1952, and the use of Japanese bases by US forces during the Korean War and the Vietnam War. While debate over Article 9 has simmered in post WWII Japan, this was largely restricted to the political and policymaking elites. However, in recent years, and particularly during and after Koizumi’s tenure, the debate has intensified and increasingly become part of mainstream discourse. In fact, Japan has since the end of the Cold War, increasingly begun to push the limits by first deploying Japanese troops in peacekeeping operations under the UN mandate beginning with Cambodia in 1992 to now deploying them in non-
22 This reluctance is not new. Former US President, Richard Nixon, argued that when the US assumed
responsibility for the defence of Japan, the US economy comprised some 50 per cent of the world’s total economy, but this fell to below 30 per cent in the 1970s and 1980s. This was a prod to Japanese militarization.

20
combat roles in a war zone like Iraq and providing logistics support such as refueling for US-led coalition ships in the Indian Ocean. In this context, it is becoming increasingly likely that constitutional amendment or not, Japanese forces will begin to play a more active role both in East Asia and in the extended neighbourhood. Given that Japan too is heavily dependent on energy supplies from the Middle East, and that the safety of sea lanes of communication (SLOCs) are a vital security interest, it may perhaps be expected that Japan will find additional grounds for engaging India. Indeed, maritime cooperation is one of the most promising areas for Indo-Japan defence cooperation. It is important however, to stress that India and Japan should as mature nations, find their own reasons for – to use another term that is much in vogue in India’s neighbourhood – an “all-weather” partnership, instead of relying on the US to egg them on or on China to scare them into one. India will also need to keep track of the changes in Japanese policy, including the domestic debate over Article 9, to enable a more sustainable and long-term policy of defence cooperation with Japan. While Japan is still most closely tied in to the US for its security needs, the QI offered a hint of the promise of expanded security ties between India and Japan as well. While the Initiative has been put on the backburner, it is still a project that holds promise. Japan, Australia and the US held their first ministerial-level trilateral strategic talks in late 2005 and when India became a part of this framework with the QI, it was naturally, a cause of some considerable inquiry in the immediate neighbourhood, particularly from China. The project was ill-conceived in that it ended up rankling the Chinese.23 However, while the rankling needs to be taken care of, the intent to rattle the Chinese is a natural expectation that will continue to exist as long as China, on the one side, and the countries comprising the QI continue to hold divergent views on crucial issues of respective national and international import. The Chinese are concerned for they have very real fears about the US and Japan – China’s two most important neighbours. However, India has clear objectives from its joint military exercises with members of the QI and it is important that as a rising power, it should convey these to China – its most important neighbour – without being either vague or diffident in its statements. China is also India’s most serious potential adversary and this is a fact that cannot be wished away. Naturally both countries must continue efforts to improve relations but such improvement can only be realized and sustained if both sides understand each other’s core security concerns.
23 China, in fact, issued demarches to the four countries just days before their first-ever official-level
security consultation on May 25 on the sidelines of an Association of Southeast Asian Nations (ASEAN) Regional Forum meeting in Manila. Siddharth Varadarajan, “Chinese demarches to 4 nations,” The Hindu, 14 June 2007, http://www.hindu.com/2007/06/14/stories/2007061404451200.htm. See also Yan Wei, “A Broader Asia Without China?” Beijing Review, No. 38, 20 September 2007, http://www.bjreview.com.cn/quotes/txt/2007-09/25/content_77617.htm.

21
The Way Ahead Singh and Abe identified the right starting point for the expanded partnership, namely economics. While it is easy to think that globalization will increasingly drive economic relations between nations, India’s trade with China and Japan, still requires a great deal of intervention and encouragement by the respective governments to increase bilateral trade. In the case of Sino-Indian relations, politics currently places a limit on the expansion of economic relations, but there are no such constraints in the case of Indo-Japanese relations; if anything political input can only help boost the economics. An EPA/CEPA between the two countries, as the Report of the Joint Study Group states “rests on complementarity of the partner economies”24 and is more feasible than a FTA between China and India at the present stage. Further, this economic partnership could serve as “a building block for an even larger regional economic integration.”25 This must be pursued as a strategic goal. India might have brought Japan into the SAARC as a counterweight to China, but it is nevertheless, a powerful choice. Japan already occupies an important place in many South Asian economies and its potential contribution in enhancing India’s own role in South Asia cannot be underestimated. India should, however, not forget that even Abe, Indophile that he was, made his first official visits abroad to China and South Korea, the first Japanese Prime Minister to do so. This was a message not only to the US but also to the rest of the world. India should be informed that as much as Abe was and others after him might be interested in expanding ties with India, Japan’s primary interests lie in its immediate neighbourhood. India should guard against going overboard with hype and hopes on the relationship with Japan. Perhaps, India’s lack of adequate knowledge and expertise about the country should put the brakes on unrealistic expectations.26 For starters, India, which has an enormous pool of English speakers, has far fewer Japanese speakers than China. Also, almost before the hype of Manmohan Singh’s 2006 visit had died down, The Japan Times editorialized that while Japan and India were “natural partners”, “[t]he relationship will not be friction free.”27 This is a remarkably forthright statement for the Japanese to make and must guide Indian expectations as well. India can respond only by shedding its timidity and taking on a more proactive role in East Asia. Greater defense cooperation, intelligence-sharing and joint initiatives on maritime security, counterterrorism, disaster prevention and management, and energy
24 “Report of the India-Japan Joint Study Group, June 2006,” Ministry of Foreign Affairs, Government of
Japan, http://www.mofa.go.jp/region/asia-paci/india/report0606.pdf. 25 “Report of the India-Japan Joint Study Group, June 2006,” Ministry of Foreign Affairs, Government of
Japan, http://www.mofa.go.jp/region/asia-paci/india/report0606.pdf. 26 During his visit to Japan, however, Indian Prime Minister Manmohan Singh showed that he was aware
of the problem when he stated, “We have decided to work together for a quantum leap in educational and cultural ties and people-to-people contacts. Mere incremental increases are not what we seek.” “Remarks by Prime Minister at Joint Press Interaction with Prime Minister Shinzo Abe of Japan,” 15 December 2006, Ministry of External Affairs, Government of India, http://meaindia.nic.in/.
27 “Editorial: A natural partnership in Asia,” The Japan Times, 20 December 2006, http://search.japantimes.co.jp/cgi-bin/ed20061220a1.html.

22
security will all come but a long-term relationship cannot be sustained if India and Japan do not first understand each other, make sure that they are talking the same language and share the same vision. The two countries’ lack of adequate knowledge and expertise on each other will limit growth in the relationship in the short term and it will take a great deal of effort to prevent this from turning into a long-term disadvantage. In this respect, inter-governmental cooperation alone is insufficient. Greater dialogue and interaction between the citizens of the two nations are essential for generating the trust and comfort levels required for a truly global and strategic partnership, generating “stalwart solidarity,” as Abe put it.28 India and Japan will continue to grow in importance to each other and their economic relationship will also grow if anything faster than their political relationship but if India is to remain of “crucial importance” to Japan and vice-versa, both countries must not just leverage the advantages of their economic relationship and shared geopolitical interests but also take seriously the shared values that have been declared as forming such an important component of their ties. That is the way towards shared and permanent interests for both countries.
28 “Statement by Prime Minister Shinzo Abe,” 26 September 2006, Speeches and Statements by Prime
Minister, Prime Minister of Japan and His Cabinet, http://www.kantei.go.jp/foreign/abespeech/index_e.html.

23
Appendix I: Indian Merchants in Osaka-Kobe connected with the Match Trade
Name of Company/ Merchant
Main Office
Year of foundation of co./ estab. in Japan
Areas of dealing Exports from Japan Imports to Japan
R.D. Tata & Co., Ltd.
Bombay -/1891 (b) cotton yarn, cotton crepe, silk piece goods, matting, wood products, matches
(b) raw cotton
E. Pabhany Bombay -/- (a) knitwear, towels, *zakka (b) camphor, matches (a) raw cotton, rubber (b) ivory, raw cotton, arabic gum
A.M. Essabhoy/ E. Faizullabhoy
Bombay -/- India, “colonial territories”
(a) matches, knitwear, towels, *zakka (b) willow hampers, bags, matches, brushes, umbrellas, purses, matting, brassware, (d) matches, camphor, cotton cloth, *zakka
(a) raw cotton, chemicals, fertilizer, sheep skins, *zakka (b) tapioca, coffee, pepper seeds, rape seed, etc (d) raw cotton, chemicals
M. Musabhoy -/1919 Nanyo, India, South China, “various sea”
(a) knitwear, towels, *zakka (b) soap, toys, fans, perfume, umbrellas, purses, glassware (c) matches, knitwear, glassware, buttons, *zakka (d) *zakka
(b) shellac gum
C.Abdoola -/- (a) *zakka (b) wood sticks, wood furniture, lacquerware, soap, paper, lanterns, matches, toys
arabic gum
M.N. Metha Calcutta 1879/ 1915-16 India, "various areas"
(c)glassware, matches, celluloid-ware, *zakka (d) chemicals, glass bangles, celluloid bangles, matches, materials for matches
F.N. Abudolally -/1919 India, China, Africa, Europe
(c) cotton yarn, cotton cloth, silk yarn, silk goods, dyeing materials, fertilizers, leather, cereals (imports)
N.Futehally & Sons
Bombay 1883/1900 India (Bombay) (b) cotton yarn, cotton cloth, silk yarn, silk goods, dyeing materials, fertilizer, leather, cereals, (c) matches, *zakka (d) *zakka, cotton yarn, materials for matches
(b) glue, shellac gum, olive oil, scrap hide, raw cotton etc (c) (d) raw cotton
M.H. Hirjee Bombay -/1916 Bombay, Calcutta, Rangoon, Durban, “various areas”
cotton cloth, cotton yarn, matches, hardware, enamel-ware, ceramics, glassware, *zakka (d) *zakka, cotton goods
(a) raw cotton
Peer Muhammad Bombay -/1922 India, Africa, London
(c) cotton goods, knitwear, glassware, *zakka
Adapted from Takashi Oishi (2004) International Journal of Asian Studies, 1,1 Abbreviation: * zakka” in Japanese means miscellaneous goods. Sources: (a) data in 1910, Nikka Shinposha 1910. (b) data in 1911, Kobe Chamber of Commerce 1911 (c) data in 1923, Kobe Shiyakusho 1925 (d) data in 1926, Kobe Shiyakusho 1927. Some other cited in the references. Personal interviews.

24
Appendix II: GDP and Global Ranks in 2006 (in million US $)
Rank
Country GDP Rank County PPP GDP
1 United States 13,201,819 1 United States 13,201,819 2 Japan 4,340,133 2 China 10,048,026 b 3 Germany 2,906,681 3 India 4,247,361 c 4 China 2,668,071 4 Japan 4,131,195 5 United Kingdom 2,345,015 5 Germany 2,616,044 6 France 2,230,721a 6 United Kingdom 2,111,581 7 Italy 1,844,749 7 France 2,039,171 8 Canada 1,251,463 8 Italy 1,795,437 9 Spain 1,223,988 9 Brazil 1,708,434
10 Brazil 1,067,962 10 Russian Federation 1,704,756 11 Russian Federation 986,940 11 Spain 1,243,440 12 India 906,268 12 Mexico 1,152,356 13 Korea, Rep. 888,024 13 Korea, Rep. 1,140,445 14 Mexico 839,182 14 Canada 921,241 15 Australia 768,178 15 Indonesia 728,340 16 Netherlands 657,590 16 Australia 661,736 17 Turkey 402,710 17 Turkey 617,910 18 Belgium 392,001 18 Argentina 603,937 19 Sweden 384,927 19 Thailand 592,958 20 Switzerland 379,758 20 Netherlands 592,958
Source: World Development Indicators database, World Bank, 1 July 2007; Note available. PPP is purchasing power parity; an international dollar has the same purchasing power over GDP as a U.S. dollar has in the United States.; a. Data include the French overseas departments of French Guiana, Guadeloupe, Martinique, and Réunion. b. Excludes Kosovo.; b. Estimate is based on a 1986 bilateral comparison of China and the United States (Rouen and Kai 1995) employing a different methodology than that used for other countries. This interim methodology will be revised in the next few years; c. Estimate is based on regression; other PPP figures are extrapolated from the latest International Comparison Program benchmark estimates.

25
Appendix III: Share Of Top Investing Countries FDI Equity Inflows (Financial year-wise)
Amount: Rupees in crore (US$ in million)
Rank Country 2004-05 (April-March)
2005-06 (April-March)
2006-07 (April-March)
2007-08 (April-August 2007)
Cumulative Inflows (April 2000-August
2007)
%age with total Inflows (in
rupees)
1 Mauritius 5,141 (1,129)
11,441 (2,570)
28,759 (6,363)
11,866 (2,897)
77,756 (17,436)
44.72
2 U.S.A. 3,055 (669)
2,210 (502)
3,861 (856)
1,630 (396)
17,210 (3,840)
9.90
3 U.K. 458 (101)
1,164 (266)
8,389 (1,878)
624 (122)
14,999 (3,340)
8.63
4 Netherlands 1,217 (267)
340 (76)
2,905 (644)
689 (167)
9,831 (2,177)
5.65
5 Japan 575 (126)
925 (208)
382 (85)
2,050 (491)
8,050 (1,802)
4.63
6 Singapore 822 (184)
1,218 (275)
2,662 (578)
1,687 (413)
7,492 (1,697)
4.31
7 Germany 663 (145)
1,345 (303)
540 (120)
1,083 (265)
5,747 (1,295)
3.30
8 France 537 (117)
82 (18)
528 (117)
178 (43)
2,979 (659)
1.71
9 Switzerland 353 (77)
426 (96)
257 (56)
807 (197)
2,738 (620)
1.57
10 UAE 178 (39)
219 (49)
1,174 (260)
369 (89)
2,203 (495)
1.27
TOTAL FDI INFLOWS *
17,138 (3,754)
24,613 (5,546)
70,630 (15,726)
26,470 (6,445)
197,907 (44,373)
-
(i) *Includes inflows under NRI Schemes of RBI, stock swapped and advances pending for issue of shares. (ii) Cumulative country-wise FDI inflows (from April 2000 to August 2007) – Annex-‘A’.

26
Appendix IV: India's Top 20 Export Destinations (Rank)
Year
Country
1989 1990 1991 1992 1993 1994 1995 1996 1997 1998 1999 2000 2001 2002 2003 2004 2005 2006 Australia 15 17 18 19 19 17 - 19 - - - - - - - - Bangladesh 17 13 14 15 15 13 10 11 12 9 13 12 10 11 11 11 15 16 Belgium-Luxembourg 8 6 7 6 6 7 7 7 7 7 7 7 8 8 8 8 8 9 Canada 16 19 - - - 20 - - - 17 15 17 16 - - - - 18 China, P.R.: Mainland 19 - - - 17 - - 15 14 16 17 15 7 7 5 3 3 3 China, P.R.: Hong Kong
5 7 8 5 5 5 5 5 5 3 2 2 3 3 3 4 6 6
Egypt - - - 12 13 - - - - - - - - - - - - - France 7 10 10 9 11 11 13 13 13 10 9 9 11 12 12 12 12 15 Germany 3 4 4 3 3 3 4 4 4 4 5 5 4 5 6 7 7 7 Indonesia - - - - - 19 14 14 19 - - - - 18 16 16 19 19 Iran, I.R. of - - - - - - - - - - - - - - 19 18 20 - Israel - - - - - - - - - - 19 - - - - 20 - - Italy 6 8 9 7 9 8 9 9 8 8 8 8 9 9 10 9 9 10 Japan 2 3 2 2 2 2 2 2 3 6 6 6 5 6 9 10 10 8 Korea 11 18 15 - - 18 17 17 18 - 20 - 13 - - - 16 11 Kuwait 14 - - - - - - - - - - - - - - - - - Malaysia 20 - 19 - 20 - 20 19 16 - - 19 17 17 18 19 - - Nepal 13 - - - - - - - - - - - 20 - - - - - Netherlands 12 12 12 14 14 12 12 10 11 11 11 11 14 13 13 13 11 13 Russia - - - 11 10 10 8 12 9 12 10 10 - 19 - - - - Saudi Arabia 9 14 13 13 12 14 16 16 15 13 12 14 15 14 15 15 14 14 Singapore 10 11 11 8 7 9 11 8 10 14 14 13 12 10 7 6 4 5 South Africa - - - - - - - - - 20 - - - - - - 18 20 Spain - - 17 17 - - 19 - 20 15 16 16 18 16 17 17 17 17 Sri Lanka - - - - 18 16 18 18 17 18 18 18 - 15 14 14 13 12 Switzerland 18 15 16 - - - - - - - - - - - - - - - Thailand - 16 - 18 16 15 15 20 - - - 20 19 20 20 - - - U.S.S.R. - 1 3 16 - - - - - - - - - - - - - - United Arab Emirates - 9 6 10 8 6 6 6 6 5 3 3 6 2 2 2 2 2 United Kingdom 4 5 5 4 4 4 3 3 2 2 4 4 2 4 4 5 5 4 United States 1 2 1 1 1 1 1 1 1 1 1 1 1 1 1 1 1 1

27
Appendix V: India's Top 20 Import Destination (Rank)
Year
Country
1989 1990 1991 1992 1993 1994 1995 1996 1997 1998 1999 2000 2001 2002 2003 2004 2005 2006 Australia 13 9 10 8 9 9 10 10 10 11 16 13 11 12 9 8 6 5 Bahrain 20 14 12 14 14 20 Belgium-Luxembourg 3 2 3 3 2 8 8 7 4 3 2 2 3 2 2 4 5 6 Brazil 18 20 20 16 Canada 17 19 17 17 20 19 Chile 20 China,P.R.: Mainland 20 13 13 19 14 16 15 8 8 4 3 1 1 1 China,P.R.:Hong Kong 20 16 12 16 15 15 15 14 Egypt 13 16 France 12 10 9 11 11 17 18 18 17 19 19 16 14 16 16 17 13 Germany 5 3 2 2 4 2 2 2 2 6 10 6 6 6 6 6 4 3 Indonesia 18 18 18 15 15 13 11 12 12 12 Israel 19 20 Iran, I.R. of 19 14 8 15 19 18 20 17 19 17 Iraq 17 Italy 10 12 12 16 13 14 11 11 16 17 19 18 17 17 17 17 18 16 Japan 4 4 4 5 6 3 3 5 8 5 6 5 7 8 8 10 10 11 Korea 16 18 15 18 18 11 17 16 15 13 14 14 10 9 7 9 8 8 Kuwait 9 15 19 7 7 6 4 4 6 9 12 20 20 Malaysia 15 13 13 14 20 16 13 13 10 9 9 9 11 13 13 14 7 Morocco 14 Netherlands 14 16 18 19 17 Nigeria 12 8 19 19 9 11 14 7 17 5 Russia 12 20 20 18 18 18 18 16 15 Saudi Arabia 7 6 6 4 3 4 5 3 3 7 3 11 13 20 19 19 18 Singapore 11 11 16 10 12 10 9 12 12 12 13 7 2 10 12 11 11 4 South Africa 15 11 10 7 10 14 13 Switzerland 20 15 15 15 15 7 2 5 4 5 5 3 3 19 Thailand 20 17 U.S.S.R. 6 7 11 United Arab Emirates 8 8 7 9 10 7 7 8 9 8 8 12 14 15 14 5 7 9 United Kingdom 2 5 5 6 5 5 6 6 5 4 4 3 4 3 4 7 9 10 United States 1 1 1 1 1 1 1 1 1 1 1 1 1 1 1 2 2 2 Yemen, Republic of 19

28
Appendix VI: India’s External Trade
India's Export to India's import from
Percentage share to total
Percentage share to total
Year
World (Million
USD) Japan China,
P.R.: Mainland
China, P.R.: Hong Kong
China,P.R.:
Macao
World
(Million USD)
Japan China, P.R.:
Mainland
China, P.R.: Hong Kong
China, P.R.:
Macao
1989 15,839.00 13.49 0.90 5.22 0.00 19,297.50 7.74 0.20 0.68 0.02 1990 17,813.00 9.30 0.10 3.06 0.00 23,991.40 7.51 0.13 0.66 - 1991 17,873.50 9.25 0.27 3.44 0.00 19,509.40 6.99 0.11 0.55 - 1992 19,232.60 7.92 0.49 3.75 0.00 23,196.60 6.48 0.40 0.73 - 1993 20,989.80 7.89 1.36 5.46 0.00 21,268.80 6.47 1.22 0.89 0.00 1994 24,196.20 7.95 0.89 5.58 0.01 25,485.80 7.22 2.44 0.69 0.00 1995 30,538.00 6.98 0.93 5.96 0.00 34,486.50 6.48 2.35 0.70 0.00 1996 32,325.60 6.43 1.68 5.46 0.01 36,054.80 5.92 1.95 0.91 0.00 1997 34,622.10 5.56 2.00 5.53 0.01 40,896.40 5.27 2.52 0.78 0.00 1998 33,665.20 5.09 1.48 5.62 0.00 42,162.10 5.66 2.61 0.99 0.00 1999 35,921.60 4.67 1.42 6.55 0.00 47,900.50 5.26 2.59 1.52 0.00 2000 42,625.80 4.15 1.78 6.12 0.00 50,336.10 4.00 2.88 1.68 0.00 2001 45,626.40 4.41 3.39 4.58 0.01 59,150.60 3.61 3.54 2.24 0.00 2002 50,496.30 3.52 3.41 5.05 0.01 58,912.40 3.25 4.42 1.55 0.02 2003 61,118.50 2.86 4.43 5.07 0.01 74,070.00 3.32 5.05 1.84 0.01 2004 75,385.20 2.53 5.54 4.71 0.00 99,835.30 2.93 6.08 1.66 0.00 2005 97,918.10 2.43 6.58 4.36 0.00 134,690.00 2.58 7.30 1.53 0.00 2006 122,763.00 3.05 7.75 3.51 0.00 185,030.00 2.67 8.67 1.76 0.00
Source: DOT

29
Appendix VII: Exports from Japan to Top 20 Countries
Year
Country
1989 1990 1991 1992 1993 1994 1995 1996 1997 1998 1999 2000 2001 2002 2003 2004 2005 2006 Australia 8 8 12 12 10 10 12 13 13 11 12 12 12 12 11 11 10 11 Belgium-Luxembourg 14 15 15 15 17 18 17 17 17 16 17 18 18 16 16 16 16 18 Canada 10 9 10 11 12 13 16 16 15 13 13 15 13 13 13 15 14 12 China,P.R.: Mainland 7 11 8 7 5 5 5 4 4 3 2 3 2 2 2 2 2 2 China,P.R.:Hong Kong 4 4 4 2 2 2 3 3 2 2 4 4 4 4 4 4 4 4 France 11 12 13 13 14 16 15 15 16 14 14 14 15 15 15 14 15 16 Germany 3 2 2 3 4 6 6 7 6 4 5 6 5 6 5 6 6 6 Indonesia 15 14 14 14 13 12 10 11 10 17 18 13 14 14 14 13 12 17 Italy 17 16 18 18 20 19 18 19 19 18 16 16 16 18 17 17 19 20 Korea 2 3 3 4 3 3 2 2 3 5 3 2 3 3 3 3 3 3 Malaysia 13 13 9 9 9 9 8 8 8 10 10 8 10 9 10 10 9 10 Mexico 10 19 17 19 18 18 19 19 19 19 19 19 18 13 Netherlands 12 10 11 19 11 11 11 10 11 8 8 10 9 10 9 9 11 9 Panama 20 19 16 17 16 15 13 14 14 15 15 17 17 17 18 18 17 15 Philippines 20 15 14 14 12 12 12 11 11 11 11 12 12 13 14 Saudi Arabia 18 17 17 16 18 20 20 20 20 20 20 20 20 19 Singapore 6 6 5 5 6 4 4 5 5 6 6 5 6 5 7 7 7 7 Spain 20 20 20 20 20 Switzerland 19 18 19 Russia 19 Thailand 9 7 7 8 7 7 7 6 7 9 9 9 8 7 6 5 5 5 U.S.S.R. 16 20 United Kingdom 5 5 6 6 8 8 9 9 9 7 7 7 7 8 8 8 8 8 United States 1 1 1 1 1 1 1 1 1 1 1 1 1 1 1 1 1 1

30
Appendix VIII: Imports to Japan from Top 20 Countries
Year
Country
1989 1990 1991 1992 1993 1994 1995 1996 1997 1998 1999 2000 2001 2002 2003 2004 2005 2006 Australia 3 3 3 3 4 3 4 5 5 3 4 6 5 5 5 4 5 5 Brazil 17 19 18 17 16 17 18 18 18 18 - - - - - - - - Canada 7 9 9 9 9 8 7 11 10 10 11 11 11 11 11 11 13 13 Chile - - - - - - 20 - - - - - - - - - - 19 China,P.R.: Mainland
4 4 2 2 2 2 2 2 2 2 2 2 2 1 1 1 1 1
China,P.R.:Hong Kong
20 20 - - - - - - - - - - - -
France 10 10 11 12 12 13 14 15 15 13 12 15 13 12 13 12 14 15 Germany 6 6 6 6 6 6 6 6 6 6 6 9 8 6 8 8 8 8 Indonesia 5 2 4 4 3 5 5 4 4 5 5 4 4 4 4 5 7 7 Iran, I.R. of - 5 19 18 19 19 - 20 20 - 20 17 18 18 12 13 12 12 Italy 14 17 14 14 14 14 15 14 13 14 16 18 16 14 16 16 17 18 Korea 2 13 5 5 5 4 3 3 3 4 3 3 3 3 3 3 6 6 Kuwait 19 10 - - 19 - - 19 19 19 19 19 16 14 Malaysia 11 11 10 10 10 8 7 9 7 7 7 7 9 9 10 10 10 Philippines - - 20 20 20 20 19 16 16 16 15 12 12 13 14 14 15 16 Qatar - - 16 - - - 20 18 16 14 16 15 15 11 11 Russia - 19 18 16 16 17 17 19 17 20 20 - 20 20 20 - Saudi Arabia 8 7 - 7 8 9 11 9 8 11 10 8 9 7 6 6 3 3 Singapore 18 16 8 16 15 15 13 12 14 15 14 14 17 17 18 18 19 17 South Africa - - - - - - - - - - - - - - - - - 20 Switzerland 13 15 15 15 17 18 17 19 - 17 19 - - 20 - - - - Thailand 15 14 12 11 11 11 10 10 11 9 9 10 10 10 10 9 9 9 U.S.S.R. 16 18 17 - - - - - - - - - - United Arab Emirates
9 8 7 8 7 7 9 8 7 8 8 5 6 8 7 7 4 4
United Kingdom 12 12 13 13 13 12 12 13 12 12 13 13 15 15 17 17 18 - United States 1 1 1 1 1 1 1 1 1 1 1 1 1 2 2 2 2 2 India 23 23 21 23 21 21 21 22 25 26 27 28 28 - 0.82 28 27 26

31
Appendix IX: Japan's External Trade
Japan's Export to Japan's import from
Percentage share to total Percentage share to total
Year
World (Million
USD) India China,
P.R.: Mainland
China, P.R.: Hong
Kong
China, P.R.:
Macao
World
(Million USD)
India China, P.R.:
Mainland
China, P.R.: Hong
Kong
China, P.R.:
Macao 1989 274,693.00 0.73 3.09 4.18 0.02 209,641.00 0.94 5.29 1.05 0.05 1990 287,839.00 0.59 2.13 4.55 0.02 235,334.00 0.88 5.12 0.93 0.04 1991 315,018.00 0.48 2.73 5.19 0.03 236,658.00 0.92 6.02 0.87 0.02 1992 339,997.00 0.44 3.52 6.11 0.03 232,908.00 0.87 7.29 0.88 0.02 1993 362,831.00 0.42 4.78 6.29 0.03 241,713.00 0.95 8.54 0.83 0.02 1994 395,317.00 0.52 4.73 6.51 0.03 274,323.00 0.97 10.05 0.78 0.01 1995 443,292.00 0.57 4.95 6.27 0.02 336,141.00 0.87 10.69 0.81 0.01 1996 411,614.00 0.59 5.30 6.16 0.02 349,664.00 0.82 11.56 0.74 0.01 1997 421,466.00 0.52 5.15 6.47 0.02 338,709.00 0.78 12.35 0.66 0.01 1998 388,040.00 0.62 5.20 5.79 0.02 280,867.00 0.78 13.20 0.62 0.01 1999 419,456.00 0.58 5.59 5.28 0.02 310,774.00 0.72 13.86 0.58 0.01 2000 478,361.00 0.52 6.35 5.68 0.02 379,577.00 0.69 14.53 0.44 0.01 2001 403,517.00 0.48 7.67 5.76 0.02 349,081.00 0.63 16.55 0.42 0.01 2002 416,789.00 0.45 9.59 6.10 0.02 337,172.00 0.62 18.33 0.42 0.01 2003 471,906.00 0.51 12.18 6.34 0.02 382,953.00 0.57 19.73 0.35 0.01 2004 565,811.00 0.54 13.06 6.26 0.02 454,809.00 0.57 20.74 0.36 0.01 2005 594,887.00 0.59 13.45 6.05 0.02 515,194.00 0.62 21.05 0.30 0.01 2006 646,779.00 0.69 14.35 5.63 0.02 578,694.00 0.71 20.47 0.27 0.00

32
Appendix X: Japanese FDI outflows by global region and main host country 1980–2001 (in Yen billion at current prices)
1980-85 1986-90 1991-95 1996-2000 2001 1980-2001 Value % Value % Value % Value % Value % Value %
USA 4205 35 14740 46 9947 42 10177 34 797 20 39865.8 39N. America 4408 36 15294 48 10323 44 10738 36 808.1 20 41571.3 41 Hong Kong 470 3.9 957 3 597 2.5 540.7 1.8 37 0.9 2601.7 2.6 Singapore 345 2.8 595 1.9 469 2 641.7 2.1 122.3 3.1 2173 2.1 Taiwan 103 0.8 278 0.9 200 0.9 230.8 0.8 39.9 1 851.7 0.8 Korea 137 1.1 347 1.1 179 0.8 338.9 1.1 68 1.7 1069.9 1.1NIEs 1055 8.7 2177 6.8 1445 6.1 1752.1 5.8 267.2 6.8 6696.3 6.6 Indonesia 1032 8.5 439 1.4 808 3.4 865.9 2.9 57.6 1.5 3202.5 3.2 Malaysia 146 1.2 295 0.9 433 1.8 311 1 32 0.8 1217 1.2Philippines 82 0.7 95 0.3 210 0.9 294.9 1 94.6 2.4 776.5 0.8 Thailand 93 0.8 506 1.6 459 2 756.4 2.5 110.2 2.8 1924.6 1.9NICs 1353 11 1335 4.2 1910 8.1 2228.2 7.4 294.4 7.4 7120.6 7 China 64 0.5 360 1.1 1112 4.7 857 2.9 180.2 4.6 2573.2 2.5 India 11 0.1 13 0 45 0.2 152.6 0.5 18.1 0.5 239.7 0.2Asia 2511 21 3918 12 4610 20 5093 17 773 20 16905 17MNE 205 1.7 62 0.2 172 0.7 118.4 0.4 2.5 0.1 559.9 0.6 France 122 1 465 1.5 435 1.9 498.3 1.7 38.6 1 1558.9 1.5 Germany 225 1.9 469 1.5 469 2 332.5 1.1 52.3 1.3 1547.8 1.5 UK 310 2.6 2711 8.5 1733 7.4 5566.7 19 495.5 13 10816.2 11Netherlands n.a. n.a. 1010 3.2 956.6 4.1 2259.5 7.5 563.9 14 4790.3 4.7Europe 1672 14 6739 21 4601 20 9574.3 32 1323 33 23909.1 24Latin America 2369 20 3514 11 2120 9 3513.2 12 958.3 24 12474.5 12Africa 484 4 342 1.1 269 1.1 210.2 0.7 24.1 0.6 1329.3 1.3Oceania 505 4.2 1933 6.1 1411 6 810.7 2.7 66 1.7 4725.7 4.7Total Yen billions 12154 100 31802 100 23506 100 30057 100 3955 100 101474 100
Adapted from John F. Cassidya and Bernadette Andreosso-O’Callaghan 2006, Spatial determinants of Japanese FDI in China, Japan and the World Economy, Volume 18, Issue 4, December 2006, Pages 512-527. Source: Ministry of Finance Monthly Statistics December 1981, 1983, 1985, 1987, and 1989; Ministry of Finance Home Page [http://www.mof.go.jp/].

33
LATEST ICRIER’S WORKING PAPERS
NO. TITLE AUTHOR YEAR
211
WHAT CONSTRAINS INDIAN MANUFACTURING?
POONAM GUPTA RANA HASAN UTSAV KUMAR
MARCH 2008
210
AN OPEN SERVICES REGIME RECIPE FOR JOBLESS GROWTH?
SUPARNA KARMAKAR
MARCH 2008
209
DEMAND-SUPPLY TRENDS AND PROJECTIONS OF FOOD IN INDIA
SURABHI MITTAL
MARCH 2008
208
FEASIBILITY OF AN ASIAN CURRENCY UNIT
ABHIJIT SEN GUPTA AMITENDU PALIT
MARCH 2008
207
MINERAL POLICY ISSUES IN THE CONTEXT OF EXPORT AND DOMESTIC USE OF IRON ORE IN INDIA
A. S. FIROZ
MARCH 2008
206
COST OF HOLDING EXCESS RESERVES: THE INDIAN EXPERIENCE
ABHIJIT SEN GUPTA
MARCH 2008
205
RURAL NONFARM EMPLOYMENT AND INCOMES IN THE HIMALAYAS
MAJA MICEVSKA DIL BAHADUR RAHUT
FEBRUARY 2008
204
COMPETITION CLAUSES IN BILATERAL TRADE TREATIES: ANALYSING THE ISSUES IN THE CONTEXT OF INDIA’S FUTURE NEGOTIATING STRATEGY
SANGHAMITRA SAHU NEHA GUPTA
FEBRUARY 2008
203
TOWARDS A COMPETITIVE MANUFACTURING SECTOR
RAJIV KUMAR ABHIJIT SEN GUPTA
FEBRUARY 2008
202
SOUTH ASIAN INTEGRATION PROSPECTS AND LESSONS FROM EAST ASIA
RAMESH CHANDRA RAJIV KUMAR
JANUARY 2008

34
About ICRIER
ICRIER, established in August 1981, is an autonomous, policy-oriented, not-for-profit research institute. We have nurtured our cherished autonomy by establishing an endowment fund, income from which meets all our administration expenses. ICRIER’s offices are located in the prime institutional complex of India Habitat Centre, New Delhi. The prime focus of all our work is to support India’s interface with the global economy. ICRIER’s founding Chairman was Dr. K.B. Lall who led the organization from its inception from 1981 to 1992 when he handed over the Chairmanship to Mr. R.N. Malhotra (1992-1996). He was followed by Dr. I.G. Patel who remained Chairman from 1997 to 2005 until his demise in July 2005. ICRIER’s current Chairperson is Dr. Isher Judge Ahluwalia. Amongst ICRIER’s founding members are: Dr. Manmohan Singh, Dr. C. Rangarjan, Dr. M.S. Swaminathan, Dr. Jagdish Bhagwati, Mr. Montek Singh Ahluwalia and Mr. Bharat Ram. ICRIER conducts thematic research in the following six thrust areas:
• Trade, Openness, Restructuring and Competitiveness • WTO Related Issues • Regional and Bilateral Issues • Financial Liberalization and Integration • Macro-economic Management in an Open Economy • Strategic Aspects of India’s External Relations
In addition, ICRIER holds public policy workshops to bring together policy makers, academicians, Union Cabinet Ministers, senior industry representatives, Members of Parliament and Media persons to try and forge a consensus on issues of major policy interest. In the effort to better understand global developments and experiences of other economies which have bearing on India’s policies and performance, ICRIER invites distinguished scholars and policy makers from around the world to deliver public lectures on economic themes of interest to contemporary India. ICRIER’s highly qualified core team of researchers includes several PhD’s from reputed Indian and foreign universities. At present the team has 25 economists. The team is led by Dr. Rajiv Kumar, D.Phil in Economics from Oxford University.