Changes in volume of drinking after changes in alcohol taxes and travellers' allowances: results...
11
Changes in volume of drinking after changes in alcohol taxes and travellers’ allowances: results from a panel study Pia Mäkelä 1 , Kim Bloomfield 2 , Nina-Katri Gustafsson 3 , Petri Huhtanen 1 & Robin Room 3,4 Alcohol and Drug Research Group, National Research and Development Centre forWelfare and Health (STAKES), Helsinki, Finland, 1 Unit for Health Promotion Research, University of Southern Denmark, Denmark, 2 Centre for Social Research on Alcohol and Drugs (SoRAD), Sveaplan, Stockholm University, Sweden 3 and University of Melbourne and AER Centre for Alcohol Policy Research, Turning Point Alcohol and Drug Centre, Victoria, Australia 4 ABSTRACT Aims The aim of this paper is to study short-term changes in alcohol consumption by subgroups of the population in Denmark, Finland and southern Sweden following large-scale decreases in alcohol taxation in Denmark and Finland and large increases in travellers’ allowances in Finland and Sweden. Design General population random samples surveyed before and after the changes, using northern Sweden as a control site. Setting Denmark, Finland, southern Sweden and northern Sweden. Participants Respondents aged 16–69 years. Measurements Volume of drinking is the main measure reported. Changes are examined by gender, age, income and year 2003 consumption level. Results Consumption decreased or remained the same among women and men in all three study sites. Relative changes were similar across subgroups of age, gender and income in all countries. In absolute terms, there was a consistent differential change by age in Denmark, Finland and Southern Sweden, with the higher level of the young and lower level of the old converging. Women’s and men’s consumption converged in Finland and southern Sweden. The changes did not differ systematically by income. Changes were not larger among heavier drinkers. Conclusions The results did not confirm expectations: an increase in consumption larger than that in the control site could not be shown in any of the countries or subgroups of the population. If there has been an effect – as shown in aggregate data in Finland – it seems to have been stronger among the old than the young and, in Finland and southern Sweden, among women rather than men. Keywords Panel study, policy change, taxes, travel allowance, volume of drinking. Correspondence to: Pia Mäkelä, National Research and Development Centre for Welfare and Health (STAKES), PO Box 220, 00531 Helsinki, Finland. E-mail: pia.makela@stakes.fi Submitted 20 April 2007; initial review completed 18 July 2007; final version accepted 20 September 2007 INTRODUCTION It is well established that the price of alcohol, which can be influenced by the level of taxation, affects substantially the levels and patterns of drinking and rates of alcohol- related problems [1–4]. High taxes, particularly on dis- tilled spirits, have been a major element of alcohol policy in all Nordic countries since the first decades of the 20th century. All except Denmark have also restricted alcohol availability substantially in other ways, for instance by requiring alcoholic beverages to be purchased in a limited number of government-owned outlets. This paper examines whether alcohol consumption changed differentially in subgroups of the population in three countries after recent increases in travellers’ import allowances and a large-scale reduction in alcohol taxa- tion in two of the countries. Subgroups defined by gender, age and income are also examined. Additionally we inves- tigate whether the data show signs of light drinkers and heavier drinkers having changed their consumption dif- ferentially. A secondary aim is to examine how the aggre- gate level estimates of the changes in consumption from the survey compare with external aggregate level data. Previous research The most striking evidence of the effects of taxes comes from Denmark in 1917 when, in wartime conditions of food shortages, the spirits taxes were raised to over 12 RESEARCH REPORT doi:10.1111/j.1360-0443.2007.02049.x © 2007 The Authors. Journal compilation © 2007 Society for the Study of Addiction Addiction, 103, 181–191
Transcript of Changes in volume of drinking after changes in alcohol taxes and travellers' allowances: results...
Changes in volume of drinking after changes in alcoholtaxes and travellers’ allowances: results from apanel study
Pia Mäkelä1, Kim Bloomfield2, Nina-Katri Gustafsson3, Petri Huhtanen1 & Robin Room3,4
Alcohol and Drug Research Group, National Research and Development Centre for Welfare and Health (STAKES), Helsinki, Finland,1 Unit for Health PromotionResearch, University of Southern Denmark, Denmark,2 Centre for Social Research on Alcohol and Drugs (SoRAD), Sveaplan, Stockholm University, Sweden3 andUniversity of Melbourne and AER Centre for Alcohol Policy Research,Turning Point Alcohol and Drug Centre,Victoria, Australia4
ABSTRACT
Aims The aim of this paper is to study short-term changes in alcohol consumption by subgroups of the population inDenmark, Finland and southern Sweden following large-scale decreases in alcohol taxation in Denmark and Finlandand large increases in travellers’ allowances in Finland and Sweden. Design General population random samplessurveyed before and after the changes, using northern Sweden as a control site. Setting Denmark, Finland, southernSweden and northern Sweden. Participants Respondents aged 16–69 years. Measurements Volume of drinking isthe main measure reported. Changes are examined by gender, age, income and year 2003 consumption level.Results Consumption decreased or remained the same among women and men in all three study sites. Relativechanges were similar across subgroups of age, gender and income in all countries. In absolute terms, there was aconsistent differential change by age in Denmark, Finland and Southern Sweden, with the higher level of theyoung and lower level of the old converging. Women’s and men’s consumption converged in Finland and southernSweden. The changes did not differ systematically by income. Changes were not larger among heavier drinkers.Conclusions The results did not confirm expectations: an increase in consumption larger than that in the control sitecould not be shown in any of the countries or subgroups of the population. If there has been an effect – as shown inaggregate data in Finland – it seems to have been stronger among the old than the young and, in Finland and southernSweden, among women rather than men.
Keywords Panel study, policy change, taxes, travel allowance, volume of drinking.
Correspondence to: Pia Mäkelä, National Research and Development Centre for Welfare and Health (STAKES), PO Box 220, 00531 Helsinki, Finland.E-mail: [email protected] 20 April 2007; initial review completed 18 July 2007; final version accepted 20 September 2007
INTRODUCTION
It is well established that the price of alcohol, which canbe influenced by the level of taxation, affects substantiallythe levels and patterns of drinking and rates of alcohol-related problems [1–4]. High taxes, particularly on dis-tilled spirits, have been a major element of alcohol policyin all Nordic countries since the first decades of the 20thcentury. All except Denmark have also restricted alcoholavailability substantially in other ways, for instance byrequiring alcoholic beverages to be purchased in a limitednumber of government-owned outlets.
This paper examines whether alcohol consumptionchanged differentially in subgroups of the population in
three countries after recent increases in travellers’ importallowances and a large-scale reduction in alcohol taxa-tion in two of the countries. Subgroups defined by gender,age and income are also examined. Additionally we inves-tigate whether the data show signs of light drinkers andheavier drinkers having changed their consumption dif-ferentially. A secondary aim is to examine how the aggre-gate level estimates of the changes in consumption fromthe survey compare with external aggregate level data.
Previous research
The most striking evidence of the effects of taxes comesfrom Denmark in 1917 when, in wartime conditions offood shortages, the spirits taxes were raised to over 12
RESEARCH REPORT doi:10.1111/j.1360-0443.2007.02049.x
© 2007 The Authors. Journal compilation © 2007 Society for the Study of Addiction Addiction, 103, 181–191
times their former value. The rise resulted in largedecreases in per-capita alcohol consumption and in acuteand chronic health consequences of drinking ([5], p. 73).The main body of evidence of the effects of taxes andprices on consumption and problems comes from time–series or pooled cross-sectional time–series analyses[2,6]. Such studies on price elasticity show that changesin prices of alcoholic beverages tend to be followed byopposite changes in sales. The price elasticity estimatesfor Nordic countries [6] do not differ greatly, for instance,from estimates of elasticities in the United States [2],although the Nordic demand for beer seems to be some-what more price-elastic than the US demand.
One may identify two weaknesses in time–seriesanalyses. First, they require many time-points, whichoften means a long time-period, in order to be reliable,and it is uncertain to what extent the evidence from thehistorical period can be generalized to apply today. Sec-ondly, this approach cannot be used to study whethereffects of price differ by population subgroup, e.g. bygender, age, social strata or between light and heavydrinkers.
Econometric studies on differential price effects havebeen carried out mainly in the United States with cross-sectional survey data, where the effects of prices or excisetaxes are derived from comparing consumption amongindividuals who live in geographical areas that have dif-ferent price or excise tax levels. These studies have pro-vided contradictory evidence of whether heavy drinkersare affected more or less by price changes than moderatedrinkers [7,8]. Most studies on youth have concluded thatexcise taxes, particularly of beer, have a greater effect onfrequent or heavy drinking than on less frequent orlighter drinking [2,9,10]. The general results in theeconometric literature suggest a higher elasticity amongyounger than among older drinkers [2,11]. Reviewingthe current econometric literature on the effects of priceon alcohol consumption and problems, Chaloupka et al.[2] note critically the lack of and the need for ‘naturalexperiments’ that would compare the amounts of alcoholconsumed by individuals or groups at different prices,with other variables held constant.
Previously, only a few studies have used such aresearch design to study differential effects of changes intaxes. Kendell et al. [12,13] used longitudinal data tostudy the effects of a rise in alcohol taxes in Scotland,finding that in relative terms men and women reducedtheir drinking equally, and in absolute terms heavydrinkers reduced their drinking at least as much as lightdrinkers. However, the results are likely to have been con-founded by the regression to the mean effect. In Switzer-land, a study of the effects of a substantial reduction inthe tax on foreign spirits found an increased consumptionof spirits in all subgroups studied, but younger agegroups, particularly young males, were more affected byprice than older age groups [14,15]. Also, the increase inconsumption was relatively higher in moderate than inheavier drinkers, although regression to the mean effectsmay not have been controlled for sufficiently [15].
It has long been recognized that where alcohol is moreavailable or cheaper across an easily crossed border, asubstantial cross-border trade tends to develop that canhave substantial effects in areas close to the border[16–19]. Cross-border shopping has become a substan-tial factor in the part of Sweden nearest to Denmark [20]and has been a considerable factor in Southern Jutland,Denmark [21].
Changes to be studied
Substantial changes have occurred in Nordic countries inalcohol excise taxes and in the alcohol allowances thattravellers can bring across national borders withoutpaying further taxes. In January 2004, the allowances forthose entering Denmark, Finland and Sweden from otherEuropean Union (EU) countries increased to the generalEU levels (Table 1). The effects to be examined in thisstudy are listed below.• For Denmark, the effects of a large reduction in Danish
spirits taxes and a large increase in travellers’ allow-ances for spirits imports. Danish taxes on spirits werelowered on October 2003 by 45%. As a result, recordedpurchases of spirits rose by 16% but for all alcoholicbeverages combined recorded consumption fell by 2%from 2003 to 2004 [22].
Table 1 Travellers’ allowances for alcohol imports, in litres of each beverage in 2003 and 2004.
Within-EUto Denmark<1/2004
Within-EUto Sweden<1/2004
Within-EUto Finland<1/2004
Estonia toFinland<5/2004
General within-EU‘guidance’: importsfor own use
Spirits 1.5 5 1 1* 10Fortified wine 20 6 3 2* 20Table wine 90 52 5 2 90Beer 110 64 64 16 110
*Either spirits or fortified wine.
182 Pia Mäkelä et al.
© 2007 The Authors. Journal compilation © 2007 Society for the Study of Addiction Addiction, 103, 181–191

• For Finland, the effects of a large reduction in alcoholtaxes and a large increase in travellers’ allowances foralcohol imports. Finnish taxes on spirits were loweredby 44%, on fortified wine by 40%, on table wine by 10%and on beer by 32% in March 2004. In May 2004,Estonia entered the EU and within-EU travellers’ allow-ances came into effect for travellers from Estonia.Estonia is located close to Finland and has substantiallylower alcohol prices. Estimated total consumption ofalcohol rose by 10%: recorded consumption by 6.5%and unrecorded consumption by around one-fourth[23].
• For southern Sweden, the effects of the large reductionin Danish spirits taxes and a considerable increase intravellers’ allowances for alcohol imports. Estimatedtotal consumption rose by 1%: recorded consumptiondeclined by 8% and unrecorded consumption rose by18% [20].
Study design
To investigate possible changes in alcohol consumptionafter introduction of these new policies, we analysesurvey data which consist of individual-level data col-lected before and after the changes, with both a paneldesign and with repeated cross-sectional surveys, usingnorthern Sweden as a control site. Volume of drinking isthe main measure reported in the article. Other measuresof drinking patterns will be referred to in order to confirmthat the essential features of the change are captured bythe analysis that is otherwise based on the volume ofdrinking.
Both absolute and relative changes will be examined.According to the theory of the collectivity of drinkingcultures [24], aggregate changes will be composed ofsimilar proportional rather than absolute changes in sub-groups of the population. Technically, changes in thelogarithm of consumption describe relative changes inconsumption. However, absolute changes may be arguedto be more important for public health. In relative terms,an increase from 0.1 litre to 0.2 litres is the equivalent ofa change from 10 litres to 20 litres, i.e. in both cases thereis a 100% increase, and indeed the difference between thelogarithms of these values is exactly the same. From apublic health perspective, however, the latter change ismuch more relevant.
METHOD
Data
Probability surveys of the adult population were con-ducted during the third quarter of 2003 in Sweden,Denmark and Finland. Those aged 16–69 years areincluded in the present analysis, as that age-range was
available in all three countries. In Finland, a postal surveywas sent out by Statistics Finland on behalf of theNational Research and Development Centre for Welfareand Health (STAKES) and returned by 2369 people,representing a completion rate of 60%. In Denmark,a telephone survey was conducted by a public opinionsurvey firm, Vilstrup, on behalf of the University ofSouthern Denmark. Sampling was conducted on thebasis of random digit dialling, which included cell-phonenumbers. A total of 1771 people aged 16–69 were inter-viewed. The cooperation rate among all respondents aged15 years and older was 50% (American Association forPublic Opinion Research formula 4 [25]). In Sweden, atelephone survey was conducted by Temo, a publicopinion survey firm, for SoRAD (Centre for SocialResearch on Alcohol and Drugs) on similar samples tothose for Denmark. For the purpose of the present analy-sis, two separate areas of Sweden were included inthe design. The southern Sweden area (Gothenburg,Kronoberg, Halland, Blekinge and Skåne) is within easyreach of Denmark by bridge or ferry. The northernSweden region includes an area stretching from about150 km west of Stockholm up to 150 km from theFinnish border at the north end of Sweden. Altogether,1243 individuals aged 16–69 were interviewed in thesouthern region in 2003 (51% completion and 53%cooperation rate among all respondents aged 16 ormore), and 1152 in the northern region (49% comple-tion and 52% cooperation rate).
New samples were interviewed on the same basis,again in the third quarter, and with the same data collec-tion procedures and general completion rates in 2004 ineach of the four sites. The numbers of respondentsincluded in these new samples were 1142 for Finland(53% completion), 894 for Denmark (56% cooperation),1251 for southern Sweden (47% completion, 54% coop-eration) and 1227 for northern Sweden (44% comple-tion, 55% cooperation). Approximately 1 year after thefirst interview, efforts were made to re-interview thoseinterviewed in the 2003 samples who had agreed to are-interview. This resulted in 1332 re-interviews inFinland (56% of the 2003 respondents), 1247 inDenmark (75%), 998 in southern Sweden (83%) and930 in northern Sweden (83%).
The new Danish and Swedish samples in 2003 and2004 were each weighted as a whole in terms of numberof eligible respondents in the household [the number inthe household eligible to be a respondent was approxi-mated using available data on the size of the householdand the number of children]. Post-weighting for age andgender (and region in Denmark and Finland) was used inorder to restore the population distribution. Extremeweights were reduced to fall in the range between 3 and0.33.
Taxes, availability and alcohol consumption 183
© 2007 The Authors. Journal compilation © 2007 Society for the Study of Addiction Addiction, 103, 181–191
Measures
Volume of consumption was measured by beverage-specific quantity–frequency questions. First, questionswere asked on the frequencies of drinking beer, cider oralcopops, of wine and of spirits, and additionally ofstrong wine for Sweden and Denmark and of class II beer(up to 3.5%, available in grocery stores) for Sweden. Forthose beverages that the respondent reported drinking,the typical quantity was requested. Volume of consump-tion was estimated by summing the products of thebeverage-specific quantities and frequencies.
Abstinence was defined as having not drunk anyalcoholic beverages in the previous 12 months. The fre-quency of heavy drinking occasions or binge drinkingwas asked as a frequency of drinking at least the equiva-lent of a bottle of wine in Sweden and Denmark and asthe frequency of drinking six or more drinks for Finnishmen and four or more drinks for Finnish women. Overallfrequency of drinking was asked separately.
Income was measured by gross personal income inFinland and Sweden and by gross household income inDenmark, with different categorizations in each country.We combined some categories to arrive at the samenumber and similar approximate size of categories ineach country.
Analysis and statistical methods
Unless specified otherwise the results are from panel data,i.e. based on individuals who responded in both 2003 and2004 (‘complete cases’). The main results are also shownfor the cross-sectional data, i.e. for all respondentssampled for the first time in the given year.
Proportional changes in consumption were studied byfitting marginal models on log-transformed consumption,which was approximately normally distributed, usinggeneralized estimating equations (GEE) [26]. These esti-mate average population consumption while adjustingthe standard errors for clustering effects created by takingrepeated measurements on the same individuals. In themodels for gender and income, age was also adjusted for. Atest for whether the changes were statistically significantlydifferent by a socio-demographic variable was derivedfrom the test of the interaction term between time (2003versus 2004) and the socio-demographic variable.
Confidence intervals (95%) for the absolute changeswere estimated by bootstrapping [27]. Using this method,numerous (here n = 1000) samples with replacement aredrawn from the original data with the size equivalent tothe original size of the data, and from each of thesesamples the change was calculated. The ordered N esti-mates form an empirical distribution that yields a 95%confidence interval when 2.5% of the top and bottomestimates are excluded.
Regression to the mean causes extreme observations(heavy and light drinkers) defined in one point of time tobe closer to the mean in the next measurement, even if noreal changes occurred. In order to study the real effect ofthe change by original level of drinking, net of the regres-sion to the mean effect, we used the method suggested bySkog & Rossow [28]. With this method, a hypotheticalcomparison group is derived on the assumption thatwithout the ‘intervention’, the log-transformed con-sumption would have followed the normal distributionand the distribution would have been stationary—without changes in mean and standard deviation. Theregression equation in the hypothetical comparisongroup is then obtained by:
E Y Y a b Y r m r Y2 1 1 11( ) = + ⋅ = −( )⋅ + ⋅
where Yi is log-transformed consumption at time i(i = 2003, 2004), r is the correlation that would havebeen observed without an ‘intervention’ and m is the log-artithmic mean consumption. Only drinkers are includedin the analysis. The estimate used for m is the mean in2003. The estimate for the correlation is obtained usingthe third wave of the panel study, i.e. it is the postinter-vention correlation between log-transformed consump-tion values in 2004 and 2005. These were: 0.82 forFinland, 0.74 for Denmark, 0.74 for Southern Swedenand 0.73 for Northern Sweden. The estimate of the realeffect of the intervention is obtained by comparing theobserved regression line to the hypothetical regressionline. The regression lines fitted on logarithmized con-sumption were also transformed to natural scale by usingthe formula given by Skog & Rossow [28].
The effect of ageing by 1 year, as assessed on the basisof a cross-sectional comparison of age groups in 2003,was negligible in the whole samples (approximately 1% inone direction or the other). In Finland and Sweden, theeffect in the youngest age group under consideration herewas a slight increase in consumption (a couple of per-centage points, or less than 0.1 litre per year) and in theolder age groups a slight decrease in consumption of acorresponding magnitude. In Denmark the age patternwas not systematic.
RESULTS
In Denmark, where the spirits taxes decreased consider-ably, there was no sign in the panel data of an increaseeither among men or among women in total consump-tion (Table 2) or in spirits consumption (Table 3), butrather a decrease. However, the results from the paneldata and the cross-sectional data differed markedly, par-ticularly among men, for whom the cross-sectional datashowed an increase in total consumption (Table 2). For
184 Pia Mäkelä et al.
© 2007 The Authors. Journal compilation © 2007 Society for the Study of Addiction Addiction, 103, 181–191

spirits consumption, the cross-sectional data did not differfrom the panel data.
In Finland, where there was a tax decrease and theavailability of alcohol increased through the possibility ofimporting cheap alcohol from Estonia, a decrease inoverall consumption was reported among men in bothpanel and cross-sectional data, and there was no reportedincrease in men’s spirits consumption or in women’soverall or spirits consumption (Tables 2, 3).
In southern Sweden, the availability of alcoholincreased through the possibility of importing larger
amounts of alcohol from Denmark, with prices for spiritseven lower than before. The panel data for southernSweden show no increase in the total consumption or inspirits consumption. Here, too, the cross-sectional datashow somewhat different results, with an increase in con-sumption among women. In fact, the only group thatshows signs of increase in consumption both in the paneland the cross-sectional data concerns men in the controlsite, northern Sweden.
In Finland and in southern Sweden the gap betweenmen’s and women’s consumption became smaller in both
Table 2 Volume of consumption in centilitres per year in 2003 and the change in centilitres per year between 2003 and 2004 in thepanel data and in the repeated cross-sections by country, age and gender.
Denmark Finland Southern Sweden Northern Sweden
n (2003) 2003 Change n (2003) 2003 Change n (2003) 2003 Change n (2003) 2003 Change
Volume: panel dataAll 1247 558 -44* 1267 499 -37* 1002 451 -29 945 297 13Gender
Men 588 762 -50 532 713 -81*† 451 625 -54 458 395 36Women 659 341 -38* 735 314 1 551 287 -6 487 185 -13
Age (years)16–29 229 812 -133*‡ 314 518 -77* 257 750 -197 198 355 -2230–49 538 470 -42* 509 513 -34 406 374 23 405 283 550–69 480 506 11 444 467 -9 339 335 26 342 280 39
Volume: cross-section samplesAll 1771 572 62 2243 514 -33 1287 470 24 1196 316 26Gender
Men 800 792 106 1013 743 -80 585 655 -14 578 426 46Women 971 356 15 1230 286 12 702 295 48 618 193 17
Age (years)16–29 354 832 -79 564 579 -125* 359 662 -137‡ 275 379 9630–49 738 488 85 849 524 -1 512 425 64 487 307 1550–69 679 494 134* 830 452 2 416 375 103 434 290 -8
*Bootstrapped 95% confidence intervals exclude 0 (i.e. change is significant at the 5% level). †The bootstrapped 95% confidence interval for the differencebetween men and women excluded 0 (i.e. difference in change between genders is significant at 5% level). ‡The bootstrapped 95% confidence interval forthe difference between the changes in the first and the third age group excluded 0.
Table 3 Consumption of spirits in centilitres per year in 2003 and the change in centilitres per year between 2003 and 2004 in thepanel data by country, age and gender.
Denmark Finland Southern Sweden Northern Sweden
2003 Change 2003 Change 2003 Change 2003 Change
All 84 -13* 88 0 90 -5 55 -5Gender
Men 119 -24* 155 -9 137 -2 89 -11Women 47 -2 28 8 47 -8 18 0
Age (years)16–29 229 -60*† 66 0 204 -89*† 54 -1130–49 49 -5 67 -5 48 -2 45 350–69 36 7 134 7 62 45 65 -11
*Bootstrapped 95% confidence intervals exclude 0 (i.e. change is significant at the 5% level). †The bootstrapped 95% confidence interval for the differencebetween the changes in the first and the third age group excluded 0 (i.e. difference in change between these age groups is significant at 5% level).
Taxes, availability and alcohol consumption 185
© 2007 The Authors. Journal compilation © 2007 Society for the Study of Addiction Addiction, 103, 181–191
the panel and the cross-sectional data (Table 2); this con-vergence was statistically significant only in Finland. Theconvergence could not be attributed to the consumptionof spirits (Table 3).
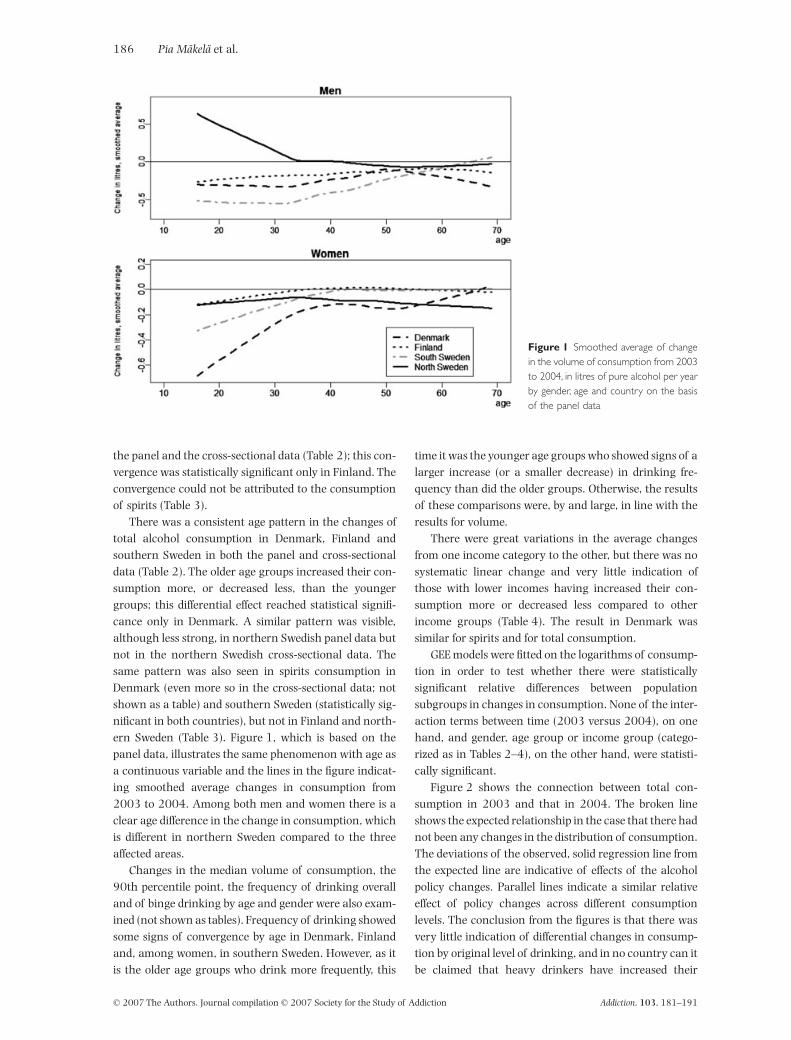
There was a consistent age pattern in the changes oftotal alcohol consumption in Denmark, Finland andsouthern Sweden in both the panel and cross-sectionaldata (Table 2). The older age groups increased their con-sumption more, or decreased less, than the youngergroups; this differential effect reached statistical signifi-cance only in Denmark. A similar pattern was visible,although less strong, in northern Swedish panel data butnot in the northern Swedish cross-sectional data. Thesame pattern was also seen in spirits consumption inDenmark (even more so in the cross-sectional data; notshown as a table) and southern Sweden (statistically sig-nificant in both countries), but not in Finland and north-ern Sweden (Table 3). Figure 1, which is based on thepanel data, illustrates the same phenomenon with age asa continuous variable and the lines in the figure indicat-ing smoothed average changes in consumption from2003 to 2004. Among both men and women there is aclear age difference in the change in consumption, whichis different in northern Sweden compared to the threeaffected areas.
Changes in the median volume of consumption, the90th percentile point, the frequency of drinking overalland of binge drinking by age and gender were also exam-ined (not shown as tables). Frequency of drinking showedsome signs of convergence by age in Denmark, Finlandand, among women, in southern Sweden. However, as itis the older age groups who drink more frequently, this
time it was the younger age groups who showed signs of alarger increase (or a smaller decrease) in drinking fre-quency than did the older groups. Otherwise, the resultsof these comparisons were, by and large, in line with theresults for volume.
There were great variations in the average changesfrom one income category to the other, but there was nosystematic linear change and very little indication ofthose with lower incomes having increased their con-sumption more or decreased less compared to otherincome groups (Table 4). The result in Denmark wassimilar for spirits and for total consumption.
GEE models were fitted on the logarithms of consump-tion in order to test whether there were statisticallysignificant relative differences between populationsubgroups in changes in consumption. None of the inter-action terms between time (2003 versus 2004), on onehand, and gender, age group or income group (catego-rized as in Tables 2–4), on the other hand, were statisti-cally significant.
Figure 2 shows the connection between total con-sumption in 2003 and that in 2004. The broken lineshows the expected relationship in the case that there hadnot been any changes in the distribution of consumption.The deviations of the observed, solid regression line fromthe expected line are indicative of effects of the alcoholpolicy changes. Parallel lines indicate a similar relativeeffect of policy changes across different consumptionlevels. The conclusion from the figures is that there wasvery little indication of differential changes in consump-tion by original level of drinking, and in no country can itbe claimed that heavy drinkers have increased their
Figure 1 Smoothed average of changein the volume of consumption from 2003to 2004, in litres of pure alcohol per yearby gender, age and country on the basisof the panel data
186 Pia Mäkelä et al.
© 2007 The Authors. Journal compilation © 2007 Society for the Study of Addiction Addiction, 103, 181–191
consumption more, or decreased less. Transforming theregression lines into the natural scale (not shown as afigure) did not change this conclusion.
DISCUSSION
According to the results of this study, the total volume ofconsumption and spirits consumption in the totalsamples from Denmark, Finland and southern Swedendid not increase. This was true for both men and women,but it was more striking among men than among women.With such large changes occurring in alcohol policies,these results were unexpected and we attempt to putthem into context here.
In Denmark, beer and wine taxes were lowered consid-erably already at the beginning of the 1990s in order toreduce imports from Germany [29]. Subsequently, regis-tered per capita consumption rose from about 11.5 litresper inhabitants aged 15 or more to about 12.1 litres, butreturned to the original level by 1998 [30]. Spirits taxeswere not reduced until 2004, and then registered spiritsconsumption increased by 16% but total consumptiondecreased by 2% [22]. Hence, the finding of no increase intotal consumption in our data is roughly in agreementwith data on registered consumption. However, the regis-tered increase in spirits consumption in 2004 was notvisible in our data. One explanation is that the increase inregistered spirits consumption was offset by a decrease inspirits border trade, as reflected in Danish tax revenuestatistics which report a fall from 10 to 7 million litres oftotal spirits (i.e. not pure ethanol) in border trade imports
between 2003 and 2004 (http://www.statistikbanken.dk/statbank5a/default.asp?w=1280).
In Sweden, there has been a long period of increasingconsumption, until a downturn in the trend in 2004.Tax-free travellers’ allowances in Sweden have risengradually from 1995 onwards when Sweden joined theEU. The quota for spirits rose from 1 litre to 2 litres in2001, to 5 litres in 2003 and 10 litres in 2004. Thequota for wines rose from the original 5 litres to 20 litresin 1998; it had risen to 26 litres by 2001, and it rosefurther to 52 litres in 2003 and to 90 litres in 2004. Thequota for beer was originally 15 litres, but it had risen to32 litres by 2000, and it rose again to 64 litres in 2003and to 110 litres in 2004. By 2003, the relative impor-tance of imported consumption in the region next toDenmark had increased so much that imports exceededregistered consumption ([20], table 15). We expected thesubstantial rises in travellers’ allowances in 2004, com-bined with a large tax reduction for spirits in Denmark, toincrease consumption in 2004. Unrecorded consumptionhas indeed been estimated to have increased by 18% (dueto tourist imports and smuggling), but a reduction in reg-istered consumption resulted in a mere 1% increase intotal (recorded + estimated unrecorded) consumption[20]. Hence, our results are not at odds with the overalldata for Sweden in showing no increase in consumptionin Sweden from 2003 to 2004. It appears that theincreasing imports have changed from being an additionto Swedish consumption to substituting for alcoholic bev-erages which would normally have been purchased inSweden.
Table 4 Mean volume of consumption in centilitres per year by income category * in 2003 and change in centilitres per year between2003 and 2004, by country.
Denmark Finland Southern Sweden Northern Sweden
% 2003 Change % 2003 Change % 2003 Change % 2003 Change
MenIncome category
1 (lowest) 11 784 -175 11 739 -28 14 1016 -133 10 319 932 15 655 -22 9 769 -159 8 444 -128 10 468 -1183 31 707 76 32 670 -115 21 552 32 27 376 214 26 679 -67 29 720 -62 39 537 -13 37 404 795 (highest) 18 932 -147 19 735 -55 17 634 -130 16 430 9
All 100 100 100 100
WomenIncome category
1 (lowest) 12 385 -91 20 329 1 22 391 -32 21 159 52 22 283 26 36 315 4 22 219 -18 23 153 23 35 307 -45 20 273 15 26 273 14 29 150 44 (highest) 31 368 -51 24 336 -14 31 283 2 26 273 -58
All 100 100 100 100
*Denmark: gross household income; Finland and Sweden: gross personal income.
Taxes, availability and alcohol consumption 187
© 2007 The Authors. Journal compilation © 2007 Society for the Study of Addiction Addiction, 103, 181–191

It seems that in both Sweden and Denmark at leastsome kind of temporary saturation point has beenattained, with consumption having levelled off inDenmark and beginning to decrease in Sweden. Else-where, periods of rising consumption have often beenfollowed by a period when consumption stabilizes or falls.Researchers have talked about ‘the long waves of alcoholconsumption’ ([31], p. 7). The timing of these waves isoften not linked in an obvious way to economic factors orpolicy intervention. Most of the southern European winecultures, for instance, are still in a long period of fallingconsumption, which started in France as long ago as inthe 1950s.
In Finland, the relation between external data and ourdata is somewhat different. According to best estimates,
total consumption in 2004 increased by 10%—recordedconsumption by 6.5% and unrecorded by one-fourth—asa response to the tax cuts and rises in travellers’ allow-ances [23]. However, this increase is not seen in our data.The same result of no increase was obtained when usinga graduated-frequency measurement of alcohol con-sumption that was available in the Finnish data [32]. Twohypotheses have been proposed to explain the discrep-ancy between survey and aggregate level data [32], bothof which probably bear some truth.
According to the first hypothesis, it was heavy drink-ers rather than ‘normal drinkers’ who increased theirconsumption in 2004. Because heavy drinkers often donot respond to surveys, the effect might well remainunnoticed in a survey, thus explaining the discrepancy
Figure 2 Scatterplots of logarithmized consumption in 2004 against that in 2003 by country.The observed regression line is marked witha solid line, the expected regression line is marked with a broken line and the diagonal is marked with a dotted line
188 Pia Mäkelä et al.
© 2007 The Authors. Journal compilation © 2007 Society for the Study of Addiction Addiction, 103, 181–191

between our results and aggregate data. This hypothesiswould appear to be contradictory to the ‘distribution ofconsumption model’ [24], on the basis of which the totaldrinking population is expected to change similarly whenconsumption changes. This theory does, however, predicta higher increase in the number of heavy drinkers thanthe rate of increase in per capita consumption (indeed, aquadratic relationship: a 1.1-fold increase in consump-tion would be expected to result, on average, in a1.12 = 1.21-fold increase in the number of heavy drink-ers [5]). Yet, the theory would also predict an increaseamong the majority of drinkers.
Deaths from liver diseases increased in Finland by anincredible 30% in 2004 and a further 20% in 2005 [33].This indicates that consumption increased at least amongthose heavy drinkers who have already damaged theirlivers before 2004. According to a recent result, theincrease in total alcohol-related mortality from 2001–03to 2004-05 among men aged 25–59 was 25%, but only1% among those employed [34]. The corresponding per-centages among women were 9% and 1%. However, theseresults on mortality do not exclude the possibility that‘normal drinkers’ also increased their consumption, asthe time lag between increased drinking and death froman alcohol-related cause for a healthy working adult maybe several years. We used the survey data to studywhether heavy drinkers increased their consumptionmore than lighter drinkers, but there were no signs ofsuch differential changes in any of the countries amongthose who responded to the survey. A similar conclusionhas been reached using the same survey data but differ-ent methodology to overcome the problem of regressionto the mean [35].
According to the second hypothesis ‘normal drinkers’increased their consumption as well, but for unknownreasons those who increased their consumption eitherdropped out of the survey or concealed the increase whenresponding. In previous analyses [32], multiple imputa-tion was used to study whether selective dropout between2003 and 2004, by known background factors in 2003,could be used to explain the unexpected findings inFinland. According to the results, selective dropoutexplained a part, but not all, of the discrepancy in resultsbetween survey studies and external data among men. Itis likely that there are selective dropout processes thatcannot be captured with the measured background vari-ables, i.e. the urban young men (or any other givengroup) who responded in 2003 and were then, forinstance, moderate drinkers and who dropped out by2004 may have increased their drinking more than menwith similar characteristics but who responded in 2004.
One limitation in the current study is indeed thisproblem that we share with many other survey studies,namely the ever-growing problem of non-response in
survey samples. Because of this problem, surveys may bebecoming ineffective instruments to capture the effects ofeven such large policy changes as were observed in theNordic countries around 2004. In general, a survey is auseful tool for studying phenomena in the general popu-lation. The more the phenomenon is restricted to a smallpart of the population, and particularly if it is a margin-alized part of the population that has a poor responserate, the less effective household surveys will be in mea-suring it.
Even though we did not observe an increase in con-sumption in the whole sample, it was important to checkwhether there were divergent trends in subgroups of thepopulation that would have cancelled each other out atthe population level. When relative changes were exam-ined, no statistically significant divergent trends in con-sumption were observed by age, gender or incomecategory, which is in agreement with what was expectedon the basis of Skog’s theory of the collectivity of drink-ing cultures.
When absolute changes were examined, a conver-gence in consumption by gender was observed in south-ern Sweden and in Finland, although the effect wasstatistically significant only in the latter country. Further,a differential trend by age was found, with the lower con-sumption level of the older age groups and the higherconsumption of the younger age groups converging.The age convergence was statistically significant only inDenmark, but it was consistent across countries andtypes of data (panel versus cross-sectional) and it was notobserved, at least not to the same extent, in the controlsite of northern Sweden. The effect of the cohort ageingby 1 year between 2003 and 2004 cannot have causedthis result, because this effect should have resulted in anopposite effect (due to ageing, older people decrease theirconsumption, the youngest increase theirs). If this resultis interpreted in terms of a stronger effect of the policychanges on older age groups, then it contrasts with pre-vious results finding youth to be most affected by changesin prices [2,11]. In the aforementioned Swiss panel study,the young were also found to be more affected [14,15]. Ifthe long waves of alcohol consumption in the Nordiccountries are starting to point downwards, it seems thatthe younger age groups may be the first ones to pick upthe new trend.
In the economic literature, it is well established thatthe uncompensated or income-constant price elasticity ofa good rises as the proportion of income spent on thatgood rises [9]. On the basis of this, and assuming thatpoorer subgroups of the population spend a larger part ofits income on alcohol, one could expect a higher incomeelasticity among the poor, as well as among the young. Inthis study, people with the lowest income did not reporthigher changes in consumption than other groups of the
Taxes, availability and alcohol consumption 189
© 2007 The Authors. Journal compilation © 2007 Society for the Study of Addiction Addiction, 103, 181–191

population. In contrast to this finding, however, a com-parison of educational levels in an annual health behav-iour survey in Finland found that among men it wasmainly the group with lowest education which increasedits consumption in 2004 [36].
In conclusion, the current study could not show anyincreases in consumption in the survey data, which is incontrast to the known consumption increase in Finlandand in agreement with the development in total con-sumption in Denmark and Sweden. If there has been aneffect, it seems that it has been stronger in absolute termsamong the old rather than among the young and, inFinland and southern Sweden, stronger among womenthan among men. In relative terms there were no signs ofdifferential changes, nor were there signs of the changebeing larger among heavier drinkers. The lack of signifi-cant changes in reported consumption in these popula-tion surveys despite substantial changes in price is anunexpected finding, and not in accordance with expecta-tions from the general economic literature. The findingspose substantial puzzles for further research.
Acknowledgements
This analysis is part of the study, ‘Effects of major changesin alcohol availability’, conducted collaboratively byresearchers at the Centre for Social Research on Alcoholand Drugs of Stockholm University, the Unit of HealthPromotion Research of the University of SouthernDenmark, Esbjerg, and the Alcohol and Drug ResearchGroup of the National Research and Development Centrefor Welfare and Health (STAKES), Helsinki. The study hasreceived support from the Joint Committee for NordicResearch Councils for the Humanities and the Social Sci-ences (NOS-HS, project 20071), the US National Instituteon Alcohol Abuse and Alcoholism (R01 AA014879) andnational funds. For Sweden, partial funding for the 2003data collection came from Systembolaget. For Denmark,data collection was supported by the Danish MedicalResearch Council (contract no. 22-02-374), as well as theDanish Health Insurance Fund (journal nos 2003B195,2004B195, 2005B093). The authors are thankful toSamuli Ripatti for statistical advice and to Ulrike Grittnerfor initial preparation of the Danish data.
References
1. Babor T., Caetano R., Casswell S., Edwards G., Giesbrecht N.,Graham K. et al. Alcohol: No Ordinary Commodity: Researchand Public Policy. Oxford: Oxford University Press; 2003.
2. Chaloupka F. J., Grossman M., Saffer H. Effects of price onalcohol consumption and alcohol-related problems. AlcoholRes Health 2002; 26: 22–34.
3. Cook P. J., Moore M. J. Alcohol. In: Cuyler A., Newhouse J.,editors. Handbook of Health Economics. Amsterdam: Elsevier;2000, p. 1630–73.
4. Österberg E. Effects of price and taxation. In: Heather N.,Peters T. J., Stockwell T., editors. International Handbook ofAlcohol Dependence and Problems. Chichester: John Wiley;2001, p. 685–98.
5. Bruun K., Edwards G., Lumio M., Mäkelä K., Pan L.,Popham R. E. et al. Alcohol Control Policies in Public HealthPerspective. Helsinki: Finnish Foundation for AlcoholStudies; 1975.
6. Österberg E. Do alcohol prices affect consumption andrelated problems? In: Holder H. D., Edwards G., editors.Alcohol and Public Policy: Evidence and Issues. Oxford: OxfordUniversity Press; 1995, p. 145–63.
7. Manning W. G., Blumberg L., Moulton L. H. Demand foralcohol: the differential response to price. J Health Econ1995; 14: 123–48.
8. Farrell S., Manning W. G., Finch M. D. Alcohol dependenceand the price of alcoholic beverages. J Health Econ 2003; 22:117–47.
9. Coate D., Grossman M. Effects of alcoholic beverage pricesand legal drinking ages on youth alcohol use. J Law Econ1988; 31: 145–71.
10. Laixuthai A., Chaloupka F. J. Youth alcohol use and publicpolicy. Contemp Policy Issues 1993; 11: 70–81.
11. Kenkel D. S. Drinking, driving, and deterrence: the effective-ness and social costs of alternative policies. J Law Econ1993; 36: 877–913.
12. Kendell R. E., de Roumanie M., Ritson E. B. Influence of anincrease in excise duty on alcohol consumption and itsadverse effects. BMJ 1983; 287: 809–11.
13. Kendell R. E., de Roumanie M., Ritson E. B. Effect of eco-nomic changes on Scottish drinking habits 1978–82.Br J Addict 1983; 78: 365–79.
14. Heeb J.-L., Gmel G., Zurbrügg C., Kuo M., Rehm J. Changesin alcohol consumption following a reduction in the price ofspirits: a natural experiment in Switzerland. Addiction2003; 98: 1433–46.
15. Kuo M., Heeb J.-L., Gmel G., Rehm J. Does price matter? Theeffect of decreased price on spirits consumption in Switzer-land. Alcohol Clin Exp Res 2003; 27: 720–5.
16. Beard R., Gant P. A., Saba R. P. Border-crossing sales, taxavoidance, and state tax policies: an application to alcohol.South Econ J 1997; 64: 293–306.
17. Macdonald S., Wells S., Giesbrecht N. Unrecorded alcoholconsumption in Ontario, Canada: estimation proceduresand research implications. Drug Alcohol Rev 1999; 18:21–9.
18. Lund I., Trolldal B., Ugland T. Norwegian–Swedish cross-border trade in alcoholic beverages. Nord Stud Alcohol Drugs2000; 17: 78–85.
19. Norström T. The geography of cross-border trading ofalcohol. In: Holder H., editor. Sweden and the EuropeanUnion: Changes in National Alcohol Policy and Their Conse-quences. Stockholm: Almqvist and Wiksell; 2000, p. 121–35.
20. Trolldal B., Boman U., Gustafsson N.-K. Alkoholkonsum-tionen och dess olika delmängder 2004 [Alcohol Consumptionand Its Different Subsets 2004]. Forskningsrapport no. 28.Stockholm: Centre for Social Research on Alcohol andDrugs (SoRAD); 2005.
21. Bygvrå S. Border shopping between Denmark and WestGermany. Contemp Drug Problems 1990; 17: 595–611.
22. Danmarks Statistik. Statistik Årbog 2006 [Statistical Year-book 2006]. Copenhagen: Danmarks Statistik; 2006.
23. Österberg E. Alkoholin kulutuksen kasvu Suomessa vuonna
190 Pia Mäkelä et al.
© 2007 The Authors. Journal compilation © 2007 Society for the Study of Addiction Addiction, 103, 181–191
2004 [The rise in alcohol consumption in Finland in 2004].Yhteiskuntapolitiikka 2005; 70: 283–94.
24. Skog O.-J. The collectivity of drinking cultures: a theory ofthe distribution of alcohol consumption. Br J Addict 1985;80: 83–99.
25. American Association for Public Opinion Research(AAPOR). Standard Definitions: Final Dispositions of CasesCodes and Outcome Rates for Surveys, 4th edn. Lexena, KS:AAPOR; 2006.
26. Fitzmaurice G. M., Laird N. M., Ware J. H. Applied Longitudi-nal Analysis. Wiley Series in Probability and Statistics. NewJersey: Wiley-Interscience; 2004.
27. Efron B., Tibshirani R. J. An Introduction to the Bootstrap.London: Chapman & Hall; 1993.
28. Skog O.-J., Rossow I. Flux and stability: individual fluctua-tions, regression towards the mean and collective changesin alcohol consumption. Addiction 2006; 101: 959–70.
29. Horverak O., Osterberg E. Utviklingen i avgifter og priser paalkoholdrikker i Norden pa 1990-talet [Trends in alcoholtaxation and prices in the Nordic countries in the 1990s].Nord Alkohol- Narkotikatidskr 2003; 19: 91–105.
30. Danmarks Statistik. Nyt Fra Danmarks Statistik: Stabilitet IDanskernes Alkoholforbrug [New from Statistics Denmark:Stability in Danes’ Alcohol Consumption]. Available at: http://www.statistikbanken.dk (accessed 16 May 2001).
31. Mäkelä K., Room R., Single E., Sulkunen P., Walsh B., Bunce
R. et al. Alcohol, Society and the State, 1. A Comparative Studyof Alcohol Control. Toronto: Addiction Research Foundation;1981.
32. Mustonen H., Mäkelä P., Huhtanen P., Metso L., RaitasaloK. Alkoholia ostetaan ja tuodaan enemmän kuin koskaan.Mihin se katoaa? [People are buying and importing morealcohol than ever. Where is it all going?]. Yhteiskuntapoliti-ikka 2005; 70: 239–51.
33. National Research and Development Centre for Welfareand Health (STAKES). Päihdetilastollinen vuosikirja 2006[Yearbook of Alcohol and Drug Statistics 2006]. Helsinki:STAKES; 2006.
34. Herttua K., Martikainen P., Mäkelä P. Kun hinta halpeni,viina tappoi eniten yksinäisiä miehiä [When prices fell,booze killed lonely men the most]. Dialogi 2007; 17: 40–1.
35. Ripatti S., Mäkelä P. Conditional models accounting forregression to the mean in observational multi-wave panelstudies on alcohol consumption. Addiction 2007; in press.Available from: http://dx.doi.org/10.1111/j.1360-0443.2007.02033.x
36. Helakorpi S., Patja K., Prättälä R., Uutela A. Suomalaisenaikuisväestön terveyskäyttäytyminen ja terveys, kevät 2005[Health Behaviour and Health among the Finnish Adult Popula-tion, Spring 2005]. Publications of the National PublicHealth Institute B18/2005. Helsinki: National PublicHealth Institute; 2005.
Taxes, availability and alcohol consumption 191
© 2007 The Authors. Journal compilation © 2007 Society for the Study of Addiction Addiction, 103, 181–191