Changes in the Distribution of the α3 Na
13
Research Article Changes in the Distribution of the 3 Na + /K + ATPase Subunit in Heterozygous Lurcher Purkinje Cells as a Genetic Model of Chronic Depolarization during Development Rebecca McFarland, 1,2 Hadi S. Zanjani, 3 Jean Mariani, 3,4 and Michael W. Vogel 1 1 Maryland Psychiatric Research Center, Department of Psychiatry, University of Maryland School of Medicine, P.O. Box 21247, Baltimore, MD 21228, USA 2 Department of Biology, University of Maryland Baltimore County, Baltimore, MD 21201, USA 3 Universit´ e Pierre et Marie Curie-P6, UMR7102, 75005 Paris, France 4 Institut de la Long´ evit´ e, Hˆ opital Charles Foix, 94205 Ivry-Sur-Seine, France Correspondence should be addressed to Michael W. Vogel; [email protected] Received 9 October 2013; Revised 28 December 2013; Accepted 13 January 2014; Published 27 February 2014 Academic Editor: Alessio D’Alessio Copyright © 2014 Rebecca McFarland et al. is is an open access article distributed under the Creative Commons Attribution License, which permits unrestricted use, distribution, and reproduction in any medium, provided the original work is properly cited. A common assumption of excitotoxic mechanisms in the nervous system is that the ionic imbalance resulting from overstimulation of glutamate receptors and increased Na + and Ca ++ influx overwhelms cellular energy metabolic systems leading to cell death. e goal of this study was to examine how a chronic Na + channel leak current in developing Purkinje cells in the heterozygous Lurcher mutant (+/Lc) affects the expression and distribution of the 3 subunit of the Na + /K + ATPase pump, a key component of the homeostasis system that maintains ionic equilibrium in neurons. e expression pattern of the catalytic 3 Na + /K + ATPase subunit was analyzed by immunohistochemistry, histochemistry, and Western Blots in wild type (WT) and +/Lc cerebella at postnatal days P10, P15, and P25 to determine if there are changes in the distribution of active Na + /K + ATPase subunits in degenerating Purkinje cells. e results suggest that the expression of the catalytic 3 subunit is altered in chronically depolarized +/Lc Purkinje cells, although the density of active Na + /K + ATPase pumps is not significantly altered compared with WT in the cerebellar cortex at P15, and then declines from P15 to P25 in the +/Lc cerebellum as the +/Lc Purkinje cells degenerate. 1. Introduction e Na + /K + ATPase pump (Na/K pump) in neurons plays a key role in maintaining the transmembrane electrical gradient that is critical for normal function. e mature pump resides in the plasma membrane and exports 3 Na + ions for every two K + ions it imports at a cost of 1 ATP molecule, resulting in a net outward, hyperpolarizing current [1]. In healthy cerebellar Purkinje cells, increases in the expression levels of the Na/K pump during postnatal development are associated with the gradual hyperpolarization of the Purkinje cell membrane potential [2, 3]. All Na/K pumps contain an alpha () and a beta () unit, though in some cell types the pump contains an additional FXYD protein [4, 5]. ere are at least 4 isoforms of the alpha subunit and 3 isoforms of the beta subunit. e subunit is the catalytic unit and is responsible for binding of Na + and K + ions, ATP, and ouabain (an inhibitor). e subunit plays a crucial role in the structure and maturation of the Na/K pump, including, for example, aiding in the tracking of the subunit from the ER to the plasma membrane [6]. Cerebellar Purkinje cells exclusively express the 3 and 1 subunits, but some other cerebellar neurons (e.g., basket cells) or structures (e.g., granule cell layer glomeruli) also express the 3 subunit [7]. e FXYD family protein, FXYD1 (Phospholemman), is also expressed in Purkinje cells and the molecular layer of the cerebellum [8], but this protein was not analyzed in this study. Na/K ATPase activity in neurons may contribute as much as 240 pA to the resting membrane potential and pump activity is increased as a function of neuronal activity [3]. Hindawi Publishing Corporation International Journal of Cell Biology Volume 2014, Article ID 152645, 12 pages http://dx.doi.org/10.1155/2014/152645
-
Upload
independent -
Category
Documents
-
view
2 -
download
0
Transcript of Changes in the Distribution of the α3 Na

Research ArticleChanges in the Distribution of the 𝛼3 Na+/K+ ATPaseSubunit in Heterozygous Lurcher Purkinje Cells as a GeneticModel of Chronic Depolarization during Development
Rebecca McFarland,1,2 Hadi S. Zanjani,3 Jean Mariani,3,4 and Michael W. Vogel1
1 Maryland Psychiatric Research Center, Department of Psychiatry, University of Maryland School of Medicine, P.O. Box 21247,Baltimore, MD 21228, USA
2Department of Biology, University of Maryland Baltimore County, Baltimore, MD 21201, USA3Universite Pierre et Marie Curie-P6, UMR7102, 75005 Paris, France4 Institut de la Longevite, Hopital Charles Foix, 94205 Ivry-Sur-Seine, France
Correspondence should be addressed to Michael W. Vogel; [email protected]
Received 9 October 2013; Revised 28 December 2013; Accepted 13 January 2014; Published 27 February 2014
Academic Editor: Alessio D’Alessio
Copyright © 2014 Rebecca McFarland et al. This is an open access article distributed under the Creative Commons AttributionLicense, which permits unrestricted use, distribution, and reproduction in any medium, provided the original work is properlycited.
A common assumption of excitotoxic mechanisms in the nervous system is that the ionic imbalance resulting from overstimulationof glutamate receptors and increased Na+ and Ca++ influx overwhelms cellular energy metabolic systems leading to cell death. Thegoal of this study was to examine how a chronic Na+ channel leak current in developing Purkinje cells in the heterozygous Lurchermutant (+/Lc) affects the expression and distribution of the 𝛼3 subunit of the Na+/K+ ATPase pump, a key component of thehomeostasis system that maintains ionic equilibrium in neurons.The expression pattern of the catalytic 𝛼3 Na+/K+ ATPase subunitwas analyzed by immunohistochemistry, histochemistry, andWestern Blots in wild type (WT) and +/Lc cerebella at postnatal daysP10, P15, and P25 to determine if there are changes in the distribution of active Na+/K+ ATPase subunits in degenerating Purkinjecells. The results suggest that the expression of the catalytic 𝛼3 subunit is altered in chronically depolarized +/Lc Purkinje cells,although the density of active Na+/K+ ATPase pumps is not significantly altered compared withWT in the cerebellar cortex at P15,and then declines from P15 to P25 in the +/Lc cerebellum as the +/Lc Purkinje cells degenerate.
1. Introduction
The Na+/K+ ATPase pump (Na/K pump) in neurons playsa key role in maintaining the transmembrane electricalgradient that is critical for normal function. The maturepump resides in the plasmamembrane and exports 3Na+ ionsfor every two K+ ions it imports at a cost of 1 ATP molecule,resulting in a net outward, hyperpolarizing current [1]. Inhealthy cerebellar Purkinje cells, increases in the expressionlevels of the Na/K pump during postnatal development areassociated with the gradual hyperpolarization of the Purkinjecell membrane potential [2, 3]. All Na/K pumps contain analpha (𝛼) and a beta (𝛽) unit, though in some cell typesthe pump contains an additional FXYD protein [4, 5]. Thereare at least 4 isoforms of the alpha subunit and 3 isoforms
of the beta subunit. The 𝛼 subunit is the catalytic unit andis responsible for binding of Na+ and K+ ions, ATP, andouabain (an inhibitor). The 𝛽 subunit plays a crucial role inthe structure and maturation of the Na/K pump, including,for example, aiding in the tracking of the 𝛼 subunit fromthe ER to the plasma membrane [6]. Cerebellar Purkinjecells exclusively express the 𝛼3 and 𝛽1 subunits, but someother cerebellar neurons (e.g., basket cells) or structures (e.g.,granule cell layer glomeruli) also express the 𝛼3 subunit [7].The FXYD family protein, FXYD1 (Phospholemman), is alsoexpressed in Purkinje cells and the molecular layer of thecerebellum [8], but this proteinwas not analyzed in this study.
Na/K ATPase activity in neuronsmay contribute as muchas 240 pA to the resting membrane potential and pumpactivity is increased as a function of neuronal activity [3].
Hindawi Publishing CorporationInternational Journal of Cell BiologyVolume 2014, Article ID 152645, 12 pageshttp://dx.doi.org/10.1155/2014/152645

2 International Journal of Cell Biology
Changes in Na/K pump activity are also associated with theadaptive responses of neurons to hypoxia, ischemia, and celldeath [5, 9]. However, whether pump activity is increasedor decreased in response to acute models of cellular injuryappears to depend on the cell type or injury model [10–13]. There is evidence that Na/K pump activity is directlyregulated by a variety of cellular second messenger signalingsystems. For example, nitric oxide (NO)/cGMP intracellularsignaling can downregulate Na/K pump activity [10]. Con-versely, in cerebellar Purkinje cells, carbon monoxide (CO)and glutamate can act through cGMP to promote persistentincreases in Na/K pump activity [14]. Under excitotoxicconditions, peroxynitrite and reactive oxygen can react withthe Na/K pump to deactivate it [15, 16]. In general, excitotoxicmechanisms in neurons are associated with overstimulationof glutamate receptors resulting in an increasedNa+ andCa++influx that overwhelms cellular energy metabolic systemsleading to cell death [17, 18]. Both increases and decreases inNa/K pump activitymay be theoretically associatedwith neu-roprotective or cell-death promoting activities. In chronicallydepolarized neurons, increased Na/K pump activity could beseen to reduce intracellular Na+ levels to help restore cellularhomeostasis, but the increased demand for ATP could bedeleterious. Alternatively, decreased Na/K pump activity ininjured cells may allow for increased intracellular Na+, butthe decreased demand for ATP from less active Na/K pumpsmay be neuroprotective.
A recent study of HEK293 cells expressing 𝛿2 glutamatereceptors (GluR𝛿2) with the Lurcher mutation, GluR𝛿2Lc,found that ectopic expression of the mutant receptor incultured cells causes a decline in ATP levels [19]. The Lcmutation in GluR𝛿2 turns the receptor into a constitutivelyopen membrane channel that chronically depolarizes thecells expressing the mutant receptor [20]. In the HEK293 invitro studies, the authors speculate that over activation ofthe Na/K pump in response to the chronic Na+ leak mayconsume cellular ATP levels leading to cell death [19, 21].The purpose of this study is to examine how a chronic Na+
leak current mediated by the mutant GluR𝛿2Lc receptor indeveloping Purkinje cells in the heterozygous Lurcher (+/Lc)mouse mutant affects the cellular distribution of 𝛼3 subunitsand active Na/K pumps.
The gene for the GluR𝛿2 receptor was first identifiedbased on its homology to NMDA and AMPA glutamatereceptors, but the receptor does not bind to most gluta-mate agonists or antagonists, nor does it appear to carry amembrane current under normal circumstances. GluR𝛿2 ispreferentially expressed in cerebellar Purkinje cells, and inthe +/Lcmutant, cerebellar Purkinje cells become chronicallydepolarized at the end of the first postnatal week whenGluR𝛿2 receptors are inserted at Purkinje cell-parallel fibersynapses. The majority of +/Lc Purkinje cells degenerateduring the first month of postnatal life starting at the endof the first week via pathways that have been described aseither apoptotic, autophagic, or necrotic [19, 20, 22, 23].Granule cell death follows as a consequence of the loss of theirprimary neuron target population, the Purkinje cells: by theend of the second postnatal month, almost all Purkinje cellsand 90% of the granule cells have degenerated in the +/Lc
cerebellum [24].We have previously hypothesized that beforecell death pathways are activated in +/Lc Purkinje cells, thechronic depolarization caused by the constitutive cation leakcurrent from the GluR𝛿2Lc channel stresses the neuron’s ionexchange and energy production systems [25, 26]. In supportof this hypothesis, we have previously shown that cytochromeoxidase activity is dramatically increased in +/Lc Purkinjecells through P25 [26] and calcium levels are elevated in+/Lc Purkinje cells in vitro [27]. In addition, the distaldendrites of +/Lc Purkinje cells contain numerous dilatedmitochondria, suggesting mitochondrial dysfunction [28].+/Lc Purkinje cells also contain significantly higher levels ofnitric oxide synthase (NOS) activity and protein nitration[25]. Stimulation of mitochondrial activity in response to thechronic depolarization is likely to increase the production ofreactive oxygen species (ROS) and increases in intracellularCa++ will stimulate NOproduction. NO and𝑂
2
− free radicalswill react to form peroxynitrite, a highly reactive oxidizingagent which can damage and kill cells by tyrosine nitration ofcritical proteins and membrane lipid peroxidation [29, 30].The results of this study demonstrate that the expression ofthe Na/K pump catalytic 𝛼3 subunit is increased, or at leastmore concentrated, in individual +/Lc Purkinje cells throughP25. However, as +/Lc Purkinje cells degenerate by P25, totalexpression levels of 𝛼3 and its 40 kD breakdown product inthe +/Lc cerebellum declines compared with WT cerebella.The density of active Na/K pumps assayed ex vivo is notaltered at P15, near the peak of +/Lc Purkinje cell death, anddecreased at P25 when there are relatively few remaining+/Lc Purkinje cells. Our interpretation of the results is thatwhile the expression of the 𝛼3 subunit may be increasedwithin individual +/Lc Purkinje cells in response to thechronic stress, potential increases in overall ATPase pumpactivity and ATP consumption due to increased expressionof the 𝛼3 subunit may be limited by the deactivation and/ordegradation of many 𝛼3 subunits.
2. Experimental Procedures
2.1. Animals. GluR𝛿2+/Lc mutant and GluR𝛿2+/+ wild type(WT) pups were generated by mating B6CBACa A𝑤−𝐽/A-Grid2Lc/J males with WT females (C57BL/6J), both fromJackson Laboratories. All animals were housed in standardconditions (14 hours light, 10 hours dark) in the animalfacilities at the Maryland Psychiatric Research Center andprovided with food and water ad libitum. Males were haremmated with one male per two females. The day of birth wascounted as postnatal day 0 (P0).The animal facilities are fullyaccredited by the American Association for the Accreditationof Laboratory Animal Care (AAALAC) and the studies wereconducted in accordance with the Guide for Care and Use ofLaboratory Animals provided by the NIH.
Mice were either euthanized by cardiac perfusion with0.9% saline followed by 4% paraformaldehyde (while deeplyanesthetized with Euthasol, >100 𝜇g/g) or by decapitation.Following the perfusions with 4% paraformaldehyde, brainswere removed from the skull, postfixed for 2 hours, andthen cryoprotected with 20% sucrose in 10mM phosphate

International Journal of Cell Biology 3
buffed saline (PBS). At least 48 hours later, the fixed brainswere embedded in OCT and frozen in isopentane. Followingdecapitation, freshly dissected brains were either bisected andfrozen in aluminum foil for Na/K pump activity assays orthe cerebellum was isolated and frozen in crushed dry ice forWestern blot analysis.
2.2. Immunohistochemistry. Fixed, frozen brains were cutat 12 𝜇m on a Leica cryostat, collected directly on slides,and stored at −70∘C until stained. For immunofluorescencestudies, slides were rinsed in 10mM PBS, followed byincubation in two changes of 0.1M glycine for 5min each.Endogenous fluorescence was reduced by incubating thesections in 50mM ammonium chloride for 1 hour. Thesections were then rinsed three times in 10mM PBS andthen incubated for an hour in blocking solution containing3% normal goat serum and 0.3%Triton X-100. Sections werethen incubated in the primary antibodies overnight at 4∘C.Sections were double labeled with either rabbit polyclonalanti-𝛼1 (gift of Dr. M. Blaustein) or rabbit polyclonal anti-𝛼3 Na/K ATPase (Upstate, now Millipore, 1/500: and mousemonoclonal anti-calbindin (Sigma, 1/5000) or rabbit poly-clonal anti-activated caspase-3 (R&D, 1/500) andmonoclonalmouse anti-𝛼3 Na+/K+ ATPase (ABR Affinity BioReagents,Thermo Scientific Pierce Antibodies, 1/250). The sectionswere rinsed 3 times in PBS and then incubated for 2 hourswith fluorescent-labeled secondary antibodies (anti-mouseor anti-rabbit Alexa 594 and Alexa 488, Molecular Probes,1/200). After incubation, they were rinsed once in 10mMPBS and incubated with 300 nM DAPI, then rinsed 3 timesin 10mM PBS, once in distilled water, and coverslipped withgel mount.The finished slides were then photographed usingeither an Olympus FV500 laser scanning confocal micro-scope or a Zeiss Axioplan fluorescence microscope. Confocaldigital imageswere cropped and adjusted usingAdobePhoto-shop for color balance and intensity. All immunofluorescenceexperiments included slides (WT and +/Lc) with no 1anti-body incubation as a control for nonspecific immunolabeling.The specificity of both the mouse monoclonal (ABR AffinityBioReagents) and the rabbit polyclonal (Upstate/Millipore)anti-𝛼3 antibodies was also tested with Western blots usinghomogenized cerebellar tissue from WT and +/Lc mutantmice (data not shown).TheABRmousemonoclonal antibodylabeled a single 110 kD band that represents the unbound,native 𝛼3 isoform, while the Upstate rabbit polyclonal anti-body labeled two bands, the 110 kD 𝛼3 isoform and a 40 kDband that has been shown to be a byproduct of 𝛼3 isoformcleavage by calpain activity [31].
For the semiquantitative comparison of Na/K ATPaseimmunolabeling in WT and +/Lc cerebella, digital imagesof 𝛼3 isoform and calbindin immunolabeling of Purkinjecells were taken at 40x on a Zeiss Axioplan with anOlympus DP70 CCD camera within the first two daysafter staining all of the sections (to avoid uneven fadingartifacts). The raw, unprocessed images were then analyzedusingMetamorphVersion 7.0r1.Threshold and colocalizationfunctions were used to selectively measure the intensity of𝛼3 isoform immunolabeling in areas that colocalized with
calbindin-stained Purkinje cells in the same section. At least3 molecular layer regions per cerebellum were selected fromvermal sections in each WT or +/Lc cerebella and the meanvalue calculated for each cerebellum.The number ofWT and+/Lc cerebella analyzed at each time point was P10, 𝑛 = 5WT,4 +/Lc; P15, 𝑛 = 5WT, 5 +/Lc; P25, 𝑛 = 4WT, 5 +/Lc. Theintensity of the 𝛼3 isoformfluorescence signal at P10, P15, andP25 is expressed as a percent change from labeling intensityin control Purkinje cells at P10.
2.2.1. Western Blot Analysis. WT and +/Lc cerebella werecollected from freshly dissected brains, rapidly frozen indry ice and stored at −70∘C until processed. Each cerebel-lum was homogenized in a buffer containing 50mM Tris(pH 8.0), 150mM NaCl, 5mM EDTA, 1%SDS, 10 𝜇L/mLProtease inhibitor cocktail (Sigma), 1mM PMSF, and 1mMNaVO
4. The homogenate was centrifuged at 15,000 rpm
for 15 minutes. Protein concentration in the supernatantwas measured using a BioRad protein assay kit. Proteinextracts were diluted in Laemmli sample buffer with 𝛽-mercaptoethanol and denatured at 37∘C for 5min and 10 𝜇gof protein per well was resolved on a Tris-glycine gel. Proteinwas transferred overnight at 4∘C onto a PVDF membrane.Themembrane was rinsed with 5% nonfat dry milk dissolvedin 1 × TBS. It was then incubated in the anti-𝛼3 Na/KATPase (ABR, 1/1000 orUpstate, 1/5000), diluted in TBS/0.1%Tween (TBS-T) with 1% milk overnight at 4∘C, and thenrinsed 3 × 10min each with PBS-T. The sample membranewas incubated in alkaline phosphatase-conjugated secondaryantibody (diluted 1/1000) and the protein was detected usingBio-Rad immun-Star chemiluminescence kit. Film exposedto the chemiluminescent signal was digitized using a lightbox and Pixera Pro150ES digital camera connected to a PowerMacintosh. The optical density of the images was calibratedusing a photographic calibration step tablet (Kodak) so thatdata is collected in the linear range of the O.D. The relativedensity of the labeled protein bands was determined usingdensitometric measurements with ImageJ. In all studies, oncedata from the antigen of interest had been collected, themembrane was stripped and labeled for total protein withIndia ink as a loading control. The density of 𝛼3 isoformprotein bands was corrected for the total amount of proteinby calculating the ratio of the density of the 𝛼3 isoform bandand the total protein. Changes in the density of the corrected𝛼3 isoform band were expressed as a percent of the averageddensity of the 𝛼3 isoform bands from P25 controls within thesame gel.
2.3. In Situ Na/K ATPase Activity Assay
Histochemistry. The density of active Na/K pumps was mea-sured in frozen tissue sections using a procedure modifiedfrom previously published protocols [32, 33]. WT and +/Lcbrains were bisected and rapidly frozen in dry ice for 2min.The brains were then cut the same day in parasagittal sectionsat 20𝜇m. A kidney from one of the wild type animals wasalso frozen and a 20𝜇m section of kidney was placed on each

4 International Journal of Cell Biology
slide as a positive control. Two slides with 2 sections per slidefrom each brain were used in the assay. The sections werefixed for 10min in 2% paraformaldehyde, rinsed 3 times eachin PBS, rinsed twice in 50mM Tris/100mM sucrose (pH 7.4),and then rinsed 3 times for 15min each time in Tris/sucrosebuffer. They were then incubated for 20min at 37∘C in alead citrate mix pH 8.8 of 4mM Potassium Citrate, 4mMLead Nitrate, 250mM Glycine, 25mM potassium hydroxide,20% DMSO, 10mM para-Nitrophenylphosphate (p-NPP),and 2.5mMLevamisole. Sectionswere then rinsed in distilledwater, rinsed for 10min in TRIS/sucrose buffer, and rinsedagain 2 times in distilled water. Sections were developed for2min in 1% ammonium sulfide, rinsed 2 times in distilledwater, rinsed for 10min in PBS on a rocker, rinsed in distilledwater, covered in crystal mount, and allowed to dry at roomtemp. As an assay for ouabain insensitive activity, one slidefrom each brain was treated with 10mMOuabain during thefinal Tris/sucrose incubation and the lead citrate incubation.
Quantification of Enzyme Activity. Stained slides were pho-tographed at 5x on a Leica DMR microscope with a 24-megapixel Power Phase Scanning camera (Phase 1, Inc.). Todecrease variations in background illumination, images ofboth the sections and adjacent blank areas of slide werephotographed.The background images were subtracted fromthe section images using MatLab. Because of the large num-ber of sections to analyze in each histochemical experiment,digital images were collected over three consecutive days. Tocalibrate for any potential differences between images takenin different sessions (e.g., changes in light levels), the changein average density of a selected section that was imaged allthree days was subtracted from the respective day. UsingImageJ, a systematic random set of points was selected tomeasure optical densities.The density for the molecular layerand granular cell layers was averaged for each brain frommeasurements of two sections per brain per experiment. Theouabain-specific activity was calculated by subtracting thedensity of the ouabain treated tissue from the density of theuntreated tissue.
3. Statistical Analyses
Statistical comparisons between experimental and controlgroups were made using two-way or one-way analysis ofvariance (ANOVA) and post hoc comparisons were madeusing Bonferroni/Dunn (Statview 5.01).
4. Results
4.1. Cellular Distribution of 𝛼3 Na/K Pump Isoforms inWT and +/Lc Purkinje Cells. A previous study has shownthat in an adult mouse cerebellum, the 𝛼1 Na/K pumpsubunit is expressed in granule cells and glomeruli, 𝛼2subunits are expressed in astrocytes, and 𝛼3 subunits areexpressed in Purkinje cells, basket cell processes, and mossyfiber glomeruli [7]. Since both Purkinje and granule cellsdegenerate in the +/Lc mutant, the 𝛼1 and 𝛼3 subunits wereinitially selected for study as the most likely isoforms to
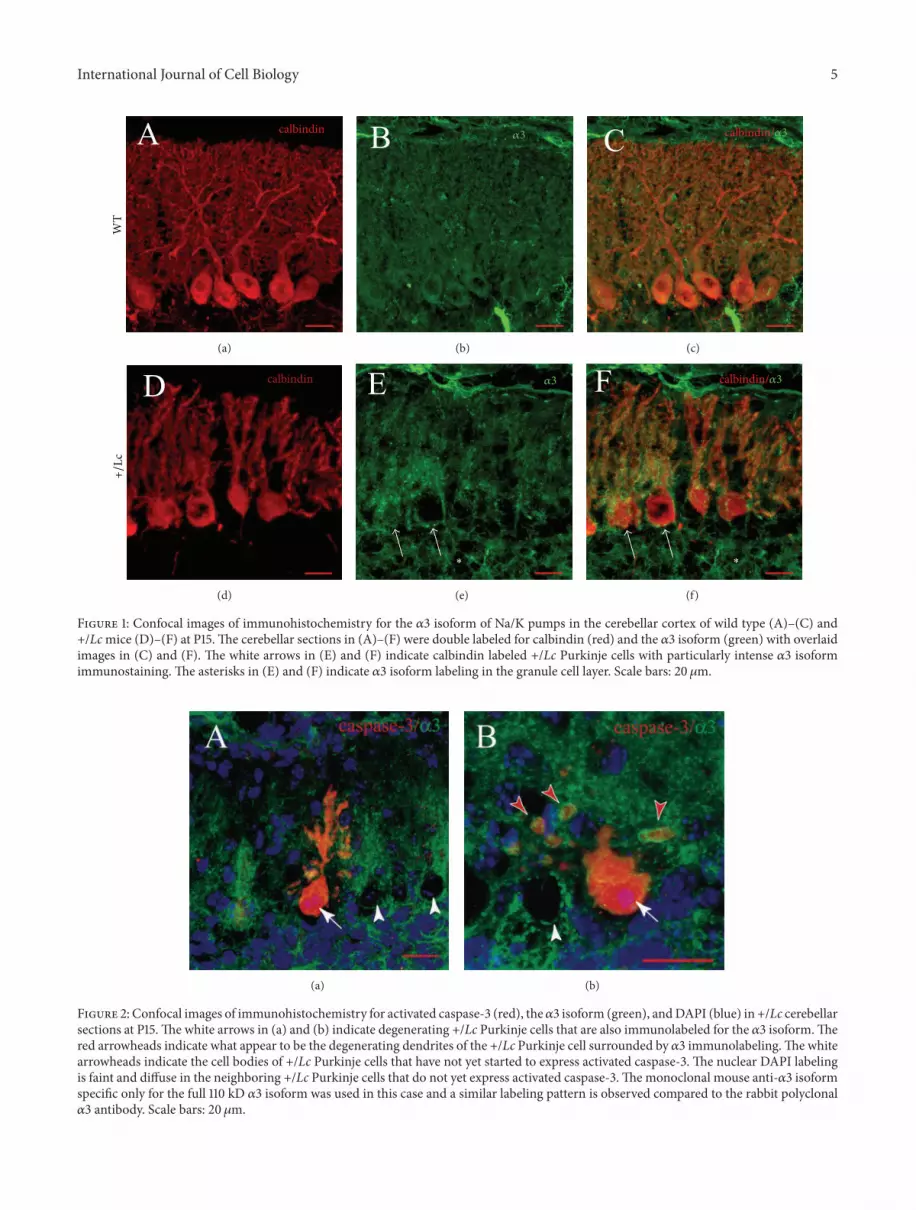
show altered expression patterns. A preliminary immuno-histochemical survey did not show any evidence of changesin the distribution or intensity of immunolabeling of the 𝛼1subunit (results not shown), but therewas evidence of distinctchanges in the pattern of immunolabeling for the 𝛼3 subunitin the +/Lc cerebellum from P10 to P25. Vermal cerebellarsections from at least 4WT and +/Lc cerebella at P10, P15,and P25 were double immunolabeled for calbindin and the𝛼3 subunit using the Upstate rabbit polyclonal antibodythat recognizes both the 110 kD full length 𝛼3 isoform andthe 40 kD byproduct of 𝛼3 isoform cleavage in Westernblots. In both WT and +/Lc cerebella from P10 to P25,the 𝛼3 subunits appear to be expressed in Purkinje cells,the molecular layer, and granule cell layer glomeruli in asimilar pattern to that described by Peng et al. [7] in thecerebellum of adult rats. 𝛼3 expression in WT Purkinje cellsis diffusely distributed throughout the dendrites and cellbody as shown for P15 WT Purkinje cells in Figures 1(b)and 1(c) (green labeling). In contrast, the immunolabelingfor 𝛼3 is qualitatively different at all three ages in +/LcPurkinje cells. From P10, the 𝛼3 isoform labeling becomesmore intense and less diffuse within +/Lc Purkinje cells. Asshown for P15 +/Lc Purkinje cells in Figures 1(e) and 1(f),immunolabeling for the 𝛼3 subunit (green) is more punctateand concentrated around the primary dendrites and cellbodies so the labeling appears more intense, though there issome variation between different Purkinje cells. For example,the 𝛼3 labeling is particularly intense in the two left most+/Lc Purkinje cells in Figures 1(d)–1(f) (white arrows), wherethe 𝛼3 isoform appears to surround the stunted primaryPurkinje cell dendrites especially in the lower two-thirds ofthe molecular layer. 𝛼3 immunolabeling is also seen aroundthe Purkinje cell bodies but not as much within the cell bodyin comparison with WT Purkinje cells. 𝛼3 immunolabelingin the granule cell layer glomeruli is indicated by whiteasterisks in Figures 1(e) and 1(f). While we cannot rule outthe possibility that some of the increased 𝛼3 immunolabelingin the Purkinje cell andmolecular layers in the +/Lc cerebellarcortex may be in climbing fibers, it is clear that the intensityand distribution of 𝛼3 immunolabeling is altered in the +/Lccerebellar cortex.
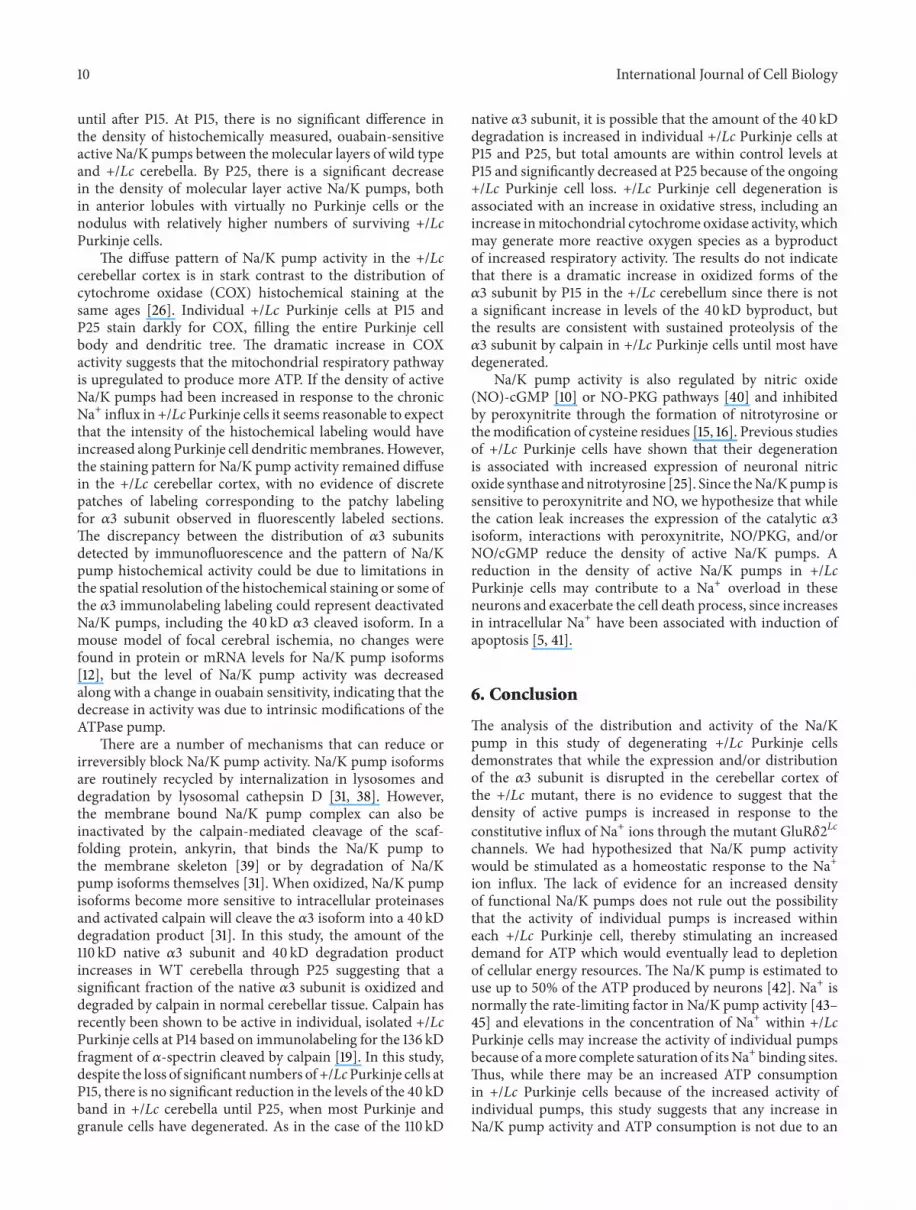
+/Lc Purkinje cells that appear to be in the final stagesof degeneration express activated caspase-3 [34, 35]. Todetermine if 𝛼3 subunit expression persists in dying Purkinjecells, cerebellar sections from P15 and P25 +/Lc cerebellawere double labeled with antibodies to activated caspase-3 and the 𝛼3 isoform and counterstained with DAPI. Thedistribution of 𝛼3 isoform labeling in activated caspase-3 positive +/Lc Purkinje cells was examined in cerebellarsections from three +/Lc mutants at P15. Confocal imagesof two such degenerating +/Lc Purkinje cells are shown inFigures 2(a) and 2(b), illustrating that +/Lc Purkinje cellscontinue to express the 𝛼3 isoform even as they degenerate.The stunted dendrites and cell body of the activated caspase-3 positive (red) +/Lc Purkinje cell shown in Figure 2(a) showpunctate labeling for 𝛼3 (green and yellow) throughout theremaining dendritic tree and cell body.The +/Lc Purkinje cellshown in Figure 2(b) appears to be at an advanced stage ofdegeneration with only a few retracted dendrites remaining
International Journal of Cell Biology 5
calbindinW
T
A
(a)
𝛼3B
(b)
calbindin/𝛼3C
(c)
+/L
c
calbindinD
(d)
𝛼3
∗
E
(e)
∗
calbindin/𝛼3F
(f)
Figure 1: Confocal images of immunohistochemistry for the 𝛼3 isoform of Na/K pumps in the cerebellar cortex of wild type (A)–(C) and+/Lcmice (D)–(F) at P15.The cerebellar sections in (A)–(F) were double labeled for calbindin (red) and the 𝛼3 isoform (green) with overlaidimages in (C) and (F). The white arrows in (E) and (F) indicate calbindin labeled +/Lc Purkinje cells with particularly intense 𝛼3 isoformimmunostaining. The asterisks in (E) and (F) indicate 𝛼3 isoform labeling in the granule cell layer. Scale bars: 20𝜇m.
(a) (b)
Figure 2: Confocal images of immunohistochemistry for activated caspase-3 (red), the𝛼3 isoform (green), andDAPI (blue) in +/Lc cerebellarsections at P15.The white arrows in (a) and (b) indicate degenerating +/Lc Purkinje cells that are also immunolabeled for the 𝛼3 isoform.Thered arrowheads indicate what appear to be the degenerating dendrites of the +/Lc Purkinje cell surrounded by 𝛼3 immunolabeling.The whitearrowheads indicate the cell bodies of +/Lc Purkinje cells that have not yet started to express activated caspase-3. The nuclear DAPI labelingis faint and diffuse in the neighboring +/Lc Purkinje cells that do not yet express activated caspase-3.Themonoclonal mouse anti-𝛼3 isoformspecific only for the full 110 kD 𝛼3 isoform was used in this case and a similar labeling pattern is observed compared to the rabbit polyclonal𝛼3 antibody. Scale bars: 20 𝜇m.

6 International Journal of Cell Biology
as detached spherical blebs or tubes (red arrowheads). Yet theremaining parts of the degenerating Purkinje cell dendritesare surrounded by 𝛼3 immunolabeling. DAPI labeling (pur-ple) in the nuclei of both activated caspase-3 positive neuronsshows the condensation of the nuclei in the degenerating +/LcPurkinje cells (white arrows). Nuclear DAPI labeling is foundin the neighboring +/Lc Purkinje cells that have not yet begunto express activated caspase-3 (white arrowheads).
Thequalitative descriptions of the developmental changesin immunolabeling for the 𝛼3 isoform suggest that it isdiffusely distributed throughout the Purkinje cell dendritictree from P10 to P25 in the WT cerebellum. In contrast,in +/Lc Purkinje cells, 𝛼3 immunolabeling becomes moreintense from P10 to P25 with punctate labeling concentratingalong the Purkinje cell primary dendrites and cell bodies. Asan assay for developmental changes in 𝛼3 immunolabeling,the intensity of the 𝛼3 (green) fluorescence signal coincidentwith calbindin labeling in WT and +/Lc Purkinje cells wasmeasured using MetaMorph (Figure 3). Two-way ANOVAanalysis of the fluorescence intensity measurements indicatesthat there are significant age- and genotype-dependant effectsin 𝛼3 subunit immunofluorescence between WT and +/LcPurkinje cells (Figure 3: Age: ANOVA 𝐹
2,22= 7.3, 𝑃 =
0.0038; genotype: ANOVA 𝐹1,22= 7.3, 𝑃 = 0.0128), but
the age 𝑥 genotype interaction does not reach significance(ANOVA 𝐹
2,22= 1.85, 𝑃 = 0.18). Post hoc analyses
of the complete data set suggest that there are significantincreases in 𝛼3 fluorescence intensity between P10 and P15and between P10 and P25 and an overall significant differencebetween fluorescence intensity in +/Lc and WT Purkinjecells (Bonferroni/Dunn; 𝑃 < 0.0167). A further exploratorypost hoc one-way ANOVA analysis separating the data setby age suggests that while differences between 𝛼3 isoformimmunofluorescence in +/Lc and WT Purkinje cells at P10and P15 may contribute to the main effect, they are notsignificantly different when analyzed separately (P10 one-wayANOVA 𝐹
1,7= 2.22, 𝑃 = 0.18; P15 one-way ANOVA 𝐹
1,8=
0.48, 𝑃 = 0.5). However, there is a significant differencebetween the intensity of 𝛼3 isoform immunolabeling in +/𝐿𝑐and WT Purkinje cells at P25 with higher levels in the +/LcPurkinje cells (ANOVA 𝐹
1,7= 7.45, 𝑃 < 0.03).
4.2. Analysis of 𝛼3 Isoform Protein Expression Levels. Theincrease in 𝛼3 immunofluorescence in +/Lc Purkinje cellsfrom P10–P25 may be due to a variety of reasons, includingeither a redistribution of existing 𝛼3 isoforms or an increasein the expression levels of the 𝛼3 isoform. To distinguishbetween these possibilities, protein extracts of cerebellartissue were prepared fromWT and +/Lc cerebella at P10, P15,and P25 and the relative levels of 𝛼3 isoform expression werequantified by Western blot (Figure 4). Western blots wereperformed with both the mouse monoclonal (ABR AffinityBioReagents) and the rabbit polyclonal (Upstate/Millipore)anti-𝛼3 antibodies. The ABR mouse monoclonal antibodylabeled a single 110 kD band that represents the unbound,native 𝛼3 isoform, while the Upstate rabbit polyclonal anti-body labeled two bands, the 110 kD 𝛼3 isoform and a 40 kDband that has been shown to be a byproduct of 𝛼3 isoform
180
160
140
120
100
80
60
40
20
0
Fluo
resc
ence
inte
nsity
(% P25
WT)
n = 5 n = 4 n = 5 n = 5 n = 5n = 4
P25P10 P15Postnatal age (days)
Wild type+/Lc
∗
Figure 3: Densitometric measurements of the intensity ofimmunofluorescent labeling for the 𝛼3 subunit in the WT and+/Lc cerebellar cortex. The graph illustrates the relative changesin fluorescence intensity relative to the intensity of Purkinje cellimmunolabeling in the P25 WT cerebellum (P10, 𝑛 = 5WT, 4 +/Lc;P15, 𝑛 = 5WT, 5 +/Lc; P25, 𝑛 = 4WT, 5 +/Lc).
cleavage by calpain activity [31].TheUpstate rabbit polyclonal110 kD band showed more background than the ABR mousemonoclonal, so the mouse monoclonal antibody was used tomeasure 𝛼3 isoform levels and the rabbit polyclonal antibodywas used to measure levels of the 40 kD 𝛼3 isoform calpaindegradation product. Representative images of Western blotsfor the 110 kD 𝛼3 isoform are shown for +/Lc and WTcerebella at P10, P15, andP25 in Figure 4(a). Figure 4(b) showsrepresentative 𝛼3 40 kD degradation product bands for WTand +/Lc cerebella at P10, P15, and P25.
Quantitative changes in the relative optical densities ofthe 110 kD𝛼3 isoformprotein and 40 kDdegradation productare shown in the graphs in Figures 4(a) and 4(b), respectively.Two-wayANOVAof the 110 kD protein density data indicatesthat there is a significant effect of age (ANOVA 𝐹
2,37=
10.241, 𝑃 = 0.003), but there are no significant effectsof genotype (ANOVA 𝐹
1,37= 1.32, 𝑃 = 0.26) or age 𝑥
genotype interactions (ANOVA 𝐹2,37= 1.83, 𝑃 = 0.18). Post
hoc exploratory analyses indicate that in the +/Lc and WTcerebella, 𝛼3 isoform protein levels at P25 are significantlyhigher than at P10 and P15 (Bonferroni/Dunn, 𝑃 < 0.0167).A separate one-way ANOVA analysis of the data separatedby age indicates that 𝛼3 isoform protein levels are onlysignificantly different between WT and +/Lc cerebella at P25(ANOVA 𝐹
1,12= 5.18, 𝑃 = 0.042). The results indicate that
𝛼3 isoform levels in the WT and +/Lc cerebellum increasewith age after P15, but by P25 the increase in 𝛼3 levels in +/Lccerebella is not as great as in WT cerebella.
Two-way ANOVA of the 40 kD 𝛼3 isoform protein levels(Figure 4(b)) indicates that there are significant effects of age(ANOVA 𝐹
2.43= 6.33, 𝑃 = 0.004), genotype (ANOVA 𝐹
1,43=
8.61, 𝑃 = 0.0053), and age 𝑥 genotype interactions (ANOVA

International Journal of Cell Biology 7
P10 P15 P250
20
40
60
80
100
120
Opt
ical
den
sity
(% o
f P25
WT)
Postnatal age (days)
∗
+/Lc
p10
+/Lc
p15
+/Lc
p25
+/+
p10
+/+
p15
+/+
p25
𝛼3 110 kD band
Wild type+/Lc
(a)
+/L
c p10
+/L
c p15
+/L
c p25
+/+
p10
+/+
p15
+/+
p25
P10 P15 P250
20
40
60
80
100
120
∗
Opt
ical
den
sity
(% o
f P25
WT)
𝛼3 40 kD band
Postnatal age (days)Wild type+/Lc
(b)
Figure 4: Expression levels of the 𝛼3 subunit 110 kD and 40 kD protein bands at P10, P15, and P25 inWT and +/Lc cerebella as determined bydensitometry of Western blots. Representative Western blots are shown for the 𝛼3 110 kD (a) and 40 kD bands (b) at P10, P15, and P25, alongwith graphs of the relative density of the bands expressed as a percentage of the mean band intensity for P25 WT cerebella.
𝐹2,42= 3.8, 𝑃 < 0.028). Post hoc analyses indicate that group
levels for the𝛼3 40 kD fragment are significantly higher at P25comparedwith P10 levels (Bonferroni/Dunn,𝑃 < 0.0167) butnot between P25 and P15 or P15 and P10 (Bonferroni/Dunn,𝑃 > 0.0167). One-wayANOVA separated by age suggests thatthe genotype effect is primarily due to a significant differencebetween the amount of 𝛼3 40 kD fragment at P25 (ANOVA𝐹1,14= 15.33, 𝑃 = 0.0016), with significantly lower levels in
+/Lc cerebella. There are no significant differences betweenlevels of the 40 kD fragment at P10 or P15.The results suggestthat by P25 there is a dramatic increase in the 40 kD 𝛼3fragment inWT cerebella, but this age-related increase is notmatched in the +/Lc cerebella.
4.3. Histochemical Measurements of Active Na/K Pump Den-sity. Since the GluR𝛿2Lc channel mediates an Na+ leakcurrent we hypothesized that the density of active Na+/K+ATPase pumps would be increased from P10 through P25in +/Lc Purkinje cells in response to increased intracellularNa+ levels. Furthermore, the changes in the distribution ofthe catalytic 𝛼3 subunit of the Na/K pump also suggest thatthe distribution and density of pump activity would be alteredin +/Lc Purkinje cells. To assay changes in the distributionof active Na/K pumps in the +/Lc cerebellum, p-NPP wasused as a substrate in an in situ histochemical assay todetect ouabain-sensitive, potassium-dependent activity of theNa/K pump complex. Representative images of histochemicallabeling for Na/K pump activity in WT and +/Lc cerebellar
cortex at P15 and P25 are shown in Figure 5. The imagesof both the wild type and +/Lc cerebella are taken at thesame magnification, but the +/Lc cerebella is smaller at P15and dramatically reduced in size by P25 compared to WTbecause of ongoing (and by P25, extensive) +/Lc Purkinje andgranule cell death. Quantitative analysis of in situ ouabain-sensitive Na/K pump activity in histological sections of wildtype and +/Lc cerebellar sections at P15 and P25 shows thatthe overall density of active Na/K pump in the molecular andgranule cell layers is within WT levels at P15 (ML; ANOVA𝐹1,9= 0.467, 𝑃 > 0.1; GCL; ANOVA 𝐹
1,9= 0.47, 𝑃 > 0.1)
but decreases by P25 in both the +/Lc molecular layer ( ML:ANOVA 𝐹
3,16= 11.9, 𝑃 < 0.003) and granule cell layer (GCL:
ANOVA𝐹3,16= 19.4,𝑃 < 0.001; Figures 5(e) and 5(f)). In situ
active Na/K pump density is expressed as a percent of WTvalues at either P15 or P25. Cerebellar slices from WT and+/𝐿𝑐mice at P15 and P25 were processed on separate days soit was not possible to compare densitometric density betweenP15 and P25.
At P15, significant numbers of +/Lc Purkinje cells arestill present, so we assume that the Na/K pump activitymeasurements in themolecular layer reflects pump activity inPurkinje cells dendrites in addition to other cellular elementsin the molecular layer. Therefore, at P15 all of the measure-ments were made in the molecular and granule cell layers oflobes III and IV as representative areas. However, by P25most+/Lc Purkinje cells have degenerated in anterior and centrallobules, but approximately 40 to 50% of the +/Lc Purkinje

8 International Journal of Cell Biology
ML
GCL
(a)
ML
GCL
(b)
ML
GCL
(c)
GCL
ML
(d)
P15 ML P15 GCL0
20
40
60
80
100
120
140
Chan
ge fr
om W
T ac
tivity
(%)
Wild type+/Lc-ant. lobules+/Lc-nodulus
(e)
P25 ML P25 GCL0
20
40
60
80
100
120
140
Chan
ge fr
om W
T ac
tivity
(%)
Wild type+/Lc-ant. lobules+/Lc-nodulus
(f)
Figure 5: Histochemical assay for ouabain-sensitive Na/K pump activity in P15 (a), (b) and P25 (c), (d)WT and +/Lc cerebellar sections.Theresults of densitometric measurements of the molecular (ML) and granule cell layers (GCL) are expressed as a percent of wild type activitylevels either at P15 (e) or P25 (f). At P25, densitometric measurements were made in both anterior lobules of the cerebellum and the nodulus.Scale bars: 200 𝜇m.

International Journal of Cell Biology 9
cells persist in the nodulus [36]. To determine if there is adifference in Na/K pump activity between cerebellar regionswith fewPurkinje cells versus regionswith surviving Purkinjecells, Na/K pump activity measurements at P25 were madein the molecular and granule cell layers of lobules III and IVversus X (the nodulus) in control and +/Lc mutant cerebella(Figure 5(f)). Following the activity measurements, the samesections were stained with cresyl violet to verify the presenceof +/Lc Purkinje cells. While only a few Purkinje cells werefound throughout lobules III and IV, the density of survivingPurkinje cells in the regions of the nodulus analyzed forNa/K pump activity was noticeably higher (data not shown).However, the preferential survival of +/LcPurkinje cells in thenodulus did not appear to affect the overall decline in Na/Kpump activity observed at P25 in the +/Lc cerebella in boththe molecular and granule cell layers.
5. Discussion
The Lurcher mutation in GluR𝛿2 converts this enigmaticglutamate receptor into a constitutively open cation channelthat chronically depolarizes +/Lc Purkinje cells as theymature following the first week of postnatal development[20, 22]. The cation leak in +/Lc Purkinje cells is thoughtto initiate excitotoxic cell death pathways [19]. One assump-tion of excitotoxic mechanisms is that the ionic imbalanceresulting fromoverstimulation of glutamate receptors and theresulting influx of Na+ and Ca++ ions places overwhelmingstress on cellular energy metabolism systems [17, 18]. In+/Lc Purkinje cells, in particular, mitochondrial cytochromeoxidase activity is significantly increased, possibly in responseto increased cellular energy requirements [26]. The goal ofthis study was to test the hypothesis that Na+/K+ ATPase 𝛼3isoform expression and the density of active Na/K pumps areincreased in +/Lc Purkinje cells. This increase would be con-sistent with an increased demand for ATP production (andincreased cytochrome oxidase activity) to counterbalance theGluR𝛿2Lc Na+ and Ca++ leak current. However, the resultsindicate that while the expression of the catalytic 𝛼3 isoformmay be increased in individual +/LcPurkinje cells, the densityof activeNa/Kpumps is not significantly increased abovewildtype levels in the cerebella of younger +/Lc mutants (P10 toP15). Furthermore, by 25, overall expression levels of the 𝛼3isoform and its 40 kD breakdown product are decreased inthe +/Lc cerebellum compared to WT, along with a decreasein the density of active Na/K pumps. The lower cerebellarexpression levels of the 𝛼3 isoform and decreased density ofactive Na/K pumps by P25 in the +/Lc cerebellummay simplyreflect the substantial loss of +/Lc Purkinje and granule cellsby this age. While the results indicate that the density ofactiveNa/Kpumpunits are not significantly increased in+/LcPurkinje cells in response to the leak current, it is importantto note that in this study we have not analyzed the in vivo unitactivity of Na/K pumps in living +/Lc Purkinje cells.
5.1. Expression of the Na/K Pump 𝛼3 Subunit in Depolarized+/Lc Purkinje Cells. In this study, initial immunohistochem-ical studies of the expression pattern of the primary subunits
of the Na/K pump expressed in cerebellar Purkinje cells, the𝛼3, and 𝛽1 isoforms suggested that only the expression of thecatalytic 𝛼3 subunit is altered in the +/Lc cerebellar cortex.The change in expression of the 𝛼3 isoform in +/Lc Purkinjecells was subsequently analyzed by fluorescent immunolabel-ing to provide information about subunit localization. Thesignificant increase in the intensity of immunofluorescencefor the 𝛼3 subunit from P10 through P25 (Figure 3) in +/LcPurkinje cells indicates either that there is an increase inthe density of the protein or that the localization of thesubunit is altered within each +/Lc Purkinje cell as theirdendrites and cell bodies degenerate. The Western blot datashows that the total cerebellar levels of both the native 𝛼3subunit and its 40 kD cleavage product are not significantlyaltered from P10 to P15 in the +/Lc cerebella compared toWT and their levels do not subsequently increase throughP25 as inWT cerebella.While both immunofluorescence andWestern blot techniques provide important complementaryqualitative and quantitative information about the pattern ofprotein expression, the results need to be interpreted withcaution because of their inherent limitations. The significantincrease in the intensity of immunofluorescence for the𝛼3 subunit in +/Lc Purkinje cells suggests that there isan increase in the density of the protein within individualPurkinje cells. However, it is not possible to distinguishbetween the possibilities that there is an increase in theexpression of the 𝛼3 subunit or that the localization of thesubunit is altered as +/Lc Purkinje cells fail to differentiate(especially their dendrites) and eventually degenerate. TheWestern blot data appears to favor the latter hypothesissince the only significant difference in 𝛼3 expression is arelative decrease at P25 in +/Lc cerebella when 70–90% ofthe +/Lc Purkinje cells and 60% of the granule cells havedegenerated [24, 36]. It is also important to consider that +/LcPurkinje cells are degenerating from at least P10 onwardswithapproximately 50% of the +/Lc Purkinje cells missing by P13to P15 [24]. Given that the intensity of immunolabeling forthe subunit within each +/Lc Purkinje cell steadily increasesfrom P10 through P25 (Figure 3), it is possible that 𝛼3 proteinlevels may actually steadily increase within individual +/LcPurkinje cells, but the overall expression levels in the cere-bellum may not significantly change because of the ongoingloss of +/𝐿𝑐 Purkinje cells. Thus, even at P25, 𝛼3 subunitexpression levels may be significantly increased within thestunted dendritic trees characteristic of +/Lc Purkinje cells,but overall cerebellar 𝛼3 levels may have declined overallbecause most Purkinje cells have died by this time.
While the immunohistochemistry and Western blot dataare consistent with a change in the density of Na/K pumpswithin individual Purkinje cells, these results do not indicatehow these changes may translate into alterations in pumpactivity. A previous study of adult acutely dissociated ratthalamic neurons depolarized by exposure to veratridine ormonensin found that the resulting Na+ influx resulted in anincrease in Na/K pump density and in the level of phospho-rylated pump molecules (implying increased pump activity;[37]). In the chronic Na+ leak in developing +/Lc Purkinjecells in this study, the evidence suggests that the density ofactive Na/K pumps is not altered in the +/Lc cerebellar cortex
10 International Journal of Cell Biology
until after P15. At P15, there is no significant difference inthe density of histochemically measured, ouabain-sensitiveactive Na/K pumps between the molecular layers of wild typeand +/Lc cerebella. By P25, there is a significant decreasein the density of molecular layer active Na/K pumps, bothin anterior lobules with virtually no Purkinje cells or thenodulus with relatively higher numbers of surviving +/LcPurkinje cells.
The diffuse pattern of Na/K pump activity in the +/Lccerebellar cortex is in stark contrast to the distribution ofcytochrome oxidase (COX) histochemical staining at thesame ages [26]. Individual +/𝐿𝑐 Purkinje cells at P15 andP25 stain darkly for COX, filling the entire Purkinje cellbody and dendritic tree. The dramatic increase in COXactivity suggests that the mitochondrial respiratory pathwayis upregulated to produce more ATP. If the density of activeNa/K pumps had been increased in response to the chronicNa+ influx in +/Lc Purkinje cells it seems reasonable to expectthat the intensity of the histochemical labeling would haveincreased along Purkinje cell dendriticmembranes. However,the staining pattern for Na/K pump activity remained diffusein the +/Lc cerebellar cortex, with no evidence of discretepatches of labeling corresponding to the patchy labelingfor 𝛼3 subunit observed in fluorescently labeled sections.The discrepancy between the distribution of 𝛼3 subunitsdetected by immunofluorescence and the pattern of Na/Kpump histochemical activity could be due to limitations inthe spatial resolution of the histochemical staining or some ofthe 𝛼3 immunolabeling labeling could represent deactivatedNa/K pumps, including the 40 kD 𝛼3 cleaved isoform. In amouse model of focal cerebral ischemia, no changes werefound in protein or mRNA levels for Na/K pump isoforms[12], but the level of Na/K pump activity was decreasedalong with a change in ouabain sensitivity, indicating that thedecrease in activity was due to intrinsic modifications of theATPase pump.
There are a number of mechanisms that can reduce orirreversibly block Na/K pump activity. Na/K pump isoformsare routinely recycled by internalization in lysosomes anddegradation by lysosomal cathepsin D [31, 38]. However,the membrane bound Na/K pump complex can also beinactivated by the calpain-mediated cleavage of the scaf-folding protein, ankyrin, that binds the Na/K pump tothe membrane skeleton [39] or by degradation of Na/Kpump isoforms themselves [31]. When oxidized, Na/K pumpisoforms become more sensitive to intracellular proteinasesand activated calpain will cleave the 𝛼3 isoform into a 40 kDdegradation product [31]. In this study, the amount of the110 kD native 𝛼3 subunit and 40 kD degradation productincreases in WT cerebella through P25 suggesting that asignificant fraction of the native 𝛼3 subunit is oxidized anddegraded by calpain in normal cerebellar tissue. Calpain hasrecently been shown to be active in individual, isolated +/LcPurkinje cells at P14 based on immunolabeling for the 136 kDfragment of 𝛼-spectrin cleaved by calpain [19]. In this study,despite the loss of significant numbers of +/LcPurkinje cells atP15, there is no significant reduction in the levels of the 40 kDband in +/Lc cerebella until P25, when most Purkinje andgranule cells have degenerated. As in the case of the 110 kD
native 𝛼3 subunit, it is possible that the amount of the 40 kDdegradation is increased in individual +/Lc Purkinje cells atP15 and P25, but total amounts are within control levels atP15 and significantly decreased at P25 because of the ongoing+/Lc Purkinje cell loss. +/Lc Purkinje cell degeneration isassociated with an increase in oxidative stress, including anincrease inmitochondrial cytochrome oxidase activity, whichmay generate more reactive oxygen species as a byproductof increased respiratory activity. The results do not indicatethat there is a dramatic increase in oxidized forms of the𝛼3 subunit by P15 in the +/Lc cerebellum since there is nota significant increase in levels of the 40 kD byproduct, butthe results are consistent with sustained proteolysis of the𝛼3 subunit by calpain in +/Lc Purkinje cells until most havedegenerated.
Na/K pump activity is also regulated by nitric oxide(NO)-cGMP [10] or NO-PKG pathways [40] and inhibitedby peroxynitrite through the formation of nitrotyrosine orthemodification of cysteine residues [15, 16]. Previous studiesof +/Lc Purkinje cells have shown that their degenerationis associated with increased expression of neuronal nitricoxide synthase andnitrotyrosine [25]. Since theNa/Kpump issensitive to peroxynitrite and NO, we hypothesize that whilethe cation leak increases the expression of the catalytic 𝛼3isoform, interactions with peroxynitrite, NO/PKG, and/orNO/cGMP reduce the density of active Na/K pumps. Areduction in the density of active Na/K pumps in +/LcPurkinje cells may contribute to a Na+ overload in theseneurons and exacerbate the cell death process, since increasesin intracellular Na+ have been associated with induction ofapoptosis [5, 41].
6. Conclusion
The analysis of the distribution and activity of the Na/Kpump in this study of degenerating +/Lc Purkinje cellsdemonstrates that while the expression and/or distributionof the 𝛼3 subunit is disrupted in the cerebellar cortex ofthe +/Lc mutant, there is no evidence to suggest that thedensity of active pumps is increased in response to theconstitutive influx of Na+ ions through the mutant GluR𝛿2Lcchannels. We had hypothesized that Na/K pump activitywould be stimulated as a homeostatic response to the Na+ion influx. The lack of evidence for an increased densityof functional Na/K pumps does not rule out the possibilitythat the activity of individual pumps is increased withineach +/Lc Purkinje cell, thereby stimulating an increaseddemand for ATP which would eventually lead to depletionof cellular energy resources. The Na/K pump is estimated touse up to 50% of the ATP produced by neurons [42]. Na+ isnormally the rate-limiting factor in Na/K pump activity [43–45] and elevations in the concentration of Na+ within +/LcPurkinje cells may increase the activity of individual pumpsbecause of amore complete saturation of itsNa+ binding sites.Thus, while there may be an increased ATP consumptionin +/Lc Purkinje cells because of the increased activity ofindividual pumps, this study suggests that any increase inNa/K pump activity and ATP consumption is not due to an

International Journal of Cell Biology 11
overall increase in the density of active ATPase pumps inchronically depolarized Purkinje cells.
Conflict of Interests
The authors declare that they have no conflict of interestsassociated with this paper.
Acknowledgments
This work was supported by NIH Grant NS 34309 to MichaelW.Vogel.The authorswould like to thankDr.AdamPuche forhis assistance with the acquisition and analysis of microscopydata. The authors also thank Carol Armstrong, MichisukeYuzaki, and Jun Nishiyama for their helpful comments inthe preparation of the paper. This paper was prepared whileMWV was employed at the University of Maryland Schoolof Medicine. The opinions expressed in this paper are theauthor’s own and do not reflect the view of the NationalInstitutes of Health, the Department of Health and HumanServices, or the United States government.
References
[1] R. F. Rakowski, D. C. Gadsby, and P. De Weer, “Stoichiometryand voltage dependence of the sodium pump in voltage-clamped, internally dialyzed squid giant axon,” Journal ofGeneral Physiology, vol. 93, no. 5, pp. 903–941, 1989.
[2] L. R. Molnar, K. A. Thayne, W. W. Fleming, and D. A. Taylor,“The role of the sodium pump in the developmental regulationof membrane electrical properties of cerebellar Purkinje neu-rons of the rat,” Developmental Brain Research, vol. 112, no. 2,pp. 287–291, 1999.
[3] S. Genet and R. T. Kado, “Hyperpolarizing current of theNa/K ATPase contributes to the membrane polarization ofthe Purkinje cell in rat cerebellum,” Pflugers Archiv EuropeanJournal of Physiology, vol. 434, no. 5, pp. 559–567, 1997.
[4] K. Geering, P. Beguin, H. Garty et al., “FXYD proteins: newtissue- and isoform-specific regulators of Na,K-ATPase,”Annalsof theNewYorkAcademy of Sciences, vol. 986, pp. 388–394, 2003.
[5] M. I. Panayiotidis, C. D. Bortner, and J. A. Cidlowski, “On themechanism of ionic regulation of apoptosis: would the Na+/K+-ATPase please stand up?” Acta Physiologica, vol. 187, no. 1-2, pp.205–215, 2006.
[6] K. Geering, “Functional roles of Na, K-ATPase subunits,”Current Opinion in Nephrology and Hypertension, vol. 17, no. 5,pp. 526–532, 2008.
[7] L. Peng, P. Martin-Vasallo, and K. J. Sweadner, “Isoforms ofNa,K-ATpase 𝛼 and 𝛽 subunits in the rat cerebellum and ingranule cell cultures,” Journal of Neuroscience, vol. 17, no. 10, pp.3488–3502, 1997.
[8] M. S. Feschenko, C. Donnet, R. K. Wetzel, N. K. Asinovski, L.R. Jones, and K. J. Sweadner, “Phospholemman, a single-spanmembrane protein, is an accessory protein of Na,K-ATPase incerebellum and choroid plexus,” Journal of Neuroscience, vol. 23,no. 6, pp. 2161–2169, 2003.
[9] X. Q. Wang, A. Y. Xiao, C. Sheline et al., “Apoptotic insultsimpair Na+, K+-ATPase activity as a mechanism of neuronaldeath mediated by concurrent ATP deficiency and oxidant
stress,” Journal of Cell Science, vol. 116, no. 10, pp. 2099–2110,2003.
[10] D. Z. Ellis, J. Rabe, and K. J. Sweadner, “Global loss of Na,K-ATPase and its nitric oxide-mediated regulation in a transgenicmouse model of amyotrophic lateral sclerosis,” Journal ofNeuroscience, vol. 23, no. 1, pp. 43–51, 2003.
[11] W. C. Golden and L. J. Martin, “Low-dose ouabain protectsagainst excitotoxic apoptosis and up-regulates nuclear Bcl-2 invivo,” Neuroscience, vol. 137, no. 1, pp. 133–144, 2006.
[12] I. Jamme, O. Barbey, P. Trouve et al., “Focal cerebral ischaemiainduces a decrease in activity and a shift in ouabain affinity ofNa+, K+-ATPase isoforms without modifications in mRNA andprotein expression,”Brain Research, vol. 819, no. 1-2, pp. 132–142,1999.
[13] A. Y. Xiao, X. Q.Wang, A. Yang, and S. P. Yu, “Slight impairmentof Na+,K+-ATPase synergistically aggravates ceramide- and 𝛽-amyloid-induced apoptosis in cortical neurons,”Brain Research,vol. 955, no. 1-2, pp. 253–259, 2002.
[14] J. A. Nathanson, C. Scavone, C. Scanlon, and M. McKee, “Thecellular Na+ pump as a site of action for carbon monoxide andglutamate: a mechanism for long-term modulation of cellularactivity,” Neuron, vol. 14, no. 4, pp. 781–794, 1995.
[15] W. C. Golden, A. M. Brambrink, R. J. Traystman, D. H.Shaffner, and L. J. Martin, “Nitration of the striatal Na,K-ATPase 𝛼3 isoform occurs in normal brain development butis not increased during hypoxia-ischemia in newborn piglets,”Neurochemical Research, vol. 28, no. 12, pp. 1883–1889, 2003.
[16] M. S. Reifenberger, K. L. Arnett, C. Gatto, and M. A. Milan-ick, “The reactive nitrogen species peroxynitrite is a potentinhibitor of renal Na-K-ATPase activity,” American Journal ofPhysiology—Renal Physiology, vol. 295, no. 4, pp. F1191–F1198,2008.
[17] A. Mehta, M. Prabhakar, P. Kumar, R. Deshmukh, and P. L.Sharma, “Excitotoxicity: bridge to various triggers in neurode-generative disorders,” European Journal of Pharmacology, vol.698, no. 1–3, pp. 6–18, 2012.
[18] Y. Wang and Z.-H. Qin, “Molecular and cellular mechanisms ofexcitotoxic neuronal death,” Apoptosis, vol. 15, no. 11, pp. 1382–1402, 2010.
[19] J. Nishiyama, K. Matsuda, W. Kakegawa et al., “Reevaluation ofneurodegeneration in lurchermice: constitutive ion fluxes causecell death with, not by, autophagy,” Journal of Neuroscience, vol.30, no. 6, pp. 2177–2187, 2010.
[20] J. Zuo, P. L. De Jager, K. A. Takahashi, W. Jiang, D. J. Linden,and N. Heintz, “Neurodegeneration in Lurcher mice caused bymutation in 𝛿2 glutamate receptor gene,” Nature, vol. 388, no.6644, pp. 769–773, 1997.
[21] J. Nishiyama and M. Yuzaki, “Excitotoxicity and autophagy:lurcher may not be a model of “autophagic cell death”,”Autophagy, vol. 6, no. 4, pp. 568–570, 2010.
[22] F. Selimi, A. M. Lohof, S. Heitz et al., “Lurcher GRID2-induceddeath and depolarization can Be dissociated in cerebellarPurkinje cells,” Neuron, vol. 37, no. 5, pp. 813–819, 2003.
[23] M.W. Vogel, J. Caston, M. Yuzaki, and J. Mariani, “The Lurchermouse: fresh insights from an old mutant,” Brain Research, vol.1140, no. 1, pp. 4–18, 2007.
[24] K. W. Caddy and T. J. Biscoe, “Structural and quantitativestudies on the normal C3H and Lurcher mutant mouse,”Philosophical transactions of the Royal Society of London B, vol.287, no. 1020, pp. 167–201, 1979.
12 International Journal of Cell Biology
[25] R. McFarland, A. Blokhin, J. Sydnor, J. Mariani, and M. W.Vogel, “Oxidative stress, nitric oxide, and themechanisms of celldeath in Lurcher Purkinje cells,” Developmental Neurobiology,vol. 67, no. 8, pp. 1032–1046, 2007.
[26] M. W. Vogel, H. Fan, J. Sydnor, and P. Guidetti, “Cytochromeoxidase activity is increased in +/Lc Purkinje cells destined todie,” NeuroReport, vol. 12, no. 14, pp. 3039–3043, 2001.
[27] H. S. Zanjani, A. M. Lohof, R. McFarland, M. W. Vogel, and J.Mariani, “Enhanced survival of wild-type and Lurcher Purkinjecells in vitro following inhibition of conventional PKCs orstress-activated MAP kinase pathways,” Cerebellum, vol. 12, no.3, pp. 377–389, 2012.
[28] N. Dumesnil-Bousez and C. Sotelo, “Early development of theLurcher cerebellum: purkinje cell alterations and impairment ofsynaptogenesis,” Journal of Neurocytology, vol. 21, no. 7, pp. 506–529, 1992.
[29] L.-O. Klotz, P. Schroeder, and H. Sies, “Peroxynitrite signaling:receptor tyrosine kinases and activation of stress-responsivepathways,” Free Radical Biology and Medicine, vol. 33, no. 6, pp.737–743, 2002.
[30] M. Minetti, C. Mallozzi, and A. M. M. Di Stasi, “Peroxynitriteactivates kinases of the src family and upregulates tyrosinephosphorylation signaling,” Free Radical Biology and Medicine,vol. 33, no. 6, pp. 744–754, 2002.
[31] N. Zolotarjova, C. Ho, R. L. Mellgren, A. Askari, and W.-H.Huang, “Different sensitivities of native and oxidized formsof Na+/K+-ATPase to intracellular proteinases,” Biochimica etBiophysica Acta, vol. 1192, no. 1, pp. 125–131, 1994.
[32] K. Inomata, H. Mayahara, K. Fujimoto, and K. Ogawa,“Ultrastructural localization of ouabain-sensitive potassium-dependant p-nitrophenylphosphate (Na+-K+-ATPase) activityin hte central nervous system of the rat,” Acta HistochemicaCytochemica, vol. 16, no. 3, pp. 277–285, 1983.
[33] W. C. Golden, A. M. Brambrink, R. J. Traystman, and L. J.Martin, “Failure to sustain recovery of Na,K-ATPase functionis a possible mechanism for striatal neurodegeneration inhypoxic-ischemic newborn piglets,” Molecular Brain Research,vol. 88, no. 1-2, pp. 94–102, 2001.
[34] F. Selimi, M. W. Vogel, and J. Mariani, “Bax inactivation inLurcher mutants rescues cerebellar granule cells but not Purk-inje cells or inferior olivary neurons,” Journal of Neuroscience,vol. 20, no. 14, pp. 5339–5345, 2000.
[35] M. L. Doughty, P. L. De Jager, S. J. Korsmeyer, and N. Heintz,“Neurodegeneration in Lurcher mice occurs via multiple celldeath pathways,” Journal of Neuroscience, vol. 20, no. 10, pp.3687–3694, 2000.
[36] C. A. Duffin, R. McFarland, J. R. Sarna, M. W. Vogel, and C. L.Armstrong, “Heat shock protein 25 expression and preferentialpurkinje cell survival in the lurcher mutant mouse cerebellum,”Journal of Comparative Neurology, vol. 518, no. 11, pp. 1892–1907,2010.
[37] V. V. Senatorov, P. K. Stys, and B. Hu, “Regulation of Na+,K+-ATPase by persistent sodium accumulation in adult rat thalamicneurones,” Journal of Physiology, vol. 525, no. 2, pp. 343–353,2000.
[38] J. S. Cook, E. H. Tate, and C. Shaffer, “Uptake of [3H]ouabainfrom the cell surface into the lysosomal compartment of HeLacells,” Journal of Cellular Physiology, vol. 110, no. 1, pp. 84–92,1982.
[39] J. Inserte, D. Garcia-Dorado, V. Hernando, and J. Soler-Soler,“Calpain-mediated impairment ofNa+/K+-ATPase activity dur-ing early reperfusion contributes to cell death after myocardialischemia,”Circulation Research, vol. 97, no. 5, pp. 465–473, 2005.
[40] D. Gonzalez-Forero, F. Portillo, L. Gomez, F. Montero, S. Kas-parov, and B. Moreno-Lopez, “Inhibition of resting potassiumconductances by long-termactivation of theNO/cGMP/proteinkinase G pathway: a new mechanism regulating neuronalexcitability,” Journal of Neuroscience, vol. 27, no. 23, pp. 6302–6312, 2007.
[41] L. Kiedrowski, “Critical role of sodium in cytosolic [Ca2+]elevations in cultured hippocampal CA1 neurons during anoxicdepolarization,” Journal of Neurochemistry, vol. 100, no. 4, pp.915–923, 2007.
[42] A. Ames III, “CNS energy metabolism as related to function,”Brain Research Reviews, vol. 34, no. 1-2, pp. 42–68, 2000.
[43] R. S. Haber, T. A. Pressley, J. N. Loeb, and F. Ismail-Beigi, “Ionicdependence of active Na-K transport: “Clamping” of cellularNa+ with monensin,” American Journal of Physiology—RenalFluid and Electrolyte Physiology, vol. 253, no. 1, pp. F26–F33,1987.
[44] M. Nakao and D. C. Gadsby, “[Na] and [K] dependence ofthe Na/K pump current-voltage relationship in guinea pigventricularmyocytes,” Journal of General Physiology, vol. 94, no.3, pp. 539–565, 1989.
[45] N. Inoue and H. Matsui, “Activation of a brain type Na pumpafter glutamate excitation of cerebral neurons,” Brain Research,vol. 534, no. 1-2, pp. 309–312, 1990.

Submit your manuscripts athttp://www.hindawi.com
Hindawi Publishing Corporationhttp://www.hindawi.com Volume 2014
Anatomy Research International
PeptidesInternational Journal of
Hindawi Publishing Corporationhttp://www.hindawi.com Volume 2014
Hindawi Publishing Corporation http://www.hindawi.com
International Journal of
Volume 2014
Zoology
Hindawi Publishing Corporationhttp://www.hindawi.com Volume 2014
Molecular Biology International
Hindawi Publishing Corporationhttp://www.hindawi.com
GenomicsInternational Journal of
Volume 2014
The Scientific World JournalHindawi Publishing Corporation http://www.hindawi.com Volume 2014
Hindawi Publishing Corporationhttp://www.hindawi.com Volume 2014
BioinformaticsAdvances in
Marine BiologyJournal of
Hindawi Publishing Corporationhttp://www.hindawi.com Volume 2014
Hindawi Publishing Corporationhttp://www.hindawi.com Volume 2014
Signal TransductionJournal of
BioMed Research International
Hindawi Publishing Corporationhttp://www.hindawi.com Volume 2014
Evolutionary BiologyInternational Journal of
Hindawi Publishing Corporationhttp://www.hindawi.com Volume 2014
Hindawi Publishing Corporationhttp://www.hindawi.com Volume 2014
Biochemistry Research International
ArchaeaHindawi Publishing Corporationhttp://www.hindawi.com Volume 2014
Hindawi Publishing Corporationhttp://www.hindawi.com Volume 2014
Genetics Research International
Hindawi Publishing Corporationhttp://www.hindawi.com Volume 2014
Advances in
Virolog y
Hindawi Publishing Corporationhttp://www.hindawi.com
Nucleic AcidsJournal of
Volume 2014
Stem CellsInternational
Hindawi Publishing Corporationhttp://www.hindawi.com Volume 2014
Hindawi Publishing Corporationhttp://www.hindawi.com Volume 2014
Enzyme Research
Hindawi Publishing Corporationhttp://www.hindawi.com Volume 2014
International Journal of
Microbiology