Changes in the electromyographic spectrum power distribution caused by a progressive increase in the...
11
Eur J Appl Physiol (1995) 71:113-123 © Springer-Verlag 1995 Martin Bilodeau. Marco Cincera' Sylvie Gervais A. Bertrand Arsenault" Denis Gravel. Yves Lepage Patricia McKinley Changes in the electromyographic spectrum power distribution caused by a progressive increase in the force level Accepted: 3 November 1994 Abstract The purpose of the present study was to de- termine the specific changes occurring in the power spectrum with an increasing force level during isomet- ric contractions. Surface electromyographic signals of the triceps brachii (TB) and the anconeus (AN) of 29 normal subjects were recorded during isometric ramp contractions performed from 0 to 100% of the max- imum voluntary contraction (MVC) in a 5-s period. Power spectra were obtained at 10, 20, 30, 40, 50, 60, 70, 80 and 90% MVC. Changes in the shape of these spectra were evaluated visually and with the calcu- lation of several statistical parameters related to the distribution of power along the frequency axis, such as median frequency and mean power frequency, standard deviation, skewness, first and third quartiles and half- power range. For the AN, the behaviour of the spec- trum was relatively similar across subjects, presenting a shift toward higher frequencies without any major change in the shape of the spectrum. For the TB, subjects with a thin skinfold thickness presented similar behaviours. In subjects with a thicker skinfold, how- ever, a loss of power in the high frequency region M. Bilodeau • A.B. Arsenault • D. Gravel School of Rehabilitation, Faculty of Medicine; University of Montreal, Montreal, Quebec, Canada M. Bilodeau • A.B. Arsenault (1~) . D. Gravel Research Centre, Montreal Rehabilitation Institute, 6300 Darlington Avenue, Montreal, Quebec, Canada H3S 2J4 M. Cincera Centro di Bioingegneria, Politecnico, Fondazione Pro Juventute, Milan, Italy S. Gervais . Y. Lepage Department of Mathematics and Statistics, Faculty of Arts and Sciences, University of Montreal, Montreal, Quebec, Canada M. Cincera . P. McKinley School of Physical and Occupational Therapy, Faculty of Medicine, McGill University, Montreal, Quebec, Canada paralleled the increase in the force level. Significant correlations were obtained between the extent of the change in the value of higher order statistical para- meters across force and the thickness of the skin. This points out the importance of the skinfold layer when recording with surface electrodes. Furthermore, the use of a combination of several parameters appears to provide a better appreciation of the changes occurring in the spectrum than any single parameter taken alone. Key words Electromyographic (EMG) signals • Power spectral analysis • Muscular contraction • Gender - Tissue filtering Introduction An increase in the value of either the mean power frequency (MPF) or the median frequency (MF) of the power spectrum of electromyographic (EMG) signals with an increasing level of effort is a frequent observa- tion (see Bilodeau et al. 1991 for review). Such an increase in the value of these two central tendency parameters is believed to reflect the additional recruit- ment of larger diameter fibres as the force is raised (Bilodeau et al. 1990; Hagberg and Ericson 1982; Mori- tani and Muro 1987; Roy et al. 1986). Because larger fibres have higher conduction velocity than smaller fibres (Masuda and De Luca 1991), and these larger fibres are stereotypically recruited after smaller ones (Sypert and Munson 1981), the average muscular con- duction velocity will go up as the force level is in- creased. In turn, since the MPF and the MF of the EMG power spectrum are linearly related to the con- duction velocity (Stulen and De Luca 1981), their value will also increase. In fact, Solomonow et al. (1990) have shown experimentally that the increase in the value of the MF was directly associated with the recruitment of larger diameter fibres, whereas an increase in the firing
-
Upload
independent -
Category
Documents
-
view
2 -
download
0
Transcript of Changes in the electromyographic spectrum power distribution caused by a progressive increase in the...

Eur J Appl Physiol (1995) 71:113-123 © Springer-Verlag 1995
Martin Bilodeau. Marco Cincera' Sylvie Gervais A. Bertrand Arsenault" Denis Gravel. Yves Lepage Patricia McKinley
Changes in the electromyographic spectrum power distribution caused by a progressive increase in the force level
Accepted: 3 November 1994
Abstract The purpose of the present study was to de- termine the specific changes occurring in the power spectrum with an increasing force level during isomet- ric contractions. Surface electromyographic signals of the triceps brachii (TB) and the anconeus (AN) of 29 normal subjects were recorded during isometric ramp contractions performed from 0 to 100% of the max- imum voluntary contraction (MVC) in a 5-s period. Power spectra were obtained at 10, 20, 30, 40, 50, 60, 70, 80 and 90% MVC. Changes in the shape of these spectra were evaluated visually and with the calcu- lation of several statistical parameters related to the distribution of power along the frequency axis, such as median frequency and mean power frequency, standard deviation, skewness, first and third quartiles and half- power range. For the AN, the behaviour of the spec- trum was relatively similar across subjects, presenting a shift toward higher frequencies without any major change in the shape of the spectrum. For the TB, subjects with a thin skinfold thickness presented similar behaviours. In subjects with a thicker skinfold, how- ever, a loss of power in the high frequency region
M. Bilodeau • A.B. Arsenault • D. Gravel School of Rehabilitation, Faculty of Medicine; University of Montreal, Montreal, Quebec, Canada
M. Bilodeau • A.B. Arsenault (1~) . D. Gravel Research Centre, Montreal Rehabilitation Institute, 6300 Darlington Avenue, Montreal, Quebec, Canada H3S 2J4
M. Cincera Centro di Bioingegneria, Politecnico, Fondazione Pro Juventute, Milan, Italy
S. Gervais . Y. Lepage Department of Mathematics and Statistics, Faculty of Arts and Sciences, University of Montreal, Montreal, Quebec, Canada
M. Cincera . P. McKinley School of Physical and Occupational Therapy, Faculty of Medicine, McGill University, Montreal, Quebec, Canada
paralleled the increase in the force level. Significant correlations were obtained between the extent of the change in the value of higher order statistical para- meters across force and the thickness of the skin. This points out the importance of the skinfold layer when recording with surface electrodes. Furthermore, the use of a combination of several parameters appears to provide a better appreciation of the changes occurring in the spectrum than any single parameter taken alone.
Key words Electromyographic (EMG) signals • Power spectral analysis • Muscular contraction • Gender - Tissue filtering
Introduction
An increase in the value of either the mean power frequency (MPF) or the median frequency (MF) of the power spectrum of electromyographi c (EMG) signals with an increasing level of effort is a frequent observa- tion (see Bilodeau et al. 1991 for review). Such an increase in the value of these two central tendency parameters is believed to reflect the additional recruit- ment of larger diameter fibres as the force is raised (Bilodeau et al. 1990; Hagberg and Ericson 1982; Mori- tani and Muro 1987; Roy et al. 1986). Because larger fibres have higher conduction velocity than smaller fibres (Masuda and De Luca 1991), and these larger fibres are stereotypically recruited after smaller ones (Sypert and Munson 1981), the average muscular con- duction velocity will go up as the force level is in- creased. In turn, since the MPF and the MF of the EMG power spectrum are linearly related to the con- duction velocity (Stulen and De Luca 1981), their value will also increase. In fact, Solomonow et al. (1990) have shown experimentally that the increase in the value of the MF was directly associated with the recruitment of larger diameter fibres, whereas an increase in the firing
114
rate of the motor units did not affect this parameter. Furthermore, Gerdle et al. (1991) have reported that the relative importance of the increase in the value of the M P F with force is significantly associated with the varying fibre type content of different subjects for a given muscle. Subjects with a higher percentage of type II fibres present more pronounced increases in the MPF with force than subjects with a lower type II fibre percentage. These two last studies and others (Gerdle et al. 1988; Moritani et al. 1985; Wretling et al. 1987) provide some evidence that the behaviour of the EMG power spectrum with increasing force has an interesting potential in discriminating muscular characteristics such as the fibre type content of a muscle.
Even though the MF and the MPF are commonly used interchangeably in the literature, the validity of these two central tendency parameters as measures of the distribution of power in the power spectrum might be questioned. From a statistical point of view, it could be argued that the MF is the better parameter to use because the power spectrum of EMG signals does not present the characteristics of a normal distribution; often it is skewed to the right (Duxbury et al. 1976; Moritani and Muro 1987; Sato 1982). The MF is de- fined as the frequency where the spectrum is divided in two parts of equal power, a condition which can be expressed mathematically in the following manner:
The MF is defined as:
S(f) df = S( f )d f = S(f)df (1) 0 M F
where S(f) is the power spectrum. From the above formula, it can be seen that this is
a zero-order parameter. Thus, all the frequency compo- nents are weighted equally. In contrast, the MPF com- prises moments of the first order, that is, the power at a given frequency is weighted (multiplied) by the nu- merical value of that frequency.
The MPF is defined as:
GO
~ f S ( f ) d f M P F - o
0(3
S(f) df 0
(2)
Because the power in the high frequency range is weighted to a greater extent when using the MPF, this parameter might be more sensitive and thus more ap- propriate to evaluate changes occurring in that portion of the spectrum (Hagg 1991). It is thus apparent from the basic properties of these two parameters that they should not be used interchangeably.
In order to adequately interpret modifications in the value of either the MF or MPF under specific experimental conditions, for instance when the force level is increased, the distribution of power in the spec- trum (shape) must be carefully examined. The specific
changes in the shape of the power spectrum that ex- plain the behaviour of the MPF and MF across force levels have yet to be thoroughly documented. The few papers dealing with this issue report a general shift of power toward higher frequencies, that is, a decrease of the relative power in the low frequency region (5-50 Hz) and an increase of the relative power in the high frequency region (50 Hz and higher) (Gan- der and Hudgins 1985; Komi and Viitasalo 1976; Viitasalo and Komi 1978). Put in other terms, there is no change per se in the general shape of the power spectrum; rather the whole distribution shifts slightly to the right on the frequency axis. In this situation, the MPF and MF could be considered appropriate para- meters to characterize changes occurring with increas- ing force, because the relative distribution of power, even though not normal, would be similar across differ- ent force levels.
However, in comparison to contractions performed at several different steady force levels (step contrac- tions), we previously reported that single contractions performed with a gradual increase in force (ramps) tend to maximize the observation of an increase in the value of the MPF or MF up to high force levels (Bilodeau et al. 1991). Such a finding has been reproduced by San- chez et al. (1992). The above-mentioned studies (Gan- der and Hudgins 1985; Komi and Viitasalo 1976; Viitasalo and Komi 1978) concerning changes in the shape of the power spectrum were all done using steady force level contractions. Because the increase in the value of the MPF or the MF of spectra obtained during linearly force increasing contractions is more pro- nounced than that obtained from steady force contrac- tion spectra, the former type of contraction would probably present either a more pronounced or a differ- ent pattern of change in the shape of the power spec- trum with increasing force. To our knowledge, only Moritani and Muro (1987) have reported changes in the shape of the power spectrum while using ramp-type contractions. Their data suggest that the increase in the MPF would be explained mostly by an increase of the relative power in the high frequency region of the spectrum. In their study, only a graphical representa- tion of the data of two subjects is shown, and thus, no definite conclusion can be drawn from these data. It could be speculated, however, that if non-homogeneous changes in the shape of the spectrum do occur across force levels, the use of a central tendency parameter such as the MPF or MF may not be an optimal measure to quantify these changes. Other parameters related to the distribution of power in the spectrum might thus be required in order to adequately interpret the data.
In a series of studies performed on two elbow exten- sors, the triceps brachii (TB) and the anconeus (AN), we also observed that the MPF and the MF of the power spectrum can present a different behaviour across force even though they are obtained from the same spectra
115
(Bilodeau et al. 1990, 1991, 1992a, b). More specifi- cally, the MF of the TB increased across in- creasing force levels, whereas its MPF stayed constant or even decreased in some cases. These different behav- iours were not noted for the AN. Because the skin layer overlying the TB is relatively thick compared to that overlying the AN, a different sensitivity of these two spectral parameters to the low-pass filter effect of this factor was put forward to explain these different behav- iours (Bilodeau et al. 1992a). The attenuation of the high frequency content of the signal caused by the skin layer would thus affect the MF and MPF differently. A preliminary report seems to confirm this point (Bi- lodeau et al. 1992c). To ascertain the role of skinfold thickness (low-pass filter), specific changes in the shape of the power spectrum have to be related directly to the different behaviours of both the MF and MPF. This could help to determine if one of these two parameters has a greater potential to estimate the distribution of power in the spectrum and consequently allow one to make a more enlightened choice between them. We also recently observed that men and women could present different MPF behaviours across force levels for certain muscles (Bilodeau et al. 1992a). In spite of the fact that dissimilarities in muscle fibre character- istics have been observed between men and women (Brooke and Engel 1969; Simoneau and Bouchard 1989), skinfold thickness was again put forward to explain the differences obtained between these two groups (Bilodeau et al. 1992a). Women tend to have a thicker skin layer than men over the TB. This could explain the observation of a lesser increase or even a decrease of the MPF with increasing force level for the women in contrast to the increase observed for men. Over the AN such men/women differences in skinfold thickness were not observed. Interestingly, nei- ther were differences in the behaviour of the MPF between the two groups. Nevertheless, a definite answer with regard to the specific effect of these two factors (gender versus skinfold thickness) has not yet been provided.
The purpose of the present study was thus to investigate the specific changes that are occurring in the EMG power spectrum of men and women when the force of the contraction is increased progress- ively (ramp). Changes in the spectra of both TB and AN were evaluated in order to elucidate the cause of the different behaviours of both spectral parameters be- tween these two muscles. In addition to the graphic representation of each spectrum, several parameters related to the statistical distribution of power were calculated in order to quantify thoroughly the changes in the spectrum. Such parameters could add important information with regard to the shape of the power spectrum that might not be given by the MF and MPF alone. An attempt was also made to separate the re- spective effect of skinfold thickness and gender on the power spectrum.
Methods
Thirteen men [mean (SD), range; 29.8 (7.1) years, 24M4; 1.77 (0.08) m, 1.66-1.93; 77.3 (ll.3)kg, 57.6 i01.8] and 16 women [28.1 (5.8) years, 21-44; 1.63 (0.05)m, 1.54-1.71; 57.1 (8.0)kg, 44.7-73.9] participated in this study. None of the subjects had any previous history of neuromuscular disorders. Each gave written informed consent prior to the experiment. Measures of the thickness of the skinfold over each muscle were taken with a Harpenden adipometer (John Bull British Indicators).
Our experimental set-up has been described in detail else- where (Bilodeau et al. 1990). Briefly, subjects were secured with belts at the shoulders and pelvis onto an adapted Cybex chair with the right arm and forearm supported horizontally. The elbow was main- tained at a 90 ° angle and the forearm placed midway between pronation and supination. The elbow joint was aligned with the axis of rotation of an isokinetic dynamometer (Cybex II, Lumex) and extension forces were recorded with a strain gauge type dynamom- eter mounted on the shaft of the isokinetic dynamometer (Knutsson and Martensson 1980).
Prior to the experimental task, the maximum voluntary contrac- tion (MVC) of each subject was estimated from three maximal efforts. Following a few practice trials, each subject had to perform at least three isometric elbow extensions with the force increasing linearly from 0 to 100% of the MVC, each in a 5-s period. A 2-min rest period was allowed between each contraction. Visual feedback of the force signal was provided to the subject on a monitor.
Surface EMG signals of the right TB and AN were recorded using pairs of modified miniature electrodes (Beckman) placed 6 mm apart, longitudinally along the muscle fibres. The ground electrode was placed over the right lateral epicondyle. Shaving and abrasion of the skin reduced the skin-electrode interface impedance to values lower than 10 kf~. EMG signals were pre-amplified and amplified (Teca PA62A and A6MK3, respectively; Common Mode Rejection Ratio = 90 dB, input impedance = 100 mr2, gain = 1000) with a fre- quency band ranging from 16 to 800 Hz and displayed on a screen (Nihon Kohden VC-680G) to allow their monitoring by visual inspection. These signals were digitized on-line with a sampling frequency of 2000 Hz using a data acquisition card (DAS-20 Met- rabyte) mounted in an AT computer or using a P D P l l \ 2 3 P L U S Digital computer. The data were stored on disk for further analysis.
Of the ramp contractions performed by each subject, only one was retained for further analyses. The contraction was chosen on the basis of the best (smoother) linear increase of force in time. The present analysis was performed only on single trials (no averaging across different contractions for a given subject) in order to prevent the possible loss of significant information that might be contained within the single power spectrum and that would be lost by aver- aging. The following analyses of the digitized EMG signals was performed on the P D P l l \ 2 3 P L U S computer. Nine specific force levels were studied, that is, 10, 20, 30, 40, 50, 60, 70, 80 and 90% MVC. For a specific force level, spectral analysis (Hamming window processing, 512 points, fast Fourier transform) was performed on three 256-ms windows overlapping each other by half their length for a total segment of 512 ms. An average power spectrum, represen- tative of a given force level, was thus obtained from this segment. From the average spectra, the following parameters were calculated: the MPF, the MF, the standard deviation [SD (f)], the skewness (ASYM), the 25th and 75th percentiles (F25 and F75) and the half-power range (HPR).
Those parameters were obtained according to formulae of the form described below (see introduction for the MPF and the MF).
The SD(f) (moment of order 2) is defined as:
!,lJl2

180-
The ASYM (moment of order 3) is defined a s :
j i S(f)~--~f (4)
The F25 (moment of order 0) is defined a s :
e2s
The F75 (moment of order 0) is defined a s :
F 7 5 3oo ! s( i l . i= ! (il ai (61
The HPR (moment of order zero) is simply defined as the value of the F75 minus the value of the F25. This parameter gives informa- tion with regards to the distribution of power (50%) around the MF.
Two-way analyses of variance (ANOVAs) with repeated measures on one factor (force) were used to depict the presence of significant differences between men and women (gender factor) and across increasing force levels (force factor) for every parameter. A level of significance of 0.05 was selected for these tests and for the interaction between the force and gender factors. For the force factor, the following five levels were retained in the analyses: 10, 30, 50, 70 and 90% MVC.
Simple linear correlations were performed between skinfold thick- ness and an estimate of the behaviour of each parameter across force levels. This estimate was calculated by fitting a linear regression line through the values, of a given parameter obtained at 10, 30, 50, 70 and 90% MVC. The slope of the regression line was calculated and used as a measure of the behaviour of a given parameter across force levels.
Covariance analyses were also performed on the skinfold and gender data. The covariance analysis allows for a better comparison for the effect of different factors, in the present case, gender and force, because additional information contained in a covariate, skinfold thickness in the present case, is used.
Results
The primary findings were that the parameters meas- ured showed different behaviours across force levels depending on the muscle. For the TB, skinfold thick- ness was an important factor in determining para- meters' behaviour as the force level was increased, while for the AN, it was not a significant component.
Parameter behaviour for the TB
Figure 1 illustrates the overall behaviour of the meas- ured parameters for men (top) and women (bottom). The average coefficients of variation [(SD + mean) x 100], which quantify the variability of the data across subjects, are also reported for each parameter and each muscle in the figure's legend. As can be seen by a com- parison between the overall behaviour of the two groups, the M P F (filled squares) of the TB decreases significantly across increasing force levels (force; P < 0.05) for the female group, but not for the male group where values stay relatively constant (force;
160-
TRICEPS
MEN (n=13)
140-
~ 1 2 0
D 100 0 w "" 80 u.
6 0 ¸
4C
4 0
116
16~ ~ ad~ 46~ 66% 6d~ z6% a6~ 9d~ FORCE (% MVC)
180
160
~v. 140
o ~ 1 2 0 Z uJ
100 ,,q
80
6 0
16~ 26% ad% 46% 66~ 66°/o ~d% 86% 95% FORCE (% MVC)
~__~ MPF ~ MF ~ F25
F75 - -x - SD(f) - A - ASYM
WOMEN (n=16)
Fig. 1 Graphs showing the mean value, for both the men (top) and women (bottom) groups, of the median frequency (MF), median power frequency (MPF), first quartile (F25) third quartile (F75), standard deviation [SD(f)] and skewness (ASYM) parameters across force levels for the triceps brachii (TB). Between subjects coefficients of variation [(SD + mean) x 100] are respectively for the six above parameters in the order of 21.4, 17.6, 23.3, 20.6, 21.4 and 24.4 for men, 14.4, 16.0, 14.3, 18.7, 27.0 and 28.2 for women
P > 0.05). This different behaviour between men and women is statistically significant as depicted by the interaction (P < 0.05). By contrast, the MF (open squares) increases with force similarly for both groups (force; P < 0.05 and interaction; P > 0.05). Similar to the behaviour of the MPF, the F75 (open hourglasses) presents a significant decrease with force (P < 0.05) for the women and stable values for the men (force; P > 0.05). The F25 (asterisks) stays relatively constant across force levels for both men and women, although the ANOVAs depicted a significant force factor effect (P < 0.05). As a consequence of the behaviours of the F25 and F75, the H P R presents similar behaviours to that of the F75 for both groups. Both the SD( f ) (cross- es) and the ASYM (filled triangles) decrease signifi- cantly with increasing force levels (force; P < 0.05), this decrease being more pronounced for the women (inter- action; P < 0.05).
117
240
220
2O0
180
160 z
140 0
~2O
10o
80
60
TRICEPS Subject RL
10% 20% 30% 40% 50% 60% 70% 80% 90% FORCE (9(, MVC)
I . . . . . . . ] TRICEPS
Subject (RL)
TRICEPS Subject ML
,,z, 1SOl ~o0
504 ,.
0 I ,
FORCE (% MVC)
I . . . . . . I TRICEP~ Subject ML
g o
t . .
Joo ~ _ FReOUE~p0 FREQUENcy (Hz) 500 ' ,~r (HZ) 400 500
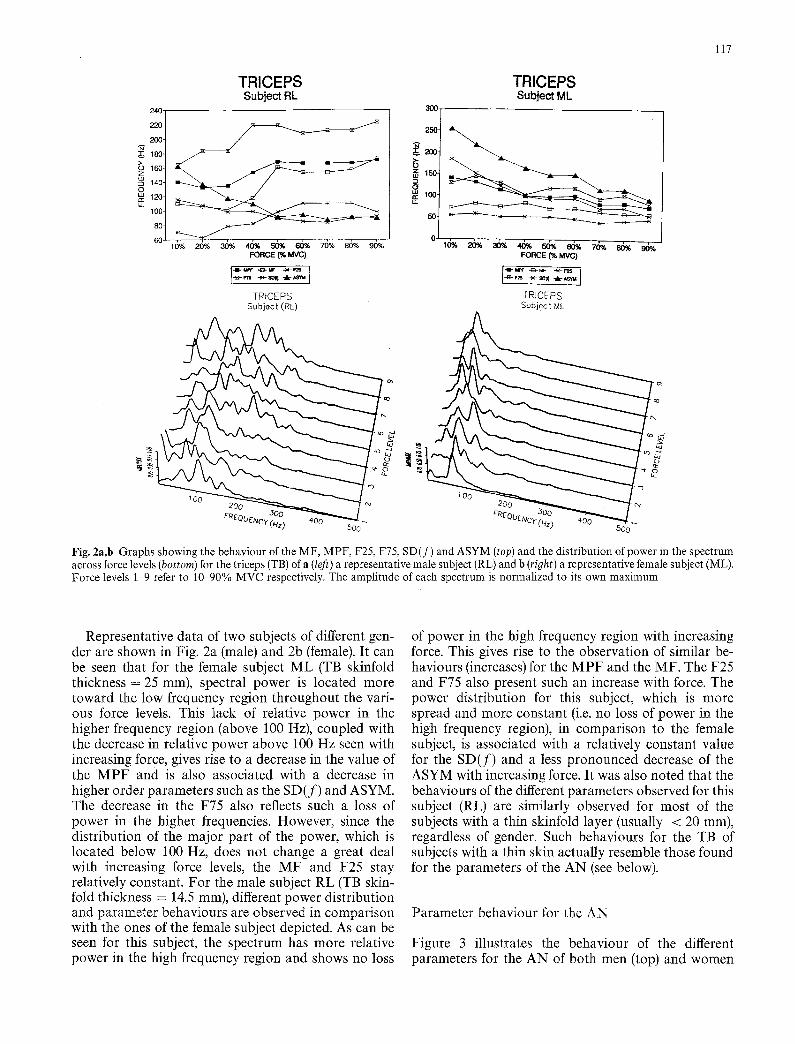
Fig. 2a,b Graphs showing the behaviour of the MF, MPF, F25, F75, SD(f) and ASYM (top) and the distribution of power in the spectrum across force levels (bottom) for the triceps (TB) of a (/eft) a representative male subject (RL) and b (right) a representative female subject (ML). Force levels 1-9 refer to 10-90% MVC respectively. The amplitude of each spectrum is normalized to its own maximum
Representative data of two subjects of different gen- der are shown in Fig. 2a (male) and 2b (female). It can be seen that for the female subject ML (TB skinfold thickness = 25 mm), spectral power is located more toward the low frequency region throughout the vari- ous force levels. This lack of relative power in the higher frequency region (above 100 Hz), coupled with the decrease in relative power above 100 Hz seen with increasing force, gives rise to a decrease in the value of the M P F and is also associated with a decrease in higher order parameters such as the SD( f ) and ASYM. The decrease in the F75 also reflects such a loss of power in the higher frequencies. However, since the distribution of the major part of the power, which is located below 100 Hz, does not change a great deal with increasing force levels, the M F and F25 stay relatively constant. For the male subject RL (TB skin- fold thickness = 14.5 mm), different power distribution and parameter behaviours are observed in comparison with the ones of the female subject depicted. As can be seen for this subject, the spectrum has more relative power in the high frequency region and shows no loss
of power in the high frequency region with increasing force. This gives rise to the observation of similar be- haviours (increases) for the M P F and the MF. The F25 and F75 also present such an increase with force. The power distribution for this subject, which is more spread and more constant (i.e. no loss of power in the high frequency region), in comparison to the female subject, is associated with a relatively constant value for the SD( f ) and a less pronounced decrease of the ASYM with increasing force. It was also noted that the behaviours of the different parameters observed for this subject (RL) are similarly observed for most of the subjects with a thin skinfold layer (usually < 20 mm), regardless of gender. Such behaviours for the TB of subjects with a thin skin actually resemble those found for the parameters of the AN (see below).
Parameter behaviour for the AN
Figure 3 illustrates the behaviour of the different parameters for the AN of both men (top) and women
118
ANCONEUS
260
240
220
200
180 z
160 O w 140
120"
100"
260
240-
~. 220-
200 180-
160- O
140-
u.. 120-
100-
MEN (n=13)
X - - = ~ - - - - = 7 x
10% 20% 30% 40% 50% 60% 70% 80% 90% FORCE (% MVC)
WOMEN (n=16)
16% 26% 36% 46% 56% 66% 76% 86% 96% FORCE (% MVC)
I --~- MPF ~ MF ~ F25
F75 ~ SD(f) - A - ASYM
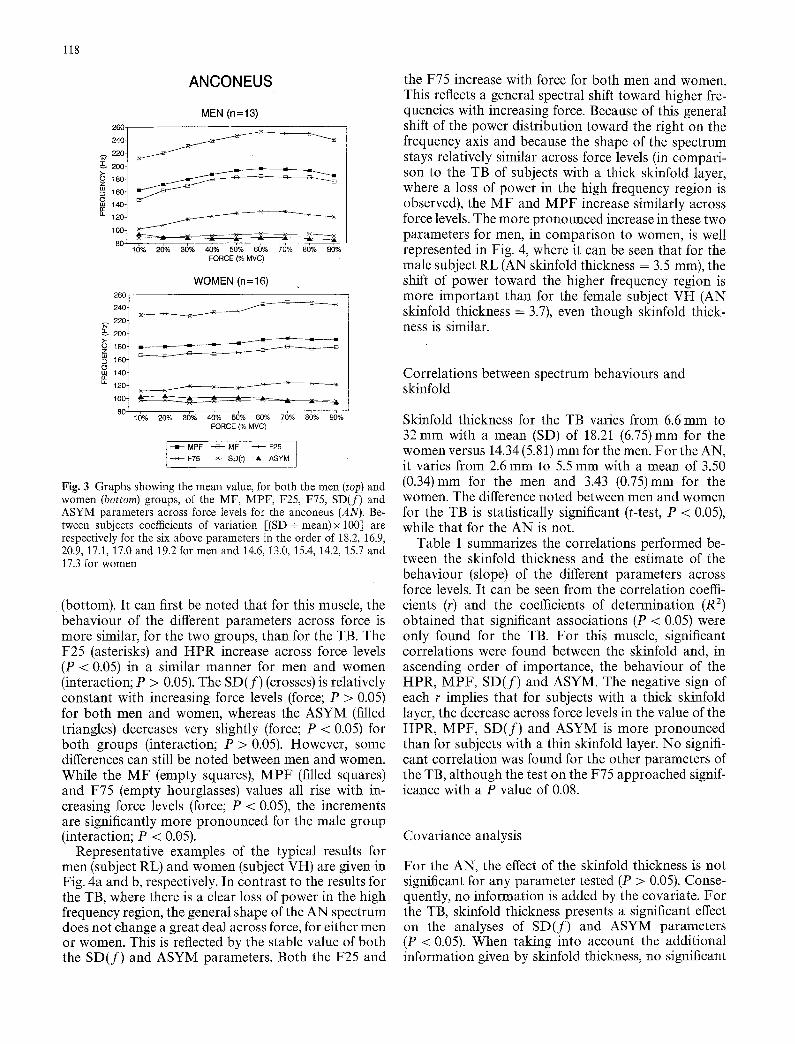
Fig. 3 Graphs showing the mean value, for both the men (top) and women (bottom) groups, of the MF, MPF, F25, F75, SD(f) and ASYM parameters across force levels for the anconeus (AN). Be- tween subjects coefficients of variation [(SD + mean)x 100] are respectively for the six above parameters in the order of 18.2, 16.9, 20.9, 17.1, 17.0 and 19.2 for men and 14.6, 13.0, 15.4, 14.2, 15.7 and 17.3 for women
(bottom). It can first be noted that for this muscle, the behaviour of the different parameters across force is more similar, for the two groups, than for the TB. The F25 (asterisks)and H P R increase across force levels (P < 0.05) in a similar manner for men and women (interaction; P > 0.05). The SD(f ) (crosses) is relatively constant with increasing force levels (force; P > 0.05) for both men and women, whereas the ASYM (filled triangles) decreases very slightly (force; P < 0.05) for both groups (interaction; P > 0.05). However, some differences can still be noted between men and women. While the M F (empty squares), M P F (filled squares) and F75 (empty hourglasses) values all rise with in- creasing force levels (force; P < 0.05), the increments are significantly more pronounced for the male group (interaction; P < 0.05).
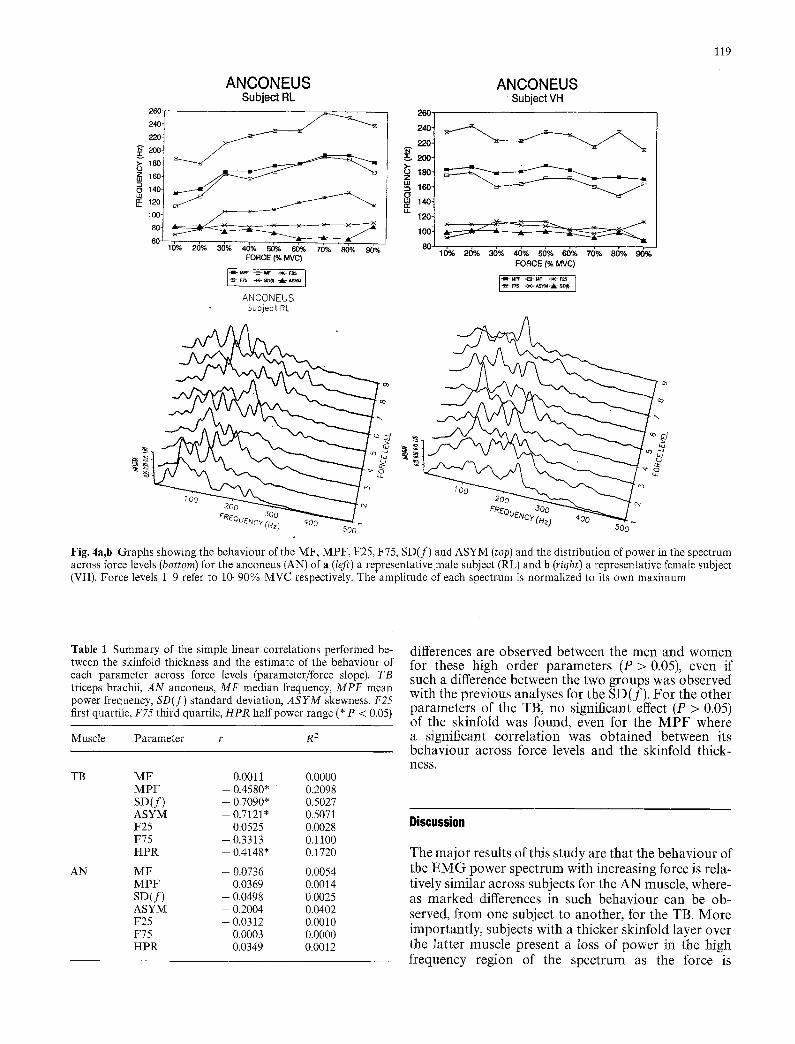
Representative examples of the typical results for men (subject RL) and women (subject VH) are given in Fig. 4a and b, respectively. In contrast to the results for the TB, where there is a clear loss of power in the high frequency region, the general shape of the AN spectrum does not change a great deal across force, for either men or women. This is reflected by the stable value of both the SD( f ) and ASYM parameters. Both the F25 and
the F75 increase with force for both men and women. This reflects a general spectral shift toward higher fre- quencies with increasing force. Because of this general shift of the power distribution toward the right on the frequency axis and because the shape of the spectrum stays relatively similar across force levels (in compari- son to the TB of subjects with a thick skinfold layer, where a loss of power in the high frequency region is observed), the M F and M P F increase similarly across force levels. The more pronounced increase in these two parameters for men, in comparison to women, is well represented in Fig. 4, where it can be seen that for the male subject RL (AN skinfold thickness = 3.5 ram), the shift of power toward the higher frequency region is more important than for the female subject VH (AN skinfold thickness = 3.7), even though skinfold thick- ness is similar.
Correlations between spectrum behaviours and skinfold
Skinfold thickness for the TB varies from 6.6 mm to 32 mm with a mean (SD) of 18.21 (6.75)mm for the women versus 14.34 (5.81) mm for the men. For the AN, it varies from 2.6 mm to 5.5 mm with a mean of 3.50 (0.34)mm for the men and 3.43 (0.75)mm for the women. The difference noted between men and women for the TB is statistically significant (t-test, P < 0.05), while that for the AN is not.
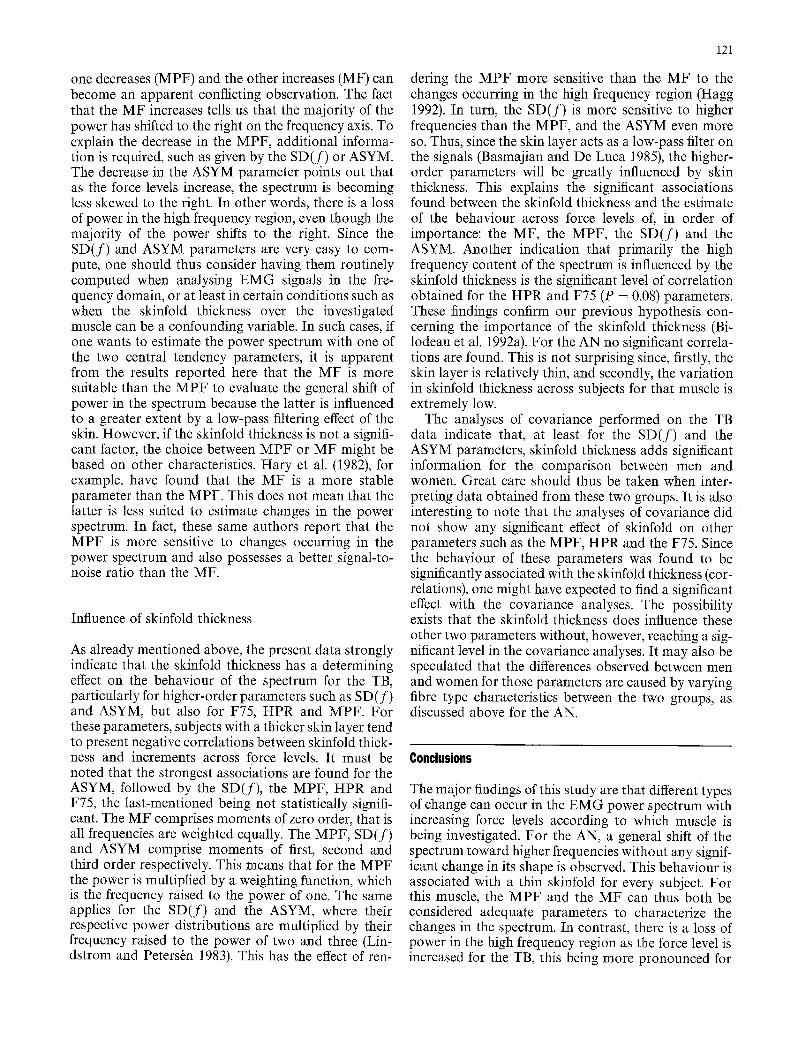
Table 1 summarizes the correlations performed be- tween the skinfold thickness and the estimate of the behaviour (slope) of the different parameters across force levels. It can be seen from the correlation coeffi- cients (r) and the coefficients of determination (R 2) obtained that significant associations (P < 0.05) were only found for the TB. For this muscle, significant correlations were found between the skinfold and, in ascending order of importance, the behaviour of the HPR, MPF, SD( f ) and ASYM. The negative sign of each r implies that for subjects with a thick skinfold layer, the decrease across force levels in the value of the HPR, MPF, SD( f ) and ASYM is more pronounced than for subjects with a thin skinfold layer. No signifi- cant correlation was found for the other parameters of the TB, although the test on the F75 approached signif- icance with a P value of 0.08.
Covariance analysis
For the AN, the effect of the skinfold thickness is not significant for any parameter tested (P > 0.05). Conse- quently, no information is added by the covariate. For the TB, skinfold thickness presents a significant effect on the analyses of SD( f ) and ASYM parameters (P < 0.05). When taking into account the additional information given by skinfold thickness, no significant
119
260
240"
220-
g2oo 180"
Z 160-
140- 120- 100- 80-
ANCONEUS Subject RL
60 1(~% 20% 36% 46% 5(~/o 66% 7(~% 8(}% 9(~,4, FORCE (% MVC)
[ . . . . . . . . ]
ANCONEU$ Subject RL
26O
240-
220-
200- g
P, 140-
ANCONEUS Subject VH
220
200
180-1
160-1
140-1 120-1
8 0 I , 10~ 26% 36% 46% ~6% 66% 76% 86% 9d~
FORCE (% MVC)
o)
co
) ~Oo
Fig. 4a,b Graphs showing the behaviour of the MF, MPF, F25, F75, SD(f) and ASYM (top) and the distribution of power in the spectrum across force levels (bottom) for the anconeus (AN) of a (left) a representative male subject (RL) and b (right) a representative female subject (VH). Force levels 1-9 refer to 10-90% MVC respectively. The amplitude of each spectrum is normalized to its own maximum
Table 1 Summary of the simple linear correlations performed be- tween the skinfold thickness and the estimate of the behaviour of each parameter across force levels (parameter/force slope). TB triceps brachii, A N anconeus, MF median frequency, MPF mean power frequency, SD( f ) standard deviation, A S Y M skewness, F25 first quartile, F75 third quartile, HPR half power range (* P < 0.05)
Muscle Parameter r R 2
TB
AN
MF 0.0011 0.0000 M P F -- 0.4580* 0.2098 SD(f ) -- 0.7090* 0.5027 ASYM - 0.7121" 0.5071 F25 0.0525 0.0028 F75 - 0.3313 0.1100 HPR - 0.4148" 0.1720
MF - 0.0736 0.0054 M P F - 0.0369 0.0014 SD(f ) - 0.0498 0.0025 ASYM - 0.2004 0.0402 F25 - 0.0312 0.0010 F75 0.0003 0.0000 HPR 0.0349 0.0012
differences are observed between the men and women for these high order parameters (P > 0.05), even if such a difference between the two groups was observed with the previous analyses for the SD(f) . For the other parameters of the TB, no significant effect (P > 0.05) of the skinfold was found, even for the M P F where a significant correlation was obtained between its behaviour across force levels and the skinfold thick- ness.
Discussion
The major results of this study are that the behaviour of the EMG power spectrum with increasing force is rela- tively similar across subjects for the AN muscle, where- as marked differences in such behaviour can be ob- served, from one subject to another, for the TB. More importantly, subjects with a thicker skinfold layer over the latter muscle present a loss of power in the high frequency region of the spectrum as the force is

120
increased. Thus, the shape of the spectrum changes across force levels. Consequently, for these subjects, a different behaviour between the M P F and the MF can be observed. In contrast, for subjects with a thinner skin layer over the TB muscle and across subjects for the AN, no change in the general shape of the spectrum is observed. There is, however, a general shift toward the high frequencies. This is reflected by the similar behaviours obtained for the MPF and the MF.
The results of the correlations and covariance ana- lyses performed also suggest that the varying behav- iours observed across subjects for the TB, such as between men and women, could be explained by a dif- ferent skinfold layer from subject to subject.
Criticism of the methods
Due to the relatively short duration of the contractions performed in this study, a compromise had to be made regarding the length of the window used to calculate the power spectrum. A relatively short duration had to be used in order to prevent too much force variation within a given window. The length of the single win- dows used here was 256 ms, which corresponds to variation in the force level of about 5% MVC. Since force fluctuations in this range can also occur while maintaining a constant target force level, we feel that the present window length was sufficiently short. Obvi- ously, the window also had to be long enough to provide an adequate sample of EMG signals that will give meaningful results. We have shown previously, for step contractions, that 256-ms windows give similar results, with regard to MPF and MF values, than windows up to 2-s long (Bilodeau et al. 1991). It should be pointed out that an average power spectrum was obtained on three overlapping 256-ms windows for a total length of 512 ms, which we think is very accept- able. Furthermore, the effect of using short windows is to increase the variability in the results of spectral analysis. However, regardless of this potential higher variability in the data, high correlation between skin- fold thickness and several spectral parameters was found.
A further concern that could be expressed with regard to the present data is the stationarity, or rather, the potential non-stationarity of the signal analysed. Even though the amplitude of the EMG signal increases gradually with force, we have recently shown that the statistical characteristics of EMG sig- nals obtained in both ramp and constant force (step) contractions, with the present window length, are not significantly different (Bilodeau et al. 1993). The im- plication of this finding is that EMG signals can be considered at least locally stationary signals. Conse- quently, the present spectral analyses should be con- sidered valid.
Changes in the characteristics of the spectrum across force levels
With regard to the general shift of power toward higher frequencies previously observed by other authors for steady force level contractions (Gander and Hudgins 1985; Komi and Viitasalo 1976; Viitasalo and Komi 1978), the present data for the AN confirm such behav- iour for ramp contractions. For that muscle, a relative loss of power in the low frequency region and a relative power gain in the high frequency region (general shift of the power to the right of the frequency axis without any significant change in its shape) can be observed. Such a general shift of power along the frequency axis can be explained by the fact that any characteristic frequency of the spectrum is linearly related to the conduction velocity (Stulen and De Luca 1981). Thus, an increase in the average muscular conduction velocity, caused by the recruitment of larger diameter fibres, will give rise to a similar shift of power to the right in all frequency regions of the spectrum. In this case, the interpretation of the changes in the value of the MPF or MF can be straightforward because there is no change in the shape of the spectrum. Any changes in these parameters will thus be well representative of the shift occurring in the spectrum.
It is interesting to note that the shift of parameters in AN is more pronounced for men than for women. This observation could be related to the fact that the average difference between the diameter of type I and type II muscle fibres of women is smaller when compared to that of men for certain muscles (Brooke and Engel 1969; Simoneau and Bouchard 1989; Simoneau et al. 1985). Thus, the orderly recruitment from type I to type I1 muscle fibres (Sypert and Munson 1981) would give rise to a lesser relative increase in conduction velocity for the female group, which would be reflected by a less pronounced shift of the power spectrum and conse- quently lesser increases in MPF or MF with increasing force.
The general shift toward the higher frequencies was not observed for the TB of several subjects. More specifically, only subjects presenting a thin skinfold layer (mostly men) could show a similar behaviour to that observed for the AN. For subjects whose skin was thicker (all women), there was no shift of power to- wards the higher frequencies. In fact, the power for these subjects was typically located mostly in the low frequency region of the spectrum (Fig. 2b). In addition, it shifted even more toward the left as the force level was increased. Thus, there was a change in the shape of the power spectrum as the force level was increased. This change in shape renders the interpretation of the behaviour of the MPF and MF more difficult. Conse- quently, one has to take into account the information provided by several parameters in order to characterize adequately the specific changes occurring in the spec- trum. If the MPF and MF are taken alone, the fact that
121
one decreases (MPF) and the other increases (MF) can become an apparent conflicting observation. The fact that the MF increases tells us that the majority of the power has shifted to the right on the frequency axis. To explain the decrease in the MPF, additional informa- tion is required, such as given by the SD(f ) or ASYM. The decrease in the ASYM parameter points out that as the force levels increase, the spectrum is becoming less skewed to the right. In other words, there is a loss of power in the high frequency region, even though the majority of the power shifts to the right. Since the SD(f ) and ASYM parameters are very easy to com- pute, one should thus consider having them routinely computed when analysing EMG signals in the fre- quency domain, or at least in certain conditions such as when the skinfold thickness over the investigated muscle can be a confounding variable. In such cases, if one wants to estimate the power spectrum with one of the two central tendency parameters, it is apparent from the results reported here that the MF is more suitable than the MPF to evaluate the general shift of power in the spectrum because the latter is influenced to a greater extent by a low-pass filtering effect of the skin. However, if the skinfold thickness is not a signifi- cant factor, the choice between MPF or MF might be based on other characteristics. Hary et al. (1982), for example, have found that the MF is a more stable parameter than the MPF. This does not mean that the latter is less suited to estimate changes in the power spectrum. In fact, these same authors report that the MPF is more sensitive to changes occurring in the power spectrum and also possesses a better signal-to- noise ratio than the MF.
Influence of skinfold thickness
As already mentioned above, the present data strongly indicate that the skinfold thickness has a determining effect on the behaviour of the spectrum for the TB, particularly for higher-order parameters such as SD(f ) and ASYM, but also for F75, HPR and MPF. For these parameters, subjects with a thicker skin layer tend to present negative correlations between skinfold thick- ness and increments across force levels. It must be noted that the strongest associations are found for the ASYM, followed by the SD(f), the MPF, HPR and F75, the last-mentioned being not statistically signifi- cant. The MF comprises moments of zero order, that is all frequencies are weighted equally. The MPF, SD(f) and ASYM comprise moments of first, second and third order respectively. This means that for the MPF the power is multiplied by a weighting function, which is the frequency raised to the power of one. The same applies for the SD(f ) and the ASYM, where their respective power distributions are multiplied by their frequency raised to the power of two and three (Lin- dstrom and PetersSn 1983). This has the effect of ren-
dering the MPF more sensitive than the MF to the changes occurring in the high frequency region (Hagg 1992). In turn, the SD(f ) is more sensitive to higher frequencies than the MPF, and the ASYM even more so. Thus, since the skin layer acts as a low-pass filter on the signals (Basmajian and De Luca 1985), the higher- order parameters will be greatly influenced by skin thickness. This explains the significant associations found between the skinfold thickness and the estimate of the behaviour across force levels of, in order of importance: the MF, the MPF, the SD(f) and the ASYM. Another indication that primarily the high frequency content of the spectrum is influenced by the skinfold thickness is the significant level of correlation obtained for the HPR and F75 (P = 0.08) parameters. These findings confirm our previous hypothesis con- cerning the importance of the skinfold thickness (Bi- lodeau et al. 1992a). For the AN no significant correla- tions are found. This is not surprising since, firstly, the skin layer is relatively thin, and secondly, the variation in skinfold thickness across subjects for that muscle is extremely low.
The analyses of covariance performed on the TB data indicate that, at least for the SD(f ) and the ASYM parameters, skinfold thickness adds significant information for the comparison between men and women. Great care should thus be taken when inter- preting data obtained from these two groups. It is also interesting to note that the analyses of covariance did not show any significant effect of skinfold on other parameters such as the MPF, HPR and the F75. Since the behaviour of these parameters was found to be significantly associated with the skinfold thickness (cor- relations), one might have expected to find a significant effect with the covariance analyses. The possibility exists that the skinfold thickness does influence these other two parameters without, however, reaching a sig- nificant level in the covariance analyses. It may also be speculated that the differences observed between men and women for those parameters are caused by varying fibre type characteristics between the two groups, as discussed above for the AN.
Conclusions
The major findings of this study are that different types of change can occur in the EMG power spectrum with increasing force levels according to which muscle is being investigated. For the AN, a general shift of the spectrum toward higher frequencies without any signif- icant change in its shape is observed. This behaviour is associated with a thin skinfold for every subject. For this muscle, the MPF and the MF can thus both be considered adequate parameters to characterize the changes in the spectrum. In contrast, there is a loss of power in the high freqnency region as the force level is increased for the TB, this being more pronounced for
122
subjects having a thicker skin layer. Because of (1) the change in shape of the spectrum and (2) the different sensitivity to the high frequency region between the two parameters, the M P F and the MF present different behaviours across force. Additional parameters can, however, help determine the specific changes occurring in the spectrum. Such parameters include the ASYM. Finally, it is obvious that the skinfold thickness is a sig- nificant determinant not only of the behaviour of the central tendency parameters of the power spectrum across force levels, but also of the shape of the spectrum.
Because of its non-invasive nature, surface EMG, and more specifically its analysis in the frequency do- main, has been used extensively in recent years in studies performed both on normal (Knaflitz et al. 1990, Merletti et al. 1992; Moritani and Muro 1987) and on pathological populations (Latash 1988; Moglia et al. 1987; 1991). We believe that the present work contrib- utes new knowledge that will help us to document better the characteristics of the EMG power spectrum as well as its sensitivity. In this way, non-invasive approaches of EMG investigation will be better validated and their limits better appreciated.
Acknowledgements Martin Bilodeau is supported by a Ph.D. stu- dentship from the Medical Research Council (MRC) of Canada, Marco Cincera by a fellowship from the Comitato Promotore Tele- thon and Sylvie Gervais by a scholarship from the National Sciences and Engineering Research Council of Canada. The authors would like to thank Michel Goyette and Francois Kemp for their contribu- tion to the collection and processing of the data.
References
Basmajian JV, De Luca CJ (1985) Muscles alive. Their functions revealed by electromyography, 5th ed. Williams and Wilkins, Baltimore
Bilodeau M, Arsenault AB, Gravel D, Bourbonnais D (1990) The influence of an increase in the level of force on the EMG power spectrum of elbow extensors. Eur J Appl Physiol 61:461-466
Bilodeau M, Arsenault AB, Gravel D, Bourbonnais D (1991) EMG power spectra of elbow extensors during ramp and step isometric contractions. Eur J Appl Physiol 63:24-28
Bilodeau M, Arsenault AB, Gravel D, Bourbonnais D (1992a) Influ- ence of gender on the EMG power spectrum during an increasing force level. J Electromyogr Kinesioi 2:121-129
Bilodeau)M, Arsenault AB, Gravel D, Bourbonnais D (1992b) Time and frequency analysis of EMG signals of homologous elbow flexors and extensors. Med Biol Eng Comput 30:640 644
Bilodeau M, Arsenault AB, Gravel D, Bourbonnais D, Lepage Y, Harel F (1992c) The influence of anthropometric factors on the EMG power spectrum of upper limb muscles. Proceedings, 9th International Congress of the International Society for Electro- physiological Kinesiology, Florence, Italy, p 40
Bilodeau M, de la Barrera E J, Arsenault AB, Gravel D, Bourbonnais D, Kemp F (1993) Stationarity of EMG signals obtained across increasing force levels during ramp and step contractions. J Bio- mech 26:09
Brooke MH, Engel WK (1969) The histographic analysis of human muscle biopsies with regard to fibre types. 1. Adult male and female. Neurology 19: 221-233
Duxbury AJ, Hughes DF, Clark DE (1976) Power spectral distribu- tion of the masseter electromyogram from surface electrodes. J Oral Rehabil 3:333-339
Gander RE, Hudgins BS (1985) Power spectral density of the surface myoelectric signal of the biceps brachii as a function of static load. Electromyogr Clin Neurophysiol 25:469-478
Gerdle B, Wretling M-L, Henriksson-Larsen K (1988) Do the fibre type proportion and the angular velocity influence the mean power frequency of the electromyogram? Acta Physiol Scand 134:341-346
Gerdle B, Henriksson-Larsen K, Lorentzon R, Wretling M-L (1991) Dependence of the mean power frequency of the electromyogram on muscle force and fibre type. Acta Physiol Scand 142:457-465
Hagberg M, Ericson B-E (1982) Myoelectric power spectrum de- pendence on muscular contraction level of elbow flexors. Eur J Appl Physiol 48:147-156
Hagg GM (1991) Comparison of different estimators of electromyo- graphic spectral shifts during work when applied on short test contractions. Med Biol Eng Comput 29:511-516
Hary D, Belman M J, Propst J, Lewis S (1982) A statistical analysis of the spectral moments used in EMG tests of endurance. J Appl Physiol 53:779-783
Knaflitz M, Merletti R, De Luca CJ (1990) Inference of motor unit recruitment order in voluntary and electrically elicited contrac- tions. J Appl Physiol 68:1657-1667
Knutsson E, Martensson A (1980) Dynamic motor capacity in spastic paresis and its relation to prime mover dysfunction, spastic reflexes and antagonist coactivation. Scand J Rehabil Med 12:93-106
Komi PV, Viitasalo JT (1976) Signal characteristics of EMG at different levels of muscle tension. Acta Physiol Scand 96:267-276
Latash ML (1988) Spectral analysis of the electromyogram (EMG) in spinal cord trauma patients I. Different types of the EMG and corresponding spectra. Electromyogr Clin Neurophysiol 28:319-327
Lindstr6m L, Peters6n I (1983) Power spectrum analysis of EMG signals and its application. In:Desmedt JE (ed) Progress in clini- cal neurophysiology, vol 10. Karger, Basel, pp 1-51
Masuda T, De Luca CJ (1991) Recruitment threshold and muscle fibre conduction velocity of single motor units. J Electromyogr KinesioI 1:116-123
Merletti R, Lo Conte LR, Cisari C, Actis MV (1992) Age related changes in surface myoelectric signals. Scand J Rehabil Med 24:25-36
Moglia A, Bejor M, Cattaneo S, Lottici P, Zandrini C, Arrigo A (1987) Surface EMG evaluation of quadriceps femoris in normal and spastic subjects. Electromyogr Clin Neurophysiol 27:217-222
Moglia A, Alfonsi E, Zandrini C, Ciano C, Rascaroli M, Toffola ED, Arrigo A (1991) Surface-EMG analysis of rectus femoris in pa- tients with spastic hemiparesis undergoing rehabilitation treat- ment. Electromyogr Clin Neurophysiol 31:123-128
Moritani T, Muro M (1987) Motor unit activity and surface elec- tromyogram power spectrum during increasing force of contrac- tion. Eur J Appl Physiol 56:260-265
Moritani T, Gaffney FD, Carmichael T, Hargis J (1985) Interre- lationships among muscle fibre types, electromyogram, and blood pressure during fatiguing isometric contraction. In: Winter DA, Norman RW, Wells RP, Hayes KC, Patla AE (eds) Bio- mechanics IX-A. Human Kinetics Champaign, pp 287-292
Roy SH, De Luca CJ Schneider J (1986) Effects of electrode location on myoelectric conduction velocity and median frequency esti- mates. J Appl Physiol 61:1510-1517
Sanchez J, Solomonow M, Baratta RV, D'Ambrosia R (1992) EMG power spectra frequencies profiles of elbow antagonist muscle pair during linearly and stepwise increasing contractions. Proceedings of the 9th International Congress of the International Society for Electrophysiological Kinesiology, Florence, Italy, p 63
Sato H (1982) Functional characteristics of human skeletal muscle revealed by spectral analysis of the surface eiectromyogram. Electromyogr Clin Neurophysiol 22:459-516
Simoneau JA, Bouchard C (1989) Human variation in skeletal muscle fibre-type proportion and enzyme activities. Am J Physiol 257:E567-E572

123
Simoneau JA, Lortie G, Boulay MR, Thibault M-C, Th6riault G, Bouchard C (1985) Skeletal muscle histochemical and biochemi- cal characteristics in sedentary male and female subjects. Can J Physiot Pharmacol 63:30-35
Solomonow M, Baten C, Smit J, Baratta R, Hermens H, D'Ambro- sia R, Shoji H (1990) Electromyogram power spectra frequencies associated with motor unit recruitment strategies. J Appl Physiol 68:1177-1185
Stulen FB, De Luca C (1981) Frequency parameters of the myoelec- tric signal as a measure of conduction velocity. IEEE Trans Biomed Eng 28: 515-523
Sypert GW, Munson JB (1981) Basis of segmental motor con- trol:motoneuron size or motor unit type? Neurosurgery 8:608-621
Viitasalo JT, Komi PV (1978) Interrelationships of EMG signal characteristics at different levels of muscle tension and during fatigue. Electromyogr Clin Neurophysiol 18:167-178
Wretling ML, Gerdle B, Henriksson-Larsen K (1987) EMG:a non- invasive method for determination of fibre type proportion. Acta Physiol Scand 131:627-628