Changes in Protein Expression Across Laboratory and Field Experiments in Geobacter bemidjiensis
38
Subscriber access provided by LAWRENCE BERKELEY NATL LAB Journal of Proteome Research is published by the American Chemical Society. 1155 Sixteenth Street N.W., Washington, DC 20036 Published by American Chemical Society. Copyright © American Chemical Society. However, no copyright claim is made to original U.S. Government works, or works produced by employees of any Commonwealth realm Crown government in the course of their duties. Article Changes in protein expression across laboratory and field experiments in Geobacter bemidjiensis Eric David Merkley, Kelly Wrighton, Cindy J. Castelle, Brian J. Anderson, Michael J. Wilkins, Vega Shah, Tyler Arbour, Joseph N. Brown, Steven William Singer, Richard D Smith, and Mary S Lipton J. Proteome Res., Just Accepted Manuscript • DOI: 10.1021/pr500983v • Publication Date (Web): 10 Dec 2014 Downloaded from http://pubs.acs.org on January 8, 2015 Just Accepted “Just Accepted” manuscripts have been peer-reviewed and accepted for publication. They are posted online prior to technical editing, formatting for publication and author proofing. The American Chemical Society provides “Just Accepted” as a free service to the research community to expedite the dissemination of scientific material as soon as possible after acceptance. “Just Accepted” manuscripts appear in full in PDF format accompanied by an HTML abstract. “Just Accepted” manuscripts have been fully peer reviewed, but should not be considered the official version of record. They are accessible to all readers and citable by the Digital Object Identifier (DOI®). “Just Accepted” is an optional service offered to authors. Therefore, the “Just Accepted” Web site may not include all articles that will be published in the journal. After a manuscript is technically edited and formatted, it will be removed from the “Just Accepted” Web site and published as an ASAP article. Note that technical editing may introduce minor changes to the manuscript text and/or graphics which could affect content, and all legal disclaimers and ethical guidelines that apply to the journal pertain. ACS cannot be held responsible for errors or consequences arising from the use of information contained in these “Just Accepted” manuscripts.
Transcript of Changes in Protein Expression Across Laboratory and Field Experiments in Geobacter bemidjiensis

Subscriber access provided by LAWRENCE BERKELEY NATL LAB
Journal of Proteome Research is published by the American Chemical Society. 1155Sixteenth Street N.W., Washington, DC 20036Published by American Chemical Society. Copyright © American Chemical Society.However, no copyright claim is made to original U.S. Government works, or worksproduced by employees of any Commonwealth realm Crown government in the courseof their duties.
Article
Changes in protein expression across laboratoryand field experiments in Geobacter bemidjiensis
Eric David Merkley, Kelly Wrighton, Cindy J. Castelle, Brian J. Anderson, Michael J. Wilkins, VegaShah, Tyler Arbour, Joseph N. Brown, Steven William Singer, Richard D Smith, and Mary S Lipton
J. Proteome Res., Just Accepted Manuscript • DOI: 10.1021/pr500983v • Publication Date (Web): 10 Dec 2014
Downloaded from http://pubs.acs.org on January 8, 2015
Just Accepted
“Just Accepted” manuscripts have been peer-reviewed and accepted for publication. They are postedonline prior to technical editing, formatting for publication and author proofing. The American ChemicalSociety provides “Just Accepted” as a free service to the research community to expedite thedissemination of scientific material as soon as possible after acceptance. “Just Accepted” manuscriptsappear in full in PDF format accompanied by an HTML abstract. “Just Accepted” manuscripts have beenfully peer reviewed, but should not be considered the official version of record. They are accessible to allreaders and citable by the Digital Object Identifier (DOI®). “Just Accepted” is an optional service offeredto authors. Therefore, the “Just Accepted” Web site may not include all articles that will be publishedin the journal. After a manuscript is technically edited and formatted, it will be removed from the “JustAccepted” Web site and published as an ASAP article. Note that technical editing may introduce minorchanges to the manuscript text and/or graphics which could affect content, and all legal disclaimersand ethical guidelines that apply to the journal pertain. ACS cannot be held responsible for errorsor consequences arising from the use of information contained in these “Just Accepted” manuscripts.
1
Changes in protein expression across laboratory and field experiments in Geobacter bemidjiensis
Eric D. Merkley,a Kelly C. Wrighton
c, Cindy J. Castelle,
d,e Brian J. Anderson,
b Michael J. Wilkins,
c,f Vega
Shahg, Tyler Arbour
d, Joseph N. Brown,
b Steven W. Singer,
e Richard D. Smith,
b and Mary S. Lipton
b*
a Signature Sciences and Technology Division, Pacific Northwest National Laboratory, Richland, WA
99352
b Biological Sciences Division, Pacific Northwest National Laboratory, Richland, WA 99352
c Department of Microbiology, The Ohio State University, Columbus, Ohio, 43210
d Department of Earth and Planetary Science, University of California Berkeley, Berkeley, CA, 94720
e Earth Sciences Division, Lawrence Berkeley National Laboratory, Berkeley, CA, 94720
f School of Earth Sciences, The Ohio State University, Columbus, Ohio, 43210
g Biological Oceanography, University of Washington, Seattle, WA 98105
*To whom correspondence should be addressed: Mary S. Lipton, Biological Sciences Division, Pacific
Northwest National Laboratory, PO Box 999 MS-IN K8-98, Richland, WA, 99352. Tel. 509-371-6589; Fax
509-371-6564; Email [email protected]
Page 1 of 37
ACS Paragon Plus Environment
Journal of Proteome Research
123456789101112131415161718192021222324252627282930313233343536373839404142434445464748495051525354555657585960
2
Abstract
Bacterial extracellular metal respiration, as carried out by members of the genus Geobacter, is
of interest for applications including microbial fuel cells and bioremediation. Geobacter bemidjiensis is
the major species whose growth is stimulated during groundwater amendment with acetate. We have
carried out label-free proteomics studies of Geobacter bemidjiensis grown with acetate as the electron
donor and either fumarate, ferric citrate, or one of two hydrous ferric oxide mineral types as electron
acceptor. The major class of proteins whose expression changes across these conditions is c-type
cytochromes, many of which are known to be involved in extracellular metal reduction in other, better-
characterized Geobacter species. Some proteins with multiple homologues in G. bemidjiensis (OmcS,
OmcB) had different expression patterns than observed for their G. sulfurreducens homologues under
similar growth conditions. We also compared the proteome from our study to a prior proteomics study
of biomass recovered from an aquifer in Colorado, where the microbial community was dominated by
strains closely-related to G. bemidjiensis. We detected an increased number of proteins with functions
related to motility and chemotaxis in the Colorado field samples compared to the laboratory samples,
suggesting the importance of motility for in situ extracellular metal respiration.
Keywords: Geobacter bemidjiensis, c-type cytochromes, proteomics, electron acceptors
Introduction
Bacteria of the genus Geobacter use extracellular metals such as iron (III) and uranium (VI) as
terminal electron acceptors for cellular respiration, a process known as dissimilatory metal reduction.
The metals can be in a soluble form or incorporated in a solid mineral phase, such as hydrous ferric
oxide (HFO). The ability to utilize soluble and insoluble electron acceptors has led to fundamental and
applied research involving Geobacter, including electrical current generation in microbial fuel cells,1
identification of microbial nanowires derived from electrically conductive pili,2 and bioremediation of
uranium-contaminated aquifers.3-5
Geobacter bemidjiensis, an isolate obtained from an iron mine in
Minnesota, is particularly important for potential bioremediation applications, since G. bemidjiensis and
closely related strains are the cultured representatives of the predominant species coupling acetate
utilization to the reduction of uranium in alluvial aquifers.4-5
The detailed mechanism of extracellular electron transfer is the focus of recent research, and
may differ between Geobacter species. In these mechanistic studies, there are numerous lines of
genetic and biochemical evidence obtained from experiments with G. sulfurreducens that have
Page 2 of 37
ACS Paragon Plus Environment
Journal of Proteome Research
123456789101112131415161718192021222324252627282930313233343536373839404142434445464748495051525354555657585960
3
established multi-heme c-type cytochromes (proteins with one or more covalently-bound heme c
groups) as critical proteins for extracellular metal respiration.6-14
The genome of G. bemidjiensis
encodes 84 c-type cytochromes, both single and multi-heme, including some unique to the species and
others homologous to c-type cytochromes in other Geobacter species.15
The exact nature of the in situ
electron acceptor substrate in subsurface environments for dissimilatory metal reduction by populations
related to G. bemidjiensis is also unclear. In isolation, G. bemidjiensis can grow on either soluble iron(III)
sources such as iron(III) citrate, or insoluble iron-containing minerals such as HFO, as well as organic
electron acceptors such as fumarate.
To characterize the protein complement from G. bemidjiensis involved in extracellular metal
respiration and to elucidate the role of c-type cytochromes, we have carried out peptide-based liquid
chromatography-mass spectrometry proteomics measurements on lab-grown cultures of G. bemidjiensis
using the accurate mass and time (AMT)tag approach.16-18
We used a variety of terminal electron
acceptors, including fumarate, ferric citrate, and two different particle sizes of HFO (heterogeneous
undefined HFO (bulk), and the other a chemically synthesized nanoparticle <6 nm) to assess differences
in proteome complement in laboratory grown G. bemidjiensis. We then compared the proteome from
these laboratory conditions with the proteome of bacteria isolated from uranium-contaminated
groundwater that had been stimulated by acetate addition at the Department of Energy’s Integrated
Field Research Challenge (IFRC) site in Rifle, Colorado.19
We found several proteins that displayed differential expression between the soluble electron
acceptors and HFO growth conditions, although there were few differentially expressed proteins
between the two types of HFO. We identified several c-type cytochromes whose expression pattern is
suggestive of involvement in extracellular metal reduction. Some of these cytochromes have expression
patterns that differ from those of their G. sulfurreducens homologues. Comparisons between laboratory
and field proteomes revealed a greater proportion of proteins involved in chemotaxis, signal
transduction and motility in biomass recovered from the environment. We further describe a method of
analyzing AMT tag proteomics data that is robust with respect to interference from residual iron present
in cultures grown in HFO.
Methods
Synthesis of HFO
HFO was synthesized as previously described for undefined 20
and nanoparticulate (NP) forms with no
impurity phases and a mean particle diameter between 3-6 nm. 21-22
Briefly, for undefined HFO,
Page 3 of 37
ACS Paragon Plus Environment
Journal of Proteome Research
123456789101112131415161718192021222324252627282930313233343536373839404142434445464748495051525354555657585960
4
amorphous Fe(III) oxyhydroxide was formed by neutralizing a 0.4 M solution of FeCl3 slowly to a pH of 7
with NaOH, followed by a series of washes to ensure the chloride is below inhibitory concentrations in
the final media. For NP, a ferrihydrite suspension was prepared by controlled addition of 0.48 M NaHCO3
to an equal volume of 0.40 M Fe(NO3)3·9H2O with vigorous stirring at 80 °C . After heating, samples were
immediately submerged in an ice bath to room temperature, microwave-annealed, and rapidly cooled in
an ice bath. Dialysis was performed for three days, changing water at least nine-times, and both
undefined and NP HFO suspensions were kept at 10 °C until use in this experiment.
Geobacter bemidjiensis culture conditions.
The inoculum contained 6 L of mid-log phase culture grown on fumarate (40 mM) and acetate
(10 mM) growth medium. Growth medium (pH 6.85) used here and throughout the experiment
contained the following (per liter): 0.1 g of KCl, 0.2 g of NH4Cl, 0.6 g of NaH2PO4, 2.5 g NaHCO3, 10 ml of
vitamin mix, and 10 ml of trace mineral mix.23-24
To obtain sufficient biomass for proteomic subsampling
at early time points on poorly crystalline iron minerals, bacterial cells were harvested by centrifugation
(6000g x 8min) under anoxic atmosphere, washed once, and reconcentrated in 60 ml basal buffered
medium (without vitamins and minerals). 1.5 ml of this cell suspension was anoxically and aseptically
added to 148.5 ml of growth media in experimental bottles. Each bottle was amended with 10 mM
acetate and four different electron acceptor treatments. The electron acceptor treatments were
designated i) fumarate (~40 mM), ii) Fe(III) citrate (42.6 ± 1.3 mM Fe(III)), iii) bulk HFO (67.21 ± 1.58
mM Fe(III)), and iv) nanoparticle HFO (53.93 ± 1.57 mM Fe(III)). All four experimental electron acceptor
treatments and accompanying killed controls were run in triplicate. Additionally, for the bulk and
nanoparticle HFO treatments an abiotic (no cell) control was also included.
For ferric citrate, bulk HFO, and NP HFO, Fe(II) production over time was monitored regularly by
the ferrozine assay with a 24 hour extraction.24-26
Killed and abiotic controls demonstrated no change in
Fe(II) production and/or cell density over time. Bulk and NP experiments were conducted over 35 days
and ferric citrate and fumarate over 26 hours. For iron-containing media, samples were collected during
“early” and “late” Fe(III) reduction, and compared to early and stationary phase fumarate control. Early
reduction was denoted as the period up to when ~25% of the bioavailable iron was reduced (NP 31%
reduction, 6.25 ± 1.2 mM Fe(II); Bulk 22% reduction, 3.75 ± 0.12 mM Fe(II); Ferric citrate 25%, 10.79 ±
1.31 mM Fe (II)). Late iron reduction was denoted when Fe(II) production no-longer increased
logarithmically, and stabilized for three consecutive time points (NP 15.86 ± 1.24 mM; Bulk 13.24 ± 0.53
mM Fe(II)).
Biomass collection for proteomics
Page 4 of 37
ACS Paragon Plus Environment
Journal of Proteome Research
123456789101112131415161718192021222324252627282930313233343536373839404142434445464748495051525354555657585960

5
Biomass samples for proteomics were harvested from each time point from each triplicate
culture. For each sample, 15 mL of cellular medium was anoxically removed from each bottle, with
biomass harvested by centrifugation (8000g, 3 minutes), and immediately frozen on liquid nitrogen and
stored at -80°C until protein isolation.
Cell pellets were washed with approximately 7-10 mL of 0.392 M oxalate (prepared as 0.225 M
oxalic acid and 0.167 M ammonium oxalate) in 2 mL aliquots.27
A change in color from colorless to
green/yellow, due to the iron-oxalate complex, indicated the presence of dissolved iron. 2 mL wash
volumes were repeated until the supernatant was nearly colorless, at which point the sample was
presumed to be iron-free. (This presumption was later proved to be incorrect--see below.) Sample cell
pellets were suspended in 100 mM ammonium bicarbonate pH ~8 and lysed by bead beating with 0.1
mm zirconia/silica beads (Biospec Products, Inc.) in a Bullet Blender homogenizer (Next Advance, Averill
Park, NY). Lysates were centrifuged for 5 min at 5,000 rpm to pellet visible insoluble iron, zirconia/silica
beads and cellular debris. Dry urea was added to each sample to reach 9 M final concentration, and DTT
was added to 5 mM. Samples were denatured at 60˚C for 30 minutes then diluted 10-fold with 100mM
ammonium bicarbonate. 1 M CaCl2 was added to 1 mM final concentration and trypsin was added in a
mass ratio of 1:50 (trypsin: protein). Samples were digested overnight (~18 hrs) at 37˚C. Samples were
briefly spun to pellet all remaining insoluble iron and zirconia/silica beads that may have remained, and
then supernatants were desalted by solid phase extraction using 1 mL/50 mg C18 columns (Supelco).
Eluents were concentrated to less than 10 µL in a vacuum centrifuge, then diluted to 50 µL using 50 mM
ammonium bicarbonate. After digestion and clean-up, protein concentration was measured by the BCA
assay, and samples were diluted to an apparent concentration of 0.25 µg/µL and subjected to LC-MS
analysis. Examination of the LC-MS total ion chromatograms indicated that samples from HFO-grown
cultures had much lower intensity than non-HFO-grown samples, probably due to residual iron
interfering with the BCA assay. We addressed this issue during data analysis; see below.
As part of a strategy intended to increase the detection of c-type cytochromes in the AMT tag
workflow (see below), cultures of G. bemidjiensis were also grown in the laboratory on
fumarate/acetate medium. Protein extracts from these samples were analyzed by sodium
dodecylsulfate polyacrylamide gel electrophoresis (SDS-PAGE) and stained by the heme-specific reagent
3,3',5,5'-tetramethylbenzidine (TMBZ).28
Excised TMBZ-stained bands (containing c-type cytochromes)
were cut into approximate 1 mm3 pieces and de-stained, at room temperature, on a rotating rack for a
few hours in a 50:50 vol% mixture of acetonitrile and 50 mM ammonium bicarbonate. After this point,
the in-gel digestion procedure followed standard protocols.29
The solution was removed and the gel
Page 5 of 37
ACS Paragon Plus Environment
Journal of Proteome Research
123456789101112131415161718192021222324252627282930313233343536373839404142434445464748495051525354555657585960

6
pieces were soaked in 100% acetonitrile for 10 min. The acetonitrile was then discarded and the pieces
were dried in a vacuum centrifuge for 10 minutes. Dried gel pieces were covered with a 12.5 ng/µL
solution of trypsin in 50 mM ammonium bicarbonate and incubated on ice for 45 minutes, after which
50 mM ammonium bicarbonate was added when necessary to ensure all pieces were covered by
solution. Samples were digested overnight (~18 hrs) at 37˚C. Peptides were extracted from each gel
with 5% formic acid/50% acetonitrile three times. Each extraction included three rounds of a 1 min spin
at 20,000 g, followed by 1 min at rest. The three extractions for each sample were pooled and desalted
by SPE as described above, and the samples analyzed by LC-MS as describe below. Data from these
samples, which are highly enriched in c-type cytochromes, was used only in construction of the AMT tag
database, and is expected to increase the number of heme-containing peptides in the database and
therefore the number of c-type cytochromes identified in subsequent LC-MS analyses.
LC-MS and LC-MS/MS analysis of samples.
To generate the AMT tag database, we pooled peptide samples from all of the culture
conditions and separated them off-line using a strong cation exchange chromatography (SCX) column
packed with 5-µm particle size Poly LC Polysulfoethyl A (PolyLC, Columbia, MD). The mobile phase
solvents A and B were 10 mM ammonium formate + 25% acetonitrile, and 500 mM ammonium formate
+ 25% acetonitrile, respectively. The gradient was 0-10 min, 0% B; 10-50 min, 0-50% B; 50-60 min, 50-
100% B; 60-70 min, 100% B; and finally a wash with 100% nanopure water from 70-110 min. Non-
adjacent SCX fractions were pooled to maintain high proteome coverage while reducing the number of
required runs.30
Pooled SCX fractions, as well as all other samples, were analyzed by reversed-phase LC-
MS, on a custom-built chromatography system31
using a 60 cm, 75 µm ID fused silica column packed
with Jupiter C18 stationary phase (3 µm particle size; Phenomenex, Torrance, CA). The two mobile
phases were (A) 0.1% formic acid in water, and (B) 80% acetonitrile/20% water/0.1% formic acid. The LC
column was coupled to either a Thermo Scientific LTQ (for analyses used in database generation only) or
Thermo Scientific LTQ Orbitrap (for production runs) mass spectrometer via an electrospray ionization
interface as previously described.31
Initially, samples were analyzed in triplicate. In order to overcome possible issues associated
with run order and column-to-column variation, the complete set of samples were run in triplicate a
second time. We refer to the resulting groups of datasets as experiments 1 and 2. We report the results
for both experiments, treating experiment 2 as an additional replicate of the whole of experiment 1, and
requiring agreement between the two for a protein’s expression change to be judged significant.
Page 6 of 37
ACS Paragon Plus Environment
Journal of Proteome Research
123456789101112131415161718192021222324252627282930313233343536373839404142434445464748495051525354555657585960
7
Data Analysis for Proteomics
Generation of the accurate mass and time tag database. We analyzed our LC-MS data by the
accurate mass and time (AMT) tag approach.16-18
In this method, the LC retention time and accurate
mass of peptides detected and confidently identified in an initial LC-MS/MS experiment are stored in a
database as putative mass tags (PMTs). Peptides detected in subsequent LC-MS experiments are
identified by matching their elution times and accurate masses to the PMT database, even if the peptide
is not selected for MS/MS fragmentation. Detecting a peptide in a second analysis with a mass and
elution time that match the database also serves to confirm the PMT, which then becomes an AMT tag,
a signature in the data indicating the presence of a particular peptide. Statistical techniques were
applied to assess the confidence of the matches and control the false discovery rate (FDR) as described
previously.32
Identified peptides were then quantified by LC-MS peak intensities.
The Geobacter bemidjiensis AMT tag database was populated with data from 115 individual LC-
MS analyses. To maximize the number of peptides in the AMT tag database, we prepared a pooled
sample of all the lab-grown G. bemidjiensis samples and fractionated it by off-line SCX chromatography.
Fractionation simplifies the mixture that is subjected to LC-MS analysis, allowing more proteins to be
detected. Twenty-eight LC-MS datasets were collected from the SCX fractions. Another 65 datasets
were derived from samples grown on fumarate, ferric citrate, or one of the solid iron(III) phases. This
category included all the runs used for protein quantitation. Finally, to improve the representation of c-
type cytochromes in the AMT tag database, 23 LC-MS analyses of in-gel digests of TMBZ-stained gel
bands from SDS-PAGE analysis of laboratory-grown G. bemidjiensis cultures were also included in the
library. Since these gel bands are stained for the presence of heme groups, the gel bands are enriched
for c-type cytochromes. All datasets were searched with TurboSequest v27.1233
using 3 Da precursor
mass tolerance for LTQ datasets and 50 ppm precursor mass tolerance for LTQ Orbitrap datasets, partial
tryptic peptide rules, up to 4 missed cleavages, and a dynamic modification of 615.1694 (heme c) on
cysteine residues. Sequest identifications were rescored with MS-GF.34-35
The maximum allowed MS-
GF spectral probability score allowed was 1x10⁻⁹
(lower scores represent more confident peptide-
spectrum matches). After filtering, the final database had 23,253 peptides, 16,610 of which were
identified and quantitated in the production LC-MS runs.
Note that MS/MS results from both high- and low-resolution instrumentation were combined to
generate the AMT tag database. Since the theoretical mass of an identified peptide (calculated from the
sequence) is used in the creation of a putative mass tag, high resolution MS data is not necessary. We
Page 7 of 37
ACS Paragon Plus Environment
Journal of Proteome Research
123456789101112131415161718192021222324252627282930313233343536373839404142434445464748495051525354555657585960

8
did not investigate the effect of low-resolution instrumentation versus high-resolution instrumentation
on the identifications used to generate the AMT tag database.
Statistical Analysis of Protein Abundance
Overcoming Matrix Effects Using a Linear Regression Data Analysis Approach. In the course of
these studies, we discovered that sample matrix effects had a significant impact on our results for
samples grown on HFO (both bulk and nanoparticle treatments). HFO, as a poorly crystalline iron
mineral, cannot be separated from the cell pellet by simple centrifugation. We speculate that density
gradient centrifugation could successfully separate cells from nanoparticles and avoid the problems
associated with residual dissolved iron, but since we did not detect the problem until after cell lysis and
digestion, we were unable to apply this method. We applied the common method of dissolving
insoluble HFO with oxalate prior to centrifugation and downstream sample preparation. However, we
found that HFO and/or the products of its reaction with oxalate (i.e., residual iron ions) interfered with
the estimation of peptide concentration by the BCA assay. The interference resulted in a large
overestimation of the protein concentration and a dramatically decreased sample loading and measured
LC-MS intensity for these samples. It is also possible that dissolved iron could have other effects, such as
inhibiting digestion by stabilizing iron-binding proteins or promoting oxidative chemical modifications of
peptides, but we focused our attention on the effect of dissolved iron on the estimation of peptide
concentration. We tested a variety of methods for effectively estimating the peptide concentration.
None proved satisfactory; therefore we decided to address the issue at the level of data processing
rather than sample preparation.
Without inter-dataset normalization,36
the protein abundances in the HFO-grown samples were
systematically lower in abundance than in the samples grown on ferric citrate or fumarate. The median
peptide log2 abundance values for HFO-grown samples ranged from 14-19, whereas the ferric citrate
and fumarate median log2 abundance values ranged from 21-22.5. The overall LC-MS intensity judged
by total ion chromatograms was also much higher for the non-HFO samples. We first analyzed the data
using a standard procedure for our laboratory, which we will designate as method 1: central tendency
normalization 36
, R-rollup37
to convert peptide data to protein abundances, and ANOVA with multiple
hypothesis testing correction by the q-value method38
(see Supplemental Methods). Method 1 analysis
resulted in the classification of an unreasonably high number of proteins (20-30% of all detected) as
differentially expressed. Furthermore, the majority of these proteins were judged to be more highly
expressed in the non-HFO condition; that is, in the condition with higher LC-MS signal, which suggests
Page 8 of 37
ACS Paragon Plus Environment
Journal of Proteome Research
123456789101112131415161718192021222324252627282930313233343536373839404142434445464748495051525354555657585960

9
that the combination of very different signal intensity and central tendency normalization introduced a
systematic bias.
To avoid this kind of artifact when comparing samples such as fumarate versus bulk HFO, for
which the iron interference/sample loading issue causes one of the samples (bulk or nanoparticle HFO)
to give a much higher overall signal than the other sample (fumarate or ferric citrate), we used a linear
regression procedure to make a series of pairwise comparisons between conditions. This approach,
which we designate Method 2, is similar to the linear regression normalization described by Callister et
al.,36
except that the linear regression was used to identify significant proteins directly, rather than to
normalize abundance values. In this respect, the method resembles the graphical displays of data used
by Beck et al.,39
and by Washburne and coworkers.40
Log2-transformed protein abundances were
calculated from peptide abundances by the R-rollup procedure as applied in DAnTE37
with no
normalization (other than the scaling procedure included in R-rollup). Peptides were required to be
present in at least 10% of datasets, and all other parameters were the defaults. This method exludes
proteins where only one peptide was detected, but due to missing data a protein result can be strongly
dependent on a single peptide’s abundance. Log2 protein abundances for each replicate dataset at a
given condition for a given experiment were averaged, and error bars were calculated as the standard
deviation (for n=3), half the range (for n=2, i.e., when one of the runs was an outlier or had missing
data). If data was missing in all but one run, then the error bar was taken as 10% of the non-missing
value. Only the datasets being compared were included in the rollup. For each observed protein, the
average log2 abundance values for condition 2 were plotted versus condition 1, and a regression line
calculated. Assuming a Gaussian distribution of residuals from the regression line, a z-score for each
protein was calculated as:
� =�� − �̅
��,
where the subscript p indicates a particular protein, dp is the residual from that protein, and d is the
mean of all dp (which is approximately zero, due to the assumptions of the linear regression). Only 5% of
the area under the curve occurs at more extreme values than z-score of ±1.96 in either direction, so
z=±1.96 is in a sense equivalent to a p-value of 0.05, which we have chosen as the critical value for
assessing significance. Only proteins detected in 2 or more out of 3 replicates for each condition were
used in calculating the regression line, but z-scores based on the distances from the regression line were
Page 9 of 37
ACS Paragon Plus Environment
Journal of Proteome Research
123456789101112131415161718192021222324252627282930313233343536373839404142434445464748495051525354555657585960

10
calculated for any proteins detected in as few as two runs in one condition and one in the other in a
pairwise comparison. Thus, Method 2 is less stringent with respect to missing data than Method 1.
Using Equation 1, we calculated dcrit, the value of d corresponding to z = ±1.96. Proteins with |z| < 1.96
and whose error bars were outside of the regression line ± dcrit were considered to have significantly
changing abundances. We also tracked the occurrence of proteins seen only in one condition or the
other. We filtered the data according to a series of heuristics meant to ensure that only proteins with
qualitative agreement (i.e., same direction of change) between the two experiments were counted as
differentially expressed. For instance, a protein was considered to change significantly if it was judged
significant in both experiments by the z-score and error bar criteria above, but also if it was judged
significant by z-score and error bar in one experiment and only by z-score in the other (that is, one of the
two experiments had large error bars), or if it was judged significantly upregulated in condition 1 in one
experiment and occurred only in condition 1 in the other experiment. The linear regression and
statistical analysis was carried out in the R statistical computing environment [33] using a custom script
(available in the Supplemental Methods); collation of the data and comparison of the two experiments
were done by a combination of custom Perl scripts and spreadsheet/database software.
To evaluate the linear regression procedure (Method 2), we compared it to Method 1. Details of
Method 1 can be found in Supplemental Methods. Where both methods could be applied, the
agreement was acceptable (Supplementary Material).
Due to the decreased sample loading for the insoluble iron-grown samples, we expect a greater
number of protein identifications in the ferric citrate and fumarate datasets. Therefore, in order to
provide the most conservative interpretation, we do not discuss proteins appearing only in ferric citrate
or fumarate-grown samples (and not in the insoluble iron-grown samples), although they are reported in
Table S2. This heuristic provides the most conservative interpretation of the data. Where protein
abundance could be estimated in both samples, the linear regression approach provides a confident
comparison.
Comparing Laboratory and Field Samples Using Spectral Counting. Because of the taxonomic
complexity of samples derived from the Rifle aquifer microbial community, these samples are not
amenable to proteomics analysis via the AMT tag approach. In addition, a quantitative statistical
comparison between laboratory and field samples is confounded by the many differences between the
two types of samples as well as the differences in sample handling. For this reason, we carried out a
spectral counting analysis (reviewed in 41
) of the field and laboratory data. Data were searched with
MSGF+34-35, 42
and filtered by mass measurement error and MSGF spectral probability to a peptide level
Page 10 of 37
ACS Paragon Plus Environment
Journal of Proteome Research
123456789101112131415161718192021222324252627282930313233343536373839404142434445464748495051525354555657585960

11
of 0.25% for field samples and 0.29% for laboratory samples. Two peptides per protein and two spectral
counts per peptide were required for confident protein identification. We used the spectral count data
for comparison between lab and field samples by principal components analysis. For comparing lists of
detected proteins, we used the results of spectral counting analysis for the field data and AMT tag
analysis for the laboratory data.
Results and Discussion
Performance of the Linear Regression Method
The linear regression method (described in Methods), was introduced to account for unintended
differences in sample loading arising from matrix effects on protein concentration measurement in
samples grown on solid iron mineral phases. We evaluated this method by comparison with a standard
data analysis pipeline. Where both analysis methods could be used (i.e., where there was no HFO-
related intensity difference, for instance when comparing fumarate and ferric citrate conditions), the
overlap was good (Figure 2, red points). The standard method is more sensitive, identifying more
significantly changing proteins than linear regression, but the additional differentially expressed proteins
called out by the standard method only are borderline cases in the linear regression method (Figure 2,
cyan points). The number of proteins detected by the linear regression method and not by the standard
method in this comparison is small (Figures 2 and S2, gold points), and likely due to the inclusion of
more proteins with missing data. These observations indicate that whereas the conventional method is
more sensitive to small changes, the linear regression method effectively detects large changes in
protein abundance. The false discovery rate (FDR) for significantly changing proteins in Method 1 is
controlled at 5% or less by the q-value method. Given the high degree of overlap between method 1
and method 2, and given that the proteins called out by method 2 tend to show larger changes on
average than those called out by method 1, we believe that the FDR of method 2 is likely similar to that
of method 1 or only slightly greater. The requirement for agreement between two complete replicates
of the entire experiment provides additional confidence that the FDR of significantly changing proteins is
acceptably low. We conclude that the linear regression method is an effective option in cases where
sample matrix effects make more rigorous data analysis methods impractical. Note that we have used
the term “significant” to describe changes in protein abundance as described in Methods, which may
not be equivalent to statistical significance in the strictest sense. In other words, the linear regresison
method derived here is an approximation.
Page 11 of 37
ACS Paragon Plus Environment
Journal of Proteome Research
123456789101112131415161718192021222324252627282930313233343536373839404142434445464748495051525354555657585960

12
Protein Expression: General Observations
A correlation matrix of protein abundance changes (Figure 1) based on the raw (un-normalized)
peptide intensities reveals similarities and differences between the four electron acceptor treatments.
Correlation matrices are similar for experiment 1 and experiment 2. The data in Figure 1 show that the
identity of the electron acceptor, and not early or late growth, is the most important experimental
factor influencing protein expression. Peptides collected from biomass grown on either form of poorly
crystalline iron mineral (bulk or nanoparticle) are more similar to each other, as represented by higher
Pearson correlation coefficients (mean Pearson correlation coefficient between all bulk and nanoparticle
analyses R=0.80±0.08), than they are to the soluble treatments (mean R =0.63±0.06). Similarly, samples
grown on soluble electron acceptors (ferric citrate, fumarate) are more similar to each other than they
are to insoluble electron acceptors (mean R=0.88±0.05 and R=0.63±0.06, respectively). This analysis
suggests that a similar complement of proteins may be responsible for growth on HFO, regardless of
differences in particle size or properties, although there are a few proteins specific to one or the other
(see below). In analogy to a proteomics study of G. sulfurreducens by Ding et al.,43
our data also suggest
that this HFO-induced proteome is different than the proteome observed during reduction of soluble
Fe(III). Another study by these same authors found proteomics differences between G. sulfurreducens
grown on ferric citrate or fumarate.44
In our results, the values of the correlation coefficients between
ferric citrate and fumarate runs suggest broadly similar protein expression profile between the two
conditions, but with a differences in the expression of many individual proteins.
To get a broad overview of the functions of proteins whose levels change significantly between
electron acceptors at roughly equivalent time points, we grouped these proteins according to the
Clusters of Orthologous Groups (COG) functional classes.45
To this list we added another class, c-type
cytochromes (as annotated in 15
). Functional classes that were enriched in at least one pairwise
comparison of terminal electron acceptors at the same time point (early or late growth) according to the
Method 2 (linear regression) analysis include coenzyme metabolism, post-translational modification,
protein turnover, chaperone functions, signal transduction, and most frequently, c-type cytochromes,
indicating that these cellular functions are important in responding to variation in the terminal electron
acceptor (Table 1). Our results show some similarities with results from transcriptomics laboratory
studies of G. uraniireducens grown on Rifle sediment or fumarate.46
In that study, transcript levels of c-
type cytochromes, genes relating to protein fate (i.e., protein folding, degradation, and trafficking), and
signal transduction genes were found to change significantly with the growth conditions. In this report,
Page 12 of 37
ACS Paragon Plus Environment
Journal of Proteome Research
123456789101112131415161718192021222324252627282930313233343536373839404142434445464748495051525354555657585960

13
we have chosen to focus on c-type cytochromes as they showed the greatest differential protein
expression patterns across the electron acceptor treatments (Table 1). The following section describes
the expression patterns of the observed c-type cytochromes. Information about proteins in the other
functional categories can be found in Table S1.
C-type Cytochromes
C-type cytochromes play a major role in electron transfer processes.47
Out of the 84 c-type
cytochromes encoded in the G. bemidjiensis genome, we detected 27-29 in the 8 samples (two growth
phases, 4 treatments). In two cases the detected peptides did not allow us to distinguish between
paralogs. Due to this inability to distinguish between paralogs, we treat those proteins as identical in
the subsequent discussion (Figure 3). Out of the detected c-type cytochromes, twelve showed a clearly
significant change in abundance between at least one set of conditions. Three proteins showed no
change in abundance across time or electron acceptor. Five cytochromes did not show a clear
expression pattern due to lack of agreement between methods 1 and 2, and thus were not included in
subsequent discussion. For the final seven proteins, the expression pattern could not be clearly
described due to missing data (Figure 3). In this category we have included proteins detected only in
ferric citrate or fumarate conditions, due to the sample loading issues discussed in Methods.
Cytochromes with Missing Data or No Clear Expression Pattern. Deletion of G. sulfurreducens
OmcH, an extracellular 24-heme cytochrome, decreases the efficiency of Fe(III) reduction by reducing
the expression of OmcB.48
Two detected homologues of OmcH are listed in Figure 3: Gbem_1153, a 27-
heme predicted to have an extracellular localization, and Gbem_3470, also predicted to have 27 hemes
but with predicted periplasmic/outer membrane localization (subcellular prediction performed by
PsortB49
). These two proteins have 99% sequence identity, and the two detected peptides are common
between the two proteins, so either protein could be represented. Peptides from these OmcH
homologues were detected too sporadically across electron acceptors and time points to draw any
conclusions about their specific roles.
Other cytochromes with no easily interpretable expression pattern due to missing data (that is,
proteins not detected in all LC-MS datasets) or from differences in protein loading between
experiments, include Gbem_0325 (1 heme group), Gbem_0679 (12 heme groups), Gbem_1100 (5 heme
groups), Gbem_1234 (1 heme group), Gbem_1236 (2 heme groups), and Gbem_3371 (10 heme groups).
Little is known about homologs of these cytochromes in other Geobacter spp., although Gbem_3371
belongs to the same family as Shewanella oneidensis MtrC, which, as part of the MtrCAB complex, plays
Page 13 of 37
ACS Paragon Plus Environment
Journal of Proteome Research
123456789101112131415161718192021222324252627282930313233343536373839404142434445464748495051525354555657585960

14
a key role in extracellular metal reduction in that organism.50
Five additional cytochromes (Gbem_2070,
Gbem_0095, Gbem_3352, Gbem_1249, and Gbem_0972) have expression patterns that are unclear due
to disagreements between the two replicate experiments.
Cytochromes with No Change in Expression. Gbem_2674 (five heme groups) and Gbem_3353
(one heme group) are both hypothetical proteins with predicted periplasmic/outer membrane
localizations (there is no available experimental data on localization, but the SignalP 4.1 server51
identifies signal peptides in both proteins). These proteins were detected at all time points with all
electron acceptors, but showed no significant differences in expression between any set of conditions.
This observation suggests that these proteins play a role in general electron transport processes and are
not linked to a specific substrate. A BLAST search of the UniprotKB database with Gbem_2674 reveals
that its closest homologue is Gbem_3059 (49.6 % sequence identity), which we did not detect in this
study. It also had significant sequence identity (20-22%) to proteins from G. lovleyi (Glov_1710), G.
metallireducens (Gmet_0679), G. daltoni (Geob_0309) and G. sulfurreducens (GSU2801), all annotated
simply as c-type cytochromes. The closest homologues of Gbem_3353 are uncharacterized and/or
putative proteins from Geobacter strains M21 (GM21_0892), M18 (GM18_3432), Rf64 (Geob_1863) and
G. uraniireducens (Gura_3283). The detection of these proteins (annotated as hypothetical proteins) in
our proteomics data shows that these genes are indeed translated in G. bemidjiensis, and suggests that
the homologous genes are expressed proteins in other Geobacter strains as well. These species are a
phylogenetically coherent group and have been identified as a clade predominating in subsurface
aquifer ecosystems, with important ramifications for environmental biogeochemical cycling.52
Together
these results highlight the yet undefined genomic potential that may catalyze functionally important
electron transfer reactions in the subsurface.
Gbem_3199, a seven-heme, predicted inner-membrane cytochrome c-nitrite reductase, is also
expressed in all conditions studied. The close G. sulfurreducens homologue GSU3259 was observed in
the cytosolic membrane fraction in the proteomics study of Ding et al.,44
but it was not more highly
expressed during growth on Fe(III) citrate than on citrate. The later proteomics study comparing Fe(III)
citrate and Fe(III) oxide by the same authors did not report GSU3259.43
At early stages of iron reduction,
Gbem_3199 is more highly expressed in ferric citrate than in fumarate conditions, but the difference is
not deemed significant by the criteria of the method 2 analysis because of data variability. However,
this change is deemed significant by method 1 (Table S5).
Differentially Expressed Cytochromes. The remaining twelve cytochromes (out of 27 detected)
were differentially expressed in at least one binary comparison. OmcF (GSU_2432) is a monoheme
Page 14 of 37
ACS Paragon Plus Environment
Journal of Proteome Research
123456789101112131415161718192021222324252627282930313233343536373839404142434445464748495051525354555657585960

15
cytochrome with predicted outer membrane localization.12
Deletion of OmcF in G. sulfurreducens
drastically impaired reduction of Fe(III) citrate, and resulted in loss of expression of OmcB and OmcC,
and increased expression of OmcS.12
Our data show that two G. bemidjiensis OmcF homologues,
Gbem_2183 and Gbem_1585 have very different expression patterns. Gbem_1585 tended to be more
highly expressed (or at least more frequently detected) during growth on soluble Fe(III) or fumarate
than on HFO at early times. By contrast, Gbem_2183 was more highly expressed during growth on solid
iron phases at both early and late reduction. While Gbem_2183 expression patterns showed no
difference between ferric citrate and fumarate at early stage, Gbem_2183 was more highly expressed in
fumarate than in ferric citrate during late reduction. The differences in expression patterns suggest that
in G. bemidjiensis, the two homologues have different roles, with Gbem_2183 being important for
growth on insoluble electron acceptors. Gbem_1585 and Gbem_2183 have 46% and 37% sequence
identity to G. sulfurreducens OmcF/GSU_2432, respectively, and 46% sequence identity to each other.
In G. sulfurreducens, OmcF controls expression of OmcB.12
Like Gbem_2183/OmcF, in our experiments
Gbem_3379/OmcB was more highly expressed during early reduction of poorly crystalline iron
substrates. Based on the loose correlation between expression of Gbem_2183/OmcF and
Gbem_3779/OmcB we speculate that Gbem_2183 plays a similar role to G. sulfurreducens OmcF (that is,
influencing expression of OmcB), and that Gbem_1585 plays a divergent role.
G. bemidjiensis has a total of five OmcS homologues (Gbem_1116, Gbem_1117, Gbem_1131,
Gbem_2679, and Gbem_2680) that all contain 6 hemes,15
and are predicted to localize to the
extracellular space. They have between 45%-56% sequence identity to G. sulfurreducens OmcS and 38%-
91% sequence identity to each other. Because of the high sequence identity, it is difficult to determine
which gene product was detected in our LC-MS experiments. Four OmcS peptides were detected: one
peptide unique to Gbem_1116, two common to Gbem_1116 and Gbem_2679, and one common to all of
Gbem_1116, Gbem_2679, and Gbem_2680. Therefore all of the peptide data can be explained by the
presence of Gbem_1116, although we cannot rule out the presence of Gbem_2679 and Gbem_2680. In
our data, OmcS is expressed in all conditions studied. OmcS expression was higher in ferric citrate
samples than in fumarate at early stage (although not significantly higher due to variability in the data),
and significantly higher in ferric citrate samples than in insoluble (bulk) iron at early times, but this
observation is based on a single significantly changing peptide. Interestingly, there was no significant
difference between ferric citrate and nanoparticle iron. There are no significant changes at later
reduction across the electron acceptors. In agreement with our data, G. sulfurreducens OmcS
transcripts are detected during log-phase growth on solid Fe(III).11
G. sulfurreducens OmcS is required
Page 15 of 37
ACS Paragon Plus Environment
Journal of Proteome Research
123456789101112131415161718192021222324252627282930313233343536373839404142434445464748495051525354555657585960
16
for the reduction of solid Fe(III) phases but not soluble Fe(III) citrate, but in our G. bemidjiensis data we
observed upregulation of OmcS in ferric citrate over fumarate.11
Recent transmission microscopy
studies53
have shown that OmcS associates with electrically conductive pili, likely acting as terminal
reductases for charge transfer between the microorganism and iron minerals. Although our data show
that OmcS is expressed during growth on iron minerals, we do not observe any up-regulation of OmcS in
response to growth on iron mineral phases.
OmcB is a decaheme outer-membrane cytochrome that, in G. sulfurreducens, is important for
growth on ferric citrate, but not on fumarate.14
We detected two homologues of OmcB in G.
bemidjiensis (Gbem_3354 and Gbem_3379), both with unknown localization, and with 10 and 12 hemes,
respectively. Gbem_3354 is expressed in all conditions studied, with no differential expression except
for significant up-regulation in nanoparticle iron medium over bulk solid iron medium at early stage..
However, the peptide-level evidence for this change is weak (not shown). If Gbem_3354 is in fact
upregulated in the presence of nanoparticles, expression may be regulated by minerological or redox
factors or particle size. Further research is necessary to validate this observation. Gbem_3379 was also
expressed in all conditions, and is up-regulated in both bulk and NP iron mineral phases over both ferric
citrate and fumarate at early stages of iron reduction. The differences between ferric citrate and
insoluble iron persisted later into the reduction process, but the differences between fumarate and
insoluble iron phases did not. In keeping with this observation, Gbem_3379 was also more highly
expressed in fumarate than in ferric citrate during late time points. One way to interpret this expression
pattern is that poorly crystalline solid iron promotes the expression of G. bemidjiensis OmcB
(Gbem_3379), whereas prolonged ferric citrate exposure inhibits its expression. Thus, Gbem_3379
could play a key role in reduction of iron minerals and is a good candidate for further study in subsurface
strains. The observation that Gbem_3379 and Gbem_3354 have different expression patterns, along
with the differing numbers of heme groups, suggests that these two proteins have distinct functional
roles. Ding et al. reported that G. sulfurreducens OmcB protein is more highly expressed during growth
on ferric citrate than during growth on fumarate at late stage in batch cultures 44
, the opposite of our
result for Gbem_3379. We therefore speculate that Gbem_3354 may play a similar functional role to G.
sulfurreducens OmcB and Gbem_3379 a more divergent role, but both may be important in the
subsurface where organisms encounter both soluble and insoluble forms of iron.
In G. sulfurreducens, the tri-heme periplasmic cytochrome PpcA is involved in reduction of
Fe(III), humic substances, and U(VI) when acetate is the electron donor, but has not been implicated in
reduction of fumarate.13, 54
There are four ppc genes in G. sulfurreducens, each with slightly different
Page 16 of 37
ACS Paragon Plus Environment
Journal of Proteome Research
123456789101112131415161718192021222324252627282930313233343536373839404142434445464748495051525354555657585960
17
functions.54
Of the three Ppc-family genes present in G. bemidjiensis,15
we detected only Gbem_3455
(PpcG). In our data, at early stage, Gbem_3455 was more highly expressed in the presence of bulk HFO
than in fumarate or ferric citrate. Interestingly, the PpcA knockout in G. sulfurreducens13
was suggested
to play a role in electron transfer during growth on soluble Fe(III) citrate with acetate as the electron
donor (growth on solid iron mineral was not investigated in that study). In our data, however, there was
no clear evidence of increased Ppc protein expression during growth on soluble ferric citrate. These
results may indicate distinct functional roles for different ppc genes, or alternatively a functional
difference between G. bemidjiensis and G. sulfurreducens.
Comparison of Laboratory Cultures and Previously-Studied Rifle Groundwater Samples
Extensive proteomics experiments have previously been carried out on microbial biomass
filtered from groundwater at an acetate amendment field site at Rifle, CO. 3-4, 19
Geobacter species, in
particular species and strains closely resembling G. bemidjiensis, are the predominant species to be
stimulated by acetate addition to the groundwater.3 Using the AMT tag approach with a database of G.
bemidjiensis peptides is problematic for such microbial community samples, since the potential for
incorrect database matches is high. Therefore, we reanalyzed the Rifle LC-MS/MS datasets collected in
2010,55
along with our laboratory data, using a spectral counting approach.(ref) Field and laboratory
samples were then subjected to principal components analysis (PCA), a dimension-reduction technique
that allows analysis of variation and clustering in the data. Figure 4A shows a scatter plot of the first two
principle components of the spectral count data, which together account for 43% of the total variation
in the input data. As with Figure 1 above, it is clear that the protein expression profiles of ferric citrate
and fumarate samples closely resemble one another, as do the protein expression profiles of
nanoparticle and bulk solid iron mineral samples. The Rifle field samples also form a distinct tight
cluster, but they do not cluster with either the HFO or the non-HFO laboratory samples. This finding is
not surprising since the complex conditions prevailing in the field are not completely replicated in any of
our batch culture systems.
To complement the PCA analysis and to provide a quantitative assessment of similarity between
field and laboratory samples, we also calculated the correlation coefficients between each group of
samples and performed a hierarchical clustering analysis (Figure 4B). The correlation analysis confirms
that Rifle samples most closely resemble each other, with about the same degree of similarity to the
laboratory samples regardless of culture conditions.
Page 17 of 37
ACS Paragon Plus Environment
Journal of Proteome Research
123456789101112131415161718192021222324252627282930313233343536373839404142434445464748495051525354555657585960

18
Each principle component consists of contributions from hundreds of proteins, making detailed
interpretation of the PCA results at the level of individual proteins difficult. Therefore we have
examined the correlations between the first principal component (PC1) and the individual protein
abundances across the sample categories. A strong correlation indicates that a given protein
contributes to the trend described by PC1. Although many COG functional categories had proteins that
correlated highly with PC1, the COG functional classes with the most extreme median correlation
coefficients were N (cell motility), T (signal transduction), and R (general functional prediction only).
Spectral counts for proteins in the N and T categories were negatively correlated with PC1. This analysis
suggests that proteins related to cell motility and signal transduction are among the important proteins
defining PC1, and therefore among the proteins that differentiate between field samples and lab
samples, at least in the datasets used here.
The large differences between the Rifle and laboratory experiments make a direct proteomic
comparison problematic. Importantly, the laboratory samples came from cultures of a single organism,
whereas the field samples contained more complex microbial communities consisting of many different
species and strains. Additionally some differences in measurement methods apply: the Rifle samples
were fractionated by strong cation exchange chromatography before LC-MS analysis, but no replicates
were run.. By contrast, the laboratory samples were run without prior fractionation, but with multiple
biological and technical replicates. The laboratory medium was also supplemented with vitamins and
minerals, whose concentrations may be much lower in the Rifle groundwater systems. For these
reasons, we felt that a direct statistical comparison of field versus laboratory samples would not be
valid. However, we have conducted a qualitative comparison based on the detection (at a high level of
confidence) or non-detection of proteins in the various samples. This comparison used the list of
confidently identified proteins from the Rifle spectral counting analysis. The list of proteins identified in
the laboratory-grown samples was derived from the AMT tag analysis. Figure 5 shows the results of this
analysis as a Venn diagram. Proteins common to all laboratory samples and to the Rifle samples form
the largest set (612 proteins). These “common core” proteins are enriched in housekeeping genes,
including 44 ribosomal proteins, aminoacyl tRNA synthetases for all 20 amino acids, TCA cycle enzymes,
and proteins involved in carbohydrate, amino acid, and nucleotide metabolism (Figure 6A). The second-
largest set consists of proteins common to all samples except the Rifle field samples. This group of
proteins was also enriched for many of the same functional categories as the common core, but with the
addition of c-type cytochromes (c-type cytochromes found in the laboratory-grown samples in this study
are listed in Figure 3). We initially speculated that this observation reflected the differences between
Page 18 of 37
ACS Paragon Plus Environment
Journal of Proteome Research
123456789101112131415161718192021222324252627282930313233343536373839404142434445464748495051525354555657585960

19
database searches used to construct the AMT tag database (which included heme c as a dynamic
modification) and those used to analyze the Rifle data (which did not include a heme c dynamic
modification). However, a search of the Rifle data using a dynamic modification of 615.1694 Da on
cysteinyl residues56-57
revealed no heme-c modified peptides when filtered to ≤1% peptide-level FDR.
This observation therefore likely reflects a real biological finding that more c-type cytochromes are
expressed in our laboratory conditions than in the field. However, differences in identifying proteins and
in estimating relative protein abundances due to differences between the AMT tag and spectral
counting approaches, cannot be ruled out, nor can matrix effects.
The set of proteins unique to the Rifle samples is of particular interest. In keeping with the PCA
analysis, the COG categories for cell motility (N, 31 proteins, p=3.3×10⁻³²
) and signal transduction (T, 39
proteins, p=3.2×10⁻¹⁷
, including 21 proteins common to both functional classes, Figure 6B) are
significantly enriched in this set. Based on their annotations, these proteins (Table 2) are likely related to
chemotaxis, and include proteins annotated as flagellar proteins, response regulators, histidine kinases
and methyl-accepting chemotaxis proteins. Despite the differences between the lab and field
experiments, and considering that the high complexity of an environmental microbial community
sample increases the difficulty of detecting a given protein, the fact that several proteins in this class
were detected only in the field sample is notable. This suite of proteins specific to the field samples
likely reflect the environmental conditions found in the subsurface, where electron acceptors (e.g. solid
phase Fe(III)) and other nutrients are present at lower concentrations than in the laboratory batch
incubations. Under these field conditions, a planktonic lifestyle may be advantageous, or even
necessary, for continued growth and survival. The large number of proteins in this group annotated as
“methyl-accepting chemotaxis sensory transducer,” identified by unique peptides, raises the question of
what chemoattractants are being sensed, and to what degree these proteins might be functionally
redundant. This list of proteins therefore provides interesting targets for future study.
Conclusions
Using a linear-regression based procedure, we have analyzed label-free, intensity-based LC-MS
proteomics data in the presence of large, systematic differences in signal between datasets. The
method is more lenient with respect to missing data than, and sometimes can be influenced by a single
peptide observation, but it proved robust enough to allow biological insight into changes in the
proteome of G. bemidjiensis under growth on fumarate, ferric citrate, or insoluble iron minerals as the
terminal electron acceptor. We detected between 27 and 29 cytochromes (the observed peptides do
Page 19 of 37
ACS Paragon Plus Environment
Journal of Proteome Research
123456789101112131415161718192021222324252627282930313233343536373839404142434445464748495051525354555657585960

20
not always allow distinction between closely related proteins.) A number of cytochromes appeared to
have constitutive expression or had no clear expression pattern. But we also found that the expression
of several c-type cytochromes changed in response to these conditions, sometimes in ways that do not
parallel prior work on G. sulfurreducens. Indeed, in at least two cases (OmcF, OmcB), a gene previously
studied in G. sulfurreducens has more than one homologue in G. bemidjiensis, and the protein
expression patterns hint at divergent function between the homologues. This finding suggests some
degree of divergence in extracellular metal reduction pathways between the two species, and thus the
possibility that there is not just one mechanism of microbial extracellular metal respiration, but several.
It is our hope that the present protein expression data will encourage further research into these
variations.
By comparing our proteomics results on laboratory cultures with previous proteomic analyses of
field samples, we found that field samples express many more proteins involved in motility, chemotaxis
and signal transduction. This finding suggests that in situ, G. bemidjiensis may actively travel to insoluble
iron(III) electron acceptors. Recent cryo-transmission electron microscopy studies showed iron mineral
nanoparticles bound to the surface of Geobacter cells.58
In that study, the authors suggested that cell-
bound nanoparticles explain how iron-reducing bacteria can be both mineral-dependent and planktonic.
The suggestion that motility and chemotaxis proteins are not as readily detected in laboratory culture,
and the fact that the groundwater sampling methods are biased toward planktonic organisms, leaves
open the possibility that G. bemidjiensis could also exist with a distinct physiological state in other
ecological niches.
Supporting Information Available
This material is available free of charge via http://pubs.acs.org. Supplementary Methods,
Supplementary Figures S1 (Boxplot of peptide abundances from AMT tag analysis), Figures S2-S7 (linear
regression proteomics analysis scatter plots for each pair of laboratory culture conditions).
Supplementary Tables (provided as Microsoft Excel spreadsheets) S1 (Summary of protein expression by
linear regression analysis), S2 (Details of the functional enrichment analysis shown in Figure 6 in the
main text), S3-S6 (Summary of protein expression by standard analysis, i.e., Method 1. Provided as a
single Excel spreadsheet). LinearRegressionMethodExample.R.txt: Example R script for performing
linear regression analysis.
Acknowledgments
Page 20 of 37
ACS Paragon Plus Environment
Journal of Proteome Research
123456789101112131415161718192021222324252627282930313233343536373839404142434445464748495051525354555657585960

21
This work was funded by a grant from the DOE/BER for Pan-Omics Technologies Development,
Implementation and Applications and by DOE/SBR grant DE-SC-0004733. Portions of this research were
conducted at the Environmental and Molecular Sciences Laboratory, a DOE/BER National Scientific User
Facility located at Pacific Northwest National Laboratory in Richland, Washington. The authors would
like to thank Ashoka Polpitiya for a helpful discussion, Karl Weitz and Justin Chambers for LC-MS
analyses, and Sam Purvine and Matt Monroe for assistance with data management and analysis.
References
(1) Lovley, D. R. Bug juice: harvesting electricity with microorganisms. Nat Rev Micro 2006, 4 (7), 497-
508.
(2) Lovley, D. R. Live wires: direct extracellular electron exchange for bioenergy and the bioremediation
of energy-related contamination. Energy Environ. Sci. 2011, 4 (12).
(3) Wilkins, M. J.; VerBerkmoes, N. C.; Williams, K. H.; Callister, S. J.; Mouser, P. J.; Elifantz, H.; et al.
Proteogenomic Monitoring of Geobacter Physiology during Stimulated Uranium Bioremediation. Appl.
Environ. Microbiol. 2009, 75 (20), 6591-6599.
(4) Callister, S. J.; Wilkins, M. J.; Nicora, C. D.; Williams, K. H.; Banfield, J. F.; VerBerkmoes, N. C.; et al.
Analysis of Biostimulated Microbial Communities from Two Field Experiments Reveals Temporal and
Spatial Differences in Proteome Profiles. Environ. Sci. Technol. 2010, 44 (23), 8897-8903.
(5) Anderson, R. T.; Vrionis, H. A.; Ortiz-Bernad, I.; Resch, C. T.; Long, P. E.; Dayvault, R.; et al.
Stimulating the In Situ Activity of Geobacter Species To Remove Uranium from the Groundwater of a
Uranium-Contaminated Aquifer. Appl. Environ. Microbiol. 2003, 69 (10), 5884-5891.
(6) Qian, X.; Mester, T.; Morgado, L.; Arakawa, T.; Sharma, M. L.; Inoue, K.; et al. Biochemical
characterization of purified OmcS, a c-type cytochrome required for insoluble Fe(III) reduction in
Geobacter sulfurreducens. Biochimica et Biophysica Acta (BBA) - Bioenergetics 2011, 1807 (4), 404-412.
(7) Voordeckers, J. W.; Kim, B. C.; Izallalen, M.; Lovley, D. R. Role of Geobacter sulfurreducens Outer
Surface c-Type Cytochromes in Reduction of Soil Humic Acid and Anthraquinone-2,6-Disulfonate. Appl.
Environ. Microbiol. 2010, 76 (7), 2371-2375.
(8) Inoue, K.; Qian, X. L.; Morgado, L.; Kim, B. C.; Mester, T.; Izallalen, M.; et al. Purification and
Characterization of OmcZ, an Outer-Surface, Octaheme c-Type Cytochrome Essential for Optimal
Current Production by Geobacter sulfurreducens. Appl. Environ. Microbiol. 2010, 76 (12), 3999-4007.
(9) Inoue, K.; Franks, A. E.; Nevin, K. P.; Lovley, D. R. OmcZ, a mobile, extracellular, c-type cytochrome
that accumulates at the anode in current-producing biofilms of Geobacter sulfurreducens. Abstracts of
Papers of the American Chemical Society 2010, 239.
(10) Holmes, D. E.; Mester, T.; O'Neil, R. A.; Perpetua, L. A.; Larrahondo, M. J.; Glaven, R.; et al. Genes
for two multicopper proteins required for Fe(III) oxide reduction in Geobacter sulfurreducens have
different expression patterns both in the subsurface and on energy-harvesting electrodes. Microbiology
2008, 154 (5), 1422-1435.
(11) Mehta, T.; Coppi, M. V.; Childers, S. E.; Lovley, D. R. Outer Membrane c-Type Cytochromes
Required for Fe(III) and Mn(IV) Oxide Reduction in Geobacter sulfurreducens. Appl. Environ. Microbiol.
2005, 71 (12), 8634-8641.
(12) Kim, B.-C.; Leang, C.; Ding, Y.-H. R.; Glaven, R. H.; Coppi, M. V.; Lovley, D. R. OmcF, a Putative c-
Type Monoheme Outer Membrane Cytochrome Required for the Expression of Other Outer Membrane
Cytochromes in Geobacter sulfurreducens. J. Bacteriol. 2005, 187 (13), 4505-4513.
Page 21 of 37
ACS Paragon Plus Environment
Journal of Proteome Research
123456789101112131415161718192021222324252627282930313233343536373839404142434445464748495051525354555657585960

22
(13) Lloyd, J. R.; Leang, C.; Hodges Myerson, A. L.; Coppi, M. V.; Cuifo, S.; Methe, B.; et al. Biochemical
and genetic characterization of PpcA, a periplasmic c-type cytochrome in Geobacter sulfurreducens.
Biochem. J. 2003, 369 (1), 153-161.
(14) Leang, C.; Coppi, M. V.; Lovley, D. R. OmcB, a c-Type Polyheme Cytochrome, Involved in Fe(III)
Reduction in Geobacter sulfurreducens. J. Bacteriol. 2003, 185 (7), 2096-2103.
(15) Aklujkar, M.; Young, N.; Holmes, D.; Chavan, M.; Risso, C.; Kiss, H.; et al. The genome of Geobacter
bemidjiensis, exemplar for the subsurface clade of Geobacter species that predominate in Fe(III)-
reducing subsurface environments. BMC Genomics 2010, 11 (1), 490.
(16) Conrads, T. P.; Anderson, G. A.; Veenstra, T. D.; Paša-Tolić, L.; Smith, R. D. Utility of Accurate Mass
Tags for Proteome-Wide Protein Identification. Anal. Chem. 2000, 72 (14), 3349-3354.
(17) Smith, R. D.; Anderson, G. A.; Lipton, M. S.; Pasa-Tolic, L.; Shen, Y.; Conrads, T. P.; et al. An accurate
mass tag strategy for quantitative and high-throughput proteome measurements. PROTEOMICS 2002, 2
(5), 513-523.
(18) Jaitly, N.; Monroe, M. E.; Petyuk, V. A.; Clauss, T. R. W.; Adkins, J. N.; Smith, R. D. Robust Algorithm
for Alignment of Liquid Chromatography−Mass Spectrometry Analyses in an Accurate Mass and Time
Tag Data Analysis Pipeline. Anal. Chem. 2006, 78 (21), 7397-7409.
(19) Wilkins, M. J.; Wrighton, K. C.; Nicora, C. D.; Williams, K. H.; McCue, L. A.; Handley, K. M.; et al.
Fluctuations in Species-Level Protein Expression Occur during Element and Nutrient Cycling in the
Subsurface. PLoS One 2013, 8 (3), 11.
(20) McLaughlin, J. R.; Ryden, J. C.; Syers, J. K. SORPTION OF INORGANIC PHOSPHATE BY IRON- AND
ALUMINIUM- CONTAINING COMPONENTS. Journal of Soil Science 1981, 32 (3), 365-378.
(21) Penn, R. L.; Erbs, J. J.; Gulliver, D. M. Controlled growth of alpha-FeOOH nanorods by exploiting-
oriented aggregation. Journal of Crystal Growth 2006, 293 (1), 1-4.
(22) Gilbert, B.; Erbs, J. J.; Penn, R. L.; Petkov, V.; Spagnoli, D.; Waychunas, G. A. A disordered
nanoparticle model for 6-line ferrihydrite. American Mineralogist 2013, 98 (8-9), 1465-1476.
(23) Lovley, D. R.; Phillips, E. J. P. Novel Mode of Microbial Energy Metabolism: Organic Carbon
Oxidation Coupled to Dissimilatory Reduction of Iron or Manganese. Appl. Environ. Microbiol. 1988, 54
(6), 1472-1480.
(24) Wrighton, K. C.; Thrash, J. C.; Melnyk, R. A.; Bigi, J. P.; Byrne-Bailey, K. G.; Remis, J. P.; et al.
Evidence for Direct Electron Transfer by a Gram-Positive Bacterium Isolated from a Microbial Fuel Cell.
Appl. Environ. Microbiol. 2011, 77 (21), 7633-7639.
(25) Fredrickson, J. K.; Zachara, J. M.; Kennedy, D. W.; Dong, H.; Onstott, T. C.; Hinman, N. W.; et al.
Biogenic iron mineralization accompanying the dissimilatory reduction of hydrous ferric oxide by a
groundwater bacterium. Geochim. Cosmochim. Acta 1998, 62 (19–20), 3239-3257.
(26) Lovley, D. R.; Phillips, E. J. P. Rapid Assay for Microbially Reducible Ferric Iron in Aquatic Sediments.
Appl. Environ. Microbiol. 1987, 53 (7), 1536-1540.
(27) Schwertmann, U. Differenzierung der Eisenoxide des Bodens durch Extraktion mit
Ammoniumoxalat-Lösung. Zeitschrift für Pflanzenernährung, Düngung, Bodenkunde 1964, 105 (3), 194-
202.
(28) Thomas, P. E.; Ryan, D.; Levin, W. An improved staining procedure for the detection of the
peroxidase activity of cytochrome P-450 on sodium dodecyl sulfate polyacrylamide gels. Anal. Biochem.
1976, 75 (1), 168-176.
(29) Shevchenko, A.; Tomas, H.; Havlis, J.; Olsen, J. V.; Mann, M. In-gel digestion for mass spectrometric
characterization of proteins and proteomes. Nat. Protocols 2007, 1 (6), 2856-2860.
(30) Yang, F.; Shen, Y. F.; Camp, D. G.; Smith, R. D. High-pH reversed-phase chromatography with
fraction concatenation for 2D proteomic analysis. Expert Review of Proteomics 2012, 9 (2), 129-134.
Page 22 of 37
ACS Paragon Plus Environment
Journal of Proteome Research
123456789101112131415161718192021222324252627282930313233343536373839404142434445464748495051525354555657585960

23
(31) Livesay, E. A.; Tang, K.; Taylor, B. K.; Buschbach, M. A.; Hopkins, D. F.; LaMarche, B. L.; et al. Fully
Automated Four-Column Capillary LC−MS System for Maximizing Throughput in Proteomic Analyses.
Anal. Chem. 2007, 80 (1), 294-302.
(32) Stanley, J. R.; Adkins, J. N.; Slysz, G. W.; Monroe, M. E.; Purvine, S. O.; Karpievitch, Y. V.; et al. A
Statistical Method for Assessing Peptide Identification Confidence in Accurate Mass and Time Tag
Proteomics. Anal. Chem. 2011, 83 (16), 6135-6140.
(33) Eng, J. K.; McCormack, A. L.; Yates, J. R. An approach to correlate tandem mass spectral data of
peptides with amino acid sequences in a protein database. J. Am. Soc. Mass Spectrom. 1994, 5 (11), 976-
989.
(34) Kim, S.; Gupta, N.; Pevzner, P. A. Spectral Probabilities and Generating Functions of Tandem Mass
Spectra: A Strike against Decoy Databases. J. Proteome Res. 2008, 7 (8), 3354-3363.
(35) Kim, S.; Mischerikow, N.; Bandeira, N.; Navarro, J. D.; Wich, L.; Mohammed, S.; et al. The
Generating Function of CID, ETD, and CID/ETD Pairs of Tandem Mass Spectra: Applications to Database
Search. Mol. Cell. Proteomics 2010, 9 (12), 2840-2852.
(36) Callister, S. J.; Barry, R. C.; Adkins, J. N.; Johnson, E. T.; Qian, W.-j.; Webb-Robertson, B.-J. M.; et al.
Normalization Approaches for Removing Systematic Biases Associated with Mass Spectrometry and
Label-Free Proteomics. J. Proteome Res. 2006, 5 (2), 277-286.
(37) Polpitiya, A. D.; Qian, W.-J.; Jaitly, N.; Petyuk, V. A.; Adkins, J. N.; Camp, D. G.; et al. DAnTE: a
statistical tool for quantitative analysis of -omics data. Bioinformatics 2008, 24 (13), 1556-1558.
(38) Storey, J. D.; Tibshirani, R. Statistical significance for genomewide studies. Proc. Natl. Acad. Sci. U.
S. A. 2003, 100 (16), 9440-9445.
(39) Beck, D. A. C.; Hendrickson, E. L.; Vorobev, A.; Wang, T.; Lim, S.; Kalyuzhnaya, M. G.; et al. An
Integrated Proteomics/Transcriptomics Approach Points to Oxygen as the Main Electron Sink for
Methanol Metabolism in Methylotenera mobilis. J. Bacteriol. 2011, 193 (18), 4758-4765.
(40) Zybailov, B.; Mosley, A. L.; Sardiu, M. E.; Coleman, M. K.; Florens, L.; Washburn, M. P. Statistical
Analysis of Membrane Proteome Expression Changes in Saccharomyces cerevisiae. J. Proteome Res.
2006, 5 (9), 2339-2347.
(41) Lundgren, D. H.; Hwang, S.-I.; Wu, L.; Han, D. K. Role of spectral counting in quantitative
proteomics. Expert Review of Proteomics 2010, 7 (1), 39-53.
(42) Kim, S.; Pevzner, P. A. MS-GF+ makes progress towards a universal database search tool for
proteomics. Nat Commun 2014, 5.
(43) Ding, Y.-H. R.; Hixson, K. K.; Aklujkar, M. A.; Lipton, M. S.; Smith, R. D.; Lovley, D. R.; et al. Proteome
of Geobacter sulfurreducens grown with Fe(III) oxide or Fe(III) citrate as the electron acceptor.
Biochimica et Biophysica Acta (BBA) - Proteins & Proteomics 2008, 1784 (12), 1935-1941.
(44) Ding, Y.-H. R.; Hixson, K. K.; Giometti, C. S.; Stanley, A.; Esteve-Núñez, A.; Khare, T.; et al. The
proteome of dissimilatory metal-reducing microorganism Geobacter sulfurreducens under various
growth conditions. Biochimica et Biophysica Acta (BBA) - Proteins & Proteomics 2006, 1764 (7), 1198-
1206.
(45) Tatusov, R.; Fedorova, N.; Jackson, J.; Jacobs, A.; Kiryutin, B.; Koonin, E.; et al. The COG database:
an updated version includes eukaryotes. BMC Bioinformatics 2003, 4 (1), 41.
(46) Holmes, D. E.; O'Neil, R. A.; Chavan, M. A.; N'Guessan, L. A.; Vrionis, H. A.; Perpetua, L. A.; et al.
Transcriptome of Geobacter uraniireducens growing in uranium-contaminated subsurface sediments.
Isme Journal 2008, 3 (2), 216-230.
(47) Lovley, D. R. The microbe electric: conversion of organic matter to electricity. Curr. Opin.
Biotechnol. 2008, 19 (6), 564-571.
(48) Kim, B.-C.; Qian, X.; Leang, C.; Coppi, M. V.; Lovley, D. R. Two Putative c-Type Multiheme
Cytochromes Required for the Expression of OmcB, an Outer Membrane Protein Essential for Optimal
Fe(III) Reduction in Geobacter sulfurreducens. J. Bacteriol. 2006, 188 (8), 3138-3142.
Page 23 of 37
ACS Paragon Plus Environment
Journal of Proteome Research
123456789101112131415161718192021222324252627282930313233343536373839404142434445464748495051525354555657585960

24
(49) Yu, N. Y.; Wagner, J. R.; Laird, M. R.; Melli, G.; Rey, S.; Lo, R.; et al. PSORTb 3.0: improved protein
subcellular localization prediction with refined localization subcategories and predictive capabilities for
all prokaryotes. Bioinformatics 2010, 26 (13), 1608-1615.
(50) Hartshorne, R. S.; Reardon, C. L.; Ross, D.; Nuester, J.; Clarke, T. A.; Gates, A. J.; et al.
Characterization of an electron conduit between bacteria and the extracellular environment. Proc. Natl.
Acad. Sci. U. S. A. 2009, 106 (52), 22169-22174.
(51) Petersen, T. N.; Brunak, S.; von Heijne, G.; Nielsen, H. SignalP 4.0: discriminating signal peptides
from transmembrane regions. Nat Meth 2011, 8 (10), 785-786.
(52) Holmes, D. E.; O'Neil, R. A.; Vrionis, H. A.; N'Guessan, L. A.; Ortiz-Bernad, I.; Larrahondo, M. J.; et al.
Subsurface clade of Geobacteraceae that predominates in a diversity of Fe(III)-reducing subsurface
environments. Isme Journal 2007, 1 (8), 663-677.
(53) Leang, C.; Qian, X.; Mester, T.; Lovley, D. R. Alignment of the c-Type Cytochrome OmcS along Pili of
Geobacter sulfurreducens. Appl. Environ. Microbiol. 2010, 76 (12), 4080-4084.
(54) Lovley, D. R.; Ueki, T.; Zhang, T.; Malvankar, N. S.; Shrestha, P. M.; Flanagan, K. A.; et al.,
Geobacter: The Microbe Electric's Physiology, Ecology, and Practical Applications. In Adv. Microb.
Physiol., Robert, K. P., Ed. Academic Press: 2011; Vol. Volume 59, pp 1-100.
(55) Wilkins, M. J.; Wrighton, K. C.; Nicora, C. D.; Williams, K. H.; McCue, L. A.; Handley, K. M.; et al.
Fluctuations in Species-Level Protein Expression Occur during Element and Nutrient Cycling in the
Subsurface. PLoS One 2013, 8 (3), e57819.
(56) Yang, F.; Bogdanov, B.; Strittmatter, E. F.; Vilkov, A. N.; Gritsenko, M.; Shi, L.; et al. Characterization
of Purified c-Type Heme-Containing Peptides and Identification of c-Type Heme-Attachment Sites in
Shewanella oneidenis Cytochromes Using Mass Spectrometry. J. Proteome Res. 2005, 4 (3), 846-854.
(57) Merkley, E. D.; Anderson, B. J.; Park, J.; Belchik, S. M.; Shi, L.; Monroe, M. E.; et al. Detection and
Identification of Heme c-Modified Peptides by Histidine Affinity Chromatography, High-Performance
Liquid Chromatography–Mass Spectrometry, and Database Searching. J. Proteome Res. 2012, 11 (12),
6147-6158.
(58) Luef, B.; Fakra, S. C.; Csencsits, R.; Wrighton, K. C.; Williams, K. H.; Wilkins, M. J.; et al. Iron-
reducing bacteria accumulate ferric oxyhydroxide nanoparticle aggregates that may support planktonic
growth. Isme Journal 2013, 7 (2), 338-350.
(59) Tatusov, R. L.; Fedorova, N. D.; Jackson, J. D.; Jacobs, A. R.; Kiryutin, B.; Koonin, E. V.; et al. The COG
database: an updated version includes eukaryotes. BMC Bioinformatics 2003, 4.
Page 24 of 37
ACS Paragon Plus Environment
Journal of Proteome Research
123456789101112131415161718192021222324252627282930313233343536373839404142434445464748495051525354555657585960
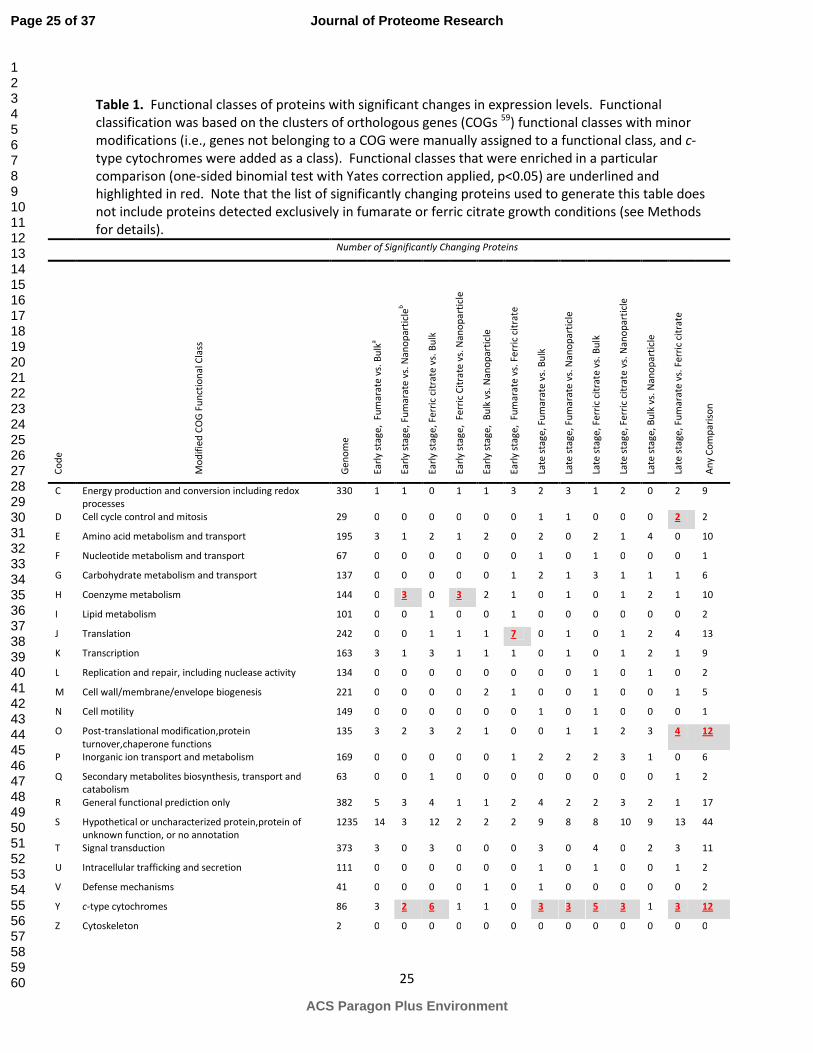
25
Table 1. Functional classes of proteins with significant changes in expression levels. Functional
classification was based on the clusters of orthologous genes (COGs 59
) functional classes with minor
modifications (i.e., genes not belonging to a COG were manually assigned to a functional class, and c-
type cytochromes were added as a class). Functional classes that were enriched in a particular
comparison (one-sided binomial test with Yates correction applied, p<0.05) are underlined and
highlighted in red. Note that the list of significantly changing proteins used to generate this table does
not include proteins detected exclusively in fumarate or ferric citrate growth conditions (see Methods
for details). Number of Significantly Changing Proteins
Co
de
Mo
dif
ied
CO
G F
un
ctio
na
l Cla
ss
Ge
no
me
Ea
rly s
tag
e,
Fu
ma
rate
vs.
Bu
lka
Ea
rly s
tag
e,
Fu
ma
rate
vs.
Na
no
pa
rtic
leb
Ea
rly s
tag
e,
Fe
rric
cit
rate
vs.
Bu
lk
Ea
rly s
tag
e,
Fe
rric
Cit
rate
vs.
Na
no
pa
rtic
le
Ea
rly s
tag
e,
Bu
lk v
s. N
an
op
art
icle
Ea
rly s
tag
e,
Fu
ma
rate
vs.
Fe
rric
cit
rate
Late
sta
ge
, F
um
ara
te v
s. B
ulk
Late
sta
ge
, F
um
ara
te v
s. N
an
op
art
icle
Late
sta
ge
, F
err
ic c
itra
te v
s. B
ulk
Late
sta
ge
, F
err
ic c
itra
te v
s. N
an
op
art
icle
Late
sta
ge
, B
ulk
vs.
Na
no
pa
rtic
le
Late
sta
ge
, F
um
ara
te v
s. F
err
ic c
itra
te
An
y C
om
pa
riso
n
C Energy production and conversion including redox
processes
330 1 1 0 1 1 3 2 3 1 2 0 2 9
D Cell cycle control and mitosis 29 0 0 0 0 0 0 1 1 0 0 0 2 2
E Amino acid metabolism and transport 195 3 1 2 1 2 0 2 0 2 1 4 0 10
F Nucleotide metabolism and transport 67 0 0 0 0 0 0 1 0 1 0 0 0 1
G Carbohydrate metabolism and transport 137 0 0 0 0 0 1 2 1 3 1 1 1 6
H Coenzyme metabolism 144 0 3 0 3 2 1 0 1 0 1 2 1 10
I Lipid metabolism 101 0 0 1 0 0 1 0 0 0 0 0 0 2
J Translation 242 0 0 1 1 1 7 0 1 0 1 2 4 13
K Transcription 163 3 1 3 1 1 1 0 1 0 1 2 1 9
L Replication and repair, including nuclease activity 134 0 0 0 0 0 0 0 0 1 0 1 0 2
M Cell wall/membrane/envelope biogenesis 221 0 0 0 0 2 1 0 0 1 0 0 1 5
N Cell motility 149 0 0 0 0 0 0 1 0 1 0 0 0 1
O Post-translational modification,protein
turnover,chaperone functions
135 3 2 3 2 1 0 0 1 1 2 3 4 12
P Inorganic ion transport and metabolism 169 0 0 0 0 0 1 2 2 2 3 1 0 6
Q Secondary metabolites biosynthesis, transport and
catabolism
63 0 0 1 0 0 0 0 0 0 0 0 1 2
R General functional prediction only 382 5 3 4 1 1 2 4 2 2 3 2 1 17
S Hypothetical or uncharacterized protein,protein of
unknown function, or no annotation
1235 14 3 12 2 2 2 9 8 8 10 9 13 44
T Signal transduction 373 3 0 3 0 0 0 3 0 4 0 2 3 11
U Intracellular trafficking and secretion 111 0 0 0 0 0 0 1 0 1 0 0 1 2
V Defense mechanisms 41 0 0 0 0 1 0 1 0 0 0 0 0 2
Y c-type cytochromes 86 3 2 6 1 1 0 3 3 5 3 1 3 12
Z Cytoskeleton 2 0 0 0 0 0 0 0 0 0 0 0 0 0
Page 25 of 37
ACS Paragon Plus Environment
Journal of Proteome Research
123456789101112131415161718192021222324252627282930313233343536373839404142434445464748495051525354555657585960

26
Total of significantly changing proteins in samplec 4127 31 15 31 12 14 18 28 22 28 26 30 36 164
a “Bulk” designates undefined poorly hydrous ferric oxide. See text for details
b “Nanoparticle” designates synthesized hydrous ferric oxide mineral particles < 6 nm. See text for
details.
c Column sums are greater than the total number of significantly changing proteins in each column
because a protein can belong to more than one functional class.
Page 26 of 37
ACS Paragon Plus Environment
Journal of Proteome Research
123456789101112131415161718192021222324252627282930313233343536373839404142434445464748495051525354555657585960
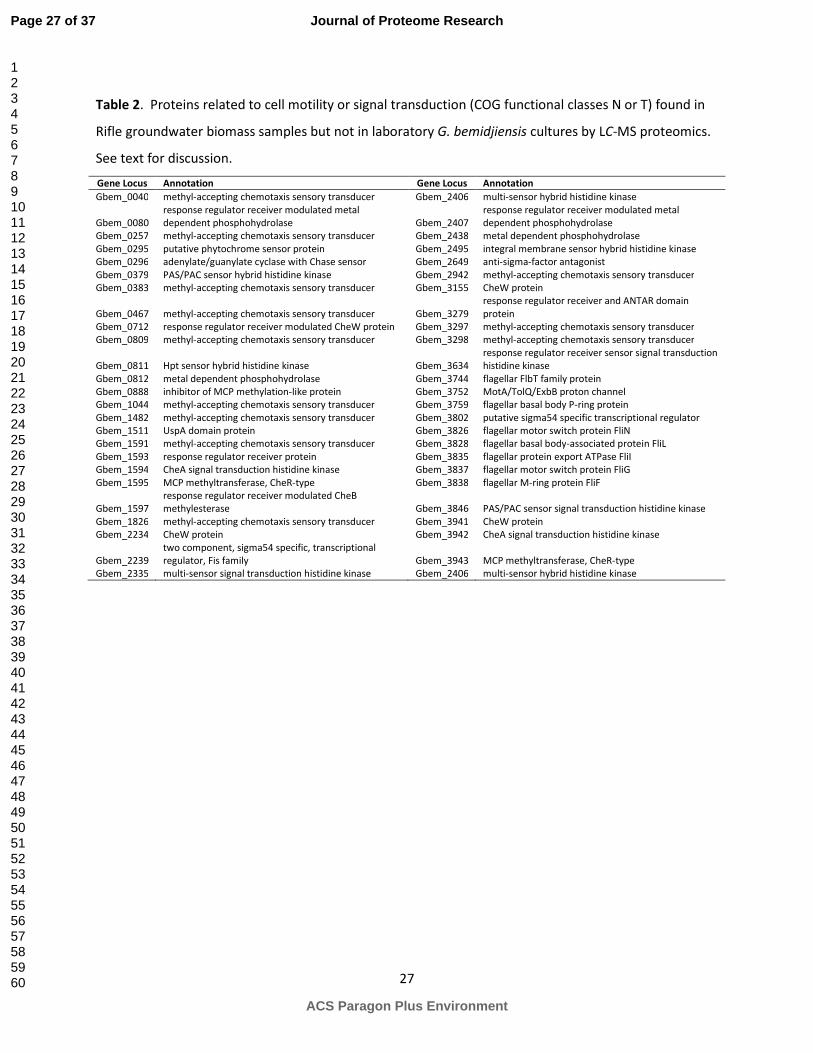
27
Table 2. Proteins related to cell motility or signal transduction (COG functional classes N or T) found in
Rifle groundwater biomass samples but not in laboratory G. bemidjiensis cultures by LC-MS proteomics.
See text for discussion.
Gene Locus Annotation Gene Locus Annotation
Gbem_0040 methyl-accepting chemotaxis sensory transducer Gbem_2406 multi-sensor hybrid histidine kinase
Gbem_0080
response regulator receiver modulated metal
dependent phosphohydrolase Gbem_2407
response regulator receiver modulated metal
dependent phosphohydrolase
Gbem_0257 methyl-accepting chemotaxis sensory transducer Gbem_2438 metal dependent phosphohydrolase
Gbem_0295 putative phytochrome sensor protein Gbem_2495 integral membrane sensor hybrid histidine kinase
Gbem_0296 adenylate/guanylate cyclase with Chase sensor Gbem_2649 anti-sigma-factor antagonist
Gbem_0379 PAS/PAC sensor hybrid histidine kinase Gbem_2942 methyl-accepting chemotaxis sensory transducer
Gbem_0383 methyl-accepting chemotaxis sensory transducer Gbem_3155 CheW protein
Gbem_0467 methyl-accepting chemotaxis sensory transducer Gbem_3279
response regulator receiver and ANTAR domain
protein
Gbem_0712 response regulator receiver modulated CheW protein Gbem_3297 methyl-accepting chemotaxis sensory transducer
Gbem_0809 methyl-accepting chemotaxis sensory transducer Gbem_3298 methyl-accepting chemotaxis sensory transducer
Gbem_0811 Hpt sensor hybrid histidine kinase Gbem_3634
response regulator receiver sensor signal transduction
histidine kinase
Gbem_0812 metal dependent phosphohydrolase Gbem_3744 flagellar FlbT family protein
Gbem_0888 inhibitor of MCP methylation-like protein Gbem_3752 MotA/TolQ/ExbB proton channel
Gbem_1044 methyl-accepting chemotaxis sensory transducer Gbem_3759 flagellar basal body P-ring protein
Gbem_1482 methyl-accepting chemotaxis sensory transducer Gbem_3802 putative sigma54 specific transcriptional regulator
Gbem_1511 UspA domain protein Gbem_3826 flagellar motor switch protein FliN
Gbem_1591 methyl-accepting chemotaxis sensory transducer Gbem_3828 flagellar basal body-associated protein FliL
Gbem_1593 response regulator receiver protein Gbem_3835 flagellar protein export ATPase FliI
Gbem_1594 CheA signal transduction histidine kinase Gbem_3837 flagellar motor switch protein FliG
Gbem_1595 MCP methyltransferase, CheR-type Gbem_3838 flagellar M-ring protein FliF
Gbem_1597
response regulator receiver modulated CheB
methylesterase Gbem_3846 PAS/PAC sensor signal transduction histidine kinase
Gbem_1826 methyl-accepting chemotaxis sensory transducer Gbem_3941 CheW protein
Gbem_2234 CheW protein Gbem_3942 CheA signal transduction histidine kinase
Gbem_2239
two component, sigma54 specific, transcriptional
regulator, Fis family Gbem_3943 MCP methyltransferase, CheR-type
Gbem_2335 multi-sensor signal transduction histidine kinase Gbem_2406 multi-sensor hybrid histidine kinase
Page 27 of 37
ACS Paragon Plus Environment
Journal of Proteome Research
123456789101112131415161718192021222324252627282930313233343536373839404142434445464748495051525354555657585960

28
Figure 1. Correlation of unscaled log2 peptide abundance values across all conditions- the correlation
value is represented by a red color scale (upper left). Data are Pearson correlation coefficients for the
indicated comparisons, displayed as a heat map. Fumarate- and ferric citrate-grown samples of G.
bemidjiensis closely resemble each other, as evidenced by the high correlation coefficients (for example,
black box). Similarly, samples grown on bulk and nanoparticle iron mineral samples resemble each
other (for example, gray box). By contrast, bulk/nanoparticle and fumarate/ferric citrate samples have
lower correlations (light red color, dashed boxes). The “checkerboard” appearance thus indicates that
Page 28 of 37
ACS Paragon Plus Environment
Journal of Proteome Research
123456789101112131415161718192021222324252627282930313233343536373839404142434445464748495051525354555657585960

29
the peptide expression profiles split the samples into two groups, fumarate/ferric citrate and
bulk/nanoparticle iron mineral. Hierarchical clustering analysis of these data (not shown) confirms that
all ferric citrate/fumarate samples cluster together, as do all bulk/nanoparticle solid iron samples.
Page 29 of 37
ACS Paragon Plus Environment
Journal of Proteome Research
123456789101112131415161718192021222324252627282930313233343536373839404142434445464748495051525354555657585960

30
Figure 2. Linear regression (method 2) comparison of early-growth G. bemidjiensis cultures grown on
fumarate or ferric citrate. The top and bottom figures represent technical replicates of the entire
experiment. Data are the average log2 abundance values from 2-3 technical replicates for each
condition. Gray points represent proteins that do not change significantly. Cyan points represent
proteins that are judged to change significantly by the traditional median-centered normalization
method (method 1). Orange points represent proteins that are judged to change significantly by the
linear regression method (method 2) only (i.e., the points fall outside the dotted lines representing the
Page 30 of 37
ACS Paragon Plus Environment
Journal of Proteome Research
123456789101112131415161718192021222324252627282930313233343536373839404142434445464748495051525354555657585960

31
|z| > 1.96 boundaries). Red points represent proteins judged to change significantly by both methods. If
the points fall above the linear regression line, expression is higher in cultures grown on ferric citrate; if
below the line, expression is higher in fumarate-grown cultures. Note that the proteins judged to have
significantly different expression only by method 1 are in general borderline cases (cyan points near the
dotted lines) in method 2, indicating that method 2 robustly detects large changes in protein expression,
although some subtle changes may not be detected. The cyan point in (A) at (21.6,22.0), lying very
close to the regression line, represents Gbem_2232. This protein was called significant by method 1 but
not by method 2. This apparent discrepancy is a result of using the data from both (A) and (B) in the
method 1 analysis, so that method 1 used twice as many data points as method 2, and of the treatment
of missing data in the R-Rollup procedure.37
Note that in (B), Gbem_2232 is in fact identified as
significantly changing.
Page 31 of 37
ACS Paragon Plus Environment
Journal of Proteome Research
123456789101112131415161718192021222324252627282930313233343536373839404142434445464748495051525354555657585960

32
Figure 3. Results of method 2 analysis of c-type cytochromes, arranged as a set of pairwise comparisons between conditions. Each column
represents a pairwise comparison between conditions using 2-3 LC-MS replicates per condition. Data are the z-scores from the method 2 linear
regression analysis (see text), colored red if z > 1.96, indicating that expression was higher in the second condition listed, or green if z < -1.96,
indicating that expression was higher in the first condition listed. Each z-score comes from the average of three analytical replicate experiments;
to be judged significant, the error bars (standard deviations if n=3, one-half the range if n=2, and 10% of the value if n=1) of the measurement
also had to fall outside of |z|>1.96. Hence, the symbols “+” and “^” indicate that the observed z-score was judged to be statistically significant
in the positive (“+”, red) or negative (“^”, green) direction, based on the error bars. Cells with values of 10, 20, 30 or 40 are not z-scores, but
Page 32 of 37
ACS Paragon Plus Environment
Journal of Proteome Research
123456789101112131415161718192021222324252627282930313233343536373839404142434445464748495051525354555657585960

33
indicate that a protein was detected in only one condition (fumarate, ferric citrate, bulk HFO, or nanoparticle HFO, respectively). NA, protein
was detected in too few runs to calculate a z-score; ND, protein was not detected. “No matches” indicates c-type cytochromes with no close
homologues in G. sulfurreducens or G. metallireducens. Gbem_1116 and Gbem_2679 (*) and Gbem_3470 and Gbem_1153 (**) are pairs of
proteins with high enough sequence identity to make assignment of observed peptides to one or the other protein uncertain. Significance
notations: a, clear expression change in at least one conditions; b, no change in expression; c, no clear change in expression due to
disagreement between experiments; d, no interpretation of expression pattern due to missing data.
Page 33 of 37
ACS Paragon Plus Environment
Journal of Proteome Research
123456789101112131415161718192021222324252627282930313233343536373839404142434445464748495051525354555657585960

34
Figure 4. Comparison of proteomics results for Rifle acetate amendment field samples and laboratory
cultures grown under the indicated conditions with acetate as the carbon source. A, principle
components analysis (PCA). Black point represents the summed spectral counts for a series of strong
cation exchange fractions of a sample of Rifle aquifer groundwater sampled at various times after
acetate amendment [reference]. Other points represent the summed spectral counts for all technical
replicates of analyses of cultures grown with the indicated electron acceptor (with early and late
temporal samples grouped separately). Note that the Rifle groundwater samples form a cluster that is
distinct from both the solid iron cluster (bulk and nanoparticle) and soluble electron acceptor (fumarate
and ferric citrate) clusters. B, heatmap of correlation coefficients for the same samples, including a
hierarchical clustering dendrogram at left. The clustering results support the groupings observed in A,
indicating that the Rifle samples exhibit distinct protein profiles from laboratory-cultured samples.
Input data for both A and B were the protein abundances measured by normalized spectral counts
Page 34 of 37
ACS Paragon Plus Environment
Journal of Proteome Research
123456789101112131415161718192021222324252627282930313233343536373839404142434445464748495051525354555657585960

35
Figure 5. Overlap in detected proteins between laboratory cultures of G. bemidjiensis and
environmental groundwater samples from the Rifle site. The Venn diagram shows the numbers of
proteins common or unique to each combination of conditions. The Rifle field samples have slightly
more proteins in common with ferric citrate/fumarate samples (705 proteins, or 93 outside the common
core of 612 proteins), than with bulk/nanoparticle samples (675 proteins, or 63 outside the common
core). The list of proteins from the laboratory samples was the list of confidently identified proteins
from the AMT tag analysis. The list of proteins from the Rifle samples was based on spectral counting.
For functional enrichment analysis of Rifle-only and common-core proteins, see Figure 6.
Page 35 of 37
ACS Paragon Plus Environment
Journal of Proteome Research
123456789101112131415161718192021222324252627282930313233343536373839404142434445464748495051525354555657585960

36
Figure 6. Functional category enrichment analysis of selected regions of the Venn diagram in Figure 5.
(A) Proteins unique to Rifle groundwater samples compared to the G. bemidjiensis genome. (B)
Proteins found in all samples, both Rifle groundwater and laboratory cultures. Red asterisks indicate
statistical significance (p < 0.05, two-sided test for equal proportions as described in Methods).
Functional categories were based on the COG functional categories and are defined as follows: B,
chromatin structure and dynamics; C, energy production/conversion and redox processes; D, cell cycle
control and mitosis; E, amino acid metabolism and transport; F, nucleotide metabolism and transport; G,
carbohydrate metabolism and transport; H, coenzyme metabolism; J, translation; K, transcription; L,
replication and repair including nuclease activity; M, cell wall/membrane/envelope biogenesis; N, cell
motility; O, post-translational modification, protein turnover, and chaperone functions; P, inorganic ion
transport and metabolism; Q, secondary metabolite biosynthesis, transport, and catabolism; T, signal
transduction; U, intracelluar trafficking and secretion; V, defense mechanisms; Y, c-type cytochromes; Z,
cytoskeleton. The set of proteins common to all samples is highly enriched in housekeeping and basic
cellular processes. The set of proteins unique to the Rifle samples is enriched in cell motility and signal
transduction proteins, many of which are involved in chemotaxis.
Page 36 of 37
ACS Paragon Plus Environment
Journal of Proteome Research
123456789101112131415161718192021222324252627282930313233343536373839404142434445464748495051525354555657585960

37
Table of Contents Figure
Page 37 of 37
ACS Paragon Plus Environment
Journal of Proteome Research
123456789101112131415161718192021222324252627282930313233343536373839404142434445464748495051525354555657585960