Changes in failure stress and stress transfer during the 1976-77 Friuli earthquake sequence
10
Geophys. J. Int. (2004) 156, 297–306 doi: 10.1111/j.1365-246X.2003.02146.x GJI Seismology Changes in failure stress and stress transfer during the 1976–77 Friuli earthquake sequence B. Perniola, 1 G. Bressan 2 and S. Pondrelli 3 1 Universit` a di Urbino—Istituto di Fisica, via S. Chiara, 27 Urbino (PU), Italy. E-mail: [email protected] 2 Istituto Nazionale di Oceanografia e di Geofisica Sperimentale, Dip. C.R.S. via Treviso, 55—C.P. 1, Cussignacco (Udine), Italy. E-mail: [email protected] 3 Istituto Nazionale di Geofisica e Vulcanologia, via D. Creti, 12, Bologna, Italy. E-mail: [email protected] Accepted 2003 September 30. Received 2003 September 29; in original form 2002 July 9 SUMMARY Coulomb stress changes related to the sequence of strong earthquakes that affected the Friuli area (Northeastern Italy) during the period 1976–77 have been investigated to explore the possibility of fault interaction and stress transfer mechanisms. The seismic sequence that followed the M w 6.4 mainshock of 1976 May 6, consists of 5 events of M w between 5.2 and 6.0 during the same year and one event of M w 5.3 that occurred in 1977 September, all characterized by thrust focal mechanisms. The area is affected by a regional compressive stress, which tends to activate N-dipping thrust planes. The goal of this study is to analyse and verify the relationship between the stress changes induced by the mainshock and the occurrence of subsequent events. Our results show that the mainshock induced a variation in the stress field in the area where most of the seismic events occurred. Our modelling shows a positive correlation between the areas of increased Coulomb stress induced by the mainshock and the distribution of seismicity that followed. This evidence suggests stress interaction and the possibility that the mainshock promoted the rupture of those faults associated with the event of 1976 May 9 ( M w 5.1) and the events of 1976 September 11 ( M w 5.2 and 5.6), 1976 September 15 ( M w 6.0) and 1977 September 16 ( M w 5.3). The Coulomb stress caused by co-seismic dislocations decreased in the zone where an M w 5.9 earthquake occurred on September 15 at 03:15. When we included the contribution of the regional tectonic loading in the calculation of Coulomb stress changes, we found a positive correlation between the hypocentral area of the September 15 03:15 event and the area of Coulomb stress increase. Aftershocks that occurred after the mainshock but before the September 15 03:15 event are also located in the area of Coulomb stress increase. Key words: earthquakes, fault-plane solutions, stress distribution. INTRODUCTION The Friuli seismic sequence which started on 1976 May 6 (at 20:00) with a mainshock of M w 6.4 was the most important that affected Northeastern Italy during the 20th century. The maximum intensity, measured using the Medvedev-Sponheuer-Karnik scale, was X. The sequence displayed some interesting peculiarities. The focal mecha- nisms of the strongest shocks ( M w > 5.0) were similar and involved thrust processes (Fig. 1); a migration of seismicity from east to west was observed. The seismic moment release was not characterized by a uniform temporal decay. Major aftershocks occurred on May 9, of M w 5.1, and on May 11, of M w 5.0, and then the seismicity decreased through to August. On September 11, two strong shocks occurred at 16:31 ( M w 5.2) and 16:35 ( M w 5.6), followed by two further strong events on September 15, at 03:15 ( M w 5.9) and 09:21 ( M w 6.0). The seismic activity then decreased until September 16 1977, when a M w 5.3 occurred. The last relevant event of the se- quence occurred on 1979 April 18, with M w 4.8. The seismic moment release and its time evolution do not fol- low a simple occurrence model of mainshock-aftershock sequence, that is, a dominant large earthquake followed by substantial smaller magnitude events, decaying with time according to the Omori’s law (Utsu et al. 1995). The major events, with M w > 5, can’t properly be considered aftershocks of the May 6 mainshock. Aftershocks are considered (Scholz 1990) a secondary process induced by the dynamic rupture effect of the main shock, and the sum of their seismic moment is normally a small fraction (about 5 per cent) of the moment of the main shock itself. Furthermore, the temporal evolution observed for the Friuli sequence suggests that the fracture processes could be related to changes in the state of stress during the sequence by a mechanism involving stress diffusion and interaction among seismogenic faults. Slejko et al. (1999) demonstrated that the sequence was affected by stress heterogeneity caused by local responses, superimposed on regional stress. Obviously, the redistri- bution of static stress following a large earthquake may promote or inhibit rupture processes on adjacent faults. C 2003 RAS 297 by guest on September 10, 2016 http://gji.oxfordjournals.org/ Downloaded from
-
Upload
independent -
Category
Documents
-
view
1 -
download
0
Transcript of Changes in failure stress and stress transfer during the 1976-77 Friuli earthquake sequence
Geophys. J. Int. (2004) 156, 297–306 doi: 10.1111/j.1365-246X.2003.02146.x
GJI
Sei
smol
ogy
Changes in failure stress and stress transfer during the 1976–77 Friuliearthquake sequence
B. Perniola,1 G. Bressan2 and S. Pondrelli31Universita di Urbino—Istituto di Fisica, via S. Chiara, 27 Urbino (PU), Italy. E-mail: [email protected] Nazionale di Oceanografia e di Geofisica Sperimentale, Dip. C.R.S. via Treviso, 55—C.P. 1, Cussignacco (Udine), Italy. E-mail: [email protected] Nazionale di Geofisica e Vulcanologia, via D. Creti, 12, Bologna, Italy. E-mail: [email protected]
Accepted 2003 September 30. Received 2003 September 29; in original form 2002 July 9
S U M M A R YCoulomb stress changes related to the sequence of strong earthquakes that affected the Friuliarea (Northeastern Italy) during the period 1976–77 have been investigated to explore thepossibility of fault interaction and stress transfer mechanisms. The seismic sequence thatfollowed the Mw 6.4 mainshock of 1976 May 6, consists of 5 events of Mw between 5.2and 6.0 during the same year and one event of Mw 5.3 that occurred in 1977 September, allcharacterized by thrust focal mechanisms. The area is affected by a regional compressive stress,which tends to activate N-dipping thrust planes. The goal of this study is to analyse and verifythe relationship between the stress changes induced by the mainshock and the occurrence ofsubsequent events. Our results show that the mainshock induced a variation in the stress field inthe area where most of the seismic events occurred. Our modelling shows a positive correlationbetween the areas of increased Coulomb stress induced by the mainshock and the distributionof seismicity that followed. This evidence suggests stress interaction and the possibility that themainshock promoted the rupture of those faults associated with the event of 1976 May 9 (Mw
5.1) and the events of 1976 September 11 (Mw 5.2 and 5.6), 1976 September 15 (Mw 6.0) and1977 September 16 (Mw 5.3). The Coulomb stress caused by co-seismic dislocations decreasedin the zone where an Mw 5.9 earthquake occurred on September 15 at 03:15. When we includedthe contribution of the regional tectonic loading in the calculation of Coulomb stress changes,we found a positive correlation between the hypocentral area of the September 15 03:15event and the area of Coulomb stress increase. Aftershocks that occurred after the mainshockbut before the September 15 03:15 event are also located in the area of Coulomb stress increase.
Key words: earthquakes, fault-plane solutions, stress distribution.
I N T RO D U C T I O N
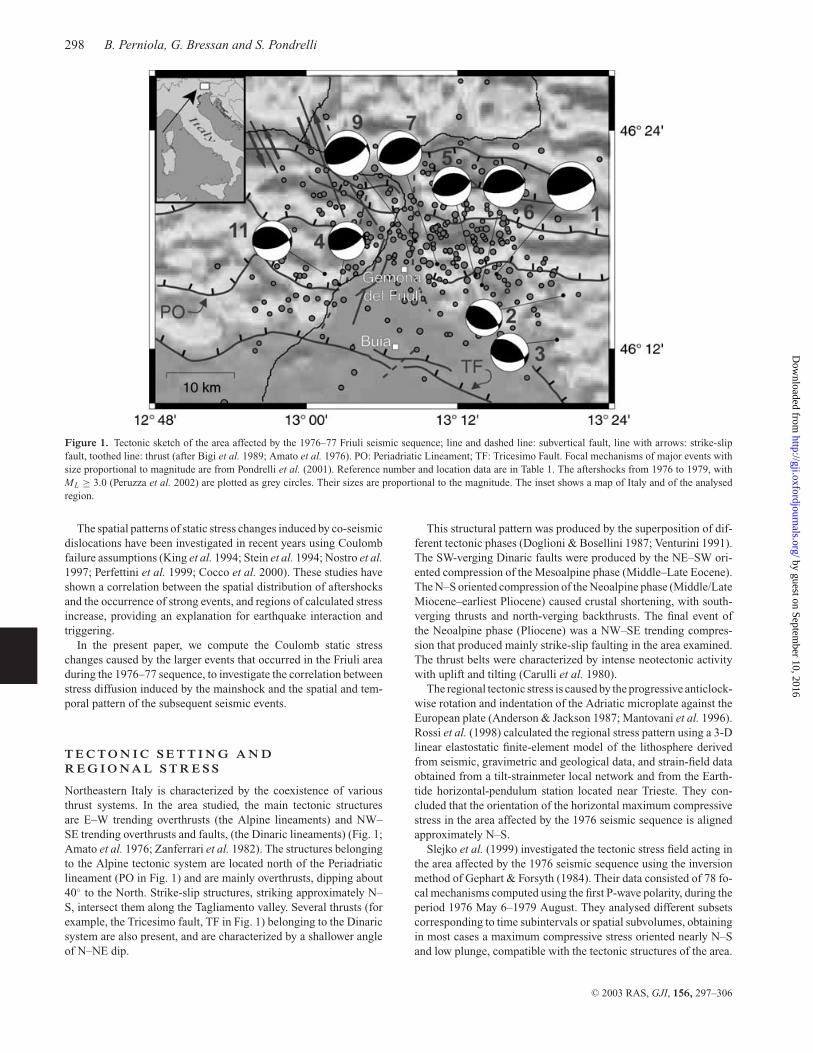
The Friuli seismic sequence which started on 1976 May 6 (at 20:00)with a mainshock of Mw 6.4 was the most important that affectedNortheastern Italy during the 20th century. The maximum intensity,measured using the Medvedev-Sponheuer-Karnik scale, was X. Thesequence displayed some interesting peculiarities. The focal mecha-nisms of the strongest shocks (Mw > 5.0) were similar and involvedthrust processes (Fig. 1); a migration of seismicity from east to westwas observed. The seismic moment release was not characterizedby a uniform temporal decay. Major aftershocks occurred on May9, of Mw 5.1, and on May 11, of Mw 5.0, and then the seismicitydecreased through to August. On September 11, two strong shocksoccurred at 16:31 (Mw 5.2) and 16:35 (Mw 5.6), followed by twofurther strong events on September 15, at 03:15 (Mw 5.9) and 09:21(Mw 6.0). The seismic activity then decreased until September 161977, when a Mw 5.3 occurred. The last relevant event of the se-quence occurred on 1979 April 18, with Mw 4.8.
The seismic moment release and its time evolution do not fol-low a simple occurrence model of mainshock-aftershock sequence,that is, a dominant large earthquake followed by substantial smallermagnitude events, decaying with time according to the Omori’s law(Utsu et al. 1995). The major events, with Mw > 5, can’t properlybe considered aftershocks of the May 6 mainshock. Aftershocksare considered (Scholz 1990) a secondary process induced by thedynamic rupture effect of the main shock, and the sum of theirseismic moment is normally a small fraction (about 5 per cent) ofthe moment of the main shock itself. Furthermore, the temporalevolution observed for the Friuli sequence suggests that the fractureprocesses could be related to changes in the state of stress during thesequence by a mechanism involving stress diffusion and interactionamong seismogenic faults. Slejko et al. (1999) demonstrated thatthe sequence was affected by stress heterogeneity caused by localresponses, superimposed on regional stress. Obviously, the redistri-bution of static stress following a large earthquake may promote orinhibit rupture processes on adjacent faults.
C© 2003 RAS 297
by guest on September 10, 2016
http://gji.oxfordjournals.org/D
ownloaded from
298 B. Perniola, G. Bressan and S. Pondrelli
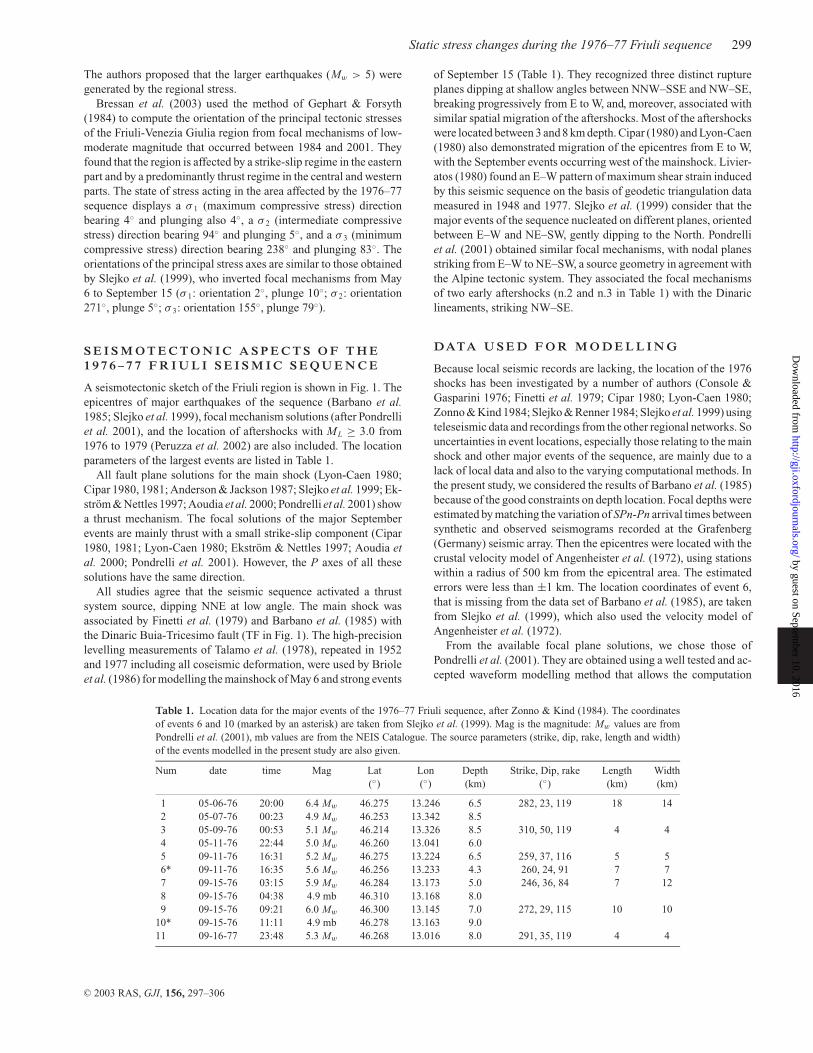
Figure 1. Tectonic sketch of the area affected by the 1976–77 Friuli seismic sequence; line and dashed line: subvertical fault, line with arrows: strike-slipfault, toothed line: thrust (after Bigi et al. 1989; Amato et al. 1976). PO: Periadriatic Lineament; TF: Tricesimo Fault. Focal mechanisms of major events withsize proportional to magnitude are from Pondrelli et al. (2001). Reference number and location data are in Table 1. The aftershocks from 1976 to 1979, withML ≥ 3.0 (Peruzza et al. 2002) are plotted as grey circles. Their sizes are proportional to the magnitude. The inset shows a map of Italy and of the analysedregion.
The spatial patterns of static stress changes induced by co-seismicdislocations have been investigated in recent years using Coulombfailure assumptions (King et al. 1994; Stein et al. 1994; Nostro et al.1997; Perfettini et al. 1999; Cocco et al. 2000). These studies haveshown a correlation between the spatial distribution of aftershocksand the occurrence of strong events, and regions of calculated stressincrease, providing an explanation for earthquake interaction andtriggering.
In the present paper, we compute the Coulomb static stresschanges caused by the larger events that occurred in the Friuli areaduring the 1976–77 sequence, to investigate the correlation betweenstress diffusion induced by the mainshock and the spatial and tem-poral pattern of the subsequent seismic events.
T E C T O N I C S E T T I N G A N DR E G I O N A L S T R E S S
Northeastern Italy is characterized by the coexistence of variousthrust systems. In the area studied, the main tectonic structuresare E–W trending overthrusts (the Alpine lineaments) and NW–SE trending overthrusts and faults, (the Dinaric lineaments) (Fig. 1;Amato et al. 1976; Zanferrari et al. 1982). The structures belongingto the Alpine tectonic system are located north of the Periadriaticlineament (PO in Fig. 1) and are mainly overthrusts, dipping about40◦ to the North. Strike-slip structures, striking approximately N–S, intersect them along the Tagliamento valley. Several thrusts (forexample, the Tricesimo fault, TF in Fig. 1) belonging to the Dinaricsystem are also present, and are characterized by a shallower angleof N–NE dip.
This structural pattern was produced by the superposition of dif-ferent tectonic phases (Doglioni & Bosellini 1987; Venturini 1991).The SW-verging Dinaric faults were produced by the NE–SW ori-ented compression of the Mesoalpine phase (Middle–Late Eocene).The N–S oriented compression of the Neoalpine phase (Middle/LateMiocene–earliest Pliocene) caused crustal shortening, with south-verging thrusts and north-verging backthrusts. The final event ofthe Neoalpine phase (Pliocene) was a NW–SE trending compres-sion that produced mainly strike-slip faulting in the area examined.The thrust belts were characterized by intense neotectonic activitywith uplift and tilting (Carulli et al. 1980).
The regional tectonic stress is caused by the progressive anticlock-wise rotation and indentation of the Adriatic microplate against theEuropean plate (Anderson & Jackson 1987; Mantovani et al. 1996).Rossi et al. (1998) calculated the regional stress pattern using a 3-Dlinear elastostatic finite-element model of the lithosphere derivedfrom seismic, gravimetric and geological data, and strain-field dataobtained from a tilt-strainmeter local network and from the Earth-tide horizontal-pendulum station located near Trieste. They con-cluded that the orientation of the horizontal maximum compressivestress in the area affected by the 1976 seismic sequence is alignedapproximately N–S.
Slejko et al. (1999) investigated the tectonic stress field acting inthe area affected by the 1976 seismic sequence using the inversionmethod of Gephart & Forsyth (1984). Their data consisted of 78 fo-cal mechanisms computed using the first P-wave polarity, during theperiod 1976 May 6–1979 August. They analysed different subsetscorresponding to time subintervals or spatial subvolumes, obtainingin most cases a maximum compressive stress oriented nearly N–Sand low plunge, compatible with the tectonic structures of the area.
C© 2003 RAS, GJI, 156, 297–306
by guest on September 10, 2016
http://gji.oxfordjournals.org/D
ownloaded from
Static stress changes during the 1976–77 Friuli sequence 299
The authors proposed that the larger earthquakes (Mw > 5) weregenerated by the regional stress.
Bressan et al. (2003) used the method of Gephart & Forsyth(1984) to compute the orientation of the principal tectonic stressesof the Friuli-Venezia Giulia region from focal mechanisms of low-moderate magnitude that occurred between 1984 and 2001. Theyfound that the region is affected by a strike-slip regime in the easternpart and by a predominantly thrust regime in the central and westernparts. The state of stress acting in the area affected by the 1976–77sequence displays a σ 1 (maximum compressive stress) directionbearing 4◦ and plunging also 4◦, a σ 2 (intermediate compressivestress) direction bearing 94◦ and plunging 5◦, and a σ 3 (minimumcompressive stress) direction bearing 238◦ and plunging 83◦. Theorientations of the principal stress axes are similar to those obtainedby Slejko et al. (1999), who inverted focal mechanisms from May6 to September 15 (σ 1: orientation 2◦, plunge 10◦; σ 2: orientation271◦, plunge 5◦; σ 3: orientation 155◦, plunge 79◦).
S E I S M O T E C T O N I C A S P E C T S O F T H E1 9 7 6 – 7 7 F R I U L I S E I S M I C S E Q U E N C E
A seismotectonic sketch of the Friuli region is shown in Fig. 1. Theepicentres of major earthquakes of the sequence (Barbano et al.1985; Slejko et al. 1999), focal mechanism solutions (after Pondrelliet al. 2001), and the location of aftershocks with ML ≥ 3.0 from1976 to 1979 (Peruzza et al. 2002) are also included. The locationparameters of the largest events are listed in Table 1.
All fault plane solutions for the main shock (Lyon-Caen 1980;Cipar 1980, 1981; Anderson & Jackson 1987; Slejko et al. 1999; Ek-strom & Nettles 1997; Aoudia et al. 2000; Pondrelli et al. 2001) showa thrust mechanism. The focal solutions of the major Septemberevents are mainly thrust with a small strike-slip component (Cipar1980, 1981; Lyon-Caen 1980; Ekstrom & Nettles 1997; Aoudia etal. 2000; Pondrelli et al. 2001). However, the P axes of all thesesolutions have the same direction.
All studies agree that the seismic sequence activated a thrustsystem source, dipping NNE at low angle. The main shock wasassociated by Finetti et al. (1979) and Barbano et al. (1985) withthe Dinaric Buia-Tricesimo fault (TF in Fig. 1). The high-precisionlevelling measurements of Talamo et al. (1978), repeated in 1952and 1977 including all coseismic deformation, were used by Brioleet al. (1986) for modelling the mainshock of May 6 and strong events
Table 1. Location data for the major events of the 1976–77 Friuli sequence, after Zonno & Kind (1984). The coordinatesof events 6 and 10 (marked by an asterisk) are taken from Slejko et al. (1999). Mag is the magnitude: Mw values are fromPondrelli et al. (2001), mb values are from the NEIS Catalogue. The source parameters (strike, dip, rake, length and width)of the events modelled in the present study are also given.
Num date time Mag Lat Lon Depth Strike, Dip, rake Length Width(◦) (◦) (km) (◦) (km) (km)
1 05-06-76 20:00 6.4 Mw 46.275 13.246 6.5 282, 23, 119 18 142 05-07-76 00:23 4.9 Mw 46.253 13.342 8.53 05-09-76 00:53 5.1 Mw 46.214 13.326 8.5 310, 50, 119 4 44 05-11-76 22:44 5.0 Mw 46.260 13.041 6.05 09-11-76 16:31 5.2 Mw 46.275 13.224 6.5 259, 37, 116 5 56* 09-11-76 16:35 5.6 Mw 46.256 13.233 4.3 260, 24, 91 7 77 09-15-76 03:15 5.9 Mw 46.284 13.173 5.0 246, 36, 84 7 128 09-15-76 04:38 4.9 mb 46.310 13.168 8.09 09-15-76 09:21 6.0 Mw 46.300 13.145 7.0 272, 29, 115 10 10
10* 09-15-76 11:11 4.9 mb 46.278 13.163 9.011 09-16-77 23:48 5.3 Mw 46.268 13.016 8.0 291, 35, 119 4 4
of September 15 (Table 1). They recognized three distinct ruptureplanes dipping at shallow angles between NNW–SSE and NW–SE,breaking progressively from E to W, and, moreover, associated withsimilar spatial migration of the aftershocks. Most of the aftershockswere located between 3 and 8 km depth. Cipar (1980) and Lyon-Caen(1980) also demonstrated migration of the epicentres from E to W,with the September events occurring west of the mainshock. Livier-atos (1980) found an E–W pattern of maximum shear strain inducedby this seismic sequence on the basis of geodetic triangulation datameasured in 1948 and 1977. Slejko et al. (1999) consider that themajor events of the sequence nucleated on different planes, orientedbetween E–W and NE–SW, gently dipping to the North. Pondrelliet al. (2001) obtained similar focal mechanisms, with nodal planesstriking from E–W to NE–SW, a source geometry in agreement withthe Alpine tectonic system. They associated the focal mechanismsof two early aftershocks (n.2 and n.3 in Table 1) with the Dinariclineaments, striking NW–SE.
DATA U S E D F O R M O D E L L I N G
Because local seismic records are lacking, the location of the 1976shocks has been investigated by a number of authors (Console &Gasparini 1976; Finetti et al. 1979; Cipar 1980; Lyon-Caen 1980;Zonno & Kind 1984; Slejko & Renner 1984; Slejko et al. 1999) usingteleseismic data and recordings from the other regional networks. Souncertainties in event locations, especially those relating to the mainshock and other major events of the sequence, are mainly due to alack of local data and also to the varying computational methods. Inthe present study, we considered the results of Barbano et al. (1985)because of the good constraints on depth location. Focal depths wereestimated by matching the variation of SPn-Pn arrival times betweensynthetic and observed seismograms recorded at the Grafenberg(Germany) seismic array. Then the epicentres were located with thecrustal velocity model of Angenheister et al. (1972), using stationswithin a radius of 500 km from the epicentral area. The estimatederrors were less than ±1 km. The location coordinates of event 6,that is missing from the data set of Barbano et al. (1985), are takenfrom Slejko et al. (1999), which also used the velocity model ofAngenheister et al. (1972).
From the available focal plane solutions, we chose those ofPondrelli et al. (2001). They are obtained using a well tested and ac-cepted waveform modelling method that allows the computation
C© 2003 RAS, GJI, 156, 297–306
by guest on September 10, 2016
http://gji.oxfordjournals.org/D
ownloaded from
300 B. Perniola, G. Bressan and S. Pondrelli
of centroid-moment tensor (CMT) solutions for moderate mag-nitude earthquakes (Arvidsson & Ekstrom 1998; Ekstrom et al.1997; Morelli et al. 2000; Pondrelli et al. 2002). This methodis derived from the standard CMT procedure (Dziewonski et al.1981; Dziewonski & Woodhouse 1983) and is based on modellingintermediate-period surface waves. Global phase velocity maps(Ekstrom et al. 1997) are used to predict the dispersion of surfacewaves with periods between 35 and 150 s. The data set of Pondrelliet al. (2001) has the advantage that it includes the moment tensor ofthe largest events of the sequence, computed with the same methodof waveform inversion.
For the present work, moment tensor solutions have been recom-puted using as preliminary locations those of Barbano et al. (1985).This change produced only a very small variation in the focal pa-rameters of the September 11 16:31 earthquake (1–2 degrees in thedirections of the principal axes; Table 1), while for all other eventsthe focal planes remained unchanged. The focal mechanism showsmainly thrust faulting with a smaller strike-slip component. Shocks2 and 3 (Fig. 1) are characterized by a NW–SE oriented plane, dip-ping to the NE with strike 37◦ and 50◦ , respectively, related to theDinaric trend faults in the area. All the other events show a faultplane orientation from about E–W to NE–SW, N–NW dipping withstrikes between 23◦ and 37◦, consistent with the Alpine tectonicstructures.
C O U L O M B S T R E S S C H A N G E S
Method
Stress changes caused by dislocation processes through theCoulomb failure function (CFF), are computed using Okada’s equa-tions (1992) for dislocations in an elastic homogeneous half-space(King et al. 1994; Nostro et al. 1997).
The failure function is defined as (Harris & Simpson 1992;Reasenberg & Simpson 1992; Stein et al. 1994; Simpson &Reasenberg 1994; King et al. 1994; Harris et al. 1995; Nostro etal. 1997):
C F F = |τ | + µ(σn + P) (1)
where µ is the friction coefficient, P is the pore fluid pressure, and τ
and σ n are respectively the shear stress and normal stress (positivefor extension).
Changes in the CFF are given by:
�C F F = �τ + µ(�σn + �P) (2)
where �τ and �σ n are the changes in shear and normal stress, and�P is the change in pore pressure.
In general, the absolute values of stress are not known; therefore,stress changes are usually computed, because these variations canbe calculated easily from the available information about geometryand slip direction of the earthquake rupture.
The change in the shear stress (�τ ) is computed in the direc-tion of fault slip considering both variations in the strike and dipcomponents of shear traction. In the case of oblique-slip faultingmechanisms, the changes in the Coulomb failure function are deter-mined by all three components of the static traction variation (Nostroet al. 1997).
The effects of pore pressure changes �P are calculated consid-ering the medium is homogeneous, isotropic and in the undrainedcondition (that is, after the occurrence of the static stress changes,but before the free flow of fluids has occurred).
Under these hypotheses, �P can be expressed, introducingSkempton’s coefficient B, as follows (Rice & Cleary 1976; Roeloffs1988):
�P = −B�σkk
3(3)
where �σ kk is the volumetric stress change and σ kk is the sumof the diagonal elements of stress tensor. Skempton’s coefficient Btheoretically ranges from 0 for dry soil to 1 for fully saturated soil(Roeloffs 1988).
Considering that fault zone materials (Rice 1992; Harris 1998)are more ductile than the surrounding materials, as in the model ofRice (1992), σ xx = σ yy = σ zz in the fault zone and consequently�σkk
3∼= �σ , so the eq. (2) may be rewritten as:
�C F F = �τ + µ′(�σn) (4)
where µ′ = µ (1 − B) is the effective (or apparent) coefficient offriction (Harris 1998).
The definition of effective friction coefficient depends on the stateof stress of the medium and not on material properties (Harris 1998).Both the eqs (2) and (4) account for the undrained response of themedium. In particular, in the latter equation, the undrained responsecan be interpreted as indicating that the pore pressure proportionalto the mean stress or to the normal stress. Therefore, while eq. (2)is more general, eq. (4) is valid only under a particular rheology.
Once the static stress changes produced by an event have beenevaluated, the induced stress on the surrounding faults can easilybe computed, knowing the geometry and faulting mechanisms ofsecondary faults.
A more general case may be considered where a change of stressdue to an earthquake is imposed on pre-existing stress field. Tofind the best planes for failure (‘optimal’ planes, not specified apriori), one can consider the simultaneous contribution of tectonicloading and the stress induced by the dislocation of the main fault.The optimally oriented planes are computed by summing the stresschange due to the earthquake σ c
i j and the regional stress σ ri j . Thus,
the total stress tensor σ ri j is given by
σ ti j = σ c
i j + σ ri j (5)
If the geometry and mechanism of secondary faults are unknown,it is possible to find the orientation of the optimally oriented faultplanes (that is where the Coulomb stress is maximum) using a grid-search procedure (Nostro et al. 1997). Once the orientations of op-timally oriented faults that maximize the CFF is known in any nodeof our 3-D spatial grid, it is possible to perform the calculation ofCoulomb stress changes on these fault planes according to eq. (4).
The model is more sensitive to the orientation of regional stressthan the regional stress amplitude and the coefficient of effectivefriction (King et al. 1994). The direction of regional stress affects theorientation of the optimal planes far from the main fault. Conversely,the relative magnitude of the regional stress, proportional to theearthquake stress drop, contributes changing the direction of theseplanes near the main fault. Finally, we point out that it is possible toconsider the regional stress field as merely an input parameter forCoulomb stress interaction analysis, with little relation to the realstresses in the Earth (King & Cocco 2001).
Results
The study focusses on the evolution of the major events of the 1976–77 Friuli seismic sequence. We consider the seven strong to moderate
C© 2003 RAS, GJI, 156, 297–306
by guest on September 10, 2016
http://gji.oxfordjournals.org/D
ownloaded from
Static stress changes during the 1976–77 Friuli sequence 301
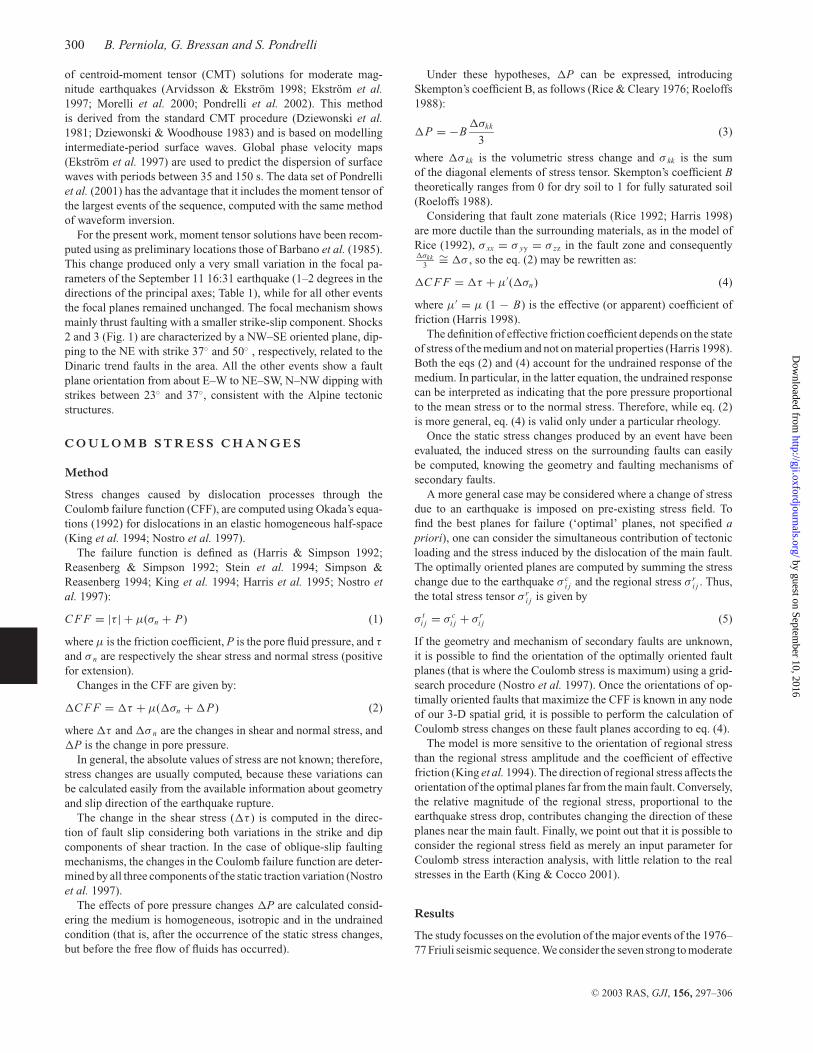
Figure 2. Coulomb stress changes at 4 km depth caused by event 1 (Table1), calculated on the fault plane associated with event 3 (dashed line). Solidlines indicate the causative faults, while the dashed lines show the faults thathave not yet ruptured. Stars indicate the hypocentres of events with Mw ≥5.5, triangles indicate the hypocentres of events with Mw < 5.5.
events of Mw greater than 5.0 (Table 1). To compute and analyse theCoulomb static stress changes due to these earthquakes, we associateeach event with a fault plane and to a focal mechanism.
We then model the Coulomb stress variations using CMT faultplane solutions (Pondrelli et al. 2001) and the rupture geome-tries (length and width in Table 1), and the empirical relations ofKanamori & Anderson (1975) are used to calculate rupture param-
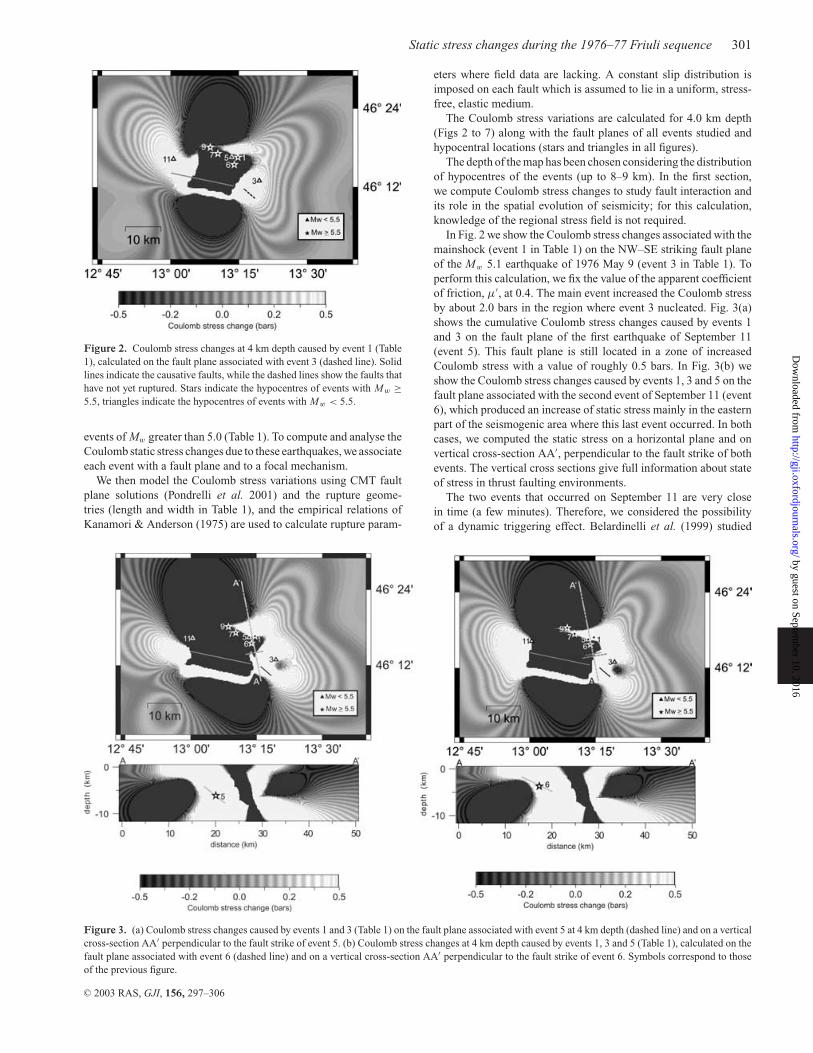
Figure 3. (a) Coulomb stress changes caused by events 1 and 3 (Table 1) on the fault plane associated with event 5 at 4 km depth (dashed line) and on a verticalcross-section AA′ perpendicular to the fault strike of event 5. (b) Coulomb stress changes at 4 km depth caused by events 1, 3 and 5 (Table 1), calculated on thefault plane associated with event 6 (dashed line) and on a vertical cross-section AA′ perpendicular to the fault strike of event 6. Symbols correspond to thoseof the previous figure.
eters where field data are lacking. A constant slip distribution isimposed on each fault which is assumed to lie in a uniform, stress-free, elastic medium.
The Coulomb stress variations are calculated for 4.0 km depth(Figs 2 to 7) along with the fault planes of all events studied andhypocentral locations (stars and triangles in all figures).
The depth of the map has been chosen considering the distributionof hypocentres of the events (up to 8–9 km). In the first section,we compute Coulomb stress changes to study fault interaction andits role in the spatial evolution of seismicity; for this calculation,knowledge of the regional stress field is not required.
In Fig. 2 we show the Coulomb stress changes associated with themainshock (event 1 in Table 1) on the NW–SE striking fault planeof the Mw 5.1 earthquake of 1976 May 9 (event 3 in Table 1). Toperform this calculation, we fix the value of the apparent coefficientof friction, µ′, at 0.4. The main event increased the Coulomb stressby about 2.0 bars in the region where event 3 nucleated. Fig. 3(a)shows the cumulative Coulomb stress changes caused by events 1and 3 on the fault plane of the first earthquake of September 11(event 5). This fault plane is still located in a zone of increasedCoulomb stress with a value of roughly 0.5 bars. In Fig. 3(b) weshow the Coulomb stress changes caused by events 1, 3 and 5 on thefault plane associated with the second event of September 11 (event6), which produced an increase of static stress mainly in the easternpart of the seismogenic area where this last event occurred. In bothcases, we computed the static stress on a horizontal plane and onvertical cross-section AA′, perpendicular to the fault strike of bothevents. The vertical cross sections give full information about stateof stress in thrust faulting environments.
The two events that occurred on September 11 are very closein time (a few minutes). Therefore, we considered the possibilityof a dynamic triggering effect. Belardinelli et al. (1999) studied
C© 2003 RAS, GJI, 156, 297–306
by guest on September 10, 2016
http://gji.oxfordjournals.org/D
ownloaded from
302 B. Perniola, G. Bressan and S. Pondrelli
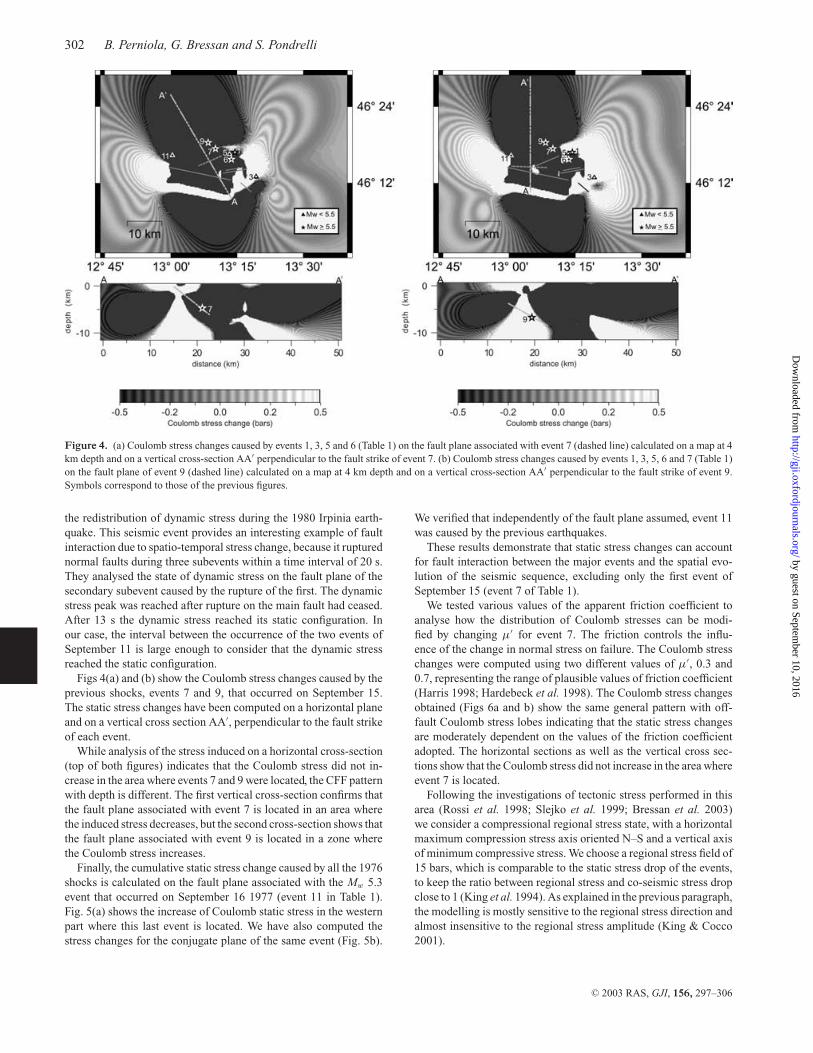
Figure 4. (a) Coulomb stress changes caused by events 1, 3, 5 and 6 (Table 1) on the fault plane associated with event 7 (dashed line) calculated on a map at 4km depth and on a vertical cross-section AA′ perpendicular to the fault strike of event 7. (b) Coulomb stress changes caused by events 1, 3, 5, 6 and 7 (Table 1)on the fault plane of event 9 (dashed line) calculated on a map at 4 km depth and on a vertical cross-section AA′ perpendicular to the fault strike of event 9.Symbols correspond to those of the previous figures.
the redistribution of dynamic stress during the 1980 Irpinia earth-quake. This seismic event provides an interesting example of faultinteraction due to spatio-temporal stress change, because it rupturednormal faults during three subevents within a time interval of 20 s.They analysed the state of dynamic stress on the fault plane of thesecondary subevent caused by the rupture of the first. The dynamicstress peak was reached after rupture on the main fault had ceased.After 13 s the dynamic stress reached its static configuration. Inour case, the interval between the occurrence of the two events ofSeptember 11 is large enough to consider that the dynamic stressreached the static configuration.
Figs 4(a) and (b) show the Coulomb stress changes caused by theprevious shocks, events 7 and 9, that occurred on September 15.The static stress changes have been computed on a horizontal planeand on a vertical cross section AA′, perpendicular to the fault strikeof each event.
While analysis of the stress induced on a horizontal cross-section(top of both figures) indicates that the Coulomb stress did not in-crease in the area where events 7 and 9 were located, the CFF patternwith depth is different. The first vertical cross-section confirms thatthe fault plane associated with event 7 is located in an area wherethe induced stress decreases, but the second cross-section shows thatthe fault plane associated with event 9 is located in a zone wherethe Coulomb stress increases.
Finally, the cumulative static stress change caused by all the 1976shocks is calculated on the fault plane associated with the Mw 5.3event that occurred on September 16 1977 (event 11 in Table 1).Fig. 5(a) shows the increase of Coulomb static stress in the westernpart where this last event is located. We have also computed thestress changes for the conjugate plane of the same event (Fig. 5b).
We verified that independently of the fault plane assumed, event 11was caused by the previous earthquakes.
These results demonstrate that static stress changes can accountfor fault interaction between the major events and the spatial evo-lution of the seismic sequence, excluding only the first event ofSeptember 15 (event 7 of Table 1).
We tested various values of the apparent friction coefficient toanalyse how the distribution of Coulomb stresses can be modi-fied by changing µ′ for event 7. The friction controls the influ-ence of the change in normal stress on failure. The Coulomb stresschanges were computed using two different values of µ′, 0.3 and0.7, representing the range of plausible values of friction coefficient(Harris 1998; Hardebeck et al. 1998). The Coulomb stress changesobtained (Figs 6a and b) show the same general pattern with off-fault Coulomb stress lobes indicating that the static stress changesare moderately dependent on the values of the friction coefficientadopted. The horizontal sections as well as the vertical cross sec-tions show that the Coulomb stress did not increase in the area whereevent 7 is located.
Following the investigations of tectonic stress performed in thisarea (Rossi et al. 1998; Slejko et al. 1999; Bressan et al. 2003)we consider a compressional regional stress state, with a horizontalmaximum compression stress axis oriented N–S and a vertical axisof minimum compressive stress. We choose a regional stress field of15 bars, which is comparable to the static stress drop of the events,to keep the ratio between regional stress and co-seismic stress dropclose to 1 (King et al. 1994). As explained in the previous paragraph,the modelling is mostly sensitive to the regional stress direction andalmost insensitive to the regional stress amplitude (King & Cocco2001).
C© 2003 RAS, GJI, 156, 297–306
by guest on September 10, 2016
http://gji.oxfordjournals.org/D
ownloaded from

Static stress changes during the 1976–77 Friuli sequence 303
Figure 5. Coulomb stress changes caused by events 1, 5, 6, 7, 9 (solid lines) (Table 1) on the fault plane associated with event 11 (dashed line) calculated ona map at 4 km depth and on a vertical cross section AA′ perpendicular to the fault strike of event 11. In (a) the dashed line indicates the fault plane associatedwith event 11, while in (b) the dashed line indicates the conjugate plane of this event. Symbols correspond to those of the previous figures.
Figure 6. Coulomb stress changes caused by events 1, 3, 5 and 6 (Table 1) on the fault plane associated with event 7 (dashed line) calculated on a map at 4 kmdepth and on a vertical cross-section AA′ perpendicular to the fault strike of event 7, with effective friction coefficient (a) µ′ = 0.3 and (b) µ′ = 0.7. Symbolscorrespond to those of the previous figures.
C© 2003 RAS, GJI, 156, 297–306
by guest on September 10, 2016
http://gji.oxfordjournals.org/D
ownloaded from
304 B. Perniola, G. Bressan and S. Pondrelli
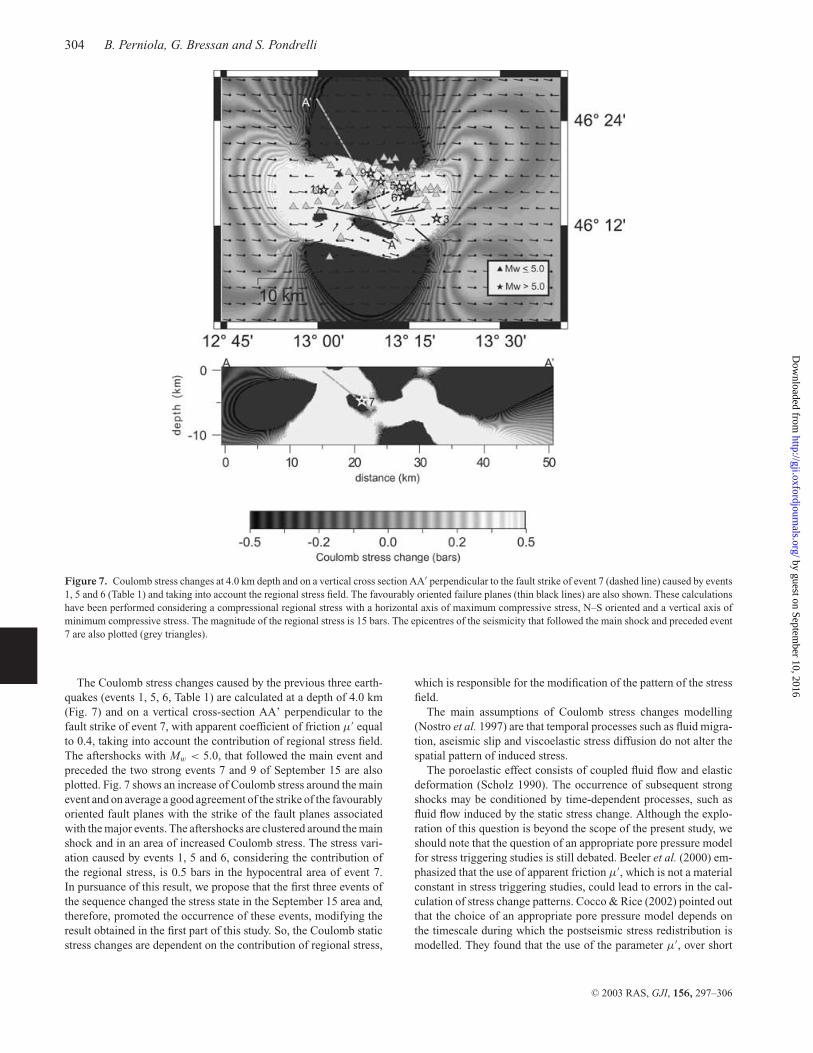
Figure 7. Coulomb stress changes at 4.0 km depth and on a vertical cross section AA′ perpendicular to the fault strike of event 7 (dashed line) caused by events1, 5 and 6 (Table 1) and taking into account the regional stress field. The favourably oriented failure planes (thin black lines) are also shown. These calculationshave been performed considering a compressional regional stress with a horizontal axis of maximum compressive stress, N–S oriented and a vertical axis ofminimum compressive stress. The magnitude of the regional stress is 15 bars. The epicentres of the seismicity that followed the main shock and preceded event7 are also plotted (grey triangles).
The Coulomb stress changes caused by the previous three earth-quakes (events 1, 5, 6, Table 1) are calculated at a depth of 4.0 km(Fig. 7) and on a vertical cross-section AA’ perpendicular to thefault strike of event 7, with apparent coefficient of friction µ′ equalto 0.4, taking into account the contribution of regional stress field.The aftershocks with Mw < 5.0, that followed the main event andpreceded the two strong events 7 and 9 of September 15 are alsoplotted. Fig. 7 shows an increase of Coulomb stress around the mainevent and on average a good agreement of the strike of the favourablyoriented fault planes with the strike of the fault planes associatedwith the major events. The aftershocks are clustered around the mainshock and in an area of increased Coulomb stress. The stress vari-ation caused by events 1, 5 and 6, considering the contribution ofthe regional stress, is 0.5 bars in the hypocentral area of event 7.In pursuance of this result, we propose that the first three events ofthe sequence changed the stress state in the September 15 area and,therefore, promoted the occurrence of these events, modifying theresult obtained in the first part of this study. So, the Coulomb staticstress changes are dependent on the contribution of regional stress,
which is responsible for the modification of the pattern of the stressfield.
The main assumptions of Coulomb stress changes modelling(Nostro et al. 1997) are that temporal processes such as fluid migra-tion, aseismic slip and viscoelastic stress diffusion do not alter thespatial pattern of induced stress.
The poroelastic effect consists of coupled fluid flow and elasticdeformation (Scholz 1990). The occurrence of subsequent strongshocks may be conditioned by time-dependent processes, such asfluid flow induced by the static stress change. Although the explo-ration of this question is beyond the scope of the present study, weshould note that the question of an appropriate pore pressure modelfor stress triggering studies is still debated. Beeler et al. (2000) em-phasized that the use of apparent friction µ′, which is not a materialconstant in stress triggering studies, could lead to errors in the cal-culation of stress change patterns. Cocco & Rice (2002) pointed outthat the choice of an appropriate pore pressure model depends onthe timescale during which the postseismic stress redistribution ismodelled. They found that the use of the parameter µ′, over short
C© 2003 RAS, GJI, 156, 297–306
by guest on September 10, 2016
http://gji.oxfordjournals.org/D
ownloaded from
Static stress changes during the 1976–77 Friuli sequence 305
postseismic time periods could be an appropriate approximation ifthe rigidity of the fault zone is much smaller than that of the sur-rounding volume.
The aseismic slip following a strong shock could contribute tothe transfer of stress to the medium surrounding the seismogenicfault. However, because of the lack of data regarding geometriesand rates of creep, it is difficult to include this behaviour in stresspattern modelling (King & Cocco 2001). The method of computingthe spatial patterns of static stress changes does not include theviscoelastic relaxation of the lithosphere that causes time effects instress perturbation. However, Nostro et al. (1997) consider valid themodelling of Coulomb stress changes at timescales shorter than tensof years, when the viscoelastic stress transfer can still be neglected.
C O N C L U S I O N S
The stress interaction of the major shocks (Mw > 5.0) of the 1976–77 Friuli sequence has been investigated using the Coulomb frac-ture criterion. A good correlation is found between the calculatedCoulomb stress increase and the various fault segments that rup-tured during the 1976 sequence. The results show that the staticstress change induced by the main shock promoted the Mw 5.1shock that occurred on May 9 and the Mw 5.2 shock that occurredon September 11 at 16:31. An increase of Coulomb static stress dueto the previous dislocations is present in the zone where the Mw 5.6event of September 11 16:35 was located. The cumulative Coulombstatic stress, computed considering the aforementioned events, de-creases in the area where the Mw 5.9 earthquake of September 1503:15 occurred and, conversely, increases where the Mw 6.0 shockof September 15 09:21 was located. Furthermore, we found that therupture plane of the Mw 5.3, 1977 earthquake is located in an area ofincreased Coulomb stress, produced by the coseismic dislocationsof the previous strong shocks and considering both conjugate planesfor this event.
When the regional tectonic stress is included in the computationof the total Coulomb stress change, we found a positive correlationbetween the aftershocks that occurred after the mainshock and be-fore September 15 03:15 and increase of Coulomb stress. The goodcorrelation between the positive Coulomb stress variations and thehypocentral area of event 7, suggests that a stress redistributioncould have promoted the occurrence of the events in that area.
The modelling shows that small stress increases (few bars) maypromote the occurrence of earthquakes. This effect suggests thatstrong earthquakes result from a complex process that graduallybrings the brittle crust, where future shocks occur, to a critical state.The tectonic stress is progressively stored in a large volume sur-rounding the future hypocentre of the strong shock, bringing themajor fault zones near their failure strength. The spatial redistribu-tion and enhancement of static stress caused by a strong earthquakemay promote rupture on adjacent faults that are close to this failurethreshold.
A C K N O W L E D G M E N T S
The authors are grateful to Massimo Cocco and Concetta Nostro fortheir support and helpful suggestions, to Andrea Morelli and GoranEkstrom for their continuous encouragement and to Vincenzo Ac-concia for help. Special thanks are also due to Gianfranco Renner forkindly providing the location data of the aftershocks that occurredduring the 1976–77 sequence.
R E F E R E N C E S
Amato, A., Barnaba, P.F., Finetti, I., Groppi, G., Martinis, B. & Muzzin, A.,1976. Geodynamic outline and seismicity of Friuli-Venetia-Julia region,Boll. Geof. Teor. Appl., 18, 217–256.
Anderson, H. & Jackson, J., 1987. Active tectonics in the Adriatic region,Geophys. J. R. astr. Soc., 91, 937–983.
Angenheister, G., Bogel, H., Gebrande, H., Giese, C., Schmidt-Thome, P.& Zeil, W., 1972. Recent investigations of surficial and deeper crustalstructures of the eastern and southern Alps, Geol. Rundschau, 61, 349–395.
Aoudia, A., Sarao, A., Bukchin, B. & Suhadolc, P., 2000. The 1976 Friuli(NE Italy) thrust faulting earthquake: a reappraisal 23 years later, Geophys.Res. Lett., 27, 577–580.
Arvidsson, R. & Ekstrom, G., 1998. Global CMT Analysis of ModerateEarthquakes Mw ≥ 4.5, using Intermediate Period Surface Waves, Bull.seism. Soc. Am., 88, 1003–1013.
Barbano, M.S., Kind, R. & Zonno, G., 1985. Focal parameters of someFriuli earthquakes (1976–1979) using complete theoretical seismograms,J. Geophys., 58, 175–182.
Beeler, N.M., Simpson, R.W., Hickman, S.H. & Lockner, D.A., 2000. Porefluid pressure, apparent friction, and Coulomb failure, J. geophys. Res.,105, 25 533–25 542.
Belardinelli, M. E., Cocco, M., Coutant, O. & Cotton, F., 1999. Redistributionof dynamic stress during coseismic rupture: Evidence for fault interactionand earthquake triggering, J. geophys. Res., 104, 14 925–14 945.
Bigi, G., Cosentino, D., Parotto, M., Sartori, R. & Scandone, P., 1989.Structural Model of Italy, Progetto Finalizzato Geodinamica, ConsiglioNazionale delle Ricerche, Roma, Italy.
Bressan, G., Bragato, P.L. & Venturini, C., 2003. Stress and strain ten-sors based on focal mechanisms in the seismotectonic framework of theFriuli—Venezia Giulia region (Northeastern Italy), Bull. seism. Soc. Am.,93, 1280–1297.
Briole, P., De Natale, G., Gaulon, R., Pingue, F. & Scarpa, R., 1986. Inver-sion of geodetic data and seismicity associated with the Friuli earthquakesequence (1976–1977), Ann. Geofis., 4, ,481–492.
Carulli, G.B, Carobene, L., Cavallin, A., Martinis, B. & Onofri, R., 1980.Evoluzione strutturale Plio-Quaternaria del Friuli e della Venezia Giulia,in Contributi alla realizzazione della Carta Neotettonica d’Italia, parte II.Pubbl. N.356 Prog. Fin. Geodin.-Sottopr. Neotettonica, CNR, 489–545.
Cipar, J., 1980. Teleseismic observations of the 1976 Friuli, Italy earthquakesequence, Bull. seism. Soc. Am., 70, 963–983.
Cipar, J., 1981. Broadband time domain modelling of earthquakes fromFriuli, Italy., Bull. seism. Soc. Am., 71, 1215–1231.
Cocco, M. & Rice, J.R., 2002. Pore pressure and poroelasticity effects inCoulomb stress analysis of earthquake interactions, J. geophys. Res., 107,ESE 2,1–17.
Cocco, M., Nostro, C. & Ekstrom, G., 2000. Static stress changes and fault in-teraction during the 1997 Umbria-Marche earthquake sequence, J. Seism.,4, 501–516.
Console, R. & Gasparini, C., 1976. Analisi dei parametri ipocentrali delterremoto del Friuli del 6 Maggio 1976, Boll. Geof. Teor. Appl., 18, 153–157.
Doglioni, C. & Bosellini, A., 1987. Eoalpine and Mesoalpine tectonics inthe southern Alps, Geol. Rundsch., 76/ 3, 735–754.
Dziewonski, A.M., Chou, T.A. & Woodhouse, J.H., 1981. Determination ofearthquake source parameters from waveform data for studies of globaland regional seismicity, J. geophys. Res., 86, 2825–2852.
Dziewonski, A.M. & Woodhouse, J.H., 1983. An experiment in the system-atic study of global seismicity; Centroid moment tensor solutions for 201moderate and large earthquakes of 1981, J. geophys. Res., 88, 3247–3271.
Ekstrom, G. & Nettles, M., 1997. Calibration of the HGLP seismographnetwork and centroid-moment tensor analysis of significant earthquakesof 1976, Phys. Earth planet. Inter., 101, 219–243.
Ekstrom, G., Tromp, J. & Larson, E.W., 1997. Measurements and globalmodels of surface waves, J. geophys. Res., 102, 8137–8157.
C© 2003 RAS, GJI, 156, 297–306
by guest on September 10, 2016
http://gji.oxfordjournals.org/D
ownloaded from

306 B. Perniola, G. Bressan and S. Pondrelli
Finetti, I., Russi, M. & Slejko, D., 1979. The Friuli earthquake (1976–1977),Tectonophysics, 53, 261–272.
Gephart, J.W. & Forsyth, D.W., 1984. An improved methos for determiningthe regional stress tensor using earthquake focal mechanism data: appli-cation to the San Fernando Earthquake sequence, J. geophys. Res., 89,9305–9320.
Hardebeck, J.L., Nazareth, J.J. & Hauksson E., 1998. The static stress changetriggering model: constraints from two southern California aftershocksequences, J. geophys. Res., 103, 24 427–24 437.
Harris, R.A., 1998. Introduction to special section: stress triggers, stressshadows, and implications for seismic hazard, J. geophys. Res., 103,24 374–24 358.
Harris, R.A. & Simpson, R.W., 1992. Changes in a static stress on southernCalifornia faults after the 1992 Landers earthquake, Nature, 360, 251–254.
Harris, R.A., Simpson, R.W. & Reasenberg, P.A., 1995. Influence of staticstress changes on earthquake location in southern California, Nature, 375,221–224.
Kanamori, H. & Anderson, D.L., 1975. Theoretical basis of some empiricalrelations in seismology, Bull. seism. Soc. Am., 65, 1073–1095.
King, G.C.P. & Cocco, M., 2001. Fault interaction by elastic stress changes: new clues from earthquake sequences, Adv. Geophys., 44, 1–38.
King, G.C.P., Stein, R.S. & Lin, J., 1994. Static stress changes and the trig-gering of earthquakes, Bull. seism. Soc. Am., 84, 935–953.
Livieratos, E., 1980. Crustal deformations from geodetic measurements,Boll. Geof. Teor. Appl., 22, 255–260.
Lyon-Caen, H., 1980. Seisme du Frioul (1976): Modeles de source a l’aidede sismogrammes synthetiques d’ondes de volume, These Diplome dedocteur de 3eme cycle. Universite Paris VII, Paris.
Mantovani, E., Albarello, D., Tamburelli, C. & Babbucci, D., 1996. Evolutionof the Tyrrhenian basin and surrounding regions as a result of the Africa-Eurasia convergence, J. Geodynamics, 21, 35–72.
Morelli, A., Ekstrom, G. & Olivieri, M., 2000. Source properties of the1997–98 Central Italy earthquake sequence from inversion of long-periodand broad-band seismograms, J. Seism., 4, 365–375.
Nostro, C., Cocco, M. & Belardinelli, M.E., 1997. Static stress changes inextensional regimes: an application to southern Apennines (Italy), Bull.seism. Soc. Am., 87, 234–248.
Okada, Y., 1992. Internal deformation due to shear and tensile faults in ahalf-space, Bull. seism. Soc. Am., 82, 1018–1040.
Perfettini, H., Stein, R.S., Simpson R. & Cocco, M., 1999. Stress transferby the 1988–1989 M = 5.3 and 5.4 Lake Elsman foreshocks to the LomaPrieta fault: unclamping at the site of peak mainshock slip, J. geophys.Res., 104, 20 169–20 182.
Peruzza, L., Poli, M.E., Rebez, A., Renner, G., Rogledi, D. & Slejko, D, 2002.The 1976–1977 seismic sequence in Friuli: new seismotectonic aspects,Memorie della Societa Geologica Italiana, 57, 391–400.
Pondrelli, S., Ekstrom, G. & Morelli, A., 2001. Seismotectonic re-evaluationof the 1976 Friuli, Italy, seismic sequence., J. Seism., 5, 73–83.
Pondrelli, S., Morelli, A., Ekstrom, G., Mazza, S. Boschi, E. & Dziewonski,
A.M., 2002. European-Mediterranean Regional Centroid Moment Ten-sors: 1997–2000, Phys. Earth planet. Int., 130, 71–101.
Reasenberg, P.A. & Simpson, R.W., 1992. Response of regional seismicity tothe static stress change produced by the Loma Prieta earthquake, Science,255, 1687–1690.
Rice, J.R., 1992. Fault stress states, pore pressure distributions and the weak-ness of the San Andreas fault, in Fault Mechanics and Transport Propertiesof Rock. A Festschrift in Honor of W.F. Brace, pp. 475–503, eds Evans, B.& Wong, T.F., Academic, San Diego.
Rice, J.R. & Cleary, M.P., 1976. Some basic stress diffusion solutions forfluid-saturated elastic porous media with compressible constituents, Rev.Geophys, 14, 227–241.
Roeloffs, L.A., 1988. Fault stability changes induced beneath a reservoirwith cyclic variations in water level, J. geophys. Res., 93, 2107–2124.
Rossi, G., Zadro M. & Ebblin C., 1998. Geodynamic processes at the north-ern boundary of Adria plate: strain-tilt measurements and modelling, inGeodynamics of the Alps-Adria Area by Means of Terrestrial and SatelliteMethods, eds Colic K. & Moritz H., Proceedings of the II InternationalSymposium, Dubrovnik, Croatia, 28 Sept–2 Oct. 1998, 271–282.
Scholz, C.H., 1990. The Mechanics of Earthquake and Faulting, p. 439,Cambridge University Press, New York.
Simpson, R.W. & Reasenberg, P.A., 1994. Earthquake-induced static-stresschanges on central California faults, ed. Simpson R.W., U.S. Geol. Surv.Profess. Pap. 1550-F, F55–F89.
Slejko, D. & Renner, G., 1984. La sequenza sismica iniziata col terremoto del6 maggio 1976 in Friuli, in Finalita ed esperienze della rete sismometricadel Friuli-Venezia Giulia, Regione Autonoma Friuli-Venezia Giulia, pp.75–92, Direzione Regionale Dei Lavori Pubblici, Trieste.
Slejko, D., Neri, G., Orozova, I., Renner, G. & Wyss, M., 1999. Stress fieldin Friuli (NE Italy) from fault plane solutions of activity following the1976 main shock, Bull. seism. Soc. Am., 89, 1037–1052.
Stein, R.S., King, G.C.P. & Lin, J., 1994. Stress triggering of the 1994 M =6.7 Northridge, California, earthquake by its predecessors, Science, 265,1432–1435.
Talamo, R., Pampaloni, M. & Grassi, S., 1978. Risultati delle misure dilivellazione di alta precisione eseguite dall’Istituto Geografico Militarenelle zone del friuli interessate dalle recenti attivita sismiche, Boll. Geod.Sc. Aff., 1, 6–75.
Utsu, T., Ogata, Y. & Matsu’ura, R.S., 1995. The centenary of the Omoriformula for a decay law of aftershock activity, J. Phys. Earth., 43, 1–33.
Venturini, C., 1991. Cinematica neogenico-quaternaria del sudalpino orien-tale (settore friulano), in Neogene Thrust tectonics. Esempi da Alpi merid-ionali, Appennino e Sicilia, pp. 109–116, eds Boccaletti, M., Deiana, G.& Papani, G., Studi Geol. Camerti Camerino Vol. spec., 1990. Universitadi Camerino, Camerino.
Zanferrari, A. et al., 1982. Evoluzione neotettonica dell’Italia nord-orientale,Mem. Soc. Geol., 35, 355–376.
Zonno, G. & Kind, R., 1984. Depth determination of north italian earth-quakes using Grafenberg data, Bull. seism. Soc. Am., 74, 1645–1659.
C© 2003 RAS, GJI, 156, 297–306
by guest on September 10, 2016
http://gji.oxfordjournals.org/D
ownloaded from