
1 77 X - World Bank Documents & Reports
228
177 X World Baik Discussion Papers The Regulatory Impediments to the Private Industrial Sector Development in Asla A Comparative Study Deena R. Khatkhate Public Disclosure Authorized Public Disclosure Authorized Public Disclosure Authorized Public Disclosure Authorized
-
Upload
khangminh22 -
Category
Documents
-
view
3 -
download
0
Transcript of 1 77 X - World Bank Documents & Reports

1 77 X World Baik Discussion Papers
The RegulatoryImpediments to thePrivate IndustrialSector Developmentin AslaA Comparative Study
Deena R. Khatkhate
Pub
lic D
iscl
osur
e A
utho
rized
Pub
lic D
iscl
osur
e A
utho
rized
Pub
lic D
iscl
osur
e A
utho
rized
Pub
lic D
iscl
osur
e A
utho
rized

Recent World Bank Discussion Papers
No. 118 Improving the Performance of Soviet Enterprises. John Nellis
No. 119 Public Enterprise Reform: Lessonsfrom the Past and Issuesfor the Future. Ahmed Galal
No. 120 The Information Technology Revolution and Economic Development. Nagy K. Hanna
No. 121 Promotitng Rural Cooperatives in Developing Countries: The Case of Sub-Saharan Africa. Avishay Braverman,J. LuisGuasch, Monika Huppi, and Lorenz Pohlmeier
No. 122 Performance Evaluationfor Public Enterprises. Leroy P. Jones
No. 123 Urban Housing Reform in China: An Economic Analysis. George S. Tolley
No. 124 The New Fiscal Federalism in Brazil. Anwar Shah
No. 125 Housing Reform in Socialist Economies. Bertrand Renaud
No. 126 Agricultural Technology in Sub-Saharan Africa: A Workshop on Research Issues. Suzanne Gnaegy andJock R.Anderson, editors
No. 127 Using Indigenous Knowledge in Agricultural Development. D. Michael Warren
No. 128 Research on Irrigation and Drainage Technologies: Fifteen Years of World Bank Experience. Raed Safadi andHerve Plusquellec
No. 129 Rent Control in Developing Countries. Stephen Malpezzi and Gwendolyn Ball
No. 130 Patterns of Direct Foreign Investment in China. Zafar Shah Khan
No. 131 A New View of Economic Growth: Four Lectures. Maurice FG. Scott
No. 132 Adjusting Educational Policies: Conserving Resources While Raising School Quality. Bruce Fuller and Aklilu Habte,editors
No. 133 Letting Girls Learn: Promising Approaches in Primary and Secondary Education. Barbara Herz, K. Subbarao,Masooma Habib, and Laura Raney
No. 134 Forest Economics and Policy Analysis: An Overview. William F. Hyde and David H. Newman, with a contributionby Roger A. Sedjo
No. 135 A Strategyfor Fisheries Development. Eduardo Loayza, in collaboration with Lucian M. Sprague
No. 136 Strengthening Public Service Accountability: A Conceptual Framework. Samuel Paul
No. 137 Deferred Cost Recoveryfor Higher Education: Student Loan Programs in Developing Countries. Douglas Albrechtand Adrian Ziderman
No. 138 Coal Pricing in China: Issues and Reform Strategy. Yves Albouy
No. 139 Portfolio Performance of Selected Social Security Institutes in Latin America. Carmelo Mesa-Lago
No. 140 Social Security and Prospectsfor Equity in Latin America. Carmelo Mesa-Lago
No. 141 China's Foreign Trade and Comparative Advantage: Prospects, Problems, and Policy Implications. Alexander J. Yeats
No. 142 Restructuring Socialist Industry: Poland's Experience in 1990. Homi J. Kharas
No. 143 China: Industrial Policiesfor an Economy in Transition. Inderjit Singh
No. 144 Reforming Prices: The Experience of China, Hungary, and Poland. Anand Rajaram
No. 145 Developing Mongolia. Shahid Yusuf and Shahidjaved Burki
No. 146 Sino-Japanese Economic Relationships: Trade, Direct Investment, and Future Strategy. Shuichi Ono
(Continued on the inside back cover.)

1 77 IESI World Bank Discussion Papers
The RegulatoryImpediments to thePrivate IndustrialSector Developmentin AsiaA Comparative Study
Deena R. Khatkhate
The World BankWashington, D.C.

Copyright c 1992The International Bank for Reconstructionand Development/THE WORLD BANK1818 H Street, N.W.Washington, D.C. 20433, U.SA.
All rights reservedMamifactured in the United States of AmericaFirst printing September 1992
Discsion Papers present results of country analysis or research that is circulated to encourage discussionand comment vwthin the development community. To present these results with the least possible delay, thetypescript of this paper has not been prepared in accordance with the procedures appropriate to formalpdnted texts, and the World Bank accepts no responsibility for errors.
The findis, interpretations, and conclusions expressed in this paper are entirely those of the author(s) andshould not be attributed in any manner to the Wodd Bank, to its affiliated organizations, or to members ofits Board of Executive Directors or the countries they represent. The World Bank does not guarantee theaccuracy of the data included in this publication and accepts no responsibility whatsoever for anyconsequence of their use. Any maps that accompany the text have been prepared solely for the convenienceof readers; the designations and presentation of material in them do not imply the expression of any opinionwhatsoever on the part of the World Bank, its affiliates, or its Board or member countries concening thelepl stau of any country, territory, city, or area or of the authorities thereof or concerning the delimitationof its boundades or its national affiliation.
The material in this publication is copyrighted. Requests for permission to reproduce portions of it shouldbe sent to the Office of the Publisher at the address shown in the copyright notice above. The World Bankencourages dissemination of its work and will normally give permission prompdy and, when thereproduction is for noncommercial purposes, without asking a fee. Permission to copy portions for classroomuse is ganted through the Copyright Clearance Center, 27 Congress Street, Salem, Massachusetts 01970, U.SA.
The complete backlist of publcations from the World Bank is shown in the annual Index of Publications,which contins an alphabetical tide lst (with full orderng information) and indexes of subjects, authors, andcountries and regions. The latest edition is available free of charge from the Distribution Unit, Office of thePublisher, Department F, The World Bank, 1818 H Street, N.W., Washington, D.C. 20433, U.S.A., orfrom Publications, The World Bank, 66, avenue d'I6na, 75116 Paris, France.
ISSN: 0259-210X
Deena R. Khatchate is a consultant in the Industry, Trade and Finance Division of the World Bank's AsiaTechnical Department.
lbnry of Congru Cataloging-in-Publication Data
Khatkhate, Deena R.The regulatory impediments to the private industrial sector
development in Asia: a comparative study / Deena Khatchate.p. cn. - (World Bank discussion papers; 177)
ISBN 0-8213-2221-41. Industry and state-Asia, Southeastern. 2. Industry and state-South Asia. I. Tide. II. Series.HD3616.A773K48 1992338.954-dc2O 92-23555
CIP

- iii -
FOREWORD
The World Bank has come to focus more sharply than in the past onrole of the private sector in member countries. There has been a great deal ofdiscussion on this issue within the Bank with a view to understanding the natureof impediments to the private industrial sector development and to explore afresh approach to promoting that vital sector as an engine of growth. One of theways to clearly perceive the issues is to develop a regional overview of theprivate sector role in some of the countries, where its progress is held back bya variety of regulatory policies. The underlying idea of this study is not somuch to deal with all the relevant policies, such as financial and trade regimesaffecting the private sector or the privatization of public sector as to bringin sharp relief the impediments placed in its development by industrial licensingpolicies, direct foreign investment policies, labor market constraints, pricecontrols and distorted promotional policies. While doing so, it would be helpfulfor the Bank, to know what changes in these policies have occurred, how they haveimpacted on the private sector and what needs to be done in future. However,since the regulatory policies may have different implications in differentcountries, it is rewarding to present a comparative picture in regard to thecountries covered as done in this study. The countries - Bangladesh, India,Indonesia, the Philippines and Sri Lanka are chosen because they provide a mixof countries which need more vigorous and well defined policies to promote theprivate sector.
The study has relied only on the available sources within the Bankand outside and therefore there has remained inevitably several gaps ininformation and data, which seem to have biased some of the analytical points andconclusions. Though the difficulties in developing an analytical framework wererecognized, an attempt was made to discuss the regulatory policies in a mutuallyconsistent and sufficiently representative empirical framework (drawing, ofcourse, on the work done in the academia) germane to developing countries, inwhich interrelations between macroeconomic determinants of private sectordevelopment, the degree of interventionist policies and the relative role ofpublic and private sector are clearly underscored. The approach adopted forpresentation of the material is to discuss the selected regulatory policy aspectswith respect to each of the countries, referring to inter-country variations andto weave the common threads of arguments in the Executive Summary. This approachalso combined the macro-policy discussion with micro analysis of selectedsubsectors, before and after the regulatory reforms affecting them wereiLntroduced. This was done in order to capture the impact of reforms onindustries more concretely and meaningfully, which could not have been possibleif the impact was sought to be assessed only on a macro basis. This study hasyielded some interesting lessons which, I hope, will guide not only the policymakers in these countries but also the Bank staff working in those countries andother countries where the development of private sector is awaiting more focusedattention.
Daniel RitchieDirector
Asia Technical DepartmentAsia Region

- iv -
Acknowldo mant
Th- author would like to acknowledge coments and suggestions on earlierdrafts of this paper by Daniel Ritchie, Ihalid Siraj, Frida Johansen, DipakDasgupata, Nissim Zzekiel, Charleo Draper, Dilip Wagle, N. Hanna and I. Newport.Hemant Saijal provided valuable statistical assistance and prepared the earlydrafts of the country industry studios included in the appendix.

!ables of Onemt5
Exccutivo Summary .............. ..* .......................... . ................... ........ vii
I. Introduction .. .... ............. ................*................. I
II. Private Sector Develoment. its Deterinant and Role ofGovernment Intervention - An Emoirical Fram.work .....0................... . 2
Private Investment and Economic Growth ................................ 3Macroeconomic Determinants of Private Investment in Developing Countries ... 4Limits of Government Intervention ....... ....... . ...... . S
III. Macroeconomic Environment and Trade and Financial c ar Polies .......... .0
Macroeconomic Environment . ...... ... .. * ....................... 10
Trade Policy Reforms ........................................................ 28
Financial Sector Reforms .. ................................................. 32
IV. Domestic Reaulatorv Policy Imoediments to the PrivateIndustrial Development ..................................................... 37
Industrial Policy Framework ... ............... . 37
Consequences of Domestic Regulatory Policy . . 54
V. Industrial PolicX Reform and Its Imoact............................. 66
Industrial Regulatory Policy Reform .............................. ........... 66Impact of Deregulation . ........... .*. ........ s ... .......... . 83
A Micro Approach to Impact of Deregulation on Industry . ............. 102References ................................................................. 104Appendices ...... . .................... 109


vii
EXECUTIVE SUMMARY
Introduction
1. This study, drawing mainly on the existing material within the Bank
group and outside focuses on the domestic regulatory apparatus in five Asiancountries, India, Indonesia, The Philippines, Sri Lanka and Bangladesh inorder to critically examine how it has affected the growth of privateindustrial sector development. The selected countries provide a mix of
countries that are in various stages of modifying and/or dismantling theirdomestic regulatory policies. These are discussed under five topics:(a) industrial licensing; (b) price control policies; (c) labor marketpolicies; (d) policies directed towards direct foreign investments; and(e) the promotional policies in regard to private sector development. To theextent other policies such as trade and financial sector policies are germaneto the private sector development, they have been briefly discussed inappropriate contexts. There are other regulatory obstacles to the privateindustrial development but they could not be discussed for want of relevantinformation. The summary will focus on the salient features of this study,such as its underlying empirical framework, divergence and convergence ofexperiences of the countries covered in the study and some lessons drawn fromtheir experiences.
Determinants of Private Sector Development and Role of GovernmentIntervention - An Empirical Framework
2. Recent empirical research in the field of development economics hasdemonstrated for a sample of 24 developing countries that there is a strongand positive relationship between private sector activity, particularlyprivate sector investment and economic growth. Except when public investmentis in infrastructure, it tends to crowd out private investment. The privatesector, which grows faster through direct and indirect policy measuresdirected at removing constraints and offering incentives of various sortsplays a dominant role in the growth process. In the sample of countrieschosen, which included several Asian countries, it is found that, highestaverage rates of growth were attained with the highest average ratios ofprivate to total investments. More important is the finding that theproductivity growth arising from factors and technical change has been higherLn respect of private investment than in public investment. The capital inprivate investment contributes to productivity, while capital's contributionin public investment has been negative. These experiences generally conformto those of the industrial countries.
:3. On the basis of the experiences of the industrial countries duringthe last four decades, the macroeconomic determinants of private investmentare identified as: (a) macroeconomic stability as represented by lowinflation rate; (b) economic growth and per capita income level; (c) the levelof real interest rates; (d) debt service ratio; and (e) the rate of publicsector investments. The relationship between private sector growth andinflation rate, debt-service ratio and public investment (except when it is ininfrastructure) is negative and the relationship between private investment

viii
and per capita income level and real interest rates is positive. The evidenceon these relationships has been investigated in empirical work on 23 develop-ing countries both by observing the average values during the period of 1975-87 with above and below average private investment rates and by rigorouseconometric tests and it was concluded that the expected relationship betweenprivate investment and the specified determinants is well supported.
4. As regards the limits and nature of government intervention inprivate sector activiLty, the empirical evidence points to the possibility andalso practicability to devise optimal rules for operating regulatory systemwhich while servicing its legitimate purpose will not transcend its limits tothe disadvantage of the private sector development. First, any policyaffecting allocation of resources, and regulation of private sector needs tobe pursued if and only if there is a specified set of procedures or criteriafor deciding what fits within the defined scope of the enunciated economicpolicies. Second, even when there is strong presumption in favor of govern-ment intervention, it is imperative to limit it to minimum necessary scale asefficiency of regulation is scale-determined. Three, from amongst theavailable alternative regulatory sets, it is necessary to go in for one whichwill provide the least scope for rent seeking. This may imply that policiesdirectly controlling private sector are likely to be less efficient thanpolicies that offer incentives for individuals to embark on activities whichare considered desirable. Finally, a regulatory policy involving lowerinformation costs and transparency is a preferred alternative.
Se It is with a general reference to this empirical framework that theregulatory policies as operated in the five Asian countries, and their reformsare discussed below.
Intercountry Experience in Operating Regulatory Policies:Divergence and Converaence
6. The experience in pursuing regulatory policies and their implementa-tion in all these five countries has been unavoidably diverse and yieldedvarying results. The reasons for this difference in performance are many andvaried. The macroeconomic environment is a crucial factor in determining themode of regulatory policies and their outcome. Domestic regulatory reform isa part of an overall reform strategy and its impact therefore is determined byhow well other parts of the reform strategy are dovetailed into the domesticregulatory policy. The success of the policies is also dependent on how theregulatory reforms are designed. At times, in a strict formal sense, reformslook attractive but there are certain features which get built into it,attenuating their efficiency. From this point of view, it is rewarding toreview the experiences of the five countries in a comparative context. Thisapproach may also suggest how certain problems, faced by some of the countriescould be avoided by modification of reform policies in those countries,drawing on the experiences of those where no such problems had arisen; it mayalso enrich the knowledge of those who would be involved in the private sectordevelopment policies at some future date.
7. All the five countries covered in this study--India,Indonesia, ThePhilippines, Sri Lanka and Bangladesh--differfrom each other in almost everyrespect - structure, the stage of development, diversity of output and theexport orientation. India and The Philippines were perhaps much more advanced

ix
in the early 1950s than the other three. But the greatest progress in termsof industrialization and export orientation took place in Indonesia particu-larly since the beginning of 1980e. It also figured most prominently in thefield of economic reform whether it related to financial reform, trade reformor thie industrial regulatory reform. On the other hand, India's reforms werelopsided, confined mainly to the domestic regulatory policies leaving otherareas like the trade and financial sector reform relatively immune from newpolicies until recently. The Philippines, Sri Lanka, and Bangladesh have mademajor dent on their trade and financial sector policies which were, in manyrespects more far-reachingthan in the case of India. In terms of macro-economic situation, Indonesia has been able to maintain a better record since1980, which contributed to the speed of the reform of its trade, financial andindustrial regulatory policies. India, after a long period of stable macro-economic environment ran into serious imbalances in the latter half of 1980s--precisely the period when it embarked on industrial deregulation. ThePhilippines, Sri Lanka, and Bangladesh went through undulating macroeconomicsituation during the 1980s, which, while interfering with their economicreform policies, did not scupper them. In fact, despite the adverse macro-economic situation, these countries persisted with their reforms with varyingdegree of success.
8. Despite some differences among countries arising from the differingeconomic structures, stages of devel6pment or the openness of the economies,they are all similar in regard to what they experienced from followingregulatory policies such as industrial licensing, price controls, promotionalpolicies in regard to small scale industries, labor market polices and thepolicies towards FDI. Industrial licensing failed to achieve the objective ofdi,spersal of industry or producing output in cost-effective and profitableways. It did not succeed in preventing products, not intended by the authori-ties nor concentration of industries in, few owners, cities or areas. Pricecontrols proved to be the greatest disincentive for production of thecontrolled commodities in all countries and accounted for latent or openinflationary pressures and widespread rent seeking. Again, these controlswere evaded on a large scale. The import substitution was no doubtaccelerated but it was not only inefficient but also raised the level ofimports in all the five countries, containment of which was the avowedobjective of import substitution strategy. The promotional policies towardssmall scale industries failed to accomplish their goal. The so-called smallscale industries consumed both capital and labor and they came in the way ofhealthy and competitive expansion of the large industry.
9. India's experience in reform policies has been illuminating less forwhat India accomplished in making its economy competitive than for letting innew impulses for efficiency consciousness. A reorientation in governmentpolicies towards industrial development during the 1980s no doubt brought in afresh breeze in otherwise suffocated private enterprise economy and for thefirst time, it was realized by the industrial entrepreneurs that quantitygeneration without quality and competitive pricing would be a futile exercisein the long run when India would have to face outside producers in the worldmarket. And yet it can not be said that the domestic regulatory reform wasfar reaching enough. In point of fact, it was half-hearted, steeped inbureaucratic rigmarole, and essentially opaque. Though the grip of theadministration was somewhat loosened and the implementation of regulatoryregime was made somewhat purposive, "the system remained substantially intact.In some ways, it actually became more complicated, because almost every reform

x
was hedged about with pages of rules to prevent abuse. The folds of India'sregulatory system overlap each other so luxuriously that extreme violence willbe needed to expose even an inch of the economy to daylight".1/
10. One of the major reasons for this rather disappointing outcome wasthe perpetuation of the old trade regime. The high effective rate ofprotection (ERP) in industries benefitting from delicensing, while bearinghigh financial returns ended up in distorting domestic industrial structure,and in insulating it: from foreign competition. One of the glaring exampleswas the implementation of the Phased Manufacturing Program (PMP) which tookaway a great deal of advantages which the industry with or without licensingrequirements could have derived from the relaxed regulatory regime. PMPs hadtwo effects: First, the local content of requirements resulted in uneconomicscales of production and raised the cost of the final production. Second inthose industries where technological innovations could occur rapidly, indigen-ousness of the compcnent industry resulted in a "locked in" effect on thefinal goods. As regards exports, though a variety of incentives wereprovided, they entailed a massive complexity of the schemes, the delays, thetime and money needed to deal with power-conscious bureaucracy. The endresult of all this, was that final impact on private sector industrialdevelopment and the efficiency was much less than it could have been, if tradepolicy regime had undergone reform simultaneously.
il. Equally discouraging and counterproductive was the design of theregulatory reforms. If one step was taken forward towards liberalization, itwas matched by half a step backward to minimize if not completely offset theimpact. This was done by adding a large number of micro conditions to themacro measures, whether the reform related to the large scale organizedindustrial sector or the small. scale industries or their location in backwardregions. This was well illustrated by what was pronounced in the 1990Industrial Policy (though it remained a paper tiger). The effective ceilingon project size for delicensing was raised by 300 percent but at the sametime, a proviso was added that industry-specific delicensing would beeliminated- -i.e. all projects above the size ceiling would be required toobtain license even in Previously delicensed industries. Yet another examplewas that of requirement for Minimum Economic Scale (MES) plants. While theclearance or new investment and most expansion investments conforming to MESstipulation, was automatic, the clearance for projects above MES was not.Similar was the experience in regard to permissible investment in the backwardareas or the small scale industries which were saddled with micro conditionsof one kind or another for availing of every concession offered.
12. The nature of the public sector investment and its uneconomic andinefficient operations detracted considerably from the intended impact of thedomestic deregulation. It was often argued that the private sector industrialperformance was lackluster because of the slowdown in public investment andunless the latter picked up, private sector growth would remain sluggish.However, the public investment that was implicit was in infrastructuralfacilities such as power, communication and transport and not in manufacturingsuch as machinery, steel etc. What actually happened was that the publicsector investment could not increase, where it ought to have, because of the
1/ A Survey of India in the Economist (London), May 4, 1991.

xi
wasteful operation of the public sector manufacturing sector, which failed togenerate internal surpluses. As several studies by Bureau of Industrial Costsand Prices (BICP) have shown, the state owned steel plants, coal mines,
shipyards, machine tool factories and host of similar other enterprises, werebedeviled with egregious overstaffing, obsolete technology, underutilizationof capacity, excessive inventories--allthat would make the enterprise a deadduck. Thus the public investment, even of a desirable kind could notincrease. On the other hand, the high cost of products in vital inputindustries in the public sector was passed on to the captive private sector inthe form of higher prices or higher taxes.
13. Finally, the authorities' piecemeal and firefighting kind ofapproach to domestic deregulation ignored the crucial importance of overdue
labor market reforms. Far from any reform in this sphere, the Governmentsboth central and states were totally apathetic to the problem and took someretrogressive steps such as prohibiting retrenchment in loss-makingindustries. This made not only the exit of loss-making industrial unitsalmost impossible but also prevented other industries which were favorablyimpacted by domestic deregulation from improving their operational efficiencyand to become competitive both in domestic and foreign markets.
14. Nevertheless, the deregulation experiment that India embarked onduring the 1980s, however, faint-hearted was not in vain. It could show in aconvincing fashion what even a small dose of domestic deregulation couldaclhieve in terms of higher industrial performance, economic efficiency,diversity of products and eagerness to compete in international markets. Itopened a window of opportunity to the private sector which exploited theincentives with vigor and when confronted with unresponsive bureaucracies,tried to get round them in legal or illegal ways to demonstrate its intrinsicdynamism. It tested the waters of a less constrictive environment anddeimonstrated to the skeptical government and intelligentsia in general whatcould be accomplished, even with a little chance coming its way. Perhaps themost important benefits that ensued from 1980s deregulation were psychologicaland attitudinal and may help to break the entrenched barriers in the Indianeconomy to rapid growth of the private sector. With new sweeping economicpolicy reforms ushered in by the Government that came to power in June 1991,the Indian private sector may record more efficient growth than in the past.
15. Indonesia, on the other hand, presents a striking contrast to India.The Indonesian experience can be taken as strongly supporting the deregulationpolicies taken in their pristine purity. Its success lay in synchronizing itwith the sound macroeconomic policies, its strong export orientation, theassignment of a central role to the private sector, mutual consistency amongreforms in all areas, trade, financial sector, industrial licensing, land andlabor policy, etc., and deepening the reform process continuously throughextending it to new areas, e.g., maritime deregulation. Appropriate exchangerate adjustment, interest rate deregulation, control of inflation, access toexport credits created the suitable incentive framework, within which theprivate sector could progress rapidly, by exploring new products and newmarkets. Apart from this, the reforms in different areas were not only wellcoordinated but properly sequenced. But for this, the reform process wouldhave stalled either because certain reforms were prematurely set in or certain
others were delayed.

xii
16. With all these reforms, however, Indonesia has not been able toeliminate some other obstacles peculiar to that country, which are even moreformidable than industrial regulatory policies or a trade policy. Unless theyare modified, it cannot be said, in a comparative sense, that Indonesia'sderegulation has progressed faster than in countries like India. First ofthese is the corporate legal framework consisting of antiquated laws unsuitedto modern business practices. The most important weakness of the legalframework has been enforcement of laws which entail several cumbersomeprocedures. So long as these gaps remain, other deregulation measures wouldnot result in achieving what could have been achieved otherwise. Indonesiahas been also amiss in not paying adequate attention to reforms of local levelregulations which have been particularly complex, complicated and incomprehen-sible and have posed more formidable barriers to entry than the investmentlicensing regulations. Since nothing much is done in this area, other majorreforms have been less successful in their intended goals. This throws intobold relief the fact that for any comparative study, the relevance andimplications of restrictive practices, not often captured by commonly adoptedregulatory practices across countries need to be understood in their propercontext. In the absence of information on legal framework and contract lawsin other countries, no meaningful conclusion can be drawn about whether thesecountries performed better or worse than Indonesia.
17. The Philippines' case is typical of how proforma reform processesprogress. It has pursued reform on a wide front--notbold but in a rightdirection. As a result the private sector investment increased substantiallyand a considerable impetus was given to the labor-intensive techniques ofproduction. The export-oriented projects however began to decline because themacroeconomic policies, particularly the real exchange rate policy ran counterto the basic thrust of the reform policies--theexperience not too differentfrom that of India, where the industrial deregulation coincided with worseningof the balance of payments and precisely for the same reasons as in thePhilippines, viz., iLnconsistent macroeconomic policies as reflected inwidening fiscal deficit. The Philippine's experience in regard to foreigndirect investment can be contrasted with that of Indonesia. Both liberalizedpolicies toward foreign investment in intent, incentive and direction but withdifferent results. Indonesia emerged as a beneficiary on a larger scale whilethe Philippines was left on the fringe. The reason was, apart from thepolitical instability which was beyond the control of the authorities, thehesitant implementation of the DFI policy. There was a strong perception thatthe policy operated on a case-by-casebasis, providing misleading signalsabout the discretionary authorities. This was also accompanied by theapprehension about "60-40" rule that restricted foreign ownership in projectsto 40 percent- -againan experience analogous to what happened in India.
18. Sri Lanka typified a case where far reaching economic reforms wereintroduced in 1977, but a pay-off in terms of results was small. This wasbecause the authorities lost the momentum of reforms, being preoccupied withthe problem of macro management of the economy, which became serious due torapid expansion of the public sector and consequent widening of fiscaldeficit. In fact Sri Lanka's experience throws in bold relief the criticalimportance of the need to maintain macroeconomic stability as a preconditionfor the progress and success of reform policies. Sri Lanka's reforms were onwide front-financial sector, trade and industrial sector, but they did notsucceed as much as they could have if the authorities were more adept inmaintaining suitable macroeconomic environment.

xiii
19. Bangladesh represents a somewhat different case where despitegenerous and varied incentive system in regard to foreign investment, theimpact on DIP was moderate. Though in the 1980e, several export-orientedindustries were established, the flow of foreign investment was discouraged bylimited resource base, small domestic market, inadequacy of physical andsocial infrastructural facilities, relatively high production costs, poorlabor discipline and above all the unreliable legal system. In fact thenumber of foreign firms in the manufacturing sector declined. Thisdemonstrates that much more than the formal incentive scheme is required forindustrial promotion and a piecemeal approach to deregulation is perhapscounterproductive. Unfortunately, firmer conclusions about the reform impactsin Sri Lanka and Bangladesh could not be drawn in absence of reliable informa-tion and data.
20. What emerges from the reform experiences in the countries is thatthe impediments in private sector development should not be interpreted asarising from any particular set of policies in a particular area; they areimbedded in the economic and industrial environment, institutional andadministrative arrangements and procedures, lack of internal mobility of laborand capital, and cultural and sociological attitudes. Thus the problem ofimpediment should be seen as a whole and the approach to their removal shouldbe multi-dimensional.
What Do We Learn?
21. First of all, the economies which strive to grow rapidly through amedium of private sector have to maintain macroeconomic balances as indicatedby sustainable balance of payments deficit, minimization of external debt-overhang, declining fiscal deficit and reasonably stable inflation rates. Inabsence of this, a stab at regulatory reforms would not only not yield optimalresults but would in fact weaken reforms. After all, deregulation is notwithout costs in the short and medium term. Since the manufacturing sectorunder constricting regulatory regime develops a great deal of featherbedding,the whiff of reform creates initially viability problems for the sector and ata second remove for the financial sector. This is because the financialsystem, comes under heavy strain and stress with collapsing borrowing industryand ends with a large amount of non-performing loans. Thus the financialcrisis with a large amount of bad loans looms large in normal circumstances inregulated economies but it becomes even more unmanageable if the macroeconomicsituation is adverse to begin with. Apart from this, real incentives for theprivate sector emanate from a stable economic situation which assures growingmarkets, scope for enterprise, and innate urge for seeking profit opportuni-tiies and these incentives are stronger than the disincentives stemming fromre,gulatory system per se.
22. The second lesson is that a holistic approach to deregulation ismore productive than a partial deregulation in any one sphere say inindustrial policy which is divorced from any reform in other areas. If forinstance, domestic deregulation frees industry, it does not reap the competi-tive benefits fully unless the domestic industry faces the challenges frominternational markets. This means, domestic deregulation should proceed Diaassu with liberalization of trade and tariffs. If resource allocation
between traded and home goods is to be influenced, it should better be done byusing economy-wide instruments such as appropriate real exchange rate policy,rather than specific quotas and differentiated tariffs and so on. However,

xiv
the governments in the countries studied except Indonesia have been slow ontrade reforms on the ostensible ground that the major sources of revenue wouldbe lost to the governments with the elimination of tariffs. If that is thecase, then a policy of instituting a uniform tariff across all imports wouldbe a better alternative. That would give separate exchange rates for exportsand imports (without resulting in different exchange rates for differentimports). The merit of such a policy of associating trade reform withdomestic deregulation would have a more efficiency-enhancing impact on thedomestic manufacturing sector.
23. Three, the evidence gathered from the countries also indicates thatit is difficult to resort to selective intervention as a general propositionas opposed to the functional intervention. The critical element in allregulatory policies, especially of selective type which involves favoring onetype of activity over the other competing one is the exercise of discretion.Although some principles or rules can be devised to govern the intervention ofselective type, they tend to become non-operational for two reasons. First itis impossible, even in theory to come up with a set of principles or rule forall myriad categories of regulations that are mutually consistent with themultiple goals of the industrial policy framework, which in themselves are notentirely consistent. This means that the first operating rule mentioned inpara. 4 that any policy regulating private economic activity needs to bepursued if and only if there is a specified set of procedures or criterion forwhat should be included or excluded is often violated. This was borne out bywhat happened in India. Most of the state intervention was devised to assisteither small scale industry or a project helping the poor. In practice, thecoverage expanded so much that selectivity was lost in the process ofimplementation. Thie same was the experience in Indonesia, the Philippines andSri Lanka, where the targeted industries far from benefitting from interven-tion in terms of productivity and profitability, remained in crutches almostperennially. For another, the problem of translating whatever rules there areinto operational decisions is "a problem of orwellian dimensions." Theallocative mechanism is largely in the form of quantitative restrictions. Itis true that regulatory policy of selective type achieved impressive resultsin Korea and Japan. However, much of the success that it met with is to beascribed to the institutional, historical, sociological and cultural factorsspecific to these countries and it is unrealistic to generalize its beneficialimpact for other countries. In India for example, the intervention began withselectivity approachi, in early stages of its development but it soon becamemore generic resulti.ng in perverse incentive system. If a selective interven-tion becomes ineluctable at all, it should be done in such a way that theintervened industries are exposed to market discipline as much as the Koreanindustry was.
24. Four, the regulatory system worked best when it was confined to asmall part of the functioning of industry as the efficiency of regulations isscale-determined. In all the countries covered in the study but more particu-larly in India and Indonesia, the intervention was not only in almost allsegments of industry but also all aspects of their organization. The creditwas regulated, output size was controlled, management was directed, locationwas determined, the marketing of products was planned and all that is done bythe bureaucracy of the Government whose motivations and attitudes weregoverned by law and order ethos of the governance than by commercial andtechnological considerations. Here again, second optimal rule of interventionmentioned earlier was not observed.

xv
25. Five, the promotional policy particularly in regard to small scaleindustry through reservation of products and so on, while being promotionaltowards inefficient industry tends to discourage capacity creation in andcompetition from large scale industry whether or not the product of the smallscale sector is competitive in terms of cost and quality. The mill sector ofIndia's textile industry and its exports were destroyed in part by suchpolicy, while the small scale industry could not stand on its feet. India'sexperience in this arealhas been one of unending woes for the small scalesector. Even after prolonged period of subsidization of all sorts, the numberof small scale units turning sick mounted over the years. If the assuredcredit access to imports and other needed inputs for getting enterpriserunning and going, are maintained as easy and equitable, there is no furtherincentive needed to be provided through reservation of products and throughtaxing of large-scale sector products. The focus should be on access issueand not on subsidies, taxes or reservation.
26. Six, the domestic regulating policy, while being a major impedimentto the private industrial development is one among many. Even more importantmeasures are needed to be directed towards creating a legal and institutionalinfrastructure for the smooth functioning of the private sector. This hasbeen well illustrated by the Indonesian experience. Though Indonesia'sindustrial policy, trade and financial sector reforms were deep and sweeping,they failed to get a full pay-off as Indonesia lagged in changing itscorporate law and other laws vital to trade and industry. Similar was thecase with issues of land and property rights. In some ways, the reform ofthese laws became more imperative than industrial deregulation. Othercountries like the Philippines, Bangladesh may have had these problems but theinformation on their legal framework and property rights could not beobtained. If allowance is made for it, perhaps, their situation may be foundto be even worse than that of Indonesia.
27,, Seven, the policy towards foreign investment has been liberalized inAsian countries but it succeeded most in some like Indonesia in inducinginflow of foreign investment. This means that the intent of the FDI policyand other factors related to it are more important than mere formal liberal-ization of ownership in foreign investment. Oftentimes, the foreigninvestment policy liberalization is accompanied by stipulation of conditionsrequiring foreign firms to export a certain part of their output. While thisis understandable in view of the foreign exchange constraints in thesecountries, it is interpreted by foreign investors as unduly binding on theiroperations. If a free and competitive markets are maintained within thecountries, the foreign firms would naturally remain cost effective, in whichcase their products will automatically compete with similar productsmanufactured internationally and the conditions for compulsory exports willbecome redundant. If the foreign firms are not competitive, then there issomething wrong with a whole set of domestic policies which still stall theemiergence of competitive markets.
28, Eight, reform of regulatory policies is of course an imperative butcredibility of these policies is even more important. It has been a commonexperience in deregulating countries that the policies are often changedbackward and forward, which create a great deal of uncertainty in theinvestor's mind as to whether the new reformed policies would stay the courseor would be reversed. It is therefore necessary that the governments refrainfrom changing the direction of their reform policies once they are set in

xvi
motion. If the authorities consider that economic fundamentals are such thatthey make reversal unavoidable, they should, from the start, introduce reformsin discrete steps so that they would stay put even if economic situationchanges for worse.
29. Ten, the labor market policy changes cannot be shirked if thederegulation is to take hold . Facilitation of exit is as much crucial asentry which is addressed by deregulation. However, the experience shows thatin most countries, there is a certain lethargy in dealing up-front with laborretrenchment which inevitably follows deregulation. Much can be learnt inthis regard from thie Swedish labor market policies. Anticipating laborretrenchment, the government can organize retraining programs for retrenchedlabor to prepare them for new kinds of jobs, through paying them remunerationless than the wages in the previous employment. In addition to this, employ-ment schemes paid for with wage goods, tried in countries like India can beimplemented. In short, labor market reforms should be considered as a sinaqua non of the industrial policy reform.
30. Eleven, though all the countries under examination had introduced avariety of incentive schemes - fiscal, credit, marketing and technical, theywere either inadequate or overborne by a set of direct regulations . If theemphasis were mainly on the former, the rent seeking could have been much lessand industrial growth would have been higher. As observed the countries usedindustrial licensing and price and foreign controls as the main instrumentsfor directing investment; allowing the manufactures to indulge more incircumventing these controls rather than in producing what was targeted by thestate.
31. Twelve, most of the regulations used and implemented underlinedbroad goals about industries to be promoted and the assistance provided tothem, while details of these policies were enshrined in rules and regulationsknown only to those who administered those policies. This was particularly soin regard to industrial licensing and foreign exchange allocations and thepolicies to ward foreign direct investment. This lack of transparency inregulatory mechanisms, gave undue powers to the administration and encouragedthe special interests group in the private sector to appropriate licenses orforeign exchange allocations through personal contacts with the concernedauthorities. The most glaring example of this was that of India. There wasbroad eligibility criteria for issue of industrial licensing, which emphasizedwide dispersal of owinership of industry. However, as it turned out, thelicenses issued got concentrated in only a few big industrialists, therebydefeating the very criterion used to prevent it.
32. Finally, this paper recognizes but could not discuss for want ofinformation how much importance should be attached to the transaction costsarising from interactions between the private sector and the Government on theone hand and those between different firms within the private sector. It iswidely believed that transaction costs, described also as "cost of doingbusiness" may be even a more deterring factor for industrial growth than theregulatory policies. With the reduction of these transaction costs, therigour of regulations may not be felt to the same extent as is generallybelieved. One study, though preliminary, found that there is a regularcorrelation between the cost of communications - a particular subject of

xvii
transaction cost and export growth.2/ For lack of required data for the
countries, these hypotheses could not be tested, though there is a strong casefor in in-depth study of this aspect in any liberalization policies that areto be formulated for the developing countries or countries in transitions from
a socialist to market oriented system.
2/ D. Laland U. Patel, "Transaction Costs or the Cost of Doing Business.Empirical Estimates for Some Developing Countries" (Unpublished) 1992.


I. INTRODUCTION
1.1 In the early thinking on the economic problems of developingcountries and development policy, there was a pronounced bias in favor of thepublic sector as an instrument of development and income distribution andgovernmental intervention to regulate the incipient private sector so as makeit conform to the certain predetermined investment priorities. A strong faithin the Government's power was reinforced by the inchoate stage of privateenterprise and initiative in the early phases of development, uncongenialeconomic environment, inadequacy and rigidities of the money and capitalmarkets to finance new enterprises and the lumpiness of new investments.
1.2 There has been recently a marked turnaround in the approach todevelopment policy. The realization that policies, with a subordinate roleassigned to the private sector introduced many unintended distortions in mostof the developing countries, which culminated ineluctably in an all round risein economic and social costs of development, thereby drying up the mainspringsof productivity growth. The accumulated experiences of a relative failure ofthe public sector including its regulatory policies acquired sharpness ofrelevance when the centrally planned economies with comprehensiveinterventionist regimes, collapsed in quick succession. The unresponsivebureaucracy, a maze of controls and regulations, unaccountability inmanagement and the inability to react to changing opportunities and pricesignals, both internal and external tended to sap the vitality of theeconomies and as a result these countries reached a point of no return. By arule of elimination, therefore, a sustained and dynamic development of theprivate sector became an only viable option for the progress of theseeconomies.
1.3 There were also positive factors which imparted urgency to relianceon the private sector as the main engine of growth. The rapid development ofthe newly industrialized countries in Asia (NICs) demonstrated the vigorousnature of the private sector-led growth and the legitimate role of thegovernment in clearly defining rules to intervene in cases of market failureand in provision of public goods, including legal and institutionalfoundations, education and certain infrastructural investment. The otherdevelopment was that international markets became more integrated with greatermobility of factors of goods, more efficient flow of information and rapidtechnological change so that any country desiring to progress had to develop acapacity to respond, in a rational way, to international prices, costs andtechnical changes.
1.4 Recognizing this new configuration of economic and institutionalforces, developing countries, came to focus on the importance of stablemacroeconomic environment free from constricting trade, financial andindustrial regimes in order to facilitate growth of the private enterprise.
1.5 The principal objective is to study the domestic regulatoryapparatus in five Asian countries, India, Indonesia, Sri Lanka, thePlhilippines and Bangladesh, for a critical examination of how it has affected

- 2 -
the private industrial sector development. The selected countries are invarious stages of modifying their domestic regulatory policies. An attemptwill be made to synthesize their experiences in such a way that more generalpolicy conclusions can be drawn by policymakers as well as Bank staff foraccelerating private sector industrial development. The regulatory policieswill be discussed under five topics: (a) industrial licensing; (b) pricecontrol policies; (c)> labor market policies; (d) policies directed towardsforeign private investment; and (c) the promotional policies in regard toprivate sector development. There are other obstacles to the industrialdevelopment but they could not be discussed for want of relevant information.Left out also will be other major factors such as trade and financial sectorpolicies. These are important, but there are already Bank documents onfinancial restructuring and trade policy loans. Their linkages with domesticregulatory policies will be nevertheless referred to briefly in appropriatecontexts.
1.6 Section II will present a broad empirical framework in which privatesector development, its determinants, its links with economic growth and thelimits of governmental intervention to regulate the private sector, can beviewed in their interconnectedness. This provides a backdrop to thesubsequent country specific and inter-county experience in regard to theimplementation and consequences of domestic regulatory policies. Perspectivesprovided by this discussion on private sector development will hopefullydemonstrate that the need to orient economic policies to facilitate privateinvestment comes from the experiences of the developing countries over asufficiently long period and not from the subjective judgements or ideologicalpreferences. Section III describes the macroeconomic contexts of thecountries' covered to emphasize that in the absence of appropriate economicenvironment, deregulation by itself would not help to promote privateinvestment. Likewise, the key features of trade and financial policies willbe highlighted and the progress made in liberalization of those policies willbe referred to in so far as they have a bearing on domestic deregulation.
1.7 Section IV deals with domestic industrial regulatory policies ineach of the countries allowing a comparative perspective. Discussion willcenter, mainly, on how these regulations are implemented and theirconsequences for private industrial sector investment. Section V will focuson reform episodes and how they have impacted on the private industrialsector. In order to measure the impact, criteria such as concentrationratios, effective protection, domestic resource cost, total factor as well aslabor productivity are used, depending upon data availability. To the extentpossible, individual country studies, in appendices to the main text, will beused in comparing experiences at a micro level.
II. PRIVATE SECTOR DEVELOPMENT. ITS DETERMINANTS AND ROLE OFGOVERNMENTAL INTERVENTION - AN EMPIRICAL FRAMEWORK
2.1 With growth failure in a wide range of developing countries inrecent years and a striking success in only a few, convictions of theeconomists, policy makers and the multilateral lending institutions have grown

in favor of greater reliance on the market in the allocation and use ofresources. This has come to imply that a sustained higher rate of economicgrowth requires stable and traditional macroeconomic policies, liberalizationof goods and factor markets, greater flexibility in the operation of financialsystems and an enhanced role for the private sector in economic management1/In what follows, this empirical evidence on all possible obstacles will beanalyzed drawing on the existing body of research so as to bring in sharprelief of what determines the development of the private sector and thereforegrowth in the developing countries.
Private Investment and Economic Growth
2.2 In a recent study by Khan and Reinhart 2/ a simple growth model isf-ormulated for a cross-section sample of 24 developing countries i./ duringthe 1970s to estimate separately the effects on growth of public sector andprivate sector investment. Until recently, not much was known of theempirical relevance in the developing world of a bias toward the privatesector, except in regard to a positive relationship between trade andfinancial liberalization on the one hand and economic growth on the other.The latter relationships are normally perceived as operating through increasedprivate saving and investment. Now new research in the field of developmenteconomics has brought ample statistical evidence to show a strong and positiverelationship between the private sector activity, particularly private sectorinvestment, and economic growth. It has also by now become clear that public:Lnvestment, except when it is in infrastructure tends to crowd out private:Lnvestment. The sample chosen is so diverse that the conclusions based on itcan be taken as sufficiently valid for many Asian developing countries. Themodel yielded results strongly supporting direct policy measures and indirectones aimed at removing the impediments to private sector development.
2.3 First of all, the private investment plays a dominant role in growthprocess. This means that public investment of omnibus type covering.manufacturing activities has generally no direct effect on growth except inextremely underdeveloped economies and the direct effects of privateinvestment far outweigh those of the public sector investment. In most of the:24 developing countries which include Indonesia, Sri Lanka and NICs, with theIhighest average ratios of private to total investment also recorded the
*lJ Corbo V., Goldstein M and Khan M.S. (eds), Growth Oriented AdiustmentPrograms (Washington, DC. International Monetary Fund and the WorldBank, 1987)
2J Khan M.S. and Reinhart C., "Private Investment and Economic Growth indeveloping countries" World Development volume 18, Number 1.Januaxy. 1990.
3J The countries are Chile, Haiti, Argentina, Bolivia, Sri Lanka, Panama,Honduras, Trinidad and Tobago, Mexico, Venezuela, Barbados, Guatemala,Columbia, Turkey, Costa Rica, Dominican Republic, Indonesia, Ecuador,Thailand, Malaysia, Paraguay, Brazil, Singapore and South Korea.

- 4 -
highest average growth rates. Second result with even wider significance, isthat the productivity growth, arising from factors and technical change ishigher in respect of private investment than in public investment. Thecapital in private investment contributes to productivity, while capital'scontribution in public investment is negative and therefore offsets thecapital productivity in private investment. Judging by several criteria, beit contribution to growth or the increase in factor productivity, or outwardmarket-orientation of the production system or technical change, the privateinvestment has been shown empirically to score over the public investment indeveloping countries. These results generally conform to the experiences inthe industrial countries,/ indicating thereby that the growth process, doesnot vary significantly as between developed and developing countries.
2.4 While private sector investment is shown to be efficiency-superiorto public investment, there are certain exceptions. Public investment ininfrastructure, like roads, communication, etc., far from crowding outprivate investment and offsetting the private sector's contribution to growth,actually complements the private investment and consequently helps to enhancefactor productivity. Only public investment in manufacture competes withprivate investment for resources and markets. Since its contribution isnegative in this type of activity, overall growth is adversely affected.V.
Macroeconomic Determinants of Private Investment in DeveloRing Countries
2.5 The rate of private investment is determined by a host of factors.The regulatory industrial, trade and financial sector policies are only someof them. Unless other factors, in a way more fundamental, work in favor ofprivate sector development, modification of regulatory policies by itself,while helpful, will fail to deliver much. Hence, there may not be one to onerelationship between removal of regulatory impediments and private investmentgrowth. On the basis of the experiences of the industrial countries duringthe last four decades:, the macroeconomic determinants of private investmentare identified as (a) macroeconomic stability as represented by low inflationrate; (b) economic growth and per capita income level; (c) the level of realinterest rates; (d) the debt-service ratio or the magnitude of external debtin relation to GDP; and (e) the rate of public sector investment. For ahealthy private sector promotion, a stable macroeconomic environment is aprecondition; it covers a whole range of variables such as fiscal balance andexternal balance. High inflation rate which can be taken as a proxy formacroeconomic stability or lack of it adversely affects private investment byincreasing the riskinetss of longer-term investment projects, reducing theaverage maturity of commercial lending and distorting the information content
Chenery H., Robinson S., and Syrquin M., Industrialization and Growth. AComparative Studv (Washington, D.C., Oxford University Press for theWorld Bank), 1986.
2/ Blejer M. and Khan M.S. "Government Policy and Private Investment inDeveloping Countries "IMF Staff PaDers, Vol. 31, Number 2, June 1983.

5 -
of relative prices. For this reason the relationship between high domesticinflation and private investment is expected to be negative. The per capitaincome, on the other hand, is considered to be a positive function of privateinivestment because at higher level of incomes, more is saved and invested. Asfor the real interest rates, there should be a positive relationship betweenthe real deposit rates and private investment contrary to what was believedearlier on the basis of a neoclassical theory of investment. With high levelofE real interest rates, the private investors are encouraged to accumulatelarger money balances before undertaking investment projects because of thelimited access to credit and equity markets. Finally, the presence of a largeexternal debt burden is considered to adversely affect private investmentbecause large debt-service payments preempt savings required to financeinvestment, a high ratio of external debt to GDP reduces the incentive forinvestment i/ and difficulties in meeting debt-service obligations, tend toreduce the trade financing a country obtains. As regards the publicinvestment, it helps promote private investment, only if it is ininfrastructure as observed earlier. The evidence on these relationships hasbeen addressed both by observing the average values during the period of 1975-87 in twenty-three developing countries 2/ with above and below averageprivate investment rates and by rigorous econometric tests for the samecountries and for the same period.I/ There is support for the expectedrelationship between private investment and the five factors specified above.
Limits of Goverement Interventio
2.6 In addition to the economic determinants of private investment,there are other factors such as Government intervention which helps or hampersprivate sector development. The governments in developing countries haveaLdopted a wide array of instruments of intervention like industrial licensing,trade and price controls, labor market regulation etc., on the ostensibleground of promoting the private sector. Their generalized experiences overalmost four decades was unsavory. On the other hand, in a few countries, morestrikingly the newly industrialized countries in Asia (NICs), the emergingdlevelopment picture was totally different. The activist state, going beyondthe prescribed neutral regulatory regime of neoclassical vintage, has played acatalytic role in strengthening the crucial learning process and offsettingthe externalities, in addition to being a surrogate for missing capitalmnarkets as well documented by Westphal.2/ However, the charisma for
§/ Froot K., and Krugman P., Market Based Debt Reduction For DevelopingCountries: Principles and Prospects (Unpublished) Cambridge, Mass.:National Bureau of Economic Research, 1990.
Z/ The 23 countries are Argentina, Bolivia, Brazil, Chile, Columbia, CostaRica, Ecuador, Guatemala, India, Kenya, the Republic of Korea, Mexico,Pakistan, Peru, the Philippines, Singaporo, Sri Lanka, Thailand, Tunisia,Turkey, Uruguay, Venezuela and Zimbabwe.
l/ Greene J. and Villanueva D., *Private Investment In Developing Countries:An Empirical Analysis' IMF Staff Pagers, Vol. 38, Number 1, March 1991.
i/ Westphal L., "Industrial Policy in an Export-propelled Economy: Lessons

-6-
interventionist policies, overtly similar to those the NICs followed, but withtotally retarding and retrogressive consequences, has worn off. It is nowrealized that the earlier plea of development economists for interventionistregime was not enouglh, as one has to grapple with the issue of micro-management of the invested capital and the organizational and incentiveaspects of facilitating the learning process.
2.7 Focussing on the legitimate role of the instruments of interventionhelps to gain a perspective on why these instruments tend to overreachthemselves, losing sight of their assigned tasks in the process. Theseinstruments have conspicuously succeeded, when they have worked closely andcontinuously with the markets, and when the states remained alert using thesignals emanating from world markets, to maintain dynamic efficiency in firmsand to prevent thereby infant industries from turning into inefficientgeriatric lobbies.1Q/t However convinced one may be of the pervasiveness ofmarket failures in developing countries, one must recognize the vitaldisciplining function of competition in encouraging quick learning and costand quality consciousness.
2.8 Admittedly, the success of intervention schemes, where it occurredhas to be ascribed to certain historical, sociological and societal factors,which are specific to certain countries and cannot be easily replicatedelsewhere. In general, there has been a substantial evidence that failure ofGovernment, when it intervenes is larger in scale than the marketfailures.;lj The reasons for government failure are to be found in theself-centeredness of the agents of governments which administer the policies,the lack of benevolence of government as an institution and the high cost ofgovernment intervention. First, when economic interventions create somethingthat is to be allocated at less than its value by any kind of governmentprocess, resources will be invariably diverted to capture the rights to theitems of value. It generates rent-seeking and what is relevant is that theeconomic cost of many policies--minimum wages, legislation, import licensing,quantitative restrictions, credit rationing, etc.--are far greater when rent-seeking takes place than traditional welfare cost analyses would indicate. Insome instances, policies that might appear desirable to meet noneconomicobjectives, or even to correct "market failures," may result in a situationeven less satisfactory than that prevailing before the policy was put in play.
2.9 Second, whenever a government policy has clearly identifiablebeneficiaries and/or victims, those groups will tend to organize in support or
from South Korea's Experience". The Journal of Economic Perspectives,Vol. 4, Number 3, Summer, 1990.
1Q Bardhan P., "Symposium on the State and Economic Development". TheJournal of Economic PersRectives, Vol. 4, Number 3, Summer, 1990.
1J/ This discussion draws on Anne Krueger's interesting contribution to thesymposium on "The State and Economic Development" that appeared in "TheJournal of EconoMic Literature, Vol. 4, Number 3, Summer, 1990."

opposition to the policies and then lobby for increasing the value of the gainor reducing the value of the losses from those policies. An initial politicalequilibrium may not be a long term equilibrium, as newly formed pressure orinterest groups work increasingly for favorable, or less favorable treatment.For example, once a system of protection against imports is in place,protected producers will generally lobby for higher tariffs and/a lowerquotas, using contrasts with other levels of protection and other arguments.Likewise, initially unprotected groups will begin lobbying for protection, onthe ground, that this case is at least as strong as that of already protectedinterest. More generally, there will be a tendency for increasingproliferation of categories and of policy instruments as various groups assertconflicting and competing claims and this proliferation should be counted as acost of the original policy.
2.10 The group normally administering the policies comes into existence,if no other unit was in existence or if it does, it is expanded with newpowers. Either way, a part of the government usually becomes an advocate formaintaining functions involved and in many cases, extending them. Thoseadministering the policies necessarily believe that they are doing somethingimportant, and also know that discontinuance of the function would result in aloss of jobs for some and of bureaucratic power for others.12/
2.11 Third, it is necessary to differentiate between the interests ofdifferent groups and institutions within the Government. Those organizationsof the Government which are preoccupied with spending will spawn programs andpolicies for access to more funds, while the controlling ministries such asfinance ministries would try to curb them. In this respect ideology becomingan important determinant of what is and what is not generally acceptable.Obviously in democratic societies, policymakers within governments haveautonomy only in so far as the voters acquiesce in their activities, whetherthat permission is of out of ignorance or out of sanction for their activity.InI non democratic regimes, the question of such permission does not arise; thepolicy making bureaucracy is the final arbiter.
2.12 Apart from these inadequacies of Government in managing marketfailure situations, there are certain deficiencies endemic to the regulatorymechanism itself. First there are the sources of misinformation - informationasymmetrics between regulations and those affected by regulations, whetherproducer or consumers; regulatory rigidities that grow out of the tendency forproducers and consumers to develop property rights in particular regulatory
12V Political scientists call it an "iron triangleu of bureaucrats,politicians and voters. The bureaucrats have interest in extending thisscope of their activities, making them visible to the voters; politiciansseek re-election and thus support or at least do not oppose bureaucraticactivities supporting services to the constituents. Voters are madecognizant of the services by bureaucrats and therefore support both thebureaucrats and the politicians (see for application of this concept toIndia. J. Bhagwati, "Poverty and Public Policy", World DeveloDment, May1988).

- 8 -
outcomes; the unintended consequences of what can be called "regulatory firefighting" reacting to unanticipated side effects of previous regulatoryactions and the pursuit of self-interest by those responsible for regulations.The regulatory asymmetry arises because producers have a far greater knowledgeof average and marginal costs, changes in technological conditions and oftheir own degree of managerial inadequacies than do the regulators. Bymanipulating information-access to their advantage, they are able to distortthe regulatory process. The rigidity stems from the fact that the regulatoryapparatus cannot ad'just in response with speed, when economic conditionschange and then involves the economic system in losses. The third type ofregulatory misdirection and regulatory fire-fighting arises because regulatorysystem is often constructed on the premise that regulated entities and theircustomers and competitors will respond passively to regulations, whereasprofit maximizing behavior generally requires that they invest resources tomitigate regulatory impact. This leads to a creeping regulation, a situationin which more and more complex, costly and far-reaching regulations becomeunavoidable to achieve the original regulatory goal.
2.13 The question therefore is whether the regulatory mechanism can bejettisoned altogether for the many errors of commission or there is somepractical way for sc operating it as to minimize its deleterious featuresaffecting progress of the private sector. Though doing away with regulatorypolicy is the first best policy, it is rarely feasible in the world of realpolitick. Therefore, certain optimal rules of operating regulatory systemwithout its misdirection can be conceived, both on the basis of practicalnecessity and economic efficiency. First of all, any policy affectingallocation of resources, and regulation of private economic activity, needs tobe pursued if and only if there is a specified set of procedures or criteriafor deciding what fits within the defined scope of the enunciated economicpolicies and also an administrative apparatus for implementing that policy.It would help to make a judgement as to the administrative cost andfeasibility of the activity as well as the likelihood that political pressureswill quickly alter the initial chosen process. Second, even when there is astrong presumption in favor of government intervention and conditions favoringits effectiveness, it is imperative to limit it to minimum necessary scalebecause once the intervention enters the scene, it develops a life of its own,diverting some scarce management skills away from where they have greatercomparative advantage. Third, from amongst the available alternativeregulatory sets, it is necessary to go in for one which will provide the leastscope for rent-seeking. This may imply that policies directly controllingprivate economic activity are likely to be less efficacious in terms ofachieving their objectives than policies that offer incentives for individualsto embark on activities which are considered desirable. In other words,intervention policieis aiming at strengthening markets for goods and factors,through incentives are better than control laded intervention policies.Finally, a choice of regulatory policy involving lower information cost andtransparency is a preferred alternative. When the costs of a policy areobscure, special interests in the private sector and government have a greateropportunity to use those policies for their own advantage without incurringthe disapproval of voters and the politicians.

9-
2.14 The broad conclusion that emerges from the foregoing is that whilemarket failure is a pervasive phenomenon in a large number of developingcoamtries, a strong government intervention is not an answer to remove themarket failure. As discussed earlier in this section, economic growth isfaster under conditions of private initiative because productivity growthcomes not only from capital but also technical change and exports. Itsfundamental determinants among others are--low inflation rates, positive realinterest rates, high per capita increase and low foreign debt service ratio.This means that any regulatory policy, if at all deemed essential andunavoidable should be such, in form, substance and direction that thesefundamental determinants of private investment are not stifled. In otherwords, the regulatory policies should be allowed to draw sustenance from theefificiency laden economic determinants, the competitive forces spurring moreinnovations and cost-reducing measures. The question therefore is not whethermarket failure should or should not be met by government intervention; ratherthe issue is how to formulate essential regulatory policies which seek marketguLdance in transmitting their impact on private investment in developingcountries. It is the later which will be discussed in the following sectionsin the light of the empirical and analytical insights presented in thissection.

-10 -
III. MACROECONOMIC ENVIRONMENT AND TRADE AND FINANCIAL REFORM POLICIES
3.1 In this section, a beginning will be made with discussion ofmacroeconomic variables affecting investment and growth to be followed by areference to the trade and financial sector policies in order to spotlighttheir linkages with the domestic regulatory policies - the main focus of thispaper. A comprehension of the interconnectedness of various determinants ofthe private investment and financial sector and trade policies lends aperspective for a realistic assessment of the impact of changes in domesticregulatory policies on the private sector development.
Macroeconomic Environment
3.2 Macroeconomic picture of the five countries since 1970s is presentedin Figures 1-14a. In terms of macroeconomic situation, Indonesia has beenable to maintain a better record since 1980, which contributed to the speed ofthe reforms of its trade, financial and industrial regulatory policies.India, after a long period of stable macroeconomic environment ran intoserious imbalances in the later half of 1980s - precisely the period when itembarked on industrial deregulation. The Philippines, Sri Lanka, Bangladeshwent through undulating macroeconomic situations during the 1980s, which,while interfering with their economic reform policies, did not scupper them.In fact, despite the adverse macroeconomic situation, these countriescontinued their reforms with varying degree of success.
3.3 India was perhaps the first among developing countries whichembarked on economic development as a deliberate policy in the post-secondWorld War period. 'Yet India's secular growth rate, when seen in relation togrowth rates in some of the developing countries, has been modest at best, anddisappointing at worst. Thus the average real growth rate was only 2.9%during 1961-70, rose to 3.5% during the 1970s: It was only during 1980s whensomewhat liberal trade, financial and regulatory regimes were ushered in thatthe growth rate picked up to the highest decade-wise average of 5.7%, Indiaever experienced. Gross domestic investment as a ratio of GDP reached thehighest level of 23.9% during a decade of 1980s. However, the productivity ofinvestment remained low throughout. The marginal capital/output ratio,inverse measure of investment productivity consistently decreased from 5.40 in1970s to 4.45 in the 1980s. Alongside with rising investment, domestic savingalso rose impressively until mid 1980s, when it reached 23% of GDP and thoughit declined somewhat--mainly due to dissaving by Government sector, remainedhigh by international standards.
3.4 Macroeconomic stability was a characteristic of the Indian economyuntil the early part: of the 1980s, despite large fiscal and external accountdeficits. However, as fiscal deficit began to surge up during the 1980s, the

- 11 -
Figure 1Real GDP Growth Rate
(% per annum)
9.00- / AVG. 19708s
10.0 / Ave.l1980s
8 . 0 -- _ _ _ _ _ _ _ _ _ _ _ _ _ _ _ _ _ __7_ _ __0_ _ _ _ _ _ _ _ _
500 / :-i r -7-
8.00 ~ ~ ~ 3.0
2.00[- A ; AL
4.00~~~~.0
india Indonesia SriDLanka Philippines Bangladesh
| t9B t986 1987 t98 Bangladesh-2.00)
-400
46.00

- 12 -
Figure 2Inflation Growth Rate
(%/ per annum)
25.00 | Ave 1970s
El Ave. 1960
20.00-
15.00-
India Indonesia Sri Lanka Philippines hangladeh
2soT25&00
l irda
&OD -~~~~~~~~~~~~~~~~ rKosl
gl P idp99esh
1985 1985 1987 1988 198 1990

- 13 -
Figure 3Gross Domestic Investment/GDP
(% per annum)
. * ~~~~~~~~~~~~~Ave. 1970s30.00-
250 l Z- AV 90
20.00-
dr.00-
30.00-
25.00
20.00UIna
India Indonesia SriOLanka Philippines Bangladesh
10.00Elanldh
:5.00 -
_ - [D~~~~~~~~~~~~~~~~~~indo"
0.00
isas isee 1957 19ee 19ee 1990

- 14 -
Figure 4Gross Domestic Saving/GDP
(% per annum)
25 l [ * ~~~~~~~~~~~~Ave. 1970s
2500 ~ ~ ~ 2
/ _ ^ g ~~~~~~~~~~EAve. 1980s
2020.
_ ii ;2 2 _;.<§ei * X _ ,'S,S,i 27 _,2Sri Lank
15- / .. il ,; S
10.00 U Pilippine
India Indonesia SrB Lanka Philsppines Bangladesh
25.00
20.00
1985 986 1987 1988 19 10India
::~~~~~~~~~~~~~~~~~~~~~~E Bangladesh L1985 1986 1987 1988 1989 1990

- 15 -
Figure 5Public Investment/GDP vs Public Savings/GDP
Annual Trend 1985-90
India Indonesia
14C] 1T 12.00112.0C1 , .........
12.00 - -. ~ ...... - .. 0
1CS ......._ Public invs'tment | Pubic liwmM
2.0CI t
4.0CIr 4.00/
2.0CI + .00
'185 1986 1987 1986 1989 1990 1965 1886 1987 1988 1989 19.0
Sri Lanka
Philippines14.00
.X8 ' '-' " ' ' " ' "3.5 -10.0(i
..... .. - - ~~~~~~~3-
ILCC 2.0-
-C -Public Investment6.88
.... pub88IflsSmWn4.00 | ~ Public Savings 1.5
I Publi Savilip2.00 0.5 -
O.C -_ I I I 0II 1986 1887 1388 1889 1990 -O5iP 1 1887 19ii8 19i8 10o.2.06
-l
Bangladesh
8.00
7.00 -..
8.00 .............
5.005.00 ....... ~~~~P.blic I.v.rment
4.00
3.00
2.00
1.00
0.00
1805 19i8 19t7 188 83i 1989 1880

- 16 -
Figure 6Private Investment/GDP vs Private Savings/GDP
Annual Trend 1985-90
mIns h,diisI
'-"""''''''''''''''''''''''''' 1' =_
mSG-M
aze 1 8 ttl IM mmtte t
Sr Lanka
ue~~~~~~~~~ ,
................
Blnlgad"h
7Jlt
................ .. ............... ..............
Sm
am
off IM "a
LW--
see _.-----.-.- S
IW as i im i G
eiee I ~~anla ldl I
7W " t s t Z

-17-
Figure 7Fiscal Deficit/GDP
b.i ~ ~ ~ ~ d L.ad M~~~~~UWh.. U,ghd ~ ~ BdLMI
3- lm l00 iun os
11 \ X * 1 - lilull tRlil9 1"a"adw
_ 2- _ -
.7hid.
4~~~~~~~~~~~~~~~~~~~~~~~~~~-- - - Srl LanIa
e~ ~ - - --tIIpm
*4-_

- 18 -
Figure 8Domestic Financing/GDP vs Foreign Financing/GDP
Annual Trend 1985-90
Inodiia
.~~~~~~~~~~~~~~~~~~~~~~~~~.
SL Ins I I ;
Sri LankaPlilippines
LOD~~~L
150 1*-~~~~~~~~~~~~~~~~~~~~~~~o
0.00 1X0
insi 1_. in? 1as ins 1So 1 131 1US ¶i5
7
S
4-
1................................................-1~~1

- 19 -
Figure 9Balance of Payments
Current AccounVGDP
India Indonsa Sri Larkc Ptillnes Banglah
4
2
19 85 19e6 \1e7 -190 1989 199002 _._ -__\- -- doea- - - \bdonsia
-2- - --- - SriLanka
PhU-p10-
-4

- 20 -
Figure 10Exports/GDP vs Imports/GDP
Annual Trend 1985-90
Indbe ndon"la
to aim
mm
LU _____ :1~~~~~~~~~~~~~~~~~~~~~~~~~~~..................
~~~~~Sl lnk Ip9I o llmm
am O~~~~~~~~~~~mm
Sri Llanka Phpp
am
mm
oloo
5L1 .
aal . | | S - , | .67 U
ne I en ' 'X
am~~~~ nbz
1 - ... . . . . . . . . . . . . . . . . . . . . .
4M-amD
1an
rto 1.Mi

a a
°-2 o WS5 t I - :/ 2 * P -o

- 22 -
Figure 12-aNominal Exchange Rate
Annual Trend 1985-90
aco-.
ZLX - _
_ - hdl (R.p..US$)
,dn__ _- - dol. (R.pI.JUS$) 10D
2D-0_ - - - S, Lnnk. (R.p..US$)
_-_ _ - - philIppIn. (P.a.USS)
- - B .nglB.dh (T.kAUS$)
50.00
1IX -
Nx
im
Figure 12-b
12D - -~ ~ ~ ~ ~ ~ ~ ~ ~ ~ ~ ~ ~ ~~~~~~~~~~~~~~~ 1l091
TReal Effective Exchange Rate (1980=100)Annual Trend 1985-90
00 - - - Sri Lanka
D ~ ~ ~ ~ - - -+ - - -
10
im Igo1? 10 19 19
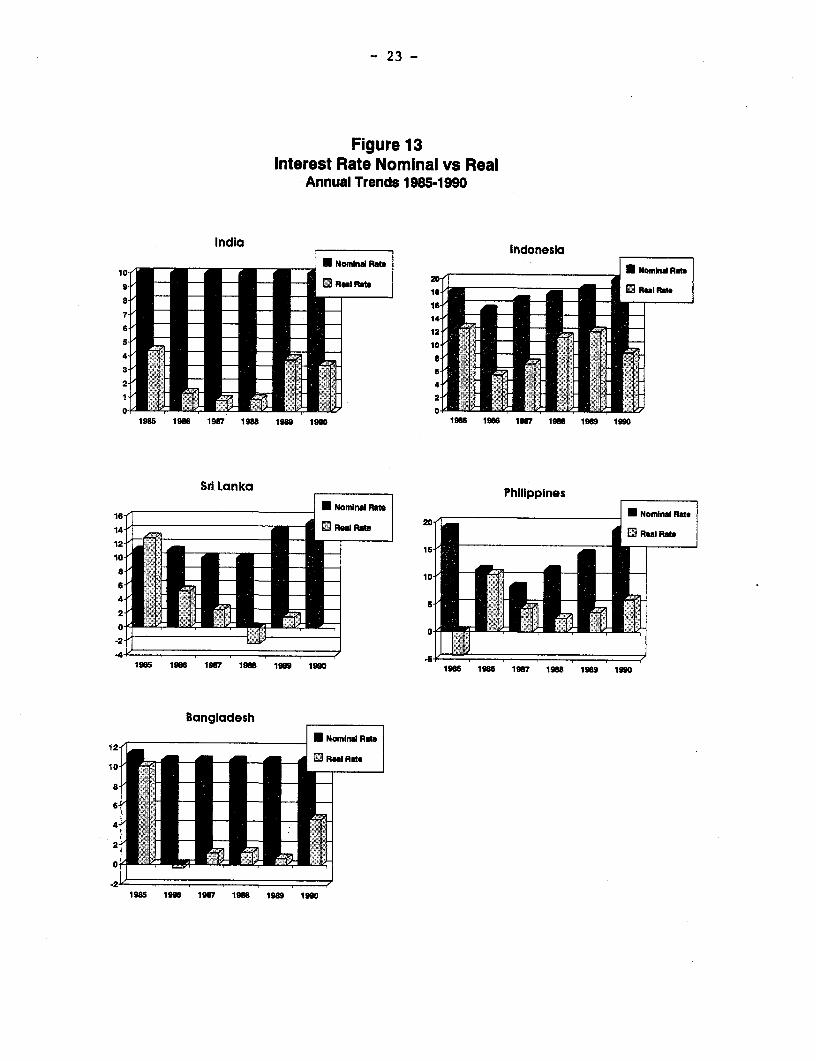
- 23 -
Figure 13Interest Rate Nominal vs Real
Annual Trends 1985-1990
India Indonesia
10 I U Nomhin R U Nomhal Rit8 _ 3 R 1B- i tul Rate
8-1 m~~~~-
8.e tE6 E97 E EB18919 191186 1- s 1#8119U
7. E 141 12-
''I~~~~~~~~~~~~~~~~~~O - I' -i
5- 10 m4
2
1985 1996 1967 19# 1989 1990 1965 1966 I 1997 ins isi
SrBankladeshppne
1985 1986 1967 F1988N1989a19R0

- 24 -
Figure 14-aM1/GDP
Annual Trends 1985-1990
14-8 India
12-, lE lndonea
10-1 ~~~~~~~~~~~~~*Sri Lanka
El Philippines
EBangladesh
1985 11988 1987 1988 1989 1990
Figure 14-bM3/GDP
Annual Trends 1985-1990
* India
l ]Indonesia
30-, ~ ~ ~ ~ ~ ~ ~ ~ ~ ~~~~*Sri Lanka
EPhilippines
Bangladesh
1985 1986 1987 1988 1989 1990

- 25 -
macroeconomic stability was increasingly eroded.ly/ The main factors foren'larged fiscal deficit were the failure of a large and proliferating publicsector to generate surpluses and a sharp increase in subsidies for fertilizer,food and interest payments following ballooning of internal and external debt.This led to a sharp deterioration in the balance of payments position--the gapincreased from a mere 0.4X of GDP to 2.5X between decades of 1960s and 1980s.The deterioration in the external accounts impelled recourse to foreignborrowing on commercial terms. As a result, both the external debt to GDP asweLl as the debt service ratio rebounded, creating uncertainty in the privatesector about the availability of resources for new investment. Towards theend of 1990, with the political disturbance in the Middle East, the externalsituation further worsened, with a rapid decline in remittances as well as therise in oil prices, forcing India to borrow from the IMF. The Governmentresponse was in terms of resiling from the earlier liberalized trade policy,through tightening import controls both direct and indirect. Thus allmacroeconomic indicators except real interest rates operated in a mannerdetrimental to the healthy and vigorous growth of the private sector.
3.5 Indonesian economy too like India's underwent macroeconomicinstability during the 1980s when it embarked on reform, in contrast to asteady growth with price stability during the 1980s. The main factors wereexogenous in nature which were a collapse of oil prices, worldwide recession,andl depreciation of the U.S. dollar. Oil and LNG exports which accounted for80X of total merchandise exports in 1981/82 plummeted. Primarily due to oilprice decline, the terms of trade turned adverse between 1981/82 and 1985/86by 38X. These external shocks forced the Indonesian authorities to go in fora major adjustment effort not only to restores it to its earlier macroeconomicbalance, but also to reorient its entire economic structure in order to raisemore non-oil exports to finance its development.
3.6 Indonesia's adjustment program initiated in 1983 was intensified in1986 when oil prices collapsed. Unlike India, however, Indonesia combinedaustere macroeconomic policies with economic reforms. The objectives ofdemand restraint and structural change both had been served by theimplementation of a number of strong fiscal measures designed to restrainexpenditure and to mobilize public resources and ushering in of a phasedprogram of reforms in various areas - trade, financial sector and industrialregulatory system designed to improve the incentive framework.
3.7 The PhiliDpines experienced macroeconomic imbalances intermittentlysince the middle of 1970s, which worsened in 1980s. The Philippines wasgenerally perceived as a success story during the 1970s, but the seeds of the19E80s crisis were already being planted. GNP growth rate was over 6X in realterms throughout the decade, but growth in manufacturing occurred largely inhighly protected sectors. Export growth rate was also quite high, but theincentive system was not conducive to a broad-based export expansion. The
13/ Burter W. and Palel U. "Debt, Deficits and Inflation: An Application tothe Public Finance of India" (mimeograph) Yale University, New Haven,1991.

- 26 -
peso was adjusted periodically, but the structure of tariffs, importrestrictions, and export taxes allowed the peso to be over-valued. Investmentrate was over 20% of GNP, but the efficiency of investment was low.
3.8 Deterioration in the terms of trade and the rising interest rates inthe early 1980s, brought the underlying structural weakness of the economyinto the open. The balance of payments was in deficit, which by 1982 wasequivalent to 7.6% of GDP. As most of the deficit was financed by foreignborrowing, total external debt increased to reach by end of 1982, $24.2billion. The situation was aggravated by widening fiscal deficit.
3.9 The Philippines started a stabilization process in late 1983 tobring the short run external imbalances under control but soon after themacroeconomic instability reappeared. The tight monetary policy together withforeign exchange and import controls somewhat stabilized the economy. By1986-87, the economy recovered across a broad front: GDP and investment grewstrongly; and inflation was kept at single digit level. The current accountdeficit, the fiscal deficit and the external debt were reduced relative totheir earlier levels. Macroeconomic management was characterized by a prudentfiscal stance and conservative monetary policy, which kept inflation at anaverage of 4.5% over the three years through 1988. The relative macroeconomicstability was disturbed by the end of 1988. The consolidated fiscal deficitrose from 3.1% of GDP in 1988 to 4% in 1989; in the first half of 1990 it wasrunning at almost 5% of GDP. The current account deficit rose from 1% of GDPin 1988 to 3.3% in 1989 to almost 5% of GDP in 1990 and inflation from 8.8% in1988 to around 13% Ln the same period. Among other factors that affectedrecent performance was the sharp rise in domestic debt from around 19% of GDPin 1985 to around 25% in 1989. In 1989 and 1990 the domestic debt increasedprimarily because of rising domestic interest rates, which were partlyresponsible for the real exchange rate appreciation that has occurred sincethe end of 1988, a development that exacerbated the current account deficit.After two years of 'relatively comfortable levels (averaging 1.2% of GDP), theexternal deficit almost tripled, reaching 6.5% of GDP in 1990. Theauthorities undertook a reform program which covered tax policy privatization,organization of government enterprise, and government owned financialinstitutions. However, the recurring macroeconomic instability did not permiteconomic reforms to take roots.
3.10 The macroeconomic environment of Sri Lank was influenced by theinterventionist poliLcies since 1950s as in the case of India and Indonesia,but the extent of imbalance was greater in Sri Lanka as the growth of theeconomy was much slower than in India and Indonesia. The interventionistpolicies, including an industrial policy based on import substitution andstate operation of industrial enterprises, led to country's vulnerability toshifts in terms of trade and balance of payments crises became a chronicfeature during the 1970s. GDP growth rates in the 1970s were among the lowestsince Independence. The cost of public investment and the social programs ledto large fiscal deficits.
3.11 The new government elected in 1977 reversed the policy of publicsector dominance and control in the economy, adopting a broad-based program ofliberalization to limit the role of the state, increase that of the private

- 27 -
sector and, more generally, to expand the role of market forces in theallocation of resources. The rupee was devalued by approximately 30%; thedual exchange rate system was abolished; import quotas were replaced by'tariffs; exchange controls were eased; most price controls were lifted; andfreely fluctuating interest rates were permitted to determine the allocationof most types of savings and credit. As a result of these measures, andfollow-up actions taken over succeeding years, there was a period ofsignificant economic recovery. However, the rapid expansion of publicinvestment contributed to a growth in public sector deficit from 7% - 8% in1976-77 to over 25% in 1980;, the balance of payments deficit in consequencegrew rapidly. Despite the insupportable levels of balance of payment andfiscal deficits, the government was able to postpone politically difficultadjustment decisions because foreign creditors and development agenciescontirnued to support the country in response to its continued pursuit ofliberalization policies. By 1986, the access to foreign commercial sources ofcredit, was gone. The deficit on current account reached 9.5% of GDP, grossofficial reserves were equal to less than two months requirements, and thedebt service ratio, at 26% of exports, was at a record high.
3.12 These macroeconomic developments slowed down the pace of reformsbegun in 1977. The authorities did not succeed in fully removing the complexarray of legal and regulatory requirements that had evolved during the twentyyears of economic domination by the public sector nor in finding an efficientbalance between private and public interests in the economy. The resurgenceof economic problems in the early 1980s was because liberalization failed toreduce the size of the public sector, to increase the efficiency of publicsector expenditure programs, and to re-orient industry sufficiently towardexport markets. There was consequently a rise in fiscal deficit and thebalance of payments deficit which was primarily financed with commercialborrowing. The macroeconomic imbalances were also due to the outbreak ofethnic conflict which eroded the government's ability to take difficultmeasures to deal with the economic crisis.
3.13 Towards the end of 1986, the Government articulated a medium-termPolicy Framework Paper (PEP) at stabilization of the economy and addressed keyconstraints to growth. This program was supported by the IMF's StructuralAdjustment Facility (SAF). Main features of the Program included both short-term stabilization and medium-term adjustment measures: revival of growth of4-5 percent per annum, reduction of fiscal deficit to 9 percent of GDP by1990, and reduction of the external account deficit of 6 percent of GDP by1990; scaling down and restructuring of public expenditure, industrial sectorreform aimed at increasing the export orientation of the manufacturing sectorand improvement of the public administration. However, there was a seriousslippages in implementation of the stabilization program because of the ethnicstrife, electoral politics and the weakness of political will to face hardchoices. This impelled the Government to make a serious effort to strengthenstalbilization effort again with the support of the IMF and IDA.
3.14 The economy of Bangladesh had been vulnerable right from thebeginning of its existence in 1971. The tragic historical legacy of neglecttogether with excessive population pressure in relation to the land mass andits perpetual vulnerability to frequent external shock like flood, adverse

- 28 -
changes in terms of trade. etc. made a skillful management of its economy asine aua non for progress towards growth and stability. The average GDPgrowth rate during the 1970s was 4.8 percent which remained thereabout duringthe 1980s. The average ratio of inflation was much higher in 1970s than in1980s when it declined to 8.8 percent from 13.4 percent. The average fiscaldeficit had been very high at 6.9 percent of GDP during the 1970s--in factincreased to 7.8 percent in the 1980s; and it was financed mostly by foreignsavings as a result: of which its external debt/GDP ratio rebound to 53.3percent in 1989 frcom 41.6 percent in 1988. In tune with fiscal deficit, thebalance of payment too was in red with an average deficit of 7.8 percent ofGDP during the 1980s and showed no signs of diminishing except in two years1987-1988. In this; respect Bangladesh economy was similar to the economies ofIndia, the Philippines and Sri Lanka in 1980s.
3.15 During tlhe early half of the eighties, the authorities initiated astabilization program in response to destabilizing effect of second oil pricerise of 1979-80. While initial impact of this policy was favorable ininducing rapid growth, a succession of disastrous flood and cyclones held downthe growth prospects. The crisis management interfered with the medium-termreform process and in consequence the GDP growth rate averaged slightly below3 percent during 1988-89 compared to 5 percent during 1981-86. The short-termdemand management seriously slipped in 1990. The fiscal and monetarysituation weakened significantly during 1990.
3.16 This propelled the Government to initiate early 1990 a short-termprogram in order to stabilize the balance of payments and the budget for theremainder of FY1990. Government imposed 50 percent deposit requirements onopening letters of credit for all imports and tightened the availability ofbank credit for financing them. The exchange rate of Taka was depreciated innominal terms by 5 percent which signalled the resumption of a flexibleexchange rate regime. The fiscal position was sought to be stabilized byrunning additional taxation to the tune of TK 2 billion for FY1990 and thecurrent expenditure was restricted to the original budget of FY1990. Thesuccess of the Government's short-term demand management in 1990 paved the wayfor the agreement with IMF in regard to Enhanced Structural AdjustmentFacility in 1991.
Trade Policy Reforms
3.17 Of the five countries, Indonesia, the Philippines and Sri Lankaadopted more radica'L trade policy reforms during the 1980s. Bangladesh madesignificant progress in this area in mid-1980s, while Indian trade reformefforts were modest until 1991. Since then India made significant moves inthis area. On the iwhole, all the five countries are expected to relax traderegime on a larger scale in 1990s than in 1980s.
3.18 In India, trade regime and the associated exchange controls weremotivated from the beginning by the considerations of self-reliance. Thismeant in practice the protection of domestic industry, old and new, fromforeign competition which was achieved by licensing imports, imposition ofhigh tariffs on imported goods and other quantitative restrictions andstringent foreign exchange controls, and an overvalued exchange rate. As

- 29 -
Bhagwati and Srinivasan have forcefully argued, "... every item of indigenousproduction, no matter how much its cost of production exceeded the landedc.i.f. price, was automatically shielded from competition through imports,indeed the once being put on the buyer to show conclusively that he could notprocure the item from indigenous producers." Until 1966 the exchange rate wasovervalued, and though its adverse impact was somewhat mitigated by variousimport entitlement schemes under which the exporters could make up the losseson exports through profits on sales of imported raw materials, the exportcompetitiveness was not transparent because of the complexity of the exportincentive schemes.
3.19 It was not as if the counterproductive nature of this kind of traderegime was not recognized by the Government. Several government committeesunderscored time and again how the efficiency and productivity of Indianindustry have been impaired by the trade regime. However, theirrecommendations did not get translated into concrete action, or if they did,the resulting policy became a patch work, with some liberalization within anoverall framework of a regulated trade policy. Since 1985, OGL list wasexlpanded and a more benign view of import controls was taken; administrationof controls was somewhat liberalized. The level and scope of exportincentives were increased. The exchange rate policy, too, for the first time,was flexibly administered, allowing steady depreciation of the real exchangerate through continuously downward adjustment in the nominal exchange rate.With all these adjustments in trade and exchange rate policies, the changesmade in trade regime were relatively of limited significance in making Indianmanufacturing sector internationally competitive. The basic system, itsadministrative apparatus and associated distortions and economic costs remainintact. Perhaps most fundamentally, the concept of a neutral trade regimewh:Lch would allow India to reap the economic benefits of specialization ofproduction in line with comparative advantage, is almost missing from publicdiscussions of trade policy issues as is acceptance of the idea of importcompetition for domestic industries." With a newly elected Government comingto the centre in June 1991, there was a major overhauling of economicpolicies. As a part of this, trade policy was modified in a right directionbut. not with the punch warranted by the current economic situation. The mainchanges were the following: (a) abolition of cash compensatory support (suchas export subsidies) which had varied between 5 and 20 percent and averagedabout 6 percent of f.o.b. export value; (b) replacement of licenses (REP) forExiLmp with a uniform replenishment rate of 30 percent of export value comparedwith a wide range of rates (considerably lower on average) previously. Eximpscrip is freely tradeable and completely fungible across eligible products; itwill be the only vehicle for importing most of the intermediate goods andcomponents; (c) abolition of several categories of discretionary licensespreviously used for importing intermediate goods and components which are nowimportable using Eximp scrip. It is the intention of the authorities toeliminate most licenses for capital goods and raw material within three years,abolish canalization for all but essential goods, and move towards rupeeconvertibility and trade account in three to five years. However, despitehigh effective and nominal tariffs, these broadly remain unchanged in view ofthei strained budgetary position, though the Government announced itsconmitment to rationalize tariffs, beginning from next year.

- 30 -
3.20 As the Indonesian economy began to regain macroeconomic balancethrough a series of adjustment policies during the 1980s, the authoritiesinitiated major trade reforms to accelerate the structural change. In 1985,the tariff ceiling was lowered from 225X to 601, and the number of tariffrates was reduced from 25 to 11. The reforms also raised the percentage ofitems with tariffs below 30%, from 591 to 821. Although this resulted in anunequivocal improvement in trade regime, its effect was significantly assuagedby the simultaneous proliferation of restrictive import licenses. In order toreinforce trade reform, the authorities followed a depreciating exchange ratepolicy between 1983 and 1986 and enhanced its flexibility through a moreactively managed float. A major reform of the customs, ports and shippingoperation was effected in 1985.
3.21 Following the sharp drop in oil prices in 1986, the IndonesianGovernment embarked upon a more fundamental series of reforms designed tostimulate non-oil exports and increase economic efficiency. In 1986, thegovernment created a duty exemption and drawback facility to enable exportersto access imported inputs at world prices. The significance of this facilitywent beyond allowing imports to be bought in duty free as it also permittedexporters to bypass import license restrictions. In addition, a duty drawbackfacility was created to enable individual exporters to reclaim import duties.
3.22 In October 1986, following the 311 devaluation in September, a firstmajor step was taken in directly removing import policy-related distortions byannouncing the removal of 197 items from the restricted goods list. This wasa clear indication that the authorities would move faster away from a traderegime dependent mainly on NTRs to one based solely on tariffs. Since 1986,there have been three further policy packages which focused primarily oneliminating the incidence of NTRs in manufacturing, where both the overalllevel and the variability in protection was highest. In addition, in 1989,the need to obtain gm export license except on those goods under specialexport regulations was abolished, thereby opening export trade eto all holders of a business license.
3.23 The trade reform measures in the PhiligRines initiated in 1981marked a fundamental shift from the protective policies of the previous threedecades. Unlike efforts before, which were aimed at redressing balance ofpayment disequilibria and providing partial support to exports, recent tradereforms aimed at correcting in a more comprehensive manner the adverseincentive effects of the trade regime by reducing the level and variability ofprotection. These trade reforms accordingly included actions in all key areasaffecting the protection regime: tariffs, quantitative import restrictions,the protective elements of the tax system, and exemptions to importsubstituting industries. The trade reform had two components: importliberalization and tariff reduction. The latter component dominated in thepre-1983 period, while the former has been important since 1986. The tariffreduction was more in regard to agriculture and manufacturing than mining.Since 1982, the maximum tariff rates were reduced from 100 percent to 50percent; effective protection rates were also narrowed to a range of 10-80Xand a degree of tariff escalation from low tariff on raw material inputs tomuch higher tariffs on finished products was reduced. During the period 1986-89, nominal tariffs remained virtually unchanged but there had been a slight

- 31 -
resduction in tariff rate dispersion. Effective' rates of protection declinedby about 7 percentage points overall and their dispersion also decreased.Some nominal tariffs remained virtually unchanged. The reduction in effectiveprotection was mainly due to the liberalization in import restriction. Thenumber of regulated imports in terms of tariff line items declined from 1924to 447 by August 1990. The regulated imports declined from 34.1Z to 7.9X.
3.24 Sri Lanka's experience has been more akin to that of India ratherthan to that of Indonesia and the Philippines. Trade liberalizationer was insmall steps and did not reach the level of Indonesia. Some attempts were madeto liberalize the controls on imports and encourage exports by the newGovernment in 1965. The rupee was devalued in 1967; a Bonus Voucher Schemewas introduced whereby exporters received the equivalent of 20% of the valueoE their exports in vouchers which entitled them to foreign exchange toimnports machinery, spares, accessories, and raw materials. Foreign ExchangeEntitlement Certificates (FEEC) were introduced in 1968 to encouragediversification of exports. These attempts at liberalization came to an endin 1970.
3.25 The most dramatic liberalization measures were introduced by the newgovernment in November, 1977. They included: Elimination of quotas and theirreplacement with tariffs; elimination of the dual exchange rate system; andeasing of exchange controls. Import licensing requirements were waived formost products, and the system effectively dismantled, although, as of October11986, some 281 products still required import licenses. In the area ofexchange control and administration, commercial banks were authorized to dealin foreign exchange and with non-residents. In the following years, othermeasures were introduced to reinforce the changes signalled in the initialround of adjustment. Between 1978 and 1984, the tariff structure was changedto eliminate negative effective protection rates, and in 1985 the last importban (on textiles) was removed. New impetus was given to the drive to make theindustrial sector more internationally competitive in 1988. The maximumtariff and effective protection rates as well as the degree of theirdispersion were reduced. (Maximum ERP from 100Z to 60Z). All importlicensing requirements were eliminated except for those based on health andsecurity considerations. In the most recent phase of trade policy reforms,aimed at export-oriented industries, the Government accelerated the pace ofrestructuring its trade policies. The Industrial Strategy of 1987 announcedthe reduction of the 19 tariff bands to four, ranging from 5 percent to 50percent to come into effect in 1992. The rupee was devalued in late 1989 andan attempt was made to simplify regulatory procedures.
3.26 Since its inception in 1971 Banaladesh like all other Asiancountries followed a policy of restricting access to imports as a means ofrationing scarce foreign exchange and protecting vulnerable local industriesfrom import competition. Trade liberalization process commenced in the earlypart of 1980s. Major reforms in the import regime since 1982 focussed onexpansion of the secondary foreign exchange market to finance imports;simplification of import procedures; rationalization of the tariff structure;and relaxation of quantitative restrictions. The most significant of thesewas the option of financing imports through the secondary foreign exchangemarket involving Wage Earners Scheme (WES) where supply and demand determined

- 32 -
the price of foreign exchange and hence its allocation among competing users.In 1984, the authorities took further steps in the direction of importliberalization by expanding the list of items to be imported and requiring thepublic sector importers to meet 40 percent of their requirements through thismarket. By 1986, all imports by public entities except those financed byforeign aid or barter trade were assigned to the foreign exchange market. Therelative importance of the secondary market increased substantially in recentyears. The process was carried forward with greater vigour. Items in therestricted list were made either importable by specified categories ofimporters or subject to satisfying specific conditions; items in the negativelist were banned; and other items could be imported through a normal routine.Over the past several years, the 'Negative List' and 'Restricted List' havebeen relaxed to allow the export-oriented industries to import banned orrestricted raw and packing materials and spares for the execution of specificexport orders. Since 1987-88 the government was gradually reducing the numberof items in these lists. By 1988-89, items in the negative and restrictedlists had been reduced to 189 and 159 respectively. There were further tradepolicy reforms in 1987-89, which aimed at boosting production and employmentin the medium-term while increasing exports and reducing the country'sdependence on foreign aid. One aspect of trade reforms related to exportpolicy administration, which entailed generalizing the processes andinstitutional mechanism and the other aspect involved reduction in the numberof tariff headings containing banned items by 20% a year in the negative listand by 60 new material items in the restricted list, lowering the maximumtariff to 100 percent.
Financial Sector Reforms
3.27 Indonesia led all the other four countries in respect of pace anddegree of financial sector reform. The Philippines and Sri Lanka came next.The minimal financial reforms were in Bangladesh and India - in the latter,the major steps are likely to be taken in 1992, as a part of sweepingindustrial and trade policy reforms. In Indonesia, the competition amongbanks increased substantially with the removal of special advantages which theState Banks enjoyed, substantial phasing of the directed credits, introductionof new financial instruments and total freeing of interest rates. Theexperience in the Philippines was mixed. Competition among banks received aboost, interest rates were adjusted upward and nonperforming loans were takenover by the Reconstruction Corporation. However, the banking system's assetsdeclined by 1987 and interest rates reached a level, which adversely affecteddomestic investment. In Sri Lanka, formal intervention was considerablyattenuated but it did not disappear. The exposure of the banking system toforeign competition increased, the foreign currency deposits held by residentsgrew rapidly and the links with the Offshore Banking Units (OBUs) werestrengthened. In the case of Bangladesh, the interest rate policy became moremarket-oriented, subsidized refinancing facilities were replaced by a moregeneral rediscount facility and more rational accounting practices wereintroduced in banks. However, the problem of debt recovery, became so seriousas to blunt the edge of other financial sector reforms.

- 33 -
3.28 India's financial system has grown rapidly in the last few yearswith greater depth, diversity of institutions and instruments and high degreeof sophistication. Its most significant achievement has been in the sphere ofmobilization of financial resources. This growth was built on a solidfoundation of high rate of domestic saving, consistently positive realinterest rates, availability of variegated financial assets, fiscal incentivesand expanded branch banking. Financial liberalization as understood ineconomic literature has not, however, progressed much in India. Thoughinterest rates remained positive, it was due to frequent adjustment inadministered interest rates. The growth in external debt, larger trade flows,increasing dominance of nonresident Indian accounts and greater privatesector's access to international money and capital markets paved a way to a defacto opening of India's capital account, thereby making India's financialsystem more sensitive to world interest rates. This in a way diluted theIndian monetary authorities' policy of administering interest rates in as muchas it impelled them to adjust interest rates in response to market conditions.Interest rates played a minimal role in resource allocation; they have beenused more as a distributional instrument to lower the cost of funds to thegovernment and priority borrowers. Commercial bank rates have beenunnecessarily complex, though they are not as distorted as in many otherdeveloping countries. In 1988 the Reserve Bank, India's central bankintroduced a number of measures that tended to increase the role of interestirates in resource allocation, the most important of this being theestablishment of minimum lending rates for short- and long-term lending bycommercial banks. This action afforded considerable flexibility in pricingloans and allowed long-term rates to be higher than short-term rates.
:3.29 With the advent of new government in 1991, there has been a sweepingireform in industrial and trade policies. As a part of this, the authoritieshiave decided to embark on major financial sector reform by decontrollinginterest rates on the bulk of debt instruments in the money and capital marketand allowing the private sector to set up mutual funds. A committee appointedby the government, has suggested transfer of non-performing loans to areconstruction corporation, gradual reduction of subsidized credit, radicalchanges in bank supervision, lesser involvement of the government inmanagement of banks and freer entry of new banks, both domestic and foreign.
3.30 The financial sector reform in Indonesia has made even greaterstrides since 1983 than the trade reform. As a result, there had been a greatdeal of improvement in regard to provision of working capital and long-termdiebt finance, equity contribution from venture capitalists and the stockexchange markets, long-term funds from the insurance companies and pensionfEunds, and alternative sources of finance from leasing companies and securityhouses. In the early phases of reforms, the Government deregulated interestrates of commercial banks, replaced credit ceiling with a system of reservemoney management and adjusted interest rates on a simplified structure ofdirect subsidized credits. Between 1984 and 1985, new money marketiLnstruments were introduced along with a rediscount window at Bank Indonesia(BI) to improve further the control of monetary policy. Since some of theproblems like barriers to entry, dominance of the financial system by statebanks, and sizeable subsidized credits remained, the authorities introducedfurther reforms in 1988/89. Under these, restrictions on entry and branching

- 34 -
by foreign and domesltic banks were lessened; public enterprises were asked toplace up to 501 of their deposits with banks other than the state banks; banksand non-bank financial intermediaries (NBFIs) were allowed to issuecertificates of deposit, and to raise capital in the stock market, minimumcapital standards for banks and solvency ratios for insurance companies wereprescribed, inside trading on stock exchange was prohibited; reserverequirements for all banks were unified for all bank liabilities and theirlevel was reduced to 2X and the maturing of BI certificates and SBIs waslengthened to facilitate a secondary market for them.1I/ Since theemphasis of reforms was on credit evaluation, proper pricing of loans and thefinancial management of assets on the basis of profitability, a betterenvironment for the private sector to grow faster than before was created.
3.31 The Philippines financial reforms began in 1980 with amendment ofbanking laws to permit the adoption of a universal banking system. Tofacilitate the change, the ceilings on various categories of bank lending anddeposit rates were first relaxed and then removed. A new Manila ReferenceRate (MRR) was established as a readily observable index to serve as the basisfor variable interest rate loans. The interest rate ceilings on long-termloans and deposits were removed first in order to encourage term lending;later, the interest rates on short-term deposits were freed. The last lendingceilings on short-term loans were eliminated in January 1983 and the lastdeposit rate ceiling (for deposits with maturity or two years or less) waseliminated in mid-1984. However, the interest rate subsidy for preferentialcredit programs was continued. It was not until 1985 that the Central Bankfinally eliminated the subsidy element in these programs by aligning thediscount rate on preferential loans to the market rate.15/ To broaden theownership base, banks that became unibanks were required to broaden theirownership base so that no one family or business group could retain control.No single domestic owner or group of owners within three levels ofconsanguinity were permitted to have more than 20X of the voting stock, andownership by foreign interests was limited to 401. Investments in nonalliedenterprises were restricted to 351 of voting stock, but in practice all butone of the private commercial banks were still closely allied with one or moreof the leading families.
3.32 During the [nitial years of financial liberalization, 1980-83,developments in the financial sector showed promising movement toward theintended goals. Real interest rates were positive, in the range of 3-51,mainly because of the decelerated inflation immediately after the reforms.After 1984, the rise in nominal interest rates induced by the issue of high-yield instruments reached 39-44Z, up fr-om 14-151 in previous years. However,
],i/ Cho, Y. J. and Khatkhate D; Lessons of Financial Liberalization in Asia:A Comparative Study, World Bank Discussion Papers #50, 1989, World Bank,Washington, D. C.
jV/ Cho Y. J. and Khatkhate, D., op. cit.

- 35 -
the high nominal and real interest compounded the financial problems of thehighly leveraged corporate borrowers, which in turn weakened the financialp?osition of banks.j,6/
3.33 The main accent of Sri Lanka's financial reform initiated in 1977was on the removal of restrictions on interest rates. This was done first byraising the bank rate from 8.5% to 10% p.a., thereby giving a signal to othermarket rates of interest. This was followed by raising sharply the interestrates on deposits of the National Savings Bank (NSB), the most dominantmobilizer of financial savings. In fact, deposit rates paid by this bank wereannounced to be the key rates for other banks and the financial institutionsto follow. The depreciated exchange rate and the increased domestic interestrates ensured that the illicit outflow of financial assets would decline andthe domestic financial intermediation process would be strengthened. Theselective control policy, however, was continued, although it was made evenmore selective, and the concessional element in interest rates was scaleddown. Banks were given more freedom to determine lending rates to the finalborrowers.J.1/ The reforms also permitted the financial system to operate:Ln a more competitive environment, since more banks, particularly foreignbanks and other deposit-taking nonbanks, could freely enter the field. Thiswas evident from the subsequent establishment of the foreign currency bankingunits (FCBUS) which could transact in foreign currency with nonresidententerprises in the free trade zone and accept foreign currency deposits fromnonresidents. Exchange controls were considerably diluted. Measures fordecontrol of prices and allocation of credit through interest rates wereLntroduced.
:3.34 While the policy of the Government was conducive to continuedprivate and foreign bank competition, there were still a number of constraintsthat placed these banks at a competitive disadvantage. These included:(a) capital adequacy requirement of 4 percent of total liabilities includinginterbank and contingent liabilities, imposed higher requirements on privateand foreign banks in terms of risk adjusted assets than on state banks; (b)selective credit policy set ceilings on commercial and large industrialLending which these banks focused on; (c) the central bank's refinancing ofnational credit program which was based on historical level rather thaneffectiveness of lending programs; (d) some pressure was exerted on publicenterprises to place deposits with state banks; (e) implicit governmentguarantees for state bank deposits which reduced their relative risk indepositor's minds. However, the Government seemed to be moving in thedirection of removing these obstacles to competition.
3.35 The Bangladesh financial sector reform program started in mid 1980s,sought to enhance financial sector efficiency through greater reliance onmarket competition, reduction in direct Government intervention, interest rateLiberalization, strengthening of the National Commercial Banks (NCBs) and an
;Lk Cho Y. J. and Khatkhate, D., op. cit.
;2/ Cho Y. J. and Khatkhate, D., op. cit..

- 36 -
improved legal framework for debt recovery. The Government moved to a moreflexible and market oriented approach to interest rate determination;discontinued providing subsidized refinancing facilities by replacing themwith a more general rediscount facility; through the Bangladesh Bank, imposednew regulations with respect to scheduled banks' accounting policies forprovisioning of bad debt and suspension of interest; and instituted financialcourts (under the Financial Loan Court Law) designed to improve debt recovery.
3.36 During the coming months, the Government intends to strengthen thesereforms in such areas as debt recovery, loan classification, bank supervision,financial restructuring of the NCBs, establishment of open market monetaryoperations, changes in accounting procedures and in capital marketdevelopment. While the.reforms already introduced by the Governmentrepresented a major step forward in restoring the viability of the financialsector, it remains to be seen whether these actions will be backed by a strongenough commitment of policy makers to improve loan recoveries and to fosterreal competition in lending and savings mobilization which are central to thereform program.

-37-
IV. DOMESTIC REGULATORY POLICY IMPEDIMENTS TO THE PRIVATEINDUSTRIAL DEVELOPMENT
4.1 The macroeconomic stability has always been the cornerstone of asteady and sustained growth of developing economies in general. Unlesshowever it is accompanied by an appropriate regulatory policy, much of thepotential from macroeconomic stability is often lost. The economic growth isaffected by the nature, scope and quality of regulatory policies and aconsistency among its various arms is also of overarching importance. It mayso happen that, while one type of regulatory policy, say domestic industrialpolicy is designed to spur private investment, other aspects of regulatoryapparatus such as labor market policy or direct foreign investment policy maywork at cross purposes. This section will focus on various aspects ofdomestic regulatory policies in the five countries, their evolution and howthey have been implemented. The impact of these policies on the privatesector development will be assessed in terms of various measures ofcompetitiveness and efficiency such as concentration ratios, or level ofeffective protection or total or partial factor productivity, scale ofproduction, etc., subject, to availability of information.
Industrial Policy Framework
India
4.2 The nature of India's domestic industrial policy as that of tradeand financial sector policies and the manner in which these were implementedover the years was the direct offshoot of the choice of centralized planningas an instrument to achieve rapid economic growth and egalitarian incomedistribution. Since market forces were considered to be incapable ofachieving optimal results, it was assumed that a state should take on aleading role as an economic agent. As a consequence, a comprehensiveregulatory apparatus emerged with its wings spreading to all sectors of theeconomy. The Government's policy was predicated on three basic premises.F'irst, the economy should pull itself up by its own shoestrings, which meantin practice that it should operate almost as a closed economy, producing asmany products domestically as possible and assigning a marginal role toforeign trade. The second was that the public sector should occupy thecommanding heights in the economy. Economic rationale underlying this premiseemanated from the Mahalanobis model, envisaging two sectors. A leading sectorconsisted of basic goods like steel and machinery, and the other a consumergoods sector playing a complementary role. Since the allocation of resourcesbetween these two sectors was not likely to be determined by autonomousforces, the Government had to step in. The third premise was theuLnderstandable concern in a poverty-afflicted and overpopulated country likeIndia that growth should benefit the most disadvantaged classes of society, interms of more employment opportunities and more equal income distribution.T'he basic needs, which gained a wide currency during the 1970s in the debateon development problems of the Third World countries, constituted the mainfulcrum of the Indian planning experiment. The implications of this concernfor industrial regulatory policies were clear. If the public sector was to bethe pulmotor of heavy industry, the private sector should be denied entry into

-38-
that field. If employment generating and quick yielding small scaleindustries were to be encouraged, it could be possible only if the largeindustries in the private sector were prevented from encroaching on the areasreserved for the former. If the egalitarian goals were to be attained, it wasimperative that luxury goods were not allowed to be produced domestically orimported. Thus, the negative aspects with emphasis on *don'ts" rather than onmdos* received greater prominence in fashioning the industrial policy.Initially, their objeactives were confined to steer investment allocation whereit would yield maximum benefits; but once the regulatory machinery was setgoing, it developed a life of its own, with constricting influence on growthin industrial production, efficiency and trade promotion, creating rentseeking vested interests in the process.
4.3 Since the Government had assigned high priority to the allocation ofresources, between the public and private sectors, and also predetermined thepattern of private sector investment, the instruments devised to ensure theoutcome had naturally a wide domain. Apart from the external trade policy andfinancial sector policies which have been alluded to earlier, othersclassified under a generic rubric of domestic regulatory policy wereindustrial developmerLt policy and a labor market policy. The first set ofthese viz industrial development policies, which originated with theIndustrial Development and Regulation Act 1951 (IDRA) and the subsequentIndustrial Policy Resolution of 1956 was dominant and though its character andcoverage changed over time, its grip on the private industrial developmentremained firm. The main constituents of the industrial policies were: (a)industrial licensing; (b) administered price controls (c) control of dominantfirms; (d) foreign investment control and technology licensing; and (e)promotional policies directed towards small-scale industries and location ofindustries in backward areas. In what follows, each of these constituentinstruments of domestic industrial policy will be discussed in order to assesstheir impact on private industrial development.
4.4 In general India's industrial policy adversely affects entry,growth, adaptability of firms. On the other hand, the exit is influencedmainly by the labor market policies and financial and industrial laws directedat restructuring firms.
(a) Industrial Licensing
4.5 In order to ensure a continuous compliance of private investmentwith plan investment priorities, the Government adopted industrial licensingas the main instrument. The IDRA required private approval by the licensingauthorities to establJish a new manufacturing unit, expand output by more than5% a year or 25% over five years and manufacture of a new product in anexisting plant, or relocate a plant. In recent years, several relaxations oflicensing were introdtuced, to promote growth and competition and to stimulateproduct groups. As a result, it was more liberally used to add capacity underprovisions for "automatic growth,' "unlimited growth," "regulations ofcapacity,' 'modernizat:ion," are-endorsement of capacity" and "raising minimumeconomic scale of prodLuction"; various product groups were completelyderegulated. However, despite these relaxations, the basic frame ofregulatory regime remained a barrier to entry, growth and adaptability. Even

-39-
whien certain restrictions were diluted, some others were introduced in regardto location, access to foreign exchange, additional investment and exportobligations.
Administered Prices
4.6 No less important have been the price controls used as an instrumentto ensure the availability of essential or crucial products at reasonableprices. Various methods were employed to enforce price controls and toadminister them in different industries. There have been industries such asfertilizer, aluminum, and cement where price controls were associated with asystem of differential retention prices across plants within an industry.Besides, there have been other industries where price controls were only oneelement in a system of multiple controls which distorted the growth of theindustry. There are currently about 65 individual or groups of commoditiessubject to price controls of various kinds. The coverage of commodities isaltered from time to time, depending upon which prices were needed to beraised or lowered.
4.7 Prices have been usually set on a cost-plus basis, derived fromtechnical relationships and the norm for a reasonable rate of return oncapital employed. More recently, non-linear pricing, long-run marginalpricing methods were experimented with. Normally, the prices are set by theBureau of Industrial Costs and Prices (BICP) for the industrial commodities,but special committees also are set up to regulate price control mechanisms,such as the Oil Coordination or the Fertilizer Coordination Committee, or theJoint Steel Plants Committee.
4.8 Most prices include a rate of return, normally 12 percent per annum,and more for the areas where investments have to be promoted and are based onpast production cost -- generally average cost, with a view to encouragingeEficiency. In several sectors of industry, firms are allotted quotas oftheir output for selling to the government at regulated prices; e.g. papermills, sugar, cement; the rest is allowed to be sold in the free market. Levyprices have ranged between 15 - 50 percent below the domestic free marketprices. The idea behind this is to preempt a part of the output for the useof government in what is designated as priority investment or publicdistribution system for the poorer sections of the society.
Control of Large and Dominant Firms
4.9 In addition to capacity licensing and price controls, the policy asenunciated in the Monopolies and Restrictive Trade Practices Act (MRTP) playedan equally important role in regulating private industrial sectors. This Actwas designed to (a) curb the concentration of economic power used "to thecommon detriment"; (b) to prevent practices that restrict competition and (c)to control unfair trade practices. The firms attracting the provisions of theAct were not allowed to enter or expand their existing operation in all areasexcept those specifically mentioned in the Act. MRTP firms were originallydefined as enterprises of interconnected firms that had assets of Rs. 200

-40-
million or more or a dominant market share of 33 percent or more. In 1985,the MRTP firm asset limit was raised to Rs. 1 billion. The number of suchfirms is around 1,100 presently.
(b) Policy Towards Foreign Investment
4.10 A policy towards foreign investment was governed from the beginningby two objectives: To supplement domestic savings and to bridge technologygaps in the economy. A major policy shift took place in the mid 1960s as thecountry opted for highly selective purchases of technology and minorityforeign participation in equity. The Foreign Investment Board (FIB) was setup in 1968 to scrutinize and approve foreign collaborations. It laid down alist of banned items and regulated the terms and conditions of foreigninvestment as well as the payments for technology imports and acquisition.Besides, it directed Indianization of management and the dilution of foreignequity shareholding.
4.11 The foreign investment policy became even more restrictive with theenactment of the Foreign Exchange Regulation Act (FERA) of 1973 and thegovernment began to control more severely foreign equity shareholding,bringing it down to a maximum of 40 percent, except that a higher controllinginterest was permitted in export-oriented and high technology companies. Theemphasis shifted again in the early 1980s when it was realized that foreigninvestment shriveled considerably while royalty payments ballooned. A littlemore liberal stance iwas taken by widening the area of permissible investments.Direct investment was encouraged for OPEC countries and non-resident Indianson a freely repatriable basis and foreign collaborations were furtherliberalized.
4.12 A further stage in liberal attitude towards foreign investment wasreached in 1989 with the publication of White paper on Technology policy.This was propelled by the realization that technological obsolescence,reflected in low total factor productivity, high costs and inferior quality ofproducts became a disturbing feature of the Indian industrial scene.Upgrading technology thus came to the fore as a major issue. The newtechnology policy, while reiterating the importance of domestic development oftechnology, advocated import of up-to-date foreign technology to beaccumulated at the shop floor level.
4.13 The policy toward foreign investment was interwoven with domesticindustrial regulatory policy and the external trade policy. The fragmentedcapacity in Indian industry, arising from industrial licensing policy, thecontrol of imports of capital goods and very high protection of the domesticcapital goods sector created an unfavorable climate for technologicaldevelopment along desired lines. This was more so when the profitability ofthe sheltered domestic market and the limitations on the policy actionsdesigned to correct the inherent anti-export bias contributed to industry'slack of exposure to the changing world technological standards. Other aspectsof the trade policy, which had a bearing on lack of technology developmentswas the restriction placed on the use of foreign exchange for modernization

-41-
purposes and the serious problem of absorbing heterogeneous technology withina plant -- essentially a problem associated with capital goods imports underdiverse lines of credit from foreign sources including bilateral aid programs.
(c) Promotional Policies Towards Private Sector DeveloRment
4.14 Promotional policies towards private industrial sector had a twotrack approach; First was directed towards developing small scale industriesandL the second toward industrial location in backward areas through specialincentives or reservations of output. The emphasis on Small Scale Industries(SSI) was motivated by a desire to spawn entrepreneurs and employment as theSSIs used more labor intensive techniques of production. Assistance to theSSI took various forms. (a) reservations of products exclusively in thatsector; the list of items contained about 900 items in 1980s but declinedslightly to some 836 or above 17 percent of all items produced by SSIs; (b)restriction on the growth and capacity in the large manufacturing sectorconipeting with SSIs; (c) directed subsidized credit from the financial systemfor purchase of capital equipment; (d) preferential tax treatment, both inregard to individual and direct taxation; (e) exemption from application ofrestrictive labor legislations; (f) exemption from licensing; (g)infrastructural support through industrial estates, training facilities andtechnical assistance of varied types; (h) favorable treatment in regard toraw materials, both domestic and imported; and (i) purchase support throughgovernment procurement and price preference for SSI products. SSI for thepurpose of product reservation was defined as firm having an investment inmachinery and equipment not exceeding Rs. 3.5 million (US$272,000) or Rs. 4.5million (US$350,000) in the care of an ancillary firm. To maintain a regionalbalance, through a geographic dispersal of industry was the objective ofindustrial location policy, which took different forms over the years. Duringthe! 1950s and 1960s, the focus was on locating public sector undertakings inbackward states, providing economic infrastructure and maintaining uniformprices for basic inputs like steel and cement nationwide. In the 1970s, thepolicy changed the gear from development of backward states to development ofbackward regions. Additional financial incentives like capital subsidies,interest rate concession, transport subsidy and tax concession were introducedto attract industries to such regions. In the 1980s, fiscal incentives weresupplemented by licensing policies to direct HRTP companies, large houses,and companies with substantial foreign ownership to locate in backward areas.
(d) Labor Market Policies
4.15 A complex web of legislations governs regulations on all aspects oflabor in the organized individual sector. Several laws owed their origin tothe British regime. Labor laws and regulations have multiplied over the yearsat a rapid rate and a large governmental and quasi-judicial apparatus has beenestablished. Unlike in the case of licensing and other direct controls, thelegal framework and regulatory apparatus governing industrial labor have notbeen reformed in recent years. On the contrary, new additions have been madeto the tome of labor legislations in the 1980s, which accentuated themanagement problems and introduced greater rigidity in employment andretrenchment policy. Under the 1984 amendment of the Industrial Disputes Act,any unit with more than 100 employees must obtain government permission to

-42-
dismiss workers or cease operation. "Financial difficulty" has beenexplicitly excluded as a legitimate cause for application to dismiss workers.Permission to retrench labor is rarely granted, and entrepreneurs have toeither continue operating loss-making units or negotiating an agreement forvoluntary separatiom with compensation.
Indonesia
4.16 Industrial development policies in Indonesia were alwaysinterventionist though they passed through various phases. There was somedegree of liberalization albeit modestly in 1966 when the Soeharto regimestarted but soon reverted to the earlier pattern with a multiple and complexregulations on private sector industry, in regard to all aspects. Therationale for the regulatory policy, both trade and domestic was derived fromthe various Five-year Plans (Repelitas), which like all other plans indeveloping countries like India, Sri Lanka, etc., focused on development of"Basic" heavy indust:ry like cement, fertilizer, chemicals and on the promotionof entrepreneurship through encouragement of small scale industries and thespatial dispersal w.Lthin the country. Since domestic industrial growth wasforced through deliberate policy, the bias against imports which might competewith domestic products and the foreign investment was unavoidable.
Investment Licensing System
4.17 Manufacturing firms were classified into three categories until thelate 1970s: the BKPM sector, the BRO sector and the unlicensed sector. TheBKPM sector covered those firms which applied for licenses through theInvestment Coordinating Board, i.e. BKPM, all manufacturing firms, no matterhow small with any degree foreign equity whatever must obtain approval fortheir operation in this way. Domestically owned firms, on the other hand,could opt for applying for taxation and investment incentives from theGovernment, in which case they must apply through BKPM or alternatively, theycould simply register under BRO provisions. Finally, the unlicensed sectorcovered a large but unknown number of small and cottage firms which wererequired, in a strict legal sense, to be registered with local governmentdepartments.
4.18 The characteristic of the investment licensing system was lack ofuniformity in its application to various types of firms. On one hand, therewere specific licensing requirements relating to production which varied byproduct or by region for firms which registered through the BKPMs or under BROprovisions. On the other hand, there were several other licenses to beobtained, such as trading license for internal-external trade, pollution,domestic road and sea transportation, classification and packaging of productsetc., which applied to all industrial enterprises, excluding cottageindustries.
4.19 The BKPM dealt with the core of the large firms In the privatesector, which sought tax and investment incentives, through formulatinginvestment priorities and policies. For this purpose, it prepared anInvestment Priority List, or DSP for short. Originally it was issued at two-year intervals, but since 1980, it was released every year. The DSP for

-43-
domestic investment listed 526 subsectors which covered 389 industrialsubsectors; the corresponding number for foreign investment DSP were 339 and267. Thus the licensing had been such detailed, prolonged and elaborate thatit took the firms few months if not years for completion of the formalities.The conditions for licensing included, among others, maximum allowableproduction, minimum economic capacity, location, participation of the weakereconomic groups as partner or cooperative, use of raw material, etc. The DSPlist was specified as a positive approval list which varied from year to year.
4.20 The firms of all sizes not seeking tax and investment incentives,registered themselves with the provincial Departments of Industry or what wasknown as BRO sectors. The BRO Law provided the legal foundation for issue oflicensing both for new investment as well as for the expansion of existingfirms.
4.21 An overriding concern of the government was the orderly developmentof the industrial sector so that private decisions made by the businessescould remain consistent with the social goals of the country. The objectiveswere both socio-political and economic and were often mutually conflictive.Among the socio-political objectives were, the development of basicindustries, the promotion of weak local entrepreneurs, the guarantee ofdomestic supply, etc. The economic objectives were the allocation of scarceresources to conform to predetermined priorities and plans; prevention ofexcess idle capacity, and monopolies, balanced regional development,encouragement of modern technology, quality control, etc.
4.22 Licenses were obtained from BKPM and BRO under different procedures.In addition, regional licenses were also required, which could be obtainedfrom provincial governments. Investors were required to report their progressannually to BKPM, BRO though in practice, the reporting system hardlyfunctioned. The criteria adopted for issue of licenses were: (a) theeligibility of the applicant, given the existing market situation; forinstance, if the particular sector was deemed to be saturated, no licensewould be issued; (b) the economic capacity of the applicant--whether hebelonged to a weaker section of the society; (3) the first-come first-servedbasiis of the issue of licenses. This criterion had implications for sectorsin which the Government wished to control excess capacity.
Local Content Programs
4.23 Intrinsic to the investment licensing policy was the local contentprogram (LCP) instituted by the Government in the late 1970s for a range ofprcducts -- mostly in the automotive, metal and engineering subsector. TheLCE', an aspect of an import substituting industrialization strategy, wasimplemented through a set of explicit Government regulations or licensingprocedures that involved a certain amount of input (by value or quantity) fora particular final product or an industrial subsector be locally manufacturedor be of local origin. The products included varied over the years. In mostcases, LCPs took the form of regulations issued by Ministry of Industry (OI)specifying that a certain component or input be produced locally by a certain

-44-
future date. Thege programs were also enforced through controls or inputs offinal products. LCP included a tariff-based system which encouraged the useof local inputs soLely through tariff policy.
4.24 The LCP was designed to: (a) stimulate the development of small-and medium-scale industry in order to increase domestic value added andemployment; (b) st:imulate the transfer of technology from foreign companiesto domestic enterprises; and (c) conserve foreign exchange through localproduction of importables. The LCP programs covered products for which designor production license had to be purchased, or products that could be purchasedin completely knocked down condition and assembled. General criteria adoptedin choosing produclts was whether their manufacturer in Indonesia had acomparative advantage. On the whole, this was a very restrictive system andmilitated against low cost and competitive domestic production.
Domestic Pricing Policies and Subsidies
4.25 Domestic price controls were not as pervasive in Indonesia as inIndia and some other developing countries in similar economic situation. Riceprices were stabilized through the market operation of BULOG, but without anysignificant deviation from world prices. Some other agricultural prices suchas those of soybeans and sugar, were above world prices because of inputrestrictions. The most important price controls were on energy -- petroleumproducts, power, and agricultural inputs -- pesticides, and fertilizers.Domestic petroleum prices were substantially lower than elsewhere in theregion with cross subsidization of some products like kerosene and diesel.Though prices of petsticides and fertilizers were raised substantially in 1988,the subsidization continued, though on a reduced scale.
Policy Towards Direct Foreign Investment
4.26 There was always a certain degree of ambivalence in the Government'sattitude towards direct foreign investment (DFIs). While one of the principalobjectives in the 3rd Plan (Repelita III) was to promote foreign investmentsconsistent with Indonesia's development priorities, the policy towards DFI inpractice, gave weighage to the political and ideological considerations,arising from the country's colonial past.
4.27 The FDI was regulated by two laws passed in 1967 and 1970. Underthese laws, foreign investment (known PMA in Indonesia) is defined as thatinvestment in which domestic equity holding was less than 100%. TheGovernment could not revoke ownership rights or reduce investor control,except in national interest. However, this provision was so vague that itspractical impact was negative on FDI. The policy towards FDI changed in mid-1970s in a manner that restrictions on FDI became more stringent. The mostimportant of these included increased controls on investments by sector andlocation, the exclusion of foreign investment in certain sectors, insistenceon higher local participation in ownership and management, prohibitions onforeign firms in engaging in distribution activities. and various creditrestrictions on for,eign firms.

-45-
4.28 Since 1974, investment applications from foreign firms to BKPM hadbeen subject to the requirement that the initial Indonesian share be at least20% to be increased to 51% within ten years from the start of operation.However, the shift in policy created a great deal of uncertainty in the mindsof the average investors because of its ambiguity as regards coverage, timingand penalties for the violation of the guidelines.
4.29 Another major area of restrictions resulted from the increasedcontrol on new investments. Apart from the prohibition of certain fields ofinvestments even under the earlier open door policy, some other types ofinvestments, such as marketing and distribution, paint, cigarettes, tiremanufacture, were closed to foreign investors. Eventually these restrictionsbecame so numerous that the BKPMs issued in 1980 the first DSP list in regardto foreign investment. Though the policy toward FDI by the beginning of the1980s became more severe, the government operated it in a flexible manner incombining incentives with restrictions and thus toned down the rigors of thenew policy.
Promotional Policy Towards Private Sector Development
4.30 Indonesia's promotional policy towards small indigenous enterpriseswas built into its investment licensing policy, which was discussed earlier inthe section. There were several specific DSPs issued from time to time, whichimplicitly recognized the Government's concerns to provide opportunities tothe weaker economic groups. Clear conditions for this group to be involvedwere specified in numerous subsectors; in some cases, the subsectors werereserved only for these favored groups. Earlier DSPs prior to 1978, were notquite so explicit and thus facilitated the avoidance of the provisionsrequiring the involvement of the weaker economic groups. In general, thepromotional policy of the government was articulated and implemented throughthe medium of BKPM, which was charged with operating a variety of tax andincentive schemes.
Location and Land-use Regulations
4.31 In addition to investment and operating licenses, a firm must alsoacquire a number of licenses and permits at the provincial and local levels.The major steps in the local regulatory procedures were: (a) locationapproval, which entailed obtaining the land reservation, and local locationpermits; (b) land rights and acquisition, which involved registering andtitling the land; and (c) Construction approval which involved procuring thenuisance license and construction permit. The main problems that arose incomplying with these multiple local regulations were: (a) the complexity ofthLe application procedures; (b) the lack of institutional coordination so thatinvestors had to secure approval at several layers of the government and fromvaLrious other agencies; and (c) weak and ineffective administration capacityat: the local level including shortage of trained staff in most agencies.
LaLnd Tenure and ProRerty Rights
4.32 The laws governing land ownership were extremely restrictive inintent and implementation and procedures for acquiring, registering and

-46-
obtaining a title to land were vague and highly discretionary. Despite theBasic Agrarian Law of 1960, which was intended to end the duality of land lawsestablished in the colonial period, a substantial proportion of land inIndonesia remained unsurveyed, unregistered and untitled, and was government-owned by tradition (or the Adat Law). Thus less than a quarter of agricul-tural land was properly titled or registered. Even the land that wasofficially registered was subject to several types of land rights with varyingdegrees of tenure. Private corporations--both domestic and foreign, were notallowed to have the right of ownership of land; this right was confined toprivate Indonesian individuals and government entities. Agricultural landsfor plantations were usually given the right of exploitation, whereasfactories and business premises usually had the right of building. Themaximum time limit on these land rights was 20 to 30 years.
Labor Market Policy
4.33 There have been five main areas of labor regulations in indonesia:(a) protection and supervision of workers that included specific regulationson hours worked and overtime, and wage and worker welfare; (b) reportingrequirements by the company; (c) safety and health standards; (d) hiring,retrenchment and movement of labor between provinces; and (c) employment ofexpatriate workers. Taken together, these regulations have been extremelycomplicated, discrel:ionary, lacking in any consistent pattern, riddled with alarge number of superfluous rules and regulations without any explicitrationale and reporting requirements which were unenforceable in normalcircumstances.
Coroorate Legal Fraewor
4.34 Corporate legal structure in Indonesia, which dated back to itscolonial past, generally operated to the disadvantage of the privateindustrial system. Most of the laws are antiquated and unsuited to the modernbusiness practices. There are also notable gaps in the legal framework; forinstance, on the intellectual property rights and the legal and accountingframework for financial transactions. As a result of the general characteris-tics of most statutes, there had been a proliferation of Government regula-tions and decrees. Enforcement of these involved a cumbersome court processthat lacked transparency and precedents. Nor are there any effectivearbitration mechanisms outside the court system. These shortcomings could beeliminated only with a comprehensive well-designed revision of the existinglaws, reforms of legal procedures and reorientation of the institutions.
The Philiggines
4.35 Industrial policy in the Philippines between 1950 and 1980 can bedivided into three distinct periods: a first phase of import-substitutingindustrialization in the 1950s under rising protective barriers; a major shifttowards a more open and liberal trade regime in the early 1960s, which was notsustained; and a reversal towards more interventionist policies beginning inthe late 1960s with increasing recourse to protective barriers, large public-sector led or supported investments and generous Board of Investmentincentives and industrial finance. At the same time, several nontrade

-47-
measures were introduced to support domestic industry including the Board ofInvestment (BOI) incentives, targeted lending by the Development Bank of thePhilippines and controls on entry into 'crowded' industries. It is thislatter phase which gave rise to the large, sophisticated but highlyinefficient industrial complex of the 1970s.
Industrial Licensing
4.36 The Philippines has a very complicated industrial regulatory system,governed by a series of incentive laws spread over many years. These lawsperiodically revised generally at an interval of five years covered both thepositive aspects like provision of incentives and negative aspects of denialto set up an industry through licensing or other instruments. A generalthrust of the changes in incentive laws has been towards provision ofincentives to export production relative to domestic production. Until 1983,successive investment laws tended to expand the value of incentives granted aswell as the range of eligible industries. The chronology of eligibleincentive legislation is presented in Table 1.
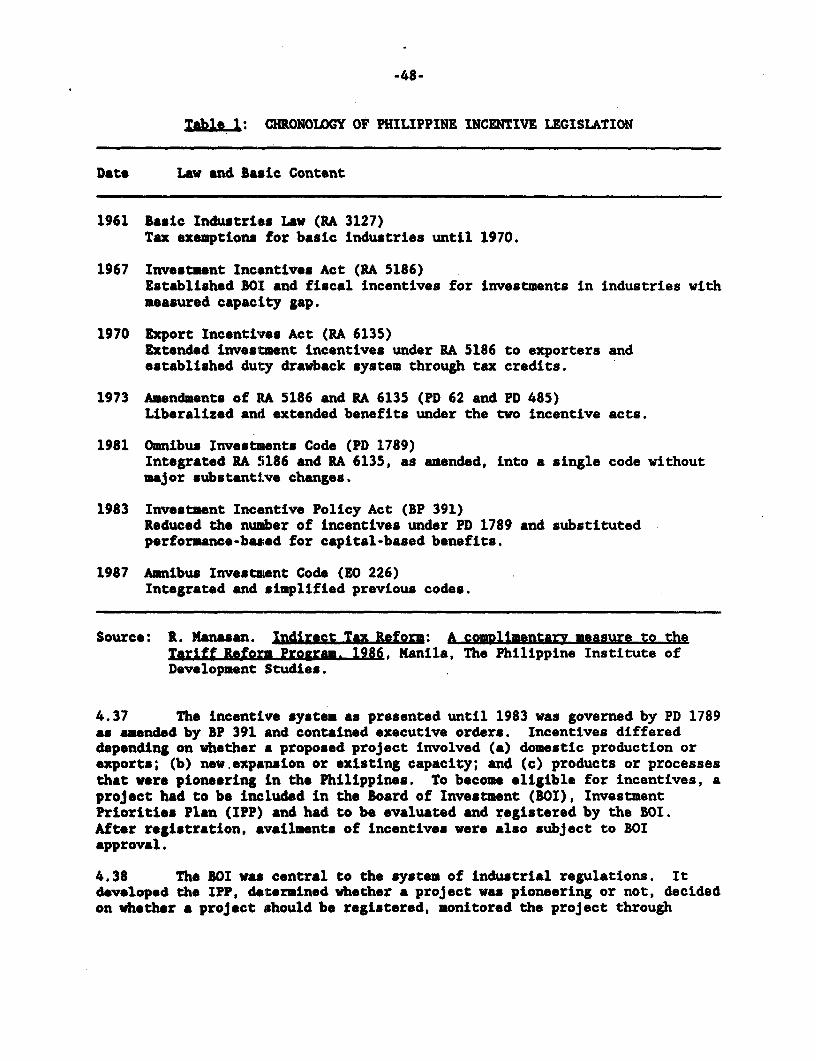
-48-
Table 1: CHRONOLOGY OF PHILIPPINE INCENTIVE LEGISLATION
Date Law end Basic Content
1961 Basic Industries Law (RA 3127)Tax exemptions for basic industries until 1970.
1967 Investment Incentives Act (RA 5186)Established BOI and fiscal incentives for investments in industries withmeasured capacity gap.
1970 Export Incentives Act (RA 6135)Extended investment incentives under RA 5186 to exporters andestablished duty drawback system through tax credits.
1973 Amendments of RA 5186 and RA 6135 (PD 62 and PD 485)Liberalized and extended benefits under the two incentive acts.
1981 Omnibus Investments Code (PD 1789)Integrated IA 5186 and RA 6135, as amended, into a single code withoutmajor substantive changes.
1983 Investment Incentive Policy Act (BP 391)Reduced the number of incentives under PD 1789 and substitutedperformance-based for capital-based benefits.
1987 Amnibus Investment Code (EO 226)Integrated and simplified previous codes.
Source: R. anasan. Indirect Tax Refor: A comDlimentarv measure to theTariff Reform Program. 1986, Manila, The Philippine Institute ofDevelopment Studies.
4.37 The incentive system as presented until 1983 was governed by PD 1789as amended by BP 391 and contained executive orders. Incentives differeddepending on whether a proposed project involved (a) domestic production orexports; (b) new expansion or existing capacity; and (c) products or processesthat were pioneering in the Philippines. To become eligible for incentives, aproject had to be included in the Board of Investment (BOI), InvestmentPriorities Plan (IPP) and had to be evaluated and registered by the BOI.After registration, availments of incentives were also subject to BOIapproval.
4.38 The BOI was central to the system of industrial regulations. Itdeveloped the IPP, detormined whether a project was pioneering or not, decidedon whether a project should be registered, monitored the project through

-49-
periodical reporting and approved all incentive availments. Originally theBOI was an independent body but it was made, in early 1980s for all practicalpurposes, a bureau of the Ministry of Trade and Industry (MTI).
Domestic Pricing Policies
4.39 Price controls were increasingly widespread in consumer andintermediate goods in the 1970s. In part these controls followed the patternof agricultural taxation through low pricing to protect urban consumers.While efforts were made to offset the farm-level impact of these controlsthrough subsidized input prices, the effect was to reduce input supplies andto create rent opportunities for those with privileged access. On theindustrial side, price controls were increasingly required as a concomitant ofthe ad hoc and monopolistic concessions made to large import substitutionenterprises. While the Department of Trade and Industry, the Department ofAgriculture, or other line ministry were nominally responsible to monitor andapprove prices within their sectors, this was a highly political issue, inwhich the President, his advisors and an informal network of associates playedan active role. Even after most price controls were officially lifted at theend of the 1970s, prices remained under the authority of industry authorities.
?olicv Toward Direct Foreign Investment
4.40 The provision of fiscal incentives to foreign investors goes back tothe passing of the New and Necessary Industries Act of 1946 which exemptedcertain industries from all internal revenue taxes for a period of four years.During the subsequent decades prior to the enactment of the Omnibus InvestmentCode in 1987, further legislation was passed concerning investment incentivesand protection, such as the establishment of an Export Processing Zone in theearly 1970s. The Philippines has attracted many large foreign industrialinvestors through a system of protection and incentive measures which were byand large, negotiated on an ad hoc basis with prospective investors and theirlocal affiliates. While these benefits were generous in many cases, they wereachieved through negotiation and were not the product of a transparentapplication of laws to which recipients had ready judicial recourse.
Labor Market Policy
4.41 The Philippines traditionally had legislative provisions for minimumwages and several other elements of worker compensation and workingconditions. These did not have an adverse impact on labor costs or theflexibility of employers in the use of labor. However, in the context of itsprice control policies, the government had played an active part in wage ratesetting and negotiations between industry and organized labor. To the extentthat this had constrained wage rate growth, it in effect made labor policyanother cost element for industries.
Sri Lanka
4.42 The year 1956 marked the introduction of the first activeindustrialization policy in Sri Lanka. The new government had elaborated itsstrategy of import substitution, industrial expansion, and public sector

-50-
domination of productive activities in the economy. It defined three types ofeligible industry: Basic industries--iron and steel, chemicals, cement,fertilizer, and textiles--which were reserved exclusively for stateinvestment; light consumer goods industries, which were to be developedjointly by the state and private investors; and small scale industries thatwere to be left to the private sector. After twenty years of this kind ofindustrialization, the manufacturing sector played only a marginal role in SriLanka economy.
Industrial Licensin.
4.43 Approvals for the entry of firms to particular industries weregranted by various local investment Advisory Committee (LIACs). Investment bySri Lankan entrepreneurs with no foreign participation were approved by theLIACs while new projects with foreign participation were approved by eitherGreater Columbo Economic Committee (GCEC) or FIAC (Foreign Investment AdvisoryCommittees) depending upon whether or not they were to be located in the FreeTrade Zones (FTZ).
4.44 There were four separate LIACs reporting to the Ministries ofIndustry and Scientific Affairs, Textile, Fisheries and Rural Industries andCovering their respective area of activity. These four committees workedindependently without formal coordination or common ground rules, and therewas no defined jurisdictional boundary between LIACs. The criteria forapproval were not clearly defined and included inter alia the promotion oflabor intensive activities, utilizing local raw material, export-orienteddecentralization, smaLl and medium industries, import-substitution foressential products or produce for which there was potential for employment;healthy but not excessive competition and the dispensing of the technologicalcapacity of the country. The areas of overlap among ministries were large,and the vagueness of the criteria left wide scope for administrativediscretion. The procedure did not allow for modification of project design asa result of dialogue between potential investors and LIAC. In several caseshowever potential investor did not even have to obtain LIAC approval.
Price Control Policy
4.45 The avowed purposes of price controls were to ensure access tostaples by the widest spectrum of the population, minimize foreign exchangerequirements, and control inflation. In practice, they also served to protectand reinforce the dominant role of public enterprises in activities in whichthere was private sector competition. Until 1977, the prices of some 6,000basic, intermediate and finished goods were controlled. This provided theGovernment with effective power over margins and, combined with entryrestrictions, ensured the survival or demise of many enterprises targeted forsupport or opposition, respectively. Price control with respect to importedgoods was effected through the monopoly operations of the State TradingCorporation, which also had a virtual monopoly on the trade in agriculturalproducts. Concerning other domestically produced items, control was effectedthrough a compulsory process of price approval overseen by the Ministry ofCommerce, whereby the petitioner was obliged to demonstrate cost increases asthe only basis for price increases. Other ministries and agencies were

-51-
required to comment on each petition, and a large administrative structuredeveloped to support the statistical and analytical requirements of thissystem.
4.46 In addition to the official price control mechanism, the governmentmade use of the pricing practices of public enterprises which were incompetition with private businesses. Their multiple and conflictingobjectives included socio-political ends such as low and stable consumerprices, while financial viability was not as immediate a criterion ofperformance. Consequently, their pricing practices were frequently used toforce private business to accept prices which were not appropriate for stablelong-term supply.
E'olicies Toward Foreign Investment
4.47 Direct Foreign Investment has always been officially welcomed in SriLanka, although the terms under which it was permitted during certain periodsin industrial policy had the effect of discouraging private external flows ofcapital. From 1956 through the early 1960s, nationalization of large foreignholdings in virtually all sectors sent negative signals to foreign investors.After the brief easing of restrictions in the late 1960s, the Government againeliminated some of the foreign exchange privileges of export-oriented firms,expressly prohibiting investment in specified areas, and omitting reference torepatriation privileges which had been included in previous statements. Thelists of activities in which foreign investment would not be permitted werechanged periodically, sometimes as a result of decisions taken during aparticular petition. Foreign ownership of assets, where it was permitted, wasdiscouraged by transaction taxes of up to 1001, for example on the transfer oftitle to land and securities.
4.48 The 1956 policy statement on state sponsored industrializationannounced the intent to nationalize the foreign-owned plantation, transport,:Lnsurance and banking. The foreign oil and insurance companies werenationalized in the early 1960s and the tree crops plantations in the 1970s.The Government's entrepreneurial role was expanded through a wave ofnationalization after the passage of Government Business Acquisition Act inL971. Under this Act, the Government was entitled to take over any privatelbusiness if judged by the Government to be in the country's interest. Thisacted as a major deterrent to the foreign investment.
Promotional Policies Toward Private Sector Development
4.49 In Sri Lanka as in many other countries, private small and mediumenterprises (SMEs) represented a potentially important agent of efficientdevelopment -- they engaged disproportionately in labor-intensive activities;they provided a seedbed for the emergence of new, dynamic national firms; andthey drew on the entrepreneurial potential nascent across a broad base ofsociety. There has been a significant but underutilized potential for SNEs inparticular and industries in general for Sri Lanka to exploit its comparativeadvantage in relatively low-wage skilled labor. These industries faced threetypes of major obstacles to growth (a) difficulties in securing access toinputs; (b) difficulties in obtaining bank credit; and (c) regulatory

-52-
impediment arising from the bureaucratic procedures and taxation burden. Afield survey found that the bureaucratic procedures involving investmentapproval, operational licenses etc. were less of obstacles in Sri Lankan ascompared to SMEs in many other developing countries.
Labor Market Policies
4.50 Sri Lanka has a large body of labor laws and an elaborate system ofregulations relating to working hours, holidays, health and sanitaryrequirements, workmen compensation, etc. This plethora of statutes made itdifficult for potential investors to determine which laws actually applied intheir case, let alone to assess the implications of the laws for theirdecisions to invest.
4.51 The issue of greatest concern to local entrepreneurs had been thevarious legal provisions relating to retrenchment under the Termination ofEmployment of Workmen (special provision) Act of 1971. An employer seeking toreduce staff must obtain either the consent of the workman or the sanction ofthe Commissioner of Lbor. The Commissioner could grant or refuse suchapproval in writing within a three month period and might decide the terms andconditions of the termination, including any particular gratuity orcompensation for termination.
Bangladesh
4.52 Industrial Licensing. In early years after Independence, privateinvestment in industry was deliberately discouraged as a mater of statepolicy; only exception was in regard to small and cottage industries. By1970s, the scope for private sector participation was widened in stagesthrough enlargement of the areas of investment and raising of investmentlimits. By 1976 except for certain sectors reserved for public investment,private investment was allowed in all other sectors subject to governmentcontrol through an Industrial Investment Schedule (IIS). The IIS specifiedinvestment possibilities in various subsectors in terms of aggregateinvestment allocation and served as an instrument to guide and sanctionprivate investment. At the same time, changes were also made in the policiesgoverning the import trade. Bangladesh nationals earning abroad, were allowedto import goods paid for from their wages. This development as also thedecision of the Goverrnent to withdraw ceilings on private investment led to afurther relaxation in the investment control system. A new list of sectors tobe known as "free sectors" emerged which required no formal sanction providedthe foreign exchange necessary for importing machinery and equipment wassupplied by entrepreneurs themselves under wage earnings or nonrepatriableforeign investment and that they did not borrow from government-relatedfinancial institutions, did not demand tax and tariff concessions. Theapproval was given by the controller of capital issues, Ministry ofFinance.2Q/
IQ/ Mubin A.K. and Rab A: Bangladesh: Industrial Regulatory and PromotionalPolicies, 1989 Op. Cit.

-53-
frice Control Policy
4.53 Bangladesh has historically maintained a comprehensive system ofinput and output price controls. Applications for price changes were requiredto give evidence of the cost changes on which the application was based. Butin addition, until early 1980s such applications were circulated to the lineministries and the Ministry of Finance, for coment as to economic and fiscalimpact before approval was given. In addition to the direct control ofpirices, the determined prices for public sector enterprises and thus forcingother suppliers to offer their output at or near the level of the pricescharged by the public sector.
Direct Foreign Investment
4.54 The Government in a formal sense, was not averse to foreign directinvestment. Foreign investment with equity up to 100 percent as well asforeign participation in joint venture projects was freely allowed. Foreigninvestment in the public sector was also permitted. Until recently, allproposals for foreign investment including terms and conditions determiningequity participation and management contract needed sanctions from the highestsanctioning authority of the Government.
4.55 Foreign investors were protected by the Foreign Investment Promotionand Protection Act, 1980. It provided assurance against state confiscation ornationalization of industries involving foreign investment as well asrepatriation of profits from these investments. To ensure this, theGovernment entered into bilateral investment protection agreemnts with manyindustrial countries such as the USA, UK, Germany, etc. The Government alsodid not discriminate against foreign investors in regard to labor policy,taxation, tariff rates and foreign trade policies. Capital and capital gainscould be repatriated with the prior permission of the Bangladesh Bank andremittance of dividend to the nonresident shareholders could be repatriatedsubject to ex post-post approval of the Bangladesh Bank.
promotional Policies Towards the Private Sector
4.56 Private sector investment has been beneficiary under a wide range ofincentive schemes. The incentives given were: (a) a special concessionaryduly rate of 1.5 percent to 15 percent payable on imported machinery,depending on location of the industry or on its nature; (b) a company taxbreak for 5 to 12 years depending on the location of industries or accelerateddepreciation allowances in lieu of the tax holiday; (c) liberal investmentallowances; (d) a variety of special incentives for export industries. Inaddition, government trade and tariff policy provided liberal protectionagainst foreign competition. The Investment Board wa involved only ingranting a certification for the duty concessions on imported machinery. Thefiscal incentives have been administered by the National Board of Revenue(NBR) while some of the export incentives such as Export Performance Benefitwere administered by the Bangladesh Bank.

-54-
4.57 The small cottage industries, were spared prior investment approvalas they were general:Ly financed through informal credit channel and did nothave to use any imported inputs.
Labor Market Policies
4.58 Guidelines for the protection of the rights of workers have beenembodied in the Labor Code. The principal provisions of concern to privateemployers were the specification of working hours, determination of minimumwages, provisions for various forms of termination, and mechanisms for thesettlement of disputes. Under the Minimum Wages Ordinance of 1961 a MinimumWage Board periodically recommended to the government the structure of minimumwages but the government reserved the right to make amendments to the minimumwage rate policy at any time. It was believed generally that the minimumwages were set at reatsonable levels. Most firms paid 30-60X higher thanregulated levels by choice and independently of union demands. Settlement ofdisputes and termination of employment did not pose any serious problem forthe industry.
Conseguences of Domestic Regulatory Policies
India
4.59 The principal objective of domestic regulatory policies to promoteheavy industrialization and import substitution has been undoubtedly achieved.Basic and capital goods output rose faster than that of intermediate and non-durable consumer goods (Appendix I - India: Table 2). The degree of importsubstitution was large and persistent and was dramatized by the production offertilizers, the imports of which were replaced by feedstock imports and crudepetroleum etc.. Thouglh most of the import substitution was inefficient, therehave been several bright spots of efficient production of importables whichhelped the country both to diversify exports with non-traditional manufacturedgoods and to effect backward integration, as reflected in the rise of theimport of intermediate products after the 1960s. Balanced against thesebenefits, however, were very high costs of import substitution in terms oflower growth, underut:Llization of capacity, slack in factor productivity anduneconomic size of the production units.
4.60 Industrial output and value added in the manufacturing sector grewrapidly initially duriLng 1950s and early part of 1960s, and then slid downward(Appendix I - India: 1rables 2 and 3). Thus the rate of growth ofmanufacturing sector output which was 6.1 during 1960; declined to 4.4 in the1970s. Likewise the trend in value added in manufacturing showed a decliningtrend. What was even more striking was the fact that the declining trend wasevident across all groups of industries. In point of fact, India's industrialperformance during 1960s to 1970s was lower than reflected in the average forall developing countries. The structure of production in many subsectors wascharacterized by an irappropriate product mix, at the firm as well as the sub-sector level. Very often, too many products were produced domesticallydespite a small demand for them in view of the limited domestic size of themarket, and low exports. There was an excessive proportion of inputsmanufactured within a firm regardless of its cost.

-55-
4.61 Another unsavory offshoot of India's regulatory policy has been anuneconomic size of the average plant. Even large firms were often made up ofnumerous small production units where costs remained higher than could beobtained in an optimal size firm or what was commonly described as minimumefficient scale (MES). Too much emphasis on the small-size firms, biasagainst large firms in order to discourage monopolies and varied disincentivesemanating from labor laws, taxation, etc., made it difficult for small sizefirms to graduate into medium- and large-sized firms (Appendix I - India:Table 11).
4.62 Paradoxically enough, the Indian industry suffered from a higherdegree of concentration and monopoly practices, even though average-sizedplant was less than optimal and the role of small industrial firms wasoveremphasized in economic and regulatory policies. In the capital goodsindustries, the top four firms -- i.e., the four firms concentration ratio --claimed 60 percent or more of output in 1976 and 1984-85 (Appendix I - India:
Table 8). The same held true, more or less, for other groups of industries --basic, consumer, and intermediate. Though the degree of concentration ratioscould be explained in terms of the varieties of scale requirements fordifferent products relative to their domestic markets, the main reason lay inthe domestic regulatory policies which attempted to specify production ofcertain goods for different size groups of firms. Under Licensing Policies asthey were operated in practice, relatively few firms were allowed to be set upfor the production of basic and intermediate goods. Concentration was alsohigh in India relative to other countries. For instance, it is striking that55 of industrial segments in India had four-firm concentration ratios in the80-1001 range, while in Japan only 91 of segments had reached this degree ofconcentration.
4.63 While the industrial diversification and spatial spread ofindustries was a notable feature of Indian economic development during itseaLrly phases, the economic efficiency with which industrial output wasproduced was low and declining. Incremental Capital Output Ratio (ICOR) theirnverse of which is one of the reliable measures of economic efficiency, wason1 the rise throughout until the latter half of the 1980s (Appendix I - India:Table 5). ICORs in manufacturing moved from 2.8 in the fifties to 4.4 in thesixties. It further increased to 7.6 during the 1970s. The high ICORsprevailed across all industry groups, though there were variations betweenthem. In general, the highest ICORs existed in industries where importsubstitution was substantial, regardless of the absence of comparativeadvantages, underutilization of capacity, technological obsolescence, and thediminishing returns.21/ Among the factors accounting for lack of overalleificiency were regional dispersal policies, excess capacity fragmentationinto uneconomic units and rising input costs of material and services frompublic sector units, labor behavior and managerial deficiencies.
3L/ Chitale, V.P. Capital Output Rates in the Indian Economy. Economic andScientific Research Foundation, 1986, New Delhi.

-56-
4.64 The conclusions based on ICORs were supported by the trend in laborproductivity as well as total factor Productivity (TFP). Labor productivityincrease was steady though not high, but it was more the outcome of the risingcapital intensity rather than an improvement in TFP. The average growth ofTFP was negative at - 0.3 between 1964-65 and 1974-80, which could be taken asthe heydays of the domestic regulatory regime. Except in regard to thecapital goods and consumer goods sectors where TFP was positive at 1.7 and 0.9respectively, all the others recorded negative productivity.I2/ This was asharp contrast to the performance in many developed and developing countrieswhere TFP growth typically averaged between 201 and 50X per annum. The slowgrowth of TFP had two adverse consequences. First, it together withincreasing capital intensity in production made it difficult for theindustrial growth to be sustained at a high level. Second, the slow growth ofTFP worsened India's competitiveness in the world market affecting its exportperformances.
4.65 The lower of TFP in manufacturing was not simply a reflection ofshift in industrial structure. Within the manufacturing sector, industriesaccounting for about 50 X of value added in manufacturing experienced declinesin total factor productivity. Thus there were significant problems, withinthe individual subsectors which related to regulatory and trade policies.First, technical efficiency was affected by an extreme degree of fragmentationand insufficient specialization. These structural deficiencies precludedfirms from realizing available economies of scale and accumulating significanttechnological capabilities. Second, trade restrictions and regulatorybarriers to mobility slowed down structural change within firms and industrieswith an adverse impact on allocative efficiency. Third, the quality ofmanagement suffered in an environment characterized by protection fromcompetition and capt:Lve markets. Weak managerial conduct was revealed by lowlevels of capacity utilization and a slow technological change. Thesetechnical, allocative and other inefficiencies were difficult to disentangle.However, their joint effect could be observed in the low level of capacityutilization and prodAuctivity growth, and in the high cost structures of Indianindustry, with the consequent loss of international competitiveness.
4.66 It was true that low levels of capacity utilization could emanatefrom several factors other than regulatory policies. There was, however,strong presumption that in India's case the regulatory policies were a majorfactor if not the only one making for low utilization of capacity. Theobserved underutilization seemed to be largely due to the problem withinfrastructural services, managerial inefficiency and the implementation ofprice controls. Prices in controlled industries, in particular, were oftenset below levels that ensured adequate profits, and firms responded bycurtailing investments, including those for debottlenecking and balancing - aresponse that had reduced capacity utilization.
)2/ Ahluwalia, I. Industrial Growth in India: Stagnation Since the Mid-Sixties, Oxford University Press, 1985, New Delhi.

-57-
4.67 The sum and substance of the working of the regulatory regime inIndia is that it stifled entrepreneurship through uncertainties in the mindsof the investors created by elaborate procedural rituals that they had to gothrough, the frequent changes in the requirements to be complied with forinvrestment decisions, and inadequate access to the up-to-date technology. Italso made the private sector, which had to constantly grapple with theregulatory policy, lethargic and complaisant for lack of competition bothdomestic and foreign. All this culminated in an investment environment whichmi]Litated against growth. The industrial policy regime was operated in amanner as to influence the pattern of investment down to a product level, thechoice of technology with its implication for scale, expansion, location,direct import content as well as the terms of foreign collaboration in financeand knowhow. This took away all the initiative and dynamism from theentrepreneurs and made them the passive agents, incapable of reacting to thechanging economic forces. "Thus, the industrial policy regime became more andmore regulatory and less and less developmental, belying the original promiseof "channeling" growth in a desired direction".1/
4.1;8 The shadow was cast by the licensing system on potential investorsand inhibited the ability of firms to benefit from economics of scale, andproduct specialization. Most of the licenses issued were used, until 1985when somewhat more significant reforms in licensing were initiated, to pre-empt entry or expansion by the competitors. The vagaries of licensing alsooflten ended in encouraging alternatively supply or shortages of the productslicensed, as the licensing authority could not fathom the market conditions.The licensing procedures had, in practice become cumbersome, dilatory anddiscretionary. On average until 1985, about 50 percent of the application forcapacity licenses were approved within three months stipulated and about thethird took more than six months. Even within the sphere permitted to the MRTPfirms, the clearance procedure was so stringent that between 1982 and 1984,for example, the approval rate of industrial license application was only 25percent - roughly half that of companies in general and the processing timewas generally longer - between one to two years.
4.69 Restricts on expansion and on introduction of new products by theexisting firms appeared to be even more severe than those on entry. Realizingthe bias towards "newness", firms tended to apply for licenses to build a newplant and produce a new product rather than expand and specialize, resultingin excessive diversification and industrial fragmentation.
4.70 The consequences of price controls were also adverse. The wayprices were fixed rarely provided any incentives to generate costeffectiveness. In addition, with few exceptions, where long term costs wereused, most pricing schemes were backward looking, being rooted in historicalcosts. A method of setting prices had created numerous anomalous situationsu,ch as uniform prices for all plants for a given product (e.g. steel)irrespective of the cost conditions in each or different prices for different
33/ Ahluwalia I, Industrial Growth in India. Stagnation since the mid-sixties, 1985 Op. Cit.

-58-
plants for the same product, depending on the obsolescence of the plant (e.g.fertilizers), or different prices for the same product from a given plant(e.g. levy and non-levy) .2W
4.71 The price control policy had many adverse consequences for thegrowth of private industrial investment and output shortages emergedfrequently in consumer goods industries like hydrogenated vegetables, subjectto price controls. Less than warranted increases in prices, as in the case ofsteel during the 1960s and 1970s, attenuated internal resource generationthereby impeding modernization, efficiency, and technological progress. As aresult, the steel industry could barely recover its variable costs, if facedwith the tariff-free imports, not to speak of the bias of price control policytowards uneconomic size of production in several industries.
4.72 It is clear from several BICP studies that the cost-plus method ofpricing for international products and raw material such as benzene orammonia, led to escalation of the cost of the downstream production making ituncompetitive in international markets. This has been well illustrated in thecase of caprolactum. Though the cost of final product on the basis ofnormative judgement compared favorably with its international prices, theactual cost exceeded the normative cost by as much as 100 percent - onlybecause of the high cost of inputs derived from cost-plus formula. Again, thesystem of administered prices contributed. V to an escalation of capitalcosts in many industries (ADB-1990). An analysis of fertilizer pricingdemonstrated that uniit-wise plan specific retention pricing did not provideany incentives whatsoever for the project authorities to keep capital costsdown since the pricing guaranteed an adequate return.
4.73 The promotional policy had also many pitfalls. SSIs which wereprotected under that: policy, from medium-sized and larger firms in themanufacture of reserved products could not grow beyond a certain size. As aresult, they could not modernize or specialize. Limitation on their linkageswith larger firms also discouraged them from seeking technological upgrading.The preferential policy for backward area development through location ofindustries paid somei dividends over the years but some inconsistency inoperating that policy tended to reduce its impact. For instance, central,state and municipal regulations designed to preserve existing jobs andemployment levels imposed severe strains on relocation despite the fact thatdispersion would reduce urban congestion. In particular, state and municipalcontrols on closing plants were often the main barriers to industrialdecentralization.
2W Kelkar Vigay, Kumar Ragiv 1990. Industrial Growth in the Eighties:Emerging Policy Issues", Economic and Political Weekly, January 27, pp.209-22.
I./ Kelkar Vigay, Kumar Ragiv, Rita Nangia, 1990. "India's IndustrialPolicies, Performance and Reforms, BICP", New Delhi.

-59-
4.74 The nature of labor market policy and the manner in which it wasimplemented contributed to greater capital intensity in industry and to rentseeking by the workers to the detriment of the efficient growth of theindustrial sector. Since labor regulations affected large firms where wagerates tended to exceed those in the unorganized sector, the net result was theprotection of relatively privileged workers and to encourage capital intensityin the organized sector. Employment in the organized sector also attractedconsiderable economic rent because entry was limited in product market andth,at policy intervention in labor market helped to preserve existingemlployment. Besides, the actions of the government, being a large employer,had significant effects on the working conditions, pay scales, and othercharacteristics of the labor market..I/ The wage rates in the public sectorfirms, operating as they did in a non-competitive environment shared some ofthe economic rents with labor. As a result of this, there had been an upwardpressure on wage levels all around in the industrial sector. By contrast, theinformal sector was relatively less hampered by labor market constraints. Inview of the prevailing practices of contract and piece rate basis of wagefixation, the wage rate was more variable in the informal sector than in theorganized industrial sector.
Indonesia
4.75 The leitmotif of the entire regulatory apparatus had been to promoteindustrialization with diversity of output -- heavy and basic goods,intermediate products, local entrepreneurship, self-sufficiency, and balancedregional development. Therefore, whether or not these objectives wereaccomplished would test the usefulness of the regulatory policies. This couldbe viewed from two perspectives: first, how well or badly the regulatorysystem operated in practice, and second, how far the objectives were achieved.Before moving on to these aspects, it will be useful to see trends in-industrial output, value added, and the private sector investment asinfluenced by the regulatory policies.
4.76 Private sector investment in Indonesia always exceeded that in thepublic sector by a large margin. This was not surprising because of thepredominance of agriculture and services in the private sector. Perhaps dueto the deliberate policy of industrialization of import substitution type,manufacturing sector increased faster during the 1970s. (Appendix I -Indonesia: Table 2). The rate of output in the manufacturing sector was ataverage 7.9X in the 1970s, which was far higher than in countries like Indiain a comparable period. Even value added in manufacturing was at a highlevel. (Appendix I - Indonesia: Table 2). Along with the faster rise inindlustrial output, the pattern of industrial output changed along the linesexpected by the Five Year Plans, with the expansion of heavy and basic
36_/ "... average wages for the unskilled are higher in the public sector thanthe private sector in India. What is more, average real earnings ingovernment have shown a phenomenal rise in the 1970s and 1980s; privateisector trends are very modest by comparison." Gus Edgren, The GrowingSector, IID, New Delhi, 1988.

-60-
industries. While the manufacturing sector, particularly in the privatesector grew, it was at high cost, and not quite in an efficient manner as willbe evident from the discussion that follows.
4.77 The manner in which the licensing system was operated determined inthe ultimate analysis the magnitude and efficiency of the industrial growth.Though all licensing regulations in all countries are cumbersome, complex, andtime consuming, the paraphernalia of regulations in Indonesia was particularlyirksome and counterproductive. This occurred not because the licenses werenumerous but because, every license issued was associated with detailed and,at times, redundant documentation as a precondition for other licenses fromdifferent layers of governmental authority. For example, documentation inseveral layers filled pages from 25 to 100 pages. The BKPMs approval wasrequired not only for original license, but for all subsequent modificationseven of a minor nature to the approved projects. The process of BKPMclarification of regulations and issues also tended to be slow; the BKPMrulings on simple matters often required six months. Furthermore, theserulings were not always clear and it was not unusual for those rulings to becountermanded by the ministries concerned. Despite the availability ofstandard forms, the procedures remained complex because with earlymodification, several additional documents in multiple copies were required tobe submitted. This was true of the licenses from the BRO also.
4.78 Manufacturing firms had to have a regular contact with tax officialsin order to obtain letters or permits for how their inventories were valuatedand the tax relief obtained. As if this was not enough, the enterprises wererequired to procure the mandatory environment licenses. In some cases, thefirms operated on temporary licenses extended repeatedly while in some others,it took several years to get the permanent licenses. In addition, licensesfrom the provincial authorities on pollution were a requirement. Thus a majortime of the entrepreneur and the enterprise management was spent in tidying upthe licensing procedures and little time to operate the enterprise, inresponse to changing market signals. The difficulties of the investors werealso compounded by the complexities and adversarial labor market policy, lackof transparency in corporate legal structure, and the almost insurmountablebarriers, posed by land use policies.
4.79 Thus a major problem with laws and regulations was that they werecouched in broad terms, and often, in ways that were ambiguous or unsuited forthe current industrial structure. Consequently, several regulations requiredmore clarifying regulations and clarification often turned out contradictory.Furthermore, the system was so designed that some licenses were dependant uponother licenses, which in turn depended on yet others. Thus the officialsoften tended to cut through the delays by granting exemption or makingadditional policy announcements.
4.80 Apart fromn the ineffectiveness of the regulatory policies, they didnot even facilitate the attainment of objectives the government had set foritself. First, industrial licenses designed to control excess capacity byfine tuning supply and demand did not appear to have succeeded. Thus the meanvalue of capacity utilization in the manufacturing sector in 1974-75 was28.18X, 32.21X in the private sector consisting of foreign firms, 27.181 in

-61-
domestic firms, 36.4X in the public enterprises. The licenses, throughbarr:Lers to entry protected firms that would otherwise have failed. Second,there was not general market concentration, though in a few industries, therewas a semblance of monopoly. In glass and glass products, four-firmscontributed in 1974-75, 71X of total value added and in nonferrous metal, 5firms contributed 81X of total value-added. However, general lack ofconcentration was not reflective of competitive conditions in Indonesianindustry; it was more a manifestation of less than optimum size of plants invarious industries--a direct effect of the licensing policies. For example,in 1974-75 as many as 1,218, i.e. 84X of all firms in food manufacturingse,ctor accounted for 42X of the sector's output.
4.81 It was also evident that the objective of regional development wasnot achieved despite the various incentives by the BKPM to locate industriesoutside Java. There had been little regional dispersion of industry to otherislands. In fact, as much as 851 of the private sector manufacturing firmswere located in Java as of 1974-75. This was because an industrial licenseacted as a one-edged weapon, which could cut in entry into Java, but by itselfco,uld not cut investment out of Java to other islands. The day-to-day contactwith various Government agencies necessitated by the regulatory system alsoacted as a powerful disincentive to regional dispersion.
4.82 On the whole, the licensing system, far from achieving its setgoals, imposed a very high cost on industrial development and what was more,tbhis cost was largely borne by the economically weak firms and entrepreneursfor whom part of the system was originally conceived. These costs includedbiases in favor of large but suboptimal firms, sprawling bureaucracy toadminister the system, diversion of skilled manpower to unproductive, rent-seeking activities and undue prolongation of project completion. All thesemilitated against the growth of productive, forward-looking and modernmanufacturing sector.
4.83 The policy toward direct foreign investment was equallycounterproductive. The restrictions on foreign participation in distribution,and marketing led to the creation of relatively high cost Indonesiandistribution firms, resulting in higher retail prices. Moreover, the absenceof foreign distribution firms prevented Indonesians from developing therequired marketing skills which could best be learned by on-the-job trainingunder experienced management. Apart from this, it was in areas such asequipment and engineering design, financial control, before and after salesservices, technology update, etc., that the domestic firms and entrepreneurswere greatly disadvantaged, thereby leading to low efficiency and productivityof institutions and industries.
4.84 Restrictions on ownership created rents for local partners, whenthey were avoided by using local firms or individuals as front covers. Equitysharing limitations were overtly satisfied by allowing local partners topurchase shares on the basis of a loan from the foreign partners, allshareholders' rights were held by the foreign investors until the indefiniteterm loan was replaced. Thus, these practices, while generating rents,stymied the growth of the entrepreneurial talent in the country.

-62-
4.85 The adverse impact on FDI policy emanated also from the way it wasperceived by the foreign firms. Foreign investors interpreted new policy toimply that the initial share of Indonesian equity could be between 10-20X atthe start of the project, and could be increased to 30-60X at the end of tenyears, but in practice the "start" of a project varied from one project to theother or according to what the BKPN could decide. In some cases, BKPMstipulated that the ten-year period should start from the moment it hadapproved the investment application, while in some other, from the momentcommercial production had commenced. Besides the foreign firms remainedunclear as to whether the regulations contained in new policy applied to thetotal amount of foreign equity or only to the expansion of an existingproject.
4.86 In view of the restrictive nature of the policy towards FDI,technology transfer to Indonesia was greatly hampered. Firms which protectedproduction and management secrets were loathe to invest in areas where theircontrol of the knowledge was threatened by being asked to transfer controllingownership shares to local firms or individuals.
4.87 The Local Content Program (LCP) together with investment licensing,passive labor market policy, restrictive policy toward foreign investment,etc., also contributed in no small measure, to the establishment of anoncompetitive industrial structure in Indonesia and to the distortions ofmarket incentives. The reasons for this were: the timetables set for thelocal production were so short for the development of the local productioncapability that the imported inputs at very high tariffs became necessary.Rise in prices of final products subject to LCP due to import bans, the use ofthe master list system and other license procedures informally and in adiscretionary manner to force the local production even at a higher cost wereinevitable consequences.
4.88 The whole set of land-use and land tenure regulations has imposedformidable barriers to the entry of firms particularly small and medium scaleand foreign investors unfamiliar with the business environment in Indonesia.The land rights could not be used as collateral for bank loans. Landacquisition could also become a very costly and time-consuming operation. Forinstance, the prevailing procedures for obtaining land for a medium to largescale investment project required forty-one letters of approval..2/
4.89 All in all, thus, Indonesia succeeded through the use of itsdomestic regulatory system in industrializing itself not in tune with its planobjectives, not even in directions contemplated by the regulations, not insubserving the interests of the vulnerable sections of its society. The costof this was very high, the resources were wasted on a large scale and the paceof the economy's advance was stalled. It was only when the economy was shakenup by external shocks like sharp fall in oil prices towards the beginning of
IV Das Gupta D. Enternrise Regulation Reforms in Indonesia. 1983-90(mimeograph) 1991, World Bank, Washington, D.C.

-63-
1980s, that the authorities realized the need to dismantle the regimen ofregulations and restrictions in order to provide an impetus to the industrialdevelopment.
The Philippines
4.90 The industrial output, manufacturing output and its pattern showedimportant gains (Appendix I: The Philippines, Table 2) but the pre-1983incentive system was responsible for debilitating the industrializationprocess in several ways. First, the measured capacity approach restricteddomestic competition and encouraged inefficiency in "full industries".Second, the objectives and the implementation of the land tended to favorimport-substituting activities over export activities. Third, the incentivesprovided were largely "capital cheapening" and encouraged capital intensiveinvestment projects. Fourth, the incentives tended to regard the act ofinvestment rather than the efficient operation of the newly-establishedcapacity. Some research studies have produced a compelling evidence that theregulatory and the faulty incentive system contributed greatly to seriousinefficiency in the sectoral structure of the economy.
4.91 The Government intervention in trade and industry led to all rounddistortions in the economy. BOI incentives and investment regulations werefound to be arbitrary and affected factor choice to favor capital intensiveproduction. This tendency was supported by a regulated financial systemproducing negative real interest rates over most of the 1970s on the one hand,and a system of preferential access to credit from financial institutions onthe other. The industrial growths was oriented towards sector, whereprofitability was artificially boosted by distortionary trade intervention.
4.92 There were several incentives provided for SMEs. Despite the longhistory of these schemes and the favorable loan default record, private formallending institutions did not become involved in SME financing because ofperceived risks, high administrative cash and high support services requiredto evaluate loans and supervise progress. Financial support for SMEs failedto address the binding constraints on these enterprises, such as price andavailability of raw materials which were affected by regulations governingintermediate imports.
4.93 Domestic price controls affected the performance of the domesticwage goods industries and also covered construction materials, such as cementand steel. Even when controls on these latter were formally removed, theystill remained under industry authority restraints. Partly as a result ofprice controls, government became involved in institutionalized wage settingnegotiations and hence in determination of real wages. On the whole, thevarious interventions in industry combined to produce an opaque incentiveenvironment, characterized by high variance of inter- and intra-sectorincentives, which ultimately resulted in creating a brittle industrialstructure.
4.94 There had been other evidence that suggested that manufacturing wasinefficient during the 1970s. The domestic resource cost (DRC) in a varietyof industries like home appliances, fabrics, fibre, etc had been negative in
-64-
1980. Likewise the estimated cost of completely knocked down kits for theauto industry sometimes exceeded the cost of the assembled car. Clearly inthese cases, sectoral growth did not reflect higher economic welfare.
4.95 Inefficient use of resource was also seen in the trends in totalfactor productivity. Thus, total factor productivity was negative between1971-80 i.e. -1.2 per years. The negative TFP reflected a shift fromindustries with high productivity to those with low productivity. Theproductivity slowed down in the 1970s was also seen in the fall of bothprofitability and real wages.
Sri Lanka
4.96 The import-substitution strategy led to quite impressive growth ofmanufacturing output. It grew at an average rate of 12.4 percent during 1970-77 of a pre-reform period. The value added, however, was insignificant asreflected in the average rate of growth of any 1.7 percent in the same period(Appendix I: Sri Lanka Table 2). The pattern of manufacturing output alsochanged with higher rate of growth of basic goods and intermediate goods.However, the state-sponsored industrialization had several negativeconsequences. First, growth of output Rer se became synonymous withsuccessful industrialization, regardless of economic efficiency. The highercost of domestic industrial production severely taxed the absorptive capacityof an already small market and ruled out production for foreign markets. As aconsequence, sustainable industrial growth was not achieved. For lack of dataon the DRCs or EPRs or factors productivity, total and labor for the pre-reform period, it is not possible to precisely indicate the high cost ofindustrial growth. Second, unable to compete with imports, the PublicManufacturing Enterprises (PMEs) lobbied for protection. This was readilyprovided, since the interests of the industrial sector were equated with thoseof the state. High PME protection was an important factor in creating thenegative protection in a number of sectors which preempted the development ofpotentially competitive input-substituting and export-oriented industries.Finally, the direct employment that the new industrial sector was able togenerate was limited by the high capital cost per worker. Public industrialprojects started through the 1950s, for example, to produce caustic soda,chlorine, sugar etc required investment of US$180 million (at 1987 prices) andprovided employment to only 3,000 men i.e. an average capital requirement ofUS$60,000 per worker.
4.97 The anti-market bias of the industrial policy encouraged capitalflight; it was also the main cause of low level of private investment, bothforeign and domestic, that led investment in the economy to depend on theGovernment's expenditure program and Sri Lanka to become an aid-dependentcountry. It also had a particularly damaging effect on industrialization asthe country was deprived of the technical and managerial know-how as well asthe access to foreign markets that generally accompanied foreign investment.Besides in the excessively regulated environment, there was a high premium onknowing how to deal with the government bureaucracy. A whole generation ofentrepreneurs had to develop expertise in the intricacies of the Governmentbureaucracy than in developing markets and reaching to market signals.

-65-
4.98 The Government tried to assist SMEs to overcome obstacles in accessto credit by asking banks under directed credit programs to provide themsubsidized credit. It was generally believed that banks were usuallyeffective in disbursing World Bank credits for SHEs. A recent study singledout Sri Lanka as a model of an aggressive entrepreneurial lendingprogram..JI However this perception was not universally shared. Whilesome sectors of SMEs might have been the beneficiaries of subsidized bankcredit, some like the leather and ceramic industries probably were left out ofthis credit program. As regards the bureaucratic intervention, though ingeneral it was not hampering the growth of SMEs, in particular industries likegems, it proved to be a formidable obstacle. The cumbersome bureaucraticcontrols on export and import of gemstone remained and many entrepreneursspent about half their time just to go through bureaucratic procedures.
BaLngladesh
4.99 The extreme difficulties found in collecting quantitative measures,as also non-availability of historical qualitative information makes itdifficult to trace the consequences of domestic regulatory policy. All thatc:an be said for the regulatory policies until 1982 when there was a first stabaLt reform, is that they were inevitable in the aftermath of BangladeshIndependence when the country was in shambles with abandoned plants, hostileabsentee owners, the disruption of supply and material rehabilitation for mostenterprises. The Government intervention brought the public enterprises tothe fore as evident from the fact that 75 percent of total investment inBangladesh. was in the public sector, but so dominating was the public sectorthat even after the onset of regulatory policy reform since 1982, the privatesector could not advance much even until 1990.
4.100 The rate of industrial production (no private sector figure areatvailable) was respectable at around 8 percent during the 1970s; but this rateis more deceptive as the base from which the industrial production started wassmall. The emphasis remained mainly on basic goods (Appendix I - Bangladesh:T'able 2). If the efficiency of manufacturing sector could be judged by laborproductivity, for which some information is available, it declined by averageof .-5 percent per annum in the 1970s.
4.101 However, the onus of the Bangladesh private industrialdevelopment could not be placed on the regulatory policies. The whole countrywas in a transition with array of political and social problems. Besides, theinfrastructure was dilapidated, and continued to be so even today; this meantthat even if the regulatory policies were friendly to the private industries,they could not have progressed beyond what they did in fact.
]j/ Webster. L., World Banking Lending to Small and Medium EnterRrise:Fifteen Years of Experience. 1989, Industry and Energy Department Workingpaper Series No. 20, World Bank, Washington, D.C.

- 66 -
V. INDUSTRIAL POLICY REFORM AND ITS IMPACT
5.1 As observed in Section IV, though some of the problems faced bythese countries assunied serious proportion because of the adverse changes inmacroeconomic environment except perhaps in Indonesia, it was largely theregulatory policies heavily loaded with discretionary elements which createdserious distortions in these economies. It was to obviate these structuraldeficiencies in the industrial sector that the authorities in these countriesinitiated deregulation, gradually in some cases and accelerated in others, butwith the same concern for achieving a higher and efficient industrial growth.
Industrial Regulatory Policy Reform
India
5.2 Realizing that it was imperative to prevent deceleration inindustrial growth and. to provide a renewed impetus to its sustained futureadvance, the Indian authorities shifted the emphasis in their economicpolicies from the volume of investment to its efficiency. Furthermore, itbecame increasingly evident that the government could not bear the heavyburden of financing investment and directing it along desired lines because ofthe deteriorating fiscal situation. Both these factors worked towardsrelaxation of government controls over private industrial sector, withoutdiluting the commitment to the earlier objective of growth, self-reliance andthe dominance of the public sector in economic management.
5.3 The industrial regulatory reform occurred in a gradual and piecemealfashion, starting from the mid-1970s and then gathering greater momentum inthe later half of 1980s (Appendix II-A). The characteristic feature of thederegulation was that it was started in isolation from the prevailing trade,particularly import regime, which changed a little. The central element ofderegulation particularly since mid-1980s was in regard to relaxation ofadministrative restrictions against entry, expansion, diversification, foreigntechnology acquisitions and more generally flexible business operations at thefirm level. There was some modest liberalization of foreign investment policybut a status quo in tlhe realm of labor market policy was maintained, with somecosmetic changes.
5.4 Industrial 'licensing procedures were first relaxed in 1975-76, but adegree of delicensing was limited; it was accelerated since 1985. Delicensingtook two main forms: delicensing of investment in certain industries anddelicensing of projecl:s below a given size. At the beginning, though bothtypes of deregulation were undertaken, they were saddled with so manyconditions that their operational impact was minimal. For example,delicensing covered 24 narrowly specified industries in the group of non-MRTP/FERA companies but it excluded projects which used imported raw materialor capital goods. Besides only the projects of up to Rs 10 million before1978 and Rs 30 million until 1983 and Rs 50 million thereafter but not thosein large cities were delicensed. It was only in 1985 that major steps weretaken in industrial delicensing. Twenty-five industries were exemptedinitially from licensing and more were added subsequently to this list. Also,

- 67 -
22 industries in which MRTP and FERA companies were encouraged to invest weredelicensed subject to the condition that their projects were located inbackward areas. The scope of delicensing continued to be enlarged until 1987,by bringing in more industries so long as they could import less than 15percent of their inputs or the maximum of Rs 7.5 million per annum and as aresult a part of manufacturing sector, producing roughly 20 percent of valueadded was excluded for the industrial licensing procedures.
5.5 In 1988 (June), the projects of non-MRTP/FERA companies up to theinvestment limit of Rs 150 million in non-backward areas and Rs 500 million inbackward areas were exempted from licensing. But licensing was relaxed in 27industries, including major ones like textiles, sugar, leather, steel,telecommunications equipment, motor vehicles and chemical products. However,stringent micro location stipulations had to be met to be eligible fordelicensing. The Industrial Policy as announced towards the end of 1990, theceiLing for general delicensing was sharply raised to Rs 250 million forbackward areas. All micro-location conditions were eliminated except for astipulation that projects had to be at least 20 km from India's four largestcities. For delicensed projects, import of capital equipment could be up tothe maximuAm of 30 percent of the total value of plant and equipment andimported raw material up to 30 percent of the annual value of ex-factoryproduction. One demerit of the policy, however, was the announced eliminationof industry-specific delicensing that all projects above the size ceilingwould require an industrial license even in previously delicensed industry.With these changes, the real ceilings on project size for delicensing wereexpected to be almost tripled. However, 1990 measures were never implementedannouncement rather. (Most of these were implemented in 1991, as will beliscussed later in this section.).
5.6 Restrictions against expansion and diversification by existing firmsalso were weakened in 1982-1986 period. Automatic endorsement of productioniLncreases were introduced, under which firms were allowed to raise theirlicensed capacity by 4/3 of their highest annual production in the precedingfive years, provided it was at least 80 percent of previous licensed capacity.These schemes appeared to have enhanced the flexibility of firms to expand.The major vehicle used to allow firms to diversify and to engage in newproduct development had been broadbandings under which firms could produce anygoods in a given group of products if they had a license to produce one ofthem. By 1990, a total of 45 industries were broadbanded, which was asubstantial improvement over 16 industries which were broadbanded first timein 1975
5.7 The minimum economic scale scheme (MES), introduced first in 1985affected both entry and expansion. Under the scheme it was specified that new:Lnvestments and most expainsion investments would not be permitted below aminimum size in order to enable those plants to enjoy the economies of scaleor at least avoid the diseconomy of less than optimum size plants. ClearancefEor projects at or above MES was not automatic, but there was apparently afast track approach to many industries with a presumption that approval wouldbe granted especially in the case of expansion projects to MES level. By1989, MES list was widened to cover a total of 108 products. There were somejanomalies in the MES list, such as use of the same MES level for heavy and

- 68 -
light commercial vehicles unlike in other countries where different scaleshave been prescribed for technologically different categories of industries.Overall, the reform of domestic industrial regulatory policy was in the rightdirection, despite the fact that each aspect of reform was accompanied by somecondition or other which detracted from its merit. The discretionary elementsin operating that policy remained as strong as ever.
5.8 Price controls policy was first changed in 1975, when prices onautomobiles were decontrolled. Gradual decontrol of cement prices began in1982, through the device of letting producers sell a certain portion of outputon open markets at free market prices. The percentage of "levy" cement soldat controlled prices was reduced in subsequent years, and the controlledprices were also raised. By early 1989, cement prices were virtuallydecontrolled as the levy part of cement production was very small. In thecase of sugar and steel, much smaller proportionate reduction in the share ofoutput subject to price controls occurred in the 1980s. There was no progressin regard to price decontrol for chemical fertilizers. For pharmaceuticals,price controls remained in place and the efforts to facilitate approvals ofprice increase on a cost basis did not seem to have worked well. On the otherhand, price and distribution controls for aluminum were removed in early 1989.On the whole, there were few producers in the organized private manufacturingsector who were much affected by price controls on their outputs, and thosewho were, were concentrated in a few industries. On the input side, some keybasic goods and infrastructural services were supplied to the manufacturingsector by public enterprises on a monopoly or quasi-monopoly basis, at a highcost or with severe quality and delivery problems. This has created seriousinflation as, high prices in the upstream sector got built into the coststructure of the entire Indian industry.
5.9 FERA Act had imposed, as observed earlier, severe restrictions onactivities of firms controlled by foreign entities with at least 40 percent ofequity holding. One -vehicle of reforms in this area had been expansion of thelist of industries in which FERA firms were encouraged to develop. In 1973,19 industries were designated as being open for investment by the FERAcompanies (along with the MRTP companies). Investment by these companieswould also be considered favorably in other industries, if they were willingto promote exports. :FERA companies were also made eligible for broad banding.Not much relaxation oE FERA companies had occurred in recent years, other thanindustrial delicensing measures which also applied to them. In late 1984,clearance for establiishment of export-oriented production units by FERAcompanies was no longear required if only their all output including rejectswas exported. In 1990 Industrial Policy, automatic clearance for undertakingup to 40 percent for fEoreign equity investment was announced as long as 30percent of the total value of plant and equipment was imported.
5.10 Restrictions against foreign technology acquisitions were dilutedconsiderably. This was done not so much through formal measures as through amore positive attitude on the part of the authority toward applications forforeign collaboration, especially in designated "Thrust industries". For someproducts and industries, applications for foreign collaborators were routinelyapproved, whereas for others they continued to be discouraged. In the 1990Industrial Policy Statement, which, however, was not put in practice, it was

-69 -
anmounced that government clearance for foreign collaboration applicationswould be automatic, provided that there was no lump sum royalty payment andthat royalties did not exceed 5 percent of sale value for domestic productionand 8 percent in the case of production for export.
5.11 Two track approach was taken in designing promotional policy: firstto develop industry in the backward areas and second to encourage small scaleindustry. This approach was characterized by both positive and negativeaspects.
5.12 Government policy toward backward areas has moved away from generalexpression of concern towards financial incentives, to more directadministrative measures to investments in underdeveloped areas. In 1971, thecentral government officially declared 217 districts as backward, a numberwhich was subsequently increased to 262, accounting for 70 percent of thetotal land area and 59 percent of the Indian population. In the 1970s, anumber of incentive schemes were put in place, including the CentralInvestment Subsidy (CIS), which provided a 15 percent subsidy on investmentcosts to certain backward areas, up to a maximum of Rs 1.5 million; a 20percent reduction in corporate profit tax for a period of five years; loansfrom all-India financial institutions carrying 1.5 percent for a lowerinterest rate charges than ordinary term loans and an array of stategovernment incentives. Of all these measures, subsidized lending had beenquantitatively the most important. In 1988, the CIS was terminated in orderto replace it with a new version of Growth Center Schemes (GCS) under whichsuch centers would be located in backward areas that had better infrastructurefacilities and better potential for industrial development. But this schemenever took off the ground.
5.13 In the 1980s, delicensing served increasingly as a tool forencouraging location of investment projects in backward areas. Projects belowRs 500 million in backward areas were delicensed in 1988 but this was madesubject to many micro conditions like minimum distance from metropolitan areasetc.. At least as important as the location bias of formal delicensingmeasures was the tendency of the regulatory authorities to discourage licenseapplications in developed areas and that of local governments not to providelands for such investments. The 1990 Industrial Policy indicated that most ofthe micro-conditions attached to delicensing for a locational purposes wouldbe abolished.
5.14 Promotion of the Small Scale Industry (SSI) was one of the dominantobjectives of economic policy for alleviating poverty through increasedemployment, and for encouraging labor intensive techniques of production.India's SSI policies generally seemed to have concentrated on the micro-level,the short run and static aspects. The instruments used were productreservations, fiscal incentives, subsidized institutional credit, preferentialprocurement of output and supply of inputs, industrial estates and setting upof District Industry Centers (DICS). Since the late 1970s, a total of morethan 800 goods were reserved for SSIs constituting about 15 percent of theindustrial goods produced by the SSI sector. The schemes of fiscal incentivesin place involved full exemption from central excise duty for sale up to Rs2.0 million annually if production were included under one head in the Central

- 70 -
Excise Tariff, Rs 3.0 million if they fell under more than one head. Therewas rebate of excise duty of 10 percent of sales value for additional sales upto a total Rs 7.5 million beyond which there was no reduction.
5.15 The main vehicle for provision of subsidized credit to the SSIsector was the development financial institutions such as the State FinanceCorporation (SFCs), Small Industries Development Bank of India (SIDBI) and thedirected programs administered by the nationalized commercial banks. Asregards the preferential procurement of output, 404 products were reserved by1982-83 for central government procurement exclusively from the SSI units. Inaddition, SSIs would receive a 15 percent price preferences in competitiveprocurement. State governments, in addition, instituted similar but smallerprice preferences. 'While these procurement schemes provided support to theSSI sector, they accounted for only 1 percent of total output of that sector.
5.16 A program for setting up Industrial Estates, first initiated in1955, gathered strength in 1970s and 1980s, though they accounted for only 5percent of total output and 4.5 percent of employment in the SSI sector. TheDICs, which were supposed to provide nodal agency at which small entrepreneurswould have access to assistance and advice were established in virtually alldistricts in India. They achieved superficially considerable success, with alarge number of new enterprise starts and increases in employment.
5.17 The objective of the present regulatory regime had been very much toprotect interests of labor, once it was in employment and at any cost. Thelegal and regulatory framework of labor market management was verycomprehensive, embracing terms of employment, retrenchment of labor, wagefixation, working conditions, union formation and host of other bearing onemployment of labor as a whole.
Indonesia
5.18 The distort:ions in the incentive framework in the past, be they fromthe trade policy regime, or domestic pricing and regulatory policies or thefinancial sector policies, leading eventually to widespread inefficiencies inresource allocation aLnd stunting the growth of the private sector assumedserious proportions with the rise in oil prices in early 1980s. Theauthorities also were faced with serious macroeconomic imbalances to counterthese difficulties. The Government adopted wide-ranging policy measures,directed toward improving macroeconomic environment conducive to the growth ofthe private sector and over-all economy and deregulation of the restrictivesystem -- domestic and trade. As a result, the incentive framework wasconsiderably improved. Broad details of reforms in the various fields ofdomestic regulatory systems culled from various studies in the Bank are givenbelow (see Appendix II-B Indonesia).
5.19 At the heart of the highly restrictive investment licensing schemethat prevailed in the early 1980s was the Investment Priority List (DSP),which regulated entry into specific lines of activity for both foreign anddomestic investment. Three distinct and successive phases of reform wereundertaken starting in 1985 to deregulate the entry and mobility of private

- 71 -
investment: (a) streamlining the investment approval procedure; (b) openingup of more fields of investment, and expansion of capacity to existing firms;and (c) shift to a small negative list.
5.20 In 1985, the investment approval procedures followed by the BKPM,the Investment Coordinating Board, were streamlined and simplified. Thisreform pared down by half the procedural requirements under the old system,involving as long as two years from the stage of the investment proposed.BKPM's role as a one-step service for investors was also strengthened bygiving it executive authority to issue most of the major licenses required inaddition to the investment licenses. In 1986, the fields of investment opento various categories of private investment were specified more clearly andthe number of areas open to domestic and foreign investment were substantiallyexpanded. This was followed by a number of reforms to reduce barriers toentry and mobility of private investment, such as: (a) automatic approval tofirms to expand production by up to 30 percent of their licensed capacity;(b) nBroadbanding' of investment categories, thereby permitting firms todiversify production; (c) opening additional fields of investments; and (d)streamlining further the investment licensing procedures, e.g. extending thevalidity of the operating license for the entire life of the plant.
5.21 A somewhat innovative measure was introduced in 1989, with anintroduction of a short negative list for investment proposals. This practicehas now been adopted in India, Sri Lanka and Bangladesh. Even withmodification and frequent revisions, the DSP list remained incomplete, andnon-transparent, allowing considerable discretion in granting investmentapprovals and licensing. In formulating a negative investment list, theattempt was made to keep the number of restricted sectors to a minimum and toreduce ad-hoc restrictions that had been introduced earlier. Two additionalfeatures were: (a) it did not distinguish between domestic investment thatcould be processed by BKPM (i.e. PMDN investment) and non-PMDN domesticirLvestment for which discretionary approval was essential; and (b) all areasthat were open to domestic investments were also made open to foreignirLvestment in manufacturing. As the following list shows, the vast majorityof investment categories were opened up to domestic and foreign PMAirnvestment, and unspecified areas were eliminated. There are now only some1,301 investment categories which were kept open only to small-scalemanufacturing.
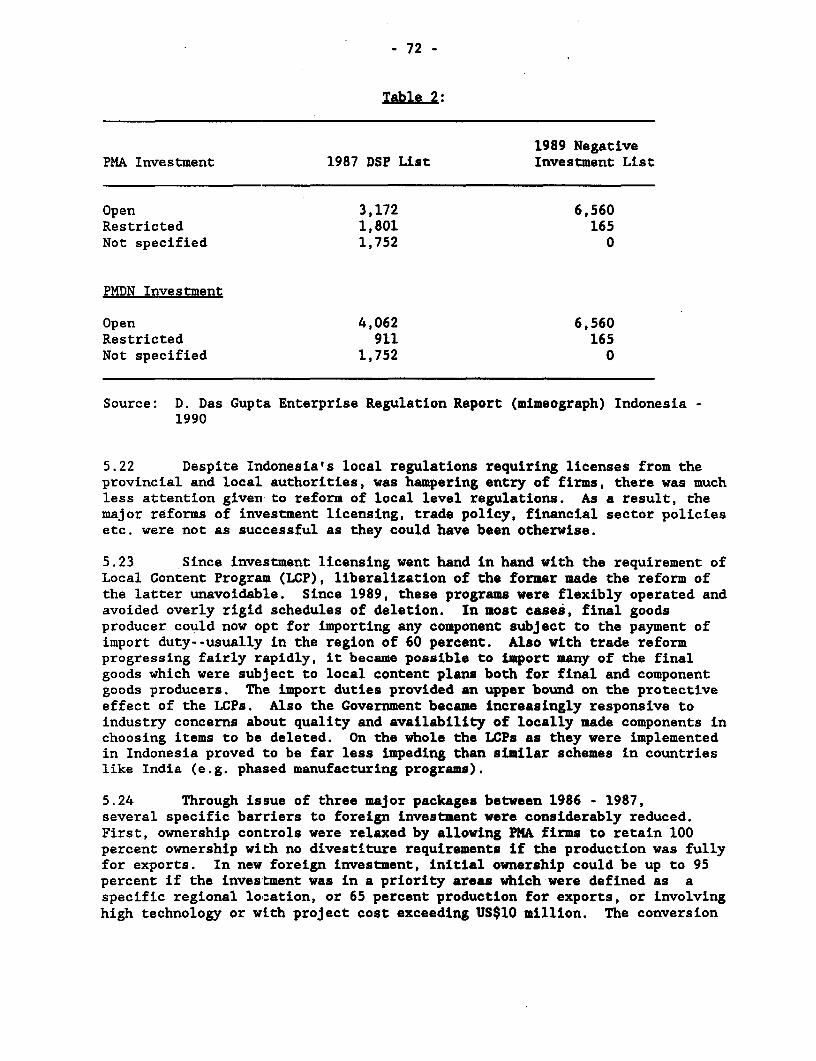
- 72 -
Table 2:
1989 NegativePMA Investment 1987 DSP List Investment List
Open 3,172 6,560Restricted 1,801 165Not specified 1,752 0
PMDN Investment
Open 4,062 6,560Restricted 911 165Not specified 1,752 0
Source: D. Das Gupta Enterprise Regulation Report (mimeograph) Indonesia -1990
5.22 Despite Indonesia's local regulations requiring licenses from theprovincial and local authorities, was hampering entry of firms, there was muchless attention given to reform of local level regulations. As a result, themajor reforms of investment licensing, trade policy, financial sector policiesetc. were not as successful as they could have been otherwise.
5.23 Since investment licensing went hand in hand with the requirement ofLocal Content Program (LCP), liberalization of the former made the reform ofthe latter unavoidable. Since 1989, these programs were flexibly operated andavoided overly rigid schedules of deletion. In most cases, final goodsproducer could now opt for importing any component subject to the payment ofimport duty--usually in the region of 60 percent. Also with trade reformprogressing fairly rapidly, it became possible to import many of the finalgoods which were subject to local content plans both for final and componentgoods producers. The import duties provided an upper bound on the protectiveeffect of the LCPs. Also the Government became increasingly responsive toindustry concerns about quality and availability of locally made components inchoosing items to be deleted. On the whole the LCPs as they were implementedin Indonesia proved to be far less impeding than similar schemes in countrieslike India (e.g. phased manufacturing programs).
5.24 Through issue of three major packages between 1986 - 1987,several specific barriers to foreign investment were considerably reduced.First, ownership controls were relaxed by allowing PMA firms to retain 100percent ownership with no divestiture requirements if the production was fullyfor exports. In new foreign investment, initial ownership could be up to 95percent if the investment was in a priority areas which were defined as aspecific regional location, or 65 percent production for exports, or involvinghigh technology or with project cost exceeding US$10 million. The conversion

73 -
period for domestic majority ownership was extended from 10 to 15 years.Second, new policy permitted purchase of local firms if investment was in apriority area and provided 20 percent of equity remains under domesticownership. Three, distinction between a PNA4 and PNDN firms was reduced bygranting the PMA firms PMDN status, if they had 51 percent local ownership or45 percent local ownership with 20 percent of their shares listed in thedomestic stock exchanges. Four, foreign firms were granted equal access toexport credits and swap facilities for foreign exchange risk cover; five, PMAfirms were allowed to market export goods freely; foreign firms were permittedto export goods in joint venture with Indonesian firms; PNA firms were allowedto sell domestically in a joint venture with local firms. Six, minimuminvestment requirement by foreign investors was reduced from US$1 million toUS$25,000. Seven, the share of permitted foreign ownership in agriculture wasraised to 40 percent, and restrictions on employment of expatriates by firmsexporting 65 percent of their production were removed. Over and above allthis, the Government implemented copyright laws and submitted a draft law onpatents for legislative action by 1991. Nevertheless, some negativeperceptions about foreign investment regulations still persisted, especiallyin regard to the divestiture of ownership over time. Besides, the land usepolicy also continued to be a sticking point in the foreign investors' mind.
5.25 Under the new policy for industrial estate development by theprivate sector, several potentially important changes were announced. First,private companies, both foreign and domestic were allowed to developindustrial estates. Second, the land title granted would permit a lease termfor 30 years, extendable by another 20 years, and renewable by another 30years, as long as the land continued to be used as an industrial estate,thereby effectively extending the land tenure to a sufficiently long period toattract investments. Third, Government coordination required for obtainingthe various periods and licensing was assured, with a high level office beingestablished to secure such coordination. Fourth, a temporary license validfor three years would be granted to investors for necessary sites and landpreparation, and thereafter a permanent license would be issued for 30 yearsfor foreign investors and indefinitely for local companies. Finally, therewere requirements on the estate developers for environmental impact analysis,securing of necessary licenses needed by plants which located to theindlustrial estates, provision of basic infrastructure, such as power andtelecommunications and common waste water treatment facilities. These policychanges potentially addressed in part some of the difficulties that firms hadbeen facing in obtaining industrial land and in dealing with localregulations.
5.26 The labor market policy in a formal sense had continued to remainstatic with hardly any changes. The exit had not been easy because of severerestrictions on retrenchment and deployment of labor. Since 1987, however,theire was a modicum of relaxation in regard to the employment of expatriates.Foreign investors who exported a major share of their production were givenexemption for hiring expatriates in restricted sectors. Furthermore, thebusiness visa was renewed every 12 months as long as each visit was for aperiod not exceeding four months as compared to the previous two months. Awork permit was no longer needed for nonpermanent expatriate employees whocame to provide advice on developing, extending and training in the

- 74 -
application and innovation of technology for improvement of quality and designof industrial products. Though these changes might seem to be marginal innature, they were more liberal in actual implementation.
The Philippines
5.27 The passages of BP 391 as an amendment to Investment Incentive Actrepresented a substantial changes in both the philosophy and instruments ofthe incentive system. Prior to this amendment, the incentive system had avery broad and somewhat confusing agenda, including employment anddistributional objectives, the establishment of "pioneer foreign enterprisesthat are capital intensive" and "self-reliance in the basic requirements forfood and raw material." The law was more specific about the InvestmentPriorities Plan (IPP) of the Board of Investment (BOI). IPP which couldidentify "gaps between prospective demand and existing supply for specificproducts and commodities" through a system of "measured capacities." Once themeasured capacity of an industry was "filled," it would be removed from theIPP and the incentives would be no longer extended to further entrants.(Appendix II-C, The Philippines).
5.28 The Philippine authorities adopted the OIC as a major vehicle forinfluencing the size, location, composition and competitiveness of thePhilippines industry through a variety of industrial policy measures. Thiscode was administered by the Board of Investment (BOI). Some of theobjectives of the OTC were: domestic investment promotion, augmentation ofdirect foreign investment, export promotion, regional development, employmentenhancement and technology upgrading. The overall industrial strategy calledfor the development of special industries, the most prominent one being theautomotive industry, through capacity and import restrictions. The chiefincentives available under the OTC were fiscal in nature. Eligibleinvestments were provided exemptions from duties and taxes on certain inputsand expenditures, as well as a general tax holiday. The main changes betweennew code and the old one are summarized in Table 3.
5.29 The most salient features were the removal of performance-basedincentives for net local content earned and net value earned and theirreplacement with an income tax holiday for up to six years. These incentiveswere restricted to the firms registered with the BOI while in many othercountries they were extended to all firms. A useful function was served byconsolidating and integrating the incentive system which was composed,earlier, of nine decrees into a simpler code.
5.30 One of the objectives of the OIC has been to promote direct foreigninvestment (DFI). To this end, it provided, in addition to the generalincentives availablei to all eligible investors, specific incentives andguarantees for foreign investment in such matters as repatriation of profits,dividends, capital expropriation, nationalization, and so on. Since 1988,foreign investors were allowed to avail of debt-to-equity swap facilitieswhereby they could purchase Philippines' external debt at a discount and useit to cover their peso investment needs. On the other hand, the perceptionamongst of foreign investors persisted that the Philippines' incentive scheme

- 75 -
TABLE 3I CONPARISON OF KEY FISCAL INCENTIVES UNDER TUE OLD AND PROPOSED (NEW)OMNIBUS INVESTMENT CODES
Fiscal Incentives New Old
A. Tax ExemptionsIncome Tax 4-6 years from commercial n.a.
operation (nonpioneer/pioneer)
Tax/Duty on imported 5 years from effectivity of Cods 5-year deferralequipment
Tax/Duty on imported 5 years from effectivity of Code n.a.spare parts
Contractors Tax All BOI-registered firms n.a.
B. Tax Credits a\Domestic capital 100% of taxes/duties on import- 100% of taxes/equipment substitute. 5 years from duties on import
effectivity of Code. substitute. 5years from
registration bX
Imported raw material direct/indirect exporters direct/idirectexporters
Net value earned and n.a. 5-10%. 5 yearsnet local content from commercial
operation
C. Tax DeductionsLabor expense 50-100% of incremental wage n.a.
bill. Expansion projects. 5years from registration.
Net operating loss n.a. 6 years fromcarryover year of loss.
Source: BOINote: n.a. - incentive not available
a\ Tax credits are valid for 10 years from date of issuance in bothCodes.
b\ Deducted from credits on net value earned and not local content.

- 76 -
was too restrictive, especially to the extent that it limited foreignownership to 40 percent in most cases, the exception being investment thatproduced mostly for exports or had pioneer status.
5.31 Though the policy towards DIF turned out to be far better, theattractiveness for foreign investors did not depend merely on the OICincentives. There were some noneconomic factors and certain risks whichtended to discourage DIF. The Philippines had a relatively poorinfrastructural facilities and high real wages recently due to risinginflation. Among the noneconomic factors was the political instability andhigh degree of personal insecurity arising from law and order situation.
5.32 To facilitate the increased access of small and medium firms toforeign inputs and to markets, industrial policy included several measures:(a) duty exemption and drawback system: The program was a move towardsformula based 'standard drawback' system; (b) the government had begunconsideration of ways in which export credit, credit guarantees and insurancecould be provided; and (c) technical assistance to small exporters.
5.33 Three other agencies--the Council for Investments (CFI), BondedExport Marketing Board (BEMB), and Export Processing Zone Authority (EPZA)--functioned under the Industry and Investment Group division of the Departmentof Trade and Industry (DTI). The activities of all these overlapped with BOIand all were involved in the licensing process of at least some applicants.In an attempt to reduce the time and logistics problems pertaining toregistration, the government established the One Stop Action Center (OSAC) andBonded Export Marketing Board (BEMB). The quality of services provided bythese new entities was good, but of limited scope. In most cases they servedeffectively to clarify procedural and documentary requirements but they didnot generally reduce the number of offices and signatures required in theregistration process.,%/
5.34 For the first five years of the Code, new or expanding registeredfirms were wholly exempt from the customs duties and other taxes on imports ofmachinery and equipment and accompanying spare parts necessary for production.Some restrictions applied to ensure that the equipment and spares were used inthe registered faci'lity. Subject to BOI approval, a parallel tax credit wasoffered to registered firms which purchased domestically manufactured capitalequipment. The credit was equal to the duties that would have been waived hadthe equipment been imported.
5.35 Government began reducing price controls as early as 1979. Moralsuasion prevailed in the early years to restrain operators from availing ofthis new flexibility but, except for brief periods during the 1983-84 crisis,the trend had been ito eliminate price controls and for prices to seek market-determined levels. As recently as 1990, some controls were still in place on
%/ Foreign Investment Advisory Service (FIAG): Policy Framework To AttractForeign Direct Investment in the PhiliRRines: Structures and Activities,1991, IFC - MIGA, Washington, D.C.

- 77 -
strategic goods such as cement, and services such as shipping. The growingdemand for these items as a result of economic recovery brought growingpressure on the supplies of these goods and services. The Government hadlittle choice but to liberalize the import and to decontrol cement prices, forexample, in late 1990, and a similar pattern would probably bring about theremoval of most other price controls.
5.36 The present Government passed several pieces of accommodatinglegislation, which resulted in increased unionization of workers in recentyears, moderately in the private sector and substantially in the publicsector. In the public sector, union membership climbed by 30 percent in 1989.In the private sector, union membership was around 12 percent of the totalwork force. Despite recent gains, however, the level of unionization in theprivate sector remained relatively low and the power of the unions toinfluence the general level of wages was relatively weak. The Governmentalso intervened in the formulation of compensation levels for private sectoremployees by maintaining the practice of setting minimum wages and severalelements of nonwage benefits by legislation. For example, in 1989, minimumwages were raised substantially for all groups of low-scale employees;nonagricultural workers received an increase of around 48 percent. Suchinterventions, however, might seem more distortive than they really were.
Sri Lanka
5.37 The watershed in the development of industrial policy was reached in1977, when there was a major shift away from the state control of economicactivity. Private investment was aggressively pursued as the means ofdeveloping the export sector; market mechanism were progressively restored inpricing and distribution of factors of production as well as output; and withsome exceptions, distribution was progressively ceded to private channels.The industrial policy reform was a part of the general policy reform of whichfinancial sector and trade reform were an integral part, as noted in SectionIII (Appendix II-D, Sri Lanka).
5.38 To begin with, Sri Lanka set up two different incentive packages andinstitutions dealing with investment both domestic and foreign. A localInvestment Advisory Committee (LIAC) was for assisting 100 percent domesticinvestment. It consisted of three ministries: The Ministry of Industry andScientific Affairs, Textiles Industries and Fisheries; other ministriesbrought in as and, when the matters concerned them. The firms were required toseek LIAC approval. The criteria used was whether the firm had adequateexport-orientation, and labor intensity, used local raw material and savedforeign exchange. The other body--the Foreign Investment Advisory Committee(FIAC) was concerned with the approval for foreign investment and jointventures. It was in 1978 when another body--the Greater Colombo EconomicCoimmittees (GCEC) was created as the institution concerned with export-oriented foreign investment. It was GCEC, which, within this strategy had toadminister the two export processing zones (EPZs) which were opened up inlarger Colombo area.

78 -
5.39 In late 1989, the Government made a major decision to merge the FIACinto GCEC to create a "one-stop shop" for foreign investors. It was expectedthat such an institutional merger would unify the country's FDI administrator.However, both policy formulation and implementation proved to be far morecomplicated than was originally thought, The merger of GCEC and FIAC, for allof the good intentions, was ineffective, because the action was accompanied byspecific and workable plans to restructure the scope, nature and detailedrules of the new authority. As a result, the GCEC authority, after themerger, failed to effectively administer the previous FIAC projects, nor wasit able to supply unified rules and procedures concerning new projects askingfor approval. Thus, the FDI policy, regulatory and institutional system until1990 contained a number of negative elements including ambiguity in severalareas and excessive restrictions inconsistent with the new reformpolicy.5/ A further liberalization process in 1989-90 changed thepreviously existing management system. The LIAC was abolished in 1988. TheBusiness Acquisition Act was repealed and the industrial licensing system wasterminated.
5.40 The issue of New Investment Policy Statement in 1990 marked amilestone in the evolution of industrial policy reform. Through this, theGovernment made an ieffort to introduce several important changes in theinvestment policy framework: (a) the early reliance on the case by caseapproval procedure was abandoned, and a new system based on the concept ofautomatic approval was introduced; (b) various restrictions in the past on theactivities and ownership structures of joint ventures were lifted; and (c) theprevious emphasis on limiting FDI activities within an isolated environmentwas withdrawn. Instead, stress was placed on the development of closelinkages between the FDI activities and the local economy by encouragingnondiscrimination and integration. At the same time, it was recognized thatthere was still a need for occasional government intervention, monitoring andresorting to special incentives on economic and social grounds.
5.41 The new Investment Policy Statement marked a breakthrough in thatthe Government made a strong effort to unify the policies for all privateinvestors, both foreign and local, small and large, to encourage anyinitiatives that would contribute to growth, export and employment. TheInvestment Policy statement also aimed at simplifying the FDI entry policy, byeliminating the previously emphasized "preferred areas" and introducing a newconcept of "automatic approval" for all private investment, supplemented onlyby certain safeguards such as the "negative list(s)." In a way, this carriedthe reform further, done under the Industrial Promotion Act of late 1980,which called for the replacement for all private initiatives except those on ashort list of activities (or a negative list).
S/ Foreign Investment Advisory Service (FIAS), Institutional Framework toAttract Direct Foreign Investment in Sri Lanka: Investment PolicyStatement, 1991, IFC-MIGA, Washington, D.C.

- 79 -
5.42 The main issues concerning price controls involved the decisions onwhat products were controlled and why and how these controls were enforced.The Fair Trade Commission set-up under the Fair Trading Commission Act,prescribed items for which changes in the selling prices needed a writtencomments based on the cost structure and a predetermined formula (the latteraLlowed for a 35 percent rate of return on capital calculated on a 75 percentcapacity utilization, capital costs were taken at their historical value).The items prescribed were those for which a monopoly or quasi monopolysLtuation was identified. A monopoly situation was defined as a market shareof 60 percent or more by one single manufacturer. After the Fair TradeCommission gave its written comment to the Ministry, which was a consent to acertain selling price, the Internal Trade Department enforced theimplementation as foreseen in Consumer Impact Act. Though the price controlpolicy changed in recent years for good, it still retained several degrees ofdiscretion, which created uncertainty in the minds of the investors. TheGovernment lately has showed willingness to modify this policy by reducing thenumaber of prescribed items.
5.43 Since 1977, the Government of Sri Lanka was keen to promote mediumand small scale industries (SKI). The upper asset levels defining SKI(excluding land and buildings) were progressively increased from Rs 2.0million in 1979 to R 8.0 million in 1990. The SMIs were allowed to be set upand operate with only minimal regulatory control e.g. registration with thecentral Environmental Authority or the Ministry of Labor and the marketsignals were the main determinants of SMI investments and their viability.Except for location permits in line with zoning regulations, further approvalwas not required. Subsectors with strong potential, high value added andlarge economic of scale were promoted but not reserved for SMI projects. TheGOSL's interest was also to develop industry in more remote urban and ruralareas but the objective was pursued through promotion and provision ofservices rather than with distorting incentives. This policy received furtherimpetus through Investment Policy Statement of 1990 under which the Governmentdeclared its intention to vigorously pursue various programs to assist SMIs,including entrepreneurship training, removing obstacle to access to rawmaterial and tax-related impediments. The Government would also providesubcontracting arrangements below the large scale foreign and local firms andSMIs.
5.44 Within the framework of the labor laws, the GOSL would not interferewiLth the employer's choice of its workforce. Furthermore, the Governmentrecognized that enterprises might require foreign experts. Accordingly itintended to liberalize Resident Permit for key personal required foremployment in such enterprises. The way the labor legislations wereimaplemented did not act as a deterrent to industrial investment.
Bangladesh
5,45 Major reform initiatives regarding the development of the privateindustrial sector were taken during the period 1982-1991 (Appendix II-E,Bangladesh). The first reform known as New Industrial Policy (NIP) was in1982. The second known as Revised Industrial Policy (RIP) was in 1986 and thethird known as the Industrial Policy (IP) was in 1991. All three covered the
- 80 -
whole gamut of problems facing the private industrial sector. The first twowere in effect far long enough to yield to assessment of their impact whilethe IP, announced in 1991 was yet to culminate in concrete action programs.
5.46 The NIP of 1982 had three main objectives: further liberalizationof investment in the private sector, privatization of public enterprises andthe flexible operation of controls on access by the private sector to variousfacilities. Under the NIP, the industry was grouped into three lists: (a) asmall reserve list for public investment only; (b) a concurrent list ofindustries in which either public or private investment would be permitted;these list included large scale industries such as jute, heavy engineering,iron and steel, etc.; and (c) and the control through the IndustrialInvestment Schedule (Ils) of all other industries reserved for private sector,which was in existence in the 1970s. However, the IIs was greatly modified tomake it more indicative than restrictive, and the procedures involved in IIs--were simplified by enhancing the sanctioning powers delegated to the financialinstitutions and commercial banks. Under this, approval of the Government wasrequired only for those programs which had a raw material input contentexceeding 20 percent, needing foreign exchange at official rate and forprojects above certain size limits. The Investment Board headed by theMinister of Industries was the highest sanctioning body. In addition, thenumber of free sectors, not requiring any prior sanction were increased to 49subsectors of industries. 6J
5.47 The reform process was carried even with greater vigor in 1986. Theprincipal changes in the industrial policy were: (a) reserved list wasreduced only to seven sectors; (b) a discouraged list was created forindustries in which no further investment for new capacity criteria was deemednecessary. The Government approval for any of the industries in thediscouraged list was given by the Government, only if it was proved that therewas a large demand for its product and it had certain 'localized' advantages;(c) all industries not in the Reserved or Discouraged list were thrown open tothe private sector. Two separate IIs--one for the large and medium industriesto be administered by the Director General of Industries (DGI) and the otherfor small and cottage industries to be administered by the Bangladesh of Smalland Cottage Industries Committee (BSCIC) were prescribed. No formal approvalwas required for investment in these "free" sectors provided the investor usedhis own resources for important machinery and equipment; (d) sanctioninglimits of the various authorities such as Investment Bank, financedinstitutes, etc. were substantially increased; and (e) the import licensingprocedures for raw material, spare parts machineries etc. were considerablysimplified; and finally, the Government decided to provide needed supportservices to new industries and strengthened the institutional arrangements forthis purpose.
5.48 A further step in the industrial policy reform was taken in 1988.The Government approval for investment involving imported raw material
i{/ Mubin A.K. and Rab., Bangladesh: Industrial Regulatory and PromotionalPolicies, 1989 Op. Cit.

- 81 -
exceeding 50 percent of the total requirements was waived. Furthermore, freesector projects where foreign investors participated, needed no prior approvalof the Government, provided foreign equity was below 50 percent and within aninvestment limit of TK 100 million and not in the Discouraged list. FromL984, a Board of Investment was set up under the Investment Board ordinance,L986. The sanctioning powers of the BOI and other bodies are summarized intable 4 below.
TABLE 4: POWERS OF INVESTMENT SANCTIONING AUTHORITIES
Sanctioning Agency Size of Investment Remarks
1. (a) Board of Investment Projects involving investmentsover Tk 300 m in case of localresources and Tk 200 m in caseof foreign resources exceptthose under the free list andBEPZA.
(b) Investment Committee (a) Projects involving in-vestment of localresources upto Tk 300 mexcept those under thefree list and other sanc-tioning authorities
(b) Projects involving in-vestments of foreignresources upto Tk 200 mexcept those under BEZPA.
2. Development FinancialInstitution (BSB,BSRS, BKB, IPDC,SABINCO, etc.)
Board Upto Tk 100 m Restriction of rawRegional Offices Upto Tk 2.5 m material withdrawn
3. Commercial Banks:
Head Office Upto Tk 50 m - ditto -
4. BSCIC:
Board Up to Tk 15 mDistrict industrial Up to Tk 1 acenters with branchbanks
Source: Mubin and Rab (1989) Op. cit.
5.49 The Industrial Policy of 1991 still to be implemented, basicallyaffirmed the substance and direction of earlier initiatives in reforms. Iteven touched upon certain aspects of the trade and financial sector reforms.However, many of the measures implicit in IP were vaguely worded and though

- 82 -
they might not be restrictive in intent, they appeared to be so in language.Perhaps the authorities would clarify the measures proposed to be taken andremove ambiguity which characterized various important parts of the IP.
5.50 A price corntrol policy was greatly liberalized. Prices of only fewcommodities like fertilizers, sugar, etc were controlled on the basis ofactual cost reflectirng capital maintenance, and rate of return. However, thecontinued domination of the public sector whose pricing policies wereregulated by the government had repercussions on the prices of output in theprivate sector. Progress had been achieved over the past five years inimproving some public pricing policies, primarily in reducing foodgrain andfertilizer subsidy. However, in regard to other tradeable and nontradeables,like power, natural gas, irrigation, subsidization continued unabated.
5.51 Foreign joint venture projects did not require government sanctionif the total project cost did not exceed Tk 100 million, if the foreign equitydid not exceed 49 percent, and if the investment was not in discouragedindustries. Development finance institutions and commercial banks might alsofinance and sanction joint venture projects falling under the above category.All other joint venture projects required sanction from the Board of Invest-ment (BOI). The interests of foreign investors were protected by the ForeignInvestment Promotion and Protection Act 1980. It provided assurance againststate confiscation or nationalization of industries involving foreigninvestments as well as guaranteeing repatriation of profits from theseinvestments.
5.52 Subject to the permission of the Bangladesh Bank, the foreigninvestor might repatriate capital invested, including capital gains, as wellas all post-tax dividends on foreign capital. Salaried foreign nationals werenot allowed to repatriate more than 50 percent of their salary. Multinationalfirms engaged in trading might not repatriate profits from that part of thebusiness. Multinationals which subcontracted production to other firms, whilethemselves remaining in charge of marketing, were prohibited from repatriatingprofits arising from that part of the business. Multinationals leasing theirproduction technology to some other firms, while themselves remainingresponsible for marketing of those produced goods, were not permitted torepatriate profits from this particular form of business. Therefore, manymultinationals allowed other firms with lower overheads to produce theirparticular brands to cut down on cost.
5.53 Labor laws, and their interpretation by the courts, was notconsidered generally by entrepreneurs as a deterrent to private investment.Though the administrative procedures were cumbersome and expensive, the rightsand obligations themselves were considered to be balanced. Consequently,there had not been pressure to reform labor laws as there was for change inother areas of regulation. One development had been in respect of labor inthe new Export Processing Zone. Compensation provisions and other elementswere tailored so that high productivity could be maintained; labor unions areforbidden, and all labor matters were handled directly by the zoneauthorities .W
E./ Choudhury, F. and Kleve J.G., A Review of Export Policy and IncentiveSystems. Industrial Regulatorv and Promotional Policies in Bangladesh,(mimeograph) 1991, World Bank, Washington, D.C.

- 83 -
J:mpact of Deregulation
l.ndia
5.54 In assessing the impact of deregulation on the industrialdevelopment, care should be taken to avoid positing one to one relationshipbetween onset of deregulation and the changes in the economic profile ofindustry in all its aspects--cost effectiveness, profitability,c:ompetitiveness, etc. In India's case several factors have to be taken intoaccount. First, the period of deregulation and consequent opening of theeconomy coincided with a sharp deterioration in its macroeconomy mainlyinduced by the large and persistent fiscal deficit. Second, there wasgenerally lack of progress in regard to liberalization of trade policy regime.Whatever happened in the trade policy sphere had been small andinconsequential, which prevented the reaping of gains from domesticderegulation to the maximum possible extent. For example, there wasdelicensing of certain industries subject to their observing the requirementsof the Phased Manufacturing Program (PMP) to import only a certain fixedpercentages of their capital equipment and raw materials. In such a situationas prevailed in India during the 1980s, domestic deregulation could haveresulted in inappropriate investment in industries where the country has hadno real comparative advantages, to excessive entry into protected domesticmarkets, and to suboptimal scales of production. There were otherdifficulties involved in assessing the impact of deregulation. Deregulationin India proceeded in a half-hearted, piecemeal and ad hoc manner and a greatdeal of emphasis was laid on informal deregulation which was difficult tomeasure. Unclear classification of industries subjected to deregulation andfrequent changes therein made it difficult to know which industry was affectedlby which regulations and at what time.
5.55 The effects of domestic deregulation were seen strongly in theindustrial performance. Average rate of growth of industrial production,during the decade of the 1980s was the highest at 8 percent, since the 1950sand this was spread over all the subgroups except intermediate goods(Graph 15). The same trend was discernible in regard to value added inmanufacturing (Graph 16). Thus, the average rate of growth of value added was7.6 during the 1980s, as compared to 7.1 percent in the 1960s and 4.2 percentin the 1970s and all the subgroup participated in the increase (Appendix I -India: Table 3). The investment in the private sector, though always higherthan that in the public sector, grew faster than before. The ratio of privateinvestment to GDP rose to 13.0 percent during the 1980s from 9.4 percent inthe 1960s. This was mainly due to the fact that the authorities opened newareas of investment for the private sector in the wake of industrialderegulation (Appendix I - India: Table 1).
5.56 The benign impact of deregulation was evident not only in terms oflarger quantitative increase in industrial output and diversity of products,but: also in terms of efficiency of factor use. Looking at the resourceallocation from the angle of static measures, it is clear from Table 5 thatICOR in the manufacturing sector, reflecting efficiency of investment declinedfrom an average of 6.0 in 1960-84 to 4.1 in 1985-90. Another measure,Domestic Resource Cost (DRC) which computes cost in terms of domesticresources required for producing one unit of output to earn or to save foreignexchange also showed that efficiency tended to rise in the 1980s. Thus,average DRC for the manufacturing sector fell to 1.37 in 1985-90 from 1.92during 1973-84. Though it remained still more than one, which was a cut offpoint to make the cost of output internationally competitive, its steady
- 84 -
decline was highly significant. What was more, there were a few industriessuch as Hydro Turbine, Turbo Generator, Pesticides, Iron Ore, etc. which couldboast of a DRC either 1 or less than 1. (Appendix I - India: Table 7)
5.57 A closely related concept for judging the efficiency of resource useis the Effective Rate of Protection (ERP) which also declined for themanufacturing sector and all its subsectors, suggesting that the protectionafforded on domestic value added was less than before. ERP would have furtherdeclined if the trade policy reforms were undertaken pari Rassu with domesticregulatory reform.
5.58 There was also a steady decline in the concentration in Indianindustrial sector, which indicated perhaps a greater play of competitiveforces in Indian markets. Thus four-firm concentration ratio--share of thetop four producers in, industry sales or output--fell across all groups ofmanufacturing sector from 72.0 percent in 1973-84 to 65.7 percent in 1985-90;there had been a sharper fall in respect of consumer goods and intermediategoods industries. At a further disaggregated level, the fall in theconcentration ratio was even more impressive. During the same period, theconcentration ratio declined for half of the products for which data wasavailable, stayed the same for 16 percent and rose for little more than athird of them. However,the degree of concentration in the Indian industrystill remained higher than in many other large developing countries.
5.59 The picture of industrial efficiency following deregulation lookedeven better if its effects were judged by reference to the dynamic indicatorssuch as Total Factor Productivity (TFP) and labor productivity. It will beseen from Table 6 that there was a dramatic change in TFP after deregulationwhich turned from -0.3 into 3.9 between two periods, viz. 1960-84 and 1985-90.And this was true of all the subsectors. With deregulation and consequentelimination of procedural delays and uncertainty arising from administrativeinterference, the investors could perhaps be better positioned to plan andmanage their projects,. The labor productivity also increased sharply in theaftermath of industrial policy liberalization. (Table 7).
5.60 All this was supported by the changes in industrial approval rates,foreign collaboration applications and time taken to clear the licenses whenrequired. Net carry-on business licenses, the average annual number ofindustrial licenses and registration of delicensed investments more thandoubled between 1972-74 and 1978-83 and further increased by 24 percent in1985-89. The mix between these two types of approvals shifted sharply infavor of registrations, perhaps reflecting delicensing of some investments andinvolving number of smaller projects. Approvals for foreign collaborationsrose to by 16 percent between 1978-80 and 1981-84 and a further 56 percent in1985-89. The number of MRTP clearances rose substantially from 45.5 percentof total applications received in 1972-1976 to 64 percent in 1986-90 inrespect of expansion and from 41 percent to 60 percent in respect of newundertakings. Likewise, the ratio of applications disposed of to thosereceived for industrial licensing declined sharply as well as the time takento take the financial decision.
5.61 As observed earlier, the degree of deregulation was limited inregard to foreign investment and promotional policies and as such there was alittle impact on the inflow of foreign investment, or industrial developmentin backward areas or on small scale industries. Foreign direct investmentincreased only marginally; the backward areas also did not derive largebenefits from the government policies. It was found that, paradoxically, muchof the actual disbursement through Central Investment Subsidy (CIS) was

- 85 -
Figure 15Real Growth in Manufacturing Value Added
14
12-
i Ave. I; _ X=
o1 Ave. POe Re io
2-
ndia indoneia Sri Lonke Phllppke kMe h
Note: For period description see Table 5.

- 86 -
Figure 16Growth in Industrial Output (sector-wise)
India
*Ave. P"ff
oAV*. POW WW
Muwtc%g Tobl Coquiw Goor. Cap"t Goodm frtwosdite GoO" 9Mb Goo_i
Indonesia
250
*Ave.
o Av& Poet C eteno
10
M.mowtaturng ToW Crounsur Good Capds goods brdsnrsdste Good SAec Goods

F- \\98hEk a o~~~~~- K _ _ _ _ Sa
4h -4 0 0~~~~~~~~~~~~~~-
| _l ~~ ~ ~ ~ ~ ~~~~~~~~~~~~~~~~~~I I I l
|~~~~~~~~~~..... .- ., .. ....". -: ' "1
a.-.::.:: .:::.:.;..1 . 0 ....... .g ~ ~~~~ ~ ~~ ~ ...........- . . . .: . ... .. ... -:..:. .: . ....... .o~~~ l'''''''''''l'''i''''''l'''' 1"'' . g I i I I~~~~~~~~~~~~~~~~~~~~~..... .. ..
| g~~~~~~~~~~~~~~~~~~~~~~~~~~~~~~~~~~~~~~~~~~~~~~~~~~~~~~~~~~~~~~~~~~~~~~~~~~~~~~~~~~~~~~~~~~~~~~~~~~~~~~~0-o :r g 0 n.
C).. _ . :........ . ... . ... ... . . ......... . : : . : ...--..... XD.
9 :::: . . - ::: :::: : : n : -:::: . ::::::::: -. , r ffi _.~~~~~~~~~~~~~~~~~. ......... . ...
--- C ..._ _ m~~~~~~~~~~~~~~~~~~~~~~~~~~~~~~~~~~~~~~~~~~~~~~~~~~~~~~~ . ...
-I _ I E Ne~~~~~~~~~~ ---... .....Sg1--:-'-
| = , ,, ~~~~~~~~~I ,_ _ W I ... .' _< (a
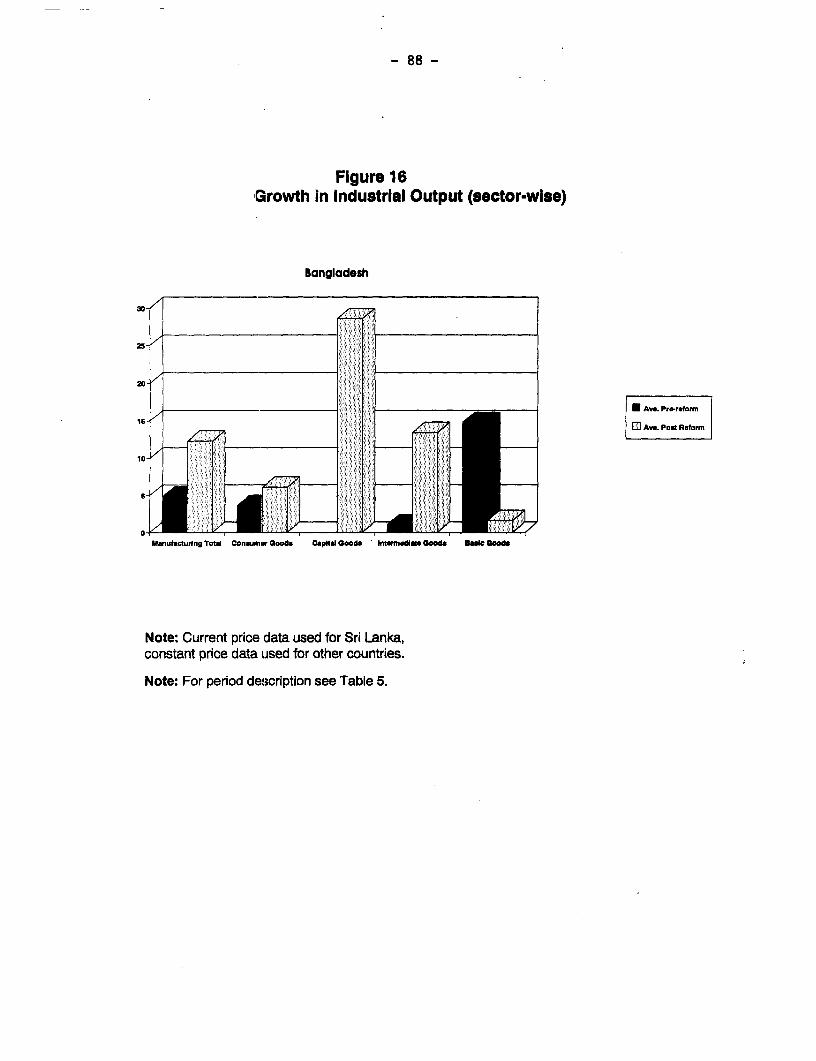
- 88 -
Figure 16Growth in Industrial Output (sector-wise)
Bangladesh
,
3D- X77SU Ave. Pro-refCrm
CAve. Post Reform
10-/
0MwnLstacturing Total Consmjmw Goods Capital Goods hntrmodlgo Goods Boole Goads
Note: Current price data used for Sri Lanka,constant price data used for other countries.
Note: For period description see Table 5.

- 89 -
TABLE St STATIC MEASURES OF PROTECTION FOR MANUFACTURING SECTOR
Average pro-reform period iL. Average post-reform period
Effective Rate of Protection (ERP) (%1
India 92.0 37.0Indonesia 74.1 53.2Sri Lanka t\ n.a. n.a.Philippines ¢\ 43.0 39 8Bangladesh 88.7 110.3
Domestic Resource Cost (DRC)
India 1.92 1.37Indonesia 1.70 1.50Sri Lan}ca n. a. 1.03Philippines 1.43 1.39Bangladesh 1.85 2.10
Four-fiLtm Concentration Ratio (5)
India 72.0 65.7Indonesia 60 0 55.0Sri Lanka n.a. n.a.Philippines n.a. n. a.Bangladesh n.a. n.a.
ICOR
India 6.0 4.1Indonesia 5.3 5.2Sri Lanka n.a. 11.3Philippines 4.2 12.6Bangladesh 8.8 10.5
Source: India, National Accounts, 1990; India, CEM 19901 India, Regulatory Reform Update 1990;India, Strategy for Trade Reform 1990; CMIE, 1986 and 1989; Indonesia, CEM 1981, 1990 and1991; Indonesia, Trade Policy Report 1991; Statistik Indonesia, isuues from 1981 to 1989;Sri Lanka, CEM 1990; "Effective Protection and Comparative Advantage in ManufacturingSector of Sri Lanka," Ministry of Finance and Planning, Sri Leakaj-angladesh, CEM 1989and 1991; 'An Assessment of the Impact of IndustrLal Policies in Bangladesh," Working Paper# 16, Ministry of Planning, Bangladesh; Philippines, CEM 1990; Philippines, TariffCommission Report 1991; and, Medalla, A., "An Assessment of Trade and Industrial Policy,1986-88," Philippine Institute of Development Studies.
Note: ji\ The pre- the post-reform periods are defined above in table 6.kA ERP data is available for Sri Lanka, but it does not appear to be plausible. DRC for
Sri Lanka is for year 1985 only.SL\ ERP and DRC for Philippines in pre-reform period are for year 1979, and in post-reform
period are for the year 1990.

- 90 -
TABLE 6: MEASURES OF PRODUCTIVITY FOR MANUFACTURING SECTOR
Average pre-reform period a\ Average post-reform period
Total Factor Productivity(Growth in % per annum)
India -0.3 3.9
Indonesia -0.8 b\ 1.0
Sri Lanka n.a. n.a.
Philippines -6.7 c\ 4.5
Bangladesh n.a. n.a.
Labor Productivitv(Growth in % per annum)
India 2.5 8.3
Indonesia 1.2 1.2
Sri Lanka d\ n.a. n.a.
Philippines -4.0 -2.0
Bangladesh -3.4 -1.0
Source: India, Regulatory Reform Update, 1990; I.J. Ahluwalia, 1985; India,Annual Survey of Industries, 1980 to 1987; Indonesia, CEM 1989 (pp 18);Statistik Indonesia, 1980 to 1989 issues; Drabek, Z., and R. Hooley,"Total Factor Productivity, Trade Liberalization and Subcontracting inPhilippines," Oct. 1990, World Bank; Bangladesh, CEM 1991; "An Assessmentof the Impact of Industrial Policies in Bangladesh," Working Paper # 16,March 1990, Ministry of Planning, Bangladesh.
Note: A1 For period description see table 6.DA An average of 0.9 per annum between 1973-81, and -2.5 per annum for
period 1982-85.c\ An average of -1.2 per annum for period 1970-80, 2.3 per annum for
period 1981-83, and -21.9 for the year 1984.d\ For Sri Lanka growth of labor productivity is not shown as data was
available for 1981 only. In 1981, the labor productivity for privatemanufacturing sector was 41.6 (value added per employee in Rs.thousands), 10.1 for GCEC units, 26.0 for Public Corporations and 23.9for GOBU units.

- 91 -
TABLZ 7: CAPACITY UTILIZATION IN T5E KANUFACTURING SZCTOR( in por cent)
Average pre-reform period aA Average pout-reform period
India 76.3 72.5
Indoneia 28 2 n.a.
Sri Lanka 54.6 76.3 k
Philippines n.a. n.a.
Bangladesh .g n.a. 49.2
Source: Industrial Bank of India, Annual Report 1988; CMIE, Production and Capacity Utilizationin 600 Industries, 1987; Indonesia, Select Issues of Industrial Development and TradeStrategy, 1981 (WI report no. 3182-IND); Central Bank of Sri Lanka, issues from 1982 to1989; Kabir, K., "The Regulatory Framework for Industry and Private Sector's Response toLiberalization Policies in Bangladesh," mimeograph, WB 1991.
Note: tAL The pre- and post-reform periods are defined in table 6.bt An averag, of 72.3% between 1978-81, 74.8% between 1982-85, 81.8% for 1986-87. The
number shown above is the average for these three periods.2\ Capacity utilization data for the manufacturing sector as a whole is not available. The
number shown above is used as a proxy for manufacturing sector capacity utilization.it is the average of capacity utilization rates for four major sectors within themanufacturing sector in 1989, Light engineering sector (46.8%), chemicals (55%), seafoodprocessing sector (39%), electronics (55.9%).

- 92 -
directed to fairly sizeable projects and more developed states receiveddisproportionately high amounts, while backward states received very little.The correlation between a state's rank in terms of per capita industrial valueadded and its rank in per capita disbursements of CIS was slightly positive in1970s (0.15), negative in the 1980. (-0.19). Moreover, a very small number ofdistricts appeared to have reaped the bulk of the subsidy. The interactionbetween CIs and state level capital investment subsidies at least in somecases distorted the incentives generated. Apart from this, both investmentand interest subsidy having rendered capital cheap led to waste of capital,thereby undermining the objective of employment creation. Such evidence asavailable revealed that investment cost of one job was much higher in backwardareas.
5.62 As far as the small-scale industries were concerned, they prolifer-ated in response to various incentive schemes. Their growth was rapid but farfrom healthy. There was an increasing industrial sickness in the SSI sectoras there was in non-SSI sector and they continued their existence only becauseof the continuing assistance from the government and its reluctance to allowtheir exit. The incentive schemes in their case were so applied that thesmall scale industry used both capital and labor inefficiently and barringfew, never graduated into large scale efficient industrial units.
5.63 The way the labor market policy worked in India made the exitproblem of the loss making firms extremely difficult. Overall, the legal andregulatory scaffolding covering labor relations spawned an atmosphere in whichunions individually are often weak and reliant heavily on governmentintervention; union representation of workers' long-term interests was oftengrossly distorted, labor relations tended to become politicized, and theincidence of industrial disputes was high by international standards, workingconditions and manning levels were rigidified, high levels of realcompensation were mandated by law, and management discretion in moving laborunder different terms of employment was severely curtailed. A strikingfeature of the labor market policy was that it remained static unlike theindustrial licensing policy or the policy towards foreign investment and smallscale industries. Basically, labor laws hardly changed, since they were firstpassed in the aftermath of Indian independence. Such changes as occurred inthose laws strengthened the rent seeking capabilities of labor and nullifiedthe advantages that resulted from other deregulation policies. In 1984, thestate government im]posed a stricter requirement that all units with 100 ormore employees obtain prior government approval for retrenchment or closure.State governments routinely turned down all such requests, even though thelegislation required that decision should be taken on merits of the case.
5.64 However, despite the legal impediments to retrenchment of labor ormodification of wages, etc., the firms came to use informal devices to evadethe impact of rigid labor market policy. This choice was in a way forced onthe industries because of the competition in product markets which gainedstrength as a result of deregulatory measures taken during the 1980s. Theenhanced product market competition meant increased pressure on the firms tobring down wage costs. Devices adopted to evade labor laws requirements were,the use of voluntary retirement schemes, company sponsored unionization, useof more capital intensive techniques of production, subcontracting of work tosmaller firms, employment of contract workers, and resort to overtly legalmethods to close the uneconomic plants without attracting penalties under thelabor laws.

- 93 -
A Post Scrigt
India
5.65 The most sweeping industrial regulatory reforms, affecting bothdomestic and foreign investment were announced by the new Government in July1991. It was sweeping not only in relation to what India did in 1985 but alsoin relation to what some other developing countries did in recent years. Themajor areas of reform were removal of administrative barriers to entry,expansion, diversification, and modernization of firms. If what was announcedwas implemented with speed and comitment, a major breakthrough would occur ininternational competitiveness of Indian's industry.,U/ The following werethe salient features of the new industrial policy: (i) industrial licensingwas abolished for all new, expansion and diversification of projectsregardless of size, except in 18 designated industries and for projectslocated within 25 km from 23 large cities with population of over one million;(i.L) capital goods imports for delicensed projects would be automaticallycleared if the need for foreign exchange was made available through foreignequity investment or if the requirement was less than 25 percent of the totalvaLue of plant and equipment, up to a maximum of Rs 20 million; (iii) allpreentry clearance requirement in the monopolies and Restrictive TradePractices Act (MRTP) were abolished. The Act was amended to restrict it tothe policing functions to curb restrictive and unfair practices and consumerprotection as in several other countries; (iv) automatic approval would begiven for projects involving foreign equity investment up to 51 percent inhigh-priority industries, provided the foreign exchange for imported capitalgoods was covered by foreign equity and repatriation of profits is covered bygross export earnings; (v) foreign technical collaborations would be freelypermitted in high-priority industries, up to a maximum lump sum payment of Rs.10 million, 5 percent of domestic sales, or 8 percent of export sales, subjectto an overall limit of 8 percent on total sales in the ten year after approvalor seven years after the start of operations; (vi) the need to enter into aPhased Manufacturing Program (PMP) was totally eliminated in respect of allnew projects, and (vii) the mandatory convertibility clause in term loans fromfinancial institutions under which they could convert a part of the loan valueinto equity was abolished for new projects.
5.66 Admittedly, the announced reforms were far reaching particularlyconcerning delicensing, doing away with PMP and foreign investment. It didnot, however, address a major constraint on exist of firms and the cognatelabor market policies reforms. These were very vital to the efficiencyenhlancing operations of firms and if they were to avail of the benefits of thereforms in other areas.
Indonesia
5.67 In assessing the experience of reforms in regulatory policy inIndonesia, what came out clearly was that it made the biggest strides in tradeand financial policy areas; the progress made in industrial deregulation wasimpressive and the same could be said about the policy towards direct foreigninvestment. As against these, precious little was done in the corporate legalfranchises, which contributed to constraint the efficient growth of theprLvate industrial sector in Indonesia.
.2j/ Sandesara J.C., "New Industrial Policy: Questions of Efficient Growthand Social Objectives "Economic and Political Weekly, August 3-10, 1991.

- 94 -
5.68 Indonesia is one of the few developing countries where both theappropriate macroeconomic policies and deregulation measures operatedsimultaneously and in harmony; this made it difficult to isolate the effectson the economy and the private sector of deregulation measures Rer se. Whatcame out most prominently from the Indonesian experience, however, was thatthe deregulation policy yielded the best possible outcome, when it is wasaccompanied by the sound and well directed fiscal, monetary and foreignexchange rate policies.
5.69 The general performance of the Indonesian economy since thebeginning of 1980s when the deregulatory policies were in full swing, wasmost impressive. Though the average GDP growth was 5.4 percent during the1980s, as compared Ito the corresponding figure of 8.1 during the 1970s, therate of growth was sustained by the faster growth of the nonoil sector whichwas boosted mainly by the private sector against the background of decliningoil sector. The rate of growth of nonoil sector GDP accelerated steadily from5.2 percent in 1984 to almost 8 percent in 1990. The vigorous nature ofnonoil sector development, a main beneficiary of deregulation was reflected inalmost the trebling of nonoil exports during the 1990s and much of itemanated from a marlket diversification of manufactured output.
5.70 The deregulation measures together with sound macroeconomicmanagement of the economy, induced a sharp recovery of the private sectorinvestment during the 1980s and much of that investment was directed towardsexport activities. After stagnating for a major part of 1970s, privateinvestment picked up sharply during the 1980s. Thus private sector investmentas a ratio of GDP steadily grew from 13.7 in 1985 to 15.3 in 1989.Considering that bulk of this investment consisted of fixed investment, theperformance was impressive by any standard (Appendix I - Indonesia: Table 1).Though the figures about private investment in manufacturing are nonexistent,the trends discerned in the approval of both domestic and foreign privateinvestment by the Irnvestment Authority (BKPM) were most encouraging.
5.71 The privately owned small, and cottage industries and the medium andlarge establishments (MLEs) almost accounted for 90 percent of themanufacturing production. The small and cottage industry claiming almost 17percent of value addled and two-thirds of workers in the manufacturing sector,expanded very fast almost doubling during the deregulation period 1986-89, andemployment in those industries increased by 18 percent in the same period.The growth rate of MLEs was equally outstanding, at 9 percent in terms ofvalue added, 6.56 percent in terms of employment; the MLEs were export-oriented as evident from a rise in their export/output ratio from 15.0 in1982-85 to 26.0 in 1985-88. The faster growth of manufacturing in the period1985-88 reflected a switch in resources both between and within sectorstowards those labor intensive activities in which Indonesia had beeninternationally competitive.
5.72 The pattern of regional industrial development as indicated byvalue-added from medium and large establishments has changed significantlybetween 1985 and 1989. Java's share of industrial value-added declined from76 percent in 1985 to 72 percent in 1988. That was due, among others, to theprovision of funds for infrastructure in areas when growth was required to beencouraged on the surface, these trends pointed to reasonably broad-basedindustrial development over the past decade that accelerated if anything,because of the impetus provided to medium and large scale firms in themanufacturing sectors by the deregulation regime.

- 95 -
5.73 Another beneficial impact of deregulation policies was seen clearlyin the rate of approvals of investments for domestic private investment andforeign investment. Thus number of approvals for investment for domesticsector increased from $1.3 billion in 1980 to $60 billion in 1990; thecorresponding figures for foreign investment was $912 million and $8.7 billionrespectively (Appendix I - Indonesia: Table 9). There was also a majorimprovement in the composition of such investment approvals favoring theexportable sector, indicative of the efficiency of the changed incentiveregime. During 1983-85; approvals for exporters both in respect of foreignanid domestic private sectors accounted for 24.5 and 38.9 percent of therespective total approvals; these percentages increased to 54 and 64.6 in1977-88, correspondingly in respect of the approvals for importables and non-tradeables.
5.74 It was noted earlier that in the aftermath of deregulation, thefactor intensity in the manufacturing sectors changed in such a manner thatthere was a pronounced shift toward use of more labor intensive techniques ofproduction. This was because of the change in the composition ofmanufacturing output in response to new incentives as well as due to wided:Lspersal of industries in other parts of Indonesia with abundant supply oflabor. Judging the impact, on the basis of static measures, the conclusion ofbeneficial impact of deregulation was strengthened. ICOR economy-wide wasestimated to have fallen from 7.8 in 1982-85 to 5.2 in 1986-88. Since ICOR,for the manufacturing sector could not be calculated for want of data, thistrend might be taken as indicating a similar trend in the manufacturing sectoraLso. Furthermore, the effective rate of protection (ERP) as well as DomesticResource Cost (DRC) in respect of manufactures fell during the period, whichmeant that efficiency in the manufacturing sector was definitely on the rise.As for the competition, the four-firms concentration ratio declined by fivepercentage points between 1975-77 to 1986-89 (Table 5). Though these measuresrepresented broad order of magnitudes, they together did reveal a more durableturn towards greater efficiency in Indonesian manufacturing sector.
5.75 The trends as reflected in static measures were similar to thoseprovided by the dynamic measures such as total factor productivity (TFP) andlabor productivity (Table 6). The TFP for the manufacturing sector moved froma negative of -2.5 percent per annum during 1982-85 to a positive of 1.0piercent in 1986-88. Labor productivity, however, increased but onlymarginally.
Tlhe Philippines
5.76 The industrial policy reform was in the right direction and it hadon the whole a beneficial impact on the Philippine's private industrials,ectors, though precise measures of impact are not possible both because ofdata unavailability and the complexity of factors simultaneously acting on theindustrial investment. In terms of industrial output growth, the impact wasstriking. Thus the average rate of growth of industrial output rose to 5.2percent in the post-reform period from an average of only 2.7 percent prior toindustrial policy reform. However, in terms of value added, the growth rateof manufacturing remained more or less the same. The investment data could beinterpreted as indicating the effectiveness of an incentive-based industrialstrategy. The following table 8 shows that the volume of investment coveredby BOI approvals has risen dramatically both in nominal and real terms since1986, even assuming that the rise could not be solely attributed to theinducements by OIC. From the point of view of economic efficiency, theincentives seemed to have worked until 1987 as the capital intensity starteddeclining. Since then the capital intensity began rising, indicating that BOI

- 96 -
incentives were having rather a perverse effect. Recent evidence pointedtoward the declining role of export-oriented projects than in the earlierdecade. Perhaps this was due to the fact that there were some factors such asappreciated exchange rate or high tariff rates which were offsetting theimpact of domestic incentives.
5.77 As far as the fiscal impact was concerned, it was felt that thestructure of fiscal incentives left much to be desired and that the fiscalimpact on budget was considerable. The prevailing system of fiscal incentivesoffered tax holidays for the early years of a firm's operations when it waslikely to be making losses. The incentives could be more useful from thefirm's point of view if they were applied to the first few profit-making yearsor if loss carry-over were permitted for tax purposes. Similarly, taxdeductions might be of little additional benefit for foreign investors iftheir home countries already allowed foreign taxes due to be credited againsthome country tax liabilities.
Table &: CHARACTERISTICS OF BOI-APPROVED PROJECTS JA(in billion pesos except as noted)
1983 1986 1987 1988 1989 Lb
Volume of Investments
Nominal 5.2 3.2 11.9 32.8 70.8Real 5.2 1.8 8.4 14.0 28.7
Proiected EmploymentTotal (000 persons) 113 26 82 128 153Investment per worker 46 12 15 26 46(Real, 000 pesos)
Share of ExSort Projectsto Total Approvals 76 72 62 50 55
BOI Share of Total Imv(in percent) 5.5 4.0 11.7 25.9 42.4
Fiscal ImacgIncentives/government revenues 8.2 7.0 5.8(in percent)
LA Not all approved projects get incentives.,& Provisional estimates.
Source: Board of Investments
5.78 The foreign investors continued to be weary of investing in thePhilippines, despite some important relaxation in procedures relating to DFI.

- 97 -
It was widely felt that the present approach wherein DFI was approvedvirtually on a case-by-case basis, did not provide clear signals and gave toormuc]h discretion to the approving authority. A short list and transparentapproval procedures would make a considerable difference in the attitude offoreign investors. Another area of concern was the so-called "60-40 rule"that restricted foreign ownership to 40 percent in many investment areas.Among the option being discussed was that of allowing foreigners to own morethan 50 percent of the equity of a joint venture in a large number of areasi(including investments oriented entirely to the domestic market) provided theyagreed to divest their shares to Filipino national over an agreed period oftime.
5.79 On the basis of static and dynamic measures of the competitivenessof manufacturing sector, the reform seemed to have been on the whole, helpful.The ERP declined from 43.0 percent during the pre-reform period to 39.8lpercent in the post reform period. Likewise, the DRC also declined, in thesame to period from 1.43 to 1.39--a modest improvement (Tables 8). Thedynamic measures--both Total Factor Productivity (TFP) and labor productivityshowed a perceptible improvement. Thus the TFP increased from an averagedecline of 6.7 percent in the pre-reform period to a rise of 4.5 percent inthe post-reform period and labor productivity also improved but in the latercase, the improvement took place in the form of a decline in the rate of laborproductivity rather than the rise (Table 9).
5.80 In order to hasten the process of deregulation, some initiativeswere taken recently to make the investment incentive system more effective andless discretionary. These initiatives would permit accelerated depreciation,the carry-over of business losses for tax purposes and the customary availmentof a flat rate of 10 percent on imported capital equipment. The last measurewould result in a substantial reduction of the discretionary power of the BOIsince duty exemption on imported capital equipment constituted one of the mostimportant incentives that the BOI currently offered.
Sri Lanka
5.81 It is more difficult to assess the impact of industrial and tradepolicy reform in Sri Lanka for want of the same detailed information as isavailable for India or Indonesia or even the Philippines. Except informationon industrial output growth and change in its pattern, private sectorinvestment growth and capacity utilization, there is no data relating todynamic or static measures of industrial efficiency in the pre-reform period.Hence no comparison is possible between two periods on the basis of thesemeasures so as to know how the industrial policy reforms have, if at all,changed the private industrial sector. Subject to these limitations, anattempt is made to evaluate the impact of policy reform in Sri Lanka to theextent possible.
5.82 First of all, it seems that with the weakening of constraints on theprivate sector since 1977, the rate of growth of the private sector investmentpicked up from the average of 11.5 percent during the 1970s to about 13.0percent in 1980s (Appendix I - Sri Lanka: Table 1). The growth of industrialoutput was even faster in the reform period. The rate of growth per annum of

- 98 -
manufacturing output almost doubled in 1980s from 12.4 percent to 24 percent.This was also true of the value added in manufacturing which increased in thesame period from 1.7 percent to 5.2 percent (Appendix I - Sri Lanka: Table 2).The pattern of industrial output, however, reflected a little change. Theoutput growth was due to a higher degree of capacity utilization from 54.6percent in the pre-reform period to 76.3 percent in the post reform period,which was impressive in comparison with that of some Asian countries.
5.83 As mentioned earlier, it is not possible to compare the performanceof the industrial sector in Sri Lanka between the two periods on the basis ofstatic and dynamic measures as these measures are not available for the pre-reform period. However, the DRC in the post reform period was around 1.03,close to 1, indicating thereby that the manufacturing sector was internation-ally competitive in the post reform period. As against this, however, theeffective rate of Protection (ERP) was very high in the post reform period:There is no information available on total factor productivity or laborproductivity for Sri Lanka.
5.84 There is some qualitative evidence, however, which suggests that thebenefits of reform were modest. The business community felt that theirindustrial operations were excessively constrained by continuous and time-consuming bureaucratic procedures, related to those of Customs Act, theExchange Control Act, and the Export and Import Control Act. This was evidentin the Government's action to appoint a "Commission on Bureaucratic Controls"chaired by eminent private sector industrialist, which would aim at facilitat-ing the dialogue, between GOSL and the private sector grievants. Perhaps theoutcome of this committee's deliberations expected by end-1991 together withthe passage of New Investment Policy Statement may help the private sector toovercome several of the impediments in its development.
Bangladesh
5.85 The impact of the industrial policy reforms on the privateindustrial development was salutary, though it was uneven. The manufacturingoutput (separate figuLres for the private sector are not available) increasedat an average rate of 12.8 percent per annum in the post-reform period, whichwas a slight improvement on the corresponding rate that prevailed in the pre-reform period. The value added in manufacturing sector increased onlymodestly. This reflected, in a decline of value added as a percentage ofgross output following an expansion of low value added activities and/or afaster increase of intermediate input prices relative to output-prices. Therelatively high prices of inputs were the result of import-substitutionstrategy dominant in the pre-reform period which created inefficientindustries producing high-cost intermediate products like steel, cotton yarn,etc. .2.2/
22/ Razzaque, M.F., Industrial Policy and Investment in Bangladesh. 1988Asian Development Bank, Manila.

- 99 -
TABLE 9: COMPARISON OF PERFORMANCE INDICATORS (continued)
Pre-deregulation period Post-deregulation period a\
Growth of Output(% per annum)India (cement) 3.0 9.3Indonesia (textiles) 14.0 24.2Philippines (cement) 0.4 23.7Sri Lanka (textiles) 10.4 21.4
Capacitv Utilization (%)India (cement) 79.3 71.0Indonesia (textiles) n.a. n.a.Philippines (cement) 64.6 77.3Sri Lanka (textiles) n.a. 66.0
Effective Rate of Protection
(%)India (cement) n.a. 33.0 to -51.0Indonesia (textiles) 140.9 35.0Philippines (cement) 136.9 42.7Sri Lanka (textiles) n.a. 141.0 b\
Ipomestic Resource CostIndia (cement) n.a. 1.3 to 0.49Indonesia (textiles) 2.5 1.3Philippines (cement) 2.7 1.9'Sri Lanka (textiles) n.a. 0.5
Exports (% of total production)India (cement) 2.3 0.1Indonesia (textiles) c\ n.a. n.a.Philippines (cement) 14.6 0.3Sri Lanka (textiles) d\ n.a. 27.3
Imports (% of total vroduction)India (cement) 7.3 3.5Indonesia (textiles) n.a. n.a.Philippines (cement) 0.0 4.7Sri Lanka (textiles) n.a. 9.4
:rotal Productivity Growth Rate(%) per annumIndia (cement) n.a. n.a.Indonesia (textiles) n.a. n.a.
Philippines (cement) 8.5 4.5Sri Lanka (textiles) n.a. n.a.

- 100 -
TABLE 9: COMPARISON OF PERFORNANCE INDICATORS (concluded)
Pro-deregulation period Post-deregulation period
Growth in Labor Productivity% per annumIndia (cement) n.a. n.a.Indonesia (textiles) n.a. n.a.Philippines (cement) 8.7 40.0Sri Lanka (textiles) n.a. n.a.
Net Profit or lossIndia (cement) (M Rs.) 7.0 11.0Indonesia (textiles) n.a. n.a.Philippines (cement) M pesos) -2.8 3.0Sri Lanka (textiles) n.a. n.a.
Return on Capital EmRloved
(%)India (cement) 13.6 16.0Indonesia (textiles) n.a. n.a.Philippines (cement) e\ -1.4 2.2Sri Lanka (textiles) n.a. n.a.
Source: India, Stratgy for Trade Reform (8998-IN), 1990; India Cement IndustryProject (5901-IN), 1985; Indonesia, Trade Policy Report 1991; Indonesia,Developing Private Enterprise, CEM 1991; Indonesia, Textile IndustryStudy 1987; Philippines, Cement Subsector Study, Development Bank odPhilippines, March 1990; Sri Lanka, Textile Sector Review, 1988; SriLanka, CEM 1988 and 1990.
Note: a\ The pre- and post-deregulation periods areIndia - 1971 to 1982 and 1983 to 1990Indonesia - 1975 to 1985 and 1985 to 1990Philippines - 1971 to 1985 and 1986 to 1990Sri Lanka - 1971 to 1977 and 1978 to 1990
k\ Both ERP and DRC for Sri Lanka in the post-deregulation period arefor the year 1985 only.
c For Indonesian textile industry, textile exports/imports as aproportion of total textile production is not available. However,textile exports grew at the rate of 58.9% in the pre-deregulationperiod and at 34.3% in the post-deregulation period. Imports on theother hand grew at the rate of -4.2% in the pre-deregulation periodand at 25.4% in the post deregulation period.
d\ For Sri Lankan textile industry, exports and imports are proportionof total exports and imports and not total production.
e\ For Philippines, it is the return on assets and not return on capitalemployed.

- 101 -
5.86 Despite generous investment and export incentives, there was not anysignificant impact on foreign investments. Though in the 1980s, some export-oriented projects such as garments, shrimp, fish processing and ship repairingwere established, Bangladesh had not been sufficiently attractive to theforeign investment because of variety of factors such as: limited materialresources base, small domestic market, inadequate physical and socialinfrastructures, relatively high production costs, lack of transparency in theincentive system, limited financial resources, poor labor discipline,unireliable legal system, nettlesome administratively procedure. This wasevident from the fact that only 72 foreign firms have been operating in thecountry and their number in manufacturing sector has in fact declined.
5.87 On the basis of standard measures of industrial efficiency like ERP,DRC or ICOR, also, the impact of deregulation did not appear to be what wasexpected from the reforms. The ERP, DRC and ICOR all increased, indicating,if anything, that the inefficiency of industrial development in fact increased(Table 8). However, too much should not be read into these criteria as, theseparate figures for the private manufacturing sector are not available andsince the public enterprises played a dominant role in Bangladesh, it ispossible that these measures reflected a biased view of efficiency in theprivate individual sector.
5.88 The capacity utilization in four major sectors like lightengineering, chemicals, seafood processing and electronics has been around 50percent during the post reform period.jQ/ Though these could not becompared to the pre-reform period for want of data, the extent of low capacityutilization itself was enough of evidence to suggest that the deregulation didnot penetrate deep into the private sector to make any substantial differenceto its efficient functioning.
5.89 Some micro-studies of private industrial development in Bangladeshdo support some beneficial aspects of individual deregulation such as improve-ment in registration procedures of the BOI, sanctioning delays, etc. Amnajority of investment was still subjected to official sanctioning and as aresult, many of them were excluded from certain sectors.ij/ The success ofBOI as seen by the investors was modest. Though it offers on paper *one stopservice," the BOI in fact was riddled with bureaucratic red-tapism thatinvolved seeking favor from the various departments within the BOI. The sheerrigamarole of applications filling, and the numerous conditions attached tothose applications transformed the BOI into an unfriendly institution.§i/
jQ/ Kabir, K. The Regglato= Framework for Industry and Private Sector'sResRonse to Liberalization Policies in Baangladesh (mimeograph) 1991,World Bank, Washington, D.C.
j]./ Kabir K.. The Regulatory Framework for Industry and Private Sector'sResRonse to Liberalization Policies in Bangladesh, 1991, Op. Cit.
I2/ Hossain, N. The Impact of Industrial Policies in Bangladsh: A QuestionRevisited (mimeograph) 1991, World Bank.
- 102 -
A Micro-approach to Impact of Deregulation on Industry
5.90 So far, the impact of deregulatory measures on industries in thecountries covered has been examined at a macro-level. However, under thatapproach, it has not become possible for want of detailed and comparable datacountry-wise and industry-wise in individual countries, to know how preciselyderegulation affected cost and profit conditions in particular industries andother relevant elements. If the impact on specific sector is assessed, it mayperhaps help to bring out the impact of deregulation more clearly and meaning-fully. Attention is focussed here on individual industries in four countriesand the changes that came about in their economic position after the reforms.No industry in Bangladesh is considered because necessary information for anysector in that country is not presently available. Industries picked up aredifferent for different countries again for the reason that relevant informa-tion is lacking. The industries chosen are cement for India, Textile forIndonesia, cement for the Philippine, and textile for Sri Lanka. However, adifference in industries should not pose any problem as the intention is tosee how any given industry is impacted by deregulation, within a country andacross countries. Detailed description of these industries countrywise ispresented in the Appendix 3. The conclusions should be taken as moreindicative than definitive. Broadly, they support what has been discussedearlier in this section about the impact of industrial deregulation at a macrolevel.
5.91 India, Indonesia and The Philippines are the three countries forwhich better data are available and hence the impact on their respectiveindustries: cement (India and The Philippines) and textile (Indonesia) isdiscussed more assureldly than in the case of Sri Lanka. In India's case, itis clear from Table 9 that except exports and capital utilization, all otherindicators showed distinct efficiency gains. The output of cement rosesharply and so were net profits. Imports were halved as a proportion ofoutput as the domestic production expanded. The capital utilization howeverdeclined and the reason was less related to the government policies than toincrease in supply outpacing the increase of the domestic demand. Though thepre-reform figure of D)RC and ERP are not available, their level in the post-reform period showed that cement industry was less protected and relativelyefficient. In fact, both in terms of new technology and competitivenessinternationally, the ][ndian cement industry did well in a liberal economicenvironment.
5.92 A similar picture emerges in regard to the cement industry in ThePhilippines. Table 9 reflects that almost all indicators of efficiency havebeen positive in post-reform period. The rate of growth of cement outputincreased by twenty-six times; capital utilization rose from 64.3 to 77.3percent, net profit turned positive to 3.0 P million from negative of -2.8million, the ERP declined from 136.9 to 42.7 percent and DRC from 2.7 to 1.9percent. There had been divergent trends in the various productivity indices.While labor productivity growth rebound to 40 percent to 8.7 percent in thepre-reform period. But the total factor productivity rate declined by half.
5.93 The textile industry in Indonesia and Sri Lanka seemed to havebenefitted from the policy reforms, though in these cases, many of the of
- 103 -
efficiency indicators used were not available. Indonesian textile sectorboomed under the liberal regime. The textile output increased to 34 percentfrom around 14 percent--more than doubled (Table 9). The S&P and DRC sharplydeclined. In the case of Sri Lanka, the industrial output increased sharplyin the post reform period; the capital utilization also increased from 52 to80 percent in the post-reform period.
5.94 Despite the patchy data and general lack of information necessary toconstruct common indicators of efficiency, vhat seemed to be borne out clearlywas that the industry tended to become more efficiency-oriented andcomnpetitive when the government removed or lessened impediments.

-104-
Refor snce
Ahluwalia, Isher Judge, 1985, Industrial Growth in India: Stagnation Since theKid-Sixtigs, Oxford University Press, New Delhi.
Ahluwalia, 1990, Contribution of Planning to Indian Industrialization, NewDelhi: Centre for Policy Research (unpublished).
Bangladesh Economic Suv 1986/87, Ministry of Finance, Bangladesh.
Bardhan, Pranab, 1990, "Symposium on the State and Economic Development,"Journal of Economic Perspectives, Volume 4, Number 3, Summer, pp. 3-7.
Basu, Kaushik, 1991, "Budget in the Time of Change: Reflections onRestructuring," Economic and Political Weekly, Vol. XXVI, No. 35, August 31.
Bhagwati, Jagdish N, and T.N. Srinivasan, 1975, Foreign Trade Regimes andEconomic Development: India, NBER Columbia University Press, New York.
Bhagwati, Jagdish N, 1982, "Directly Unproductive, Profit-Seeking (DUP)Activities," Journal of Political Economy, October, No. 90, pp. 988-1002.
Blejer, Mario I., and Nohsin S. Khan, 1983, *Government Policy and PrivateInvestment in Developing Countries," IMF Staff Pagers, Volume 31, Number 2,June, pp. 379-403.
Borensztein, Eduardo, 1989, -Debt Overhang, Credit Rationing, and Investment,"IMF Working Paper VP/89/74, September, (Washington, DC: International MonetaryFund).
Buiter, William H., and Urjit R. Patel, 1991, Debt. Deficits and Inflation: AnARRlication to the Public Finces of India, (mimeograph) Yale University, NewHaven.
Carr & Paynter Inc., 1990, Sri Lanka: Export Development Strategies and the Roleof ExRort DeveloRent Board, Rye, New York.
Chenery, Hollis, Sherman Robinson, and Moshe Syrquin, 1986, Industrialization andGrowth. A Co*garative Stud, (Washington, DC: Oxford University Press for theWorld Bank).
Chitale, V.P., 1986, Canital Ou tios in the Indian Econom, New Delhi:Economic and Scientific Research Foundation.
Cho, Yoon-Je, and Deena Khatkhate, 1989, Lessons of Financial Liberalization inAsia: A ComRarative Study, World Bank Discussion Papers # 50, Washington, DC:World Bank.
Chowdury, F., and J.G. Kleve, 1991, A Review of ExSort Policy and IncentiveSystems. Industrial Regulatory and Promotional Policies in Bangladesh,(mimeograph) World Bank, Washington DC.

-105-
Corbo, Vittorio, Morris Goldstein, and Mohuin S. Khan (Eds.), 1987, fro*thQriented Adiustment Programs, (Washington, DC: International Monetary Fund andthe World Bank).
Das, Kumar Bar, 1987, The Cement Industry of India, Ashish Publishing House,New Delhi, India.
Dasgupta, Deepak, 1991, Enterorise Regulation Reforms in Indonesia. 1983-90,(mimeograph) World Bank, Washington DC.
Dornbusch, Rudiger, and Alejandro Reynoso, 1989, "Financial Factors in EconomicDevelopment," American Economic Review, Papers and Proceedings, Volume 79,May, pp. 204-209.
Drabek, Zdensk, 1990, Industrial Restructuring Program of the PhiliR,ines: CementSubsector Study, The Development Bank of the Philippines, Manila.
Drabek, Zdensk, and R. Hooley, 1990, Total Factor Productivity. TradeLiberalization and Subcontracting in Philipoines, (mimeograph) World Bank,Washington DC.
The Economist, 1991, A Survey of India (Special SuRplement), May 4.
The Economist Intelligence Unit, 1991, Bangladesh Country Profile 1990-91.
Foreign Investment Advisory Service (PIAS), 1991a, Policy Framework to AttractForeign Direct Investment in Sri Lanka: Investment Policy Statement (19901,IFC-MIGA, Washington DC.
Foreign Investment Advisory Service (FIAS), 1991b, Institutional Frameworkfor Foreign Direct Investment in thg Philippines: Structures and activities,IFC-MIGA, Washington DC.
Froot, Kenneth, and Paul Krugman, 1990, Market Based Debt Reduction forDeveloping Countries: PrinciRles and Prospects, (unpublished; Cambridge,Massachusetts: National Bureau of Economic Research).
Gheirzi Textil Organisation, 1987, Indonesia: Textile Industry Stud, (mimeograph)Zurich, Switzerland.
Goldar, B.N., 1986, Productivity Growth in Indian Industries, Allied Publishers.
Government of Bangladesh, 1987a, Final Report on the Trade and Induwtrial PolicyfTIP) Reform Programme, Management and Planning Unit Trade and IndustrialPolicy Reform Programue, Dacca, Bangladesh.
Government of Bangladesh, 1987b, Overview of Trade and Industry Policy ReformRecommendations and their Macroeconomic Implications in Bangladesh, ManagementUnit Trade and Industrial Policy Reform Programme, Dacca, Bangladesh.
Government of Philippines, 1987, The Onibun Investments Code of 1987, ExecutiveOrder No. 226, Board of Investments, Department of Trade and Industry.

-106-
Government of Sri Lanka, 1989, A Strategy for Industrialization in Sri Lanka,Ministry of Industries, Colombo, Sri Lanka.
Grais, Wafik, Jaime de Melo, and Shujiro Urata, 1986, "A General EquilibriumEstimation of the Effects of Reduction in Tariffs and Quantitative Restrictionsin Turkey in 1978," In Srinivasan, T.N. and John Whalley, General Equilibriumand Trade Policy Modelling, Cambridge: MIT Press, pp. 61-89.
Greene, Joshua, and Delano Villanueva, 1991, "Private Investment in DevelopingCountries: An Empirical Analysis," IMF Staff Papers, Volume 38, Number 1,March, pp. 33-58.
Hossain, Najmal, 1991, The Impact of Industrial Policies in Bangladesh: AOuestion Revisite_, (mimeograph) World Bank, Washington DC.
Hutcheson, Thomas L., 1987, Fiscal and Balance of Pasments Effects of Trade andIndustrial Reforms, Management Unit Trade and Industrial Policy ReformProgramme, Government of Bangladesh.
Hutcheson, Thomas L., and Joseph J. Stern, 1986, Methodology of AssistancePolicy Analysis, Development Discussion Paper No. 226, Harvard Institute forInternational Development, Harvard University, Cambridge, Massachusetts.
Japan International Cooperation Agency, 1991, A Study on Industrial Sub-sectorDevelonment in Sri Lanka, (mimeograph) Tokyo, Japan.
Jayanntha, Dilesh, 1987, "Employment and Productivity in the Manufacturing Sectorof Sri Lanka, 1970-85," People's Bank Economic Review, August-September issue.
Kabir, Kaiser, 1991, The Regulatory Framework for Industry and Private Sector'sResponse to Liberialization Policies in Bangladesh, (mimeograph), World Bank,Washington DC.
Kelkar, Vijay L., aiad Rajiv Kumar, 1990, "Industrial Growth in the Eighties:Emerging Policy Issues," Economic and Political Weekly, January 27, pp 209-22.
Kelkar, Vijay L., Kumar, Rajiv, and Rita Nangia, 1990, India's IndustrialEconomy: Policies. Performance and Reforms (report prepared for ADB), NewDelhi: BICP.
Khan, Mohsin S., and Carmen Reinhart, 1990, "Private Investment and EconomicGrowth in Developing Countries," World Development, Volume 18, Number 1,January, pp. 19-27.
Khatkhate, Deena, 1991, "National Economic Policies in India," included inHandbook of Comparative National Economic Policies. Vol. I, Edited by D.Salvatore, Greenwood Press, Westport, Connecticut (forthcoming).
Krueger, Anne 0., 1.990, "Government Failures in Development," Journal ofEconomic PersRect,es, Volume 4, Number 3, Summer, pp. 9-23.
Lal, Deepak and Urjit Patel, Transaction Costs or the Cost of Doing Business:Empirical Estimates for Some Developing Countries, (Unpublished).

-107-
Levy, Brian, 1991, Obstacles to Developing Small and Medium Sized Entei,rises-Sin Empirical Assessment, PRE Working Paper Series No. 588, World Bank,Washington DC.
Luc:as, Robert. E.B., and Guatav Papanek (Eds.), 1988, The Indian Economy: RecentDeveloRments and Future Prospects, West View Press, Boulder, Colorado.
Medal:La, Erlinda M., 1990, An Assessment of Trade and Industrial Policy of thePhilippines 1986-88, Working Paper No.90-07, Philippines Institute forDevelopment Studies, Manila, Philippines.
Ministry of Planning, Bangladesh, 1989, Memorandm for the Bangladesh Aid Group.198-90, Dacca, Bangladesh.
Ministry of Planning, Bangladesh, 1990, An Assessment of the Impact of IndustrialPolicies in Bangladesh, Working Paper No. 16, Dhaka, Bangladesh.
Mubin, Abdul A.K., and Abdur Rab, 1989, Bangladesh: Industrial Regulatory andPromotional Policies, (mimeograph) World Bank, Washington DC.
Nagraj, R., 1989, "Growth in Manufacturing Output in India since 1980: SomePrelimenary Findings," Economic and Political Weekly, July 1.
Pfefferman, Guy P., and Andrea Madarassy, 1991, Trends in Private Investment inPeveloUing Countries. 1990-91 edition, Discussion Paper No. 11, InternationalFinance Corporation, Washington DC.
Rab, Abdur, 1989, Value of Bangladesh's Policies to Promote Exnorta,(mimeograph) World Bank, Washington DC.
Razzaque, M.F., 1988, Industrial Policy and Investment in Bansladesh, cited froman ADB study.
Sanidesara, J.C., 1991, "New Industrial Policy: Questions of Efficient Growth andSocial Objectives," Economic and Political Weekly, Vol XXVI, Nos 31 and 32,Akugust 3-10.
Sri.nivasan, T.N., 1991, 'Reform of Industrial and Trade Policies," Economicaind Political Weekly, Vol XXVI, No. 37, September 14.
Stern, Joseph J., Richard D. Mallon, and Thomas L. Hutcheson, 1986, ForeigExchange Regimes and Industrial Growth in Bangladesh, Development DiscussionPaper No. 222, Harvard Institute for International Development, HarvardUniversity, Cambridge, Massachusetts.
Sundrum, R.M., 1987, Growth and Income Distribution in India: Policy andPerformance Since Independence, Sage Publications India Pvt. Ltd., New Delhi.
Sunley, Emil M., and Heather Skilling, 1990, A Review of the Investment Policyaind Incentives of the Republic of the Philippines, A Report Prepared for theWorld Bank by Deloitte and Touche, Washington DC.

-108-
Takoda, Sachi, 1990, Bangladesh: Private Sector Industrial Investment,(mimeograph) World Bank, Washington DC.
Webster, Leila, 1989, World Bank Lending to Small and Medium EnterDrises:Fifteen Years of Experience, Industry and Energy Department Working PaperSeries No. 20, World Bank, Washington DC.
Westphal, Larry E., 1990, "Industrial Policy in an Export Propelled Economy:Lessons from South Korea's Experience," The Journal of Economic PersDectives,Volume 4, Number 3, Summer, pp. 41-59.
World Bank, World Develooment Report 1986, New York: Oxford University Press.
World Bank, World DeveloDment Report 1987, New York: Oxford University Press.
World Bank, 1989a, India: Poverty. EuDloyment and Social Services, A World BankCountry Study, Washington DC.
World Bank, 1989b, World Debt Tables 1989-90: External Debt of DeveloDin-C;ountrius, Washington DC.
WYrld Bank, World Develo=ment ReDort 1991, New York: Oxford University Press.

I 0'0
a I
aU~~~~~~~~~~~

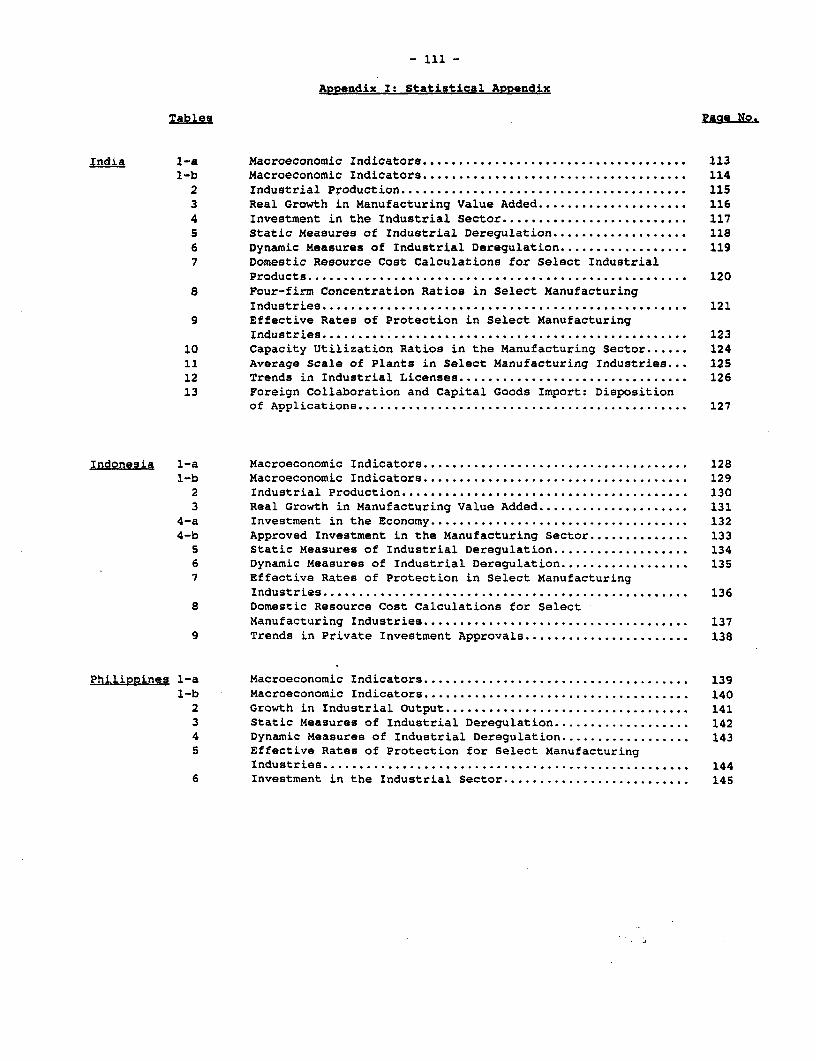
- ill -
Appendix I: Statistical Anoendix
Tables Page No.
India l -a Macroeconomic Indicators ..................................... 1131-b Macroeconomic Indicators ..................................... 114
2 Industrial Production ........................................ 1153 Real Growth in Manufacturing Value Added ..................... 116
4 Investment in the Industrial Sector .......................... 117
5 Static Measures of Industrial Deregulation ................... 118
6 Dynamic Measures of Industrial Deregulation .................. 119
7 Domestic Resource Cost Calculations for Select Industrial
Products .120
8 Four-firm Concentration Ratios in Select Manufacturing
Industries .121
9 Effective Rates of Protection in Select Manufacturing
Industries . 123
10 Capacity Utilization Ratios in the Manufacturing Sector . 124
11 Average Scale of Plants in Select Manufacturing Industries . 125
12 Trends in Industrial Licenses . 12613 Foreign Collaboration and Capital Goods Import: Disposition
of Applications . 127
Indonesia 1-a Macroeconomic Indicators . 128
1-b Macroeconomic Indicators . 129
2 Industrial Production . 130
3 Real Growth in Manufacturing Value Added . 131
4-a Investment in the Economy . 132
4-b Approved Investment in the Manufacturing Sector . 1335 Static Measures of Industrial Deregulation . 1346 Dynamic Measures of Industrial Deregulation . 135
7 Effective Rates of Protection in Select Manufacturing
Industries .136
8 Domestic Resource Cost Calculations for Select
Manufacturing Industries . 137
9 Trends in Private Investment Approvals . 138
Philionines 1-a Macroeconomic Indicators . 139
1-b Macroeconomic Indicators . 140
2 Growth in Industrial Output . 1413 Static Measures of Industrial Deregulation . 1424 Dynamic Measures of Industrial Deregulation . 1435 Effective Rates of Protection for Select Manufacturing
Industries . 144
6 Investment in the Industrial Sector . 145

- 112 -
Paae No.Sri Lanka 1-a Macroeconomic Indicators ..................................... 146
1-b Macroeconomic Indicators ..................... 147
2 Growth in Industrial Output ................... 148
3 Static Measures of Industrial Deregulation . .......... 149
4 Dynamic Measures of Industrial Deregulation . .10......... 1
5 Domestic Resource Cost Calculations for Select
Manufacturing Industries ..................... 151
6 Capacity Utilization in the Manufacturing Sector . ........ 152
7 Protection in Manufacturing ................... 153
Bangladesh 1-a Macroeconomic Indicators ..................... 154
1-b Macroeconomic Indicators .. 15................... 1
2 Industrial Production ...................... 156
3 Static Measures of Industrial Deregulation . ........... 157
4 Dynamic Measures of Industrial Deregulation . .18......... 1
5 Capacity Utilization in Select Manufacturing Industries ..... 159
6 Trends in Investment ....................... 160
Aopendix II: Chronological Summary of Industrial Dereaulation
India .... 161
Indonesia .... 165
Philippines .... 167
Sri Lanka ...................... 169
Bangladesh .... 171
APPendix III: Country Industry Studies a\
Indian Cement Industry .173Indonesian Textiles Industry .180
Philippines Cement Industry .186
Sri Lankan Textiles Industry .194
aj The industry study for Bangladesh is not presented in this section due to lack of
sufficient information.

APPENDIX I: INDIA TABLE 1.A
MACROECONOMIC INDICATORS
---------------------------------------------------- __-----------------------__------------------------------------------------
Average Average Average
1961-70 1971-80 1981-90 1985 1986 1987 1988 1989 1990------------------------------------------------------------------- __--------__------------------------------------------------
I. Real GDP growth Rate 2.9 3.5 5.7 6.6 4.8 4.5 9.4 5.0 4.1
Nominal GDP Growth Rate 10.4 12.3 14.1 13.8 11.8 13.3 17.6 13.2 n.a.
II. Investment and Savings
(as a % of GDP)
Gross Domestic Investment 16.5 20.3 23.9 25.9 24.3 22.9 24.0 24.1 23.1
Public 7.1 8.8 11.0 11.7 12.1 10.6 10.7 10.2 10.0
Private 9.4 11.5 12.9 14.2 12.2 12.3 13.3 13.8 13.1
Gross Domestic Savings 14.5 19.9 21.1 22.8 21.6 20.3 20.6 21.3 20.3
Public - 4.2 3.8 5.6 4.8 2.7 1.8 1.4 1.2
Private - 15.7 17.3 17.2 16.8 17.6 18.8 19.9 19.1 1
III. Fiscal Deficit/GDP -4.1 -4.5 -8.0 -8.5 -9.4 -8.6 -8.8 -9.2 -9.5 w
Domestic Financing/GDP 2.2 3.5 6.0 7.9 8.8 7.3 7.7 5.9 n.a I
Foreign Financing/GDP 1.6 0.5 0.7 0.5 0.7 1.0 0.6 0.7 n.a
IV. Balance of PaymentsCurrent Account Deficit/GDP -0.4 -0.2 -2.5 -2.7 -2.6 -2.5 -3.3 -3.2 -3.5
Exports/GDP 3.5 5.8 5.9 4.3 6.0 6.3 6.7 8.0 8.4
Imports/GDP 5.5 6.7 8.7 7.5 8.7 8.9 9.9 10.7 11.2
V. Exchanae RateReal Effective Exchange Rate 138.94 104.95 88.69 100.04 94.72 82.80 75.40 69.62 62.44
(1981 = 100)
Nominal Exchange Rate 6.1 8.2 13.4 12.24 12.79 12.97 14.95 16.03 18.07
(Rupee per $)…---------------------------------------------------------------------__-----__---------------------------------------------------
Source: IMF, International Financial Statistics, various issues; World Debt Tables, various issues; Annual Survey of India,various issues.

APPENDIX I: INDIA TABLE 1.BMACROECONOMIC INDICATORS
--------------------------------------------------- __------------------------__--------------------------------------------------_
Average Average Average1961-70 1971-80 1981-90 1985 1986 1987 1988 1989 1990
------------------------------------------------------------------- __--------__------------------------------.--------------------
VI. Inflation
CPI (growth rate) 6.2 8.0 8.7 5.6 8.7 9.2 9.1 6.2 6.6GDP Deflator(growth rate) 5.2 9.1 8.1 6.8 6.8 10.0 7.3 7.9 10.1
VII. MoneyM1/GDP 16.4 17.4 16.8 16.8 17.6 17.7 18.2 16.9 15.5M3/GDP 24.3 32.3 41.3 45.2 48.0 49.1 50.8 47.7 45.1
VIII. Deposit RateReal Rate -1.9 0.2 1.2 4.4 1.3 0.8 0.9 3.8 3.4Nominal Rate 5.3 8.2 10.0 10.0 10.0 10.0 10.0 10.0 10.0
IX. External DebtExternal Debt/GDP 16.0 13.8 18.5 19.2 21.1 21.7 21.4 24.1 25.2Debt Service Ratio 6.6 12.1 23.9 22.3 31.6 29.0 28.9 26.3 25.8
---------------------------------------------------------------------- __-----__---------------------------------------------------
Source: IMF, International Fihancial Statistics, various issues; World Debt Tables, various issues; Annual Survey of India,various issues.

- 115 -
APPENDIX I: INDIA TABLE 2INDUSTRIAL PRODUCTION
(growth rates % per annum)
------------------------------------------------------------------ __---------__--------------------
Average Average Average
1960. 1970s 1980. 1985 1986 1987 1988 1989------------------------------------------------------------------- __--------__-------------------
I. Industrial Production
(Growth rates: % per annum)
Basic Industries 8.0 4.4 5.5 6.7 9.2 5.6 5.0 4.1
Capital Goods 8.1 5.5 11.3 10.0 18.2 16.0 11.0 10.0
Industries
Intermediate Goods 4.6 3.7 5.6 7.4 4.4 4.7 8.6 2.3
Industries
Consumer Goods 4.3 3.4 9.0 12.5 7.1 7.4 11.8 8.0
Total Industrial 6.1 4.4 8.0 8.7 9.1 7.3 P 8 7.8
Production
Source:---------Bul--etin---various---issues;---Natio---al-Accounts----Stati-_tic--,--1989---------
Source: RBI Bulletln, varlous issues; National Accounts Statistics, 1989 issue.

- 116 -APPNDX Is t INDIA TABLZ 3
REAL GROWTN IN MANUFACTURING VALUE ADDED
(l per annum)
-------------------------------------------------------------------- __-------__--------------------
Average Average Average1960. 1970. 1980s 1984 1985 1986 1987 1988 1989
Basic Industries 8.4 5.9 6.0 3.5 11.4 2.6 8.7 4.9 4.0Basic Metal 10.1 4.8 5.8 -1.7 19.4 4.5 8.9 6.5 6.9Metal Products 7.3 3.1 4.1 8.7 3.4 0.7 8.5 2.8 0.9
Canital Goods Industries 9.0 5.5 11.2 11.3 12.4 13.4 14.1 13.0 10.7Non-electrical machinery 12.7 6.3 8.8 9.7 13.8 1.9 8.9 13.2 7.2Electrical Machinery 12.3 7.9 12.1 14.1 14.9 35.1 26.9 10.9 11.5Transport Equipment 7.5 3.1 10.1 8.7 3.4 0.7 8.5 11.2 11.3
Intermediate Industries 4.7 4.1 5.8 11.6 9.5 4.8 2.6 6.7 3.5Leather and fur products 1.8 0.8 2.6 12.3 11.2 11.9 3.8 -4.0 -1.4Wood and cork 3.3 -0.5 -3.1 9.2 -1.8 -0.5 3.5 4.8 3.9Rubber products 4.4 2.8 11.1 14.3 18.9 -5.3 -7.1 8.3 0.6Petroleum products 0.2 2.8 11.1 14.3 18.9 -5.3 -7.1 8.3 0.6Chemicals and chemical prd. 9.9 5.2 12.1 12.6 8.9 10.5 11.0 16.3 8.7Non-metallic mineral products 5.0 4.4 10.2 9.6 10.6 7.4 1.8 12.7 8.2
Consumer Goods Industries 6.4 4.4 10.2 12.5 6.6 8.7 10.0 8.5 7.0Food products 2.3 1.0 8.9 16.6 -3.0 4.4 3.4 6.5 10.9Beverages 8.3 2.9 2.8 39.2 -5.8 -3.7 -7.6 8.5 3.4Tobacco, etc. 1.4 2.9 2.8 39.2 -5.8 -3.7 -7.6 8.5 3.4Textiles 4.2 5.7 4.1 5.2 3.1 8.4 5.2 7.3 2.0Paper and paper products 9.4 3.0 6.0 9.4 19.8 12.7 9.9 3.0 3.8Miscellaneous 9.4 1.8 16.6 -7.9 18.7 21.6 39.6 11.2 6.2
All Sectors 7.1 4.2 7.6 8.8 6.1 9.1 9.1 8.8 7.0
Source:---------------------------Natio--al-A----u----Sta----tic----1989;----__bullet-----1988-89.-
Source: I.J. Ahluwalia, 1985: National Accounts Statistics, 1989; RBI bulletin, 1988-89.

- 117 -
APPENDIX I: INDIA TABLE 4INVESTMENT IN THE INDUSTRIA& SECTOR
(as a % of GDP)
Average Average Average
1960s 1970s 1980s 1985 1986 1987 1988 1989 1990------ _.--..-------------------------------------------------------__--------__----------------------
Manufacturing 4.2 5.1 4.6 3.7 3.5 5.8 5.6 5.7 n.a
Registered 3.5 3.8 3.4 2.7 2.6 4.0 4.1 4.2 n.a
Unregistered 0.7 1.3 1.2 1.0 0.9 1.8 1.5 1.5 n.a
Privatie Sector 9.4 11.5 12.9 14.2 12.2 12.3 13.3 13.8 13.1
Public Sector 7.1 8,8 11.0 11.7 12.1 10.6 10.7 10.2 10.0
Gross Domestic Investment 16.5 20.3 23.9 25.9 24.3 22.9 24.0 24.1 23.1
Source: National Accounts Statistics, 1990.

APPENDIX I: INDIA TABLE 5STATIC MEASURES OF INDUSTRIAL DEREGULATION
------------------------------------------------------ __---------------------__---------------------------------------------------
Industry Effective Rate of Protection Domestic Resource Cost Four-firm Conc. Ratio ICOR1973-77 1985-89 1973-77 1985-89 1973-77 1985-89 1973-77 1985-89
------------------------------------------------------------- __--------------__---------------------------------------------------
Basic Industries 63 49 1.63 1.49 70.0 65.1 7.6 5.1
Capital Goods Industries 66 25 1.66 1.25 68.0 62.0 9.2 4.0 1
H
Intermediate Goods Industries 130 74 2.30 1.74 74.3 63.9 5.5 3.9 1
Consumer Goods Industries 110 70 2.10 1.70 75.3 72.1 3.9 3.2
Manufacturing Sector 92 37 1.92 1.37 72.0 65.7 7.0 4.1
Source: India, National Accounts, 1990; India, Annual Survey of Industries, various issues; CMIE, 1986 and 1989.

APPENDIX I: INDIA TABLE 6
DYNAMIC MEASURES OF INDUSTRIAL DEREGULATION
TRENDS IN TOTAL FACTOR PRODUCTIVITY AND LABOR PRODUCTIVITY
(% per annum)------------------------------------------------------------------ __---------__--------------------------------------------------
Industry Growth of Total Factor Productivity Growth in Labor Productivity
1964-65 to 1979-80 1979-80 to 1986-87 1964-65 to 1979-80 1979-80 to 1986-87------------------------------------------------------------------ __---------__--------------------------------------------------
Manufacturing -0.3 3.9 2.5 8.3
Basic Goods -1.2 1.0 1.1 5.2
Intermediate Goods -0.8 1.4 1.5 9.7 F
Capital Goods 1.7 3.4 3.6 8.7
Consumer durables 0.9 6.6 4.2 8.2
Consumer nondurables -0.5 5.2 2.5 11.2
So----rce:---------------h--u---a--ia-----1985-------Annual------Survey------of---Industries,----------various-------is----ues.--
Source: I.J. Ahluwalia, 1985; Annual Survey of Industries, various issues.

APPENDIX r: INDIA TABLE 7
DOMESTIC RESOURCE COST CALCULATIONS (DRCI FOR SELECT INDUSTRIAL PRODUCTS
---------------------------------------------------------__------------------__--------------------------------------------------
Industry Domestic Resource Cost Industry Domestic Resource Cost
1973-77 1985-89 1973-77 1985-89
-------------------------------------------------------------__--------------__---------------------------------------------------
Capital Goods 1.66 1.25 Intermediate Goods 2.30 1.74
Hand Tools 1.40 1.33 Synthetic Fibers and Resins 3.15 2.62
Power Hand Tools n.a. 0.77 Plastic Products 3.29 1.37
Machine Tools 1.35 1.21 Petroleum Products 2.33 1.85
Nonelectrical Machinery ,1.80 1.64 Cotton Yarn n.a. 1.52
Electrical Machinery 2.08 1.42 Nylon Filament Yarn n.a. 2.01
Carburetors n.a. 0.8 - 0.9 Nylon Tire Yarn n.a. 1.53
Diesel Engines n.a. 0.89 Synthetic Yarn n.a. 0.80
Hydro Turbine n.a. 1.0 Rubber Products 1.66 2.21
Turbo Generator Set n.a. 1.0 Tires n.a. 1.83
Radial Drill n.a. 1.48 Pesticides 1.07 0.71
Surface Grinder n.a. 1.51 Vinyl Acetate Monomer n.a. 6.27 - 7.55 o
Consumer Goods 2.10 1.70 Basic Goods 1.63 1.49
Motor Vehicles 2.03 1.85 Heavy Chemicals 1.98 1.68
Bicycles 1.62 1.24 Iron Ore n.a. 0.93
Audio Systems 1.63 1.45 Electric Arc Steel n.a. 1.11 - 1.55
Synthetic Textiles n.a. 2.0 Alloy Steel n.a. 1.05
TVs n.a. 1.82 Casting and Forging n.a. 1.72
TV Speakers n.a. 2.20 Aluminum Products 1.52 0.84
Color TV Crystal n.a. 2.33
Personal Computors n.a. 1.16
Edible Oils 1.90 1.85
Newsprint n.a. 0.85
Source: Kelkar and Kumar, EPW, Jan 27, 1990.
Note: Under BICP methodology, DRC calculations are ERP plus one.

APPENDIX I: INDIA TABLE 8 (Continued)
FOUR-FIRM CONCENTRATION RATIOS IN SELECT INDUSTRIES
Industry Four-firm Concentration Ratio Industry Four-firm Concentration Ratio
1976 1984-85 1987-88 1976 1984-85 1987-88
Basic Industries Intermediate Industries
Urea n.a. 50.7 49.6 Paints and Varnishes 88.6 61.8 52.5
Phosphatic Fertilizers n.a. 49.0 30.4 Dye and Pigaments 75.1 71.7 58.0
Oxygen n.a. 49.5 76.6 Floor and Wall Tiles n.a. 56.3 49.0
Dissolved Acetylene Gas n.a. 46.7 36.9 Cotton and Blended Yarn n.a. 13.6 10.4
Caustic Soda n.a. 36.0 36.7 Jute Textiles 17.4 25.0 17.7
Soda Ash 100.0 91.2 93.2 Nylon Filament Yarn 82.0 64.5 63.8
Cement 59.6 41.0 38.4 Polyester Staple Fiber 100.0 89.7 68.2 1
Asbestos Cement and fittings n.a. 97.2 81.1 Acrylic Fiber 100.0 100.0 100.0
Saleable Steel and Rolled Products n.a. 70.9 56.5 Nylona Tire Yarn 100.0 84.2 89.7 '
Ferrous Castings and Forgings 25.5 13.0 28.5 Newsprint 100.0 100.0 72.5 1
Steel Pipes and Tubes 34.4 16.1 27.5 Automobile Tires 35.8 61.1 55.7
Steel Wire and Ropes n.a. 58.7 51.1 Automobile Tubes 50.7 60.2 47.6
Steel Structurals n.a. 50.5 41.7 Bearings 75.6 74.3 75.2
Aluminum Ingots n.a. 99.4 89.5 Dry Cells 66.1 80.2 87.0
Aluminum Rolled Products n.a. 96.2 98.1
Aluminum Extrusions n.a. 90.6 77.5 Average for Intermediate - 67.3 60.5
Methanol n.a. 100.0 94.5 Industries
Acetic Acid n.a. 35.3 25.9
Caprolactum 100.0 100.0 100.0
Low Density Polyethylene n.a. 100.0 100.0
High Density Polyethylene n.a. 100.0 100.0
Average for Basic Industries - 66.7 63.5
Source:-----------------------------C-------------E--------(1986---__--------__-------and---------------1989------------------.---
Source: CMIE (1986 and 1989).

APPENDIX I: INDIA TABLE n8{Concl-udedjFOUR FIRM CONCENTRATION RATIOS IN _SELECT INDUSTRIES
Industry Four-firm Concentration Ratios industry Four-firm Concentration Ratios
1976 1984-85 1987-88 1976 1984-85 1987-88
Capital Goods Industries Consumer Goods Industries
Durables
Fan and V Belts n.a. 30.1 22.2 Incandescent Lamps n.a. 61.7 52.6Refractories n.a. 35.3 48.1 Electric Fans n.a. 81.2 68.6Tractors n.a. 56.2 69.2 Cars 100.0 100.0 100.0Mining Machinery n.a. 57.4 53.9 Motorcycles n.a. 100.0 93.4Earth Moving Machinery n.a. 98.5 89.4 Mopeds n.a. 96.9 86.0Material Handling Equipment n.a. 86.2 83.8 Scooters n.a. 95.9 95.9Cranes n.a. 77.4 52.3 Three Wheelers n.a. 100.0 100.0Textile Machinery 42.4 61.0 51.9Chemical Machinery 42.3 52.5 40.5 Non DurablesWires and Cables n.a. 52.1 54.5 Soaps 85.7 79.9 90.8Transformers n.a. 57.9 62.9 Drug Formulations 20.7 18.4 20.8Heavy Commercial Vehicles 100.0 100.0 100.0 Vanaspati 26.1 29.9 28.7
Infant Milk Foods 78.6 84.3 71.1Average for Capital Goods Malted Foods 98.0 97.8 100.0Industries - 63.7 60.7 Sugar 3.6 6.7 6.2
Beer n.a. 43.0 55.1
Liquors n.a. 70.8 67.1
Cigarettes 96.3 95.7 92.1
Paper 42.5 28.7 39.8
Average for Durables - 90.8 85.2
Average for Nondurables - 55.4 57.2
Source: CMIE (1986 and 1989).

APPENDIX I: INDIA TABLE 9
EFFECTIVE RATES OF PROTECTION IN VARIOUS MANUFACTURING INDUSTRIES
IndustrY Effective Rate of Protection (%) IndustrY Effective Rate of Protection (%)
1973-77 1985-89 1973-77 1985-89
Consumer Goods 110 70 Intermediate Goods 130 74
Edible Oils 90 85 Synthetic Fibers and Resins 215 162
Synthetic Textiles n.a. 100 Plastic Products 229 37
Hiotor Vehicles 103 19 Petrochemical Products (IPCL) n.a. 225
Bicycles 62 24 Petroleum Products (other) 133 85
Audio Systems 63 45 Cotton Yarn n.a. 52
Personal Computors n.a. 16 Synthetic Yarn n.a. -20
Floppy Diskette n.a. 0 Nylon Tire Yarn n.a. 53
TVs n.a. 82 Polyster Filament Yarn n.a. 47
TV Speakers n.a. 120 EPM Rubber 66 121Electronic Tuners 230 287 Buta Rubber n.a. 68
Washing Machines n.a. -9 Tires n.a. 83
Pesticides 7 -29
BOPP Film n.a. 79
Capital Goods 66 25 Basic Goods 63 49
Hand Tools 40 33 Heavy Chemicals 98 68
Power Hand Tools n.a. -23 Iron Products and Steel products (all) 39 72
Machine Tools 35 21 Casting and Forging n.a. 72
Nonelectrical Machinery 80 64 Aluminum products (all) 52 -16
Electrical Machinery 108 42
Diesel Engines n.a. -11
Carburetors n.a. -23
Shock Absorbers n.a. 17
Source: Nambiar, EPW, 1983 and World Banklc Staff Calculations.
Note: The classification of industrial products i_L; based on the Classifica'; t System of the Government of Y: 'a.

APPENDIX I: INDIA TABLE 10CAPACITY UTILIZATION RATIOS IN THE MANUFACTURING SECTOR
(per cent)
1961-65 1966-70 1971-75 1976-80 1981-87
Basic Goods Industries 86.0 82.0 57.2 62.0 66.9
Capital Goods Industries 85.9 66.4 60.2 60.4 71.7
Intermediate Goods Industries 89.3 81.9 79.7 81.0 76.7 4
Consumer Goods Industries 86.6 82.2 80.1 79.6 74.5
Manufacturing Sector Average 87.0 78.1 69.3 70.8 72.5
Source: Industrial Bank of India, Annual Report, various issues; CMIE, Production and Capacity Utilization in 600 industries,1987.

APPENDIX I; INDIA TABLE 11
AVERAGE SCALE OF PLANTS IN SELECT INDUSTRIES
(for period 1985-89)
------------------------------------------------------------- __--------------__--------------------------------------------------
(1) (2) (3) (4)
Industry/Product Average Scale of Plants in Minimum Economic International (2) as % (2) as B
India (000 units/year) Scale According Efficiency of (3) of (4)
to Indian Conditions Standards (IES)
------------------------------------------------------------- __--------------__--------------------------------------------------
Consumer Goods
Cars 59.0 50 250 118.0% 23.6%
Bicycles >1000 2500 5000 40.0% 20.0%
Light Commercial Vehicles 6.7 25 250 26.8% 2.7%
Color TVs 20-50 150 2000 23.3% 1.8%
Paper 9.9 33 >25 13.2% 39.6% i
Capital Goods >
Heavy Commercial Vehicles 35.9 25 30 143.6% 132.0%
Printed Circuit Boards 5-10 n.a. 20 n.a. 25-50%
Mini-steel Plants 29 150 500 19.3% 5.8%
Telephone Instruments 185 n.a. 200 n.a. 92.5%
Cables 500 n.a. 2000 n.a. 25.0%
Basic Goods
Polypropylene 30 100 100 30.0% 30.0%
Polystyrene 7 40 30 17.5% 23.3%
PVC 22 100 100 22.0% 22.0%
HDPE 40 100 100 40.0% 40.0%
LDPE 32 100 100 32.0% 32.0%
Cement 450 n.a. 1000 n.a. 45.0%
Fertilizers 186 n.a. 450 n.a. 41.3%
Source: CMIE, Production and Capacity Utilization in 600 Industries, 1987.

- 126-
APPENDIX I: INDIA TABLE 12TRSNDS IN INDUSTRIAL LICENSES
(average per year)
______________________,____________________________________________________________________________
Period Letters of Industrial Registrations of
Intent Licenses Approved Delicensed
Investments
1972 to 1977 806 694 331
1978 to 1983 825 529 1775
1984 to 1989 1151 626 2204
Source: World Bank Staff Calculations.

APPENDIX I: INDIA TABLE 13FOREIGN COLLABORATION AND CAPITAL GOODS IMPORT
DISPOSITION OF APPLICATIONS
…------------------------------------------------------------__--------------__---------------------------------------------------
Average per Year t of Total
Year Type of Applications Total cases Number of Approvals Rejections Other
Application Received Disposed Approvals
…---------------------------------------------------------__-----------------__---------------------------------------------------
1978-80 Foreign 527 533 317 59.5 14.3 26.2
Collaboration
Capital Goods 556 519 267 51.5 8.1 40.4
Import I
I-.
1981-84 Foreign 543 518 368 71.0 24.5 4.5
Collaboration
Capital Goods 402 401 282 70.4 21.3 8.3
Import
1985-89 Foreign 797 750 575 76.7 18.4 4.9
Collaboration
Capital Goods 267 262 188 71.8 23.4 4.8
Import
…--------------------------------------------------------------- ----------------------------------------------------------------
Source: World Bank Staff Calculations.
Note: The category Other refers to applications withdrawn or closed with no decision.

APPENDIX I: INDONESIA TABLE l.bMACROECONOMIC INDICATORS
Average Average Average1960s 1970s 1980s 1985 1986 1987 1988 1989 1990
I. Real DP growt h rate 8. S.4 2.4 5.9 4.7 5.7 7.4 7.1Nominal GDP growth rate 22.9 30.3 14.5 7.9 5.9 21.4 12.0 17.1 16.3
II. Investment and Savings
(as a % of GDP)Gross Domestic Investment - 20.9 24.9 24.0 23.0 22.5 22.2 23.5 24.6Public - 3.9 9.7 10.3 8.5 7.9 8.4 8.2 8.5Private - 17.1 15.2 13.7 14.5 14.6 13.8 15.3 16.1
Gross Domestic Savings - 20.3 21.4 21.5 17.5 19.1 19.9 21.4 21.4Public - 5.4 5.3 4.5 3.0 5.0 4.8 5.9 9.5 1Private - 14.9 16.1 17.0 14.5 14.1 15.1 14.0 11.9 H
III. Fiscal Deficit/GDP -2.5 -1.9 -1.3 -0.3 -2.6 -1.6 -2.9 -2.0 2.0Domestic Financing/GDP 0.3 0.2 0.3 - - 0.9 0.7 0.3 -Foreign Financing/GDP 2.2 1.7 1.5 0.3 2.6 0.7 2.2 1.7 -
IV. Balance of PaymentsCurrent Account Deficit/GDP -3.5 -1.3 -3.3 -2.2 -4.9 -2.8 -1.7 -1.2 -3.8Exports/GDP 11.1 23.1 24.6 22.6 19.5 23.9 24.4 25.5 26.3Imports/GDP 11.3 20.2 26.1 21.0 20.5 22.4 21.9 23.1 25.6
Source: International Financial Statistics, IMF; World Debt Tables, World Bank; and, World Bank Staff Calculations.

APPENDIX I: INDONESIA TABLE 1.B
MACROECONOMIC INDIACTORS
Average Average Average
1960s 1970s 1980s 1985 1986 1987 1988 1989 1990
V. Exchange Rate
Real Effective Exchange Rate - 104.0 77.1 89.8 69.1 50.8 49.0 49.7 48.8
(1980 = 100)
Nominal Exchange Rate 268.8 457.8 1256.4 1110.6 1282.6 1643.8 1685.7 1770.1 1842.8
(Rupiah per $)
VI. Inflation
CPI (growth rate) 13.9 19.5 9.4 4.3 9.2 9.3 5.6 6.1 9.9GDP Deflator (growth rate) - 23.6 9.3 5.3 -0.1 15.8 7.2 7.7 8.5
VII. Money
M1/GDP 6.6 10.1 10.8 10.4 11.3 10.2 10.1 12.4 13.2
M3/GDP 8.2 15.9 25.2 23.9 26.9 27.2 29.6 35.2 37.6
VIII. Deposit Rate
Real Rate -8.5 4.9 12.6 5.5 7.3 11.3 12.2 9.0
Nominal Rate - 9.4 14.1 18.0 15.4 16.9 17.7 18.6 20.0
IX. External Debt
External Debt/GDP 29.7 32.1 48.4 44.4 56.9 73.8 67.1 59.8 58.6
Debt Service Ratio 7.0 10.4 27.7 29.5 35.9 38.5 42.7 35.2 27.3
Source: International Financial Statistics, IMF; World Debt Tables, World Bank; and, World Bank Staff Calculations.

- 130 -
APPENDIX I: INDONESIA TABLE 2INDUSTRIAL PRODUCTION
(growth rates I per annum)
Average Average Average1975-79 1980-85 1986-90 1986 1987 1988 1989 1990
Manufacturina aj 7.4 11.2 12.4 11.1 11.4 12.8 11.6 14.9
Basic Goods 34.2 15.1 8.7 6.6 1.1 2.1 18.2 15.6Industries
Capital Goods 7.5 6.1 12.0 10.9 -3.4 7.2 28.1 17.1Industries
Intermediate Goods 14.5 10.8 11.3 6.6 -0.7 18.4 19.9 12.2Industries
Consumer Goods 6.5 4.9 10.0 2.1 5.7 12.7 11.3 17.5Industries
Source: World Bank Staff Calculations.
a\ The growth rates shown for the manufacturing sector are the growth In real value added,whereas, the figures shown for the other sub-sectors are the growth in value of output atconstant prices.

- 131 -
APPENDIX It INDONESIA TABLE 3REAL GROWTH IN MANUFACTURING VALUE ADDED
(I per annum)
Average Average1970s 1980s 1985 1986 1987 1988 1989
Manufacturing 7.9 8.2 6.6 5.1 11.4 13.5 11.2
Basic Goods 6.7 8.3 8.1 8.2 4.0 5.3 12.0Industries
Capital Goods 5.3 4.7 1.4 7.5 4.2 -0.3 7.0Industries
Intermediate Goods 6.5 8.0 4.6 6.0 11.3 13.2 14.6Industries
Consumer Goods 4.9 4.7 0.6 3.9 6.1 9.4 10.8Industries
Source: Central Bureau of Statistics, Bank Indonesia; Statistik Indonesia, Biro Pusat Statistik,various issues; and, World Bank Staff Calculations.

- 132 -
APPENDIX Ss INDONESIA TABLE 4.aINVESTMENT IN TEE ECONOMY
(as a I of CDP)
Average Average
1970S 1980. 1985 1986 1987 1988 1989
Private Sector 17.1 15.2 13.7 14.5 14.6 13.8 15.3
Public Sector 3.9 9.7 10.3 8.5 7.9 8.4 8.2
Gross Domestic 20.9 24.9 24.0 23.0 22.5 22.2 23.5
Investment
Source: World Bank Staff Calculations.

- 133 -
APPENDTX I: INDONESIA TABLE 4.bAPPROVED INVESTMENT IN TEE NANUFACTURING SECTOR
(% growth per annum)
Average Average
1977-80 1980s 1985 1986 1987 1988 1989 1990
Manufacturing 46.8 61.7 -0.6 2.6 167.7 113.1 26.5 186.0
Foreign 67.5 51.7 -31.4 -21.8 58.6 349.3 10.9 37.1
Domestic 32.5 70.9 22.5 12.9 199.6 76.6 32.6 234.4
Source:i World Bank Staff Calculations.

APPENDIX I: INDONESIA TABLE 5STATIC MEASURES OF INDUSTRIAL DEREGULATION
Industry Effective Rate of Protection Domestic Resource Cost ICoR Four-firm Conc. RatioAverage Average Average Average Average Average Average Average1975-77 1987-90 1975-77 1987-90 1975-77 1986-89 1975-77 1986-89
Manufacturing Sector 74.1 53.2 1.7 1.5 3.4 5.3 60 55
Basic Industries 38.7 25.0 1.4 1.3
LaJCapital Goods Industries 15.3 145.5 1.2 2.5 - - - -
Intermediate Goods Industries 49.0 10.0 1.5 1.1
Consumer Goods Industries 117.0 72.7 2.2 1.7
Sources World Bank Staff Calculations; and, Statistik Indonesia, BPS Indonesia, various issues.

- 135 -
APPENDIX I: INDONESIA TABLE 6DYNAMIC MEASVRZS OF INDUSTRIAL DZRZGULATION
TRENDS IN TOTAL FACTOR PRODUCTIVITY AND IABOR PRODUCTIVITY(% per annau)
Average Average Average1975-81 1982-85 1986-88
I. TotAl Factor Productivity
Manufacturina Sector Total 0.9 -2.5 1.0
IX. Labor Productivity
Manufacturinc Sector Total 1.2 1.1 1.3
Source: World Bank Staff Calculations; and, Statistik Indonesia. Various issues of Biro PusatStatistik.

- 136 -
APPENDIX I: INDONESIA TAMLS 7EFFECTrVE RATES OF PROTECT1ON SS VARIOUS MANUFACTURING INDUSTRIES
Industry Effective Rate of Protection 1%)1975 1987 1990
Basic Industries 38.7 8.0 5.0
Non-oil mining - -1 1Oil refining - -1 -1Iron and steel basic industries 18.2 13.0 10.0Chemicals 28.4 14.0 13.0Cement 63.6 60.2 53.6
Capital Goods Industries 15.3 150.0 97.0
Engineering goods - 152.0 139.0
Intermediate Goods Industries 49.0 42.0 40.0
Wood and cork products -1.2 25.0 ^ 33.0Rubber and plastic products 426.0 57.0 48.0
Consumer Goods Industries 116.2 87.0 64.6
Food, beverages and tobacco 336.2 122.0 124.0Paper and paper products 87.3 31.0 20.0Textiles, cloth and footwear 231.8 102.0 35.0
Manufacturing Total 74.1 68.0 59.0(excluding oil refining)
All Tradeables 29.7 26.0 24.0(excluding oil sector)Import-competing secto.r 61.0 39.0 35.0Export-competing sector -6.0 -2.0 -1.0
Source: World Bank Staff Calculations.

- 137 -
APPSNDIX I: INDONESIA TABL 8DOMESTIC RESOURCE COST CALCULIATIONS FOR SELECT INDUSTRIES
Industry Domestic Resource Cost (DRCI Calculations1975 1987 1990
8asic Industries 1.4 1.1 1.1
Non-oil mining - 0.9 1.0Oil refining - 0.9 0.9Iron and steel basic industries 1.2 1.1 1.1Chemicals 1.3 1.1 1.1Cement 1.6 1.0 0.9
Capital Goods Industries 1.2 2.1 1.9
Engineering Goods - 2.5 2.4
Intermediate Goods Industries 1.5 1.4 1.4
Wood and cork products 0.9 1.3 1.3Rubber and plastic products 5.3 1.6 1.5
Consumer Goods Industries 2.1 1.9 1.6
Food, beverages and tobacco 4.4 2.2 2.2Paper and paper products 1.9 1.3 1.2Textiles, cloth and footwear 3.3 2.0 1.4
Manufacturing Total 1.7 1.7 1.6(excluding oil sector)
All Tradeables 1.3 1.3 1.2(excluding oil sector)Impcort-competing sector 1.6 1.4 1.3Expcrt-competing sector 0.9 1.0 1.0
Source: World Bank Staff Calculations.
Note: DRC calculations are based on effective rate of protection plus one.

- 138 -
APPENDrX Is INDONESIA TABLE 9
TRENDS IN PRIVATE INVESTMENT APPROVALS(Foreign in US$ million, Domestic in Rp billion)
Average Average Average
1982-84 1985-87 1988-89
Industry Foreign Domestic Foreian Domestic Foreign Dom
Basic Industries 592.7 363.6 82.4 163.0 79.0 153.3
Capital Goods 33.5 578.7 61.1 47.0 11.0 114.1
Industries
Intermediate Goods 80.2 318.4 173.1 783.7 917.5 1
Industries
Consumer Goods 179.0 176.8 45.4 307.2 384.9 929.4
Industries
Manufacturing Total 1994.7 4570.9 1047.4 6143.8 2336.8 10
Source: World Bank Staff C:alculations.

APPENDIX I: PHILIPPINES TABLE 1.A
MACROECONOMIC INDICATORS
Average Average
1970s 1980s 1985 1986 1987 1988 1989 1990a\
I. Real GDP growth rate 6.1 1.9 -4.2 2.1 4.7 6.2 6.1 2.6
II. Investment and Savings
(as a % of GDP)
Gross Domestic Investment 24.6 20.3 15.1 13.2 16.2 17.4 18.7 18.2
Public 6.9 4.9 3.7 3.1 3.3 3.1 4.0 n.a.
Private 17.7 15.4 11.4 10.1 12.9 14.3 14.7 n.a.
Gross Domestic Savings 24.1 19.0 16.9 19.1 16.5 17.9 17.4 13.1
Public b\ - 0.5 - -1.0 1.7 1.1 0.5 0.4
Private - 16.3 - 20.1 14.8 16.8 16.9 12.7
III. Fiscal Deficit/GDP -0.4 -2.8 -1.8 -4.9 -2.4 -2.5 -2.0 -2.9
Domestic Financing/GDP - 2.1 1.8 4.3 1.4 2.2 1.2 3.0
Foreign Financing/GDP 0.7 - 0.6 1.0 0.3 0.8 -0.1
IV. Balance of Payments
Current Account Deficit/GDP -2.8 -4.7 -0.3 2.7 -1.3 -1.0 -3.3 -6.5
Exports/GDP 15.2 15.5 14.0 15.5 16.5 18.0 17.5 n.a.
Imports/GDP 20.1 20.5 16.5 17.1 20.8 22.3 25.2 n.a.
Source: IMF, International Financial Statistics; World Bank, World Debt Tables; and, World Bank Staff Calculations.
Note: aA The 1990 figures are preliminary.
b\ The breakdown of GDS into public and private savings is available for 1986-90 only. The average for 1980s in both
cases is the average for that period.

APPENDIX It PHILIPPINES TABLE l.8
KACROECONOKIC INDICA.TORS
Average Average
1970s 1980. 1985 1986 1987 1988 1989 1990
V. Exchange Rate
Real Effective Exchange Rate 94.2 84.3 97.7 76.2 70.1 68.2 72.1 69.3(1980=100)
Nominal Exchange Rate 7.1 17.1 18.6 20.4 20.6 21.1 21.7 24.3
(Pesos per US$)
VI. Inflation
CPI (growth rate) 12.9 14.9 23.2 0.8 3.8 8.7 10.6 12.6
GDP Deflator (growth rate) 12.0 14.1 17.7 1.5 7.0 9.8 10.1 14.2
VII. Money
M1/GDP 9.5 7.3 6.0 6.9 7.6 7.4 8.4 7.1
M3/GDP 19.9 27.3 26.1 26.0 26.1 27.9 31.1 31.9
VIII. Deposit Rate
Real Rate -2.9 2.2 -4.3 10.5 4.4 2.6 3.7 6.0
Nominal Rate 10.3 16.2 18.9 11.3 8.2 11.3 14.3 18.6
IX. External Debt
External Debt/GDP - 74.6 83.5 94.1 87.8 74.8 65.7 65.2
Debt Service Ratio - 33.7 32.0 34.5 38.5 31.5 26.3 25.7
Source: IMF, International Financial Staistics; World Bank, World Debt Tables; and, World Bank Staff Calculations.

- 141 -AgPPNDIX I: PHILIPPINES TABLE 2GROWTH IN INDUSTRIAL OUTPUT a\
(I per annum)
Average Average Average1972-79 1980-84 1985-89 1986 1987 1988 1989
Manufact:uring Total 6.0 1.0 3.1 0.8 6.7 9.0 6.3
Consumer Goods 6.7 2.1 4.5 3.5 5.2 9.0 10.3Industries b\
Capital Goods 7.3 -3.7 9.1 6.7 11.7 12.0 22.1Industries
Intermediate Goods 3.8 0.2 3.2 -6.5 8.4 13.3 9.2Industri.es
Basic Goods 6.5 -1.6 4.1 -2.8 7.6 14.4 9.8Industries
Source: The Philippines, Statistical Yearbook, 1990 and 1989; and, World Bank Staff Calculations.
Note: a\ Growth in real value added.
b\ The following classification was used to divide the manufacturing sub-sectors:Consumer Goods - Food products, beverages, tobacco; footwear and wearing apparel;
paper and paper products; publishing and printing.Capital Goods - All machinery (electrical and non-electrical); all transport
equipment.Intermediate Goods - Wood and cork products; furniture and fixtures; leather and
leather products; rubber products.Basic Goods - All chemical products; Petroleum and coal products; nonmetallic
mineral products; all metal products (including iron and steel).

APPENDIX I: PHILIPPINES TABLE 3
STATIC MEASURES OF DEREGULATION a\
Effective rate of protection (%% Domestic Resource Cost b\ IOOR pA1979 1985 1990 1979 1985 1990 1973-80 1980-90
All Manufacturinn 43.0 38.0 3-.8 1.4 1.3 i.4 4.2 12.6
Exportables 1.0 -3.2 -2.0
Importables 51.0 53.4 51.9
Consumer Goods - 33.9 29.7 - 1.3 1.2 - -
IndustriesExportables - -5.7 -4.3
Importables - 74.9 65.0
Capital Goods - 48.4 31.0 - 1.5 1.3 - -
Industries
Exportables - 0.0 0.0
Importables - 60.1 38.0
Intermediate Goods - 48.0 45.0 - 1.5 1.4 - -
IndustriesExportables - 3.4 4.0
Importables - 46.0 41.5
Basic Goods - 59.7 49.0 - 1.6 1.5 - -
IndustriesExportables - -4.1 -3.7
Importables - 60.5 49.7
Source: Medalla, Arlinda. 1990. "An Assessment of Trade and Industrial Policy, 1986-88", Philippine Institute of Development
Studies; Tariff Commission Report, 1991.Note: a\ One of the measures - Four-firm concentration ratio, used elsewhere in the analysis was not available for Philippines.
DA The DRC calculations are based on the methodology (1 + EPR).c Economy wide ICOR. The data on manufacturing sector investment was not available.

- 143 -
APPENDIX I: PIILIPPINES TABLE 4DYNAMIC MEASURES OF INDUSTRIAL DEREGULATION
TRENDS IN TOTAL FACTOR PRODUCTIVITY AND LABOR PRODUCTIVITY a\
1970-80 1981-83 1984 1985-87
Total Factor Productivity
All Manufacturing -1.20 2.31 -21.9 4.51
Labor Productivity b\
All Manufacturing -1.72 -1.30 -9.0 -2.0
Source: Drabek, Zdenek and Richard Hooley, "Total Factor Productivity, Trade Liberalization andSubcontracting", October 1990; Philippines Statistical Yearbook, 19901 and, World BankStaff Calculations.
Note: jL Period average. of growth rates.h. Labor productivity is defined as value added per employee.

- 144 -
APPENDIX I: PHILIPPINES TA8LE 5EFFECTIVE RATES OF PROgECTION MOR 9ME MANUFACTURING SECTOR
ERP (% I1985 1988 1990
Food Products and food processing 33.7 29.9 30.0
Exportables -8.4 -4.1 -4.0Importables 49.5 t2.i 43.0
Beverages and tobacco 43.3 41.0 41.0Exportables -8.8 -8.8 -9.0Importables 93.6 89.1
Textiles and footwear 24.7 19.1 18.0Exportables 0.0 0.0 0.0Importables 81.5 63.0 63.0
Wood and wood products 13.8 19.0 19.0
Exportables 13.8 19.0 19.0Importables - - _
Paper, rubber, plastic & leather products 82.2 74.0 74.0Exportables -7.0 -10.9 -11.0Importables 91.9 83.3 83.0
Chemicals and chemical products 66.2 49.1 49.0Exportables - - -Importables 66.2 49.1 49.0
Non-metallic mineral products 28.8 33.7 31.0Exportables -8.0 -8.2 -5.0Importables 29.5 34.4 32.0
Basic metals and metal products 84.1 54.8 67.0Exportables -4.3 -7.8 -6.0Importables 85.7 55.9 68.0
All machinery and equipment 48.4 33.9 31.0Exportables 0.0 0.0 0.0Importables 60.1 42.1 38.0
Source: Medalla, Erlinda. 1990. 'An Assessment of Trade and Industrial Policy, 1986-88", PhilippineInstitute for Development Studies; Tariff Commission Report, 1991.

- 145 -
APPENDSIX 1 PHILIPPINES TABLL 6INVESTMENT IN THE INDUSTRSAL SECTOR
(% of GDP)
1971-75 1976-80 1981-83 1983-90
Gross Domestic Investment 18.8 30.1 28.7 16.7
Public 5.3 9.1 7.2 4.1
Private 13.5 21.0 21.5 12.6
Manufacturing Investment a\ 2.9 2.4 1.S n.a.
Source: World Bank Staff Calculations.

APPENDIX I: SRI LANKA TABLE l.AMACROECONOMIC INDICATORS
Average Average
1970s 1980s 1985 1986 1987 1988 1989 1990
I. Real GDP growth rate 5.1 4.3 5.0 4.3 1.5 2.7 2.3 6.2
II. Investment and Savings(as a % of GDP)
Gross Domestic Investment 19.8 25.1 22.9 23.2 22.9 22.0 21.2 25.5Public 9.3 11.3 12.8 12.6 11.2 9.9 8.3 9.9Private 10.5 13.9 10.1 10.6 11.7 12.1 12.9 15.6
Gross Domestic Savings 13.9 15.0 12.2 12.5 12.7 10.9 13.8 14.8Public a\. -2.8 -0.4 0.0 -0.2 - - - -
Private 17.5 16.7 15.3 15.4 - - - -
0'
III. Fiscal Deficit/GDP -10.5 -10.9 -9.6 -10.1 -8.8 -12.7 -8.6 -7.7Domestic Financing/GDP 5.3 5.9 5.3 5.1 5.8 9.5 6.3 4.0Foreign Financing/GDP 4.2 5.0 4.3 5.0 2.9 3.2 2.4 3.7
IV. Balance of PaymentsCurrent Account Deficit/GDP -3.4 -8.7 -9.9 -9.5 -7.8 -8.6 -7.8 n.a.Exports/GDP 20.2 21.8 22.3 19.0 20.9 21.1 22.2 n.a.Imports/GDP 24.2 29.5 29.9 27.4 27.7 28.9 31.3 n.a.
Source: IMF, International Financial Statistics; World Bank, World Debt Tables; Central Bank of Sri Lanka; and World Bank StaffCalculations.
Note: a\ The average for 1970s is the average for period 1977-80, and the average for 1980s is the average for 1981-86. Theprivate sector savings include savings of public corporations, and public savings include central Government savingsonly.

APPENDIX 1: SRI LANKA TABLE 1.B
MACROECONOMIC INDICATORS
Average Average
1970s 1980. 1985 1986 1987 1988 1989 1990
V. Exchange Rate
Real Effective Exchange Rate 104.9 103.5 116.8 103.9 93.0 90.9 86.1 87.7
(1980=100)
Nominal Exchange Rate . 9.7 26.8 27.2 28.0 29.5 31.8 36.1 40.0
(Rupees per US$)
VI. InflationCPI (growth rate) 8.9 11.0 1.5 8.0 7.7 14.0 11.6 n.a.
GDP Defaltor (growth rate) 14.4 11.2 0.9 5.8 7.0 11.5 9.7 n.a.
VII. MoneyM1/GDP 15.0 12.3 11.5 11.7 12.7 14.5 13.9 n.a.
M3/GDP 25.1 30.5 31.2 29.4 31.0 31.5 31.4 n.a.
VIII. Deposit Rate
Real Rate 3.4 3.5 12.9 5.2 2.6 -2.3 1.6 n.a.
Nominal Rate 8.1 12.5 11.0 11.0 10.0 10.0 14.0 15.0
IX. External Debt
External Debt/GDP - 61.7 59.4 63.7 71.1 74.5 73.5 n.a.
Debt Service Ratio - 24.2 21.1 26.0 27.6 28.9 24.4 n.a.
Source: IMF, International Financial Statistics; World Bank, World Debt Tables; Central Bank of Sri Lanka; and, World Bank Staff
Calculations.

- 148 -APPUNDZX Is 8R! LANKA TABLE 2
GROWTE IN INDUSTRIAL OUTPUT(l per annum)
Average Average Average1970-77 1978-82 1983-90 1987 1988 1989 1990
Manufacturing Total a\ 12.4 31.2 16.6 17.1 11.4 20.0 33.6
Consumer Goods 19.5 27.7 20.3 13.6 13.2 14.1 24.8Industries b\
Capital Goods 10.8 10.1 21.4 14.2 23.5 28.5 32.0Industries
Intermediate Goods 30.5 31.3 5.7 14.2 -2.0 -4.1 11.0Industries
Basic Goods 20.9 24.2 16.2 7.0 30.1 45.3 23.2Industries
Real growth inmanufacturing value added j1j 746 5.7 c\ 68 8 ,.2 -
Source: Central Bank of Sri Lanka.Note: aX The growth rates shown above are calculated from the current price data.
b\ The following classification was used to divide the manufacturing industries into varioussub-sectors.Consumer Goods - food, beverages, tobacco; all textile and leather products; paper and
paper products.Capital Goods - All types of machinery, transport equipment and fabricated metal
products.Intermediate Goods - All wood and cork products; all rubber, plastic products; all
chemical. and petroleum products.Basic Goods - All metal products; all non-mineral products like cement etc.
g, Average for period 1983-89.

- 149 -
APPENDIX l: SRI LANKA TABLZ 3STATIC MEASURES OF INDUSTRIAL DZREOULATION &I
Industry Effective Rate of Proltection __ Domegtic Reeource Cost1985 1987 1985 1983 1987
Manufacturino Total 197 207 1.03 6.3 16.4
Consumer Goods 289 255 0.79 - -
Industries
Capital Goods 177 -176 0.78 -
Industr iesi
Intermediate Goods 206 204 0.99 -
Induatriose
Basic Goods 131 135 1.76 -
Industries
Source: 'Zffective Protection and Comparative Advantage in the Manufacturing Sector of Sri Lanka",Ministry of Finance and Planning, Sri Lankal and, World Bank Staff Calculations.
Note: IL. One of the static measures - Four-firm Concentration Ratios could not be calculated
due to lack of data.ICOR shown above is for the whole economy. The data on investment for themanufacturing sector is not available.

- 150 -
APPEND1S 1: SRI LANKA XAEIZ 4DYNAMIC BEASURRS OF INDUSTRIAL DERZOULATION. 1981 .
SectorPrivate §ES Public CorDorations GOBU
Labor Productivity k
Consumer Goods Industries 72.2 16.5 17.3 17.7
Capital Goods Industries 30.3 11.0 15.0 30.1
Intermediate Goods 28.0 24.5 39.1 25.5Industrijs
Basic Goods Industries 61.8 5.4 32.1 22.4
Manufacturina Total 41.6 10.1 26.0 23.9
Source: 'Employment and Productivity in the Manufacturing Sector of Sri Lanka", People's BankEconomic Review, August 1987.
Note: ^ One of the dynamic measures used elsewhere in the analysis - Total Factor Productivitycould not be calculated due to lack of data.
b. Labor productivity is defined as value added per employee (in Re. thousands).

- 151 -
APPENDIX I: SRI LANKA TABLE 5
DOMESTIC RESOURCE COST CALCULATIONS FOR SELECT MANUFACTURING INDUSTRIES. 1985
Industry DRC Industry DRC
Consumer Goods 0.79 Intermediate Goods 0.99
Food products 2.08 Wood and wood products 1.05
Beverages 0.02 Glass and glass products 0.76
Tobacco 0.17 Ceramics 0.33
Clothing 0.51 Plastic products 1.15
Leather footwear 0.52 Rubber products 1.65
Printing and publishing 1.55
Medicines, soaps, etc. 0.68
Caoita3 Goods 0.78 Basic Goods 1.76
Scientific equipment 0.76 Cement 0.22
Transport equipment 0.48 Basic iron and steel 7.88
Electrical machinery 0.40 Non-ferrous basic metals 0.16
Handtools and hardware 1.84 Petroleum refineries 0.05
Agricultural machinery 0.43 Industrial chemicals 0.51
Source:> "Effective Protection and Comparative Advantage in the Manufacturing Sector of Sri Lanka",
Ministry of Finance and Planning, Sri Lanka.

- 152 -
APPENDIX rs SRI LANMA TAB$Z 6CAPACITY UTILIZATION IN KANUPACTURING SECTOR
(Average a*nual %)
1974-77 1978-81 1982-85 1987
Manufacturing Total 54.6 72.3 74.8 81.8
Consumer Goods Industry 60.1 70.7 80.3 91.0
Capital Goods Industries 48.9 62.5 84.3 89.0
Intermediate Goods Industries 49.4 77.4 79.4 89.0
Basic Goods Industries 53.7 71.0 48.4 58.3
Source: Central Bank of Sri Lanka Annual Review, various issues.

- 153 -
APPENDIX I: SRI LANKA TABLE 7PROTECTION IN MANUFACTURING M%s
Before 1987 reform After 1987 reform
Textiles 109.0 65.0
Intermediaries 22.0 - 327.0 13.0 - 130.0
Machinery 30.0 - 110.0 50.0
TraLnsport Equipment 75.0 75.0
Manufacturing Total 107.0 50.0
Source: World Bank Staff Calculations.

APPENDIX I: BANGLADESH TABLE 1.AMACROECONOMIC INDICATORS
Average Average19708 1980s 1985 1986 1987 1988 1989 1990
I. Real GDP growth rate 4.8 4.7 3.9 4.3 4.2 2.9 2.5 6.2
II. Investment and Savings(as a % of GDP)
Gross Domestic Investment, - 13.0 12.8 12.3 12.5 12.0 12.2 11.6Public - 7.1 7.4 6.3 6.2 6.4 6.5 6.0Private - 5.9 5.4 6.0 6.3 5.6 5.7 5.6
Gross Domestic Savings - 2.0 1.9 2.4 3.6 2.8 2.0 1.9 1Public - 0.5 0.3 0.6 0.4 0.7 0.6 0.6 &
Private - 1.5 1.6 1.8 3.2 2.1 1.4 1.3 t
III. Fiscal Deficit/GDP -6.9 -6.5 -6.1 -6.9 -5.9 -5.6 -6.3 -7.6Domestic Financing/GDP - - - - - - -Foreign Financing/GDP -
IV. Balance of Payments
Current Account Deficit/GDP -7.8 -8.4 -7.0 -5.5 -5.8 -6.7 -6.8Exports/GDP 6.6 6.7 6.7 5.8 6.1 7.0 6.4 n.a.Imports/GDP 18.4 19.0 17.0 16.6 15.5 16.3 17.8 n.a.
Source: IMF, International Financial Statistics; World Bank, World Debt Tables; and, World Bank Staff Calculations.

APPENDIX I: BANGLADESH TABLE 1.B
KACROECONOKIC INDICATORS
Average Average
1970s 1980u 1985 1986 1987 1988 1989 1990
V. Exchange Rate
Real Effective Exchange Rate - 95.2 107.3 93.2 89.9 87.2 93.1 87.9
(1980=100)
Nominal Exchange Rate 12.0 28.0 27.9 30.4 30.9 31.7 32.3 35.7
(Taka per US$)
VI. Inflation
CPI (growth rate) 20.8 8.9 1.1 11.0 9.5 9.4 10.0 6.0
GDP Deflator (growth rate) 13.4 8.8 5.6 8.5 9.8 7.0 7.8 8.9 1
nVflVII. Money
Ml/GDP 11.0 10.4 11.0 10.7 9.4 9.1 9.4 8.5
M3/GDP 20.8 28.0 27.4 28.5 29.1 30.5 33.1 30.0
VIII. Denosit Rate
Real Rate -4.2 1.8 10.1 -0.3 1.2 1.3 0.7 4.7Nominal Rate 8.2 10.7 11.3 10.7 10.7 10.7 10.7 10.7
IX. External DebtExternal Debt/GDP - 46.0 41.6 52.0 56.4 55.4 53.3 n.a.
Debt Service Ratio 19.7 21.6 29.3 26.9 21.2 19.9 n.a.
Source: IMF, International Financial Statistics; World Bank, World Debt Tables; and, World Bank Staff Calculations.

- 156 -
aPPKD!K I: UANGLADUIX YABLZ 2lNDUSDRrlAL PRODUCT12o
(% per anamu)
Average Average Average1973-80 1981-86 1987-90 1987 1988 1989 1990
NAnufacturlno jiL 7.8 1.3 4.6 7.9 0.6 2.8 7.2
Consumer Goods 3.8 2.2 9.8 13.5 0.6 7.1 17.9Industries ,
Capital Goods - 26.7 30.8 -11.6 -24.2 157.4 1.7Industries
Intermediate Goods 0.3 13.7 13.2 18.7 25.2 -7.6 16.5Industries
Basic Goods 14.9 5.5 -2.5 8.8 -3.8 -3.1 -11.9Industries
Sources World Bank Staff Calculations.Notes a The growth rates for manufacturing sector total are the growth in real value added. The
other figures are simply growth in value of output at (1975-100) constant prices.bT The following classification was used to divide the manufacturing sub-sectors:
Consumer Goods - All food products, beverages and tobacco products; All cotton, jute,rayon and synthetic textiles; paper and paper products.
Capital Goods - Non-electrical machinery; All electrical machinery; all transportequipment.
Intermediate Goods - Paints, varnishes, lacquers; glass; rubber products.Basic Goods - Fertilizers, insecticides; basic industrial chemicals; cement; iron and
steel; petroleum products.

- 157 -
APPENDIS I: 1AJOLADESH TABLE 3STATIC ZMASURES or DERZGULATION a\
1975-79 1980-84 1985-88
Effective Rate of protection 83.4 94.1 110.3for Manufacturing Sector (%)
Domestic Resource Cost (DRC) 1.8 1.9 2.1for Manufacturing Sector
Incremental Capital Output Ratio n.a. 8.8 10.5(ICOR) for manufacturing sector
Source: World Bank Staff Calculations; "An Assesment of the Impact of Industrial PolicitS inBangladesh," Working Paper 1 16, Planning Commission, March 1990.
Note: a\ One of the static measures, Four-firm Concentration Ratios, used elsewhere in theanalysis were not available for Bangladesh.The data on ERP, DRC and ICOR was only available for the total manufacturing setTrY.Data on subsectors within the manufacturing sector is not available.

- 158 -
APPENDIX it BANOLADESN TABLE 4DYNAMIC MZASURZS OF DERZGULATION a\,
Average Average Average1975-79 1980-83 1984-86
Growth In Labor Productivity -5.0 -1.7 -1.1Manufacturing Sector (% pear annum)
Source: 'An Assessment of the Impact of Industrial Policies in Bangladesh," Working Paper # 16,Planning Commission, March 1990; and, World Bank Staff Calculations.
Note: . One of the dynamic measures, total factor productivity, used elsewhere in theanalysis, is not available for Bangladesh manufacturing sector.

- 159 -
APPENDIX I: BANGLADESR TABLE 5CAPACITY UTILIZATION IN SELECT MANUFACTURING INDUSTRIES (1989) a\
Capacity Utilization Minimum Maximum(%) CU CU
Light Engineering Sector 46.8 2.0 109.8
Chemicals 55.0 10.4 103.0
Seafood Processing Sector 39.0 26.0 75.0
E:Lectronics Sector 55.9 40.0 90.0
Source: Kabir, Kaiser, "The Regulatory Framework for Industry and PrivateSector's Response to Liberalization Policies in Bangladesh," March 1991.
Note: a\ The results are based on a study with sample size of 18.The first column is the mean capacity utilization for 18 firms withinthe sector. The second and the third columns are the minimum andmaximum capacity utilization rates, respectively, attained by thesample firms.

- 160 -
IPPUNDKXS ! BAGLE DESH TABLL !RENDS IN INVESTMNT
(% of GDP)
1981-83 1984-85 1986-87 1988-
Gross Domestic Investment 14.9 12.5 12.4 11.
Public 8.5 7.0 6.2 6.
Private 6.4 5.5 6.2 5.
Manufacturing Investment 1.1 1.4 1.9 n.
Public Enterprises 0.4 0.3 0.7 n.
Fertilizer Producing 0.1 0.15 0.5 n.
Other 0.3 0.15 0.2 n.
Private Ent-rprises 0.7 1.1 1.2 n.
Source: World Bank Staff Calculations.

- 161 -
APPENDIX II-A: DEREGULATION IN INDIA (A CHRONOLOGICAL SUKMARY)
YEAR/PERIOD ECONOMIC POLICY
1960-70 In 1966, firms allowed to exceed their licensed capacity by a marginup to 25%, provided they did so without any new investments, noadditional foreign exchange expenditure was involved, and there wasno additional demand for scarce material.
In 1968, a list of reserved products for the smallscale industries was promulgated and additions were made to theexisting list.
In 1970, after the promulgation of the MRTP act, a list of "core"industries deemed critical for national development was drawn up;large companies subject to the MRTP act were expected to develop inthese industries. The investment ceiling below which no industriallicense was required for a project was raised from Rs. 2.5 millionto Rs. 10 million, subject to certain conditions.
1971-79 In 1973, with the enactment of FERA, equity shareholding policy wastightened, bringing down foreign equity to a maximum of 40%, exceptthat a higher controlling interest was allowed in export orientedand high tech companies.
In 1975-76, the first time when meaningful de-licensing began, thefollowing measures were undertaken:- "diversification" (or broadbanding) for 16 specificindustries under which firms could produce any goods ina given group of products if they had a license toproduce them.
- Delicensing of 24 industries (for non-MRTP non-FERA firms).- Allowance of maximum utilization of capacity for someindustries.
- Endorsement of capacity increases resulting frommodernization investments.
- Recognition of production in excess of licensed capacityfor 19 basic and core" industries.
- Automatic growth of capacity permitted of 5% per year ora maximum of 25% over five years in 15 engineering goodsindustries.
In 1978, the investment limit for delicensing raised to Rs. 30million.

- 162 -
YEAR/PERIOD ECONOMIC POLICY
1980-84 In 1980, some additional measures were promulgated, including,- Extension of the automatic growth permitted for 15engineering industries in 1973 to 19 basic and "core"incdustries.
- Priority to backward areas and "no-industry districts"in licensing.
- Relaxation of a no-import requirement for delicensing,replaced by a limit of 15% of ex-factory production valuefor imported inputs, up to a maximum of Rs. 4 millionper annum.
In 1982, the list of "Appendix I" industries in which MRTP and FERAfirms were encouraged to invest was consolidated and expanded. Thescheme of automatic re-endorsement of capacity increases wasextended to the entire manufacturing sector. Furthermore, in thesame year gradual decontrol of cement prices began.
In 1983, The investment ceiling for delicensing was raised to Rs.50 million (but not applicable to projects located in sizablecities). Broadbanding was introduced for the machine tool industry.The industry was divided into 15 categories, within each of whichlicensed producers were free to produce any specific item.Re-endorsement of capacity up to 133% of maximum production in theprevious five years, permission for limited expansion based onmodernization and balancing investment, and automatic growthallowances were all systematized.
1985-90 In 1985, delicensing of 25 industries was announced, replacing theearlier list. The number of categories of products delicensed wasalmost the same as in the 1975 delicensing measure (24), but the newlist was much broader in scope, and its coverage of themanufacturing sector as a whole (in terms of total output value) wasconsiderably great. Restrictions on the foreign exchange outflow ofimported inputs were further relaxed to a maximum of Rs. 7.5 million(a limit of Rs. 50 million on the value of fixed assets ofindustrial undertakings availing themselves of this facility hadbeen removed earlier); a total of 82 bulk drugs were delicensed; 22of the 27 Appendix I industries were delicensed for MRTP and FERAcompanies, provided that investments were located in centrallybackward areas. Furthermore, export obligations for MRTP companiesinvesting in other industries (and located in backward areas) werereduced Erom 50% to 25-30%. The most important relaxation of MRTPact occurred in 1985, when the asset threshold beyond whichcompanies became subject to the act was increased from Rs. 200million to Rs. 1 billion. A number of concerns were subsequently"deregisitered" as MRTP companies.

- 163 -
YEAR/PERIOD ECONOMIC POLICY
1985-90 In 1986-87, computer software, wire rods, roller flour milling andthe chemical industry delicensed, while two items (printing machineryand oil field services) were taken off the list of items delicensedfor MRTP-FERA companies. Delicensing for MRTP-FERA companies wasextended to 28 in Appendix I industries (conditional on setting upthe industry in backward areas).
In 1988, delicensing was instituted for all industrial investmentprojects by non MRTP-FERA firms up to a limit of Rs. 150 million innonbackward areas and Rs. 500 million in backward areas. But to beeligible for delicensing, a set of stringent location requirementswere to be met by the prospective investors; Compulsory licensing wasretained for 27 industries (down from 78 previously), including somevery important ones; The validity of Letters of Intent was extendedfrom one to three years.
In 1989, procedures for establishment of 100% export-oriented unitsby FERA companies were simplified; no special permission (under FERA)would be required, but only if all output, including rejects, was tobe exported. Furthermore, in the same year, price and distributioncontrol for cement and aluminum were completely abolished.
In early 1990, delicensing of industrial investments up to Rs. 250million (750 million in backward areas), and stipulations regardingdistance from large cities in effect since 1988 were announced.Furthermore, automatic clearance for capital goods import up to 30%of the value of the plant and equipment for delicensed investmentswas announced. This replaces, for these projects, the old capitalgoods imports procedures, which involved layered approval processdepending on the value of the imported capital goods. For importsless than Rs. 4 million, regional branches of CCIE could make adecision; for imports of Rs. 4-15 million the central CCIE in NewDelhi decided; for those in excess of Rs. 15 million the CapitalGoods Main Committee decided.In the same year, government clearance for foreign collaborationapplications was made automatic, provided that there is no lumpsumroyalty payment and that royalties do not exceed 5% of sales valuefor domestic production and 8% in the case of production for export.Furthermore, automatic clearance for undertakings with up to 40%foreign investment equity was announced, as long as only 30% of thetotal value of the plant and equipment is imported (this policy hasnot been implemented yet).On July 24, 1990, a comprehensive statement of Industrial policy wasannounced. The changes announced comprise a bold departure from pastIndian regulatory practices.- Industrial licensing has been abolished for all new, expansion,
and diversification projects regardless of size, except in 18
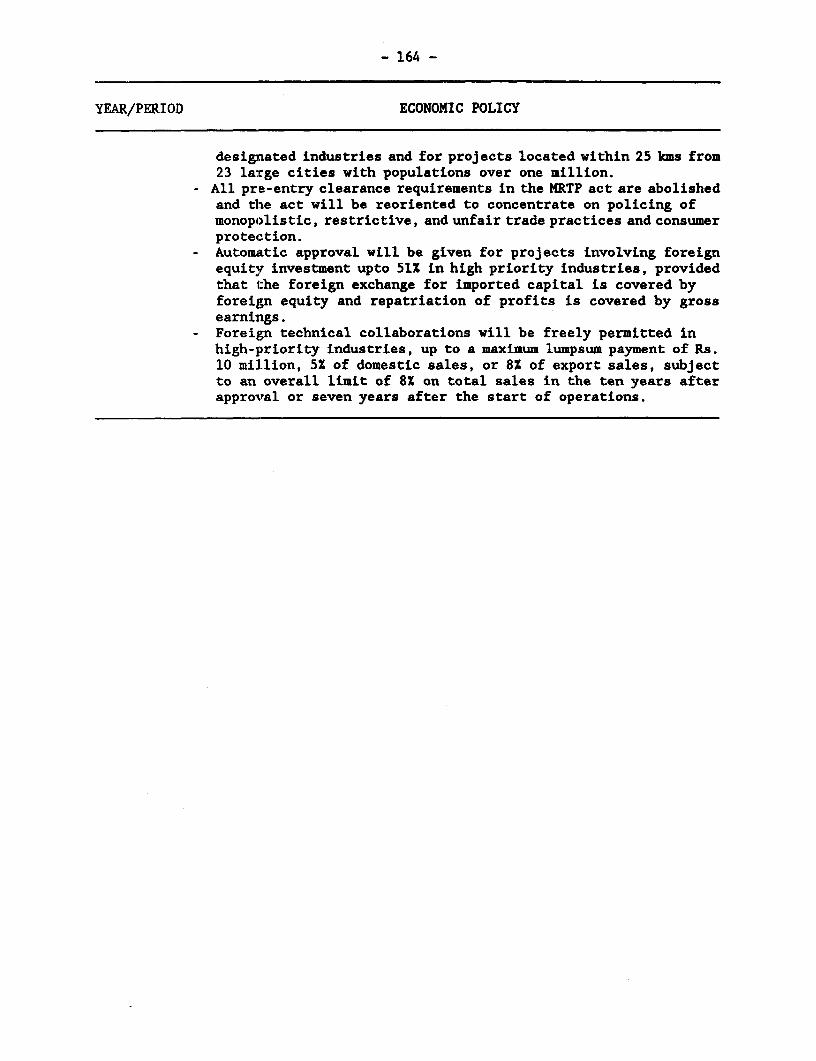
- 164 -
YEAR/PERIOD ECONOMIC POLICY
designated industries and for projects located within 25 kms from23 large cities with populations over one million.
- All pre-entry clearance requirements in the MRTP act are abolishedand the act will be reoriented to concentrate on policing ofmonopolistic, restrictive, and unfair trade practices and consumerprotection.
- Automatic approval will be given for projects involving foreignequity investment upto 51X in high priority industries, providedthat the foreign exchange for imported capital is covered byforeign equity and repatriation of profits is covered by grossearnings.
- Foreign technical collaborations will be freely permitted inhigh-priority industries, up to a maximum lumpsum payment of Rs.10 million, 5X of domestic sales, or 8X of export sales, subjectto an overall limit of 8X on total sales in the ten years afterapprovral or seven years after the start of operations.

- 165 -APPENDIX 1I-l DEREGULATIONN I INDONESIA (A CEEONoLOoICAL scmaaY
YEAR/PzRIOD ECONOMIC POLICY
1965-84 The Soeharto Regime started in 1966 on a liberal note, but by 1969 had returnedto interventionist and protectionist policies that persisted into early 1980..Industrial policy was defined in various five year plans (Repelitas), launchedin 1969-70. Basic heavy industries like cement, fertilizers, chemicals and paperand pulp were marked for promotion from the very beginning.
Attempts were made in the late 1970. to improve the functioning of theindustrial system by streamlining procedures rather than reducing thecomplexity or incidence of controls. Some improvements were registered inindustrial licensing, tax implementation and customs clearance.
1985-90 In 1985, trade and industrial policies were subjected to major reform. Acomprehensive reform of the tariff schedule was undertaken, the tariff ceilingwas lowered from 225% to 60%, and the number of tariff categories were reducedfrom 25 to 11. The proportion of items with low tariffs (below 30%) rose from59% to 82%. In the same year, the investment licensing procedure was streamlinedand relaxed. The number of requirements for an Lnvestment application wasreduced to 25 in 1985 compared to 35 in 1977.
In 1986, as a part of trade policy reform, three further policy packages wereannounced.[irst, the incidence of import licensing was sharply reduced: 539 items wereremoved from license control, and the proportion of manufacturing output coveredby licensing declined from 43.5% to 39.5%. The reduction in licensing occurredIn cases where ERPs were highest. By 1988, the incidence of licensing wasfurther reduced, when a total of 839 items were removed from licensLng control,of the 1700 which were under import licensing.eond, the tariff structure was further reformed during this period. Theaverage weighted tariff declined from 29% of domestic production value in 1985to 19% of the domestic production value in 1989.Third, exports incentives were considerably improved after 1986. A dutyexemption and drawback facility (BAPERSTA) was created in 1986, which allowedexporters to obtain inputs free of dutier and to bypass import licenserestrictions. By 1989, 24% of the value of manufactured non-oil exportsbenefitted from this facility.In the same year,.the Indonesian Government for the first tLme took steps toimprove the attractiveness of Indonesia to foreign .navstors. Cwnership limitsin export-oriented and other priority areas have been eased and the conversionperiod for domestic foreign ownership extended. Foreign firms access to umtcredit and marketing has been improved. Foreign companies are now permitted totake over local firms if investment is in a priority area and provided 20% ofequity remains under domestic ownership. The validity of investment licenseswag extended upto 30 years. As a result of the" policy changes, foreLgninvestment has increased sharply, foreign investment approvals increased by 78%in 1987 and a remarkable 300% in 1988 to reach US$ 4.4 billion. However, therate of increase

- 166 -
YEAR/PERIOD ECONOMIC POLICY
of approvals of foreign investment slowed to about 7% in 1989.
In the same year, BRPM's role of "one-stop" service for domestic and foreigninvestors was strengthened by giving it executive authority to issue most ofthe majcr licenses required in addition to the investment license; theinvestment priority list (DSP) was intended to play a more promotional role,clearly ldentifying the areas open or closed to private (PMDN) investment.
In 1987, firms were allowed to increase production by up to 30% of theirlicensed capacity without requiring new investment approval. Moresignificantly, firms were permitted to diversify production within much broaderproduct categories, thus enhancing operational flexibility and promotinggreater competition. As a result of "broadbanding" the number of productcategories has been reduced from 2490 to 387, and firms are free to changeproduct lines within these broader categories. As a result of these measures,the number of requirements for an investment application was further reducedto 15 in 1987, compared to 25 in 1984. Starting in the late 1970s, thegovernment instituted a number of local content or deletion programs across arange of products, mostly in the metal and engineering subsectors. These localcontent programs were supported through a range of trade restrictions. After1985, the government began to modify its approach towards deletion programs inseveral ways;First, only two new programs were introduced in 1986 and none in 1987;Second, the timetable for achieving local content targets were lengthened forseveral products;Third, local content programs for commercial vehicles, tractors and motorcycleswere made more flexible by allowing "multi-sourcing" of parts.
In the same year, 42 industrial sectors previously closed to foreign investmentwere opened. As a result, of a total 670 branches of manufacturing (other thanthose reserved for small scale firms), 542 are now open to foreign investment;The conversion period for majority ownership by domestic investors waslengthened from 10 to 15 years; a new ownership was also established with 95%foreign ownership allowed with no further divestiture, if the firm's productionis 100% for exports and is located in a bonded zone; foreign investors werealso allowed to form joint ventures for export marketing with Indonesianpartners.

- 167 -APPENDIX II-C: DEREGULATION IN THE PHILIPPINES (A CHRONOLOGICAL SU3(ARYI
YEAR/PERIOD ECONOMIC POLICY
1946-60 The structure of import controls established after independence in 1946continued until 1985 despite many attempts at liberalization. Apart fromthe import and exchange control policies which were in effect during the1950s, the other main set of policies affecting the mode ofindustrialization during this period were a succession of tax incentivemeasures designed to promote industrial investment. In the 1950s about1000 product lines were exempted from taxes and duties. In addition tothese tax incentives, a low interest rate policy pursued through the1950s; the Central Bank maintained a rediscount rate of 1.5% between 1954-57, and between 3-7% for the rest of the decade. Furthermore, the favoredindustries governed, under the incentive laws also had preferential accessto long term financing from the Government's long term lendinginstitutions.
1960-8) During the early 1960s, import controls were gradually lifted and the pesowas successively devalued to P 3.9 to the U.S. dollar by 1965. However,tariff protection continued to provide incentives for further importsubstitution. Import controls were reimposed along with anotherdevaluation - from P 3.9 to P 6.4 per U.S. dollar in 1970 when the pesowas allowed to float.
During the 1970s, efforts were made to push exports by putting in placea wide range of institutional infrastructure: exports processing zones(EPZs) were created; trading houses were encouraged. Export incentivesmade it possible for exporters to access imported inputs at world prices.In 1973, a tariff rationalization program was undertaken but the basicprotective character remained the same. On the domestic front, the Boardof Investments promoted industry actively including protecting it fromforeign competition.
1980-85 The trade reform measures initiated in 1981 marked a turnaround from theprotective policies of the previous three decades. The tariff reformprogram was the central element of the trade policy package. It spanneda five year period and was completed on schedule in 1985. The range ofnominal tariffs was reduced from 0-100% in 1980 to 10-50% in 1985.Furthermore, average rate of protection was reduced from 45% to 28%. Whilemajor reductions in tariffs were undertaken in 1981 and 1982, a surchargeof 3% was imposed on all imports in 1983 as a temporary measure. This dutywas raised to 10% in 1984, then reduced to 5% in 1985. The averageeffective rate of protection declined from 24% in 1979 to 12% in 1985,mainly due tariff reform and tax measures introduced during this period.

- 168 -
YEAR/PERIOD ECONOMIC POLICY
1986-90 Between 1986-90, trade policy was further liberalized. As a result, duringthis four year period, the number of regulated imports in terms of tariffline items declined from 1924 in 1986 to 447 in 1990. As a share in totalnumber of PSCC lines, the regulated imports declined from 34.1% to 7.9%.During this four year period, however, nominal tariffs have remainedvirtually unchanged, but there has been a slight reduction in tariff ratedispersion. ERP declined by 7% during this period.
In 1987, the Government adopted a new Omnibus Investment Code, acompilation of the foreign investment laws and various incentivesavailable to domestic and foreign investors, which builds up on anearlier (1981 and 1983) variants and consolidates differentincentives and privileges. The incentives offered no longer favor importsubstituting industries over exports and capital-intensive over labor-intensive technologies through "capital-cheapening'. The broad objectivesof the OIC are: domestic investment promotion; augmentation of directforeign investment; export promotion; regional development; employmentenhancement; and, technology upgrading.One of the objectives of OIC is to promote foreign directinvestment (DFI). In addition to general incentives available to allinvestors, specific incentives and guarantees for foreign
investors in such matters as repatriation of profits, dividends andcapital, expropriation etc.
The industrial policy introduced in the same year, increased access ofsmall and medium firms to foreign inputs and markets. Following measureswere taken to promote industrial development: duty exemption and drawbackscheme; efficient provision of export credit, credit guarantees andinsurance; and, technical assistance to small exporters.
In 1988, foreign investors permitted to avail debt-to-equity swapfacilities whereby they could purchase Philippine external debt at adiscount and use it to cover their peso investment needs.
In 1989, DPI raised to S 850 million from the level of $ 140 million in1986.

- 169 -APPENDIX Il-Da DERZGULA!ION IN SRI LANKA (A CHRONOLOGICAL SUMMARY
YEAR/PERIOD ECONOMIC POLICY
1948-56 The economy remains open. No import restrictions or foreign exchangecontrol. Economic policy oriented more towards small-scaleindustrialization through prlvate enterprises, and the role of the Statewas more that of promoter rather than that of a sole entrepreneur.
1956-65 The public sector takes lead in industrialization by establishing a widerange of public manufacturing enterprises. Nationalization of foreignowned plantations, transport, insurance, banking sectors; nationalizationof bus services, oil companies. Import and exchange controls.
1966-76 Partial trade liberalization and devaluation of currency. Nationalizationof Plantation Estates. State control on wholesale trade.
1977-86 The new Government's policy was directed at reducing the role of the Statein the economy and increase that of the private sector. Sweepingderegulations affected all sectors of the economy; price and distributioncontrols were eliminated; most barriers to entry in industry were removed;foreign investment was encouraged; domestic trade was opened to theprivate sector and financLal markets were liberalized.
The most important liberalization measures were, the devaluation of therupee and the elimination of the dual exchange rate system. Theelimination of import quotas and their replacement by tariffs. There wereseveral structural changes in the tariff system between 1979 and 1984,amed at eliminating negative effective protection and at reducing thedispersion in effective protection rates. The last ban on imports, thaton textiles, was lifted in 1985.
Two different incentive packages and institutions were set up to overseeinvestment both domestic and foreign. Local Investment Advisory Committee(LIAC) for assisting 100% domestic investment, and Foreign InvestmentAdvisory Committee (FIAC) for approval of foreign investment and jointventures (outside FTZs). To encourage non-traditional exports, a FreeTrade Zone was established near Colombo in 1979. A new agency, the GreaterColombo Economic Commission (OCEC) waa cr*ted to manage incentives andapprove investments in the FTZ. In the same year, the ExportDevelopment Board (EDS) was created to manage export incentives that havebeen introduced since then. In 198S, to encourage traditional exports,export taxes on tea, rubber, and coconuts were reduced substantially, fromlevels in the range of 40-50% in 1978, to 10-20% in 1985.
The main feature of the flnancial sector reform was removal ofrestrictions on interest rates. The bank rate was raised from 8.5% to10% p.a. This was followed by raising sharply the deposit rates of theNational Savings Bank (NSB). At the same time, the basic exchange rate

- 170 -
YEAR/PERIOD ECONOMIC POLICY
and the premium value (FEEC) were first unified at an initial rate of SLR16 per US dollar, and then exchange rate was allowed to float. From 1979onwards, new foreign banks were allowed to enter the market raising thenumber of foreign banks in Colombo from 4 to 20. Foreign Currency BankingUnits (FCBUs) have been allowed to operate since 1979 and to transact inforeign currency with non-resident enterprises (in FTZ), and to takeforeign currency deposits from non-residents working abroad.
1987-90 In 1987, as part of the tariff reform, the Government announced itsintention to adopt a four-banded tariff system with minimum tariff rateof 5%, with two intermediate bands of 15% and 30%. The maximum duty ratewas reduced from the previous highs of 75-100% to 60%. Furthermore, thenumber of items requiring import licenses was reduced from 281 to 150.Tlhe only items now requiring import licenses are those pertaining tonational security and the food industry.
SLnce 1987, Sri Lanka has developed a wide range of export incentivesaimed at providing exporters with access to tradable inputs atinternational prices and fiscal incentives, including direct cashpayments.
Bettween 1987 and 1990, the Government launched a comprehensive adjustmentprogram to reduce the size of Public sector and increasing its efficiencvjircludinc PE reforms and privatization. The detailed work on privatizationof manufacturing PE's, was given structure and accelerated following theestablishment in 1987 of Presidential Commission on Privatization (renamedas; the Commission on People-ization in 1989). The privatization processir Sri Lanka consists of three phases: (i) the conversion of corporationsand Government Owned Business Units (GOBUs) into public companLes;(ii) restructuring viable PE's, primarily the converted companies;(iii) privatizing select PE's. In case of small PE's, these phases havebeen merged into one step, i.e. conversion immediately followed bydivestiture, whereas, in case of large PE's, into two steps, conversionand privatization/restructuring. The Presidential Commission onPrivatization (People-ization), established to privatize small PE's, wasdisbanded in January 1990. This task is now handled by theCommercialization Division (CD) of the Ministry of Finance. CD is nowworking on privatization of 16 smaller PEs. The Public Investments andManagement Board (PIMB) established in 1989, and later incorporated asa company in 1990, handles privatization of large PEs involving foreigninvestors.

- 171 -APPENDIX I-Bt DEREOULATION IN BANGLADESH (A CHRONOLOGICAL SUMMARY1
YEAR/PERIOD ECONOMIC POLICY
1982 The initiation of New Industrial Policy (NIP), simplified theinvestment approval process substantially by increasing thesanctioning authority to government departments and financialinstitutions, and by streamlining diverse controls exercisedby the Department of Industries and the Chief Controller ofImports and Exports. The NIP had three broad objectives: furtherliberalization of investment in the private sector; privatization ofpublic enterprises; and, the flexible operation of controls on access bythe private sector to various facilities. Under NIP, the industrial sectorwas divided into three lists: (i) a small reserve list for publicinvestment only; (ii) a concurrent list of industries in which eitherpublic or private investment would be permitted;(iii) control through Investment Schedule (IIs) of all otherindustries reserved for private sector. The IIs were greatly modified tomake it more indicative than restrictive.
In the same year, major reforms in the import regime have focussed onsecondary exchange market to finance imports; simplification of importprocedures; rationalization of the tariff structure; and the relaxationof quantitative restrictions.
1986 The reform process picked up pace after the Revised Industrial Policy(RIP) was announced. The main features of RIP were: reserved list reducedto only seven sectors; a discouraged list was created for industries inwhich no further investment for new investment was deemed necessary; allindustries not in the reserved or discouraged list were thrown open toprivate sector, two separate IIs were created - one for large and mediumindustries to be administered by the Director General of Industries (DGI)and the other for small and cottage industries to be administered byBangladesh Small and Cottage Industries Committee (BSCIC); sanctioninglimits of various authorities such as Investment Bank, etc. were raisedsubstantially.
In the same year, the import regime was relaxed to a certain extent, whenthe "positive" list was replaced by "negative" and "restrictive" lists.The import licensing procedures for raw material, spare part machineryetc. were further simplified. Moreover, export-oriented industries wereallowed to import inputs in the banned/negative lists on ExportPromotion Board's recommendation.

- 172 -
YZAR/PZRIOD ECONOMIC POLICY
In the same year, as part of export promotion measures, the Governmentintroduced the Zxport Performance Benef it scheme (XPB) which set theentitlement rates to 40%, 70% and 100%. Furthermore, Export ProcessingZones (started in 1984 at Chittagong) were provided with a more positiveincentive structure.
1988-90 In 1988, the Government approval for investment involving imported rawmaterial exceeding 50% of the total requirements was waived. Furthermore,free sector projects where foreign investors participated, needed no priorapproval of the Government, provided foreign equity was below 50% andwithin the investment limit of Taka 100 million and not in thediscouraged list.
In the same year, nominal tariffs for most final goods imports in thetextile, steel and engineering, chemicals and electronics subsectors wasreduced from over 200% to 125%. Commensurate downward adjustments wereaLso made to the rates for raw materials and intermediate products usedais inputs in these sectors.
In 1989, there were significant reductions in the items included in thenegative list, from 388 items in 1986 to 178 in 1989, and in therestricted Ilst, from 283 to 16S.The list of banned items has beenprogressively reduced from 39% of import categories at the four digit SITClevel at the end of 1986 to 18% at the end of 1989, and the restrictedlist from 28% to 16% over the same period.
In the same year, to promote and facilitate direct foreign investment,an independent Board of Investment (301) was created. The functions of°OI Include promotional work; approval and registration of industrialprojects; provision of infrastructural facilities; issue of work permitsto expatriate personnel; assistance in obtaining local financing,allotment of land, and approval from administrative agencies; customsclearance for imported equipment and so on.

- 173 -
APPENDIX III-A: INDIAN CEMENT INDUSTRY
The Indian cement industry comprises of 94 large and medium plants,5 white cement plants and 135 mini-cement plants (with clinker capacity of lessthan 200 tons per day). In 1988, the large and medium plants produced 95% of thetotal cement production in the country. The industry has been developed primarilyby the private sector. Private firms account for 84% of the installed capacityancd 87% of the total cement production. The public sector's entry into the cementincdustry goes back to several decades, but significant capacity was not addeduntil the late 1960s and 1970s. At present, the public sector produces 13% ofIndia's cement output (down from 14% in 1985). In the last decade, the Governmentof India has moved away from its previous policy of supporting large capacityextensions in the public sector.
Government Policies and Regulations
The Indian cement industry grew relatively slowly during most of the1970s. During the fourth plan (1970-74), annual growth rates of capacity andproduction were 5.7% and 3.7%, respectively. During the fifth plan, capacitygrowth fell to 2.6% per annum. As a result, between 1978 and 1983 the countryexperienced considerable shortage of cement (10-25% of annual consumption) andhad to import 1-3 million tons per year. The slow expansion of capacity andassociated chronic shortage of cement experienced during the 1970s were causedby the restrictive policies pursued by the Government, price control, rigidcapacity licensing and freight equalization for distribution.
a) Price Control and CaRacity Licensing
For 40 years (1942-82), Indian cement prices were controlled by theGovernment. The pricing policy over this period fixed the retention price (ex-plant price of bulk cement) and the free-on-rail (FOR) destination price ofbagged cement. Excise duties, sales tax, freight costs, incidental charges andpackaging were then added to arrive at the retail price to the consumer. Suchpo:Licies had an adverse impact on profitability of investment in the cementindustry. The low return on investment, caused by price controls and restrictivecapacity licensing policies towards large industrial houses (MRTP companies), wasresponsible for a decline in expansion of capacity during the fourth and thefifEth plans.
b) Freight Egualization and Regional Distribution of Capacities
In 1956, the Government introduced the freight equalization schemeto ensure uniform cement prices throughout the country. A pooled average freightcharge was built into the free-on-rail destination price for cement. Actualfreight charges were notional in that they only helped to define the averagefreight charge from all production locations. Under this system, cement transportfrom a given plant to the market was subsidized (or taxed) to the extent thatactual freight charges exceeded (or fell short of) the notional average freightcharges per ton of cement transported from all plants. As a consequence of thispolicy, planning of cement production capacities gave little importance tolocation of markets. This situation led to unwarranted concentration of

- 174 -
production facilities in the regions where resources like limestone were abundantand better infrastructure was readily available.
Regulatorv Policy Reforms
Efforts to reform restrictive cement subsector policies commenced in1976. Measures adopted in 1977 attempted to improve return on investment andstimulate creation of production capacities to meet the growing demand. Towardsthis objective, a decision was made to change the basis for fixing cement pricesfrom the 14% pre-tac return on total capital employed to a 12% pre-tax return onnet worth. The higher expected return on investments associated with this newpricing principle was sufficient to stimulate investment in the cement subsectorin the late 1970s. Subsequently, the Government took an important step to openthe sector by allowing new entry and expansion of existing capacities of MRTPcompanies in the ceament industry. As a result, by the end of 1981 about 12million tons of capacity expansion was to be implemented during the early and mid1980s. The major expansion, and the resulting easing of supply constraints,encouraged the Government to continue to liberalize its cement pricing anddistribution policies. In 1982, the Government partially reduced the cement levy,allowing a certain part of the production to be sold in the open market (non levycement), it was assumed that the weighted average price of levy and non-levysales should provide the same 12% return on net worth.
From 1982-89, there has been progressive liberalization of the cementsubsector. The levy cement obligation was completely eliminated, freightequalization scheme was eliminated, investment licensing and entry of MRTP firmswere further relaxed, and finally foreign technology acquisition andcollaboration was made easier. In 1989, price control was completely abolishedand since then the cement subsector has been operating in a relatively freeenvironment.
Performance
The cement industry has fared extremely well in the last 6-7 yearsas a result of sweep.tng reforms. In this section for convenience of analyses, theperformance of the cement industry is compared for two different periods: 1971-82, the period when the industry was heavily regulated; and 1983-89, theliberalization period.
I. Output
During the period 1971-82, the cement industry grew relativelyslowly, growing at the rate an average rate of 3.0% per annum (Table 1). The year1982 marks a watershed in the development of Indian cement industry. Changes inthe Government of India pricing, output control and distribution policies havebrought forward a very positive response from the industry. Cement output hasgrown at an average, rate of 9.3% per annum during the period 1983-89. Thesubsector now accounts for 0.2% of value added in the industrial sector.

- 175 -
TABLE 1: INDIA CEMENT SUBSECTORPERFORKANCE INDICATORS
Pre-dereuglation Period Post-deregulation Period1971-82 1983-89
I. Growth of Output 3.0 9.3(t per annum)
II. Capacity Utilization Rate 79.3 71.0(Z)
III. Profitability Performance
Net profit or loss 7.0 11.5Returns on capital employed (X) 13.6 16.0
IV. Effective Rate of Protection n.a. 33.0 to -51.0(Z)
Domestic Resource Cost n.a. 1.3 to 0.49
V. Imports as X of total 7.3 3.5productionExports as Z of Total 2.3 0.1production
Source: World Bank Staff Calculations.

- 176 -
II. CaRacity Utilization
During the period 1971-82, a gap remained between the potential andactual production due to poor capacity utilization in the industry caused byrestrictive policies pursued by the Government, aggravated by shortfalls in poweravailability and labor problems. As a result, and compounded by excess andgrowing domestic demand, a significant black market for cement emerged. Asmentioned above, 1982 can be considered as the turning point. Since 1982, theIndian cement industry has achieved considerable success in establishing adequatecapacity. The gradual lifting of price control, a liberal import policy,relaxation in investment licensing and entry of MRTP firms acted as incentivesfor the cement industry. Since 1982, whereas, the installed capacity expanded by1 per annum, capacity utilization rates did not fare as well. As a result ofthe surge in capacity expansion and new investment, the deficit domestic supplysituation caught up, and surpassed demand, creating a highly competitive cementmarket in India. The surplus situation has had a dampening effect on prices overthe last 5-6 years and a negative impact upon the average capacity utilizationin the industry. Average capacity utilization rates declined from 79.3% in 1971-82 to 71X in 1983-89. Other factors like power shortages caused by drought in1985-87, initial technical difficulties with some new plants and continuing laborproblems further contributed to low capacity utilization in the industry.
III. Erofitability
The operating profit margin has increased roughly from 7% per annumduring 1971-82 to 11.5% per annum during 1983-89. The return on capital employedincreased from 13.6X in 1971-82 to 16.0% in 1983-89. Inspite of a betterperformance implied by the profitability indicators in the latter period, thefinancial health of the industry has been deteriorating since the last few years.But the financial health of the industry should be viewed against thereorientation that the industry had to undergo in the period after deregulation.After 1982, the increase in installation of new capacity and output has beenrapid and has outstripped the growth in demand with a resultant depressing effecton ex factory prices. Due to the capital and energy intensive nature of theproduct, it takes about five years from new project conception to full, efficientoperation. Hence a number of plants (both new and the ones undergoingmodernization) are in a state of transition. As mentioned above, theprofitability of the industry has deteriorated since the beginning ofderegulation in 1982. The profit margin has come down from 15.8% in 1983 to 8%in 1988. Similarly, the return on capital employed has come down from 23.4% in1983 to 9.7% in 1988.
IV. Effective Rates of Protection (ERP) and Domestic Resource cost (DRC)
Data on ERP and DRC for the cement industry for pre deregulationperiod (1971-82) is not available. After deregulation in 1982 the tariff ratesset by the Government have been low and not necessarily for protective purposes.This is indicated by the fact that the effective rate of protection has rangedfrom 33% to -51% in this period. Also, the domestic resource cost for cementproduction has ranged between 1.3 to 0.49. A less than one DRC is indicative oflow protection in the industry.

- 177 -V. Imports and ExNorts
Imports of Cement into India are within the Open General Licensesystem with basic duties of 60% and auxiliary duties of 451. During the period1978-83, when the cement shortage was most acute, the Government allowed importedcement at a low (15X) tariff rate to cover the expected shortage and stabilizethe prices. Since deregulation, the Government has not been importing cement(except special oil-well cement) as domestic production is meeting the demand andimports have come down from 1.4 million tons per annum (7.31 of total production)in 1971-82 to 0.5 million tons per annum (3.51 of total production) in 1983-89.Growing competition in the industry has kept domestic prices well below importprices. The recent manufacturer's realizations (ex-factory prices plus transportexcluding excise tax, sales tax and dealers margin) at the port cities of Bombayand Calcutta were Rs 750 and Rs 900 per ton, respectively. These prices arecompetitive with an estimated price of imported cement at both ports of Rs 900per ton at the prevailing exchange rate in 1989.
Exports on the other hand, have maintained around 0.3 million tonsper annum in both periods, but as a proportion of total production, exports haveclec:Lined from 2.31 in 1971-82 to 0.11 in 1983-89 (Table 1). In the postderegulation period, exports have occurred to Bangladesh and Nepal, and theGovernment is tapping the potential for exports to countries like Thailand,Malaysia and Singapore. Given the direct production cost in a range of Rs 500-600per ton, and indirect cost of Rs 250 (interest and depreciation based on 1million ton plant with 851 capacity utilization), the exports could match theiinternational price range of US$ 50-55 without any export subsidies.
VI. Costs
Historical data before 1985 on operating costs is not available forthe cement industry. As of 1985, India continues to be an economic producer ofcement, despite steadily increasing capital costs of new installations and fueland power costs. The 1985 investment cost of a one-kiln plant of 1 million tonsper year capacity was substantially lower than the international standards. Thelower investment costs in India can be attributed to the high degree of domesticmanufacture, fabrication, and installation of cements plants at competitivedomestic labor rates. However, the average Indian plant's operating costsemploying dry technology has increased since 1985 but remains lower thanproduction employing wet technology. In 1989, the average operating cost of wetprocess plants was Rs 567 per ton compared to Rs 427 for dry process plants.

- 178 -
TABLE 2: INDIA CEMENT SUBSECTORDISTRIBUTION OF OPERATING COSTS (1989)
Wet process Dry Process
Raw Materials 12.5 14.7Packing Materials 14.1 15.8Coal 26.1 17.4Power 14.7 15.5Store & spares 5.2 5.4Labor 12.5 6.2Factory Overhead 6.0 3.7
Total Operating Cost 91.1 78.7
Capital Cost 8.9 21.3
Total Cost 100.0 100.0
Source: World Bank Staff Calculations.
From Table 2 it is evident that cement production is capital- andenergy-intensive. Cement production involving dry process technology is moreefficient than wet process technology as total operating cost as a proportion oftotal cost is much lower. On the other hand, capital cost for dry process is muchhigher than wet process.
VII. Technologv
As mentioned earlier, since the deregulation of the cement industryin 1982, the market for cement became highly competitive. As a result of whichprices decreased significantly. This created financial problems for older plantsof less than optional scale, utilizing the wet process technology. To remain inbusiness firms had no choice but to adopt more modern technology, utilizing thedry process technology (from Table 2 it is clear that operating costs are muchlower for the dry process). During the latter half of 1980s, the cement industryhas been undergoing a modernization and restructuring program which will allowthe firms to adjust to a more competitive environment in the future. Due to thenature of technology (capital and energy intensive), there is a long gestationperiod involved. For this reason the firms have not been able to keep down theircosts in late 1980s.

- 179 -
International Comparison
The deregulation of the cement industry over the past seven years hastransformed the sector's international competitiveness. The newer one million tonper annum plants coming on stream in India today are amongst the cheapestproducers in the world. The average across the bulk of the sector suggests thatproduction costs are below the landed import price. In addition to that thecountry has developed a competitive cement machinery manufacturing industry basedonI extensive firm technology linkages with firms in Europe, the USA and Japan.Iridian firms have been able to acquire latest technology from theircollaborators. As a result, the average annual investment cost per ton of cementcapacity installed in India is estimated to be within the range of US$ 100-130,compared to US$ 150-200 for more developed countries.
However, India's per capita consumption of cement is very low evenby developing country standards (India - 47 kgs per capita per annum, Zimbabwe- 81 kgs, China - 167 kgs, Pakistan - 66 kgs, Brazil - 182 kgs). This is due topast Government policies that had not encouraged producers to market cement inthe rural areas, nor promoted usage in new market areas together with lack offinancing for housing development. Due to low consumption demand, excess capacitybuilt up in the 1980s, as a result of which capacity utilization rates suffered.The average scale of Indian cement plants in 1989 was just 45% of what it shouldbe according to the International Efficiency Standards.

- 180 -
APPENDIX III-B: INDONESIAN TEXTILES INDUSTRY
The establishment of Indonesian textiles industry goes back to 1920sand 1930s. However, it was more or less completely destroyed during World War II.Subsequent rebuilding in the 1960s was concentrated in the public sector andaimed principally at meeting the domestic demand. From mid 1970s, the privatesector assumed a more important role and the industry expanded into exportmarkets, for both garments and textiles. At present, the textiles industry inIndonesia is one of the most important export-oriented manufacturing activity inthe country. Textiles account for 12.3% of non-oil manufacturing value added, 11%of manufactured exports, and almost a fifth of Indonesia's factory labor force.The textiles sector comprises of three distinct sub-industries: spinning/fibers,weaving/fabrics and garments. These sub-industries differ in their capitalintensity (high in spinning/fibers, low in garments), export orientation (low inspinning/fibers and high in garments), and ownership (large foreign ownership inspinning/fibers to large domestic ownership in garments). Government ownershipis concentrated in older, larger plants, primarily engaged in spinning.
Government Policies and Regulations
For much of the 1970s and early 1980s the rapid increase in oilrevenues led to an expanded role of the public sector across a large part of theeconomy, combined with a strong orientation towards the domestic market and abelief in closed guidance of the private sector, led to a proliferation of tradeand investment restrictions. As a result, the regulatory environment for privatesector activity became increasingly distorted and less transparent.
a) The Import Regime
In early 1980s the Government of Indonesia imposed a set ofrestrictions to protect domestic textiles producers. The two main policyinstruments of the Import Regime through which the Government exercised controlover the sector were, the Restricted Goods List (or Non Tariff Barriers) andimport tariff. Under the Restricted Goods List, four broad categories weredefined and all imports coming into Indonesia (finished products and inputs) wereplaced into respective category depending on the nature of the product. Briefly,the four categories were - IP (Importer Producer) license; AT (Agent Trader)license; IT (Importer Trader) license; PI (Producer Importer) license. During theimport substitution phase of 1980-85, 18 products fell under IP license category;254 products under the IT license category (covering all types of batik fabricand clothing); and 2 products under PI license category.
In the early 1980s, import tariffs emerged as important and effectivemeans to protect the domestic textile industry. The import weighted tariff forthe textile sector stood around 40-50% and for garments around 50-60%. One of themost important input into the textile industry - cotton (90% of which isimported) was subject to import tariffs. As a result, producers had to pay a muchhigher price for imported cotton, and to add to their woes, domestic cottonproduction did not suffice their needs in terms of both quantity and quality.

- 181 -
b) Trhe Exnort Regime
The Government's Export Regime has two facets, export regulationsincluding bans, quotas, taxes, approved exporter and quality control; and exportassistance measures. In the early 1980s, the country was under quota ceilings inmost items and the Multi Fibre Agreement (MFA) had perverse protective effectsfor newcomer exporters (such as Indonesia) through the restraints imposed onother established exporters (like Asian NICs). The quota allocation mechanismthat has evolved over the last 5-6 years has several binding constraints thataffect the export performance of the textile industry.
Firstly, non-transparency of the administration. The Department ofTrade allocates 80% of its allotted quotas according to past performance, and 10%each to newcomers and cooperatives. The criteria for deciding which firms receiveinitial quota allocations is not clear. In addition to that, some firms with pastsatisfactory performance have had their quota allocations cut withoutexplanation, and the definition of newcomer exporters is particularly unclear.
Secondly, the quota exchange mechanism has deterred open trading.Although a Textile Quota Exchange does exist, the penalties for using itconstitute an incentive for transferring the quotas outside the exchange and thequota holder loses 20% of the quota sold on the exchange. As a consequence, quotaholders only trade low volumes on the exchange to gather price signals. Quotaholders that neither use or transfer their quota rights are penalized at the rateof 200% of the unused quota.
c) Investment Licensing
Prior to 1985, combined with a restrictive trade policy, theGovernment of Indonesia pursued a policy of investment licensing and regulationof foreign direct investment. In particular the Government had a long listactivities within that were closed for both domestic and foreign participation.A large number of activities were reserved for small scale industries. Moreover,tlhe administrative machinery in charge of investment approvals was largelyinefficient. As a result, the growth of textile sector suffered and productivityof the industry declined significantly.
Regulatorv Policy Reform
Since the mid 1980s, the Government has embarked on a series of tradederegulation measures to make the textile industry more efficient. Between 1985-90, the Government introduced reforms addressing three principal areas: (a) NonTariff Barriers and Import Tariff; (b) Export Assistance measures; and (c)investment licensing.
a) Imnort Tariffs and Non Tariff Barriers
The Government of Indonesia has removed all restrictions on one ofthe major inputs into the textile industry - cotton. In 1986, cotton imports weremoved from the approved import category to the more open IP (Importer Producer)license category, which enabled domestic users to import cotton directly. In

- 182 -
January 1987, cotton imports were deregulated further by moving them from therestricted goods list and reclassifying them as an IU (Import Umum or GeneralImport) item. However, cotton imports were still not completely deregulated asimporters had to purchase 1 ton of domestic cotton for 10 ton of imported cotton.This restriction was finally lifted in November 1987. Other major inputsincluding synthetic fibers still remain on the Restricted Goods List. The needto protect domestic synthetic fibers producers may itself be due to an "informal"trade restriction on one of the most important input into synthetic fibre - PTA.The domestic synthetic producers have informally agreed to source about half oftheir PTA needs from a domestic plant (Pertamina plant) opened in 1986. In returnthe domestic plant will sell the product at import-parity levels.
While most of the "upstream" inputs into fibre production receive lowimport protection, this is not the case for finished products. The current tariffschedule provides escalating tariff for the textiles industry, increasing froman average 33% for fibers to a high 58% for garments. In addition, all batiktextile items are stLll on the Restricted Goods List, and can only be importedthrough State Trading Corporations.
b) Export Promotion Measures (the BAPEKSTA Facility)
This facility has played a key role in the growth of textile industrysince 1986 reforms. ]3APEKSTA currently provides two mechanisms which not onlyallow textile producers to access imports at world prices, but it also allowsthem to by-pass any remaining import license protection. The two schemes are: theExemption Scheme, which allows an exemption up to 100% for an exports over 65%of the total output; and the Drawback Scheme, which assists indirect exportersby allowing the final exporters to obtain a 75% refund on the duty/VAT paid ondomestically purchased imported inputs and a 25% refund once exports have takenplace. As a result of this facility, in 1988, approximately 33.3% of Indonesia'stextile exports utilized inputs imported through BAPEKSTA, up from 10% in 1986.
c) Investment Licensing
to improve incentives and the regulatory environment for the textileindustry, the Government, during 1985-90, changed its policy stance sharply fromcontrol of investment to encouragement. Most new investment approvals aredirected towards export activities.
Performance
The process of economic and regulatory reform undertaken in Indonesiasince 1985 has created an environment within which some of the structural andtechnological deficiencies in the textile industry have been removed. TheIndonesian textile industry has emerged as an important foreign exchange earnerbesides oil. In the following section, the performance of the textile isassessed for period before the reforms began, 1975-85, and the period after thereforms, 1985-90. In the period before reforms, during the first five years,1975-80, the textile industry was regulated but at the same time the exportpotential of the industry was considered and few export promotion measures were

- 183 -
undertaken. However, during the following five years, 1980-85, the textileindustry was heavily regulated. Meaningful deregulation of textile industry beganonly in 1985-86, and since then the Indonesian Government has progressivelyderegulated the textile industry.
Output
Indonesia's textile industry has performed strongly, with value addedincreasing by an average 16% per annum over the period 1975 to 1990. Growth wasparticularly rapid after deregulation began in 1985-86. The growth in value addedincreased from an average 14.0% per annum in the pre-reform period 1975-85 (12.4%per annum for 1975-80, and 15.7% per annum for 1981-85) to an average 24.2% perannum in the more outward oriented phase of 1985-90, with growth in employmentincreasing from 5.3% per annum to a significant 15.7% per annum. All three sub-industries have grown rapidly since 1975. In spinning/garments, the high growthrate in the period 1975-85 (Table 1), reflects the initial small base and theeasy import substitution period of development.
In the more outward oriented phase 1985-90, the rate of growth ofoutput in all three sub-industries accelerated sharply, primarily due toexpansion in exports.
Exports and Imports
Exports first began to increase in the late 1970s, following theNovember 1978 devaluation. After the second oil shock of 1979, however, thebenefits of devaluation were quickly eroded by the appreciation of the realexchange rate. Exports increased moderately after 1983 devaluation andimplementation of Government's Sertifikat Ekspor (Export Certificate) scheme.Table 1 shows the export performance for the industry and its sub-sectors in thepre-reform period, 1975-85. Exports grew rapidly during this period (from a muchsmaller base) at the average rate of 58.9% per annum. Growth in exportsaccelerated significantly (from a much larger base) after 1986 devaluation, andthe implementation of trade reform measures designed to increase producers accesstc imported inputs at world prices. Exports grew at the rate of 34.3% during theperiod 1985-90, with export growth rates being higher than 30% for all three sub-industries (Table 1).

- 184 -
TABLE 1: INDONESIAN TEXTILE SECTORPERFORMANCE INDICATORS
Pro-reform Period Post-reform Period1975-85 1985-90
Textile Industry Output 14.0 24.2(% growth per annum)Spinning/fibre 22.1 23.9Weaving/fabric 9.1 21.6Garments 40.9 32.1
Exports (Z real growth v.a.) 58.9 34.3
Spinning/fibre 28.4 107.9Weaving/fabric 54.8 33.4Garments 61.3 30.4
Imports (% real groRth R.a.) -4.2 25.2
Spinning/fibre -5.3 22.8Weaving/fabric -2.4 28.7Garments -22.0 17.5
Effective Rate of Protection 140.9 35.0(%)
Domestic Resource Cost 2.5 1.3
Source: World Bank Staff Calculations.

- 185 -
The imports data (Table 1) reflects the interplay of economy widepolicy factors. During the pre-reform period 1975-85, import of textiles wasmoderate in the first five years (1975-80). During the following five years(1980-85), when imports substitution was the heaviest, imports declinedsubstantially in all sub-sectors of the textile industry. The decline wasparticularly strong in the upstream fibre and fabric sub-industries where mostNTBs were focussed. Since liberalization in 1985, imports in the textilesindustry have picked up significantly, growing at an average rate of 25.2X perannum, up from an average -4.2X per annum in 1975-85. The import performance ofthree sub-industries has also shown improvement, reflecting a strong growth ingarment exports and the effectiveness of the recent trade policy measures,particularly the duty exemption and drawback scheme (BAPEKSTA).
Effective Rate of Protection (ERP) and Domestic Resource Cost (DRC)
The net effect of changes in tariffs on the value added of aneconomic activity is captured by the effective rate of protection (ERP).Estimates of ERP for the textile industry are shown in table 1. The structureof tariffs and other protective measures conferred ERPs of 140.92 in the pre-reform period, 1975-85. After 1985, the tariff schedule was rationalized togetherwith across the board reduction in the rates. The ERP for textiles industrydropped to 35X in the year 1990.
Similarly, domestic resource cost (DRC), another measure ofefificiency for an economic activity, showed a downward trend. From 2.5 in thepre-reform period, 1975-85, to 1.3 in 1990, implying a more efficient environmentfor textiles production.
Technology and Capacity Utilization
At present, the spinning operations are in most part relativelymodern and in good condition. Around 30,000 state-of-the-art open-end rotorscurrently in operation. The operating performance of this sub-industry has beenreasonably satisfactory with 84X capacity utilization (up from 80% in the periodbefore reforms, 1980-85) and 821 production efficiency. On the other hand, mostweaving operations are technologically outdated with average size of the plantbeing just 100 looms. The state-of-the-art looms account just 51 of totalinstalled capacity. The sub-industry is characterized by a low capacityutilization rate (671 for the period, 1985-90). Garment sub-industry, the mostrapidly expanding sector within the textile industry, comprises of 3000relatively small enterprises producing 850 million garments per year. This sub-industry is not technologically modern as most garment production still takesplace using cheap labor. However, the capacity utilization of the sub-industryhas gone up from 751 in the early 1980s to 89.51 after the reforms mainly due tohigh export performance and more productive environment.

- 186 -
APPENDIX III-C: PHILIPPINES CEMENT INDUSTRY
The cement industry of the Philippines comprises a total of 18 plants(of which 17 are iLn operation). The cement market is divided into two broadareas, Luzon and Vismin (for Visayas and Mindanao). The total annual productioncapacity of the industry is 7.4 million tons of clinker and 9.5 million tons ofthe finished product, portland cement. Given the old age of the plants andlargely obsolete technology, the clinker capacity has been rerated at only 6.2million tons per year (TPY). With operational difficulties, even that capacitywas utilized to only 77% in 1988 despite the growing cement shortages in thecountry which started in 1986-87. The industry built up excess capacity duringthe import substitution regime of 1950s and 60s. As a result of which, during the1970s and the first half of 1980s, production capacity largely exceeded thedemand for cement. With production level between 6-8 million TPY and domesticconsumption fluctuating at levels between 3-4 million TPY, almost 20% of thetotal output ended up being exported. However, rapid economic expansion since1986 has put a severe strain on the industry's ability to meet booming demand andthe country had to start importing in 1986.
Government Policies and Regulations
Protection of the cement industry from outside competition dates backto early 1950s. High tariff rates; import restriction and price control have beenthe main features of a restrictive policy pursued by the Government towards thecement industry. Wihereas high tariffs were introduced much earlier, seriousregulation of the cement industry at the domestic level, started only in 1973with the promulgation of Presidential Decree, creating the Philippine CementIndustry Authority (PCIA) in response to the request of cement companies who werefacing an oversupply situation. To eradicate the excess supply in the cementindustry, the government regulated entry of new firms, regulated distribution offinished product and introduced price controls. From 1973 to 1985, the cementindustry has seen various policy shifts, mostly of restrictive nature. Thefollowing section briefly examines the regulatory policies faced by the cementindustry under different spheres. Following that, the reforms introduced by theGovernment after 1986 will be examined.
a) Price Control Policies
The Government introduced price control policies in 1973 with theestablishment of PC]A, as a means to control the excess supply of cement. Theimplementation of PCIA's policies was made through the industry arm, PhilippineCement Manufacturer's Corporation (Philcemor). During the period 1973-89, pricesfor cement have been under formal or informal price control by the Government.However, the coordination and implementation of price control policies has beenlopsided. Normally, price adjustments would be made arbitrarily by Philcemor andthe Department of Trade and Industry (DTI), without taking into account thechanging cost structiure at the plant level. Thereafter, Philcemor and DTI wouldmonitor the industry through price surveys and checking the distributor's pricesregionally. As a result firms faced price ceilings during booms, but no pricefloors during bad years, contributing to uncertainties and low profitability forthe whole industry. Table 1 indicates how cement prices were deliberately keptlower than the overall prices in the economy which led to inefficiencies in the

- 187 -
cement industry.
TABLE 1: PHILIPPINE CEMENT INDUSTRYCOMPARATIVE PRICE GROWTH RATES FOR THE PERIOD 1973-89
Ex-plant cement prices 11.7%Wholesale Cement prices 12.3%Retail cement prices 10.9%Economy wide wholesale prices 15.4%Economy wide retail prices 13.0%
Source: Philippine Cement Subsector Study, Development Bank of Philippines, March1990.
Regulatory Policy Reform
Since the early 1980s the Government began lifting controls but onlyin a piecemeal fashion. It was only after the February Revolution of 1986, thatthe Government began serious restructuring of the cement industry. In 1986, PCIAwas abolished and an ad hoc task force was convened to design an action plan forthe industry. The task force recommended a full transfer of PCIA functions toPhilcemcor (Philippine Cement Manufactures Corporation); the deregulation ofcement industry by lifting the price control on cement; and non-involvement ofgovernment in cement operations.
a) Reform in Price Control Policies
Price control was lifted in early 1989. However, given the boomingdemand, limits on domestic supply, and the constraints on imports, prices rosesignifEicantly. As a result, price control was re-imposed in mid-1989 again.Given recent increases in import prices due to tightening of the internationalcenment supply, the government suspended import tariffs (0%) until mid-1990, (withthe prospect of further extension of that suspension) to put downward pressureon pr:Lces. At present, a two-tier pricing system exists: domestically producedcemenit is subject to price control; imports are uncontrolled and even at 0% duty,the! import prices are higher than the domestic price. As a result, the demand forimported cement is low and only limited quantities of imports come into thecountry, aggravating the shortage further.
b) Reform in Tariffs and Duties
The tariff reform program (TRP), which was introduced in 1981, hasbeen successful in bringing down the tariff rate from 50% in 1979 to 40% in 1988to 20% in February 1989. The objective of TRP was to lower levels of tariffassistance and even off dispersion of the levels of assistance within the cementindustry. The TRP was part of a broader and major structural adjustment programafter three decades of protection of the industry. As mentioned above, inDec-ember 1989, the Government abolished the tariff on imported cement to mitigatethe chronic shortage of cement in the country. However, the reforms made were

- 188 -
TAUI 2? U!.PPTnI SEEN IUCTOR
Pro-refo P Post-reform Period1971-85 1986-89
I. Growth of Output 0.4 ̂ , 23.7(X per annum)
II. Capacity Utilization Rate 64.6 77.3(in Z)
III. Profitability Performance
Net Profit or Loss -2.8 3.0Turnover: Sales/Assets 46.3 75.9Return on Assets -1.4 2.2
IV. Effective Rate of Protection 136.9 42.7(ERP in Z)
V. Domestic Resource Cost (DRC) 2.7 1.9
VI. Productivity IndicatorsTotal Productivity Index 0.7 0.6(TPI) &Total Productivity Growth 8.5 4.5Rate (TPGR) (X)Labor Productivity Growth 8.7 40.0Rate (Z)
VII. Exports as Z of Total 14.6 0.3ProductionImports as X of Total 0.0 4.7Production
Source: Philippines Cemen1t Subsector Study, Development Bank of Philippines, March 1990.Note: The pre-reform period can be divided into four distinct periods. Between 1971 and
1975 the output grow at an average rate of 6.2X p.a.; during 1976-79, the output grewat an average rate of -2.4X p.a.; during 1980-83, at 4.21 p.a.; and, for 1984-85 at -9.7% p.a. Capital stock data used in computation of TPI is adjusted for capacityutilization.

- 189 -
not: adequate as tariff rates on important raw materials still remain the same.In case of Gypsum, which is an important input, the tariff rate has remainedconstant at 20X since the last ten years. Similarly, coal and fuel oil, which arethe most important energy sources, still maintain the same tariff rates.Performance of the Cement Industry
The present section analyses the performance of the cement industryunder two different periods: 1973-85, the period before deregulation of thecement subsector; and 1986-89, the period under which meaningful deregulation ofthet cement subsector started. Table 2 shows the performance indicators for bothperiods.
I. Output:
Cement production in the Philippines during the pre-reform period1971-85 grew at the average rate of 0.4X per annum. During the entire pre-reformperiod cement production has shown a cyclical pattern with intermittent periodsof high growth and stagnation. Between 1971-75, the cement industry protectedheavily from outside competition, showed rapid growth, growing at an average rateof 6.2X per annum. During the following four years, 1976-79, the period when theregulatory measures mainly in the form of price controls were most stringent, theindustry experienced a significant decline in performance when average growth ofcement production fell to -2.41 per annum. Following that, except in 1981, theindustry achieved consistent growth between 1980-83, growing at the rate of 4.2%per annum. During 1984-85, largely due to overall stagnation in the economy, theindustry performance declined substantially, growing at the rate of -9.7% perannlum (see Table 2). On the other hand, performance has been consistent in thepost-reform period (1986-89) as a result of liberalization policies introducedby the Government starting in 1986. The cement industry showed a steep recovery,growing at the rate of 23.7% per annum between 1986-89.
II CaDacity Utilization:
As mentioned above, the original annual production capacity of thecement industry is 7.4 million tons of clinker and about 9.5 million tons of thefinal product (cement). However, the industry capacity has been reratedoccasionally by Philcemor in consideration of the current status of equipment andimprovements thereof. The period before liberalization of the cement subsector1971-85, shows an average capacity utilization rate of 64.61 p.a.. After 1986,the demand for cement increased sharply as a result of which the Government waspressured to lift price and distribution controls. The cement industry benefittedfrom this move and the capacity utilization rates shot up to 77.3X during 1986-89.
III. Profitability:
During the pre-reform period (1971-85), cement industry registereda net loss of -2.8 H Pesos on average. This can be attributed to the instabilityof the cement industry and the cyclical nature of production before reforms.The year 1986 can be considered as the turning point for the cement industry. Netprofits increased to an average of 5 M pesos per annum between 1986-89, mainly

- 190 -
due to increased demand and removal of price controls. Similarly, the turnoverof assets, reflected in the sales to assets ratio was relatively low before 1986(see table 2) and then shot up after 1986. Lastly, the industry's return onassets show a strong correlation with the industry's profitability. Return onassets was -1.4% p.a. on average during 1971-85, increased to 2.2% p.a. during1986-89.
IV. Effective Rates of Protection:
A commonly used indicator to measure the efficiency of an industrialactivity is the Effective Rate of Protection (ERP). ERP measures the net effectof tariff and taxes on value added. Table 2 shows the ERP for the cementindustry for pre- and post-reform periods. The average ERP during the pre-reformperiod was 136.9%. After the regulatory policy reform in 1986, the ERP for thecement industry declined dramatically to 42.7% for the period 1986-89. Theconsistently declining trend in ERPs is an indication that the Tariff ReformProgram, which started in 1981 and picked up pace since 1986, has achieved itsobjective of reducing the levels of assistance and containing the levels of ERPsin the range 30-80%.
V. Domestic Resource Cost (DRC):
Another commonly used indicator to measure efficiency is the DomesticResource Cost (DRC). DRC is the amount of domestic resources needed to save orearn a unit of foreign exchange in shadow prices rather than at market prices.Table 2 shows the DRC calculations for the cement industry for the pre- and post-reform periods. During pre-reform period, the average DRC for cementmanufacturing was 2.7. In the period after deregulation, 1986-89, the average DRCfor cement manufacturing declined to 1.9 indicating an improvement in cementmanufacturing as a result of regulatory policy reform.
VI. Productivity:
ProductLvity performance of the cement industry can be gauged fromTable 2, in which total productivity indices (TPI), total productivity growthrates (TPGR) and Labor productivity annual growth rates are shown for pre- andpost-reform periods.1 Both TPI and TPGR show a declining trend from pre- topost- reform period (see table 2). This can be attributed to the fact technologyhas become largely obsolete over the years and modernization of most plants isstill under implementation. As for labor productivity growth rates, during thepre-reform period, Labor productivity grew at the rate of 8.7% per annum. Theperiod after deregulation, 1986-89, saw a higher growth in labor productivity.Labor productivity grew at the rate of 40% per annum. Drabek (1990) attributesthis change to the efforts made by "sick" cement plants to resume operations with
. Total productivity is different than total factor productivity in thesense that it is calculated from gross output instead of value addeddata which gives TFP. For the lack of a suitable deflator for valueadded, totatl productivity index is preferred to total factorproductivity index.

- 191 -
a miniimum number of employees and under a better regulatory environment.
VII. Exports and Imports:
The industry's export performance has been remarkable in the pre-reform period considering the fact that the production environment has not beenconducive to high performance. Philippines on an average exported 14.6% per annumof its total cement production in the pre-reform period (1971-85). The exporttrend is negatively correlated with the domestic demand. During periods of lowdomestic demand, exports as a proportion of total sales have been much higher andvice versa. This is reflected in the period with high domestic demand, 1986-89,avrerage exports as a proportion of total production were only 0.3% per annum.Simi'larly, the country did not import any cement until 1986. Imports as aproportion of total production were nil during 1971-85. After 1986, due to adramatic rise in domestic demand, imports as a proportion of total productionrose to 4.7% per annum.
VIII. Minimum economic scale and prevailing technology
Despite of the improvements made in capacity utilization rates by thecement industry, the average scale of plants as a proportion of the minimumeconomic scale (MES) of today's plants remains as low as 45-50%. This can beattributed to obsolete technology. Cements firms after the demand boom of 1986have been looking into ways to modernize their plants. However, adoption of newtechnology will not bring immediate results as such a process has a longgestation period. Except for one, all plants predate 1972 (i.e, using technologypredating the energy crises), with an average age of key installations of over25 years. Despite a sharp rise in petroleum prices in 1973, no efforts were madein the 1970s to convert to energy and fuel efficient technology. Energy and fuelconsumption in the period 1971-85 remained 40-50% above that of modern plantstoday. In the post deregulation period, 1986-89, some plants adopted more fuelefficient technology but the fuel and energy consumption levels of the cementplants still remain much higher than the international standards.
IX. Costs:
The data on manufacturing costs is available for the year 1989 only,t'herefore, it is difficult to compare cost structure of the cement industrybefore and after deregulation. Table 3 gives the breakdown of manufacturingcosts in different regions/plants of Philippines for the year 1989. It is evidentfrom the table that fuel and energy costs account for almost 50% of the totalmanuLfacturing costs in all three major cement producing regions. On the otherhand, the proportion of raw material and labor costs to the total costs is low.

- 192 -
TABLE 3: PHILIPPINE CEMENT SUBSECTORMANUFACTURING COST STRUCTURE OF THE MAIN PLANTS
LocationCost Item Luzon Visayas Mindanao
Raw Materials 8.01 8.0X 8.51Fuel 27.71 24.0X 25.01
Electricity 13.0% 12.01 8.01
Gypsum 4.0X 4.01 4.01
Labor 4.0% 5.01 5.01
Depreciation/Interest 18.01 19.01 19.51
Other Expenses 25.3X 28.01 30.01
Total Cost 100.0 100.01 100.01
Source: The Philippines, Cement Subsector Study, Development Bank of Philippines,March 1990.
International Comparison
In comparison to its major competitors in East Asia, Thailand, Japanand Indonesia, the Philippine cement industry is inefficient and less competitivein terms of prices. Except for labor and raw materials, which are the cheapestin Philippines, all other input costs are significantly higher than in othercountries. In 1989, the FOB plant price (net of taxes) was 57 US$ per bag ofcement compared to 4:2 and 53 in Indonesia and Thailand respectively.
The technology employed at cement plant in Philippines is obsoletecompared to other Asian competitors. Table 4 shows the production rates by typeof process on installation capacity basis for Philippines, Indonesia and Japan.

- 193 -
TABLE 4: PHILIPPINE CEMENT SUBSECTORCEMENT PRODUCTION RATES BY TYPE OF PROCESS (1989)
Dry Semi-dry Wet Total
Philippines 50.8X 34.71 14.51 100.01
Japan 96.11 3.91 0.0 100.01
Indonesia 96.71 0.71 2.61 100.01
Source: The Philippines Cement Subsector Study, Development Bank of PhilippinesMarch 1990.
Countries with modern cement plants produce cement mostly by dryprocess2. In Philippines only 50.81 of the total cement production is by dryprocess, compared to 96.1X and 96.71 in Japan and Indonesia respectively. Otherproduction processes, semi-dry and wet, are more prevalent in the Philippinescontributing to higher energy costs, therefore, higher prices.
2. Dry process technology is more heat and fuel efficient compared to thewet process.

194 -
APPENDIX III-D: SRI IANKAN TEXTILE INDUSTRY
The Sri Lankan textile industry makes a significant contribution tothe economy. It accounts for approximately 25% of the manufacturing sector outputand contributes 40% of the total exports by the country. The textile industrycomprises two main areas of operational control; the public sector textile millscover the industry's largest composite mills (but contribute only 20% of theindustry's output); and, the private sector which includes the medium sizedweavers and processors, and many small independent and decentralized weavers(contributing 80% of the industry's output). Within the textile industry themain subsectors are spinning, weaving/knitting, processing, and garments. Theindustry is characterized by either large integrated mills (usually in the publicsector) and the decentralized small mills involved only in weaving and/orknitting.
Government Policies end Regulations
Since the late 1940s, and until the liberalization of the economy in1977, Government inte!rventions in the economy grew gradually, but steadily. Inthe following section, the regulatory policies affecting the textile industry arepresented under two broad headings: the regulation of the private sector; andtrade regime.
a) Public Sector and the Regulation of Private Sector
From 1956 to 1977, the Government pursued a policy of nationalizationand regulation of the private sector. This was motivated by the fear that theprivate sector would not invest sufficiently in industrial projects, which soonbecame justified as private investors were discouraged by the presence ofGovernment in the textile industry. As a result, by early 1970s, the role ofprivate sector in the textile industry had diminished substantially and theGovernment became the largest industrial entrepreneur. The Government of SriLanka (GOSL) had a significant and direct control over the industry through theNational Textile Corporation (NTC), which operated the three composite mills inthe cotton mill subsector; Pugoda (PTM), Thulhiriya (TTM), and Veyangoda (VTM),and a major spinning mill, Mattegama (MSM). Through the Department of TextileIndustries (DTI), the GOSL controlled the operations of 82 workshops grouped into12 centers, and the synthetic weaving factories of Ceylon Silks and J.B.Textiles.
b) The Trade Regime
From 1956 to 1977, the textile industry operated in a protectedenvironment without any significant competition from imports. The import-substitution, state-sponsored industrialization had several negativeconsequences. Growth of output became the prime objective without anyconsiderations to efficiency. The higher costs of domestic textile productionseverely taxed the absorptive capacity of an already small market and ruled outproduction for foreign markets. Moreover, unable to compete with imports, thePublic Manufacturing Enterprises (like NTC) lobbied for more protection. High PMEprotection was an important factor in creating negative protection in the textileindustry which prevented the development of potentially competitive export-

- 195 -
oriented industries.
ReuglatorE Policy Reforms
The Government of Sri Lanka first began liberalizing its economy in1977, when the new Government changed the philosophy of economic management thathad dominated decision making for over two decades. The new Government's policywas to limit the role of the state and expand the role of market forces in theallocation of resources. Various reforms were introduced affecting both, thetrade regime, and the domestic regulatory policy. However, the reforms introducedbetween 1977-87 were not adequate, and in 1987 the Government further liberalizedthe textile industry.
a) ]?ublic Manufacturing Enterprises (PMEs) and Privatization
After a wave of nationalization in the early 1970s, the GOSL beganrestructuring the PMEs involved in textile production in 1977. As a firstmeasure, the National Textiles Corporation (NTC) mills were converted intoGovernment Owned Business Units (GOBUs), which had considerable individualdecLsion making power and financial autonomy. Furthermore, the Department ofTextile Industries (DTI) sold 10 of 12 powerloom centers to private industry andJ.B. Textiles was divested. In the early 1980s, NTC's four mills, PTM, TTM, VTMand MSM, came under foreign private management. However, despite of some positivesteps taken by GOSL during the period 1977-87 to promote privatlzation, the roleof Government did not diminish substantially. The NTC still exercised controlover textiles production through allocation of raw material imports (especiallycotton).
In March 1987, the GOSL's Industrial Policy Statement (IFS), set outto remove all constraints in the way of privatization. The reforms introduced byithe Government allowed NTC's four mills, which were under private foreignmanagement, to become independent companies, privatized and modernized throughforeign joint ventures. As a result, the two largest mills, TTM and PTM weredivested in 1989-90. TTM was sold outright to a Korean textile company, and anIndian textile investor acquired a 60% participation in PTI. Both investors haverestructured and modernized the mills, mainly for exports. The divestiture of thethird mill VTM is underway.
b) The Trade Regime
In 1977, the GOSL eliminated all import quotas and replaced them withtariffs. Imports of textiles to serve the growing export garment sector wereliberalized by the establishment of bonded warehouses, provision of duty drawbackand duty free imports for units located in the Free Trade Zones (FTZs). Therewere several structural changes in the tariff system between 1979 and 1984 aimedat eliminating negative effective protection and at reducing the dispersion inthe effective protection rates. To encourage non-traditional exports liketextiles, the Export Development Board (EDB) was created in 1979 to manage theexport incentives. During the same year, to encourage garment exports (and othernon-traditional exports as well) a Free Trade Zone (FTZ) was established nearColombo. Foreign export-oriented enterprises were attracted to this zone by theavailability of cheap labor, free access to imported inputs and generous tax

- 196 -
incentives. A new agency, Greater Colombo Economic Commission (GCEC) was createdto manage these incentives and given authority to approve investments in the FTZ.In 1980, a duty rebate scheme and a bonding scheme were introduced, wherebyimported inputs for exporters are exempt from tariffs. In 1985, the ban ontextile imports was eliminated.
In 1987, along with other reforms, the Government's IPS furtherliberalized the trade regime. First, despite of several reforms introduced toliberalize the trade regime between 1977-87, the domestic textile industryremained highly protected from international competition. The 1987 GOSL'sIndustrial Policy Statement set out to make the textile industry more competitiveinternationally by phased tariff reduction and import liberalization. The tariffrate for textile was reduced from l09X (early 1980s) to 60X after 1987 reforms.Second, the GOSL introduced a new set of export incentives in 1987. Theseincentives are aimed at providing exporters with, access to tradeable inputs atinternational prices, and fiscal incentives including direct cash payments.
Performance
Government policy has had a significant impact on the performance ofthe textile industry. Liberalization of trade and industrial policies, thelifting of foreign exchange restrictions and a growing commitment to privatesector as a basis to develop the industry contributed to a strong performanceafter the liberalization period. In this section, the performance of textileindustry is compared for two periods. The pre-reform period 1971 to 1977, whenthe industry was heavily regulated and the public sector involvement was large,and the post-reform period, 1978 to 1990. The post-reform period has two distinctphases, 1978-87, during which the first wave of trade and industrial policyreforms were introduced but at the same time the role of the Government inindustry affairs remained large; and, 1987-90, when more comprehensive reformswere introduced.

- 197 -
TABLE 1: SRI LANKA TEXTILE SECTORPERPORMANCE INDICATORS
Pre-reform Period Post-reform Period1971-77 1978-90
OutDut, 10.4 21.4(annual average X)
Capacity Utilization n.a. 66.0 k\(X)
Eports as X of Total Exports n.a. 27.3 c
Imoorts as X of Total Imoorts n.a. 9.4 d
Effective Rate of Protection (X) n.a. 141.0 e
Domestic Resource Cost n.a. 0.5
Source: World Bank Staff Calculations.
Note: ji An average of 19.6S p.a. during 1978-87, and 23.3% during 1987-90.-_ An average of 52X p.a. during 1978-87, and 801 during 1987-90.j An average of 23.6X p.a. during 1978-87, and 31.0X during 1987-90.4i An average of 5.9X p.a. during 1978-87, and 13.02 during 1987-90._ ERP and DRC data for post-reform period is available for 1985 only.
- 198 -
OutRut
The liberalization of the textile industry has had a direct effecton the performance. Before 1977, the value of production of the textile industrygrew at an average rate of 10.4% per annum. After 1977, the performance of theindustry improved significantly as a result of trade and industrial reformsintroduced by the Government. The value of production of the textile industry inthe post-reform period, 1978-90, grew at the rate of 21.4% p.a.. Within thepost-reform period, the performance improved significantly. During the firstphase of reforms (1978-87), value of production grew at an average rate of 19.6%per annum. The environment in which the textile industry has been operating hasbeen conducive to a bhigh performance after 1987 when more comprehensive reformswere introduced. The growth in value of production has been on average 23.3% perannum for the period 1987-90.
CaRacity Utilization and Technologv
Prior to 1977, the main objective of the import-substituting, statedominated textile inidustry was growth of output without any consideration toproduction efficiency and quality of product. Moreover, the production capacityof the industry did not match the local demand requirements. This trend continuedwell after 1977 even when the reforms were introduced. The supply gap whichlasted until 1987-88, can be attributed to low capacity utilization rates andobsolete technology of the textile industry. Capacity utilization data for thetextiles industry is not available for the pre-reform period (1971-77). Duringthe post-reform period (1978-90), the capacity utilization rate was 66% p.a. onaverage. Within the post-reform period the capacity utilization rates fortextiles industry were significantly different. During the first phase ofliberalization (1978-87) the capacity utilization rate for the textile industrywas 52%. The main constraint for low capacity utilization during this period hasbeen the shortage of working capital, with resultant restrictions on newtechnology acquisition. In 1985, only 31% of the operating machinery was 15 yearsor less old. The remaining 69% of the machinery is more than 15 years old.However, since 1987 onwards the textile industry has made tremendous progress inincreasing its production capacity. Increased foreign participation and greatersupport to the private sector by the Government has resulted in highermodernization investments. This has enabled the textile mills to increase theirproduction capacity, raise efficiency and progressively turn to exports. Capacityutilization rate for the industry shot up to 80% in the second phase ofliberalization (1987-90).
Exports and Imports
Before 1977, Sri Lankan textile exports were negligible andproduction was mainly for domestic consumption. Similarly, the textile importscoming into the country were highly restricted. Textile exports (particularlyready-made garments) picked up after 1977 as the Government allowed the industryto import fabric duty free through FTZ facilities. In 1987, the Governmentfurther liberalized the trade regime making it easier for the industry to competein the international markets. During the post-reform period 1978-90, textileexports as a proportiown of total exports were 27.3% per annum, out of which 92%were ready-made garments.
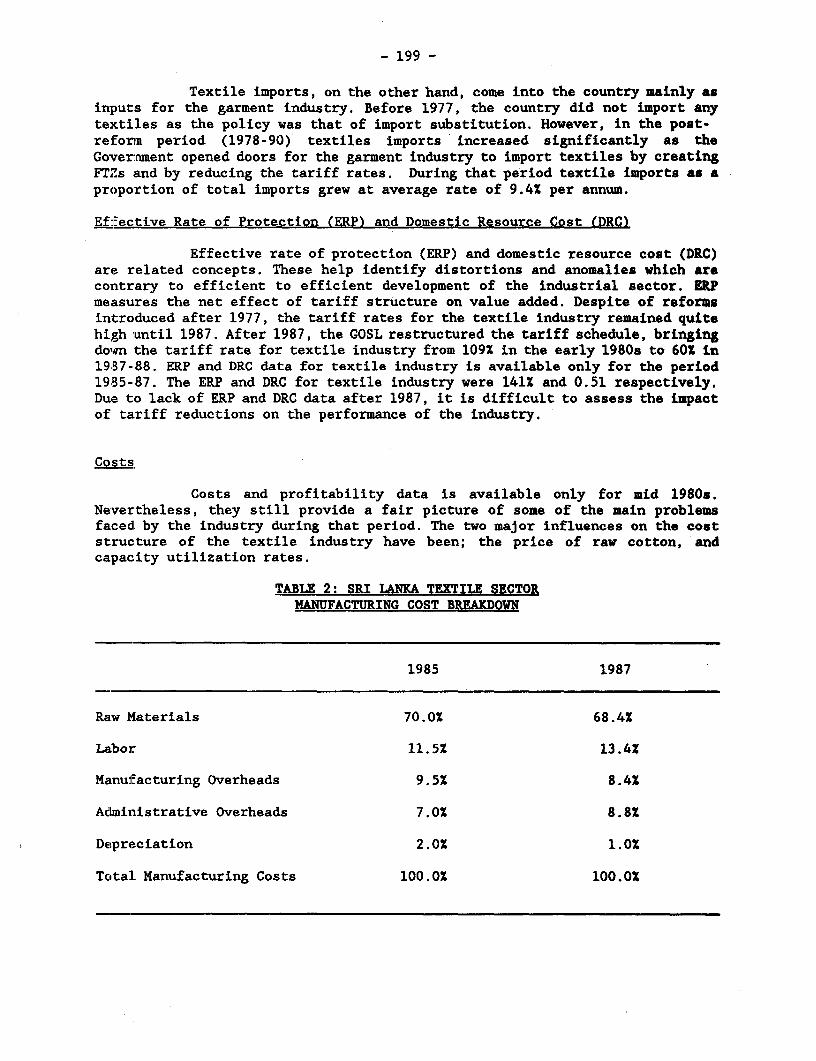
- 199 -
Textile imports, on the other hand, come into the country mainly asinputs for the garment industry. Before 1977, the country did not import anytextiles as the policy was that of import substitution. However, in the post-reform period (1978-90) textiles imports increased significantly as theGovrernment opened doors for the garment industry to import textiles by creatingFTZs and by reducing the tariff rates. During that period textile imports as aproportion of total imports grew at average rate of 9.4X per annum.
EfEective Rate of Protection (ERP) and Domestic Resource Cost (DRC)
Effective rate of protection (ERP) and domestic resource cost (DRC)are related concepts. These help identify distortions and anomalies which arecontrary to efficient to efficient development of the industrial sector. ERPmeasures the net effect of tariff structure on value added. Despite of reformsintroduced after 1977, the tariff rates for the textile industry remained quitehigh until 1987. After 1987, the GOSL restructured the tariff schedule, bringingdown the tariff rate for textile industry from 1091 in the early 1980s to 60X in1987-88. ERP and DRC data for textile industry is available only for the period1985-87. The ERP and DRC for textile industry were 141X and 0.51 respectively.Due to lack of ERP and DRC data after 1987, it is difficult to assess the impactof tariff reductions on the performance of the industry.
Costs
Costs and profitability data is available only for mid 1980s.Nevertheless, they still provide a fair picture of some of the main problemsfaced by the industry during that period. The two major influences on the coststructure of the textile industry have been; the price of raw cotton, andcapacity utilization rates.
TABLE 2: SRI LANKA TEXTILE SECTORMANUFACTURING COST BREAKDOWN
1985 1987
Raw Materials 70.0X 68.4X
Labor 11.51 13.4X
Manufacturing Overheads 9.51 8.41
Administrative Overheads 7.01 8.8X
Detpreciation 2.01 1.01
Tota:L Manufacturing Costs 100.01 100.01

- 200 -
From Table 2 it is evident that raw materials costs account for ahigh proportion of the total costs. The cost of raw materials (mainly cotton) issubject to variation in the world demand, and a marginal change in cotton pricescan change the proportion significantly. The extent of capacity utilization hasa considerable impact upon total manufacturing costs, but not as much on othercomponents of total costs. Capacity utilization as shown above has improved sincemid-1980s, and has helped bring down the manufacturing overhead component.
International arison
Over the 5-7 years, the Sri Lankan textiles industry has become oneof the leading exporters of garments in the South Asia region. This has beenpossible mainly due to availability of cheap labor. Table 3 shows the labor costsper hour for eight countries. Sri Lanka has comparative advantage in theproduction of garments due to cheap labor. This does not relate to labor cost perunit of output since productivity levels vary between countries listed, however,the Sri Lankan work force has the advantage of being relatively well educated.
TABLE 3: T INWL COMPARISON OF LABOR COSTS (1987)
_OUNTRY AVERAGE COST/OPERATING HOUR (USS) OHK (labor productivity) aj,Japan 6.3South Korea 1.9Hong Kong 1.7Taiwan 1.6 -Turkey 1.2 29India 0.7 47Pakistan 0.5 51Sri Lanka 0.3 76Ethiopia 0.2 77
Source: World Bank Staff Calculations.Note: AS Operative hours required per 100 kgs of production (OHK).

Distributors of World Bank PublicatonsARGENTINA EL SALVADOlt JAPAN SOUTH AFRICA, BOTSWANACarioH HIh,u11U Fhado burn ba&Sero For ia Caloi Gumi Alam Dr. Mw*dS tdip* Aru4SSI HonVp o 9 n I3 = SUOxford Uni, PrmFlo=ids1. 4th RIoor 43/44 5diideS8JWA. I, Tdqe Southen Africa1333 Dat Abu S9n Salador 0l P.O. Box 1141
IMNYA Cape Town 8000AUSTRALIA., PAUA NW GUINEAW INLAND Al SookS S () Lid.FIJI, SOLOMON ISLANDS. Ahkaftai IKa Upp Qurn H_ u Stl* Forsunrimc rVANUATU, AND WSSTERN SAOA P.Q 8bx 128 P.O. 1Ox 45245 lntamonal Subsnption ServiceDA Bo,e x aunAa 1410101 Hal" 10 Nirdo P.O. Box 41095646 Whilbho Road CrlgsbuMitm 332 FRANCE KORRA,UIPWULCOP oohannradu 2024Victoa Word lakk PAMlN Pa K0M okCopm"m
6S, avaeudlSta P.O. so t10, Kwagowoeuf SPAINAUSTRItA 75116PaI sow MundiA-Prm LIba. SA.CGeokw and C. CaslIUo37Crdbmn3l GEMANY MALAC IiA 28001 MadridA-IOlL Wien NO, all V U fMialcoopuaiw
APON Boyepd LIVAImp,d Lbrta lntbnalonABDAEDWSIANGLADESH WJO B 1 P.O. b1tt27,oPn p r t Cona11 do Cnt 39SMh4o hnduat D opmut W Kuaka Lm O" BDaiclona
AoiiaaSoda DAS) CUATALAHn S, Road 16 L1arwI Pb 9 Sant MEIOCO SRI LANKA AND THE MALDIVESDhnnondl R/Ara S CeIa 7 INPOIEC Lak Housa BookshopDaka 1209 Zon 1 Apta do PmA 2_10 P.O. BDx 244
Cuaemalacity 14080 T_, pfM 1 D.l. 10t, Sir Chiaampalm A.Bne .,m Guriad Mawatba
156, Nur AlwAd S9xk HONC KONG, MAC N ILANDS Colombo 2Chit"g 4000 Ask 2D00 LI& De UndINOo.jOr- a
4 WyndhamSt P.O. Sox 21 SWEDEN76, KDA Aveaute WInninGeant 740 AHaM*AlW" ForW uxgi IiIKolna 9100 2nd FRlor Fritta Faclboaot
CeAl Hong Kong NEW ZEALAND Rginpo 12U, Bocx 1t6356BELGIUM EBoCO NZ Lii S-103 V SlokholmJoan E La" INDIA PrIvatMMil "914Aw. duii R2.02 AlLId P01b151M Plwt LKM NOw Mailt For FP e n iir:1060 Brua 75M Mrout Rod Aucdand Wennogren-WU11am AB
Midr-600ao2 Bo30004CANADA NICIUA 5.104 25 Stckholm
aDl*fuhur * _ Uni=ty lmC.P. 8i, 5013 rB Amptt 1 J.N. HWia Taw g SWITZERLAND1bucm dIQbC Bhrdlai Pi'.utaMa agSS Fworqrutis
143 SRI loaby. 400y Iobad LDalkir P_yat1. rue de Bourg
CHINA 23/14iA8 ll Rea NORWAY CH01002 LaunnwChin. Firneaid &A wnm New DaId- 11001o2 NNoum laorm Cent
PUbahing Hka oak ODm FOr aahkTtlmn O,de8,DeFoSDo" lb VCOdltojwAva P.O. Dux 6125 Ruwi Librairi PayotBrsn Catka - me70 092 N4S012 do6 S v9o do Abonnommnt
Campoatlak=52COLOMBIA aydakn Ho"i 1Wd PAKISTAN CH 010 lAuanamInioum LiniA. Sit Main Road Omthta Miri bookAgoryAps"doAvno3427 Bgelong 8r-51100- 6 S , TANZANABogota Di. PQ On Ne 7 Oxford Unlivwty Pfom
34t12 KampdaC_a _ ahm 54 P.O. Box 5299COTE DWOItE Hyd dD0027 Maktxb RoadContr d1diddon etde ODos muIW DaroaSailm
Airin (CIC Prairn Fi& 2lad Rue ldriel D ieawd SA04 B.'. 541 NowThaoe9aug. NaWmn Apatudo3124 THAILANDAbidan 04 Piatau Alndabed -3809 UbAa I Cantal Department Store
306DSiam RoadCYPUS Patak Home P1iUINIS BanskokCyprs AColga B_Ae" A16 Adk M, Inkmilnsi oak Cnw6.DiognmSaet. iEnyi Ludmaw - 20OR Rehe Poo, RlpinaUa Bui is in TRiNIDAD & TOBACO, ANTICUAP.O. Box 206 Ay a Avmu^abbl SARBUDA, BARBADOS,Nicokl Cmii _;o Ioa mi. Mar11 DOMINICA, GRENADA, GUYANA,
680 BaJa Na p, AUAtA.Ir4SMtAT, ST.DENMARK Naru44010 iOLAND KiTS & NEVIS. ST. LUCIA,SaIhmndaU,b ORPAN ST. VINCNT & GRNADINESRearown A11 INOONESIA Pal KulbryINauN Syaerntlc Studio UnitDK.1W0edw1wburC FLt da" LimIted OHM warmu -9 Waft Sa
DOM1iNICAN iERULC PA. O.n11 iiTUCAL Tndad. Wat indinEditor. Tallor,C parA. J_muPiat L1l PerbiRembur_iun a Ib la Caln 3DaS ita DeCaro 70.7n UNITED KINGDOMA 4 e4Cdod eCwros21l Z-1 ISRAtL ltusen Miaoino LdSant Domio Y _on Utbatur Le. P.QO Box 3
P.O.a bx5M SAUDI ARABIA. QATAR AIU HampaltlrGU342PGEGYM.ARA BREPULICOF Tid Aviv 61560 Al OBokSfto EnandAlAhuam bad P.CB0x3t96Al Cwlaa Steet Riydh kl14 VENEZUELACain. ITALY LihRe del ie
Lc.aa Cotnrnladeaaile Siau SPA SNcoAPR. TAIWAN. Apfo. 60M37The Middle est Obeom Via Dcr Di Calel. 1/1 MYANMAUNCI Cauacas 1060-A41, EMU Siet CaSa PoOleES2 Information PubaCairo 50125 an Ptivaa LiL
Uidg.24 New lid il PIA
Sinyapoes 98


I


Recent World Bank Discussion Papers (continued)
No. 147 The Effects of Economic Policies on African Agriculture: From Past Harm to Future Hope. William K. Jaeger
No. 148 The Seaoral Foundations of China's Development. Shahidjaved Burki and Shahid Yusuf, editors
No. 149 The Consulting Profession in Developing Countries: A Strategyfor Development. Syed S. Kirmaniand Warren C. Baum
No. 150 Successful Rural Finance Institutions. Jacob Yaron
No. 151 Transport Development in Southern China. Clell G. Harral, editor, and Peter Cook and Edward Holland,principal contributors
No. 152 The Urban Environment and Population Relocation. Michael M. Cernea
No. 153 Funding Mechanismsfor Higher Education: Financingfor Stability, Efficiency, and Responsiveness. Douglas Albrechtand Adrian Ziderman
No. 154 Earnings, Occupational Choice, and Mobility in Segmented Labor Markets of India. Shahidur R. Khandker
No. 155 Managing E:xtemal Debt in Developing Countries: Proceedings of aJoint Seminar,Jeddah, May 1990. Thomas M.Klein, editor
No. 156 Developing Agricultural Extensionfor Women Farmers. Katrine A. Saito and Daphne Spurling
No. 157 Awakening the Market: Viet Nam's Economic Transition. D. M. Leipziger
No. 158 Wage Policy during the Transition to a Market Economy: Poland 1990-9i. Fabrizio Coricelli and Ana Revenga, editors
No. 159 International Trade and the Environment. Patrick Low, editor
No. 160 International Migration and International Trade. Sharon Stanton Russell and Michael S. Teitelbaum
No. 161 Civil Sewice Reform and the World Bank. Barbara Nunberg andJohn Nellis
No. 162 Rural Enterprise Development in China, 1986-90. AnthonyJ. Ody
No. 163 The Balance between Public and Pnrvate Sector Activities in the Delivery of Livestock Services. Dina L. Umali, GershonFeder, and Cornelis de Haan
No. 165 Fisheries Development, Fisheries Management, and Externalities. Richard S. Johnston
No. 166 The Building Blocks of Participation: Testing Bottom-up Planning. Michael M. Cernea
No. 167 Seed System Development: The Appropriate Roles of the Private and Public Sectors. Steven Jaffee andJitendra Srivastava
No. 168 Environmental Management and Urban Vulnerability. Alcira Kreimer and Mohan Munasinghe, editors
No. 169 Common Property Resources: A Missing Dimension of Development Strategies. N. S. Jodha
No. 170 A Chinese Province as a Reform Experiment: The Case of Hainan. Paul M. Cadario, Kazuko Ogawa, and Yin-KannWen
No. 171 Issuesfor Infrastructure Management in the 1990s. Arturo Israel
No. 172 Japanese National Railways Privatization Study: The Experience ofJapan and Lessonsfor Developing Countries.Koichiro Fukui
No. 173 The Livestock Sector in Eastern Europe: Constraints and Opportunities. Cornelis de Haan, Tjaart Schillhorn VanVeen, and Karen Brooks
No. 174 Assessing Development Finance Institutions: A Public Interest Analysis. Jacob Yaron
No. 175 Resource Management and Pastoral Institution Building in the West African Sahel. Nadarajah Shanmugaratnam,Trond Vedeld, Anne Mossige, and Mette Bovin
No. 176 Public and Private Sector Roles in Agricultural Research: Theory and Experience. Dina L. Umali

The World BankHeadquarters European Office Tokyo Office1818 H Street, N.W. 66, avenue d'16na Kokusai BuildingWashington, D.C. 20433, U.S.A. 75116 Pans, France 1-1 Marunouchi 3-chomne
Chiyoda-ku, Tokyo 100,JapanTelephone: (202) 477-1234 Telephone: (1) 40.69.30.00Facsimile: (202) 477-6391 Facsimile: (1) 40.69.30.66 Telephone: (3) 3214-5001Telex: wuLi 64145 WORLDBANK Telex: 640651 Facsimnle: (3) 3214-3657
RCA 248423 WORLDBK Telex: 26838Cable Address: INTBAFRAD
WASHINGTONDC
ISBN 0-8213-2221-4