Revenue Losses: Exploring Strategies Required by Managers ...
Upload
independentCategory
view
4download
0
EARTH SURFACE PROCESSES AND LANDFORMSEarth Surf. Process. Landforms 38, 1602–1611 (2013)Copyright © 2013 John Wiley & Sons, Ltd.Published online 11 July 2013 in Wiley Online Library(wileyonlinelibrary.com) DOI: 10.1002/esp.3455
Changes in ecosystem structure, function andhydrological connectivity control water, soil andcarbon losses in semi-arid grass to woodyvegetation transitionsAlan Puttock,1* Christopher J.A. Macleod,2 Roland Bol,3 Patrick Sessford,4 Jennifer Dungait5 and Richard E. Brazier11 Geography, College of Life and Environmental Sciences, University of Exeter, Exeter, UK2 The James Hutton Institute, Information and Computing Sciences Group, Craigiebuckler, Aberdeen, UK3 Institute of Bio- and Geosciences, Agrosphere (IBG-3), Forschungszentrum Jülich GmbH, Jülich, Germany4 College of Engineering, Mathematics and Physical Sciences, University of Exeter, Exeter, UK5 Rothamsted Research, Sustainable Soils and Grassland Systems, North Wyke, Okehampton, UK
Received 23 November 2012; Revised 12 April 2013; Accepted 10 June 2013
*Correspondence to: Alan Puttock, Geography, College of Life and Environmental Sciences, Amory Building, University of Exeter, Exeter, Devon,EX4 4RJ, UK. E-mail: [email protected]
ABSTRACT: Connectivity has recently emerged as a key concept for understanding hydrological response to vegetation change insemi-arid environments, providing an explanatory link between abiotic and biotic, structure and function. Reduced vegetation coverfollowing woody encroachment, generally promotes longer, more connected overland flow pathways, which has the potential toresult in an accentuated rainfall-runoff response and fluxes of both soil erosion and carbon.This paper investigates changing hydrological connectivity as an emergent property of changing ecosystem structure over two
contrasting semi-arid grass to woody vegetation transitions in New Mexico, USA. Vegetation structure is quantified to evaluate if itcan be used to explain observed variations in water, sediment and carbon fluxes. Hydrological connectivity is quantified using a flowlength metric, combining topographic and vegetation cover data.Results demonstrate that the two woody-dominated sites have significantly longer mean flowpath lengths (4 · 3m), than the
grass-dominated sites (2 · 4m). Mean flowpath lengths illustrate a significant positive relationship with the functional response. Thewoody-dominated sites lost more water, soil and carbon than their grassland counterparts. Woody sites erode more, with meanevent-based sediment yields of 1203 g, compared to 295 g from grasslands. In addition, the woody sites lost more organic carbon,with mean event yields of 39 g compared to 5 g from grassland sites.Finally, hydrological connectivity (expressed as mean flowpath length) is discussed as a meaningful measure of the interaction
between structure and function and how this manifests under the extreme rainfall that occurs in semi-arid deserts. In combinationwith rainfall characteristics, connectivity emerges as a useful tool to explain the impact of vegetation change on water, soil andcarbon losses across semi-arid environments. Copyright © 2013 John Wiley & Sons, Ltd.
KEYWORDS: hydrological connectivity; semi-arid; vegetation change; soil erosion; soil; organic carbon
Introduction
Arid and semi-arid environments (drylands) cover around 40%of the global land surface and are home to approximately 2 · 4billion people (Asner et al., 2003; Okin et al., 2009). Many ofthese areas have recently experienced extensive environmentalchange characterized by widespread vegetation change (VanAuken, 2000; Jackson et al., 2002; Krull et al., 2005). In thesemi-arid south-western USA (US-SW), land degradation overthe past 150 years has been accompanied by the encroachment
of woody species into areas previously dominated by grass-lands (Van Auken, 2000; Asner et al., 2003).
It has been observed that woody encroachment is oftenaccompanied by increased heterogeneity in vegetation cover,with a transition from relatively homogeneous grassland to avegetation patch and inter-patch structure (Schlesinger et al.,1990; Müller et al., 2007). Such transitions have both bioticand abiotic implications for ecosystem structure (Turnbullet al., 2010a). Vegetation is widely recognized as being a keycontrol on runoff generation and vulnerability to erosion
1603HYDROLOGICAL CONNECTIVITY IN SEMI-ARID VEGETATION TRANSITIONS
(Cammeraat, 2004; Boer and Puigdefábregas, 2005; Bautistaet al., 2007) and it has been argued that vegetation cover exertsa first-order control on hydrological function in the form ofrunoff and erosion (Michaelides et al., 2009). Whilst it isalso recognized that hydrological function influences andreinforces vegetation structure (Schlesinger and Jones,1984). During rainfall-runoff events, patches of vegetationcan act as surface obstructions, slowing and trapping run-off and associated resources (Wilcox et al., 2003a; Ludwiget al., 2005). The interaction between structure and func-tion has been conceptualized as a source-sink system (Reidet al., 1999; Cammeraat, 2004; Mayor et al., 2008) withbare areas between vegetation viewed as runoff-generatingsource areas, whilst vegetation patches act as sinks forboth water, sediment and nutrients (Brazier et al., 2007).Understanding the spatial heterogeneity of these sourceand sink features is recognized as being key to understand-ing changing function (Van Nieuwenhuyse et al., 2011)with one potential approach being the concept of hydro-logical connectivity.Connectivity has emerged as a key concept across the disci-
plines of ecology, hydrology and geomorphology (Kimberlyet al., 1997; Lane et al., 2004; Bracken and Croke, 2007;Turnbull et al., 2008; Okin et al., 2009) and has been appliedto develop understanding of the transfer of water and sedimentfrom one part of a landscape to another and the couplingbetween landform units (Bracken and Croke, 2007).Hydrological connectivity has been used to refer to thetransfer of water across the landscape, and the relatedphysical movement of matter (Pringle, 2003; Lexartza-Artza and Wainwright, 2009).Previous research has proposed various methods to
derive metrics of hydrological connectivity assessing theapplicability of multiple hydrological connectivity metricsto relate structure to functional connectivity, including flowlength (Van Nieuwenhuyse et al., 2011). It has been suggested thatincreased heterogeneity associated with the transition to woodyvegetation cover, results in the development of longer, moreconnected flow pathways, which are a key control on hydrologicalfunction (Wainwright et al., 2011). Metrics for vegetation structureand flow length have been applied to distinguish betweenconnected and disconnected patterns in simulated models (Westernet al., 2001) and also shown to be sensitive to the spatial configura-tion of runoff source and sink areas in semi-arid environments(Mayor et al., 2008). However, there is a continuing need for empir-ical data to explore the use of connectivity as an explanatory, classi-fication and predictive tool in the functioning of semi-aridenvironments (Pringle, 2003; Mayor et al., 2008).This study applies a mean flow path length (MFPL) metric
to sites located across two contrasting grass–woody eco-tones in the US-SW; sites were designed to allow investiga-tion into the structure–function interactions over vegetationtransitions which are occurring across large swathes of basinand range topography which characterizes the US-SW. Thisstudy addresses the following research questions:
1. Does changing vegetation structure over two semi-arid veg-etation transitions result in a significant change in the lengthof flow pathways?
2. Is there a significant difference in functional response, ascharacterized by fluxes of water, sediment and carbonover the monitored sites with their different vegetationstructure?
3. Does MFPL represent a significant explanatory variable forpatterns of functional response observed over grass–woodytransitions?
Copyright © 2013 John Wiley & Sons, Ltd.
Methods
Field site
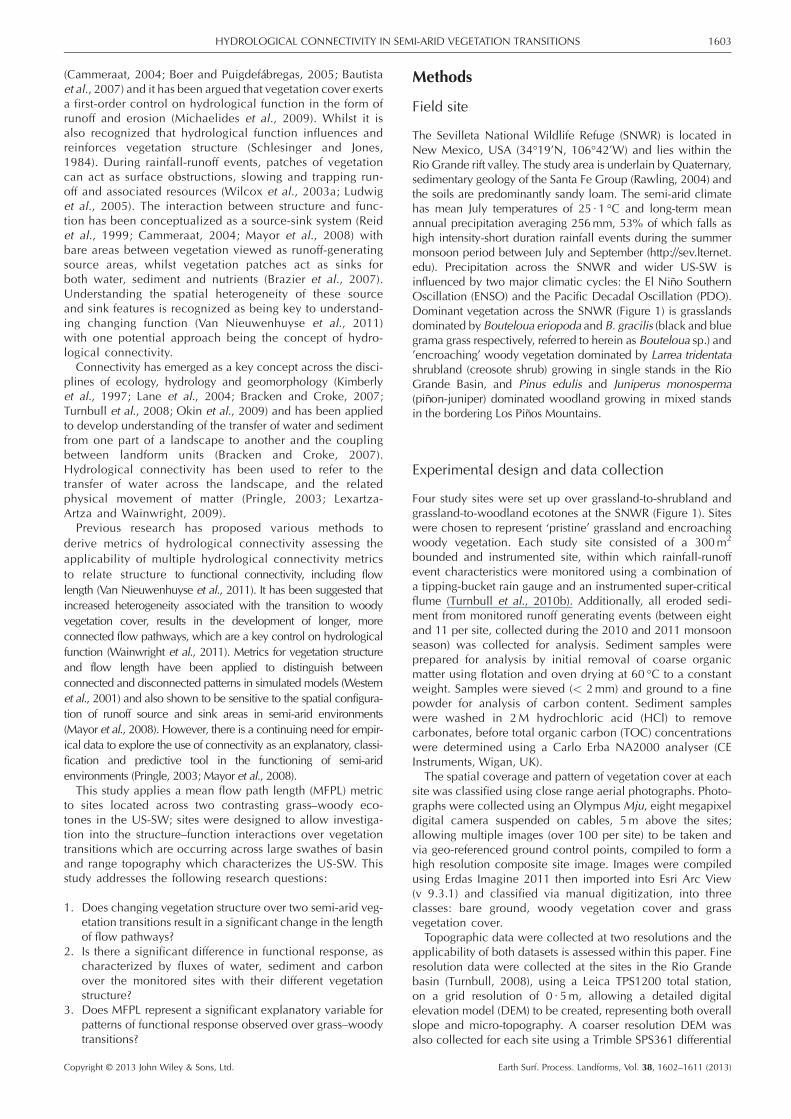
The Sevilleta National Wildlife Refuge (SNWR) is located inNew Mexico, USA (34°19’N, 106°42’W) and lies within theRio Grande rift valley. The study area is underlain by Quaternary,sedimentary geology of the Santa Fe Group (Rawling, 2004) andthe soils are predominantly sandy loam. The semi-arid climatehas mean July temperatures of 25 · 1 °C and long-term meanannual precipitation averaging 256mm, 53% of which falls ashigh intensity-short duration rainfall events during the summermonsoon period between July and September (http://sev.lternet.edu). Precipitation across the SNWR and wider US-SW isinfluenced by two major climatic cycles: the El Niño SouthernOscillation (ENSO) and the Pacific Decadal Oscillation (PDO).Dominant vegetation across the SNWR (Figure 1) is grasslandsdominated by Bouteloua eriopoda and B. gracilis (black and bluegrama grass respectively, referred to herein as Bouteloua sp.) and’encroaching’ woody vegetation dominated by Larrea tridentatashrubland (creosote shrub) growing in single stands in the RioGrande Basin, and Pinus edulis and Juniperus monosperma(piñon-juniper) dominated woodland growing in mixed standsin the bordering Los Piños Mountains.
Experimental design and data collection
Four study sites were set up over grassland-to-shrubland andgrassland-to-woodland ecotones at the SNWR (Figure 1). Siteswere chosen to represent ‘pristine’ grassland and encroachingwoody vegetation. Each study site consisted of a 300m2
bounded and instrumented site, within which rainfall-runoffevent characteristics were monitored using a combination ofa tipping-bucket rain gauge and an instrumented super-criticalflume (Turnbull et al., 2010b). Additionally, all eroded sedi-ment from monitored runoff generating events (between eightand 11 per site, collected during the 2010 and 2011 monsoonseason) was collected for analysis. Sediment samples wereprepared for analysis by initial removal of coarse organicmatter using flotation and oven drying at 60 °C to a constantweight. Samples were sieved (< 2mm) and ground to a finepowder for analysis of carbon content. Sediment sampleswere washed in 2M hydrochloric acid (HCl) to removecarbonates, before total organic carbon (TOC) concentrationswere determined using a Carlo Erba NA2000 analyser (CEInstruments, Wigan, UK).
The spatial coverage and pattern of vegetation cover at eachsite was classified using close range aerial photographs. Photo-graphs were collected using an Olympus Mju, eight megapixeldigital camera suspended on cables, 5m above the sites;allowing multiple images (over 100 per site) to be taken andvia geo-referenced ground control points, compiled to form ahigh resolution composite site image. Images were compiledusing Erdas Imagine 2011 then imported into Esri Arc View(v 9.3.1) and classified via manual digitization, into threeclasses: bare ground, woody vegetation cover and grassvegetation cover.
Topographic data were collected at two resolutions and theapplicability of both datasets is assessed within this paper. Fineresolution data were collected at the sites in the Rio Grandebasin (Turnbull, 2008), using a Leica TPS1200 total station,on a grid resolution of 0 · 5m, allowing a detailed digitalelevation model (DEM) to be created, representing both overallslope and micro-topography. A coarser resolution DEM wasalso collected for each site using a Trimble SPS361 differential
Earth Surf. Process. Landforms, Vol. 38, 1602–1611 (2013)
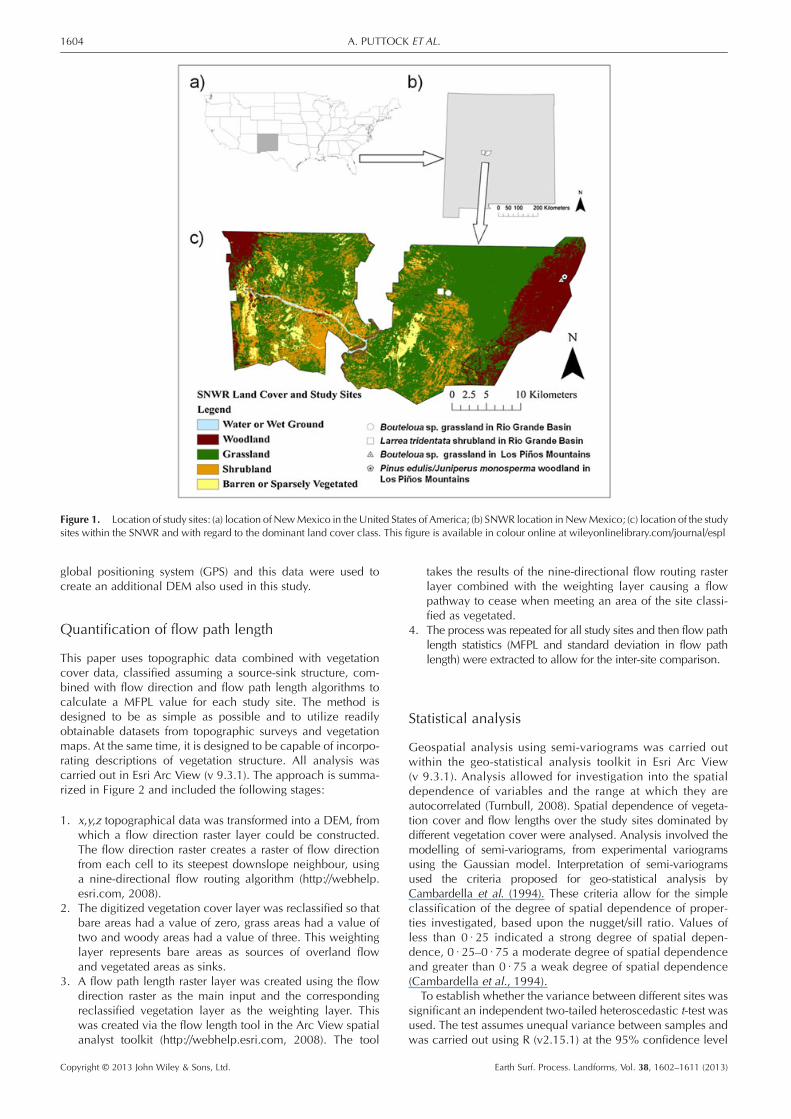
Figure 1. Location of study sites: (a) location of NewMexico in theUnited States of America; (b) SNWR location in NewMexico; (c) location of the studysites within the SNWR and with regard to the dominant land cover class. This figure is available in colour online at wileyonlinelibrary.com/journal/espl
1604 A. PUTTOCK ET AL.
global positioning system (GPS) and this data were used tocreate an additional DEM also used in this study.
Quantification of flow path length
This paper uses topographic data combined with vegetationcover data, classified assuming a source-sink structure, com-bined with flow direction and flow path length algorithms tocalculate a MFPL value for each study site. The method isdesigned to be as simple as possible and to utilize readilyobtainable datasets from topographic surveys and vegetationmaps. At the same time, it is designed to be capable of incorpo-rating descriptions of vegetation structure. All analysis wascarried out in Esri Arc View (v 9.3.1). The approach is summa-rized in Figure 2 and included the following stages:
1. x,y,z topographical data was transformed into a DEM, fromwhich a flow direction raster layer could be constructed.The flow direction raster creates a raster of flow directionfrom each cell to its steepest downslope neighbour, usinga nine-directional flow routing algorithm (http://webhelp.esri.com, 2008).
2. The digitized vegetation cover layer was reclassified so thatbare areas had a value of zero, grass areas had a value oftwo and woody areas had a value of three. This weightinglayer represents bare areas as sources of overland flowand vegetated areas as sinks.
3. A flow path length raster layer was created using the flowdirection raster as the main input and the correspondingreclassified vegetation layer as the weighting layer. Thiswas created via the flow length tool in the Arc View spatialanalyst toolkit (http://webhelp.esri.com, 2008). The tool
Copyright © 2013 John Wiley & Sons, Ltd.
takes the results of the nine-directional flow routing rasterlayer combined with the weighting layer causing a flowpathway to cease when meeting an area of the site classi-fied as vegetated.
4. The process was repeated for all study sites and then flow pathlength statistics (MFPL and standard deviation in flow pathlength) were extracted to allow for the inter-site comparison.
Statistical analysis
Geospatial analysis using semi-variograms was carried outwithin the geo-statistical analysis toolkit in Esri Arc View(v 9.3.1). Analysis allowed for investigation into the spatialdependence of variables and the range at which they areautocorrelated (Turnbull, 2008). Spatial dependence of vegeta-tion cover and flow lengths over the study sites dominated bydifferent vegetation cover were analysed. Analysis involved themodelling of semi-variograms, from experimental variogramsusing the Gaussian model. Interpretation of semi-variogramsused the criteria proposed for geo-statistical analysis byCambardella et al. (1994). These criteria allow for the simpleclassification of the degree of spatial dependence of proper-ties investigated, based upon the nugget/sill ratio. Values ofless than 0 · 25 indicated a strong degree of spatial depen-dence, 0 · 25–0 · 75 a moderate degree of spatial dependenceand greater than 0 · 75 a weak degree of spatial dependence(Cambardella et al., 1994).
To establish whether the variance between different sites wassignificant an independent two-tailed heteroscedastic t-test wasused. The test assumes unequal variance between samples andwas carried out using R (v2.15.1) at the 95% confidence level
Earth Surf. Process. Landforms, Vol. 38, 1602–1611 (2013)
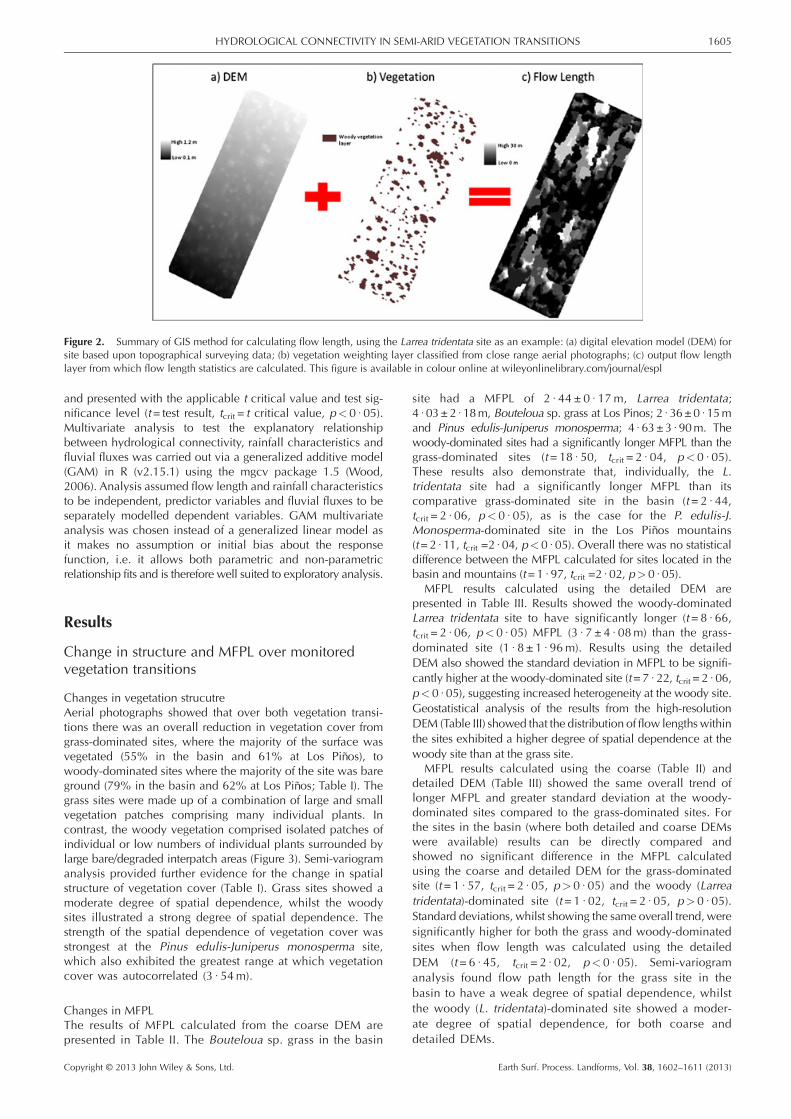
Figure 2. Summary of GIS method for calculating flow length, using the Larrea tridentata site as an example: (a) digital elevation model (DEM) forsite based upon topographical surveying data; (b) vegetation weighting layer classified from close range aerial photographs; (c) output flow lengthlayer from which flow length statistics are calculated. This figure is available in colour online at wileyonlinelibrary.com/journal/espl
1605HYDROLOGICAL CONNECTIVITY IN SEMI-ARID VEGETATION TRANSITIONS
and presented with the applicable t critical value and test sig-nificance level (t= test result, tcrit = t critical value, p< 0 · 05).Multivariate analysis to test the explanatory relationshipbetween hydrological connectivity, rainfall characteristics andfluvial fluxes was carried out via a generalized additive model(GAM) in R (v2.15.1) using the mgcv package 1.5 (Wood,2006). Analysis assumed flow length and rainfall characteristicsto be independent, predictor variables and fluvial fluxes to beseparately modelled dependent variables. GAM multivariateanalysis was chosen instead of a generalized linear model asit makes no assumption or initial bias about the responsefunction, i.e. it allows both parametric and non-parametricrelationship fits and is therefore well suited to exploratory analysis.
Results
Change in structure and MFPL over monitoredvegetation transitions
Changes in vegetation strucutreAerial photographs showed that over both vegetation transi-tions there was an overall reduction in vegetation cover fromgrass-dominated sites, where the majority of the surface wasvegetated (55% in the basin and 61% at Los Piños), towoody-dominated sites where the majority of the site was bareground (79% in the basin and 62% at Los Piños; Table I). Thegrass sites were made up of a combination of large and smallvegetation patches comprising many individual plants. Incontrast, the woody vegetation comprised isolated patches ofindividual or low numbers of individual plants surrounded bylarge bare/degraded interpatch areas (Figure 3). Semi-variogramanalysis provided further evidence for the change in spatialstructure of vegetation cover (Table I). Grass sites showed amoderate degree of spatial dependence, whilst the woodysites illustrated a strong degree of spatial dependence. Thestrength of the spatial dependence of vegetation cover wasstrongest at the Pinus edulis-Juniperus monosperma site,which also exhibited the greatest range at which vegetationcover was autocorrelated (3 · 54m).
Changes in MFPLThe results of MFPL calculated from the coarse DEM arepresented in Table II. The Bouteloua sp. grass in the basin
Copyright © 2013 John Wiley & Sons, Ltd.
site had a MFPL of 2 · 44 ± 0 · 17m, Larrea tridentata;4 · 03±2 · 18m, Bouteloua sp. grass at Los Pinos; 2 · 36±0 ·15mand Pinus edulis-Juniperus monosperma; 4 · 63±3 · 90m. Thewoody-dominated sites had a significantly longer MFPL than thegrass-dominated sites (t= 18 · 50, tcrit = 2 · 04, p<0 · 05).These results also demonstrate that, individually, the L.tridentata site had a significantly longer MFPL than itscomparative grass-dominated site in the basin (t= 2 · 44,tcrit = 2 · 06, p< 0 · 05), as is the case for the P. edulis-J.Monosperma-dominated site in the Los Piños mountains(t=2 · 11, tcrit =2 · 04, p<0 · 05). Overall there was no statisticaldifference between the MFPL calculated for sites located in thebasin and mountains (t=1 · 97, tcrit =2 · 02, p> 0 · 05).
MFPL results calculated using the detailed DEM arepresented in Table III. Results showed the woody-dominatedLarrea tridentata site to have significantly longer (t= 8 · 66,tcrit = 2 · 06, p< 0 · 05) MFPL (3 · 7 ± 4 · 08m) than the grass-dominated site (1 · 8 ± 1 · 96m). Results using the detailedDEM also showed the standard deviation in MFPL to be signifi-cantly higher at the woody-dominated site (t=7 · 22, tcrit = 2 · 06,p< 0 · 05), suggesting increased heterogeneity at the woody site.Geostatistical analysis of the results from the high-resolutionDEM (Table III) showed that the distribution of flow lengths withinthe sites exhibited a higher degree of spatial dependence at thewoody site than at the grass site.
MFPL results calculated using the coarse (Table II) anddetailed DEM (Table III) showed the same overall trend oflonger MFPL and greater standard deviation at the woody-dominated sites compared to the grass-dominated sites. Forthe sites in the basin (where both detailed and coarse DEMswere available) results can be directly compared andshowed no significant difference in the MFPL calculatedusing the coarse and detailed DEM for the grass-dominatedsite (t= 1 · 57, tcrit = 2 · 05, p> 0 · 05) and the woody (Larreatridentata)-dominated site (t= 1 · 02, tcrit = 2 · 05, p> 0 · 05).Standard deviations, whilst showing the same overall trend, weresignificantly higher for both the grass and woody-dominatedsites when flow length was calculated using the detailedDEM (t= 6 · 45, tcrit = 2 · 02, p< 0 · 05). Semi-variogramanalysis found flow path length for the grass site in thebasin to have a weak degree of spatial dependence, whilstthe woody (L. tridentata)-dominated site showed a moder-ate degree of spatial dependence, for both coarse anddetailed DEMs.
Earth Surf. Process. Landforms, Vol. 38, 1602–1611 (2013)
Table I. Results from digitized site photographs showing for each site, surface cover classes, percentage cover and results of semi-variogram analysis
Site Surface cover class Percentage cover Range (m) Nugget variancea
Bouteloua sp. grass in basin Bare 45 · 5 0 · 73 0 · 49m
Grass 54 · 5Larrea tridentata in basin Bare 79 · 4 0 · 93 0 · 23s
Woody 20 · 7Bouteloua sp. grass at Los Piños Bare 39 · 5 0 · 84 0 · 38m
Grass 60 · 5Pinus edulis-Juniperus monosperma at Los Piños Bare 62 · 1 3 · 54 0 · 15s
Grass 8 · 97Woody 28 · 9
Note: Site surface cover, classified as bare, grass (Bouteloua sp.) or woody (L. tridentata or P. edulis-J ·monosperma).aNugget variance value letters indicate degree of spatial dependence: s = strong; m=moderate; w=weak.
Figure 3. Digitized vegetation cover and pattern for monitoring sites over the Bouteloua sp. grass to Larrea tridentata and Bouteloua sp. grass toPinus edulis-Juniperus monosperma vegetation transitions. In online colour version: yellow polygons =bare ground, green polygons = grass, brownpolygons =woody. This figure is available in colour online at wileyonlinelibrary.com/journal/espl
Table II. MFPL and geospatial statistics for each site calculated using a smooth DEM and vegetation weighting layer
Site MFPL± standard deviation (m)a Range (m) Nugget varianceb
Bouteloua sp. grass in basin 2 · 44±0 · 18a 29 · 5 0 · 99w
Larrea tridentata in basin 4 · 04±2 · 18bb 4 · 93 0 · 33m
Bouteloua sp. grass at Los Piños 2 · 37±0 · 15a 28 · 81 0 · 63m
Pinus edulis-Juniperus monosperma at Los Piños 4 · 63±3 · 90b 7 · 56 0 · 15s
aMean flow path length (MFPL) values followed by the same letter are not significantly different (p>0 · 05).bNugget variance value letters indicate degree of spatial dependence: s = strong; m=moderate; w=weak.
1606 A. PUTTOCK ET AL.
Change in hydrological function over monitoredvegetation transitions
As would be expected the response to rainfall events acrossthe sites varied with rainfall characteristics. All sites showeda significant (p<0 · 05) positive relationship between totalevent rain and runoff coefficient (fraction of rainfall leaving
Copyright © 2013 John Wiley & Sons, Ltd.
the site as runoff). However, this relationship varied betweenstudy sites (Figure 4), with woody-dominated sites experiencinga greater range, higher maximums and steeper relationshipsbetween event rainfall and runoff coefficient.
Results from the monitoring of rainfall-runoff events aresummarized in Table IV. Over both transitions, woody sitesshowed significantly greater mean rainfall-runoff coefficients
Earth Surf. Process. Landforms, Vol. 38, 1602–1611 (2013)
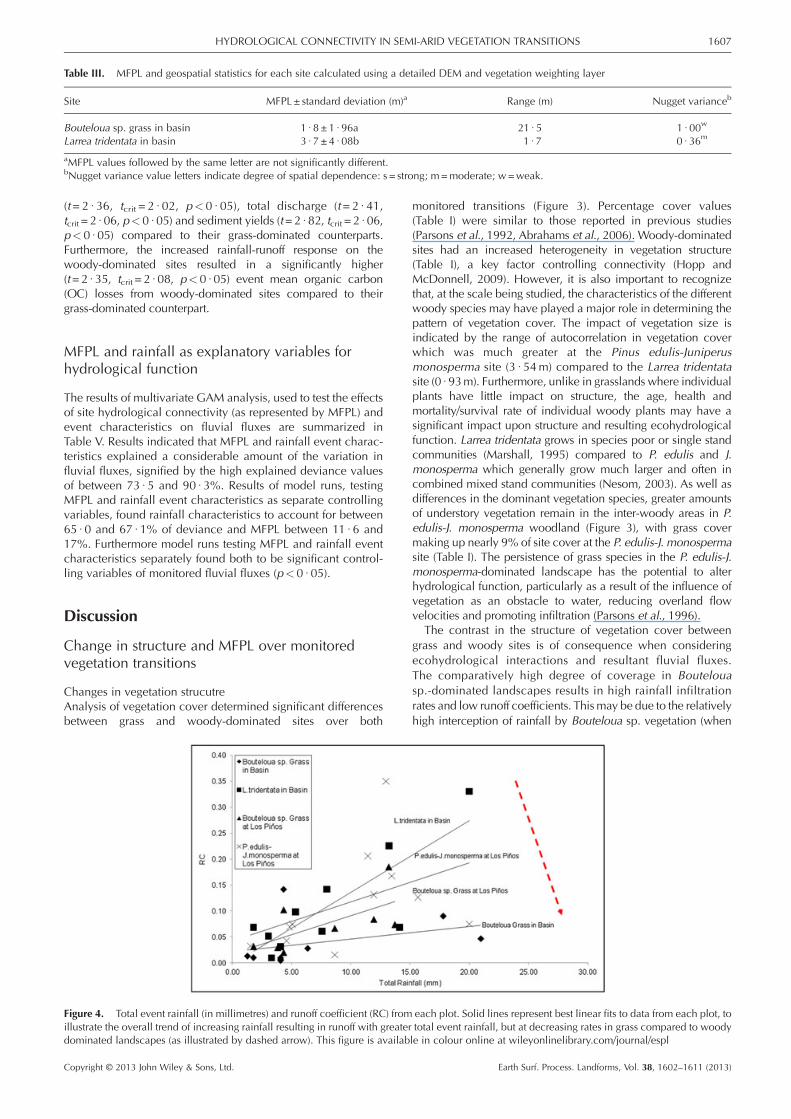
Table III. MFPL and geospatial statistics for each site calculated using a detailed DEM and vegetation weighting layer
Site MFPL± standard deviation (m)a Range (m) Nugget varianceb
Bouteloua sp. grass in basin 1 · 8 ±1 · 96a 21 · 5 1 · 00w
Larrea tridentata in basin 3 · 7 ±4 · 08b 1 · 7 0 · 36m
aMFPL values followed by the same letter are not significantly different.bNugget variance value letters indicate degree of spatial dependence: s = strong; m=moderate; w=weak.
1607HYDROLOGICAL CONNECTIVITY IN SEMI-ARID VEGETATION TRANSITIONS
(t= 2 · 36, tcrit = 2 · 02, p< 0 · 05), total discharge (t= 2 · 41,tcrit = 2 · 06, p< 0 · 05) and sediment yields (t=2 · 82, tcrit = 2 · 06,p< 0 · 05) compared to their grass-dominated counterparts.Furthermore, the increased rainfall-runoff response on thewoody-dominated sites resulted in a significantly higher(t=2 · 35, tcrit = 2 · 08, p<0 · 05) event mean organic carbon(OC) losses from woody-dominated sites compared to theirgrass-dominated counterpart.
MFPL and rainfall as explanatory variables forhydrological function
The results of multivariate GAM analysis, used to test the effectsof site hydrological connectivity (as represented by MFPL) andevent characteristics on fluvial fluxes are summarized inTable V. Results indicated that MFPL and rainfall event charac-teristics explained a considerable amount of the variation influvial fluxes, signified by the high explained deviance valuesof between 73 · 5 and 90 · 3%. Results of model runs, testingMFPL and rainfall event characteristics as separate controllingvariables, found rainfall characteristics to account for between65 · 0 and 67 · 1% of deviance and MFPL between 11 · 6 and17%. Furthermore model runs testing MFPL and rainfall eventcharacteristics separately found both to be significant control-ling variables of monitored fluvial fluxes (p< 0 · 05).
Discussion
Change in structure and MFPL over monitoredvegetation transitions
Changes in vegetation strucutreAnalysis of vegetation cover determined significant differencesbetween grass and woody-dominated sites over both
Figure 4. Total event rainfall (in millimetres) and runoff coefficient (RC) fromillustrate the overall trend of increasing rainfall resulting in runoff with greaterdominated landscapes (as illustrated by dashed arrow). This figure is availab
Copyright © 2013 John Wiley & Sons, Ltd.
monitored transitions (Figure 3). Percentage cover values(Table I) were similar to those reported in previous studies(Parsons et al., 1992, Abrahams et al., 2006). Woody-dominatedsites had an increased heterogeneity in vegetation structure(Table I), a key factor controlling connectivity (Hopp andMcDonnell, 2009). However, it is also important to recognizethat, at the scale being studied, the characteristics of the differentwoody species may have played a major role in determining thepattern of vegetation cover. The impact of vegetation size isindicated by the range of autocorrelation in vegetation coverwhich was much greater at the Pinus edulis-Juniperusmonosperma site (3 · 54m) compared to the Larrea tridentatasite (0 · 93m). Furthermore, unlike in grasslands where individualplants have little impact on structure, the age, health andmortality/survival rate of individual woody plants may have asignificant impact upon structure and resulting ecohydrologicalfunction. Larrea tridentata grows in species poor or single standcommunities (Marshall, 1995) compared to P. edulis and J.monosperma which generally grow much larger and often incombined mixed stand communities (Nesom, 2003). As well asdifferences in the dominant vegetation species, greater amountsof understory vegetation remain in the inter-woody areas in P.edulis-J. monosperma woodland (Figure 3), with grass covermaking up nearly 9% of site cover at the P. edulis-J.monospermasite (Table I). The persistence of grass species in the P. edulis-J.monosperma-dominated landscape has the potential to alterhydrological function, particularly as a result of the influence ofvegetation as an obstacle to water, reducing overland flowvelocities and promoting infiltration (Parsons et al., 1996).
The contrast in the structure of vegetation cover betweengrass and woody sites is of consequence when consideringecohydrological interactions and resultant fluvial fluxes.The comparatively high degree of coverage in Boutelouasp.-dominated landscapes results in high rainfall infiltrationrates and low runoff coefficients. Thismay be due to the relativelyhigh interception of rainfall by Bouteloua sp. vegetation (when
each plot. Solid lines represent best linear fits to data from each plot, tototal event rainfall, but at decreasing rates in grass compared to woodyle in colour online at wileyonlinelibrary.com/journal/espl
Earth Surf. Process. Landforms, Vol. 38, 1602–1611 (2013)
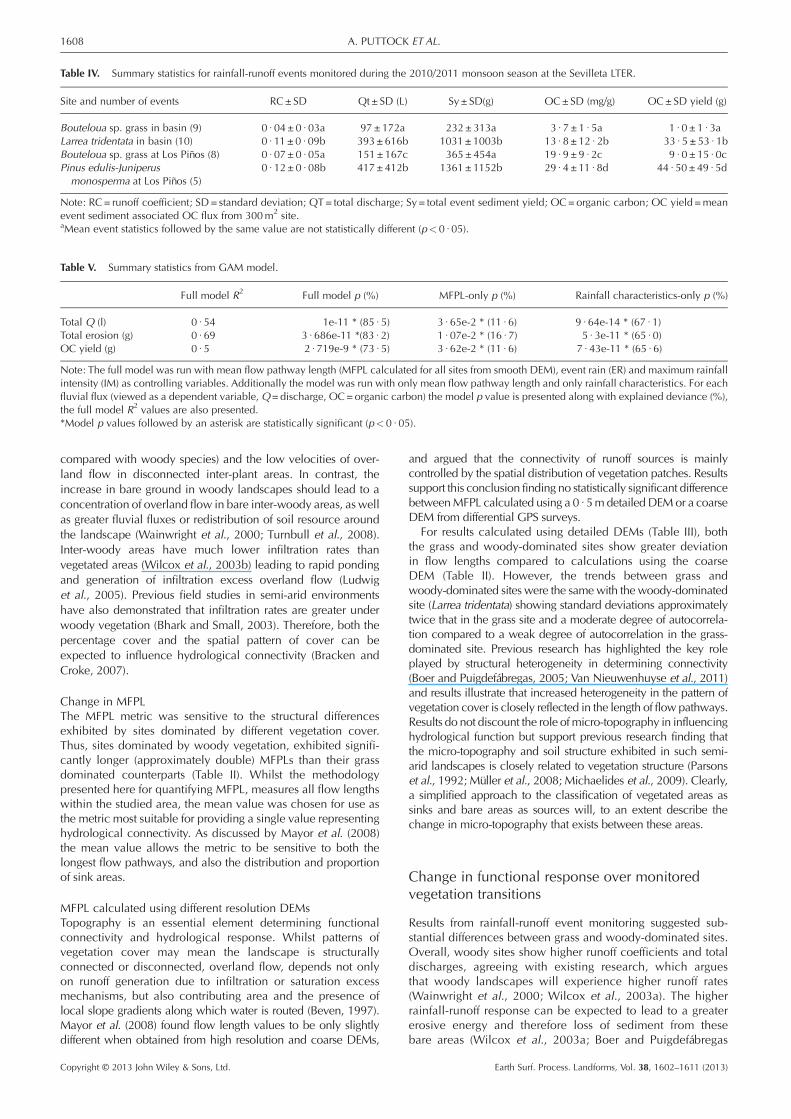
Table IV. Summary statistics for rainfall-runoff events monitored during the 2010/2011 monsoon season at the Sevilleta LTER.
Site and number of events RC±SD Qt± SD (L) Sy ± SD(g) OC±SD (mg/g) OC± SD yield (g)
Bouteloua sp. grass in basin (9) 0 · 04± 0 · 03a 97±172a 232±313a 3 · 7 ±1 · 5a 1 · 0 ± 1 · 3aLarrea tridentata in basin (10) 0 · 11±0 · 09b 393±616b 1031±1003b 13 · 8 ±12 · 2b 33 · 5 ± 53 · 1bBouteloua sp. grass at Los Piños (8) 0 · 07± 0 · 05a 151±167c 365±454a 19 · 9 ±9 · 2c 9 · 0 ± 15 · 0cPinus edulis-Juniperusmonosperma at Los Piños (5)
0 · 12± 0 · 08b 417±412b 1361±1152b 29 · 4 ±11 · 8d 44 · 50±49 · 5d
Note: RC= runoff coefficient; SD= standard deviation; QT= total discharge; Sy = total event sediment yield; OC=organic carbon; OC yield =meanevent sediment associated OC flux from 300m2 site.aMean event statistics followed by the same value are not statistically different (p<0 · 05).
Table V. Summary statistics from GAM model.
Full model R2 Full model p (%) MFPL-only p (%) Rainfall characteristics-only p (%)
Total Q (l) 0 · 54 1e-11 * (85 · 5) 3 · 65e-2 * (11 · 6) 9 · 64e-14 * (67 · 1)Total erosion (g) 0 · 69 3 · 686e-11 *(83 · 2) 1 · 07e-2 * (16 · 7) 5 · 3e-11 * (65 · 0)OC yield (g) 0 · 5 2 · 719e-9 * (73 · 5) 3 · 62e-2 * (11 · 6) 7 · 43e-11 * (65 · 6)
Note: The full model was run with mean flow pathway length (MFPL calculated for all sites from smooth DEM), event rain (ER) and maximum rainfallintensity (IM) as controlling variables. Additionally the model was run with only mean flow pathway length and only rainfall characteristics. For eachfluvial flux (viewed as a dependent variable, Q=discharge, OC=organic carbon) the model p value is presented along with explained deviance (%),the full model R2 values are also presented.*Model p values followed by an asterisk are statistically significant (p<0 · 05).
1608 A. PUTTOCK ET AL.
compared with woody species) and the low velocities of over-land flow in disconnected inter-plant areas. In contrast, theincrease in bare ground in woody landscapes should lead to aconcentration of overland flow in bare inter-woody areas, as wellas greater fluvial fluxes or redistribution of soil resource aroundthe landscape (Wainwright et al., 2000; Turnbull et al., 2008).Inter-woody areas have much lower infiltration rates thanvegetated areas (Wilcox et al., 2003b) leading to rapid pondingand generation of infiltration excess overland flow (Ludwiget al., 2005). Previous field studies in semi-arid environmentshave also demonstrated that infiltration rates are greater underwoody vegetation (Bhark and Small, 2003). Therefore, both thepercentage cover and the spatial pattern of cover can beexpected to influence hydrological connectivity (Bracken andCroke, 2007).
Change in MFPLThe MFPL metric was sensitive to the structural differencesexhibited by sites dominated by different vegetation cover.Thus, sites dominated by woody vegetation, exhibited signifi-cantly longer (approximately double) MFPLs than their grassdominated counterparts (Table II). Whilst the methodologypresented here for quantifying MFPL, measures all flow lengthswithin the studied area, the mean value was chosen for use asthe metric most suitable for providing a single value representinghydrological connectivity. As discussed by Mayor et al. (2008)the mean value allows the metric to be sensitive to both thelongest flow pathways, and also the distribution and proportionof sink areas.
MFPL calculated using different resolution DEMsTopography is an essential element determining functionalconnectivity and hydrological response. Whilst patterns ofvegetation cover may mean the landscape is structurallyconnected or disconnected, overland flow, depends not onlyon runoff generation due to infiltration or saturation excessmechanisms, but also contributing area and the presence oflocal slope gradients along which water is routed (Beven, 1997).Mayor et al. (2008) found flow length values to be only slightlydifferent when obtained from high resolution and coarse DEMs,
Copyright © 2013 John Wiley & Sons, Ltd.
and argued that the connectivity of runoff sources is mainlycontrolled by the spatial distribution of vegetation patches. Resultssupport this conclusion finding no statistically significant differencebetweenMFPL calculated using a 0 ·5m detailedDEMor a coarseDEM from differential GPS surveys.
For results calculated using detailed DEMs (Table III), boththe grass and woody-dominated sites show greater deviationin flow lengths compared to calculations using the coarseDEM (Table II). However, the trends between grass andwoody-dominated sites were the samewith the woody-dominatedsite (Larrea tridentata) showing standard deviations approximatelytwice that in the grass site and a moderate degree of autocorrela-tion compared to a weak degree of autocorrelation in the grass-dominated site. Previous research has highlighted the key roleplayed by structural heterogeneity in determining connectivity(Boer and Puigdefábregas, 2005; Van Nieuwenhuyse et al., 2011)and results illustrate that increased heterogeneity in the pattern ofvegetation cover is closely reflected in the length of flow pathways.Results do not discount the role ofmicro-topography in influencinghydrological function but support previous research finding thatthe micro-topography and soil structure exhibited in such semi-arid landscapes is closely related to vegetation structure (Parsonset al., 1992; Müller et al., 2008; Michaelides et al., 2009). Clearly,a simplified approach to the classification of vegetated areas assinks and bare areas as sources will, to an extent describe thechange in micro-topography that exists between these areas.
Change in functional response over monitoredvegetation transitions
Results from rainfall-runoff event monitoring suggested sub-stantial differences between grass and woody-dominated sites.Overall, woody sites show higher runoff coefficients and totaldischarges, agreeing with existing research, which arguesthat woody landscapes will experience higher runoff rates(Wainwright et al., 2000; Wilcox et al., 2003a). The higherrainfall-runoff response can be expected to lead to a greatererosive energy and therefore loss of sediment from thesebare areas (Wilcox et al., 2003a; Boer and Puigdefábregas
Earth Surf. Process. Landforms, Vol. 38, 1602–1611 (2013)
1609HYDROLOGICAL CONNECTIVITY IN SEMI-ARID VEGETATION TRANSITIONS
2005; Neave and Rayburg 2006). Results (Table IV) showedwoody sites to have, on average, higher sediment yieldsthan their grassland counterparts, with the woody sites inthe basin and at Los Piños, having mean event yields over1 kg compared to mean yields under 400g for the grass sites.There were significant (p< 0 · 05) differences between event
OC yields from the woody-dominated sites; which supports theneed for a degree of site specific understanding and an appreci-ation of the different vegetation, soil and topographic charac-teristics, when developing an understanding of vegetationtransitions and associated ecohydrological interactions. How-ever, for the majority of the variables examined, there was nosignificant difference between the two woody end-membersites monitored. Runoff coefficients, total discharges, sedimentand OC showed no significant difference (p> 0 · 05) betweenthe woody-dominated sites located in the Basin and at LosPiños, whilst additionally, showing the same overall trendsrelative to their grassland counterparts (Puttock et al., 2012).Results support previous studies, showing that relative to grass-lands, woody-dominated landscapes experience; higher runoffcoefficients (Parsons et al., 1996) and correspondingly greaterlevels of erosion (Abrahams et al., 1995; Turnbull et al., 2010c)resulting in higher losses of sediment and associated OC(Brazier et al., 2013).Results from rainfall-runoff event monitoring, support the
theory that vegetation structure exerts a control on hydrologicalfunction (Chartier et al., 2011). This research also builds onprevious studies into ecohydrological interactions over semi-aridgrass to shrub transitions in the US-SW (Parsons et al., 1996;Turnbull et al., 2010b) whilst expanding understanding toencompass the grass to piñon-juniper woody ecotone. Bothgrass-to-woody transitions exhibit the same overall functionalresponse of water, sediment and OC fluxes. Such a finding isimportant; indicating that changes in structure associated withsuch semi-arid vegetation transitions (Boutton et al., 1999; Baiet al., 2009) do result in a discernible change in function. Whilstnot negating the need for site-specific understanding, resultssupport the use of common conceptual and practical approachesacross grass–woody vegetation transitions encompassing differentwoody vegetation types as shown here, including shrubsand tree species.
MFPL and rainfall as explanatory variables forfluvial fluxes
Suitability of MFPL metricPrevious work has identified a role for connectivity metrics inthe ‘quest for a more predictive understanding of hydrologicalconnectivity’ (Pringle, 2003; Bracken and Croke, 2007), whilstit has also been argued that connectivity measurements may bea key step in parameterizing successful models of overlandflow in semi-arid areas (Müller et al., 2007). Results of thisinvestigation suggest that hydrological connectivity provides auseful method by which to classify and evaluate landscapes(Van Niewenhuyse et al., 2011; Borselli et al., 2008).Total discharge and total erosion showed significant (p< 0 · 05)
positive relationships with MFPL, suggesting, for the events moni-tored (N=38), MFPL was a strong variable to explain response.Results supported previous studies which found positive relation-ships between vegetation structure, flow length metrics and runoffand sediment yields (Mayor et al., 2008; Boer and Puigdefábregas,2005; Bautista et al., 2007). Furthermore, findings establishedsignificant (p< 0 ·05) positive relationships between the MFPL ofsites and erodedOC. Thus, it is argued that in semi-arid landscapesundergoing grass to woody vegetation changes (or vice versa),
Copyright © 2013 John Wiley & Sons, Ltd.
changing functional connectivity will be a significant emergentproperty. Furthermore, it is clear that there is potential for a greaterfluvial loss of carbon from woody-dominated landscapes as aresult of longer, more concentrated overland flow pathways(Parsons et al., 1996; Reid et al., 1999) that have a higher erosivepotential, thus, entraining more SOC (Brazier et al., 2013) andpotentially leading to land degradation (Okin et al., 2009).
Importance of rainfall characteristicsWhilst results presented in this paper demonstrate that MFPLmay be an important explanatory variable for the monitoredfluvial fluxes; it is also important to discuss the role played byrainfall event characteristics (Cammeraat, 2004). In previousresearch, Van Nieuwenhuyse et al. (2011) found none of the23 connectivity metrics assessed could completely explain thevariance exhibited in the hydrological response of modelledlandscapes. Results presented suggest this may be a result ofconsiderable variability in rainfall characteristics. Across all themonitored sites, a positive relationship was found between therainfall event and the runoff coefficient (Figure 4). The signifi-cance and strength of these positive relationships varies but theirpresence suggests that they cannot be discounted from analysisof hydrological response. Moreover, rainfall characteristics wereshown to be a statistically significant variable (Table V),explaining a high level of the deviance in observed trendsof discharge, sediment yield and OC yields. Whilst thestructural differences between vegetation types, results in asignificant change (p< 0 · 05) in hydrological connectivityand therefore a key control on function, abiotic dynamics(in this case rainfall) also act as fundamental controls onhydrological response (Wainwright et al., 2011).
Simplifying assumptions of the MFPL metricand issues of scaleResults presented herein (Table V) showed that a combinationof MFPL and rainfall characteristics successfully explained themajority of deviance in fluvial fluxes for sites at the scale ofthe study sites (300m2). Together, the ability of these variablesto explain observed deviance in fluvial fluxes supports previousconceptual approaches addressing the interaction of abioticand biotic components to determine hydrological function(Turnbull et al., 2008). However, studies have shown themonitored hydrological response of catchments to be highlyscale dependent, both spatially (Wilcox et al., 2003a) andtemporally (Wainwright and Parsons, 2002) whilst, highlightingthe problems associated with upscaling results (Brazier et al.,2007). The methodology for calculating MFPL is reliant onlyon topographic and vegetation cover datasets, which areavailable at a wide range of spatial scales. Therefore, it couldhave the potential to be applied as part of a nested spatialsampling approach, which has been suggested as a solutionfor developing understanding of connectivity across multiplespatial scales (Wainwright et al., 2011). In areas undergoingvegetation transitions, where temporal datasets exist formapping vegetation cover change (Goslee et al., 2003; Baiet al., 2009; Bai et al., 2012) this method also provides a meansby which to investigate changing functional response over timeas well as space. If MFPL or a similar metric were to be used ina temporal framework it is also important to acknowledge themultidirectional feedbacks between structure and functionalconnectivity (Turnbull et al., 2008). Therefore, unlike the static‘snapshots’ of vegetation and topographic data used in thispaper, an evolving structural dataset would be required todescribe change in flow path length as a function of vegetationchange over decadal to centennial timescales.
The classification of semi-arid environments as source-sinksystems in this study is a key simplifying assumption. It is
Earth Surf. Process. Landforms, Vol. 38, 1602–1611 (2013)
1610 A. PUTTOCK ET AL.
recognized that the hydrologic performance of a catchment isnot temporally static, (Grayson et al., 1997). Therefore runoffgenerating areas and sink areas are similarly not static, butdiffer with variables such as antecedent soil moisture, as thewetter the soil prior to rainfall, the more likely it is that overlandflow due to saturation excess processes will result (Turnbullet al., 2010b). In addition, temporal rainfall event characteris-tics, will also exert an influence on the connectivity of runoffgenerating areas and the resulting length of overland flowpathways; generally speaking, the higher the rainfall intensity,the more likely it is infiltration excess overland flow will occur(Wainwright et al., 2011). Moreover, the potential for vegeta-tion to trap water, sediment and nutrients will vary within andbetween vegetation species, as will the infiltration capacity ofsoils beneath vegetation, which will also vary with soil charac-teristics and topography (Ludwig et al., 2005). However, it isargued that previous research provides substantial support forthis source-sink approach and that results presented hereprovide a strong argument for its use as a classification andexplanatory metric for developing understanding of the rela-tionship between structure and hydrological function.
Conclusion
Across the two semi-arid vegetation transitions monitored, achange in vegetation structure resulted in a significant changein hydrological connectivity as illustrated by the length of over-land flow pathways.Woody-dominated sites showed considerablylonger MFPL than their grassland counterparts. Furthermore, MFPLcalculated using coarse and detailed DEMs produced comparableresults, indicating that changing vegetation coverage and pattern isstrongly representative of the structural change associated withgrass–woody transitions. As such, it is argued that changing hydro-logical connectivity should be viewed as an emergent property ofthe transition from grass-dominated to woody-dominated, semi-arid landscapes.Concurrent with the observed change in structure and connec-
tivity, a major change in hydrological function was observed.Rainfall-runoff event monitoring showed two distinct types ofwoody site to exhibit significantly greater runoff coefficients, totaldischarge, sediment yields and OC yields, than grassland coun-terparts. Using MFPL as a metric, hydrological connectivity andrainfall event characteristicswere shown to be powerful variablesfor explaining the deviance in functional response observed.Whilst further work is required to assess how flow length
varies across spatial scales and evolves across temporal scales,it is argued that flow path length provides a valuable tool bywhich to classify hydrological connectivity and to quantifythe relationship between structure and function in semi-aridenvironments undergoing vegetation change.
Acknowledgements—This research was supported by the University ofExeter and Rothamsted Research at North Wyke, NSF award DEB-0217774 to the University of New Mexico for Long-term EcologicalResearch and a British Society for Geomorphology student travel grant.This work represents part of the BBSRC-funded programmes atRothamsted Research on Sustainable Soil Function and Bioenergy andClimate Change. Additional thanks go to everyone from the SevilletaLTER who made fieldwork both possible and highly enjoyable andthe Sevilleta USFWS for kindly allowing access to field sites in theSNWR. Finally, thanks go to the anonymous reviewers who providedvaluable feedback which improved this paper.
ReferencesAbrahams AD, Neave M, Schlesinger W, Wainwright J, Howes D,Parsons A. 2006 Biogeochemical fluxes. In Structure and Function
Copyright © 2013 John Wiley & Sons, Ltd.
of a Chihuahuan Desert Ecosystem: The Jornada Basin Long-termEcological Research Site, K. Havstad K, Huenneke L, Schlesinger W(eds). Oxford University Press: London; 92–107.
Abrahams AD, Parsons A,Wainwright J. 1995. Effects of vegetation changeon interrill runoff and erosion, Walnut-Gulch, southern Arizona.Geomorphology 13: 37–48. DOI. 10.1016/0169-555X(95)00027-3
Asner GP, Archer S, Hughes RF, Ansley RJ, Wessman CA. 2003. Netchanges in regional woody vegetation cover and carbon storage inTexas Drylands 1937–1999. Global Change Biology 9: 316–335.DOI. 10.1046/j.1365-2486.2003.00594.x
Bai E, Boutton TW, Ben Wu X, Liu F, Archer SR. 2009. Landscape-scalevegetation dynamics inferred from spatial patterns of soil delta C-13in a subtropical savanna parkland. Journal of Geophysical Research– Biogeosciences 114: 10. DOI. 10.1029/2008JG000839
Bai E, Boutton TW, Liu F, Ben Wu X, Archer SR. 2012. Spatial patternsof soil d13C reveal grassland-to-woodland successional processes.Organic Geochemistry 42: 1512–1518. DOI. 10.1016/j.orggeochem
Bautista S, Mayor Á, Bourakhouadar J, Bellot J. 2007. Plant spatial patternpredicts hillslope runoff and erosion in a semiarid mediterranean land-scape. Ecosystems 10: 987–998. DOI. 10.1007/s10021-007-9074-3
Beven K. 1997. TOPMODEL: a critique. Hydrological Processes11: 1069–1085. DOI. 10.1007/s10021-007-9074-3
Bhark EW, Small EE. 2003. Association between plant canopies andthe spatial patterns of infiltration in shrubland and grassland ofthe Chihuahuan Desert, New Mexico. Ecosystems 6: 0185–0196.DOI. 10.1007/s10021-002-0210-9
Boer M, Puigdefábregas J. 2005. Effects of spatially structured vegeta-tion patterns on hillslope erosion in a semiarid Mediterranean envi-ronment: a simulation study. Earth Surface Processes and Landforms30: 149–167. DOI. 10.1002/esp.1180
Borselli L, Cassi P, Torri D. 2008. Prolegomena to sediment and flowconnectivity in the landscape: a GIS and field numerical assessment.Catena 75: 268–277. DOI. 10.1016/j.catena.2008.07.006
Boutton TW, Archer SR, Midwood AJ. 1999. Stable isotopes in ecosystemscience: structure, function and dynamics of a subtropical Savanna.Rapid Communications in Mass Spectrometry 13: 1263–1277.DOI. 1152-62 20462129
Bracken LJ, Croke J. 2007. The concept of hydrological connectivity andits contribution to understanding runoff-dominated geomorphic sys-tems.Hydrological Processes 21: 1749–1763. DOI. 10.1002/hyp.6313
Brazier RE, Parsons AJ, Wainwright J, Powell MD, Schlesinger WH.2007. Upscaling understanding of nitrogen dynamics associatedwith overland flow in a semi-arid environment. Biogeochemistry82: 265–278. DOI. 10.1007/s10533-007-9070-x
Brazier RE, Turnbull L, Bol R, Wainright J. 2013. Carbon loss by watererosion in drylands: implications from a study of vegetation change inthe southwestUSA.Hydrological Processes 1–11.DOI. 10.1002/hyp.9741
Cambardella CA, Moorman TB, Parkin TB, Karlen DL, Novak JM, TurcoRF, Konopka AE. 1994. Field-scale variability of soil properties incentral Iowa soils. Soil Science Society of America Journal 58:1501–1511. DOI. 10.1007-12665-011-1053-5
Cammeraat ELH. 2004. Scale dependent thresholds in hydrologicaland erosion response of a semi-arid catchment in southeastSpain. Agriculture, Ecosystems & Environment 104: 317–332.DOI. 10.1016/j.agee.2004.01.032
Chartier MP, Rostagno CM, Pazos GE. 2011. Effects of soil degradationon infiltration rates in grazed semiarid rangelands of northeasternPatagonia, Argentina. Journal of Arid Environments 75: 656–661.DOI. 10.1016/j.jaridenv.2011.02.007
Goslee SC, Havstad KM, Peters DPC, Rango A, Schlesinger WH. 2003.High-resolution images reveal rate and pattern of shrub encroachmentover six decades in New Mexico, USA. Journal of Arid Environments54: 755–767. DOI. 10.1006/jare.2002.1103
Grayson RBA, Western W, Chiew FHS, Blöschl G. 1997. Preferred statesin spatial soil moisture patterns: local and nonlocal controls. WaterResources Research 33: 2897–2908. DOI. 10.1029/97WR02174
Hopp L, McDonnell JJ. 2009. Connectivity at the hillslope scale:identifying interactions between storm size, bedrock permeability,slope angle and soil depth. Journal of Hydrology 376: 378–391.DOI. 10.1016/j.jhydrol.2009.07.047
Jackson RB, Banner JL, Jobbagy EG, Pockman WT, Wall DH. 2002.Ecosystem carbon loss with woody plant invasion of grasslands.Nature 418: 623–626. DOI. 10.1038/nature00910
Earth Surf. Process. Landforms, Vol. 38, 1602–1611 (2013)
1611HYDROLOGICAL CONNECTIVITY IN SEMI-ARID VEGETATION TRANSITIONS
Kimberly AR, Gardner H, Turner MG. 1997. Landscape connectivityand population distributions in heterogeneous environments. Oikos78: 151–169.
Krull ES, Skjemstad JO, Burrows WH, Bray SG, Wyn JG, Bol R,Spouncer L, Harms B. 2005. Recent vegetation changes in centralQueensland, Australia: evidence from d13C and 14C analyses ofsoil organic matter. Geoderma 126: 241–259. DOI. 10.1016/j.geoderma.2004.09.012
Lane SNC, Brookes J, Kirkby MJ, Holden J. 2004. A network-index-basedversion of TOPMODEL for use with high-resolution digital topographicdata. Hydrological Processes 18: 191–201. DOI. 10.1002/hyp.5208
Lexartza-Artza I, Wainwright J. 2009. Hydrological connectivity:linking concepts with practical implications. Catena 79: 146–152.DOI. 10.1016/j.catena.2009.07.001
Ludwig JA, Bradford P, Breshears DD, Tongway DJ. 2005. Vegetationpatches and runoff-erosion as interacting ecohydrological processesin semiarid landscapes. Ecology 86: 288–297. DOI. 10.1890/03-0569
Marshall AK. 1995. Larrea tridentata. In Fire Effects Information System.US Department of Agriculture, Forest Service, Rocky MountainResearch Station, Fire Sciences Laboratory: Missoula, MT.
Mayor ÁG, Bautista S, Small EE, Dixon M, Bellot J. 2008. Measurementof the connectivity of runoff source areas as determined by vegeta-tion pattern and topography: a tool for assessing potentialwater and soil losses in drylands. Water Resources Research44: 1–13. DOI. 10.1029/2007WR006367
Michaelides K, Lister D, Wainwright J, Parsons AJ. 2009. Vegeta-tion controls on small-scale runoff and erosion dynamics in adegrading dryland environment. Hydrological Processes 23:1617–1630. DOI. 10.1002/hyp.7293
Müller EN, Wainwright J, Parsons AJ. 2007. Impact of connectivity onthe modeling of overland flow within semiarid shrubland environ-ments. Water Resources Research 43: W09412. DOI. 10.1029/2006WR005006
Müller EN, Wainwright J, Parsons AJ. 2008. Spatial variability of soil andnutrient characteristics of semi-arid grasslands and shrublands, JornadaBasin, New Mexico. Ecohydrology 1: 3–12. DOI. 10.1002/eco.1
Neave M, Rayburg S. 2006. Nonlinear biofluvial responses to vege-tation change in a semiarid environment. Geomorphology 89:217–239. DOI. 10.1016/j.geomorph.2006.07.018
Nesom G. 2003. Pinus edulis Plant Guide. http://plants.usda.gov/plantguide/pdf/cs_pied.pdf, [21 November 2012].
Okin GS, Parsons AJ, Wainwright J, Herrick JE, Bestelmeyer T,Peters DC, Fredrickson EL. 2009. Do changes in connectivityexplain desertification? Bioscience 59: 237–244. DOI. 10.1525/bio.2009.59.3.8
Parsons AJ, Abrahams AD, Simanton JR. 1992. Microtopography andsoil-surface materials on semiarid piedmont hillslopes, southernArizona. Journal of Arid Environments 22: 107–115.
Parsons AJ, Abrahams AD, Wainwright J. 1996. Responses of interrillrunoff and erosion rates to vegetation change in southern Arizona.Geomorphology 14: 311–317. DOI. 10.1016/0169-555X(95)00044-6
Pringle C. 2003. The need for a more predictive understanding ofhydrologic connectivity. Aquatic Conservation: Marine andFreshwater Ecosystems 13: 467–471. DOI. 10.1002/aqc.603
Puttock A, Dungait JAJ, Bol R, Dixon ER, Macleod CJA, Brazier RE.2012. Stable carbon isotope analysis of fluvial sediment fluxesover two contrasting C4-C3 semi-arid vegetation transitions.Rapid Communications in Mass Spectrometry 26: 2386–2392.DOI. 10.1002/rcm.6257
Copyright © 2013 John Wiley & Sons, Ltd.
Rawling GC. 2004. Geology and Hydrologic Setting of Springs andSeeps on the Sevilleta National Wildlife Refuge. New Mexico Tech:Socorro, NM.
Reid KD, Wilcox BP, Breshears DD, MacDonald L. 1999. Runoff anderosion in a pinon-juniper woodland: influence of vegetationpatches. Soil Science Society of America 63: 1869–1879.
SchlesingerWH, Jones CS. 1984. The comparative importance of overlandrunoff and mean annual rainfall to shrub communities of the MojaveDesert. Botanical Gazette 145: 116–124. DOI. 10.2307/2474522
Schlesinger WH, Reynolds JF, Cunningham GL, Huenneke LF, Jarrell WM,Virginia RA, Whitford WG. 1990. Biological feedbacks in global deserti-fication. Science 247: 1043. DOI. 10.1126/science.247.4946.1043
Turnbull L. 2008. Ecohydrological Interactions across a Semi-aridGrassland to Shrubland Transition. University of Sheffield: Sheffield.
Turnbull L, Wainwright J, Brazier RE. 2008. A conceptual frameworkfor understanding semi-arid land degradation: ecohydrologicalinteractions across multiple-space and time scales. Ecohydrology1: 23–34. DOI. 10.1002/eco.4
Turnbull L, Wainwright J, Brazier RE. 2010a. Biotic and abioticchanges in ecosystem structure over a shrub-encroachment gra-dient in the southwestern USA. Ecosystems 13: 1239–1255.DOI. 10.1007/s10021-010-9384-8
Turnbull L, Wainwright J, Brazier RE. 2010b. Changes in hydrology anderosion over a transition from grassland to shrubland. HydrologicalProcesses 24: 393–414. DOI. 10.1002/hyp.7491
Turnbull L, Wainwright J, Brazier RE. 2010c. Hydrology, erosionand nutrient transfers over a semi-arid transition from grasslandto shrubland: a modelling assessment. Journal of Hydrology 388:258–272. DOI. 10.1016/j.jhydrol.2010.05.005
Van Auken OW. 2000. Shrub invasions of North American grasslands.Annual Review of Ecological Systems 31: 197–215. DOI. 10.1146/annurev.ecolsys.31.1.197
Van Nieuwenhuyse BHJ, Antoine M, Wyseure G, Govers G. 2011.Pattern-process relationships in surface hydrology: hydrologicalconnectivity expressed in landscape metrics. Hydrological Processes24: 3760–3773. DOI. 10.1002/hyp.8101
Wainwright J, Parsons AJ. 2002. The effect of temporal variations inrainfall on scale dependency in runoff coefficients. Water ResourcesResearch 38: 1271. DOI. DOI.10.1029/2000WR000188
Wainwright J, Parsons AJ, Abrahams AD. 2000. Plot-scale studies ofvegetation, overland flow and erosion interactions: case studies fromArizona and New Mexico. Hydrological Processes 14: 2921–2943.DOI. 10.1002/1099-1085(200011/12)14:16
Wainwright J, Turnbull L, Ibrahim TG, Lexartza-Artza L, Thornton SF,Brazier RE. 2011. Linking environmental regimes, space and time:interpretations of structural and functional connectivity. Geomor-phology 126: 387–404. DOI. 10.1016/j.geomorph.2010.07.027
Western AW, Blöschl G, Grayson RB. 2001. Towards capturing hydro-logically significant connectivity in spatial patterns. Water ResourcesResearch 37: 83–97. DOI. 10.1029/2000WR900241
Wilcox BP, Breshears DD, Allen CD. 2003a. Ecohydrology of aresource-conserving semiarid woodland: effects of scaling anddisturbance. Ecological Monographs 73: 223–239. DOI. 10.1890/0012-9615(2003)073[0223:EOARSW]2.0.CO;2
Wilcox BP, Breshears DD, Turin HJ. 2003b. Hydraulic conductivity in aPinon-Juniper woodland: influence of vegetation. Soil ScienceSociety of America 67: 1243–1249. DOI. 10.2136/sssaj2003.1243
Wood SN. 2006. Generalized Additive Models: An Introduction. Taylor& Francis: Oxford.
Earth Surf. Process. Landforms, Vol. 38, 1602–1611 (2013)
Copyright © 2022 FDOKUMEN