Changes in CSF cholinergic biomarkers in response to cell therapy with NGF in patients with...
13
Changes in CSF cholinergic biomarkers in response to cell therapy with NGF in patients with Alzheimer’s disease Azadeh Karami a,b,1 , Helga Eyjolfsdottir a,b,1 , Swetha Vijayaraghavan a ,G€ oran Lind c,d , Per Almqvist c,d , Ahmadul Kadir a , Bengt Linderoth c,d , Niels Andreasen a,b , Kaj Blennow e , Anders Wall f , Eric Westman a,b , Daniel Ferreira a , Maria Kristoffersen Wiberg g,h , Lars-Olof Wahlund a,b , Ake Seiger i , Agneta Nordberg a,b , Lars Wahlberg j , Taher Darreh-Shori a,b, * ,1 , Maria Eriksdotter a,b, * ,1 a Department of Neurobiology, Care Sciences and Society, Karolinska Institutet, Stockholm, Sweden b Department of Geriatrics, Karolinska University Hospital, Stockholm, Sweden c Department of Clinical Neuroscience, Karolinska Institutet, Stockholm, Sweden d Department of Neurosurgery, Karolinska University Hospital, Stockholm, Sweden e Department of Clinical Neuroscience, Clinical Neurochemistry Laboratory, University of G€ oteborg, G€ oteborg, Sweden f Nuclear medicine and PET, Department of Surgical Sciences, Uppsala University, Sweden g Department of Clinical Sciences, Intervention and Technology, Karolinska Institutet, Stockholm, Sweden h Department of Radiology, Karolinska University Hospital, Stockholm, Sweden i Stockholms sjukhem, Stockholm, Sweden j NsGene Inc, Providence, RI, USA Abstract Background: The extensive loss of central cholinergic functions in Alzheimer’s disease (AD) brain is linked to impaired nerve growth factor (NGF) signaling. The cardinal cholinergic biomarker is the acetylcholine synthesizing enzyme, choline acetyltransferase (ChAT), which has recently been found in cerebrospinal fluid (CSF). Method: Encapsulated cell implants releasing NGF (EC-NGF) were surgically implanted bilaterally in the basal forebrain of six AD patients for 12 months and cholinergic markers in CSF were analyzed. Hypothesis: EC-NGF therapy will alter CSF levels of cholinergic biomarkers, ChAT, and acetylcho- linesterase. Result: Activities of both enzymes were altered after 12 months. In particular, the activity of soluble ChAT showed high correlation with cognition, CSF tau and amyloid-b, in vivo cerebral glucose uti- lization and nicotinic binding sites, and morphometric and volumetric magnetic resonance imaging measures. Conclusion: A clear pattern of association is demonstrated showing a proof-of-principle effect on CSF cholinergic markers, suggestive of a beneficial EC-NGF implant therapy. Ó 2015 The Alzheimer’s Association. Published by Elsevier Inc. All rights reserved. Keywords: Alzheimer’s disease; Nerve growth factor; Choline acetyltransferase; Acetyl cholinesterase; tau; Amyloid-b; Nicotine receptors; PET; MRI All authors have contributed to the work as mentioned below, agreed with the presented findings, and the work has not been published before nor is it being considered for publication in another journal. 1 Contributed equally to the study. *Corresponding authors. Tel.: 146-8-585-863-12; Fax: +46-8-585-854- 70 (T.D-S.) or Tel.: 146-8-585-864-49 (M.E.) E-mail address: [email protected] (T.D-S.) or maria. [email protected] (M.E.) http://dx.doi.org/10.1016/j.jalz.2014.11.008 1552-5260/Ó 2015 The Alzheimer’s Association. Published by Elsevier Inc. All rights reserved. Alzheimer’s & Dementia - (2015) 1-13
Transcript of Changes in CSF cholinergic biomarkers in response to cell therapy with NGF in patients with...

Alzheimer’s & Dementia - (2015) 1-13
Changes in CSF cholinergic biomarkers in response to cell therapy withNGF in patients with Alzheimer’s disease
Azadeh Karamia,b,1, Helga Eyjolfsdottira,b,1, Swetha Vijayaraghavana, G€oran Lindc,d,Per Almqvistc,d, Ahmadul Kadira, Bengt Linderothc,d, Niels Andreasena,b, Kaj Blennowe,
Anders Wallf, Eric Westmana,b, Daniel Ferreiraa, Maria Kristoffersen Wibergg,h,Lars-Olof Wahlunda,b, �Ake Seigeri, Agneta Nordberga,b, Lars Wahlbergj,
Taher Darreh-Shoria,b,*,1, Maria Eriksdottera,b,*,1
aDepartment of Neurobiology, Care Sciences and Society, Karolinska Institutet, Stockholm, SwedenbDepartment of Geriatrics, Karolinska University Hospital, Stockholm, SwedencDepartment of Clinical Neuroscience, Karolinska Institutet, Stockholm, Sweden
dDepartment of Neurosurgery, Karolinska University Hospital, Stockholm, SwedeneDepartment of Clinical Neuroscience, Clinical Neurochemistry Laboratory, University of G€oteborg, G€oteborg, Sweden
fNuclear medicine and PET, Department of Surgical Sciences, Uppsala University, SwedengDepartment of Clinical Sciences, Intervention and Technology, Karolinska Institutet, Stockholm, Sweden
hDepartment of Radiology, Karolinska University Hospital, Stockholm, SwedeniStockholms sjukhem, Stockholm, Sweden
jNsGene Inc, Providence, RI, USA
Abstract Background: The extensive loss of central cholinergic functions in Alzheimer’s disease (AD) brain
All authors have c
with the presented fin
nor is it being conside1Contributed equa
http://dx.doi.org/10.10
1552-5260/� 2015 Th
is linked to impaired nerve growth factor (NGF) signaling. The cardinal cholinergic biomarker is theacetylcholine synthesizing enzyme, choline acetyltransferase (ChAT), which has recently been foundin cerebrospinal fluid (CSF).Method: Encapsulated cell implants releasing NGF (EC-NGF) were surgically implanted bilaterallyin the basal forebrain of six AD patients for 12months and cholinergicmarkers in CSFwere analyzed.Hypothesis: EC-NGF therapy will alter CSF levels of cholinergic biomarkers, ChAT, and acetylcho-linesterase.Result: Activities of both enzymes were altered after 12 months. In particular, the activity of solubleChAT showed high correlation with cognition, CSF tau and amyloid-b, in vivo cerebral glucose uti-lization and nicotinic binding sites, and morphometric and volumetric magnetic resonance imagingmeasures.Conclusion: A clear pattern of association is demonstrated showing a proof-of-principle effect onCSF cholinergic markers, suggestive of a beneficial EC-NGF implant therapy.� 2015 The Alzheimer’s Association. Published by Elsevier Inc. All rights reserved.
Keywords: Alzheimer’s disease; Nerve growth factor; Choline acetyltransferase; Acetyl cholinesterase; tau; Amyloid-b;
Nicotine receptors; PET; MRI
ontributed to the work as mentioned below, agreed
dings, and the work has not been published before
red for publication in another journal.
lly to the study.
*Corresponding authors. Tel.:146-8-585-863-12; Fax: +46-8-585-854-
70 (T.D-S.) or Tel.: 146-8-585-864-49 (M.E.)
E-mail address: [email protected] (T.D-S.) or maria.
[email protected] (M.E.)
16/j.jalz.2014.11.008
e Alzheimer’s Association. Published by Elsevier Inc. All rights reserved.

A. Karami et al. / Alzheimer’s & Dementia - (2015) 1-132
1. Introduction
The central cholinergic system shows early and selectivedegeneration in the major dementia disorders, such as Alz-heimer’s disease (AD) [1] and dementia with Lewy bodies(DLB) [2]. The cholinergic neurons of the basal nucleus ofMeynert (nbM) are the main source of cholinergic innerva-tion of the cerebral cortex [3].
The survival and function of neurons in nbM highlydepend on a retrograde nerve growth factor (NGF) contrib-uting transport from the hippocampus and cortex [4,5]. Awealth of data from animal models indicates that NGFeffectively decreases lesion-induced cholinergic deficit andcognitive impairment [6].
NGF is expressed in a precursor form (proNGF), whichthen through proteolytic cleavage produces mature NGF inthe brain [7]. NGF promotes growth, development, regula-tion, differentiation, and survival of peripheral and centralnervous system neurons, in particular the basal forebraincholinergic neurons [8,9].
Disturbances in NGF transport and/or decreased process-ing of proNGF to mature NGF [7,10–13] may be the reasonsfor the selective degeneration of cholinergic neurons of nbMof the basal forebrain in the brain of AD patients. Forinstance, about twofold higher proNGF levels have beenreported in the parietal cortex of AD patients comparedwith controls, signifying an abnormal overexpression,accumulation, or reduced processing rate of proNGF tomature NGF in those individuals [7,11].
Thus, therapeutic strategies for the administration ofmature NGF or compounds that induces higher processingrate of endogenous proNGF to mature NGF in the AD brainare currently explored. For example, an animal study hasshown that neurodegeneration induced by an anti-NGF anti-body can be principally reversed by the administration ofNGF [14].
Targeted delivery of exogenous mature NGF throughencapsulated cell biodelivery has recently been reported asa potential AD therapy [15,16]. This first-in-man study ofencapsulated cell biodelivery of NGF (EC-NGF) to the basalforebrain of AD patients has been conducted on six patientswith a duration of 12 months [16]. All the patients had bilat-erally received single or double EC-NGF implants withoutsigns of toxicity or complications, including the removalof the implants at 12 months follow-up of the study.
Cholinergic neurons are defined by the presence ofacetylcholine (ACh) synthesizing enzyme, choline acetyl-transferase (ChAT) in the cytosol of the neurons. Thus,ChAT has been regarded as the most selective marker ofthe cholinergic cells. Nonetheless, we have recently discov-ered that ChAT is not solely a cytosolic enzyme but is alsopresent in the human extracellular fluids, including cerebro-spinal fluid (CSF) and plasma [17]. We have hypothesizedthat the function of soluble ChAT is to maintain a certainlevel of ACh equilibrium in the extracellular fluid by coun-teracting the breakdown of ACh by cholinesterases, acetyl
(AChE), and butyrylcholinesterase (BuChE), allowingACh to act on various distantly located cholinoceptive cells,such as astroglial cells [17].
The aim of this study was to investigate whether changesin cholinergic biomarkers, particularly ChAT in the CSF ofthe AD patients participating in the EC-NGF study had a po-tential for monitoring EC-NGF induced changes in thecholinergic activity of the brain.
2. Material and methods
2.1. Study design
The details of the EC-NGF study have been previously re-ported [15,16]. Briefly, six AD patients (two men and fourwomen) with mean age of 626 6 (6SEM; ranging between55–73) years and a median MMSE score of 23 (rangingbetween 19 and 24) were enrolled and completed the study.All patients were treated with cholinesterase inhibitors(ChEI) for a mean duration of 15 6 7 months at study start,and continued on the same dose throughout the study.
Three patients received single EC-NGF implants target-ing the basal nucleus of Meynert (Ch4 region) bilaterally(i.e., two implants per patient), and three patients receiveddouble bilateral implants (a total of four implants per pa-tient) targeting both the Ch4 region and the vertical limbof the diagonal band of Broca (Ch2 region) [15,16].
This study was conducted according to the Declaration ofHelsinki and subsequent revisions. Informed consent wasobtained from each patient and the responsible caregivers.The regional human ethics committee of Stockholmapproved the study and the Swedish Medical ProductsAgency.
2.2. CSF samples and measurements of CSF biomarkers
CSF samples were collected at baseline (before implanta-tion) and 3 and 12 months after implantation. The sampleswere kept at 280�C until the assay.
For the analysis, the CSF samples were in advance dilutedfive times in Tris-buffered saline (10 mM, pH 7.4 containing1% bovine serum albumin, 1 mM ethylene diamine tetra ace-tic acid, 0.05% Triton X-100). The investigators whomeasured the CSF cholinergic biomarkers were completelyblinded to the details of the study, such as the number of im-plants or the cognitive scores of the patients in MMSE orADAS-Cog tests.
The activity of AChE was assessed by the modified Ell-man’s colorimetric assay as described before [18]. AChEprotein level was assessed by functional enzyme-linkedimmunosorbent assay (ELISA) as described previously [18].
CSF ChAT activity was measured by a new colorimetricassay described recently [17].
Analyses of CSF amyloid-b 1–42 peptide (Ab42), totaltau (T-tau), and phosphorylated tau protein (P-tau) were per-formed with xMAP technology using the Inno-Bia AlzBio 3
A. Karami et al. / Alzheimer’s & Dementia - (2015) 1-13 3
kit (Innogenetics, Gent, Belgium) as described previously[19]. For the assessment of NGF in the CSF and plasma sam-ples a sandwich ELISA with at least a detection level of31.3 pg/ml of NGF was used (cat. no. DY256 from R & DSystem, UK) according to the manufacturer’s instruction.
2.3. In vivo brain 11C-nicotinic binding sites by PET
The in vivo brain 11C-nicotinic binding sites as a putativesurrogate of the number of nicotinic ACh receptors were as-sessed by positron emission tomography (PET) at baseline,3, and 12 months. PET analyses were performed using adual tracer protocol including 15O-water and (S)(2)-(N-11C-methyl) nicotine [20]. A flow-compensatedparameter k2* was calculated from the rate constant k2 fornicotine divided by cerebral blood flow [21,22]. Forsimplicity we calculated 1- k2*, because a low k2* valueindicates high 11C-nicotine binding, i.e. has an inverserelationship with the number of nicotinic binding sites [23].
2.4. In vivo brain glucose metabolism by PET
Regional brain glucose metabolism was measured atbaseline, 3, and 12 months by 18F-fluoro-2-deoxy-D-glucose(F-FDG)-PET, with the parametric maps of regional cerebralmetabolic rate of glucose (rCMR glu [mmol/100 g/min], Pat-lak images) were created by the Patlak technique [24].
2.5. Magnetic resonance imaging
MRI was performed on a 1.5 T Siemens Magnetom AvantoMR Scanner (Simens, Erlangen, Germany). A 3D T1-weighted magnetization-prepared rapid acquisition gradient-echo (MPRAGE) sequence was acquired TR echo time (TE)/T1 5 2400/2.56/1000 ms, flip angle 5 8, slicethickness5 1.30 mm, field of view (FOV)5 250! 250 mm,matrix size5 192! 192, number of slices 128).
2.6. Brain cortical thickness and volumetric analyses byMRI
The FreeSurfer software package, version 4.5.0, was usedto quantify thickness and volume measures from differentbrain regions, as described in detail elsewhere [25,26].Cortical thickness measures were obtained from 34 regionsand volumetric measures from 23 subcortical regions.Volumetric measures were corrected for differences inhead size by dividing each measurement by the estimatedtotal intracranial volume. Cortical thickness measures werenot normalized [27]. Average cortical thickness of the fron-tal, temporal, parietal, and cingulate cortices and the overallbrain region was calculated as described in theSupplementary Methods.
2.7. Cognitive tests
The cognitive function of patients during treatment wasassessed by using the Mini-Mental State Examination
(MMSE) [28] and Alzheimer’s Disease Assessment Scale-cognitive (ADAS-cog) subscale tests [29] before and aftervarious intervals of EC-NGF treatment.
2.8. Statistical analyses
2.8.1. Stratification based on single and double implants ofEC-NGF
Three AD patients with single bilateral EC-NGF implantsin Ch4 region of the lateral nbM were assigned as single-implant group in this study. The other three patients, whoadditionally received bilateral implants in the medial nbM(Ch2) are defined here as double-implant group.
2.8.2. Definition of responders versus nonresponders basedon MMSE
To get further insight into the possible clinical effects ofNGF treatment in relation to the CSF cholinergic markers,we also subdivided the patients based on standard annualchanges in the MMSE test scores (Fig. 1). The annual cogni-tive decline rate based on MMSE is three to four points/yearin untreated and 2.5 points/year in AD patients assessed oneyear after ChEI-therapy [30,31].
In this study, three patients showed �2 points annualdecline in the MMSE test after 1 year of EC-NGF therapyand were assigned as Responders, and three patients, whoshowed greater than two points of annual decline, were as-signed as Nonresponders (Fig. 1C). This patient stratifica-tion also separated the patients as two groups withdifferent performance on the ADAS-cog tests (Fig. 1F).
Statistical analyses were then performed by the nonpara-metric statistical tests Wilcoxon-signed rank and Mann-Whitney U test. The significance levels were set to P , .05.Data are given asmean6SEM.Thenonparametric Spearmanrank correlation was used for the correlation analysis, whichwas thenvisualized graphically using a simple regression plot.
2.8.3. Reference AD group on stable dosage of reversiblecholinesterase inhibitors
Because all the EC-NGF patients were simultaneouslyand stably on treatment with the reversible ChEIs (galant-amine or donepezil), we included CSF samples from a groupof AD patients as Reference group (Fig. 1D). The CSF usedin this study was collected after 1 and 2 years of treatmentwith the reversible ChEIs. The demographic of this referencegroup at 1 year was as follows: n 5 17; eight women andnine men; 14 APOE 34-carriers and three noncarriers; age72.61 years (range 63–79) and MMSE 24 6 1 (range 13–30). The criteria for inclusion in this reference group werethe availability of CSF samples and MMSE test scoresboth after 12 and 24 months of stable dosage of ChEIs ther-apy. The criteria for responders and nonresponders werethose mentioned previously for the EC-NGF group (�2points annual MMSE decline). The activities of AChE andChAT in these CSF samples were determined as describedpreviously. Furthermore, the validity of subdividing the

Cha
nges
in M
MS
E(%
Bas
elin
e)C
hang
es in
AD
AS-C
og(%
Bas
elin
e)
0 3 6 12-50
-25
0
25
-30
0
30
60
90
Duration of EC-NGF treatment(months)
0 3 6 12
-50
-25
0
25
-30
0
30
60
90
0 3 6 12
0 3 6 12Duration of EC-NGF treatment
(months)
-50
-25
0
25
*
-30
0
30
60
90
*
0 3 6 12
0 3 6 12Duration of EC-NGF treatment
(months)
¤
¤
Non-responders
Responders
Single
Double
Overall
*
**
12 24
-25
-50
0
25
12
Reference Group
Duration of ChEI treatment (months)
5
Overall¤¤¤
A B C
E F G
D
Fig. 1. Stratification of the patients based on changes in cognitive performances after treatment. (A) The overall changes in MMSE test score during 12 months
treatment. (B) MMSE changes in the Single and Double implants subgroups. (C) Subdivision of the patients based on annual changes in the MMSE test scores.
Three patients showed�2 points annual decline in the MMSE test and were assigned as the Responders, and three patients who showed greater than two points
of annual decline in MMSEwere the Nonresponders. (D) One-year changes in MMSE test scores in a reference group of patients on stable dosage of the revers-
ible cholinesterase inhibitors (ChEIs). (E) The overall changes in ADAS-Cog test score during 12months treatment. (F) Changes in ADAS-Cog test in the Single
and Double implants subgroups. (G) Changes in the ADAS-Cog is consistent with the Responders and Nonresponders group assignment based on the MMSE.
The data is shown for the overall group and for Responders and Nonresponders to ChEI-therapy as were predefined in the section of “Statistical analyses”.
*P , .05 and **P , .01 indicate significant difference compared with the baseline levels, ¤P , .05 and ¤¤¤P , .001 indicate significant differences between
the groups. MMSE, Mini-Mental State Examination; ADAS-Cog, Alzheimer’s Disease Assessment Scale-cognitive subscale.
A. Karami et al. / Alzheimer’s & Dementia - (2015) 1-134
NGF patients has been addressed and confirmed by volu-metric MRI analyses of the brain between EC-NGF groupand another reference group from the Alzheimer’s DiseaseNeuroimaging Initiative (ADNI) study population [32].
3. Results
3.1. Responders exhibit increase in the CSF ChATactivityfollowing NGF treatment
After 3 months, the ChAT activity did not show any sig-nificant changes in the CSF in the six patients (Fig. 2A), ir-respective of Single- and Double-implant groups (Fig. 2B),or the Responder and Nonresponder groups (Fig. 2C). After12 months, the changes in the CSF ChAT activity showed asignificant increase of 256 8% in the Responders comparedwith the Nonresponders (P, .05, Fig. 2C) or compared withbaseline (266 10%, P, .10), whereas there were no differ-ences in the CSF ChATactivity in subjects with single versusdouble implants (Fig. 2B). The protein levels of ChAT in theCSF varied greatly among these patients (366 41% of base-line, P , .6) with no correlation between ChAT activity andprotein levels in the CSF.
In the overall Reference group, no annual changes wereobserved in the ChAT activity (1 6 11%, Fig. 2D) as was
compared from 12 to 24 months of stable dosage with revers-ible ChEIs. Subanalyses among the responders and nonre-sponders groups indicated no significant changes among theresponders (116 14%, P, .44, n5 12), but a trend of reduc-tion of CSF ChAT activity among the nonresponders to thelong-term treatment with ChEIs (23 6 12%, n5 5, P, .08,Fig. 2D). The differences in the CSF ChAT activity betweenthe responders and nonresponders were about 34% (Fig. 2D).
3.2. All patients exhibit increases in CSFAChE activityfollowing NGF treatment
In the total group of patients, the AChE activity in CSFshowed a statistically significant increase of 376 12% after12 months (P , .028, Fig. 2E-G). After 12 months, the ADpatients withDouble-implants showed 616 12% increase inCSF AChE activity compared with baseline (P , .035,Fig. 2F) and 48 6 11% increase compared with patientswith Single-implants (P , .023, Fig. 2F). However, theextent of increase in CSF AChE activity was similar amongResponders and Nonresponders (Fig. 2G).
With regard to changes in the CSF AChE activity, theoverall reference group exhibited a significant decrease(12 6 5%, P , .013) as was compared between 12 and24 months of stable dosage with reversible ChEIs. This
12 24 -25
0
25
50
5
Reference Group
-25
0
25
50
75
12 24 Duration of ChEI treatment
(months)
12
*
CS
F C
hAT
activ
ty
(%B
asel
ine)
-25
0
25
50
CS
F A
ChE
act
ivty
(%B
asel
ine)
-25
0
25
50
75
*
Overall
0 3 6 12
0 3 6 12
-25
0
25
50
-25
0
25
50
75*
SingleDouble
0 3 6 12
0 3 6 12-25
0
25
50
75
*Non-respondersResponders
0 3 6 12-25
0
25
50
0 3 6 12Duration of EC-NGF treatment
(months)Duration of EC-NGF treatment
(months)Duration of EC-NGF treatment
(months)
Overall
A B C D
E F G H
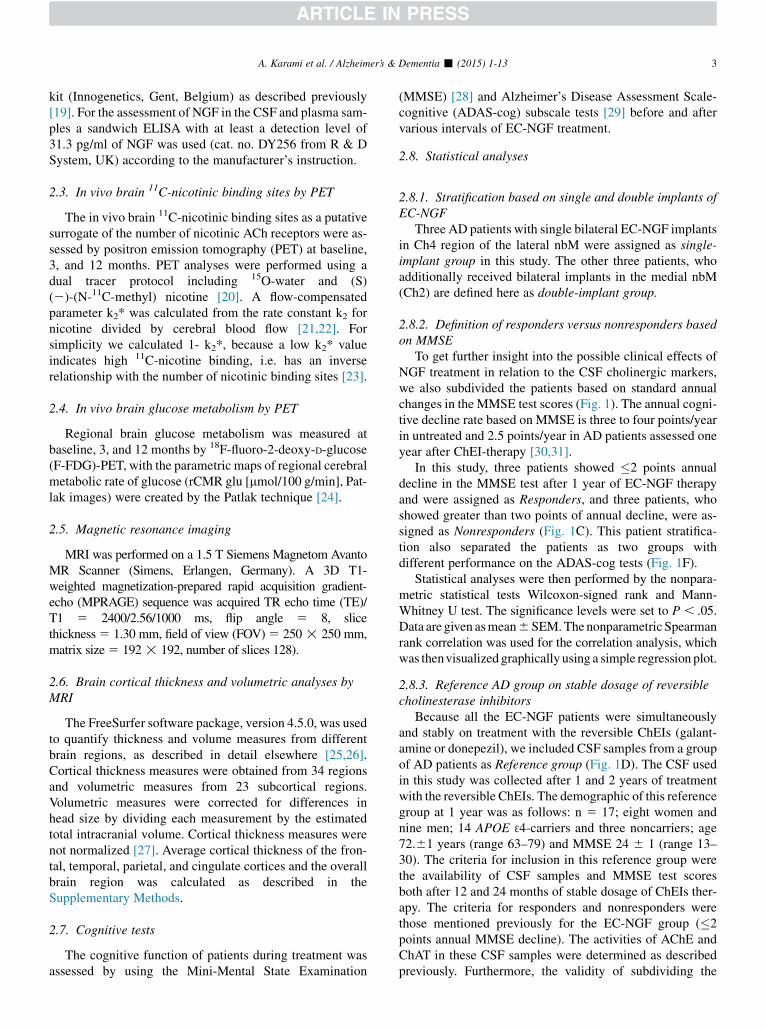
Fig. 2. Overall CSF biomarkers and the difference based on NGF doses and the performance in cognition. (A) Overall changes of ChAT activity during NGF
treatment. (B) No NGF dosage-dependent changes in CSF ChAT activity was observed when the patients were grouped based on Single and Double EC-NGF
implants. (C) In contrast, when the changes in CSF ChAT activity were analyzed based on annual cognitive changes, the Responders showed 25% increased
ChATactivity compared with Nonresponders or baseline. (D) This finding is in contrast with relative changes in the reference group (n5 17), who were stably
on reversible cholinesterase inhibitors for 12 months. Note, also that the nonresponders in this reference group showw23% decline in ChATactivity (P, .14)
compared with baseline or w34% (P , .17) compared with the responders of ChEIs’ therapy. (E) CSF AChE activity showed 40% general increases after
12 months of treatment. (F) This increase was most pronounced among AD subjects with Double implants (w65%), whereas those with Single implant had
a nonsignificant 13% increase. (G) Furthermore, no difference in the level of changes in AChE activity was apparent between the Responders and Nonre-
sponders. (H) The changes in the CSF AChE activity among the reference group show in contrast significant decreases in overall group (w12%, P , .03),
and particularly in nonresponders (w19%, P , .02) but less so among the responders (w9%, P , .18). *P .05 indicates significant difference compared
with the baseline levels, *P .05 indicates significant differences between the groups. AChE, acetylcholinesterase; CSF, cerebrospinal fluid; ChAT, choline ace-
tyltransferase; EC-NGF, encapsulated NGF releasing cells.
A. Karami et al. / Alzheimer’s & Dementia - (2015) 1-13 5
reduction was most significant among the nonresponders(19 6 5%, P , .045, Fig. 2H) than among the respondersof the reference group (9 6 6%, P , .18).
3.3. CSF ChAT activity showed high correlation withcognitive function
Correlation analysis showed a positive association betweenCSF ChATactivity and the patients’ performance in cognitivetests at 12 but not 3 months. At 12 months, the changes in theCSFChATactivity correlatedpositively bothwith the absolutevalues of theMMSE test scores (r5 0.89, P, .014, Fig. 3A),and with the percent changes in the MMSE at 12 months(r 5 0.92, P , .005, Fig. 3B). The changes in CSF ChATactivity also showed a significant correlation with the testresults in ADAS-Cog (r5 20.91, P, .0093, Fig 3C).
3.4. CSF ChATand AChE activities show high correlationwith FDG-PET
We examined whether the observed relationship betweenCSF ChAT activity and cognition existed also with thein vivo brain glucose utilization assessed by FDG-PET after12 months of EC-NGF treatment. CSF ChAT activity corre-lated positively with the in vivo glucose utilization in
average cortical (r 5 0.83, P , .037) and overall brain re-gions (r 5 0.82, P , .047) and in certain brain regions,such as primary visual cortex (r5 0.87, P, .020), thalamus(r 5 0.95, P , .0015), and cerebellum (r 5 91, P , .0078).
Similarly, the percent changes in the CSF ChAT activityshowed positive correlations with the in vivo brain glucose uti-lization in the frontal cortex (r5 0.88, P, .016, Fig. 3D), pu-tamen (r5 0.82,P,.043), and cerebellum (r5 91,P,.0078).
A proper cholinergic signaling most likely depends onboth the ACh-biosynthesizing enzyme, ChAT, and theACh-degrading enzyme, AChE, levels. We therefore per-formed a similar correlative analysis between AChE andthe in vivo PET measures.
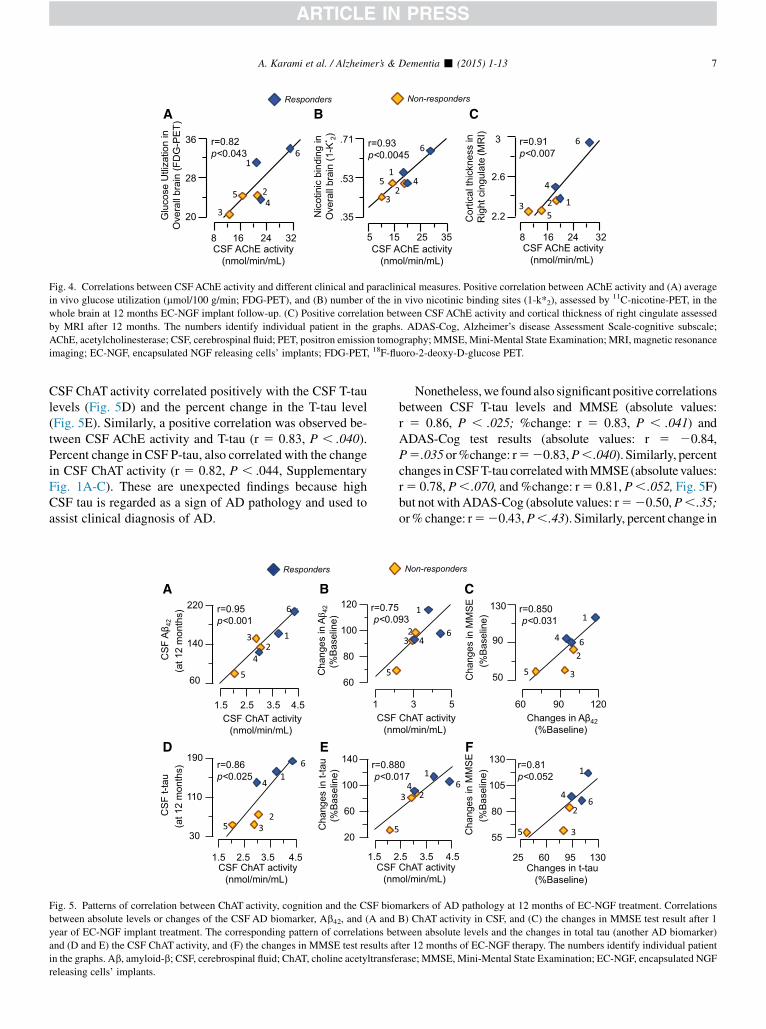
CSF AChE activity correlated significantly with FDG-PET in the overall average of brain regions (r 5 0.82,P , .043, Fig. 4D) and in several brain regions: temporalcortex (r 5 0.81, P , .049), primary visual cortex(r 5 0.83, P , .040), and thalamus (r 5 0.82, P , .043).
3.5. CSF ChATand AChE activities also correlate with thein vivo 11C-nicotine binding sites
Both ChAT and AChE are biologically linked to cholin-ergic receptors, i.e. the muscarinic and nicotinic ACh-
r=0.89p<0.014
MM
SE
(test
sco
res)
CSF ChAT activity(%Baseline)
12
18
24
30
80 120 160
CSF ChAT activity(%Baseline)
r=0.88p<0.016
Glu
cose
Util
izat
ion
in
Fron
tal c
tx(F
DG
-PE
T)
18
24
30
36
80 130 180
r=0.89p<0.014
2
2.4
2.8
3.2
Cor
tical
thic
knes
srig
ht c
ingu
late
(MR
I)
CSF ChAT activity (nmol/min/mL)
1.5 2.5 3.5 4.5
r=0.92p<0.0050
Cha
nges
in M
MS
E(%
Bas
elin
e)
CSF ChAT activity(%Baseline)
80 120
50
90
130
r=0.97p<0.0003
Nic
otin
ic b
indi
ngin
Fras
s.ct
x(1
-K* 2)
.5
.58
.66
.74
CSF ChAT activity (nmol/min/mL)
1.5 2.5 3.5 4.5
Non-respondersResponders
1
23
4
5
6
1
2
3
4
5
6
1
23
4
5
6 1
23
4
5
6
12
3
45
6
160
r=-0.91p<0.0093
AD
AS
-Cog
(te
st s
core
)
CSF ChAT activity(%Baseline)
15
25
35
45
55
80 120 160
1
23
45
6
A B C
D E F
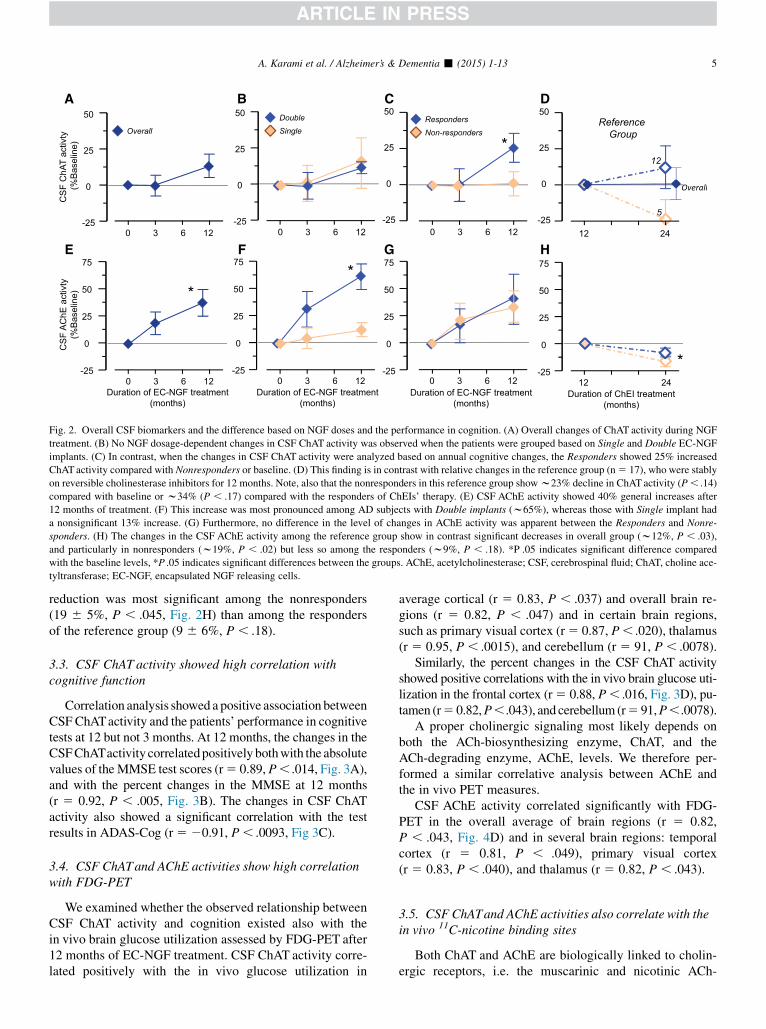
Fig. 3. Correlation between CSF ChAT activity and clinical and para-clinical in vivo assessments. Correlation between changes in CSF ChAT activity and (A)
absolute MMSE test scores, and the 12 months’ changes from baseline in (B) the MMSE, and (C) ADAS-Cog tests. (D) Positive correlation between changes in
CSF ChAT activity and the in vivo glucose utilization (mmol/100 g/min) in the frontal cortex assessed by FDG-PET at 12 months EC-NGF implant follow-up.
Positive correlation between CSF ChAT activity and (E) number of the in vivo nicotinic binding sites (1-k*2) in frontal association cortex, assessed by 11C-
nicotin-PET, and (F) the cortical thickness in right cingulate assessed by MRI after 12 months. Noteworthy, the Responders show relatively the best clinical
outcomes in relation to the CSF ChAT activity. The numbers identify individual patient in the graphs. ADAS-Cog, Alzheimer’s Disease Assessment Scale-
cognitive subscale; ChAT, choline acetyltransferase; PET, positron emission tomography; MMSE, Mini-Mental State Examination; CSF, cerebrospinal fluid;
MRI, magnetic resonance imaging; EC-NGF, encapsulated NGF releasing cells’ implants; FDG-PET, 18F-fluoro-2-deoxy-D-glucose (F-FDG)-PET.
A. Karami et al. / Alzheimer’s & Dementia - (2015) 1-136
receptors. We therefore examined the relation between theChAT and AChE activities in CSF of the patients and thenicotinic binding sites in vivo in the brain following12 months of EC-NGF therapy. The CSF ChAT activitycorrelated positively with the 11C-nicotine binding in severalbrain regions, particularly of the left hemisphere (left frontal[r 5 0.87, P , .02] and left frontal association [r 5 0.97,P , .0003, Fig. 3E] cortices) and the average of regions ofthe cingulate gyri (r 5 0.91, P , .009).
The activity of the ACh-degrading enzyme AChE in CSFalso showed significant correlations with the in vivo nicotinicbinding sites in averages of the overall cortical (r 5 0.94,P , .003) and the overall brain regions (r 5 0.93,P , .0045, Fig. 4B), but again mainly in the left brain hemi-sphere: average of left cortical regions (r5 0.99, P, .0001),left frontal (r 5 0.82, P , .045), left frontal association(r 5 0.85, P , .030), left parietal (r 5 0.82, P , .045) andleft temporal cortices (r 5 0.92, P , .0067), and average re-gions of the cingulate gyri (r 5 0.86, P , .023).
We also studied the relation between the cognition and thelevels of 11C-nicotine binding in the brain. We found that thenumber of nicotinic binding sites or the changes in the nico-tinic binding sites in the overall brain regions correlatedsignificantly with changes in cognition assessed by ADAS-Cog (r520.89, P, .013) and MMSE (r5 0.82, P, .048).
Thus, the overall pattern of these correlative analysessuggests that the Responders had relatively the highest
levels of ChAT and AChE activities and number of nico-tinic binding sites compared with the Nonresponders(Fig. 3E and 4B).
3.6. Levels of amyloid-beta correlate with cholinergicbiomarkers in CSF
A reduced level of the Ab42 peptides in CSF is part of thediagnostic assessment of AD. We hence examined whether arelationship existed between CSF levels of AChE, ChAT,and Ab42 peptides and the measures of cognition. No corre-lations were observed between the CSFAb42 and AChE ac-tivity at baseline (r5 0.21, P, .71) or at 12 months of NGFtreatment (r 5 0.62, P , .21). In contrast, positive correla-tions between CSF Ab42 and ChAT activity both at baseline(r5 0.94,P,.002) and following 12months NGF treatment(r 5 0.95, P , .001, Fig. 5A) were found. At 12 months, inaddition, the percent change in the CSFAb42 correlated withCSF ChATactivity (r5 0.75; P, .093, Fig 5B) and MMSEtests results (Fig. 5C), but not the ADAS-Cog tests results(r 5 20.52, P , .31).
3.6.1. Changes in CSF tau and correlation to CSFcholinergic biomarkers
Next we examined the relationship between total-tau (T-tau) or the phosphorylated tau (P-tau) and the CSF ChAT orAChE activities after 12 months of EC-NGF therapy. The
5 15 25 35CSF AChE activity
(nmol/min/mL)
.35
.53
.71
Nic
otin
ic b
indi
ngin
Ove
rall
brai
n(1
-K* 2) r=0.93
p<0.0045 r=0.91p<0.007
2.2
2.6
3
Cor
tical
thic
knes
s in
R
ight
cin
gula
te(M
RI)
8 16 24 32CSF AChE activity
(nmol/min/mL)
20
28
36
8 16 24 32CSF AChE activity
(nmol/min/mL)
Glu
cose
Utli
zatio
nin
Ove
rall
brai
n(F
DG
-PE
T)
r=0.82p<0.043
Non-respondersResponders
1
2
34
5
6
1
23
45
6
123
4
5
6
A B C
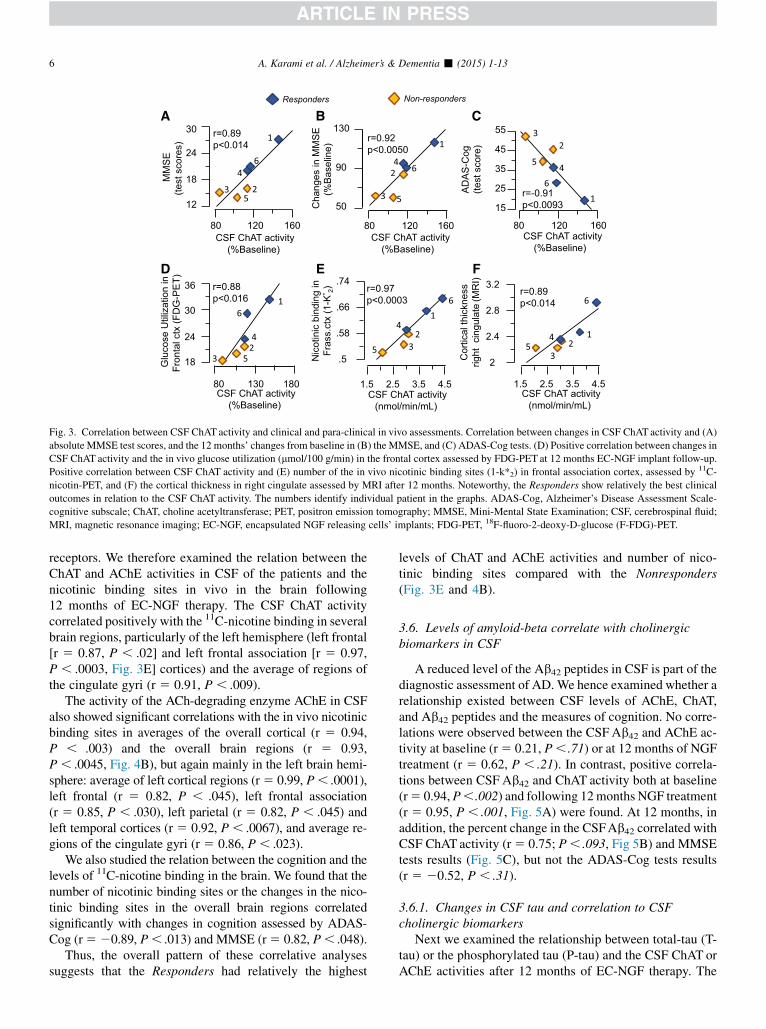
Fig. 4. Correlations between CSFAChE activity and different clinical and paraclinical measures. Positive correlation between AChE activity and (A) average
in vivo glucose utilization (mmol/100 g/min; FDG-PET), and (B) number of the in vivo nicotinic binding sites (1-k*2), assessed by 11C-nicotine-PET, in the
whole brain at 12 months EC-NGF implant follow-up. (C) Positive correlation between CSF AChE activity and cortical thickness of right cingulate assessed
by MRI after 12 months. The numbers identify individual patient in the graphs. ADAS-Cog, Alzheimer’s disease Assessment Scale-cognitive subscale;
AChE, acetylcholinesterase; CSF, cerebrospinal fluid; PET, positron emission tomography; MMSE, Mini-Mental State Examination; MRI, magnetic resonance
imaging; EC-NGF, encapsulated NGF releasing cells’ implants; FDG-PET, 18F-fluoro-2-deoxy-D-glucose PET.
A. Karami et al. / Alzheimer’s & Dementia - (2015) 1-13 7
CSF ChAT activity correlated positively with the CSF T-taulevels (Fig. 5D) and the percent change in the T-tau level(Fig. 5E). Similarly, a positive correlation was observed be-tween CSF AChE activity and T-tau (r 5 0.83, P , .040).Percent change in CSF P-tau, also correlated with the changein CSF ChAT activity (r 5 0.82, P , .044, SupplementaryFig. 1A-C). These are unexpected findings because highCSF tau is regarded as a sign of AD pathology and used toassist clinical diagnosis of AD.
60
80
100
120
1
r=0.75p<0.0
Cha
nges
in Aβ 4
2(%
Bas
elin
e)
r=0.88p<0.0
Cha
nges
in t-
tau
(%B
asel
ine)
CSF(nm
20
60
100
140
1.5 2
r=0.95p<0.001
1.5 2.5 3.5 4.5CSF
(nmCSF ChAT activity
(nmol/min/mL)
60
140
220
CS
F A
β 42
(at 1
2 m
onth
s)
CSF ChAT activity (nmol/min/mL)
r=0.86p<0.025
CS
F t-t
au(a
t 12
mon
ths)
1.5 2.5 3.5 4.5
30
110
190
Responders
12
3
4
5
6
5
1
23
4
5
6
5
A B
D E
Fig. 5. Patterns of correlation between ChAT activity, cognition and the CSF bio
between absolute levels or changes of the CSF AD biomarker, Ab42, and (A and
year of EC-NGF implant treatment. The corresponding pattern of correlations be
and (D and E) the CSF ChAT activity, and (F) the changes in MMSE test results a
in the graphs. Ab, amyloid-b; CSF, cerebrospinal fluid; ChAT, choline acetyltransfe
releasing cells’ implants.
Nonetheless,we found also significant positive correlationsbetween CSF T-tau levels and MMSE (absolute values:r 5 0.86, P , .025; %change: r 5 0.83, P , .041) andADAS-Cog test results (absolute values: r 5 20.84,P5.035or%change: r520.83,P,.040). Similarly, percentchanges inCSFT-tau correlatedwithMMSE (absolute values:r5 0.78, P, .070, and%change: r5 0.81, P, .052, Fig. 5F)but not with ADAS-Cog (absolute values: r520.50,P,.35;or%change: r520.43,P,.43). Similarly, percent change in
55
80
105
130
25 60 95 130
Cha
nges
in M
MS
E(%
Bas
elin
e)
Changes in t-tau(%Baseline)
r=0.81p<0.052
3 5
93
017
ChAT activity ol/min/mL)
.5 3.5 4.5
50
90
130 r=0.850p<0.031
60 90 120Changes in Aβ42
(%Baseline)
Cha
nges
in M
MS
E(%
Bas
elin
e)
ChAT activity ol/min/mL)
Non-responders
1
23 4
6
1
2
3
4
5
6
1
234 6
1
2
3
4
5
6
C
F
markers of AD pathology at 12 months of EC-NGF treatment. Correlations
B) ChAT activity in CSF, and (C) the changes in MMSE test result after 1
tween absolute levels and the changes in total tau (another AD biomarker)
fter 12 months of EC-NGF therapy. The numbers identify individual patient
rase; MMSE, Mini-Mental State Examination; EC-NGF, encapsulated NGF

A. Karami et al. / Alzheimer’s & Dementia - (2015) 1-138
CSF P-tau also correlated with MMSE in particular with itsrelative change (r 5 0.92, P , .007, SupplementaryFig. 1E), but not with ADAS-Cog (r5 20.57, P , .26).
3.7. MRI analyses were consistent with the pattern of CSFcholinergic and in vivo brain PET biomarkers
Comparison of changes in the cortical thickness after12 months of EC-NGF indicated that the Nonrespondershad statistically significant cortical atrophy in all the studiedbrain regions (all P-values , .05, Fig. 6A) when comparedwith baseline. No statistically significant atrophy wasobserved in the Responders (Fig. 6A). The pattern of volu-metric changes, i.e. reduction of total gray and white mattervolume, and enlargement of total CSF volume (Fig. 6B) wasin agreement with these findings.
Correlation analysis on 12 months data indicated sig-nificant correlations between the CSF ChAT activity andcortical thickness in the right cingulate (Fig. 3F,r 5 0.89, P , .014) and overall regions cingulate gyri(r 5 0.81, P , .052). Similarly, a strong correlation wasobserved between the average cortical thickness in theright cingulate with the CSF AChE activity (Fig. 4C,r 5 0.91, P , .007).
3.8. Patients’ cognitive performance after removal of EC-NGF implants
The patients’ cognitive performancewas also assessed af-ter the removal of the EC-NGF implants (Fig. 7). MMSE as-sessments were available for all patients for in average20 months before (Pre-NGF baseline) the start of EC-NGFtherapy (NGF-baseline) and for up to 15 months after theremoval of the EC-NGF implants (post-NGF assessment,Fig. 7A). No ADAS-Cog test results were available beforebaseline, but up to 7 months after removal of the implants(Fig. 7B). We found no statistically significant decline inMMSE among the Responders or Nonresponders up to3 months after EC-NGF treatment compared with theirown performance at pre-NGF baseline, which on averagewere assessed 20 months before their inclusion in the study.
-6
-4
-2
0
2
4
Thic
knes
s ch
ange
s(%
Bas
elin
e)
Treatment Follow-up (months)
0 12
0 12
0 12
0 12
0
**
Frontalcortex
Parietalcortex
* *
OverallBrain
Temporalcortex
Cingg
#
A
Fig. 6. Patterns of changes in MRI measures after 1 year of EC-NGF treatment.
changes in the Nonresponders when compared with the baseline. No statistically
volumetric changes, and the CSF expansions are also in agreement with the pattern
at 12 months. *P , .05 and **P, .005 indicate significant difference compared w
MRI, magnetic resonance imaging; CSF, cerebrospinal fluid; GM, gray matter; W
TheNonresponders reached a statistically significant declinein MMSE test performance after the 6 months NGF treat-ment compared with both pre-NGF baseline and NGF-base-line (Fig 7A). The Nonresponders also showed a continuousdecline up to 15 months after removal of the EC-NGF im-plants (Fig 7A). In contrast, the Responders did not showany statistically significant cognitive decline for up to15 months after EC-NGF removal as compared with theirown performance at the Pre-NGF baseline or at NGF-base-line (Fig 7A). In addition, the Responders showed a bettercognitive performance in MMSE tests than the Nonre-sponders at 12, 15, and 27 months after inclusion in theEC-NGF study (Fig 7A). A similar longitudinal comparisonbased on ADAS-Cog tests was consistent with the longitudi-nal pattern described based on the MMSE tests (Fig 7B).
4. Discussion
We have recently reported that the most specific cholin-ergic marker, i.e., the ACh-synthesizing enzyme, ChAT ispresent in the human extracellular fluids, including CSFand plasma.We have also shown that it is released by variouscells, in particular human brain astrocytes [17].
Here we show that NGF treated AD patients who exhibitincreased CSF ChAT activity compared with the baselinelevels were those who cognitively remained stable up to12 months, when the encapsulated NGF cell implants wereremoved. However, we did not find any correlation betweenprotein levels of ChATand activity, which may be importantand could be reflecting a differential hierarchal phosphoryla-tion of ChAT [33], but need to be investigated in a largergroup of patients.
We also demonstrate that the changes in ChAT activitycorrelated strongly with two in vivo brain measures assessedby PET, namely the FDG-PET, addressing regional brainglucose utilization, and 11C-nicotine-PET, addressingregional brain nicotinic binding sites.
Interestingly, we also found a strong increase in the activ-ity of the synaptic variant of AChE, which is responsible forthe break-down of ACh. It has been shown that treatment
0 12 24
Volume changes(%Baseline)
*
CSF
Non-responders
Responders
-8 -4
GM+WM
**
*#
ulateyri
12
B
(A) The cortical thickness statistically shows a significant cortical atrophy
significant atrophy was observed in the Responders. (B) The pattern of the
of cortical atrophy changes between the Responders and the Nonresponders
ith the baseline levels. #P, .05 significant differences between the groups.
M, white matter.

-20 0 3 6 12 15 19 27 0
10
20
30
MM
SE
test
sco
res
¤ ¤
¤
Months
Follow-ups Pre-NGF NGF Post-NGF
NA 0 3 6 12 15 19 NA 0
20
40
60
AD
AS
-cog
test
sco
res
¤ ¤
Months
Follow-ups Pre-NGF NGF Post-NGF
* *
Non-responders Responders
** ** ** ** ** * * * *
A
B
Fig. 7. Longitudinal follow-ups of the patients’ cognitive performances
before, during, and after EC-NGF implant study. (A) MMSE test scores
in average, 20 months prior (Pre-NGF) to the start of EC-NGF therapy
and up to 15 months after the removal of the implants (post-NGF). No dif-
ference betweenMMSE test scores exists between the Responders andNon-
responders at in-average 20 months before and at the baseline of EC-NGF
study, indicating that the observed longitudinal cognitive stabilization seen
among the Responders is most likely related to response to EC-NGF therapy
rather than difference in the stage of the disease that could be caused by a
selection bias. The arrow and asterisk above the horizontal line indicates sta-
tistically significant changes among the Nonresponders compared with the
pre-NGF MMSE assessment. The arrow and asterisk below the horizontal
line indicates statistically significant changes among the Nonresponders
compared with the NGF-baseline assessment. (B) ADAS-Cog test scores
from baseline until up to 7 months after removal of EC-NGF implants.
These analyses are consistent with observations on MMSE assessment
and suggest that the Responders have a preserved cognition for at least
3 months after removal of the implants even in this clinical test. In contrast,
the Nonresponders show cognitive deterioration compared with both base-
line and the Responders. *P , .05 compared with baseline, **P , .01
compared with the pre-NGF assessment; ¤P , .05 between the groups.
MMSE, Mini-Mental State Examination; CSF, cerebrospinal fluid;
ADAS-Cog, Alzheimer’s Disease Assessment Scale-cognitive subscale;
EC-NGF, encapsulated NGF releasing cells’ implants.
A. Karami et al. / Alzheimer’s & Dementia - (2015) 1-13 9
with reversible ChEIs such as galantamine and donepezil in-creases the level of AChE in CSF of AD patients [18,34–36],and an increased CSFAChE activity in response to treatmentreflects inhibition of the enzyme [37].
The observed increase in CSFAChE activity in this studyis, however, unlikely to be a response to the concomitanttreatment of the patients with cholinesterase inhibitorsbecause the patients were stably on the ChEI-therapy longbefore the NGF treatment was conducted. This is becausecalculating percentages of the NGF-baseline levels shouldeffectively have eliminated any ChEI-dependent increasein CSF AChE activity. In addition, the findings in the refer-ence group support this notion. The AD patients in the refer-
ence group were on stable treatment with reversible ChEIsfor up to 2 years, and were included as a control for the effectof concomitant treatment with ChEIs. Thus, changes in theCSF ChAT and AChE activities in this reference group ismost likely attributable to long-term treatment with ChEIs.We found that the CSFAChE activity was actually decreasedamong the reference group between 12 and 24months of sta-ble long-term treatment with reversible ChEIs. This illus-trates a contrasting pattern compared with the EC-NGFgroup, which strongly support the previous conclusion.
Based on the same argument it is unlikely that theincreased ChAT activity in CSF of NGF treated patientswas due to the concomitant treatment with ChEIs. However,because the presence of extracellular ChATwas unknown un-til very recently [17], there has been no report available up todate, neither in animal models nor in patients with dementiaon longitudinal changes in the CSFChATactivity before and/or after treatment with current ChEIs therapy. Based on find-ings from the reference group, we showed here for the firsttime that no significant increase in the CSF ChAT activitywas occurred after 24 months compared with 12 months oftreatment with reversible ChEIs. Rather, we found 23–34%annual decrease in the CSF ChAT activity among the nonre-sponders of the ChEI-treated reference group.
The observed increases in CSF ChATand AChE activitiesare also unlikely to be a result of an ongoing neuronal degen-eration in theADbrain because, in agreementwith thefindingsin the reference group, numerous reports show decrease ratherthan increase in the ChATactivity in ADbrain [38] and in CSF[17]. DecreasingAChE activity in cortical brain regions, espe-cially the temporal lobe, assessed by PET imaging [39–42],and in CSF of AD patients have also been reported [43,44].
In this context, reports suggest that cholinergic neuronsselectively take up exogenous NGF injected into hippocam-pus and cortex, and retrogradely transport it to their cellbodies in the basal forebrain [4,45]. Most importantly,NGF has been shown to elicit prominent increases inChAT activity both in vitro and in vivo in various brainregions including those that contain cholinergic cell bodiesor receive cholinergic projections, such as hippocampus[46,47]. NGF effect also seems to be dose dependent andselective toward basal forebrain cholinergic cells [48].
Thus, the observed increase in activities of these twocholinergic markers is most likely a direct consequence ofthe EC-NGF implant therapy. Over the last decades NGFreplacement intervention has become one of the potentialtherapeutic strategies of AD with targeted delivery showingpromise [15,16,49], whereas the intracerebroventricularroute is less feasible [50,51]. Neuronal (and likely evennonneuronal) cholinergic cells are greatly dependent onthe NGF signaling queues for their survival and properfunctioning [52,53]. Thereby the selective cholinergicdegeneration occurring in the major dementia disorders,AD, and DLB [1,2] may be caused by abnormal NGFsignaling [54], with the consequential decline in memoryand cognitive function.

A. Karami et al. / Alzheimer’s & Dementia - (2015) 1-1310
NGF is known to be produced by astrocytes under inflam-matory conditions both in vivo [55] and in vitro [56] and inparticular by microglial cells [57]. Astroglial cells are in turncholinoceptive andACh evidently exerts a regulatory suppres-sive tone on these nonneuronal cholinoceptive cells [17]. It istherefore intriguing that the EC-NGF therapy simultaneouslyincreased activities of the two enzymes (ChAT and AChE)closely involved in ACh homeostasis in the brain, which inturn argues forNGF therapy inducing a balancedenhancementof the cholinergic signaling in the brain of AD patients.
Although the current results cannot determine which sub-types of cholinergic cells (neuronal or astroglia) wereresponsible for the observed increases in ChAT and AChEactivities, the importance of the observation is not dimin-ished. We have recently reported that human astrocytes arecholinergic cells as they express and release soluble ChATunder both basal and inflammatory conditions [17]. In addi-tion, the properly regulated high functional state of astroglialcells in patients with AD is most likely beneficial rather thandetrimental, as such individuals also display beneficial para-clinical and clinical findings, such as high cerebral glucoseutilization, low beta-amyloid load, and less severe progres-sion of clinical symptoms [58].
The putative anti-inflammatory effect of ACh seems to be acrucial determinant of the differential responses to EC-NGFtherapy.Surgical implantationwill inevitably trigger an inflam-matory response at implantation sites. Thus, interindividualdifferences in the brains’ intrinsic capacity to resolve this initialimplantation-derived inflammationmight affect longer term offunctional status of the encapsulated NGF-releasing cells, andthereby the production rate and stability of NGF release. In thiscontext, we identified two groups. The Nonresponders ex-hibited increased AChE but not ChATactivity. Such an imbal-anced increase in AChE activity, due to extensive extracellularACh-degradation, might favor an inflammatory microenviron-ment in close proximity of the implantation sites. This in turnmight facilitate the hyperactivation of astroglial cells and therelease of proinflammatory cytokines and/or complement fac-tors which may diffuse into the implants and alter the survivaland/or functional status of the NGF-releasing cells. Alterna-tively, thehyperactivationof astroglial cellsmight induce an in-crease in the levels of neutralizing anti-NGF antibodies. Incontrast, parallel increases in both AChE and ChAT activities(as observed in the Responders) could raise equilibrium levelsof extrasynaptic ACh [17], and thereby facilitating an anti-inflammatory microenvironment. This could support the func-tional status and long-term survival of NGF-releasing cells inthe implants due to a faster resolution of inflammation at theimplantation sites.
An important aspect of AD is the progressive decline ofthe patients’ cognitive performance during the course ofthe disease. Current treatment with cholinesterase inhibitorsshows moderate impact on this gradual decline. We alsopresent indications that the cognitive stabilization by theEC-NGF therapy was long lasting among the Responderssubgroup because patients continued at the same level of
cognitive performance up to 15 months after the removalof the NGF implants. This is thereby conceivably an indica-tion of a disease-modifying outcome, expected followingNGF-treatment. Selection bias is unlikely to explain the ob-servations because the longitudinal assessments of the pa-tients’ cognition for up to 6 months of EC-NGF treatmentdid not indicate a difference between the groups (Fig. 7).
We also looked at the level of the cholinergic marker,ChAT, and the CSF markers of AD pathology, namely Aband tau levels. Consistently, we found positive correlationsbetween the CSF Ab and ChAT activity both at baselineand after 12 months of NGF therapy. Considering that lowCSF Ab is putatively a mirror of high Ab load in the brainof patients with AD, the correlation between high CSF Aband high ChAT activity is also in agreement with the associ-ation between CSF ChAT activity, cognitive test results, andthe in vivo brain measures by PET.
Although high levels of CSF tau is used to assist the clin-ical diagnosis of AD, the significance of its relative increaseor decrease following therapeutic intervention is unknown.Altogether, given that the relative decrease in CSF T-taulevels (as can be appreciated from Fig. 5F-J) and P-tauamong the Nonresponders after 12 months of EC-NGF ther-apy was associated with the cognitive performance of theAD patients in both MMSE and ADAS-Cog tests, the posi-tive correlation between the CSF ChATand CSF tau is inter-esting and consistent with the positive pattern of the otherobservations in relation to CSF ChAT activity.
Considering that the central cholinergic system showsquite early and major deficiencies (as measured and definedby substantial reduction in ChAT levels in the AD brain,and also to some extent by reduction in nicotinic receptors)together with logical argument that any AD disease-modifying therapy has to reverse the central cholinergicdeficit, it is tempting to speculate that our findings for the firsttime suggest that NGF producing cells implanted in the brainproduced long-lasting disease-modifying effects. In partic-ular, the correlation between CSF ChAT or AChE activityand the nicotinic-binding sites is interesting. Together withthe positive correlations between changes in the in vivo brainnicotinic binding sites and the patients’ cognitive perfor-mance, the patterns of findings between these cholinergic en-zymes and the nicotinic binding’s sites reinforce the notion ofa heightened cholinergic signaling in response to the NGFtreatment. Consistent with this notion is that the Respondersdisplayed relatively higher nicotinic binding sites in relationto levels of both ChAT (Fig. 3E) andAChE (Fig. 4B) activitiescompared with the Nonresponders after 12 months of NGFtreatment. Thus, a general enhancement of several compo-nents of the cholinergic system in the brain seems to berequired rather than changes in the activity of one of thecholinergic enzymes, which were seen in the reference groupfollowing the conventional symptomatic therapy with ChEIs.
This is further justified by another observation in thereference group. Namely, the responders in the referenceChEI group were also those who show decreased AChE

A. Karami et al. / Alzheimer’s & Dementia - (2015) 1-13 11
activity but kept their ChAT levels unchanged, which plau-sibly means marginal decline in ACh levels. In contrast,the nonresponders in this reference group exhibited reduc-tion in the levels of both enzymes, which might substantiallydiminish ACh signaling.
Alternatively, these observations may indicate that thenonresponsiveness to AD therapeutic may be caused by areduced capacity to increase the expression of ChAT dueto extensive loss of cholinergic cells (both neurons andcholinergic astrocytes), or by a malfunctioned cholinergicanti-inflammatory pathway, or both.
Nonetheless, once again taking into account that thecholinergic system is affected early in major dementia disor-ders with profound Ab pathology, such as AD [1] and Lewybody disease [2], the interrelated pattern of the associationsbetween Ab, tau, ChAT, and nicotinic ACh receptors furthersuggests that CSF ChAT activity may constitute a new func-tional biomarker of the brain, particularly of the overall sta-tus of cholinergic signaling in the brain. This warrantsfurther investigation in a much larger study population.
This study has several limitations. The EC-NGF therapy isa highly invasive procedure and it is still at its early investiga-tional stage, both posing heavy regulatory, ethical, andeconomical demands on the investigators. This explains thesmall number of patients included in this study, which inturn necessitates due caution in the interpretation of thedata, in particular regarding the classification of the patientsinto responders and nonresponders. As a partial remedy tothe obviously inapplicable inclusion of a placebo controlgroup for such an invasive procedure, we included a referenceAD patients’ group, who like the AD patients in the EC-NGFgroup were stably on long-term treatment with reversibleChEIs. Furthermore, MRI data analysis, addressing the brainatrophy among responders and nonresponders of EC-NGFpatients in comparison with a matched group from ADNIdatabase shows that the NGF responders had actually morebrain atrophy at baseline compared with both NGF nonre-sponders and the ADNI reference groups [32]. Yet, the 12-month trajectory of changes in the brain was similar to theADNI responder group. In other words, the NGF respondersmost likely started the treatment at a more severe stage ofbrain atrophy, yet responded well to the NGF therapy.
Here, we did a similar analysis but used trajectories ofchanges in MMSE test scores and the ratio of ChAT toAChE activities in CSF (as an index of ACh homeostasis) be-tween a MMSE-matched subgroup of the ChEI-referencegroup and the NGF group (Supplementary Fig. 2). This anal-ysis confirmed a correct assignment of the patients into re-sponders/nonresponders groups because the nonrespondersin both NGF and the ChEI-reference groups show identicaltrajectory in MMSE test (Supplementary Fig. 2A). This tra-jectory clearly differs from the NGF-responder and theChEI-responder group. The trajectory of the ratio of ChATto AChE of the NGF responder group is also clearly differentfrom the ChEI-responders, and from the NGF nonresponders(Supplementary Fig. 2B), indicating that balanced changes in
ChATand AChE (and ACh homeostasis) is one important in-dicator of responsiveness to NGF therapy (SupplementaryFig. 2B). Another argument for a NGF-related effect is alsothat after the NGF treatment in the six patients stopped (after12 months) the cognitive improvement in the respondersceased and the cognitive decline rate became similar to thenonresponders [32]. Nonetheless, it should be emphasizedthat the observations among the reference group should be in-terpreted with cautions because possibility of changes, pro-voked by the invasive nature of surgical implantationcannot be controlled for by this reference group.
Another limitation is that no corrections formultiple com-parisons were done due to the exploratory nature of the study.However, we weighted the overall pattern of observationsrather than isolated findings. As another cautionary step,we performed laboratory analyses concerning the cholin-ergic biomarkers in a completely blinded manner with mini-mal general information about the study layout and design. Athird measure of objectivity was achieved by a retrospectiveanalysis of the data, where we first defined the clinical out-comes of the treatment and then looked back to the changesthat occurred in the CSF levels of the cholinergic biomarkers.In addition, the careful inclusion of twowell-established par-aclinical in vivo brain PET measures, and the MRI volu-metric and cortical thickness analyses, provided support tothe clinical assessments and validity of the observations.Finally, the study had a repeated measure design makingthe patients their own controls.
Another limitation is that due to the predefined length ofthe EC-NGF implant therapy, there was no possibility todetermine the in vivo level of NGF release in the brain ofthe AD patients. Thus, as it is discussed in the first reportof the EC-NGF study [16] we could not determine the dura-tion of EC-cell survival, or the actual NGF release in vivo inthe brain of the patients. As a surrogate of the in vivo levelsof NGF, we performed measurements of NGF in both CSFand serum from baseline and after 3 and 12 months of EC-NGF treatment. However, the levels of NGF in these sampleswere below the lowest detection level of the assay that wasemployed (w31 pg/ml). Thereby no direct correlations be-tween changes in the CSF cholinergic markers and NGFcould be determined.
In summary, we showed here for the first time the positiveimpact of NGF implant therapy on levels of the cholinergicsignalling markers, ChAT and AChE in relation to the pa-tients’ cognitive tests scores. We found that a subgroup ofthe NGF-implant treated AD patients showed increases inCSF ChAT activity, which coincided with the best cognitiveperformance, highest in vivo cerebral glucose utilization andmost nicotinic binding sites assessed by PET, least corticalatrophy assessed by MRI. These patients remained alsomost stable in cognition long after the removal of the EC-NGF implants. This is the first study that provides insightabout the potential importance of monitoring the changesof the newly recognized soluble ChAT in human CSF as atherapeutic biomarker for AD.

A. Karami et al. / Alzheimer’s & Dementia - (2015) 1-1312
Acknowledgments
The authors wish to acknowledge the excellent assistant ofresearch nurse, Ann-Christine Tysen-B€ackstr€om. This studywas supported by grants from the Regional agreement onmedical training and clinical research (ALF) between Stock-holm County Council and the Karolinska Institute, the Stra-tegic Research Program in Neuroscience at KarolinskaInstitutet, the Swedish Research Council (project 05817),the Swedish Alzheimer Foundation, Gustaf V and QueenVictorias Freemason foundation, the Swedish Brain PowerConsortium, Loo &Hans Osterman Foundation; KI Founda-tions; Olle Engkvist Byggm€astare Foundation;�Ake WibergsFoundation; �Ahl�en-Foundation (�Ahl�en-stiftelsen); Gunvorand Josef An�ers Foundation; Magnus Bergvalls Foundation;Demens Foundation (Demensfonden); Gun and BertilStohnes Foundation; Ragnhild & Einar Lundstr€oms Founda-tion; Foundation for Sigurd & Elsa Goljes Memory; and OddFellow Foundation.
Supplementary data
Supplementary data related to this article can be found athttp://dx.doi.org/10.1016/j.jalz.2014.11.008.
RESEARCH IN CONTEXT
1. Systematic review: Literature were reviewed usingPubMed search. Reference lists of the assessed liter-ature were screened further for related papers.Despite having a well-established diagnostic value,the current cerebrospinal fluid (CSF) biomarkers ofAlzheimer’s disease (AD) show very limited poten-tial as therapeutic indicator. No publications werefound on the recently discovered CSF cholinergicbiomarker, choline acetyltransferase (ChAT) as apotential therapeutic indicator.
2. Interpretation: The analysis of CSF ChAT activity ina unique 12-month pilot study of encapsulated NGFreleasing cell (EC-NGF) brain implants, togetherwith sets of various cognitive measures, the in vivobrain positron emission tomography (glucose utiliza-tion and nicotinic binding sites) and morphometricmagnetic resonance imaging assessments revealeda clear pattern, suggestive of disease modifying ef-fect of the EC-NGF treatment strategy directed onreviving the cholinergic signaling in the brain, andmonitoring CSF ChAT activity as a promising ther-apeutic biomarker.
3. Future directions: Future research on utilizing EC-NGF therapy and ChAT as the highly desiredbiomarker in larger ADpatients’ cohort arewarranted.
References
[1] Davies P, Maloney AJ. Selective loss of central cholinergic neurons in
Alzheimer’s disease. Lancet 1976;2:1403.
[2] Bohnen NI, Kaufer DI, Ivanco LS, Lopresti B, Koeppe RA, Davis JG,
et al. Cortical cholinergic function is more severely affected in parkin-
sonian dementia than in Alzheimer disease: an in vivo positron emis-
sion tomographic study. Arch Neurol 2003;60:1745–8.
[3] Pearson R, Gatter K, Powell T. The cortical relationships of certain
basal ganglia and the cholinergic basal forebrain nuclei. Brain Res
1983;261:327–30.
[4] Seiler M, Schwab ME. Specific retrograde transport of nerve growth
factor (NGF) from neocortex to nucleus basalis in the rat. Brain Res
1984;300:33–9.
[5] Salehi A, Delcroix JD, Swaab D. Alzheimer’s disease and NGF
signaling. J Neural Transm 2004;111:323–45.
[6] Olson L, B€ackman L, Ebendal T, Eriksdotter-J€onhagen M, Hoffer B,
Humpel C, et al. Role of growth factors in degeneration and regener-
ation in the central nervous system; clinical experiences with NGF in
Parkinson’s and Alzheimer’s diseases. J Neurol 1994;242:12–5.
[7] Fahnestock M, Michalski B, Xu B, Coughlin MD. The precursor pro-
nerve growth factor is the predominant form of nerve growth factor in
brain and is increased in Alzheimer’s disease.Mol Cell Neurosci 2001;
18:210–20.
[8] Williams BJ, Eriksdotter-Jonhagen M, Granholm AC. Nerve growth
factor in treatment and pathogenesis of Alzheimer’s disease. Prog
Neurobiol 2006;80:114–28.
[9] Mufson EJ, Counts SE, Perez SE, Ginsberg SD. Cholinergic system
during the progression of Alzheimer’s disease: therapeutic implica-
tions. Expert Rev Neurother 2008;8:1703-18.
[10] Mufson EJ, Conner JM, Kordower JH. Nerve growth factor in Alz-
heimer’s disease: defective retrograde transport to nucleus basalis.
Neuroreport 1995;6:1063–6.
[11] MufsonEJ, IkonomovicMD, Styren SD,Counts SE,Wuu J, Leurgans S,
et al. Preservation of brain nerve growth factor in mild cognitive impair-
ment and Alzheimer disease. Arch Neurol 2003;60:1143–8.
[12] Salehi A, Verhaagen J, Dijkhuizen P, Swaab D. Co-localization of
high-affinity neurotrophin receptors in nucleus basalis ofMeynert neu-
rons and their differential reduction in Alzheimer’s disease. Neurosci-
ence 1996;75:373–87.
[13] Cuello AC, Bruno MA, Allard S, Leon W, Iulita MF. Cholinergic
involvement in Alzheimer’s disease. A link with NGF maturation
and degradation. J Mol Neurosci 2010;40:230–5.
[14] Capsoni S, Giannotta S, Cattaneo A. Nerve growth factor and galant-
amine ameliorate early signs of neurodegeneration in anti-nerve
growth factor mice. Proc Natl Acad Sci U S A 2002;99:12432–7.
[15] Wahlberg LU, Lind G, Almqvist PM, Kusk P, Tornoe J, Juliusson B,
et al. Targeted delivery of nerve growth factor via encapsulated cell
biodelivery in Alzheimer disease: a technology platform for restor-
ative neurosurgery. J Neurosurg 2012;117:340–7.
[16] Eriksdotter-Jonhagen M, Linderoth B, Lind G, Aladellie L,
Almkvist O, AndreasenN, et al. Encapsulated cell biodelivery of nerve
growth factor to the basal forebrain in patients with Alzheimer’s dis-
ease. Dement Geriatr Cogn Disord 2012;33:18–28.
[17] Vijayaraghavan S, Karami A, Aeinehband S, Behbahani H, Grandien A,
Nilsson B, et al. Regulated extracellular choline acetyltransferase activ-
ity—the plausible missing link of the distant action of acetylcholine in
the cholinergic anti-inflammatory pathway. PLoS One 2013;8:e65936.
[18] Darreh-Shori T, Kadir A, Almkvist O, Grut M, Wall A, Blomquist G,
et al. Inhibition of acetylcholinesterase in CSF versus brain assessed
by 11C-PMP PET in AD patients treated with galantamine. Neurobiol
Aging 2008;29:168–84.
[19] Olsson A, Vanderstichele H, Andreasen N, De Meyer G, Wallin A,
Holmberg B, et al. Simultaneous measurement of {beta}-amyloid
(1-42), total tau, and phosphorylated tau (Thr181) in cerebrospinal
fluid by the xMAP technology. Clin Chem 2005;51:336–45.

A. Karami et al. / Alzheimer’s & Dementia - (2015) 1-13 13
[20] Lundqvist H, Nordberg A, Hartvig P, L�angstr€omB. (S)-(-)-[11C] nico-
tine binding assessed by PET: a dual tracer model evaluated in the rhe-
sus monkey brain. Alzheimer Dis Assoc Disord 1998;12:238–46.
[21] Nordberg A, Lundqvist H, Hartvig P, Lilja A, L�angstr€om B. Kinetic
analysis of regional (s)(-) 11c-nicotine binding in normal and Alz-
heimer brains in vivo assessment using positron emission tomography.
Alzheimer Dis Assoc Disord 1995;9:21–7.
[22] Patlak CS, Blasberg RG, Fenstermacher JD. Graphical evaluation of
blood-to-brain transfer constants from multiple-time uptake data. J
Cereb Blood Flow Metab 1983;3:1–7.
[23] Kadir A, Darreh-Shori T, Almkvist O, Wall A, Langstrom B,
Nordberg A. Changes in brain 11C-nicotine binding sites in patients
with mild Alzheimer’s disease following rivastigmine treatment as as-
sessed by PET. Psychopharmacology (Berl) 2007;191:1005–14.
[24] Gjedde A. Calculation of cerebral glucose phosphorylation from brain
uptake of glucose analogs in vivo: a re-examination. Brain Res 1982;
257:237–74.
[25] Fischl B, Salat DH, Busa E, Albert M, Dieterich M, Haselgrove C,
et al. Whole brain segmentation: automated labeling of neuroanatom-
ical structures in the human brain. Neuron 2002;33:341–55.
[26] Fischl B, Van Der Kouwe A, Destrieux C, Halgren E, S�egonne F,
Salat DH, et al. Automatically parcellating the human cerebral cortex.
Cereb Cortex 2004;14:11–22.
[27] Westman E, Aguilar C, Muehlboeck JS, Simmons A. Regional mag-
netic resonance imaging measures for multivariate analysis in Alz-
heimer’s disease and mild cognitive impairment. Brain Topogr 2013;
26:9–23.
[28] Folstein MF, Folstein SE, McHugh PR. “Mini-mental state”: a prac-
tical method for grading the cognitive state of patients for the clinician.
J Psychiatr Res 1975;12:189–98.
[29] Mohs RC, Knopman D, Petersen RC, Ferris SH, Ernesto C,
Grundman M, et al. Development of cognitive instruments for use in
clinical trials of antidementia drugs: additions to the Alzheimer’s Dis-
ease Assessment Scale that broaden its scope. Alzheimer Dis Assoc
Disord 1997;11:S13–21.
[30] Han L, ColeM, Bellavance F, McCusker J, Primeau F. Tracking cogni-
tive decline in Alzheimer’s disease using the mini-mental state exam-
ination: a meta-analysis. Int Psychogeriatr 2000;12:231–47.
[31] Lopez OL, Becker JT,Wisniewski S, Saxton J, Kaufer DI, DeKosky ST.
Cholinesterase inhibitor treatment alters the natural history of Alz-
heimer’s disease. J Neurol Neurosurg Psychiatry 2002;72:310–4.
[32] Ferreira D, Westman E, Eyjolfsdottir H, Almqvist P, Lind G,
Linderoth B, et al. Brain changes in Alzheimer’s disease patients
with implanted encapsulated cells releasing nerve growth factor. JAlz-
heimers Dis 2015;43:1059–72.
[33] Dobransky T, Rylett RJ. A model for dynamic regulation of choline
acetyltransferase by phosphorylation. J Neurochem 2005;
95:305–13.
[34] Nordberg A, Darreh-Shori T, Peskind E, Soininen H, Mousavi M,
Eagle G, et al. Different cholinesterase inhibitor effects on CSF cholin-
esterases in Alzheimer patients. Curr Alzheimer Res 2009;6:4–14.
[35] Darreh-Shori T, Brimijoin S, Kadir A, Almkvist O, Nordberg A. Dif-
ferential CSF butyrylcholinesterase levels in Alzheimer’s disease pa-
tients with the ApoE [epsilon] 4 allele, in relation to cognitive
function and cerebral glucose metabolism. Neurobiol Dis 2006;
24:326–33.
[36] Nordberg A, Svensson AL. Cholinesterase inhibitors in the treatment
of Alzheimers disease: a comparison of tolerability and pharmacology.
Drug Saf 1998;19:465–80.
[37] Darreh-Shori T, Meurling L, Pettersson T, Hugosson K, Hellstr€om-
Lindahl E, Andreasen N, et al. Changes in the activity and protein
levels of CSF acetylcholinesterases in relation to cognitive function
of patients with mild Alzheimer’s disease following chronic donepezil
treatment. J Neural Transm 2006;113:1791–801.
[38] PERRY EK, Perry R, Blessed G, Tomlinson B. Changes in brain cho-
linesterases in senile dementia of Alzheimer type. Neuropathol Appl
Neurobiol 1978;4:273–7.
[39] Rinne J, Kaasinen V, J€arvenp€a€a T, N�agren K, Roivainen A, Yu M, et al.
Brain acetylcholinesterase activity inmild cognitive impairment and early
Alzheimer’s disease. J Neurol Neurosurg Psychiatry 2003;74:113–5.
[40] Kuhl DE, Koeppe RA, Fessler JA, Minoshima S, Ackermann RJ,
Carey JE, et al. In vivo mapping of cholinergic neurons in the human
brain using SPECT and IBVM. J Nucl Med 1994;35:405–10.
[41] IyoM, Namba H, Fukushi K, Shinotoh H, Nagatsuka S, Suhara T, et al.
Measurement of acetylcholinesterase by positron emission tomogra-
phy in the brains of healthy controls and patients with Alzheimer’s dis-
ease. Lancet 1997;349:1805–9.
[42] Herholz K, Bauer B, Wienhard K, Kracht L, Mielke R, Lenz O, et al.
In-vivo measurements of regional acetylcholine esterase activity in
degenerative dementia: comparison with blood flow and glucose meta-
bolism. J Neural Transm 2000;107:1457–68.
[43] Soininen H, Halonen T, Riekkinen P. Acetylcholinesterase activities in
cerebrospinal fluid of patients with senile dementia of Alzheimer type.
Acta Neurol Scand 1981;64:217–24.
[44] Appleyard M, Smith A, Berman P, Wilcock G, Esiri M, Neary D, et al.
Cholinesterase activities in cerebrospinal fluid of patients with senile
dementia of Alzheimer type. Brain 1987;110:1309–22.
[45] Schwab M, Otten U, Agid Y, Thoenen H. Nerve growth factor (NGF)
in the rat CNS: absence of specific retrograde axonal transport and
tyrosine hydroxylase induction in locus coeruleus and substantia nigra.
Brain Res 1979;168:473–83.
[46] GnahnH, Hefti F, Heumann R, SchwabM, Thoenen H. NGF-mediated
increase of choline acetyltransferase (ChAT) in the neonatal rat fore-
brain: evidence for a physiological role of NGF in the brain? Brain
Res 1983;285:45–52.
[47] Honegger P, Lenoir D. Nerve growth factor (NGF) stimulation of
cholinergic telencephalic neurons in aggregating cell cultures. Brain
Res 1982;255:229–38.
[48] Mobley WC, Rutkowski JL, Tennekoon GI, Gemski J, Buchanan K,
Johnston MV. Nerve growth factor increases choline acetyltransferase
activity in developing basal forebrain neurons. Mol Brain Res 1986;
1:53–62.
[49] Tuszynski MH, Thal L, Pay M, Salmon DP. A phase 1 clinical trial of
nerve growth factor gene therapy for Alzheimer disease. Nat Med
2005;11:551–5.
[50] Olson L, Nordberg A, Von Holst H, B€ackman L, Ebendal T,
Alafuzoff I, et al. Nerve growth factor affects 11 C-nicotine binding,
blood flow, EEG, and verbal episodic memory in an Alzheimer pa-
tient (case report). J Neural Transm Park Dis Dement Sect 1992;
4:79–95.
[51] Eriksdotter J€onhagen M, Nordberg A, Amberla K, B€ackman L,
Ebendal T,Meyerson B, et al. Intracerebroventricular infusion of nerve
growth factor in three patients with Alzheimer’s disease. Dement Ger-
iatr Cogn Disord 1998;9:246–57.
[52] Allen S, MacGowan S, Treanor J, Feeney R, Wilcock G, Dawbarn D.
Normal [beta]-NGF content in Alzheimer’s disease cerebral cortex and
hippocampus. Neurosci Lett 1991;131:135–9.
[53] Cuello A, Bruno A, Bell K. NGF-cholinergic dependency in brain ag-
ing, MCI and Alzheimers disease. Curr Alzheimer Res 2007;4:351–8.
[54] Olson L. NGF and the treatment of Alzheimer’s disease. Exp Neurol
1993;124:5–15.
[55] Oderfeld-Nowak B, Bacia A. Expression of astroglial nerve growth
factor in damaged brain. Acta Neurobiol Exp (Wars) 1994;54:73–80.
[56] Friedman WJ, Thakur S, Seidman L, Rabson AB. Regulation of nerve
growth factor mRNA by interleukin-1 in rat hippocampal astrocytes is
mediated by NFkB. J Biol Chem 1996;271:31115–20.
[57] Jonakait GM, Pratt L, Acevedo G, Ni L. Microglial regulation of
cholinergic differentiation in the basal forebrain. Dev Neurobiol
2012;72:857–64.
[58] Darreh-Shori T, Vijayaraghavan S, Aeinehband S, Piehl F,
Lindblom RP, Nilsson B, et al. Functional variability in butyrylcholi-
nesterase activity regulates intrathecal cytokine and astroglial
biomarker profiles in patients with Alzheimer’s disease. Neurobiol
Aging 2013;34:2465–81.