Fruit juice beverages and juice concentrates nutritionally ...

A SIK-project report
November 2007
Changed Supply Chain Disruption Risks
through Installation of a Pasteurizer - the case of Brämhults Juice AB
by Ulf Paulsson* and Carl-Henric Nilsson**
*) Assistant Professor. PhD. Lund University. School of Economics and Management. Dept. of Business Administration. P.O. Box 7080. SE-221 07 Lund. Sweden. E-mail: [email protected]. Tel/Fax: +46 46 307761. Mobil: +46 70 673 13 22. **) Associate Professor. PhD. Lund University. School of Economics and Management. Dept. of Business Administration. P.O. Box 7080. SE-221 07 Lund. Sweden. E-mail: [email protected]. Tel: +46 46 222 3720.Fax: +46 46 222 4437. Mobil: +46 73 33 20 200.
1
ABSTRACT
Brämhults Juice AB is a Swedish company producing fresh juice for the Scandinavian market. Fresh juice is rich in taste but has also limited durability and has to be treated with special care through the whole supply chain. Not only will the quality of the product be affected if mistreated but there are also contamination risks meaning that people actually could get sick, although the risk is very small. There are also other kinds of flow-related risks like single sourced packages. To reduce the risk of spoiled juice Brämhults installed during the spring 2005 a pasteurizer in their production process. An interesting question is how this affected the risks in the supply chain flow.
One of the authors has earlier in another study (Paulsson 2007) developed a model, called the DRISC (Disruption Risks In Supply Chains) model for the structuring, evaluation and handling of risks related to disruptions in the product flow in the supply chain. The DRISC model covers, seen from the angle of an individual (focal) company in the supply chain, all product flow-related disruption risks in the total supply chain from natural resources to the delivered final product and makes it possible to classify them into 15 different risk exposure boxes, of which 3 boxes with “known result impact” and 12 with “expected result impact”, and also to summarize them to a figure for the total negative result impact. The risk analysis phase of the model is in the project applied on Brämhults juice before and after the installation of the pasteurizer in order to see the effects on the risk "picture".
The analysis showed that there was an increase in two of the three “known result impact boxes” and a decrease in the third one. There was also a decrease in eight of the “expected result impact boxes” and the remaining four were unchanged. Especially interesting is that the risks linked to market confidence which before were high or very high now all three were medium. There has also been a change towards comparatively more known result impacts and less expected result impacts.
The investment in the pasteurizer was about 2 million SEK and there was a limited increase in the operating costs with 800.000 SEK annually. Since the costs for returns and withdrawals caused by spoiled juice, which before the pasteurizer were about 6 million SEK annually, dropped with about 90 % the investment has had a pay-back time of about 5 months. But the pasteurizer also prolonged durability from 10 to 18 days thereby making it possible for Brämhults to change from distribution by the company’s own drivers and lorries to all the different shops over to transporting to a limited number of DCs (distribution centres) belonging to different food chains. If we split the pasteurizer investment 50/50 on risk and on distribution we will get a pay-back time concerning the risk part of the investment of only 2 to 3 months indicating that it was a very profitable investment. Included in the costs for returns and withdrawals are further only the direct, immediate costs. If also the negative effects of disruptions on future sale are considered the pay-back time will be even shorter. Key Words: Application, Business continuity management, Case study, Conceptual model, Contamination, Disruptions, Disturbances, Food companies, Fresh juice, Pasteurize, Risk estimation, Resilience, Risk, Risk-handling, Risk management, Risk structuring, Pay-back time, Supply chain risk, Supply chain risk management, Vulnerability.
2
Foreword This report has been produced within the SIK project ”Modellering av spårbarhet och riskanalys för säker och hållbar livsmedelsproduktion” (Modelling of traceability and risk analysis for safe and sustainable food production). Many thanks to all the participants in the SIK project for interesting and fruitful discussions. Our gratitude also to VINNOVA (The Swedish Governmental Agency for Innovation Systems) which via SIK (The Swedish Institute for Food and Biotechnology) has provided financial support. We also owe great gratitude to people in Brämhults Juice AB, especially Ulf Tylestrand, for their willingness to share knowledge, insights and information. The work with this report has by one of the authors – Ulf Paulsson – been conducted parallel with the writing of a thesis. The theses was printed in august 2007 – a couple of weeks before the “printing” of this final report. Lund, November 2007 Ulf Paulsson Carl-Henric Nilsson
3

Contents
1. Introduction .......................................................................................................................6
1.1. Background ................................................................................................................6
1.2. Objectives ...................................................................................................................8
1.3. Report overview .........................................................................................................9
2. Presenting the DRISC model...........................................................................................10
2.1. Some theoretical starting points ...............................................................................10
2.2. The DRISC model on the top level ..........................................................................13
2.3. A closer look at two of the basic model elements ....................................................14
3. Brämhults Juice AB: Some basic facts............................................................................20
3.1. The company ............................................................................................................20
3.2. The products .............................................................................................................20
3.3. The product flow ......................................................................................................21
4. Brämhults before the pasteurizer.....................................................................................23
4.1. System border specification .....................................................................................23
4.2. The identification of hazards....................................................................................23
4.3. Risk exposure estimation..........................................................................................27
5. Brämhults after the pasteurizer........................................................................................31
5.1. Installation of a Pasteurizer ......................................................................................31
5.2. Changes in risk estimation .......................................................................................31
5.3. Summing up and commenting on the estimations....................................................33
5.4. Changes linked to supply chain risk essentials model .............................................34
5.5. Consequences outside the risk area ..........................................................................35
6. Results .............................................................................................................................36
6.1. The objectives of the study.......................................................................................36
6.2. Risk "picture" before and after the pasteurizer ........................................................36
6.3. Suitable risk model adjustments...............................................................................37
6.4. Further possible risk management improvements....................................................37
6.5. Some end comments.................................................................................................38
4

Figures and tables:
Figure Table Contents Page
Chapter 1
1.1 Report overview 9 Chapter 2
2.1 Disruption risk exposure and risk handling 12 2.2 Illustration of a scenario with a critical event in the DRISC model
setting 13
2.3 The DRISC model - top level 14 2.4 Framework for description and analysis model 14 2.5 Supply chain network structure model 15 2.6 Supply chain essentials model 15
2.1 Supply chain disruption source and handling way structure 16 2.7 Risk management process model 16 2.8 System border model 17 2.9 Hazard identification model 18
2.2 Risk exposure; Box structure 19 2.10 Risk exposure estimation model 19
Chapter 3 3.1 Brämhults; Production flow with internal activities 22
Chapter 4 4.1 Brämhults; Production flow and hazards 24
4.1 Brämhults; Risk exposure levels BEFORE the pasteurizer 30 Chapter 5
5.1 Brämhults; Risk exposure levels AFTER the pasteurizer 33
5

1. INTRODUCTION 1.1. BACKGROUND Empirical background A number of severe company events caused by supply chain disruptions have occurred during recent years. One example is Ericsson and the Albuquerque event back in 20001 2. A minor fire in a production cell, a so-called clean room, at a sub-supplier's plant in Albuquerque, New Mexico (USA), caused by a lightning fire affecting the delivery of electricity for about ten minutes, made the production room unclean and destroyed the production equipment. From a plant perspective the impact was low, but for Ericsson it was huge because the needed component – a radio frequency chip – was single sourced. Even after 6 months the production of chips was only 50 % of what it should have been. Ericsson lost many months of mobile phone production. The accident also had an impact on Ericsson's decision to withdraw from the mobile phone terminal business. Another example is Nilsson (false name), a Swedish steel producing company selling special steel qualities3. Production is complex, includes handling of dangerous material, and has long lead times. JIT-principles were not used except for a few input areas like hydrogen gas, where there was a constant inbound flow. Hydrogen gas, which was single sourced, was bought from a supplier who had built a hydrogen plant just a few hundred meters away from the factory, delivering the gas in a special pipeline. A mistake by some hired craftsmen doing maintenance work at the hydrogen supplier’s plant caused an explosion in the hydrogen factory and destroyed it completely. Production at Nilsson had to stop totally for a month, and it took several months before it was back to normal again. Their most important customer chose to end the business relation even though Nilsson, with the help of their inventory of finished goods, managed to maintain deliveries. Other deliveries were severely delayed. Sale and market shares were lost. In this study the empirical focus is on Brämhults Juice AB. Brämhults Juice AB is a Swedish company producing fresh juice for the Scandinavian market. Fresh juice is rich in taste but has also limited durability and has to be treated with special care through the whole supply chain. Not only will the quality of the product be affected if mistreated but there are also contamination risks meaning that people actually could get sick, although the risk is very small. There are also other flow-related risks. Brämhults has therefore paid increasing attention to supply chain risk issues, an interest that they share with many other companies today. For different reasons among which one was the wish to reduce the contamination risks Brämhults installed during the spring 2005 a pasteurizer in their production process. An interesting question is how this affected the risks in the supply chain flow. Brämhults are also
1 Sheffi, Yossi (2005) The Resilient Enterprise. The MIT press. 2 Norrman, A. & Jansson, U. (2004) “Ericsson’s proactive supply chain risk management approach after the Albuquerque accident”. International journal of physical distribution & logistics management Volume 34, number 5. 3 Artebrant, Jönsson & Nordhemmer (2004) Risks and risk management in the supply chain flow – a case study based on some of Marsh’s clients. Master thesis. Lund Institute of Technology.
6
looking for ideas about other possible improvements in the management of the supply chain flow related disruption risks4 5. Theoretical background Risk is defined by The Royal Society “as the probability that a particular adverse event occurs during a stated period of time, or results from a particular challenge”6. To be able to come to grip with risks, risk management is needed. The same source defines risk management as “the process whereby decisions are made to accept a known or assessed risk and/or the implementation of actions to reduce the consequences or probability of occurrence”7. Formulated in another way: “Risk management means taking deliberate action to shift the odds in your favour” 8. Company risks of different kinds have received increasing attention during the last decade both in media9 and as a research topic. In some countries, new legislation has been introduced making it compulsory to include risk assessment information in the annual report. This study focuses on the supply chain flow risks where risk is defined as an event with negative economic consequences. The chain of transport and storage activities from first supplier to end customer has changed character over the years, and gradually developed from a step-wise chain via a logistical chain into a supply chain10. Competition is no longer between different individual companies but between different supply chains offering similar products to an end customer11. Consequently, the focus ought to be on the supply chain and not on the individual company. The problem is that the supply chain does not exist from a legal point of view and hence the supply chain cannot take actions – only the individual companies in the chain can act. With competition changing from companies to supply chains, it has become very important for the individual company to be a "member" of a competitive supply chain that gives the company a fair share of its surplus. That will not happen by it. It has therefore become essential for the individual company to "create its own" supply chain alternative, i.e. to find out what consequences different design alternatives have for the competitiveness of the supply chain and the company, and to actively promote supply chain design alternatives with high competitiveness. So far, short-term operational efficiency issues seem to have dominated this design work. But every supply chain design alternative also includes risks of different kinds, and the supply
4 Ohlsson, D. & Svensson, S. (2005) DOSS – Värderingsmodell för riskerna vid tillverkning av flytande livsmedel. Master Thesis in Technology Management. Lund University. 5 www.bramhultsjuice.se. 2005-08-25. 6 Risk: Analysis, Perception and Management (1992). Report of a Royal Society Study Group. The Royal Society. London, p.2. 7 Risk: Analysis, Perception and Management (1992). Report of a Royal Society Study Group. The Royal Society. London, p.5. 8 Borge, Dan (2001) The book of risk. John Wiley & Sons Inc. New York, p.4. 9 Simons, Robert (1999) "How risky is your company?”. Harvard Business Review, May-June 1999. 10 Cooper M., Lambert, D. & Pagh, J (1997) ”Supply Chain Management: More Than a New Name for Logistics”. The International Journal of Logistics Management. Volume 8, Number 1. 11 Christopher, Martin (1998) Logistics and Supply Chain Management. 2nd ed. Financial Times/Pitman Publishing, p16.
7

chain tends to be increasingly vulnerable. Many firms that earlier realised that the biggest opportunities to increase their competitiveness did not lie in improving their internal efficiency but in supply chain design and integration are now realizing that the biggest risks to the company are not within the company itself but in its dependency on the supply chain. Disruptions in one link of the chain could easily spread to other links in the chain (domino effects). In some situations the negative economic consequences also tend to grow worse for each link, and we can here talk about escalating domino effects. In combination with often limited liability for the individual link, this means that companies further down the supply chain could actually be much more severely hit than the link where the initial disruption took place. A number of trends during the last decade have affected the supply chain risk situation. One is that the supply chain should be lean, another that it should be agile as well12 13. A third trend is outsourcing, resulting in more links in the chain. Single sourcing is still another trend. And of course globalisation. All these trends (and others as well) tend to make the supply chain more vulnerable. Christopher & Lee14, for instance, have pointed out that "Managing supply chains in today's competitive world is increasingly challenging". And the trends change customer demands as well, as e.g. Schwartz15 has underlined "/…/ in many cases, customers are demanding to see proof that a business is ready for trouble before they will award it a major contract or place a company within its supply chain of manufacturing”. Consequently, there is a need for models with the help of which risks related to disturbances or disruptions in the physical flow in a supply chain can be identified, structured, described and analysed. Such models are of interest to academia and to company management, employees, shareholders, local communities, and other stakeholders. One of the authors has earlier in another study developed a supply chain flow aggregated risk model – called the DRISC model – for the structuring, evaluation and handling of risks related to disruptions in the physical flow in the entire supply chain. The risk analysis phase in this model will here be applied on Brämhults Juice AB. 1.2. OBJECTIVES One objective of the study is to apply the risk analysis phase in a certain theoretical supply chain disruption risk model – called the DRISC model – on Brämhults Juice AB before and after the installation of a pasteurizer to get a view of how the “risk picture" was affected by the installation. A second objective is to get indications of suitable adjustments in the DRISC model.
12 Christopher, M. & Towill, D. (2000) “Supply chain migration from lean and functional to agile and customised”. Supply chain management: An International Journal, Vol. 5, No 4, pp.206-213, 2000. 13 Mason-Jones, R., Naylor, B. And Towill, D. (2000) “Engineering the leagile supply chain”. International Journal of Agile Management Systems. 2/1. 14 Christopher, M. & Lee, H. L. (2004) “Mitigating supply chain risk through improved confidence”. Article in International journal of physical distribution & logistics management Volume 34, number 5, 2004. 15 Schwartz, John (2003) “Disaster Plans Get New Scrutiny After Blackout”. New York Times, August 19, 2003.
8

And a third objective is to get ideas of possible further improvements in the management of the supply chain disruption risks in Brämhults Juice AB. 1.3. REPORT OVERVIEW
The DRISC model
Brämhults Juice AB
Application of the DRISC modelon Brämhults: Before and after
the installation of the pasteurizer
Theoretical results:Risk modeladjustments
Empirical results:- changes in risk pattern- ideas for possible risk
management improvements
Figure 1.1: Report overview
9

2. PRESENTING THE DRISC MODEL This chapter is based on a doctoral thesis16 which in its turn has been inspired by two different papers17 18, and a book chapter19. 2.1. SOME THEORETICAL STARTING POINTS A result-oriented perspective A result is that which someone or something, such as an organisation or a company, wants to reach. The result might be specified in many different ways/dimensions as e.g.:
• number of successful operations performed; • number of students examined; • shareholder value; and • business profit.
It is up to the user of the DRISC model to specify what kind of result dimension he or she wants to choose and thus what in the specific application is meant by result impact. Product flow focus There are a number of different flows in the supply chain, like product flow, information flow and financial flow. Our focus will be on the product flow, where product is defined as something one gets paid to deliver. It could be a physical product, a service or a mixture of both. Focal unit perspective The supply chain is looked upon from the point of view of an individual unit in the chain. That particular unit is called the focal unit and might be a single company, a group of companies, an organisation, a group of organisations, a working site, a legal unit or some other specified unit in the supply chain that the users of the DRISC model choose to select as their focal unit. Focal unit is thus defined as the individual unit in the supply chain from the perspective of which the supply chain flow risk issues are seen, interpreted and acted upon. Focal product perspective In many cases where the focal unit is producing more than one product, the focal unit is a “member” of several different supply chains where each supply chain is based on a certain product or product group. One has to be chosen. Focal product is thus defined as the individual product or product group that the focal unit chooses to study. So when we talk
16 Paulsson, Ulf (2007) "On managing disruption risks in the supply chain – the DRISC model". Doctoral thesis, chapter 8. 17 Paulsson, Ulf (2005a) "Developing a Supply Chain Flow Risk Model". Final paper to the NOFOMA 2005-conference. 18 Paulsson, Ulf (2005b) "Valuation of Supply Chain Flow Risks by Indexing". Work-in-progress paper to the NOFOMA 2005-conference. 19 Paulsson, Ulf (2004) Supply Chain Risk Management. Chapter 6 in Brindley: Supply Chain Risk: A Reader. Ashgate.
10
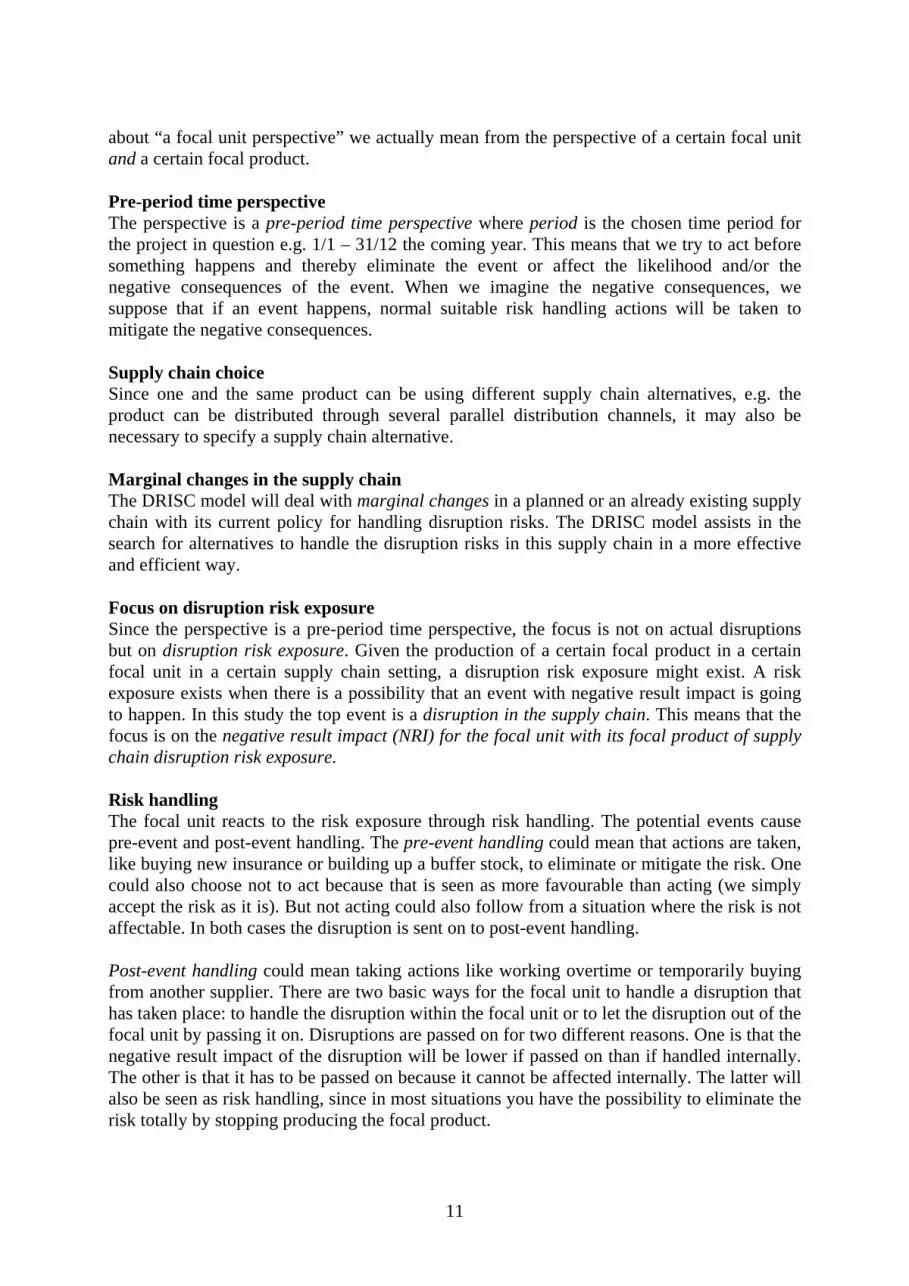
about “a focal unit perspective” we actually mean from the perspective of a certain focal unit and a certain focal product. Pre-period time perspective The perspective is a pre-period time perspective where period is the chosen time period for the project in question e.g. 1/1 – 31/12 the coming year. This means that we try to act before something happens and thereby eliminate the event or affect the likelihood and/or the negative consequences of the event. When we imagine the negative consequences, we suppose that if an event happens, normal suitable risk handling actions will be taken to mitigate the negative consequences. Supply chain choice Since one and the same product can be using different supply chain alternatives, e.g. the product can be distributed through several parallel distribution channels, it may also be necessary to specify a supply chain alternative. Marginal changes in the supply chain The DRISC model will deal with marginal changes in a planned or an already existing supply chain with its current policy for handling disruption risks. The DRISC model assists in the search for alternatives to handle the disruption risks in this supply chain in a more effective and efficient way. Focus on disruption risk exposure Since the perspective is a pre-period time perspective, the focus is not on actual disruptions but on disruption risk exposure. Given the production of a certain focal product in a certain focal unit in a certain supply chain setting, a disruption risk exposure might exist. A risk exposure exists when there is a possibility that an event with negative result impact is going to happen. In this study the top event is a disruption in the supply chain. This means that the focus is on the negative result impact (NRI) for the focal unit with its focal product of supply chain disruption risk exposure. Risk handling The focal unit reacts to the risk exposure through risk handling. The potential events cause pre-event and post-event handling. The pre-event handling could mean that actions are taken, like buying new insurance or building up a buffer stock, to eliminate or mitigate the risk. One could also choose not to act because that is seen as more favourable than acting (we simply accept the risk as it is). But not acting could also follow from a situation where the risk is not affectable. In both cases the disruption is sent on to post-event handling. Post-event handling could mean taking actions like working overtime or temporarily buying from another supplier. There are two basic ways for the focal unit to handle a disruption that has taken place: to handle the disruption within the focal unit or to let the disruption out of the focal unit by passing it on. Disruptions are passed on for two different reasons. One is that the negative result impact of the disruption will be lower if passed on than if handled internally. The other is that it has to be passed on because it cannot be affected internally. The latter will also be seen as risk handling, since in most situations you have the possibility to eliminate the risk totally by stopping producing the focal product.
11
Pre-event handling in the form of actions will be called preventive measures. Post-event handling in the form of actions will be called internally handled, and in the form of not acting passed on. There exist in other words three basic ways to handle risk exposure: preventive measures, internally handled and passed on.
Disruptionrisk
exposure
Acting
Post-eventhandling
ActingNot acting(Accept)
Pre-eventhandling
Not acting(Not affec-table)
Not acting(Accept)Not acting(Not affec-table)
Preventivemeasures
Passedon
Internallyhandled
Figure 2.1: Disruption risk exposure and risk handling In the individual situation one, two or all three ways of risk handling can be applied (risk handling mix). By making changes in the risk handling mix, the total negative result impact can be affected. Disruption risk exposure If the focal unit had not been subject to any disruption risk exposure in the supply chain flow, its estimated future result would have been of a certain size. But now since the company is exposed to certain disruption risks, the estimated future result is less favourable. The difference can be regarded as the total negative result impact from the disruption risk exposure. The focal unit wants to keep this difference as small as possible. Disruption risk definition The normal product flow creates a normal result. A negative impact is then a decrease in this normal result. The normal product flow in the supply chain includes frequent, small disruptions up to a certain level, because it is normal to have such minor disruptions. I can now, for the DRISC model, define negative consequence as a consequence of a disruption in the supply chain product flow that in comparison with the normal result created by the normal product flow has a negative result impact. Risk scenario description A risk scenario can basically be described as a chain of events starting with initial event and ending with end state. Between those one or more mid states could exist. In complex scenario situations there will probably be a number of mid states. Often we have a special interest in one of those mid states and that mid state will here be called “critical mid state”. As soon as we apply the risk scenario model on a certain context a number of specifications are necessary. We might need to specify initial event, critical mid state and end state. We might for instance only be interested in fires in private houses (Critical mid state) caused by short circuit in old electrical systems (Initial event) and our interest ends when the fire has been extinguished (End state).
12

In the DRISC model critical event is specified as “a supply chain product flow disruption which constitutes the first disruption in a risk scenario”. What characterises the “end state” also has to be defined, and the chosen definition is here; when we are “back to a stable flow again”. Consequently, there is a stable flow, something happens (initiating event) that starts a chain of events, including a critical event, that ends when we are back to a stable flow again.
Chain of events
Initiatingevent
First flow disruption(Critical event)
A stableflow again(End state)
…… ……
Events Events
Figure 2.2: Illustration of a scenario with a critical event in the DRISC model setting 2.2. THE DRISC MODEL ON THE TOP LEVEL The object of our interest is the potential disruptions risks in the supply chain product flow. These are the result of the supply chain itself and of how its risks are managed. Those two – the supply chain and the risk management process – are in constant interaction. The supply chain with its product flow creates risks. Some of those risks are handled in the risk management process by finding and implementing certain risk handling actions. Those actions change the supply chain in one way or another. A changed supply chain creates a new risk situation to which risk management might then react with new risk handling actions, and so on. These three basic elements – the supply chain, the risk management process and the potential disruptions risks in the supply chain product flow – and their interaction can be identified, described and analysed in a number of ways. It is, however, advisable to have certain fixed structures that govern how these three basic elements and their interaction are identified, described and analysed. Those fixed structures will be called the framework for description and analysis, which is the fourth basic element of the DRISC model. Changes in the supply chain (and, as a consequence, also changes in risks) can be internally generated within the supply chain but can also come from outside the supply chain – from its environment. Therefore the environment of the supply chain is included in the model as a fifth basic element. After we have been through all the different steps in the risk management process we need to ask ourselves if the risk situation now is “good enough” or not. If the answer is “no”, a new risk management process “round” is initiated.
13

Supply chain environment
Risk management process
Supply chainFram
ewor
k fo
r des
crip
tion/
anal
ysis
-sup
ply
chai
n ne
twor
k st
ruct
ure*
-sup
ply
chai
n ris
k es
sent
ials
*-d
isru
ptio
n so
urce
and
han
dlin
g w
ay s
truc
ture
*
Risk analysis* Risk evaluation* Risk reduction/control*
* = Including detailed model on at least one lower level
Good enough?NoYes
Potential disruption risks in the supply chain product flow
Figure 2.3: The DRISC model – top level (Level 1) 2.3. A CLOSER LOOK AT TWO OF THE BASIC MODEL ELEMENTS
Framework for description and analysis The framework for description and analysis consists of: supply chain network structure, supply chain risk essentials, and disruption source and handling way structure.
Framework for description and analysis
• Supply chain network structure• Supply chain risk essentials• Disruption source and handling
way structure
Figure 2.4: Framework for description and analysis model – Level 2
14

Supply chain network structure Seen from the perspective of the focal company, three different relevant supply chain parts – supply side, production and demand side – can be identified in a supply chain product flow going from natural resources to end market.
Supply side Production Demand side
Focalcomponents
Endproduct
Focalproduct
Nat
ural
reso
urce
s
Naturalresources
Supply chain product flow
FOCAL COMPANY
= Normal, planned product flow= Normal, planned product flow
End
mar
ket
Figure 2.5: Supply chain network structure model – Level 3 Supply chain risk essentials The supply chain risk essentials model identifies that in the supply chain which is of special significance from a disruption risk point of view. The model consists of six different supply chain risk essentials: product design, production process design, product flow design, product flow supporting systems, risk management systems and actions, and human resources.
SUPPLY CHAIN RISK ESSENTIALS
Productdesign
Productionprocessdesign
Product flowdesign:
Structureand volumes
Productflow
supportingsystems
Riskmanagement systems and
actions
Humanresources
Figure 2.6: Supply chain risk essentials model – Level 3 Supply chain disruption source and post-event handling way structure Earlier (figure 2.1) two different ways of post-event risk handling have been identified: internally handled, and passed on. But the consequences of a disruption can often spread over long times. Another aspect is that they can unfold over time from local to widespread. And finally the consequences can change character over time. It is therefore important to split up the consequences into sub-groups. Those aspects seem to be especially relevant for the passed on disruptions. It is therefore suitable to split up the market reactions on several periods of time. Taking the critical event (disruption) as the starting point, the following three periods of time are chosen; until back to
15
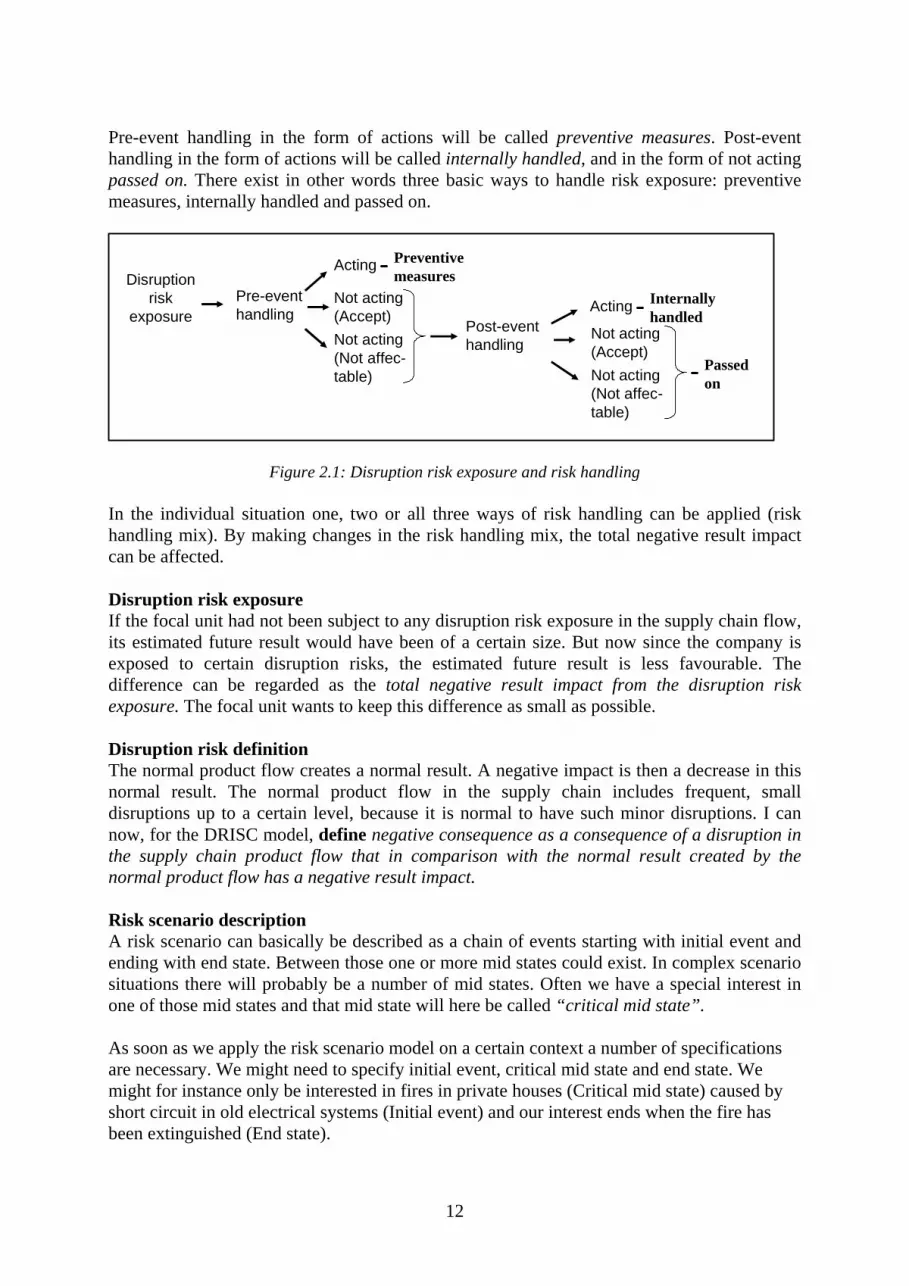
a stable flow, short run, and long run. Short run is also called market patience and another word for long run is market confidence. Consequently there are four ways of post-event (market patience), and passed on-long run (market confidence). Three different disruption sources can be identified depending in where the initiating event takes place: within the supply side, within the focal unit, and within demand side. There are thus twelve possible combinations of disruption sources and post-event handling ways, which give us a certain disruption source and post-event handling way structure.
Table 2.1: Supply chain disruption source and handling way structure – Level 3
Scen
ario
sst
ruct
ured
afte
r di
srup
tion
sour
ce
Post-event handlingstructured after way of handling
Within the focal unit
Within the demand side
Within the supply side
Pass
ed o
n –
long
ru
n
Pass
ed o
n –
shor
t ru
n
Inte
rnal
ly h
andl
ed
Pass
ed o
n –
until
ba
ck to
a s
tabl
e flo
w
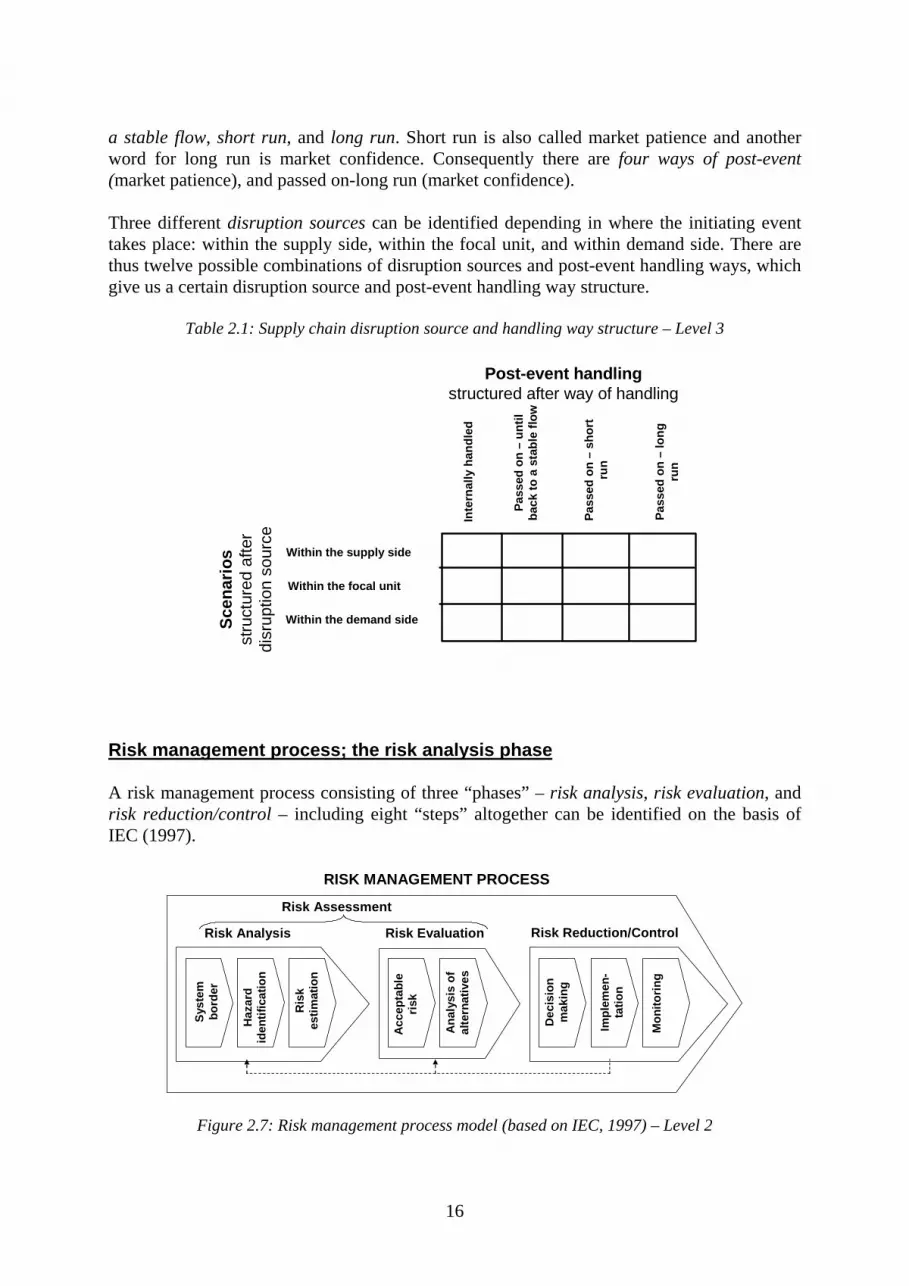
Risk management process; the risk analysis phase A risk management process consisting of three “phases” – risk analysis, risk evaluation, and risk reduction/control – including eight “steps” altogether can be identified on the basis of IEC (1997).
Syst
embo
rder
Haz
ard
iden
tific
atio
n
Ris
kes
timat
ion
Acc
epta
ble
risk
Ana
lysi
sof
alte
rnat
ives
Dec
isio
nm
akin
g
Impl
emen
-ta
tion
Mon
itorin
g
Risk Analysis Risk Reduction/ControlRisk Evaluation
RISK MANAGEMENT PROCESS
Risk Assessment
Figure 2.7: Risk management process model (based on IEC, 1997) – Level 2
16

Here our focus is only on the risk analysis phase. The risk analysis phase (Level 3) consists of the following three steps: system border, hazard identification and risk estimation. The latter is in the DRISC model more precisely expressed as risk exposure estimation. System border The first step when using the DRISC model is to decide on the setting, which means: decide who is the stake holder and who is judging, choose focal unit and focal product, decide projects goals, specify measure dimension for result impact, specify time period, ambition level and time horizon, and decide other specifications/limitations.
SYSTEM BORDER:The 1st step in the risk analysis phase
• Decide who is stake holder and who is judging
• Choose focal unit• Choose focal product• Decide project goals• Specify measure dimension
for result impact• Specify time period, ambition
level and time horizon• Decide other specifications/
limitations
System borderinformation
Figure 2.8: System border model – Level 4
Hazard identification The hazards are mapped within a structure that is a combination of two earlier presented models; the supply chain network model and the supply chain risk essentials model. The output from the model is information about potential vulnerability sources and about risk management activities.
17

Supp
ly s
ide
Prod
uctio
n
Dem
and
side
End
mar
ketSUPPLY CHAIN
NETWORKLINKS:SUPPLY
CHAIN RISKESSENTIALS:
Product design
Risk managementsystems and actions
Production processdesign
Product flow design:Structure and volumes
Product flowsupporting systems
HAZARD IDENTIFICATION:The 2nd step in the risk analysis phase
Map criticalities according to supply chainrisk essentials and network links
Potentialvulnerability
sources
Systemborder
information
Present risk management
activities
Nat
ural
res.
Human resources
Figure 2.9: Hazard identification model – Level 4 Risk exposure estimation The risk exposure estimation model consists of risk exposure box structure and estimation of the result impact. The output from the model is information about estimated result exposure. The risk exposure box structure is based on the disruption source and post-event handling way structure presented earlier (Table 2.1) complemented with pre-event handling. Each preventive measure can be linked to one or more of the same three disruption sources as the post-event handlings were. We will then get 3 new boxes making a total of 15 boxes. Acting in advance by taking preventive measures causes negative result impact. Those “costs” will be called “known result impact” since we know that they will occur. Acting after the disruption has happen also causes “costs”. Those costs will be called “expected result impact”, since we do not know if the disruption is going to occur or not. Finally if we sum up known negative result impact and expected negative result impact we will get the total negative result impact from the disruption risk exposure. In theory the complete result impact for each of the 15 risk exposure boxes can be estimated. They can then be summed up into a complete total negative result impact. In practice this is seldom done because it is practically impossible, or because such exact information is, from an action perspective, not necessary. A possibility is to use a set of risk levels. We will then acquire a rough estimate of the result impacts. This is a timesaving method, and if the aim is
18

to gain a quick overview of the risk situation in a supply chain, using risk levels is probably a practicable method.
Table 2.2: Risk exposure; Box structure – Level 5.
DISRUPTION SOURCE:
until back to a stable flow
in the short run (market patience)
in the long run (market confidence)
Initiating event within supply side AND EQUALS
Initiating event within focal unit AND EQUALS
Initiating event within demand side AND EQUALS
Total expected RI from internally handled
Total expected RI from passed on; Until back to a stable flow
Total expected RI from passed on; In the short run
Total expected RI from passed on; In the long run
TOTAL KNOWN NRI
AND EQUALS TOTAL NRI
Known NRI from
preventive measures
NRI FROM DISRUPTION
RISK EXPOSURE
TOTAL EXPECTED NRI
Expected OUTCOME structured after way of risk-handling:Expected RI from internally handled
disruptions
Expected RI from passed on disruptions upstream/downstream with includation of market reaction and considering time dimension
For the estimation of the result impact is the question of objectivity central. Objectivity is desirable but could be difficult to reach. In some situations, risks are well defined and we have accurate data for both consequences and likelihood. The calculated expected value of the risk in those situations can be said to be objective or reasonably objective. But there are also many situations where information is insufficient or lacking and we have to rely on subjective estimations. The estimations ought to made by experts either within the focal unit, such as risk managers, production managers and others within the company, or external experts, like risk consultants. Each estimation should be accompanied by motivations. The motivations can be as interesting as the estimation itself.
RISK EXPOSURE ESTIMATION:
The 3rd step in the risk analysis phase
Risk exposure box structure:• 3 boxes for known result
impact• 12 boxes for expected result
impact
Estimation of the result impact:
Potentialvulnerability
sourcesInformation
aboutestimated
risk exposure
Present risk management
activities • A mixture of objective and subjec-tive estimations done by experts
• Motivations for the different estimations
Figure 2.10: Risk exposure estimation model – Level 4
19
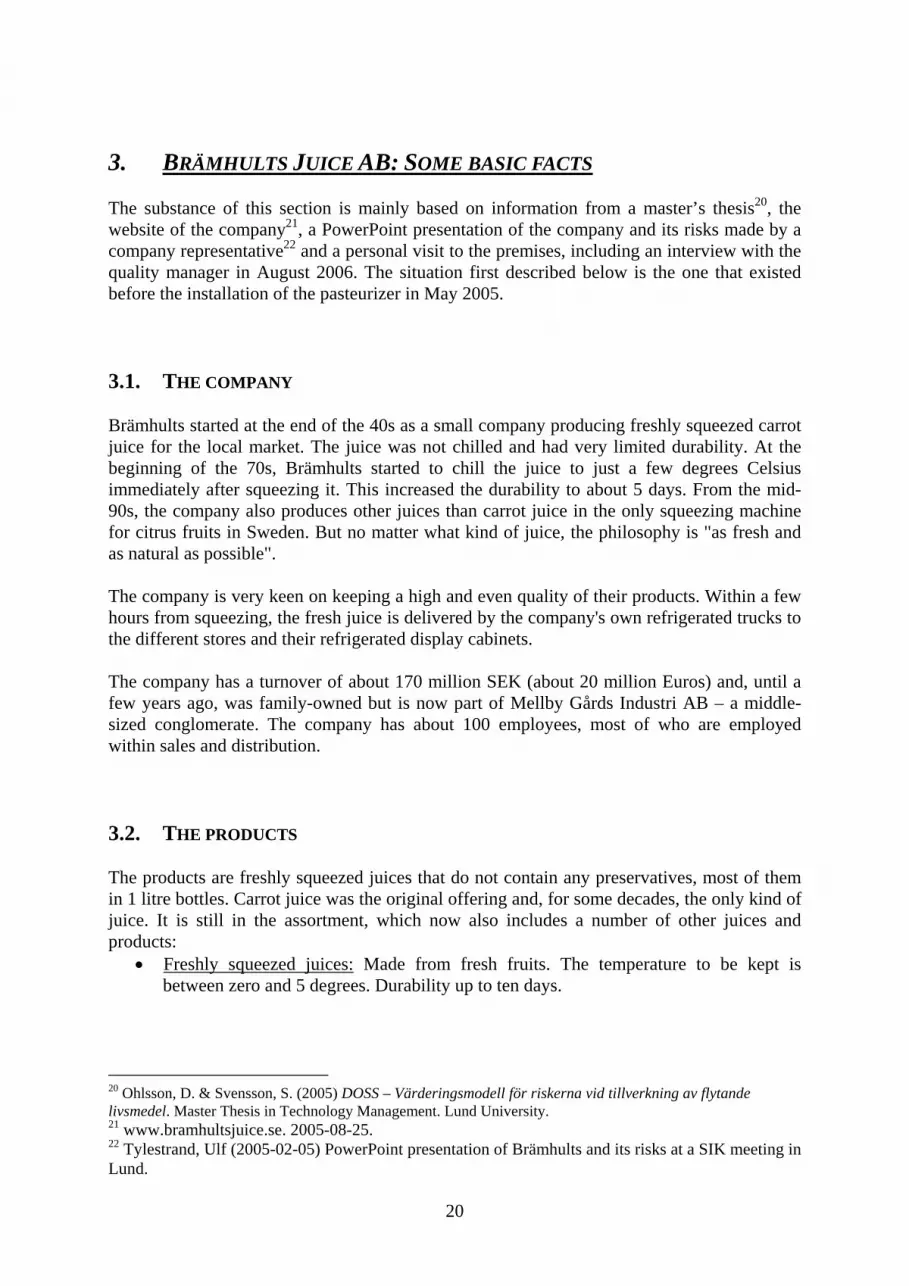
3. BRÄMHULTS JUICE AB: SOME BASIC FACTS The substance of this section is mainly based on information from a master’s thesis20, the website of the company21, a PowerPoint presentation of the company and its risks made by a company representative22 and a personal visit to the premises, including an interview with the quality manager in August 2006. The situation first described below is the one that existed before the installation of the pasteurizer in May 2005. 3.1. THE COMPANY Brämhults started at the end of the 40s as a small company producing freshly squeezed carrot juice for the local market. The juice was not chilled and had very limited durability. At the beginning of the 70s, Brämhults started to chill the juice to just a few degrees Celsius immediately after squeezing it. This increased the durability to about 5 days. From the mid- 90s, the company also produces other juices than carrot juice in the only squeezing machine for citrus fruits in Sweden. But no matter what kind of juice, the philosophy is "as fresh and as natural as possible". The company is very keen on keeping a high and even quality of their products. Within a few hours from squeezing, the fresh juice is delivered by the company's own refrigerated trucks to the different stores and their refrigerated display cabinets. The company has a turnover of about 170 million SEK (about 20 million Euros) and, until a few years ago, was family-owned but is now part of Mellby Gårds Industri AB – a middle-sized conglomerate. The company has about 100 employees, most of who are employed within sales and distribution. 3.2. THE PRODUCTS The products are freshly squeezed juices that do not contain any preservatives, most of them in 1 litre bottles. Carrot juice was the original offering and, for some decades, the only kind of juice. It is still in the assortment, which now also includes a number of other juices and products:
• Freshly squeezed juices: Made from fresh fruits. The temperature to be kept is between zero and 5 degrees. Durability up to ten days.
20 Ohlsson, D. & Svensson, S. (2005) DOSS – Värderingsmodell för riskerna vid tillverkning av flytande livsmedel. Master Thesis in Technology Management. Lund University. 21 www.bramhultsjuice.se. 2005-08-25. 22 Tylestrand, Ulf (2005-02-05) PowerPoint presentation of Brämhults and its risks at a SIK meeting in Lund.
20
• Healthy liquids. Made from fresh fruits (juices) with a natural additional healthy
contribution like ginseng. The temperature to be kept is between zero and 5 degrees. Durability up to ten days.
• Smoothes: Made from four different kinds of fresh fruit that are crushed and mixed. The temperature to be kept is between zero and 5 degrees. Durability up to ten days.
• Fruit liquids: Made from fresh frozen juices. The temperature to be kept is between zero and 5 degrees. Durability up to ten days.
• Fresh frozen juice: Made from fresh fruits; the juice is frozen immediately after it has been squeezed. The temperature has to be kept at minus 18 degrees or lower. Durability up to one year.
3.3. THE PRODUCT FLOW In chapter 2 a figure (Fig. 2.9) of the supply chain network structure was presented. This figure will be used here as a base for the presentation of the supply chain flow of Brämhults. Natural resources Nature in the sense of natural resources is here mainly the land and the soil producing the fruits. Supply side The fruits are mainly bought from traders and to some extent also directly from producers that are located both within Europe and outside it. The freight is paid by the supplier, and the transport is also arranged by the supplier. For a number of reasons the quality of the fruit can change in an unforeseeable way. One factor is changing weather conditions, which can affect the accessibility and the quality of the fruits. Production The company has in its premises a small stock of fresh oranges and other citrus fruits covering a couple of days’ need. The juice is squeezed during nighttimes and chilled and distributed early in the morning. Production is customer driven, and no stock of finished products exists. This means that everything that is produced during the night has already been sold and will be distributed during the day.
21

Arrival check
Squeezing
Mixing
Bottling
Picking
Inbound
Outbound
Figure 3.1: Brämhults; Production flow with internal activities (Based on a PowerPoint-presentation by Ulf Tylestrand, dated 2005-02-04)
In the figure above, production is described as consisting of five different production steps; arrival control, squeezing, mixing, bottling (bottle) and picking. Demand side (distribution) The company sells its products in Denmark, Finland, Norway and Sweden. The fresh juice is delivered to the different stores and their refrigerated display cabinets by Brämhults’ own refrigerated trucks driven by their own drivers (except on the Finnish market, where distribution is bought from a third party). The products have to be kept cool during the whole chain from production to consumption, because the juices are not pasteurized, which means that they might contain bacteria that could easily multiply if the temperature rises too much. If the juices are kept at the right low temperature, between zero and 5 degrees, they are guaranteed to stay fresh for 10 days. Within this period of time, the bottles should be distributed to the shop, stored at the shop, bought by an end customer, brought to the home of the end customer, stored again and finally consumed. This is the main reason why the company only sells its products in geographically nearby markets (i.e. the Scandinavian countries). End market End customers are mainly the different individual consumers (private households) that buy the juice in the shop, but there are also a few big customers (e.g. an airport) that get the juice directly delivered to them.
22

4. BRÄMHULTS BEFORE THE PASTEURIZER The risk analysis phase consists of the three steps – system border, hazard identification and risk exposure estimation. For each step a model been has developed. 4.1. SYSTEM BORDER SPECIFICATION The system border model, which was specified in Figure 2.8 in the presentation of the DRISC model, will now be applied on Brämhults. The focal unit is Brämhults and the focal product the fresh juices produced by the company. The time horizon is 2005 up to the installation of the pasteurizer in May 2005. The project goal is to map and evaluate the risks before the pasteurizer was installed. One limitation is that the fresh frozen juice will not be included, as its risks probably differ considerably from the other products in the assortment. Nor will carrot juice be included, because it remains un-pasteurized and has very short shelf life. The Finnish market will not be included in this study due to the use of a quite different distribution mode in that country than in the other Scandinavian countries. Finally it should be mentioned that I, in collaboration with the company, have made the judgements. 4.2. THE IDENTIFICATION OF HAZARDS The hazard identification model was presented in Figure 2.9. That model is now applied here. The aim of the mapping is to collect information about potential risk vulnerability and to identify present risk management activities. Identified hazards Natural resources
• Changing weather conditions like heat, cold or an unusually dry period • Natural disasters like flooding and hurricanes
Supply side
• Necessary “components” for the production of the fresh juice are mainly citrus fruits, packages of plastic, electricity and water.
• Electricity and water are single sourced and bought locally. • Packages are also single sourced and bought from a nearby company. • The design of the bottle is unique and has a trademark protection. For the production
of the bottles, certain unique forms are needed. • Citrus fruits are always available on the supply market, but price and quality could
change according to e.g. weather conditions. • Wrong deliveries and late arrivals could cause inbound delivery problems.
23
• Bad fruit quality could cause delays because the shipment is not useable for
production. A new one has to be ordered. • If a shipment with bad fruit is not detected, then it might enter production and cause
problems. • The company buys their citrus fruit from many different producers spread over many
regions and countries and even continents. • The company buys fruit from certified producers if possible.
Production
• Some buffer stock of packages • Almost no buffer stock of citrus fruits • No buffer stock at all of the finished products/juices • Just one production unit • Just one production line • No unique production equipment • Production mainly during night-time • The products/juices are not pasteurized, which means that their shelf life is quite short
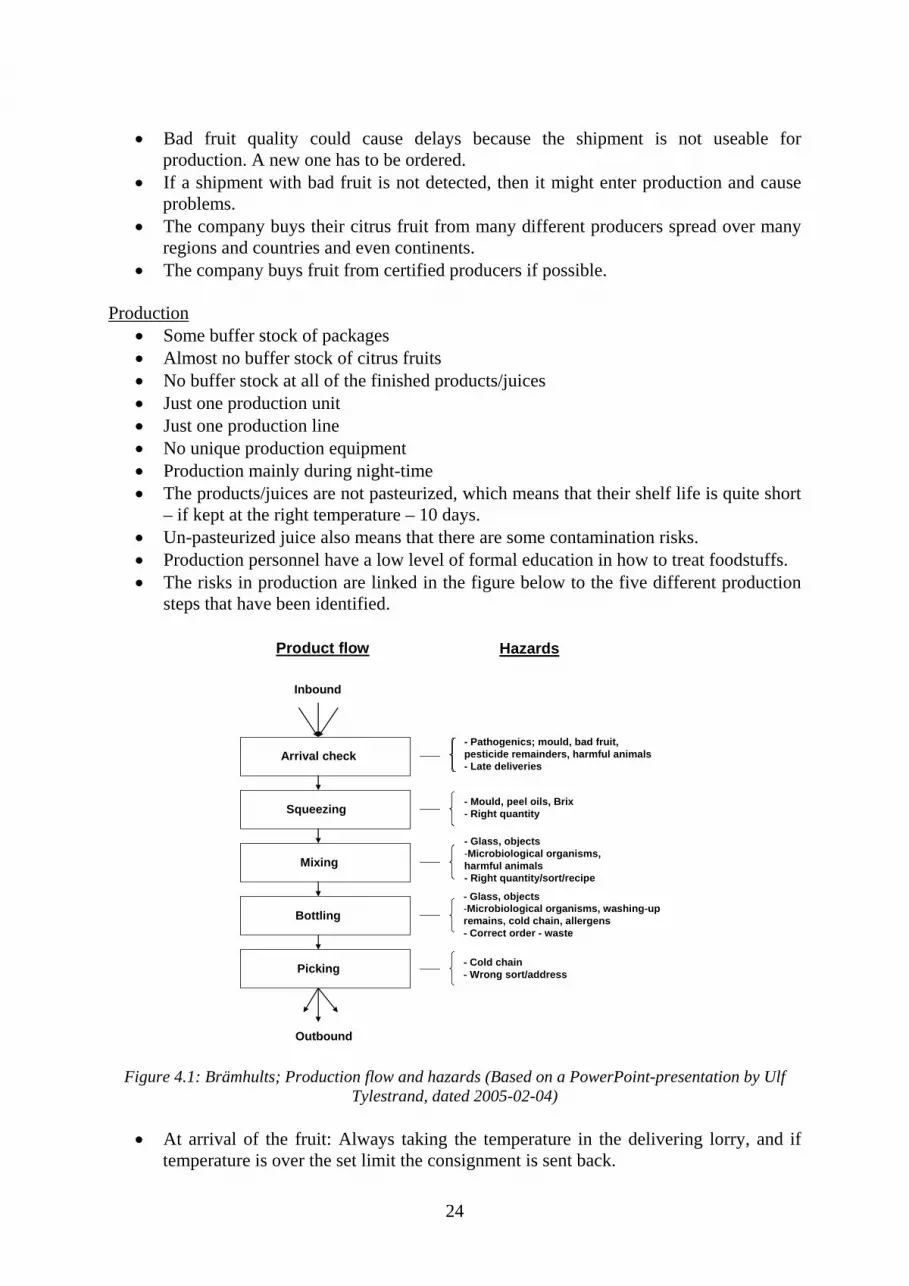
– if kept at the right temperature – 10 days. • Un-pasteurized juice also means that there are some contamination risks. • Production personnel have a low level of formal education in how to treat foodstuffs. • The risks in production are linked in the figure below to the five different production
steps that have been identified.
Arrival check
Squeezing
Mixing
Bottling
Picking
Inbound
Outbound
Product flow Hazards
- Pathogenics; mould, bad fruit,pesticide remainders, harmful animals- Late deliveries
- Cold chain- Wrong sort/address
- Glass, objects-Microbiological organisms, washing-up remains, cold chain, allergens- Correct order - waste
- Glass, objects-Microbiological organisms, harmful animals- Right quantity/sort/recipe
- Mould, peel oils, Brix- Right quantity
Figure 4.1: Brämhults; Production flow and hazards (Based on a PowerPoint-presentation by Ulf Tylestrand, dated 2005-02-04)
• At arrival of the fruit: Always taking the temperature in the delivering lorry, and if
temperature is over the set limit the consignment is sent back.
24
• At arrival of the fruit: Visual control of the fresh fruit and sorting away those fruits
that do not measure up to the required quality level. • At arrival of the fruit: Now and then taking a sample of the fruit and sending it to a
test laboratory for analysis. • Specific routines for the washing-up of the machines, but no central washing-up-
function • Routines for handling of customer complaints that might give indications of quality
problems in production. Demand side
• At the shops; some stock of juice covering a couple of days’ demand. • Limited shelf life – only 10 days. • The bottle with juice might be spoiled especially if the cold chain is not maintained. • The cold chain might not be maintained throughout the whole distribution. • The shops might not immediately pick up the delivered juice and place it in
refrigerated display cabinets. • The temperature in the refrigerated display cabinets at the shops might be too high. • Customers might regret picking the product while they are still in the shop and just put
it on an ordinary shelf or leave it at the check-out counter. The shop might occasionally delay returning the juice back into the refrigerated cabinet.
• Direct distribution from factory to the individual shop with Brämhults own trucks driven by their own chauffeurs who know the products well and are aware of the importance of keeping the cool chain.
• Routines for chauffeurs checking the quality of the products on the shop shelves. • Routines for handling customer complaints. • Routines for picking up bad products belonging to batches that do not maintain the
quality standard and should therefore be taken back. End market
• If Brämhults juice is not on the shelf, there is a risk that the customer will take a competitor’s product instead and like it.
• Spoiled products might be on the shelves and be bought by a customer. • The end customer (consumer) might not keep the temperature low enough during the
transport of the juice from the shop to the refrigerator back home. • The end customer’s refrigerator might hold a too high temperature or the customer
exposes the juice to heat, e.g. at the kitchen table, too long. Vulnerability and risk management Summing up the potential sources of vulnerability Changing weather conditions like heat, cold or an unusually dry period can drastically reduce the supply of citrus fruits, and so can natural disasters like flooding and hurricanes. Wrong deliveries and late arrivals could also cause problems. The fact that the bottle is unique and single sourced is another cause of vulnerability. There is only a small buffer stock of packages and an almost non-existent one of citrus fruits. Moreover, there is just one production unit with one production line. A disruption in production could not be mitigated
25

by buffer stocks of finished products, since there are none at the factory and only a limited stock of juice covering a couple of days’ demand at the shops. If Brämhults juice is not on the shelf, there is a risk that the customer will buy a competitor’s product instead — and like it. The risk of spoiled juice is a special case. Not only will the quality of the product be affected if mistreated, but there are also contamination risks meaning that people actually could get sick, although the risk is very small. If a shipment containing bad fruit is not discovered on arrival, it might enter production and cause contamination problems since the juice is not pasteurized. But the major problem is the cold chain, which has to be maintained from production throughout the whole distribution. There are a number of risk sources. One is that the shops may not pick up the delivered juice immediately and place it in refrigerated display cabinets. Another risk source is that the temperature may be too high in the refrigerated display cabinets in the shops. Yet another one is that customers may regret buying the product while they are still in the shop and just put it back on an ordinary shelf or leave it at the cashier’s counter. Then it might occasionally take some time until the juice is put back in the refrigerated cabinet. Spoiled products might thus be on the shelves in the shops and be bought by customers. There are also a number of risk sources after the product has been sold in the shop: too high temperature during the end customer’s (consumer’s) transport from the shop to the refrigerator in his/her home, too high temperature in the end customer’s refrigerator or in another place where the customer leaves the juice for a period of time, e.g. on the kitchen table. The customer’s personal experience of the spoiled juice means that s/he might hesitate to buy the product in the future even if s/he likes it. Information about spoiled juice from external sources like newspapers or television might also mean that customers feel apprehensive about buying the product in the future even if they have not had any problem with bad juice themselves. Risk management activities Brämhults tries to buy all their fruit from certified producers. They also have specific routines for the arrival check of the fresh fruits, e.g. visual control of the fresh fruit and returning those fruits that do not live up to the required quality level, or occasionally taking a sample of the fruit and sending it to a test laboratory for analysis. In production, Brämhults has specific routines for sorting away those fruits that do not live up to the required quality level. There are also specific routines for the cleaning-up of the machines (but no central cleaning-up function). There are also certain routines for handling customer complaints, which can provide indications of quality problems in production. On the demand side, there is direct distribution from factory to the individual shop with Brämhults’ own trucks driven by their own drivers. There are also routines for the drivers to check the quality of the products on the shop shelves and, finally, routines for picking up and taking back bad products belonging to batches that do not live up to the quality standard.
26

4.3. RISK EXPOSURE ESTIMATION Risk exposure estimation was discussed in section 2.3.2 and the discussion was summed up in a risk exposure estimation model (Figure 2.10). The result impacts at Brämhults will now be estimated by means of a five-level ranking (very high, high, medium, low and very low) and the motivations for each estimation are given. Facts and estimations Initiating event within supply side (S) Facts
• Electricity is bought from the ordinary local distributor. Brief disruptions can occur, but since Brämhults is situated in a middle-sized town, disruptions longer than a couple of hours are very unlikely.
• Water is bought from the local water authorities, who test the quality of the water regularly. A pipeline might break, but delays longer than a day or two are unlikely.
• The citrus fruits are bought from a number of different suppliers, and alternative suppliers are always at hand.
• The bottles are unique and of Brämhults’ own design. They own this design as well as the unique forms that are used to produce the bottles. There is only one supplier of the bottles, which are produced in Ullared about 100 kilometres away. If the production facilities in Ullared were destroyed, it would take considerable time to start up a new production – about six months. It would take about as long to change over to another supplier. By outsourcing the bottling step, however, it would be possible to change over to ordinary Tetra Pak packages much faster.
• Juice is the only product produced by Brämhults, and they cannot easily change over to another kind of production.
• Fresh juice is a sensitive product, especially since it could easily get spoiled. Estimations with motivations Preventive measures (S1) There is a buffer stock of bottles for some weeks’ need. The small buffer stock of citrus fruits covers just a couple of days’ need. There are also specific routines for the arrival check of the citrus fruits. There are, however, no reserve alternatives for water supply or electricity supply and no buffer stock of finished products (juice, and there is just one production site and one production line. The total known result impact for preventive measures has therefore been estimated to be low. Internally handled (S2) The buffer stocks of juice and bottles deal with some of the disruptions, but far from all of them. Certain minor disruptions in the magnitude of a couple of hours can be handled internally through overtime work. But since there is just one production unit and one production line and no buffer stocks of juice, there are, in other words, almost no possibilities to deal with incoming disruptions internally. They have to be passed on to the demand side. The total expected result impact has consequently been estimated to be very low.
27

Passed on; until back to a stable flow (S3) Since the preventive measures are limited and the possibilities of handling disruptions internally are small, the disruptions from supply side will to a considerable extent be passed on to the demand side. In the case of non-deliveries, there will, of course, be no revenues. The fleet of trucks and drivers will also become idle, because it cannot so easily be used for other purposes in the short run. In the case of a delivery of spoiled juice and subsequent complaints, the cost for taking back the product also has to be added. The expected result impact is estimated to be medium. Passed on; Short run (market patience) (S4) If Brämhults juice is not on the shelf in the shop, there is likely to be a category of customers who will postpone their purchase of juice until Brämhults juice is back again. But most of the customers will probably temporarily choose another brand instead, and it might be a while before they change back to Brämhults juice again, even though Brämhults is the only fresh, un-pasteurized juice on the market. So sales will be lost, and there will be a partly idle truck fleet as well. If the juice is spoiled and the customer finds out about it only after the purchase, s/he can go back to the shop and return the product. But the customer might instead simply throw away the spoiled juice. In both cases, the customer will probably avoid buying the product for a period of time. Also, the supply market (the supply side) can react in a way that makes the economic consequences of a disruption worse by e.g. giving Brämhults a lower quantity discount than otherwise. Considering all the factors mentioned above, the expected result impact has been estimated to be high. Passed on; Long run (market confidence) (S5) If Brämhults juice is not on the shelf, there is a risk that the customer will buy a competitor’s product instead and find that s/he prefers it, which means that Brämhults will lose that customer permanently. In the case of spoiled juice, there are different alternatives. The customer’s personal experience of spoiled juice means that s/he might avoid buying the product in the future. Other people’s bad experiences can have the same effect, even if the customer likes the product and has not had any problem with bad juice personally. Another alternative is the negative consequences of information from external sources like newspapers or television about spoiled juice. The resultant anxiety can become very strong and have a long-lived effect and spread to other juice brands as well. This could mean that the Brämhults brand is severely damaged with a considerable drop in sales on a long-term scale, and Brämhults is the only brand of the company. The supply side can also have an impact on the consequences in the long run by e.g. offering Brämhults less favourable prices in the future, since the company has now become a less attractive customer. The expected result impact is therefore estimated to be very high. Initiating event within focal unit (production) (P) Facts
• It is a matter of non-advanced products and production. • There are a few, rather simple, production steps, which are conducted by means of
standardised, relatively uncomplicated machines. This makes it possible to handle potential breakdowns rather easily and quickly.
• One production unit with just one production line creates inflexibility and thus vulnerability.
28
• Wrong handling of the machines and shortcomings in the quality control can lead to
contamination of the juice during the production process. Estimations with motivations Preventive measures (P1) There are routines for quality control of the finished product (juice) and routines for introducing and training new staff members, but no other preventive measures. The known result impact has therefore been estimated to be very low. Internally handled (P2) Re-planning of the production schedule for the day and/or working overtime can handle disruptions of up to a couple of hours – but not more. In other words, the internal risk handling possibilities are very limited. The expected result impact has been evaluated to be very low. Passed on disruptions (P3-5) The risks costs for the different passed on disruptions (P3, P4 and P5) are the same as for S3 to S5, but since the likelihood is judged to be lower, the estimation of the expected result impact is one step lower. Initiating event within demand side (D) Facts
• Fresh juice is a “sensitive” product, and the cooling chain has to be maintained all the way from production site to end customer.
• There are four possible weak links in the chain: distribution from the production site out to the different shops, storage at the shop, the customer’s transport of the juice from the shop to his/her home and, finally, storage of the juice at the customer’s home.
• The negative reactions to spoiled juice will probably be very much the same no matter where in the total supply chain the juice is spoiled before consumption.
• The accessibility of the product in the different shops can be affected by e.g. a wild strike among transport workers.
Estimations with motivations Preventive measures (D1) The fresh juice is distributed from the factory to the different shops by the company’s own drivers and refrigerated trucks. The drivers have special competence and interest in maintaining the cold chain. This way of distributing the juice can partly be regarded as a preventive measure. The drivers also check whether the quality of the juice on the shelves in the shops is satisfactory. Finally, the drivers return the juice that shops or customers have complained of. The expected result impact has been estimated to be low.
29

Internally handled (D2) There is very little that Brämhults can actually do if there is a sudden drop in orders, and consequently the expected result impact is very low. Passed on disruptions (D3-5) The expected result impact for the different passed on disruptions (D3, D4 and D5) are estimated to be at the same level as for S3, S4 and S5. Summing up and commenting on the estimations
Table 4.1: Brämhults; Risk exposure levels BEFORE the pasteurizer
DISRUPTION SOURCE:
until back to a stable flow
in the short run (market patience)
in the long run (market confidence)
Initiating event within supply side S1: Low S2: Very low S3: Medium S4: High S5: Very highInitiating event within focal unit P1: Very low P2: Very low P3: Low P4: Medium P5: HighInitiating event within demand side D1: Low D2: Very low D3: Medium D4: High D5: Very high
Total expected RI from internally handled
Total expected RI from passed on; Until back to a stable flow
Total expected RI from passed on; In the short run
Total expected RI from passed on; In the long run
TOTAL KNOWN NRI
Abbreviations: S = from supply side, P = from production, D = from demand side, RI = risk impact, NRI = negative risk impact
Risk exposure levels; Very low, Low, Medium, High, Very high and Not estimated.
Known NRI from preventive measures
TOTAL EXPECTED NRI
Expected OUTCOME structured after way of risk-handling:Expected RI from internally handled
disruptions
Expected RI from passed on disruptions upstream/downstream with includation of market reaction and considering time dimension
There are few preventive risk-handling actions, and consequently the known result impacts are low. Since the juice is fresh, the possibilities to handle a disruption internally are nearly non-existent, and therefore the result impacts are very low. Accordingly, almost all disruptions have to be passed on, and this is where the main expected negative result impacts will be found. They are: until back to a stable flow about medium, in the short run about high and in the long run about very high. In conclusion, it is worth mentioning that two major individual risk sources have been identified:
• one is spoiled juice and, especially, the long-term effects that hidden quality problems can have on market confidence; and
• the other is the unique bottle, which is characteristic of Brämhults juice. Single sourcing in combination with a limited buffer stock of bottles and a long start-up time if the production facilities for the bottle are destroyed can make it necessary to bottle the juice in standard packages, e.g. Tetra Pak packages, for some period of time. The problem, however, is that the customer might not recognize the product.
30

5. BRÄMHULTS AFTER THE PASTEURIZER 5.1. INSTALLATION OF A PASTEURIZER The description and analysis below is based on the situation in August 2006 – about 15 months after the installation of the pasteurizer in May 2005. The function of a pasteurizer A pasteurizer is a machine in which the juice in this case is heated to 70–72 degrees Celsius for about 30 seconds, thereby eliminating many of the micro-organisms that might contaminate the product. A short survey of changes
• The pasteurizer installed by Brämhults eliminates almost all possible bacteria, both those in the incoming fruit and those that might have been added through contamination during the production process.
• This has reduced the number of returns and withdrawals by about 90 %. • It has also prolonged shelf life from 10 to 18 days. • The prolonged shelf life has made it possible to change from distribution by the
company’s own drivers and lorries to all the different shops over to transport to a limited number of DCs (distribution centres) belonging to different retailer chains, which then take care of the distribution to the individual shops themselves.
• There was a change in operating costs for operator, heating, service and other costs related to the pasteurizer that led to a limited increase in the annual operating costs.
5.2. CHANGES IN RISK ESTIMATION Facts and estimations Initiating event within supply side (S) Preventive measures (S1) The investment in the pasteurizer leads to lower distribution costs and reduced risks of spoiled juice. The latter means that the cost of the pasteurizer is partly to be seen as a result impact. The pasteurizer takes care of both incoming fruit of bad quality and of the risk of contamination during the production process, or rather reduces them considerably. The estimation of total known result impact for preventive measures has therefore gone up one level from low to medium.
31

Internally handled (S2) It is still only minor disruptions of the magnitude of a couple of hours that can be handled internally (through overtime work). The total expected result impact is consequently still estimated to be very low. Passed on; until back to a stable flow (S3) The risk that the juice is spoiled has been practically eliminated by the installation of the pasteurizer. It eliminates almost all the bacteria that can enter with the fruit, and consequently there is a much lower number of potential disruptions. The expected result impact is therefore estimated to go down one level from medium to low. Passed on; short run (market patience) (S4) After the installation of the pasteurizer, the likelihood that the juice will be spoiled is now much lower. The expected result impact has therefore been estimated to go down from high to medium. Passed on; long run (market confidence) (S5) Since the risks of spoiled juice formed a considerable threat to the Brämhults brand and the attractiveness of its products, there is now, after the installation of a pasteurizer, a considerable change downwards in the result impacts related to market confidence. The expected result impact is therefore estimated to go down two levels, i.e. from very high to medium. Initiating event within focal unit (production) (P) Preventive measures (P1) The pasteurizer also eliminates potential bacteria that have entered during the first part of the production process. Consequently, there will be considerably fewer potential disruptions. The cost of the pasteurizer is thus partly to be regarded as a preventive measure and some of its costs as known result impacts. Some of the costs for training the staff to operate the machine also have to be included. The known result impact has therefore been estimated to go up two levels from very low to medium. Internally handled (P2) The possibilities of internal risk handling are still very limited, and the expected result impact has been estimated to be unchanged, i.e. very low. Passed on; until back to a stable flow (P3) As S3, but no change in the result impact level, which had already been estimated to be low. Passed on; short run (market patience) (P4) As S4, but since the likelihood is judged to be lower than for the disruptions imported from supply side, the estimation of the expected result impact is also lower – more precisely one step lower, which in this case means that it is estimated to go down from medium to low.
32

Passed on; long run (market confidence) (P5) As S5, but since the likelihood is judged to be lower than for the disruptions imported from supply side, the estimation of the expected result impact is also lower – more precisely one step lower, which in this case means that it is estimated to go down from high to medium. Initiating event within demand side (D) Preventive measures (D1) Brämhults’ own drivers and their own refrigerated lorries no longer distribute the juice to the shops. The result impacts have thus gone down, and therefore the estimated result impact level has been lowered from low to very low. Internally handled (D2) There is still very little that can be done concerning internal handling, and the result impact level remains very low. Passed on disruptions (D3-5) The result impacts for the different passed on disruptions (D3, D4 and D5) are estimated to be at the same level as for S3 to S5. 5.3. SUMMING UP AND COMMENTING ON THE ESTIMATIONS Table 5.1 presents the estimated risk exposure levels after the installation of the pasteurizer. The estimations before the installation are given within brackets.
Table 5.1: Brämhults; Risk exposure levels AFTER the pasteurizer (before within brackets).
DISRUPTION SOURCE:
until back to a stable flow
in the short run (market patience)
in the long run (market confidence)
Initiating event within supply side
S1: Medium (Low) S2: Very low S3: Low
(Medium)S4: Medium
(High)S5: Medium (Very high)
Initiating event within focal unit
P1: Medium (Very low) P2: Very low P3: Low P4: Low
(Medium)P5: Medium
(High)Initiating event within demand side
D1: Very low (Low) D2: Very low D3: Low
(Medium)D4: Medium
(High)D5: Medium (Very high)
Total expected RI from internally handled
Total expected RI from passed on; Until back to a stable flow
Total expected RI from passed on; In the short run
Total expected RI from passed on; In the long run
TOTAL KNOWN NRI
Abbreviations: S = from supply side, P = from production, D = from demand side, RI = risk impact, NRI = negative risk impact
Risk exposure levels; Very low, Low, Medium, High, Very high and Not estimated.
Known NRI from preventive measures
TOTAL EXPECTED NRI
Expected OUTCOME structured after way of risk-handling:Expected RI from internally handled
disruptions
Expected RI from passed on disruptions upstream/downstream with includation of market reaction and considering time dimension
The investment in a pasteurizer is partly to be seen as a risk handling action – a preventive measure. The known result impacts are therefore now medium for two of the three disruption sources. The result impacts for internally handled disruptions are still very low. Almost all the
33

result impacts that are linked to passed on disruptions have decreased and are now low for “until back to a stable flow” and about medium for the rest. There are still two major individual risk sources, but one of them is new:
• The first risk source is the unique package – the bottle – where nothing has changed. • Since the juice is now pasteurized, the risk of spoiled juice causing a drop in market
confidence has been more or less eliminated under the condition that the pasteurizer is properly operated and maintained. If this is not the case, the consequences could be even more severe than before, since e.g. the best-before date has been prolonged by eight days and their own drivers and lorries no longer carry out distribution. Hence, pasteurizer maintenance and operation has become a new major risk source.
5.4. CHANGES LINKED TO SUPPLY CHAIN RISK ESSENTIALS MODEL In chapter 2, Figure 2.6, a supply chain risk essentials model, including six different risk essentials, was presented. This model will be used here to describe the consequences of the installation of the pasteurizer. First of all, the product design has changed from fresh, un-pasteurized juice to pasteurized juice with a number of new qualities. The taste is different, shelf life is longer and sensitivity to contamination is considerably lower. The process design has also been changed, since a pasteurization step has been added to the production process. The prolonged shelf life has made it possible to gradually change distribution from direct distribution to the shops over to distribution to a limited number of DCs. Another consequence is fewer returns and withdrawals. The product flow design has thus been changed. Instead of a large number of small customers, Brämhults now has mainly a few big ones, which has consequences for invoicing, for example. Thus the product flow supporting systems have also been affected. Since the juice is now pasteurized, the number of products that are spoiled has decreased considerably, and the potential returns are carried out by the big food chains themselves. On the other hand, routines for the handling and maintenance of the pasteurizer have been introduced and added. The pasteurizer has to be cleaned in the correct way. The right temperature, flow and detergent concentration in the cleaning system are necessary when tanks, pipes and pump station, bottle machines and pasteurizer are cleaned. Consequently, the risk management systems and actions are also affected. It is of great importance that the personnel that handle the pasteurizer have the right competence for that task. On the other hand, the company has almost no need for drivers any longer. The effects on the human resources are considerable. It is thus worth noticing that, at a closer look, a change that was initially regarded as a change in product and process design turns out to have affected all the six different supply chain risk essentials.
34

5.5. CONSEQUENCES OUTSIDE THE RISK AREA
• Through the pasteurization the juice has got prolonged durability from 10 to 18 days. • The prolonged durability has made it possible to change from distribution by the
company’s own drivers and lorries to all the different shops over to transporting to a limited number of DCs (distribution centres) belonging to different food chains, which then distribute to the individual shops themselves.
35
6. RESULTS 6.1. THE OBJECTIVES OF THE STUDY In chapter 1, sections 1.2, the following three objectives for this study were settled:
• to apply the risk analysis phase in a certain theoretical supply chain disruption risk model – called the DRISC model – on Brämhults Juice AB before and after the installation of a pasteurizer to get a view of how the “risk picture" was affected by the installation.
• to get indications of suitable adjustments in the DRISC model. • to get ideas of possible further improvements in the management of the supply chain
disruption risks in Brämhults Juice AB. 6.2. RISK "PICTURE" BEFORE AND AFTER THE PASTEURIZER Different changes in the risk “picture”
• Changes in both known result impacts and expected result impacts. • Changes in all three disruption sources: initiating event within supply side, initiating
event within focal unit, and initiating event within demand side. • An increase in two result impact levels and a decrease in nine. • Before the installation of the pasteurizer, the risk levels related to market confidence
were high or very high, whereas after the installation they are all medium. • There has been a change towards comparatively more known result impacts and less
expected result impacts, since all the increased cost levels concerned known result impacts and all the decreased cost levels concerned expected result impacts.
• However, since there is no “weighting” of the different result impact boxes and their different levels, we cannot say whether the total result impacts in the supply chain have increased or decreased.
• The investment in the pasteurizer paid for itself already during the first year through the substantial drop in returns of spoiled juice. This is reflected in Table 9.2 in the change in result impact levels from medium to low in boxes S3 and D3 (until back to a stable flow). The risk levels for the short run and for the long run have also been lowered.
Economic consequences
• The investment in the pasteurizer was about 2 million SEK. • There was a limited increase in the annual operating costs of about 800.000 (400.000
operator, 120.000 heat, and 280.000 service and other related costs) • The costs for returns and withdrawals caused by spoiled juice were before the
pasteurizer about 6 million SEK annually. After the installation of the pasteurizer they dropped by about 90 % to about 0,6 millions annually.
36
• The pay-back time for the investment was thus about 5 months (2 millions/4,6
millions per year). • But the pasteurizer also prolonged shelf life from 10 to 18 days, thereby making it
possible for Brämhults to change from distribution by the company’s own drivers and lorries to all the different shops over to transporting to a limited number of DCs (distribution centres) belonging to different food chains.
• If we split the investment 50/50 on risk and on distribution we will get a pay-back time concerning the risk part of the investment of only 2 to 3 months.
• Included in the costs for returns and withdrawals are only the direct, immediate costs. If the negative effects of disruptions on future sales are also considered the pay-back time will be even shorter.
6.3. SUITABLE RISK MODEL ADJUSTMENTS The theoretical model – the DRISC model - has been complimented and adjusted in different ways during the work of applying the model on Brämhults juice. One adjustment is the including of quality aspects in the model and especially the stressing of the importance of "hidden" quality problems. A "hidden" disruption means that the initial disruption in the form of a deviance in quality is identified first in a later link in the chain leading to worse consequences than would otherwise have been the case. The worst case is when the quality problem is discovered first after the product has been used by the end customer for some time. Another adjustment is that when the risk exposure levels before and after the pasteurizer were presented to the company in August 2006 the passed on disruptions were split on the three time dimensions “until back to a stable flow”, “short run” and “long run”, but not on the three disruption sources “supply side”, “within production” and “demand side”. The company stressed though that it was of interest to be able to see the passed on disruptions split up both on the three different time dimensions and on the three different disruption sources. So this adjustment of the model was made, and it meant an increase in the number of risk exposure boxes from 9 to 15. 6.4. FURTHER POSSIBLE RISK MANAGEMENT IMPROVEMENTS
• Develop a contingency plan for the unique bottle, probably including copies of the unique bottle form kept in a safe place away from the supplier’s production site.
• Add more brands so that Brämhults juice is not the same as the company Brämhults. That will make the company Brämhults less vulnerable especially to market confidence-related disruptions.
37
6.5. SOME END COMMENTS
• The case study has illustrated the usability of the DRISC model. • The case study has stressed the importance of “hidden” disruptions. • The case study has also stressed the importance of market confidence for products that
are directly linked to people’s well-being but where there are other alternative products that could fulfil the same basic needs.
38
References Literature Artebrant, Jönsson & Nordhemmer (2004) Risks and risk management in the supply chain
flow – a case study based on some of Marsh’s clients. Master thesis. Lund Institute of Technology. Division of Engineering Logistics.
Borge, Dan (2001) The book of risk. John Wiley & Sons Inc. New York. Brindley, Claire (ed) (2004) Supply Chain Risk: A Reader. Ashgate Publishing Limited. UK. Cooper M., Lambert, D. & Pagh, J (1997) ”Supply Chain Management: More Than a New
Name for Logistics”. The International Journal of Logistics Management. Volume 8, Number 1, pp. 1 – 14.
Christopher, Martin (1998) Logistics and Supply Chain Management. 2nd ed. Financial Times/Pitman Publishing.
Christopher, M. & Towill, D. (2000) “Supply chain migration from lean and functional to agile and customised”. Supply chain management: An International Journal, Vol. 5, No 4, pp.206-213, 2000.
Christopher, M. & Lee, H. L. (2004) “Mitigating supply chain risk through improved confidence”. Article in International journal of physical distribution & logistics management Volume 34, number 5, 2004, pages 388-396.
International Electrotechnical Commission, IEC 300-3-9, 1995. Depandability management - part 3: Application guide - section 9: Risk analysis of technnological systems. IEC 1995.
Kleindorfer & Van Wassenhove (2004) Managing Risk in Global Supply Chains. Chapter 12 in; The INSEAD-Wharton Alliance on Globalizing. Cambridge University Press.
Kaplan, S. (1997) “The Words of Risk Analysis!. Article in Risk Analysis. Vol 17, No4. Society for Risk Analysis.
Lambert, Stock & Ellram (1998) Fundamentals of logistics management. McGraw-Hill International Editions.
Mason-Jones, R., Naylor, B. And Towill, D. (2000) “Engineering the leagile supply chain”. International Journal of Agile Management Systems. 2/1, pp. 54-61. 2000.
Norrman, A. & Jansson, U. (2004) “Ericsson’s proactive supply chain risk management approach after the Albuquerque accident”. Article in International journal of physical distribution & logistics management Volume 34, number 5, 2004, pages 434-456.
Ohlsson, D. & Svensson, S. (2005) DOSS – Värderingsmodell för riskerna vid tillverkning av flytande livsmedel. Master Thesis in Technology Management. Nr 117:2005. Lund University, Lund.
Paulsson, Ulf (2004) Supply Chain Risk Management. Chapter 6 in Brindley: Supply Chain Risk: A Reader. (Book chapter).
Paulsson, Ulf (2005a) "Developing a Supply Chain Flow Risk Model". Final paper to the NOFOMA 2005-conference, Copenhagen, 9-10 June 2005.
Paulsson, Ulf (2005b) "Valuation of Supply Chain Flow Risks by Indexing". Work-in-progress paper to the NOFOMA 2005-conference, Copenhagen, 9-10 June 2005.
Paulsson, Ulf (2007) "On managing disruption risks in the supply chain – the DRISC model". A doctoral thesis. Department of Industrial Management and Logistics. Lund University. Lund. September 2007. ISBN 978-91-976974-1-5.
Risk: Analysis, Perception and Management (1992). Report of a Royal Society Study Group. The Royal Society. London.
Schwartz, John (2003) “Disaster Plans Get New Scrutiny After Blackout”. New York Times, August 19, 2003.
39

Sheffi, Yossi (2005) The Resilient Enterprise. The MIT press. Cambridge, Massachusetts,
USA. ISBN 0-262-19537-2. Simons, Robert (1999) "How risky is your company?”. Harvard Business Review, May-June
1999. Other sources Tylestrand, Ulf (2005-02-05) PowerPoint presentation of Brämhults and its risks at a SIK-
meeting in Lund. www.bramhultsjuice.se. 2005-08-25.
40
Copyright © 2022 FDOKUMEN