Change of mineral element content in the common shrubs of ...
10
ISSN 1392-3196 ŽEMDIRBYSTĖ=AGRICULTURE Vol. 98, No. 4 (2011) 357 ISSN 1392-3196 Žemdirbystė=Agriculture, vol. 98, No. 4 (2011), p. 357‒366 UDK 631.81.095.337:636.39.086.782 Change of mineral element content in the common shrubs of Mediterranean zone. I. Macronutrients Ahmet GÖKKUŞ 1 , Altingül ÖZASLAN PARLAK 1 , Mehmet PARLAK 2 1 Çanakkale Onsekiz Mart University Çanakkale, Turkey 2 Çanakkale Onsekiz Mart University, Lapseki Vocational School Çanakkale, Turkey E-mail: [email protected] Abstract Shrubs are characteristic of Mediterranean zone and are a significant feed source for goats. However, nutrient contents of shrubs vary significantly with climate, soil and especially with plant growth. There are a few studies on annual variations in mineral contents of shrubs in Marmara Region. Therefore, in this study, seasonal variation of macronutrients (N, P, K, Ca, Mg, S) of kermes oak (Quercus coccifera L.), mock privet (Phillyrea latifolia L.), prickly juniper (Juniperus oxycedrus L.), gall oak (Quercus infectoria Oliv.), Christ’s-thorn (Paliurus spina-christi Miller), pink rockrose (Cistus creticus L.), thyme (Thymus longicaulis C. Presl.) and prickly burnet (Sarcopoterium spinosum (L.) Spach) were investigated for 14 months (October 2006–November 2007). Variation of macronutrients throughout the year was found to be significant for all shrubs. The concentrations of N, P, K, and S in the shrubs reached the highest levels during the April–May months. However, Ca significantly decreased in April. Variation in Mg varied with shrub species. While the amount of N was able to meet the demands of goats during spring for all shrubs except for Paliurus spina-christi and Quercus infectoria, they were not able to meet the demands in other seasons. While Paliurus spina-christi had sufficient N every season, Quercus infectoria had also sufficient N during each season except for winter. P, K, and Ca were mostly observed at sufficient amounts for goats. While Juniperus oxycedrus had insufficient Mg in every season and mock privet in summer and autumn, Mg deficiency was not observed in other shrubs. Amounts of S were generally insufficient for the needs of goats. Key words: macronutrients, shrubby rangeland. Introduction Shrubs are resistant to drought and salinity and play an important role in Mediterranean ecosystems. Maquis lands are considered as natural feed source for goats during the entire year. Therefore, goat production activities are widespread over these lands (Papachristou et al., 1999; 2003; Rogosic, 2000). Grazing studies carried out over Mediterranean shrublands revealed that more than 60% of goat feed comes from shrubs (Perevolotsky et al., 1998; Papachristou et al., 2005). The ration of shrubs in goat feed reaches up to 80% in December and January months (Papachristou, Nastis, 1993). Nutrients generally form the constituents of important compounds in plants and play a role in enzyme activity (Kacar et al., 2006). They are basic constituents of body tissues in animals, provide the regulation of osmotic pressure and pH and take part in structure of enzymes (Whitehead, 2000). Concentrations of N, P, K, Ca, Mg and S in plant structure vary with plant growth, soil and climate conditions and several other factors. Young tissues have higher nutrient concentrations than older ones. For instance, N, P, S present distinctive decrease with maturation. As leaves senesce, some losses are observed in nutrients through remobilization and leaching with precipitation (Whitehead, 2000). Nutrient deficiencies can be seen in animals due to changes in nutrient contents of plants. Making this situation clear will prevent the nutritional disorders in animals. Based on the year 2009 statistics, goats constitute 13.4% (5.1 million) of 38.1 million livestock assets of Turkey (Crop production statistics, 2010). Mediterranean maquis are indispensible part of goat production in Turkey. However, sufficient researches were not able to be performed over these maquis lands since these lands were involved in forest lines and were prohibited from grazing. Therefore, to investigate macronutrient (N, P, K, Ca, Mg, S) concentrations of eight shrubs of kermes oak, mock privet, prickly juniper, gall oak, Christ’s-thorn, pink rockrose, thyme and prickly burnet, common in Mediterranean zone, and to emphasize both the significance of these shrubs for animal feeding and to evaluate possible nutrient deficiencies throughout the year were purposed in this study.
-
Upload
khangminh22 -
Category
Documents
-
view
1 -
download
0
Transcript of Change of mineral element content in the common shrubs of ...
ISSN 1392-3196 ŽEMDIRBYSTĖ=AGRICULTURE Vol.98,No.4(2011) 357
ISSN 1392-3196 Žemdirbystė=Agriculture,vol.98,No.4(2011),p.357‒366UDK631.81.095.337:636.39.086.782
Change of mineral element content in the common shrubs of Mediterranean zone. I. Macronutrients
AhmetGÖKKUŞ1,AltingülÖZASLANPARLAK1,MehmetPARLAK2
1ÇanakkaleOnsekizMartUniversityÇanakkale,Turkey2ÇanakkaleOnsekizMartUniversity,LapsekiVocationalSchoolÇanakkale,TurkeyE-mail: [email protected]
Abstract ShrubsarecharacteristicofMediterraneanzoneandarea significant feed source forgoats.However,nutrientcontentsofshrubsvarysignificantlywithclimate,soilandespeciallywithplantgrowth.ThereareafewstudiesonannualvariationsinmineralcontentsofshrubsinMarmaraRegion.Therefore,inthisstudy,seasonalvariationofmacronutrients(N,P,K,Ca,Mg,S)ofkermesoak(Quercus cocciferaL.),mockprivet(Phillyrea latifoliaL.),pricklyjuniper(Juniperus oxycedrusL.),galloak(Quercus infectoriaOliv.),Christ’s-thorn(Paliurus spina-christi Miller),pinkrockrose(Cistus creticusL.),thyme(Thymus longicaulisC.Presl.)andpricklyburnet(Sarcopoterium spinosum(L.)Spach)wereinvestigatedfor14months(October2006–November2007).Variationofmacronutrientsthroughouttheyearwasfoundtobesignificantforallshrubs.TheconcentrationsofN,P,K,andSintheshrubsreachedthehighestlevelsduringtheApril–Maymonths.However,CasignificantlydecreasedinApril.VariationinMgvariedwithshrubspecies.WhiletheamountofNwasabletomeetthedemandsofgoatsduringspringforallshrubsexceptforPaliurus spina-christiandQuercus infectoria, theywerenotabletomeetthedemandsinotherseasons.WhilePaliurus spina-christihadsufficientNeveryseason,Quercus infectoriahadalsosufficientNduringeachseasonexceptforwinter.P,K,andCaweremostlyobservedatsufficientamountsforgoats.WhileJuniperus oxycedrushadinsufficientMgineveryseasonandmockprivetinsummerandautumn,Mgdeficiencywasnotobservedinothershrubs.AmountsofSweregenerallyinsufficientfortheneedsofgoats.
Keywords:macronutrients,shrubbyrangeland.
IntroductionShrubsareresistanttodroughtandsalinityand
play an important role in Mediterranean ecosystems.Maquis landsareconsideredasnatural feed source forgoatsduringtheentireyear.Therefore,goatproductionactivitiesarewidespreadovertheselands(Papachristouet al.,1999;2003;Rogosic,2000).Grazingstudiescarriedout overMediterranean shrublands revealed that morethan60%ofgoatfeedcomesfromshrubs(Perevolotskyet al., 1998; Papachristou et al., 2005). The ration ofshrubsingoatfeedreachesupto80%inDecemberandJanuarymonths(Papachristou,Nastis,1993).
Nutrients generally form the constituents ofimportantcompoundsinplantsandplayaroleinenzymeactivity(Kacaretal.,2006).Theyarebasicconstituentsof body tissues in animals, provide the regulation ofosmotic pressure and pH and take part in structure ofenzymes(Whitehead,2000).ConcentrationsofN,P,K,Ca,MgandSinplantstructurevarywithplantgrowth,soil and climate conditions and several other factors.Young tissues have higher nutrient concentrations thanolder ones. For instance, N, P, S present distinctive
decreasewithmaturation.Asleavessenesce,somelossesare observed in nutrients through remobilization andleachingwithprecipitation(Whitehead,2000).Nutrientdeficiencies can be seen in animals due to changes innutrient contents of plants.Making this situation clearwillpreventthenutritionaldisordersinanimals.
Basedontheyear2009statistics,goatsconstitute13.4% (5.1million) of 38.1million livestock assets ofTurkey(Cropproductionstatistics,2010).Mediterraneanmaquis are indispensible part of goat production inTurkey. However, sufficient researches were not ableto be performed over these maquis lands since theselandswereinvolvedinforestlinesandwereprohibitedfrom grazing. Therefore, to investigate macronutrient(N,P,K,Ca,Mg,S) concentrationsof eight shrubsofkermes oak, mock privet, prickly juniper, gall oak,Christ’s-thorn,pinkrockrose,thymeandpricklyburnet,commoninMediterraneanzone,andtoemphasizeboththesignificanceof theseshrubs foranimal feedingandtoevaluatepossiblenutrientdeficienciesthroughouttheyearwerepurposedinthisstudy.
358 Change of mineral element content in the common shrubs of Mediterranean zone. I. Macronutrients
Materials and methodsThe researchwas carried out in two different
sites(AğaköyandÇiplak)ofÇanakkale,innorth-west-ernAnatolia,Turkey,betweenOctober2006–November
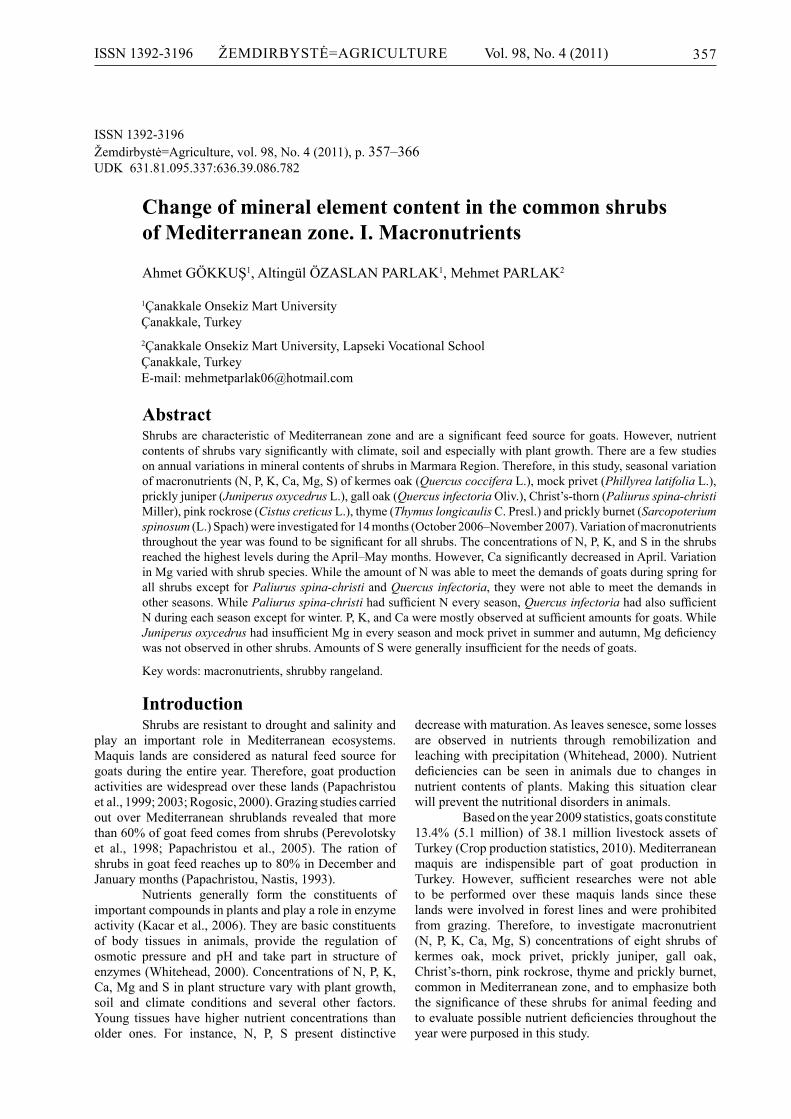
2007.AğaköyisintheCampusofBigaFacultyofEco-nomicsandAdministrativeScienceswhichis located85kmawayfromthecentreofÇanakkale,whileÇiplakislo-cated30kmawayfromthecentreofÇanakkale(Fig.1).
Figure 1.Locationofthestudyarea
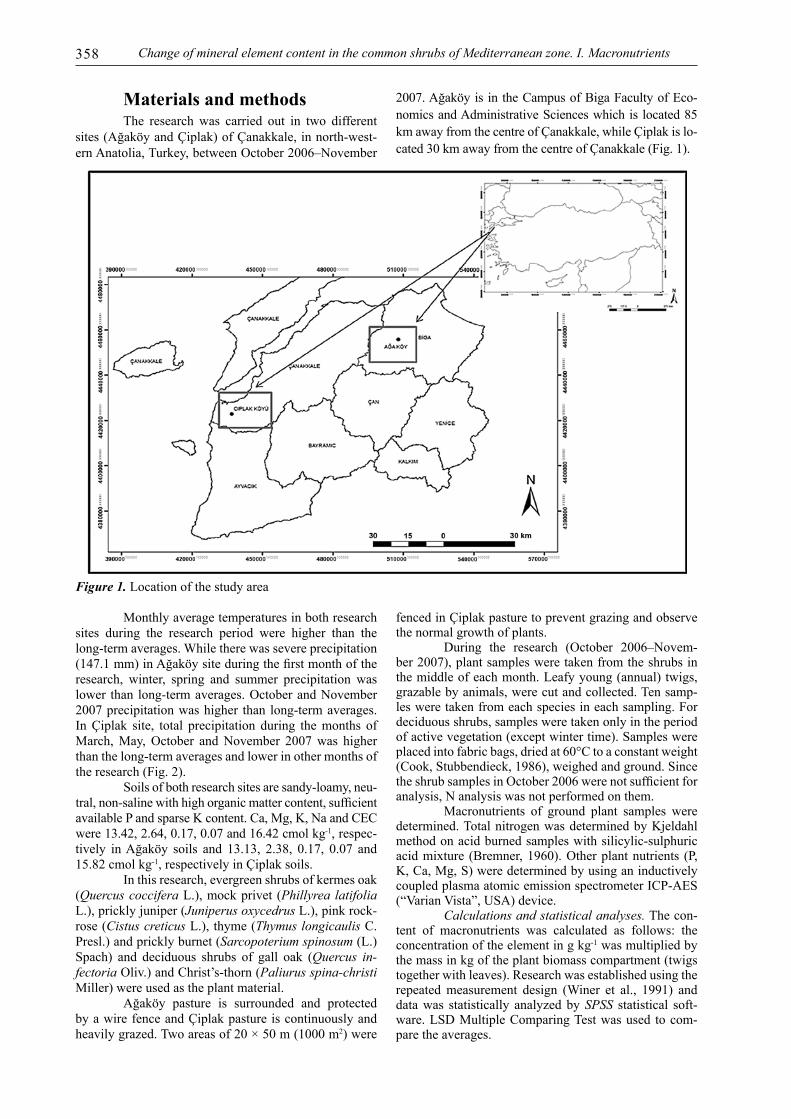
Monthlyaveragetemperaturesinbothresearchsites during the research period were higher than thelong-termaverages.Whiletherewassevereprecipitation(147.1mm)inAğaköysiteduringthefirstmonthoftheresearch, winter, spring and summer precipitation waslower than long-termaverages.OctoberandNovember2007precipitationwashigher than long-termaverages.InÇiplak site, total precipitation during themonths ofMarch,May,October andNovember 2007was higherthanthelong-termaveragesandlowerinothermonthsoftheresearch(Fig.2).
Soilsofbothresearchsitesaresandy-loamy,neu-tral,non-salinewithhighorganicmattercontent,sufficientavailablePandsparseKcontent.Ca,Mg,K,NaandCECwere13.42,2.64,0.17,0.07and16.42cmolkg-1,respec-tively inAğaköy soils and 13.13, 2.38, 0.17, 0.07 and15.82cmolkg-1,respectivelyinÇiplaksoils.
Inthisresearch,evergreenshrubsofkermesoak(Quercus cocciferaL.),mockprivet (Phillyrea latifolia L.),pricklyjuniper(Juniperus oxycedrusL.),pinkrock-rose(Cistus creticusL.),thyme(Thymus longicaulisC.Presl.)andpricklyburnet(Sarcopoterium spinosum(L.)Spach) and deciduous shrubs of gall oak (Quercus in-fectoriaOliv.)andChrist’s-thorn(Paliurus spina-christi Miller)wereusedastheplantmaterial.
Ağaköy pasture is surrounded and protectedbyawirefenceandÇiplakpastureiscontinuouslyandheavilygrazed.Twoareasof20×50m(1000m2)were
fencedinÇiplakpasturetopreventgrazingandobservethenormalgrowthofplants.
During the research (October 2006–Novem-ber2007),plantsamplesweretakenfromtheshrubsinthemiddleofeachmonth.Leafyyoung(annual)twigs,grazablebyanimals,werecutandcollected.Tensamp-lesweretakenfromeachspeciesineachsampling.Fordeciduousshrubs,samplesweretakenonlyintheperiodofactivevegetation(exceptwintertime).Sampleswereplacedintofabricbags,driedat60°Ctoaconstantweight(Cook,Stubbendieck,1986),weighedandground.SincetheshrubsamplesinOctober2006werenotsufficientforanalysis,Nanalysiswasnotperformedonthem.
Macronutrients of ground plant samples weredetermined.TotalnitrogenwasdeterminedbyKjeldahlmethodonacidburnedsampleswithsilicylic-sulphuricacidmixture (Bremner,1960).Otherplantnutrients (P,K,Ca,Mg,S)weredeterminedbyusinganinductivelycoupledplasmaatomicemissionspectrometerICP-AES(“VarianVista”,USA)device.
Calculations and statistical analyses.Thecon-tent of macronutrients was calculated as follows: theconcentrationoftheelementingkg-1wasmultipliedbythemassinkgoftheplantbiomasscompartment(twigstogetherwithleaves).Researchwasestablishedusingtherepeatedmeasurement design (Winer et al., 1991) anddatawas statistically analyzedbySPSS statistical soft-ware.LSDMultipleComparingTestwasused tocom-paretheaverages.
ISSN 1392-3196 ŽEMDIRBYSTĖ=AGRICULTURE Vol.98,No.4(2011) 359
ResultsVariationofmacronutrientsingrazablepartsof
kermesoakwerefoundtobesignificantforallelements(p<0.001)exceptforMg(p=0.57).N,P,KandScon-centrations of plant samples reached the highest levelsattheinitialshootdevelopmentperiod(April)followingthewinterdormancyanddecreasedgraduallyduringthe
Figure 2.Temperatureandprecipitationvaluesofthestudylocations(aboveAğaköy,belowÇiplak)
followingmonths.Onthecontrary,Careachedthelow-estlevelsinAprilandMay(Figs3–4).
Magnesium content of kermes oak varied be-tween2.38–2.85gkg-1.As theaverageofentiresamp-ling periods for kermes oak, N (12.32 g kg-1) and Ca(9.66 g kg-1)wereobservedasthehighestones(Table1).
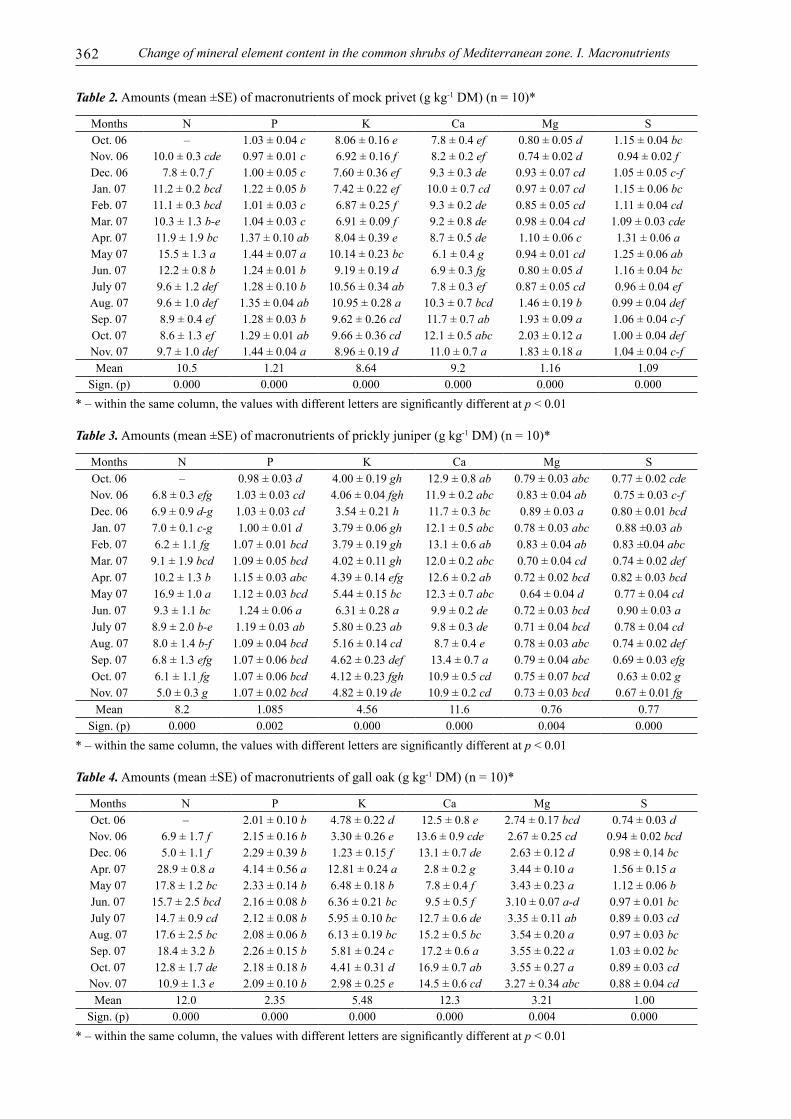
Table 1.Amounts(mean±SE)ofmacronutrientsofkermesoak(gkg-1DM)(n=10)*,**
Months N P K Ca Mg SOct.06 – 1.53±0.04c 5.93±0.24ef 10.4±0.9bcd 2.85±0.09 0.65±0.02cdNov.06 12.8±2.5bcd 1.49±0.03c 5.18±0.22fg 12.7±0.6a 2.72±0.10 0.73±0.02bcdDec.06 12.1±2.1b-e 1.46±0.05c 4.79±0.30g 11.0±0.4abc 2.62±0.10 0.69±0.01bcdJan.07 11.0±0.5c-f 1.55±0.02c 4.22±0.16g 11.9±0.4ab 2.74±0.17 0.71±0.03bcdFeb.07 12.5±1.0b-e 1.52±0.04c 4.53±0.20g 11.4±0.7abc 2.60±0.27 0.77±0.02bcMar.07 14.1±2.5b 1.44±0.03c 4.44±0.09g 11.2±0.3abc 2.38±0.05 0.75±0.03bcApr.07 21.8±0.9a 3.74±0.21a 14.02±0.79a 6.7±0.6e 2.54±0.10 1.57±0.09aMay07 13.3±0.8bc 1.89±0.05b 8.88±0.26b 5.9±0.5e 2.53±0.15 0.80±0.03bJun.07 11.6±0.9b-f 1.57±0.06c 8.07±0.09bc 9.6±0.7cd 2.41±0.19 0.69±0.02bcdJuly07 9.0±0.1f 1.56±0.08c 9.11±0.19b 6.3±0.4e 2.39±0.08 0.62±0.02dAug.07 10.4±1.1def 1.38±0.02c 7.49±0.30cd 8.9±0.4d 2.55±0.12 0.77±0.04bcSep.07 10.1±0.1def 1.38±0.03c 7.34±0.40cd 9.7±0.5cd 2.60±0.18 0.72±0.02bcdOct.07 9.8±1.8ef 1.40±0.13c 6.77±0.60de 10.1±0.7cd 2.52±0.19 0.75±0.08bcdNov.07 11.6±0.6b-f 1.55±0.05c 5.09±0.39fg 9.6±0.6cd 2.43±0.12 0.81±0.02bMean 12.3 1.68 6.85 9.7 2.56 0.79
Sign.(p) 0.000 0.000 0.000 0.000 0.570 0.000*–withinthesamecolumn,thevalueswithdifferentlettersaresignificantlydifferentatp<0.01,**–thereisnotfortheletteringinthesamecolumnofvaluesarenotstatisticallysignificant
Variationsofmacronutrientsinmockprivetwerefoundtobesignificantthroughouttheyear(p<0.001).N, P and S increased significantly in spring (April orMay).NandSlevelswereatlowlevelsduringthesum-mer, autumn andwintermonths. Phosphoruswas rela-tivelyhighduringthesummerandautumnmonthsoftheyear2007.However, itsignificantlydecreasedbetweenOctober 2006–March 2007.Although K concentrationofmockprivetwasatlowlevelsduringautumn,winterandspringmonths,itincreasedsignificantlyduringJuly
andAugust.Ca andMgcontents started to increase inAugustandreachedthehighestlevelsbetweenSeptem-ber–November2007.WhileSwasincreasingduringtheshootingperiodofspring,duringthemonthsofAprilandMay,itwaslowintherestofthemonthsandtherewerenosignificantdifferencesamongthem(Figs3–4).Astheaverage of entire sampling periods formock privet,N(10.48gkg-1),Ca(9.16gkg-1)andK(8.64gkg-1)wereobservedasthehighestones(Table2).
360
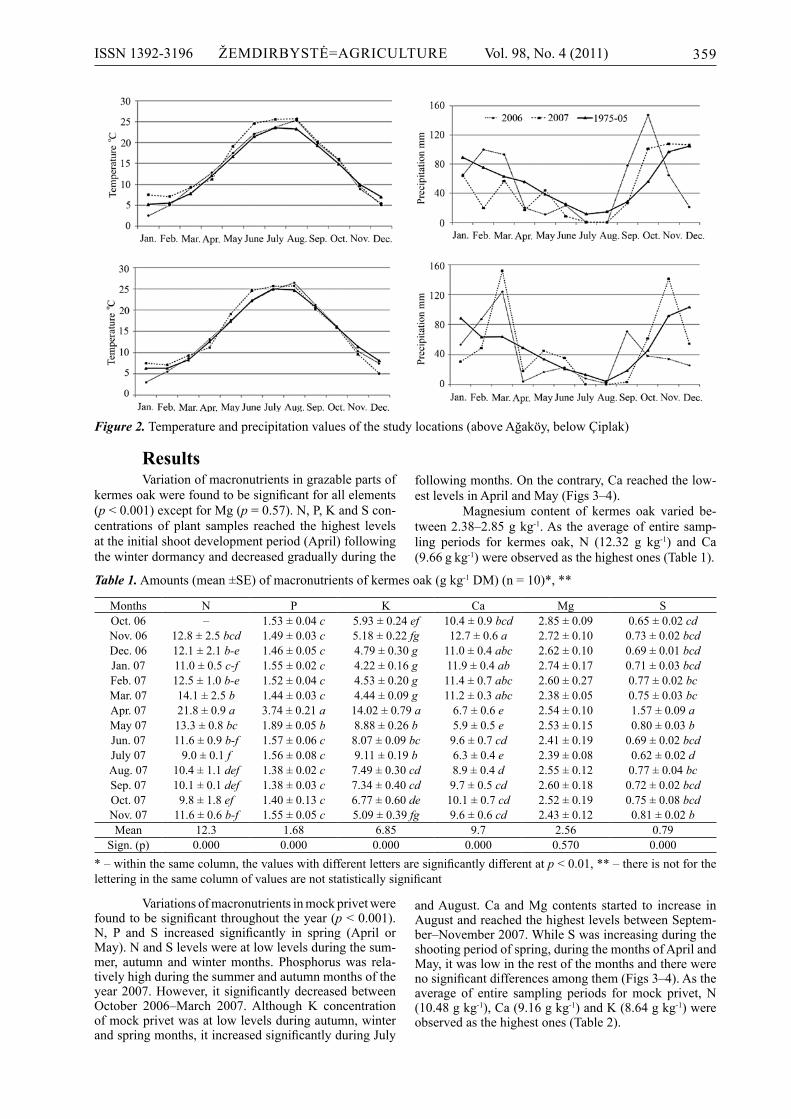
Figure 3.ChangeofN,PandKconcentrationsoftheshrubspecies
Variation of macronutrients in prickly junipersampleswerefoundtobesignificantduringtheresearchperiodof14months(p<0.001–p<0.01).Nconcentra-tioninMay,PandKatthebeginningofsummer(June)reachedthehighestlevelandtheydecreasedtothelow-estlevelsespeciallyduringautumnandsummermonths.Increasing Ca andMg in plant samples of winter andspringdecreased in summermonths.S ratioof juniperdidnotyieldaregularchangethroughouttheyear.WhileSwasobservedatthehighestlevelsinJanuary,FebruaryandJune,thelowestlevelswereobservedinSeptember,OctoberandNovember2007(Figs3–4).Theamountsofallmacronutrients,Ca(11.58gkg-1)andN(8.24gkg-1)wereobservedasthehighestones(Table3).
Statistical analysis revealed significant varia-tions inmacronutrient contents of gall oak throughout
theyear(p<0.001–p<0.01).Galloakisadeciduousshrub.InitialgrowthandleafappearancestartedinApril.In thismonth,N, P,K, andS levelswere found to bethehighestandsignificantdecreaseswereobserveddur-ingthefollowingmonths.MgalsostartedtoincreaseinAprilbutthisincreasecontinuedtotheendoftheyear.UnlikeMg,Ca showed reverse tendency.While itwasat the lowest levelsduring the initialgrowth in spring,it reached thehighest levels inSeptemberandOctober2007(Figs3–4).GalloakhadhighCa(12.34gkg-1)andN(11.97 g kg-1)contents(Table4).
MacronutrientsindefoliatingChrist’s-thornwerefoundtobesignificant(p<0.001).P,K,andSwereatthehighest levels during the leaf appearance (April).N in-creasedthroughMayandJune.Thesemineralsdecreased
Change of mineral element content in the common shrubs of Mediterranean zone. I. Macronutrients
ISSN 1392-3196 ŽEMDIRBYSTĖ=AGRICULTURE Vol.98,No.4(2011) 361
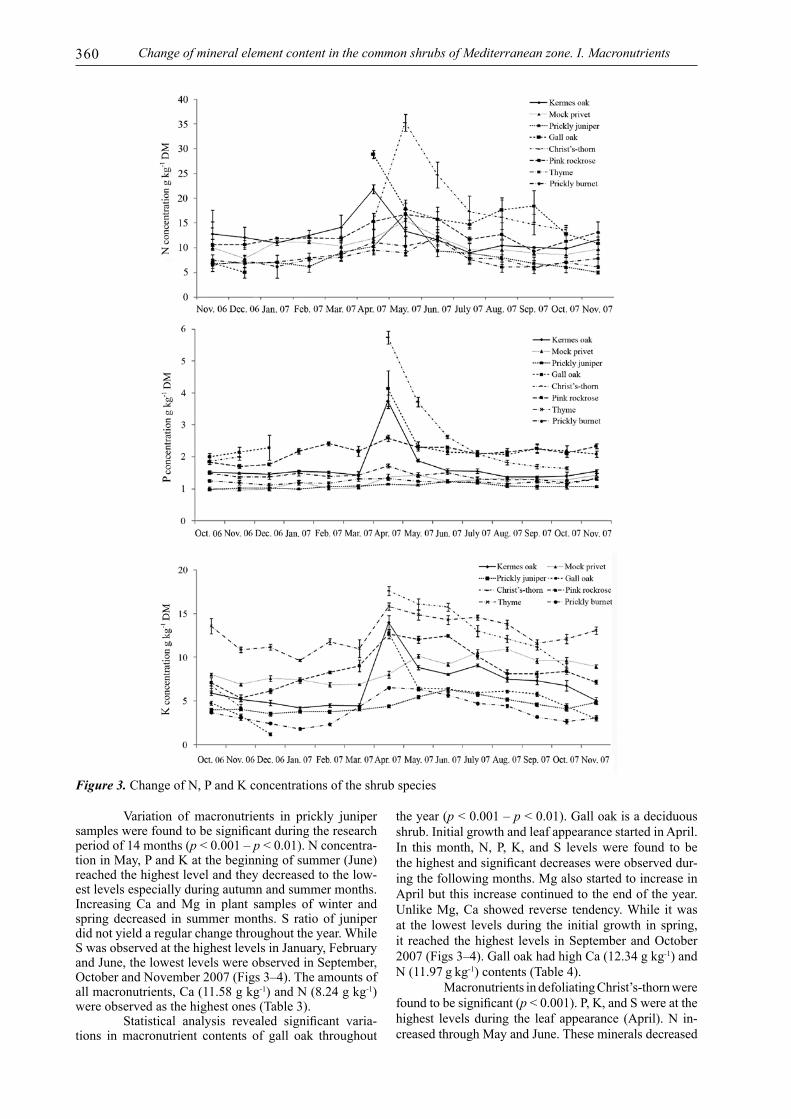
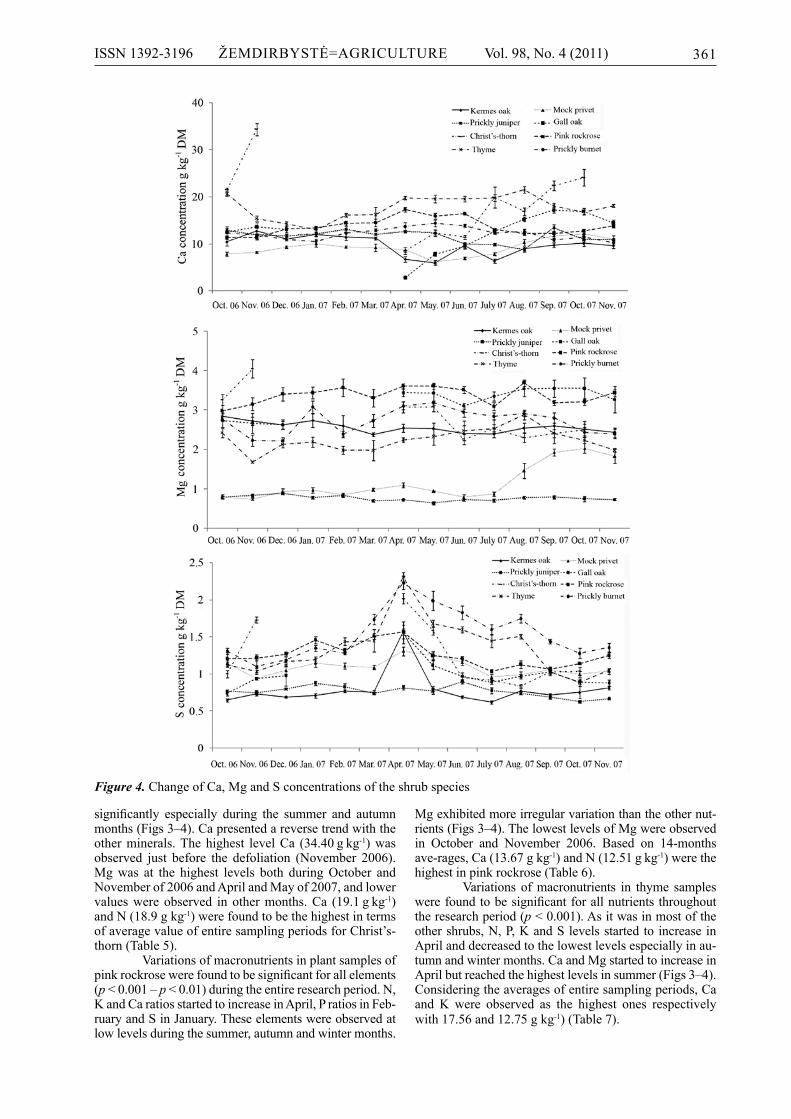
Figure 4.ChangeofCa,MgandSconcentrationsoftheshrubspecies
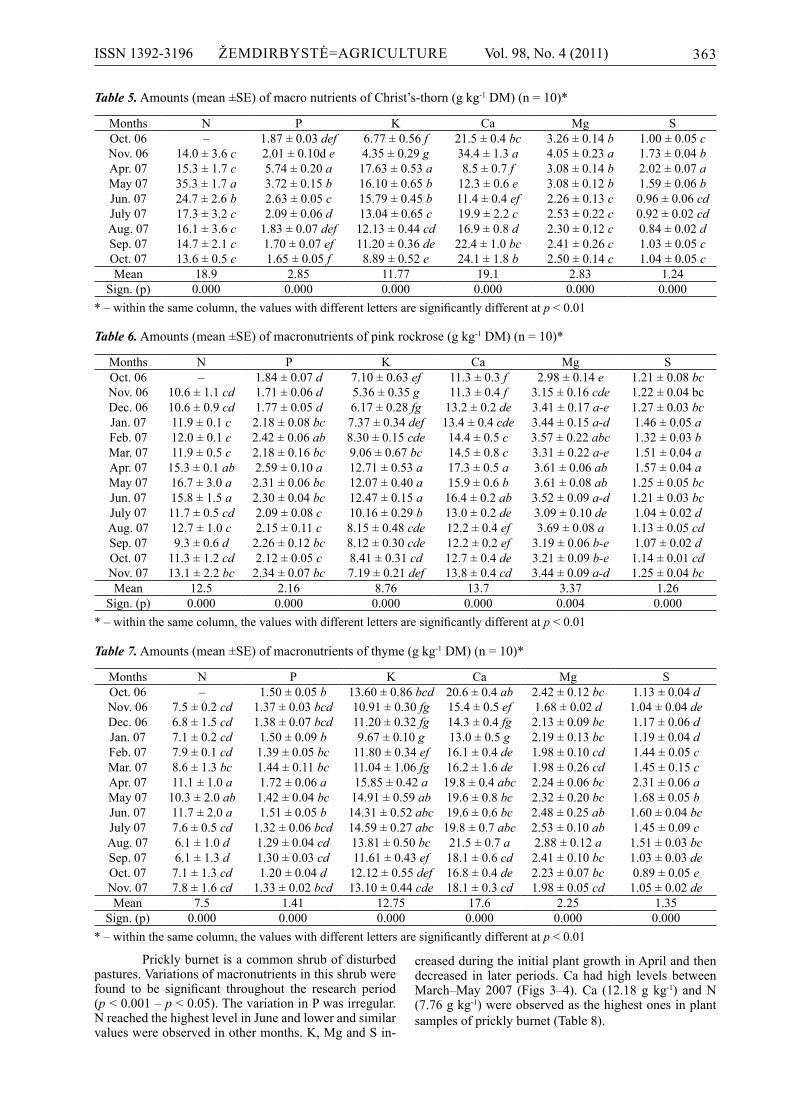
significantly especially during the summer and autumnmonths(Figs3–4).Capresentedareversetrendwiththeotherminerals.Thehighest levelCa (34.40 g kg-1)wasobserved just before the defoliation (November 2006).Mgwas at the highest levels both duringOctober andNovemberof2006andAprilandMayof2007,andlowervalueswere observed in othermonths.Ca (19.1 g kg-1)andN(18.9gkg-1)werefoundtobethehighestintermsofaveragevalueofentiresamplingperiodsforChrist’s-thorn(Table5).
Variationsofmacronutrientsinplantsamplesofpinkrockrosewerefoundtobesignificantforallelements(p<0.001–p<0.01)duringtheentireresearchperiod.N,KandCaratiosstartedtoincreaseinApril,PratiosinFeb-ruaryandSinJanuary.Theseelementswereobservedatlowlevelsduringthesummer,autumnandwintermonths.
Mgexhibitedmoreirregularvariationthantheothernut-rients(Figs3–4).ThelowestlevelsofMgwereobservedin October and November 2006. Based on 14-monthsave-rages,Ca(13.67gkg-1)andN(12.51 g kg-1)werethehighestinpinkrockrose(Table6).
Variations ofmacronutrients in thyme sampleswerefoundtobesignificantforallnutrientsthroughouttheresearchperiod(p<0.001).Asitwasinmostoftheothershrubs,N,P,KandSlevelsstartedto increaseinAprilanddecreasedtothelowestlevelsespeciallyinau-tumnandwintermonths.CaandMgstartedtoincreaseinAprilbutreachedthehighestlevelsinsummer(Figs 3–4).Consideringtheaveragesofentiresamplingperiods,Caand K were observed as the highest ones respectivelywith17.56and12.75gkg-1)(Table7).
362 Change of mineral element content in the common shrubs of Mediterranean zone. I. Macronutrients
Table 2.Amounts(mean±SE)ofmacronutrientsofmockprivet(gkg-1DM)(n=10)*
Months N P K Ca Mg SOct.06 – 1.03±0.04c 8.06±0.16e 7.8±0.4ef 0.80±0.05d 1.15±0.04bcNov.06 10.0±0.3cde 0.97±0.01c 6.92±0.16f 8.2±0.2ef 0.74±0.02d 0.94±0.02fDec.06 7.8±0.7f 1.00±0.05c 7.60±0.36ef 9.3±0.3de 0.93±0.07cd 1.05±0.05c-fJan.07 11.2±0.2bcd 1.22±0.05b 7.42±0.22ef 10.0±0.7cd 0.97±0.07cd 1.15±0.06bcFeb.07 11.1±0.3bcd 1.01±0.03c 6.87±0.25f 9.3±0.2de 0.85±0.05cd 1.11±0.04cdMar.07 10.3±1.3b-e 1.04±0.03c 6.91±0.09f 9.2±0.8de 0.98±0.04cd 1.09±0.03cdeApr.07 11.9±1.9bc 1.37±0.10ab 8.04±0.39e 8.7±0.5de 1.10±0.06c 1.31±0.06aMay07 15.5±1.3a 1.44±0.07a 10.14±0.23bc 6.1±0.4g 0.94±0.01cd 1.25±0.06abJun.07 12.2±0.8b 1.24±0.01b 9.19±0.19d 6.9±0.3fg 0.80±0.05d 1.16±0.04bcJuly07 9.6±1.2def 1.28±0.10b 10.56±0.34ab 7.8±0.3ef 0.87±0.05cd 0.96±0.04efAug.07 9.6±1.0def 1.35±0.04ab 10.95±0.28a 10.3±0.7bcd 1.46±0.19b 0.99±0.04defSep.07 8.9±0.4ef 1.28±0.03b 9.62±0.26cd 11.7±0.7ab 1.93±0.09a 1.06±0.04c-fOct.07 8.6±1.3ef 1.29±0.01ab 9.66±0.36cd 12.1±0.5abc 2.03±0.12a 1.00±0.04defNov.07 9.7±1.0def 1.44±0.04a 8.96±0.19d 11.0±0.7a 1.83±0.18a 1.04±0.04c-fMean 10.5 1.21 8.64 9.2 1.16 1.09
Sign.(p) 0.000 0.000 0.000 0.000 0.000 0.000*–withinthesamecolumn,thevalueswithdifferentlettersaresignificantlydifferentatp<0.01
Table 3.Amounts(mean±SE)ofmacronutrientsofpricklyjuniper(gkg-1DM)(n=10)*
Months N P K Ca Mg SOct.06 – 0.98±0.03d 4.00±0.19gh 12.9±0.8ab 0.79±0.03abc 0.77±0.02cdeNov.06 6.8±0.3efg 1.03±0.03cd 4.06±0.04fgh 11.9±0.2abc 0.83±0.04ab 0.75±0.03c-fDec.06 6.9±0.9d-g 1.03±0.03cd 3.54±0.21h 11.7±0.3bc 0.89±0.03a 0.80±0.01bcdJan.07 7.0±0.1c-g 1.00±0.01d 3.79±0.06gh 12.1±0.5abc 0.78±0.03abc 0.88±0.03abFeb.07 6.2±1.1fg 1.07±0.01bcd 3.79±0.19gh 13.1±0.6ab 0.83±0.04ab 0.83±0.04abcMar.07 9.1±1.9bcd 1.09±0.05bcd 4.02±0.11gh 12.0±0.2abc 0.70±0.04cd 0.74±0.02defApr.07 10.2±1.3b 1.15±0.03abc 4.39±0.14efg 12.6±0.2ab 0.72±0.02bcd 0.82±0.03bcdMay07 16.9±1.0a 1.12±0.03bcd 5.44±0.15bc 12.3±0.7abc 0.64±0.04d 0.77±0.04cdJun.07 9.3±1.1bc 1.24±0.06a 6.31±0.28a 9.9±0.2de 0.72±0.03bcd 0.90±0.03aJuly07 8.9±2.0b-e 1.19±0.03ab 5.80±0.23ab 9.8±0.3de 0.71±0.04bcd 0.78±0.04cdAug.07 8.0±1.4b-f 1.09±0.04bcd 5.16±0.14cd 8.7±0.4e 0.78±0.03abc 0.74±0.02defSep.07 6.8±1.3efg 1.07±0.06bcd 4.62±0.23def 13.4±0.7a 0.79±0.04abc 0.69±0.03efgOct.07 6.1±1.1fg 1.07±0.06bcd 4.12±0.23fgh 10.9±0.5cd 0.75±0.07bcd 0.63±0.02gNov.07 5.0±0.3g 1.07±0.02bcd 4.82±0.19de 10.9±0.2cd 0.73±0.03bcd 0.67±0.01fgMean 8.2 1.085 4.56 11.6 0.76 0.77
Sign.(p) 0.000 0.002 0.000 0.000 0.004 0.000
*–withinthesamecolumn,thevalueswithdifferentlettersaresignificantlydifferentatp<0.01
Table 4.Amounts(mean±SE)ofmacronutrientsofgalloak(gkg-1DM)(n=10)*
Months N P K Ca Mg SOct.06 – 2.01±0.10b 4.78±0.22d 12.5±0.8e 2.74±0.17bcd 0.74±0.03dNov.06 6.9±1.7f 2.15±0.16b 3.30±0.26e 13.6±0.9cde 2.67±0.25cd 0.94±0.02bcdDec.06 5.0±1.1f 2.29±0.39b 1.23±0.15f 13.1±0.7de 2.63±0.12d 0.98±0.14bcApr.07 28.9±0.8a 4.14±0.56a 12.81±0.24a 2.8±0.2g 3.44±0.10a 1.56±0.15aMay07 17.8±1.2bc 2.33±0.14b 6.48±0.18b 7.8±0.4f 3.43±0.23a 1.12±0.06bJun.07 15.7±2.5bcd 2.16±0.08b 6.36±0.21bc 9.5±0.5f 3.10±0.07a-d 0.97±0.01bcJuly07 14.7±0.9cd 2.12±0.08b 5.95±0.10bc 12.7±0.6de 3.35±0.11ab 0.89±0.03cdAug.07 17.6±2.5bc 2.08±0.06b 6.13±0.19bc 15.2±0.5bc 3.54±0.20a 0.97±0.03bcSep.07 18.4±3.2b 2.26±0.15b 5.81±0.24c 17.2±0.6a 3.55±0.22a 1.03±0.02bcOct.07 12.8±1.7de 2.18±0.18b 4.41±0.31d 16.9±0.7ab 3.55±0.27a 0.89±0.03cdNov.07 10.9±1.3e 2.09±0.10b 2.98±0.25e 14.5±0.6cd 3.27±0.34abc 0.88±0.04cdMean 12.0 2.35 5.48 12.3 3.21 1.00
Sign.(p) 0.000 0.000 0.000 0.000 0.004 0.000*–withinthesamecolumn,thevalueswithdifferentlettersaresignificantlydifferentatp<0.01
ISSN 1392-3196 ŽEMDIRBYSTĖ=AGRICULTURE Vol.98,No.4(2011) 363
Table 5.Amounts(mean±SE)ofmacronutrientsofChrist’s-thorn(gkg-1DM)(n=10)*
Months N P K Ca Mg SOct.06 – 1.87±0.03def 6.77±0.56f 21.5±0.4bc 3.26±0.14b 1.00±0.05cNov.06 14.0±3.6c 2.01±0.10de 4.35±0.29g 34.4±1.3a 4.05±0.23a 1.73±0.04bApr.07 15.3±1.7c 5.74±0.20a 17.63±0.53a 8.5±0.7f 3.08±0.14b 2.02±0.07aMay07 35.3±1.7a 3.72±0.15b 16.10±0.65b 12.3±0.6e 3.08±0.12b 1.59±0.06bJun.07 24.7±2.6b 2.63±0.05c 15.79±0.45b 11.4±0.4ef 2.26±0.13c 0.96±0.06cdJuly07 17.3±3.2c 2.09±0.06d 13.04±0.65c 19.9±2.2c 2.53±0.22c 0.92±0.02cdAug.07 16.1±3.6c 1.83±0.07def 12.13±0.44cd 16.9±0.8d 2.30±0.12c 0.84±0.02dSep.07 14.7±2.1c 1.70±0.07ef 11.20±0.36de 22.4±1.0bc 2.41±0.26c 1.03±0.05cOct.07 13.6±0.5c 1.65±0.05f 8.89±0.52e 24.1±1.8b 2.50±0.14c 1.04±0.05cMean 18.9 2.85 11.77 19.1 2.83 1.24
Sign.(p) 0.000 0.000 0.000 0.000 0.000 0.000*–withinthesamecolumn,thevalueswithdifferentlettersaresignificantlydifferentatp<0.01
Table 6.Amounts(mean±SE)ofmacronutrientsofpinkrockrose(gkg-1DM)(n=10)*
Months N P K Ca Mg SOct.06 – 1.84±0.07d 7.10±0.63ef 11.3±0.3f 2.98±0.14e 1.21±0.08bcNov.06 10.6±1.1cd 1.71±0.06d 5.36±0.35g 11.3±0.4f 3.15±0.16cde 1.22±0.04bcDec.06 10.6±0.9cd 1.77±0.05d 6.17±0.28fg 13.2±0.2de 3.41±0.17a-e 1.27±0.03bcJan.07 11.9±0.1c 2.18±0.08bc 7.37±0.34def 13.4±0.4cde 3.44±0.15a-d 1.46±0.05aFeb.07 12.0±0.1c 2.42±0.06ab 8.30±0.15cde 14.4±0.5c 3.57±0.22abc 1.32±0.03bMar.07 11.9±0.5c 2.18±0.16bc 9.06±0.67bc 14.5±0.8c 3.31±0.22a-e 1.51±0.04aApr.07 15.3±0.1ab 2.59±0.10a 12.71±0.53a 17.3±0.5a 3.61±0.06ab 1.57±0.04aMay07 16.7±3.0a 2.31±0.06bc 12.07±0.40a 15.9±0.6b 3.61±0.08ab 1.25±0.05bcJun.07 15.8±1.5a 2.30±0.04bc 12.47±0.15a 16.4±0.2ab 3.52±0.09a-d 1.21±0.03bcJuly07 11.7±0.5cd 2.09±0.08c 10.16±0.29b 13.0±0.2de 3.09±0.10de 1.04±0.02dAug.07 12.7±1.0c 2.15±0.11c 8.15±0.48cde 12.2±0.4ef 3.69±0.08a 1.13±0.05cdSep.07 9.3±0.6d 2.26±0.12bc 8.12±0.30cde 12.2±0.2ef 3.19±0.06b-e 1.07±0.02dOct.07 11.3±1.2cd 2.12±0.05c 8.41±0.31cd 12.7±0.4de 3.21±0.09b-e 1.14±0.01cdNov.07 13.1±2.2bc 2.34±0.07bc 7.19±0.21def 13.8±0.4cd 3.44±0.09a-d 1.25±0.04bcMean 12.5 2.16 8.76 13.7 3.37 1.26
Sign.(p) 0.000 0.000 0.000 0.000 0.004 0.000*–withinthesamecolumn,thevalueswithdifferentlettersaresignificantlydifferentatp<0.01
Table 7.Amounts(mean±SE)ofmacronutrientsofthyme(gkg-1DM)(n=10)*
Months N P K Ca Mg SOct.06 – 1.50±0.05b 13.60±0.86bcd 20.6±0.4ab 2.42±0.12bc 1.13±0.04dNov.06 7.5±0.2cd 1.37±0.03bcd 10.91±0.30fg 15.4±0.5ef 1.68±0.02d 1.04±0.04deDec.06 6.8±1.5cd 1.38±0.07bcd 11.20±0.32fg 14.3±0.4fg 2.13±0.09bc 1.17±0.06dJan.07 7.1±0.2cd 1.50±0.09b 9.67±0.10g 13.0±0.5g 2.19±0.13bc 1.19±0.04dFeb.07 7.9±0.1cd 1.39±0.05bc 11.80±0.34ef 16.1±0.4de 1.98±0.10cd 1.44±0.05cMar.07 8.6±1.3bc 1.44±0.11bc 11.04±1.06fg 16.2±1.6de 1.98±0.26cd 1.45±0.15cApr.07 11.1±1.0a 1.72±0.06a 15.85±0.42a 19.8±0.4abc 2.24±0.06bc 2.31±0.06aMay07 10.3±2.0ab 1.42±0.04bc 14.91±0.59ab 19.6±0.8bc 2.32±0.20bc 1.68±0.05bJun.07 11.7±2.0a 1.51±0.05b 14.31±0.52abc 19.6±0.6bc 2.48±0.25ab 1.60±0.04bcJuly07 7.6±0.5cd 1.32±0.06bcd 14.59±0.27abc 19.8±0.7abc 2.53±0.10ab 1.45±0.09cAug.07 6.1±1.0d 1.29±0.04cd 13.81±0.50bc 21.5±0.7a 2.88±0.12a 1.51±0.03bcSep.07 6.1±1.3d 1.30±0.03cd 11.61±0.43ef 18.1±0.6cd 2.41±0.10bc 1.03±0.03deOct.07 7.1±1.3cd 1.20±0.04d 12.12±0.55def 16.8±0.4de 2.23±0.07bc 0.89±0.05eNov.07 7.8±1.6cd 1.33±0.02bcd 13.10±0.44cde 18.1±0.3cd 1.98±0.05cd 1.05±0.02deMean 7.5 1.41 12.75 17.6 2.25 1.35
Sign.(p) 0.000 0.000 0.000 0.000 0.000 0.000*–withinthesamecolumn,thevalueswithdifferentlettersaresignificantlydifferentatp<0.01
Pricklyburnetisacommonshrubofdisturbedpastures.Variationsofmacronutrientsinthisshrubwerefound to be significant throughout the research period(p<0.001–p<0.05).ThevariationinPwasirregular.NreachedthehighestlevelinJuneandlowerandsimilarvalueswereobservedinothermonths.K,MgandSin-
creasedduringtheinitialplantgrowthinAprilandthendecreased in later periods.Cahadhigh levels betweenMarch–May2007 (Figs 3–4).Ca (12.18 g kg-1) andN(7.76gkg-1)wereobservedasthehighestonesinplantsamplesofpricklyburnet(Table8).
364 Change of mineral element content in the common shrubs of Mediterranean zone. I. Macronutrients
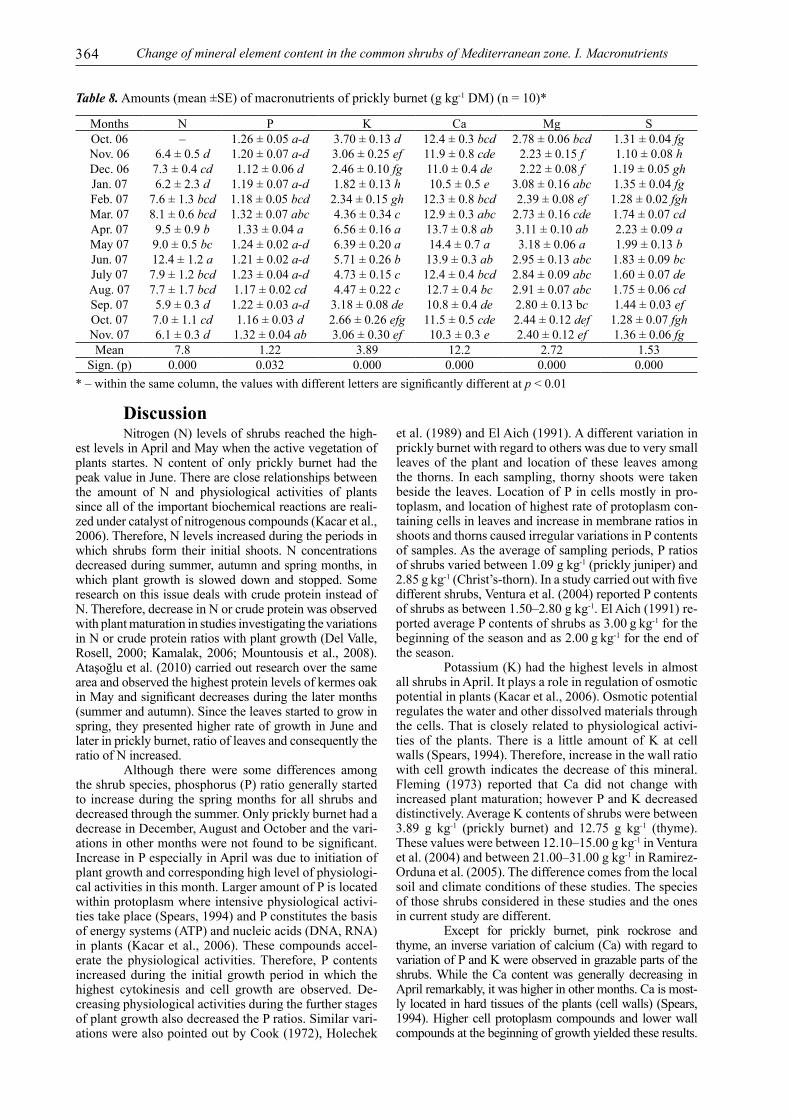
Table 8.Amounts(mean±SE)ofmacronutrientsofpricklyburnet(gkg-1DM)(n=10)*
Months N P K Ca Mg SOct.06 – 1.26±0.05a-d 3.70±0.13d 12.4±0.3bcd 2.78±0.06bcd 1.31±0.04fgNov.06 6.4±0.5d 1.20±0.07a-d 3.06±0.25ef 11.9±0.8cde 2.23±0.15f 1.10±0.08hDec.06 7.3±0.4cd 1.12±0.06d 2.46±0.10fg 11.0±0.4de 2.22±0.08f 1.19±0.05ghJan.07 6.2±2.3d 1.19±0.07a-d 1.82±0.13h 10.5±0.5e 3.08±0.16abc 1.35±0.04fgFeb.07 7.6±1.3bcd 1.18±0.05bcd 2.34±0.15gh 12.3±0.8bcd 2.39±0.08ef 1.28±0.02fghMar.07 8.1±0.6bcd 1.32±0.07abc 4.36±0.34c 12.9±0.3abc 2.73±0.16cde 1.74±0.07cdApr.07 9.5±0.9b 1.33±0.04a 6.56±0.16a 13.7±0.8ab 3.11±0.10ab 2.23±0.09aMay07 9.0±0.5bc 1.24±0.02a-d 6.39±0.20a 14.4±0.7a 3.18±0.06a 1.99±0.13bJun.07 12.4±1.2a 1.21±0.02a-d 5.71±0.26b 13.9±0.3ab 2.95±0.13abc 1.83±0.09bcJuly07 7.9±1.2bcd 1.23±0.04a-d 4.73±0.15c 12.4±0.4bcd 2.84±0.09abc 1.60±0.07deAug.07 7.7±1.7bcd 1.17±0.02cd 4.47±0.22c 12.7±0.4bc 2.91±0.07abc 1.75±0.06cdSep.07 5.9±0.3d 1.22±0.03a-d 3.18±0.08de 10.8±0.4de 2.80±0.13bc 1.44±0.03efOct.07 7.0±1.1cd 1.16±0.03d 2.66±0.26efg 11.5±0.5cde 2.44±0.12def 1.28±0.07fghNov.07 6.1±0.3d 1.32±0.04ab 3.06±0.30ef 10.3±0.3e 2.40±0.12ef 1.36±0.06fgMean 7.8 1.22 3.89 12.2 2.72 1.53
Sign.(p) 0.000 0.032 0.000 0.000 0.000 0.000*–withinthesamecolumn,thevalueswithdifferentlettersaresignificantlydifferentatp<0.01
DiscussionNitrogen(N)levelsofshrubsreachedthehigh-
estlevelsinAprilandMaywhentheactivevegetationofplants startes. N content of only prickly burnet had thepeakvalueinJune.Therearecloserelationshipsbetweenthe amount of N and physiological activities of plantssincealloftheimportantbiochemicalreactionsarereali-zedundercatalystofnitrogenouscompounds(Kacaretal.,2006).Therefore,Nlevelsincreasedduringtheperiodsinwhich shrubs form their initial shoots.N concentrationsdecreasedduringsummer,autumnandspringmonths,inwhichplant growth is sloweddown and stopped.SomeresearchonthisissuedealswithcrudeproteininsteadofN.Therefore,decreaseinNorcrudeproteinwasobservedwithplantmaturationinstudiesinvestigatingthevariationsinNorcrudeproteinratioswithplantgrowth(DelValle,Rosell, 2000;Kamalak, 2006;Mountousis et al., 2008).Ataşoğluetal.(2010)carriedoutresearchoverthesameareaandobservedthehighestproteinlevelsofkermesoakinMayandsignificantdecreasesduringthelatermonths(summerandautumn).Sincetheleavesstartedtogrowinspring, theypresentedhigherrateofgrowthinJuneandlaterinpricklyburnet,ratioofleavesandconsequentlytheratioofNincreased.
Although there were some differences amongtheshrubspecies,phosphorus(P)ratiogenerallystartedto increaseduring thespringmonthsforallshrubsanddecreasedthroughthesummer.OnlypricklyburnethadadecreaseinDecember,AugustandOctoberandthevari-ationsinothermonthswerenotfoundtobesignificant.IncreaseinPespeciallyinAprilwasduetoinitiationofplantgrowthandcorrespondinghighlevelofphysiologi-calactivitiesinthismonth.LargeramountofPislocatedwithinprotoplasmwhereintensivephysiologicalactivi-tiestakeplace(Spears,1994)andPconstitutesthebasisofenergysystems(ATP)andnucleicacids(DNA,RNA)inplants (Kacaret al.,2006).Thesecompoundsaccel-erate thephysiological activities.Therefore,P contentsincreasedduring the initialgrowthperiod inwhich thehighest cytokinesis and cell growth are observed. De-creasingphysiologicalactivitiesduringthefurtherstagesofplantgrowthalsodecreasedthePratios.Similarvari-ationswerealsopointedoutbyCook(1972),Holechek
etal.(1989)andElAich(1991).Adifferentvariationinpricklyburnetwithregardtootherswasduetoverysmallleavesof theplant and locationof these leaves amongthe thorns. Ineachsampling, thornyshootswere takenbeside the leaves.LocationofP incellsmostly inpro-toplasm,andlocationofhighestrateofprotoplasmcon-tainingcellsinleavesandincreaseinmembraneratiosinshootsandthornscausedirregularvariationsinPcontentsofsamples.Astheaverageofsamplingperiods,Pratiosofshrubsvariedbetween1.09gkg-1(pricklyjuniper)and2.85gkg-1(Christ’s-thorn).Inastudycarriedoutwithfivedifferentshrubs,Venturaetal.(2004)reportedPcontentsofshrubsasbetween1.50–2.80gkg-1.ElAich(1991)re-portedaveragePcontentsofshrubsas3.00 g kg-1forthebeginningoftheseasonandas2.00 g kg-1fortheendoftheseason.
Potassium(K)hadthehighestlevelsinalmostallshrubsinApril.Itplaysaroleinregulationofosmoticpotentialinplants(Kacaretal.,2006).Osmoticpotentialregulatesthewaterandotherdissolvedmaterialsthroughthecells.Thatiscloselyrelatedtophysiologicalactivi-ties of the plants.There is a little amount ofK at cellwalls(Spears,1994).Therefore,increaseinthewallratiowithcellgrowth indicates thedecreaseof thismineral.Fleming (1973) reported that Ca did not change withincreasedplantmaturation;howeverPandKdecreaseddistinctively.AverageKcontentsofshrubswerebetween3.89 g kg-1 (prickly burnet) and 12.75 g kg-1 (thyme).Thesevalueswerebetween12.10–15.00gkg-1inVenturaetal.(2004)andbetween21.00–31.00gkg-1inRamirez-Ordunaetal.(2005).Thedifferencecomesfromthelocalsoilandclimateconditionsofthesestudies.Thespeciesofthoseshrubsconsideredinthesestudiesandtheonesincurrentstudyaredifferent.
Except for prickly burnet, pink rockrose andthyme,aninversevariationofcalcium(Ca)withregardtovariationofPandKwereobservedingrazablepartsoftheshrubs.While theCacontentwasgenerallydecreasing inAprilremarkably,itwashigherinothermonths.Caismost-lylocatedinhardtissuesoftheplants(cellwalls)(Spears,1994).Highercellprotoplasmcompoundsand lowerwallcompoundsatthebeginningofgrowthyieldedtheseresults.
ISSN 1392-3196 ŽEMDIRBYSTĖ=AGRICULTURE Vol.98,No.4(2011) 365
Contraryresultsforpricklyburnet,pinkrockroseandthymecomefromhardandwoodystructureofpricklyburnetandthymeinspring(especiallyinApril)andsofterstructureofpinkrockrosebothinspringandintheothermonths.Aver-ageCacontentsof theinvestigatedshrubsvariedbetween9.16gkg-1(mockprivet)and19.05gkg-1(Christ’s-thorn).LowerCaratios(3.20–22.70gkg-1)wereobservedbyVen-turaetal.(2004)orhighervalues(21.40–28.00gkg-1)wereobservedbyRamirez-Ordunaetal.(2005).
Variation in magnesium (Mg) content wasfoundtobeinsignificantinkermesoak.Itincreasedsig-nificantlyinfallandwinterformockprivetandpricklyjuniper,inspringandsummerforgalloak,pricklyburnetandpinkrockrose, insummerforthymeandinfallforChrist’s-thorn.SincegalloakandChrist’s-thorndefoli-ate inwinter, plant sampleswere not able to be takenin this season. Therefore, seasonal variation trend forMgcontentsofshrubswasdifferentfromtheotherele-ments(Figs3–4).AsstatedbySpears(1994),mostoftheMgislocatedwithinprotoplasm.Thatwasobservedingalloak,pinkrockroseandpricklyburnet.Sincethymesproutsoutinsummer,increaseinMgcontentinsummerfor this shrubwas an expected case.However, inversecaseswereobservedinpricklyjuniper,mockprivetandChrist’s-thornandtheresultswerenotable tobe inter-preted.ResultsaboutvariationinMgcontentsofplantsvary according to researchers. For instance, Ramirez-Ordunaet al. (2005)performeda study inMexicoandindicatedthatvariationinMgcontentsofshrubswithre-gardtoseasonswasnotsignificant;Greeneetal.(1987)andRamirezetal.(2001)indicatedthatvariationinMgcontentwassignificant.Astheaverageofsamplingperi-ods,thelowestMgcontent(0.76gkg-1)wasobservedinpricklyjuniperandthehighest(3.37gkg-1)wasobservedinpinkrockrose.Mgcontentsinotherstudieswerebe-tween 2.90–4.80 g kg-1 and 1.20–8.20 g kg-1 (Venturaet al.,2004;Ramirez-Ordunaetal.,2005).
Monthly variations in sulphur (S) ratios ofplantsweresimilartovariationsinPandK.Again,mostofthiselementisalsolocatedwithinprotoplasmofcells(Spears, 1994). Significant increases were observed inspring,especiallyinAprilinallshrubsexceptforpricklyjuniper.VariationofSinpricklyjuniperdidnotfollowanorderwithgrowingseason.AverageScontentsofplantsamples throughout the research period were between0.77 g kg-1 (prickly juniper) and 1.53 g kg-1 (pricklyburnet).AsstatedbyGüneşetal. (2000)plantsshouldhaveanScontentequalto0.5–1.0%oftheirdryweights.Basedon these criteria, shrubs in this studyhad insuf-ficientamountsofSintheirstructure.Asaresultoftheobservations,Sdeficiencysymptomsintheshrubswerenotabletobefound.
ConclusionsThemacronutrientsconsideredinthisresearch
were interpreted by taking the maintenance for goatsinto consideration.An average goat with about 50 kglive-weightshouldconsumeatleast2.12gCa(Meschy,2000),1.28gP(Pfeffer,1989),12.0gN,5.6gK,0.87gMgand2.2gS(NationalResearchCouncil,2007)daily.Thefollowingconclusionscanbedrawnconsidering1kgdailyshrubconsumptionofagoatfromtherangeland:
1.AmountofNinkg-drymatterofkermesoakwasnotsufficientinsummerandautumnmonths.Nde-
ficiencywasobservedmost of the timeexcept inMayandJuneformockprivet,inMayforpricklyjuniper,inApril,MayandJuneforpinkrockrose.Nwassufficientingalloakinallseasonsexceptinwinter.TherewasnotNdeficiencyinChrist’s-thorn.ThymehadNdeficiencyinallseasons.
2.Pconcentrationwassufficientinkermes,galloaks,Christ’s-thorn,pink rockroseand thyme through-outthesamplingperiods.MockprivethadPdeficiencyinwintermonths.PricklyjuniperhadsufficientPlevelsonlyinJuneandpricklyburnethadsufficientPgenerallyinspringandautumn.
3.AlltheshrubshadsufficientKandCacon-tents.
4. Kermes oak, gall oak, Christ’s-thorn, pinkrockrose, thyme and prickly burnet had sufficient Mgcontent.MockprivethadsufficientMglevelsthroughoutthe samplingperiodsexpect inOctober andNovember2006andJuneandJuly2007.Mgdeficiencyforgrazinggoats can alsobementioned forprickly juniperduringtheresearchperiod.
5.AnS deficiencywas not observed in shrubsamplesexceptforthesamplesofthymeandpricklybur-nettakeninApril.
Besides the above stated conclusions, the factisthatundernormalconditionsgoatsgetabout50–60%oftheirdailydrymatterconsumptionfromtheshrubsofpastures.Asaresult,ifthegoatsaresuppliedwithNbothin the summer andwinter andwith S in every period,shrublandsproduceadequateamountsofforagerequire-mentsofgoats.
AcknowledgementsThis research was supported by TÜBİTAK
(ProjectNo.106O458).Received06062011Accepted05092011
ReferencesAtaşoğluC.,ŞahinS.,CanbolatÖ.,BaytekinH.Theeffectof
harveststageonthepotentialnutritivevalueofkermesoak(Quercus coccifera)leaves//LivestockResearchforRuralDevelopment.–2010,vol.22,p.182–185
BremnerJ.M.DeterminationofnitrogeninsoilsbyKjeldahlmethod//JournalofAgriculturalScience.–1960,vol.55,p.1–23
CookC.W.Comparativenutritivevaluesofforbs,grassesandshrubs//Wildlandshrubs:theirbiologyandutilization.–USDAForestServiceTechnicalReportINT-I,1972,5p.
CookC.W.,J.StubbendieckJ.Rangeresearch:basicproblemsandtechniques,societyforrangemanagement.–Colora-do,USA,1986,317p.
Cropproduction statistics [Bitkiselüretim istatistikleri] //Tur-kishStatisticalInstitute.–Ankara,Turkey,2010(inTurkish)
DelValleH. F.,RosellR.A.Mineral composition of peren-nialvegetationofshrubpatchesinNortheasternPatagonia//AridLandResearchandManagement.–2000,vol.14,p. 15–25
ElAichA.Roleofshrubsinecosystemfunction//OptionsMedi-terraneennes,SeriesSeminaries.–1991,No.16,p. 43–46
FlemingG.A.Mineral composition of herbage // ChemistryandBiochemistryofHerbage/ButlerG.W.,BaileyR.W.(eds).–Netherlands,1973,p.529–566
GreeneL.W.,PinchakW.E.,HeitschmidtR.K.Seasonaldy-namicsofminerals in foragesat theTexasExperimentalRanch//JournalofRangeManagement.–1987,vol.40,p.502–506
366
GüneşA.,AlpaslanM., İnalA. Bitki besleme ve gübreleme[Plantnutritionandfertilization]//AnkaraUniversityAg-riculture Faculty. –Ankara, Turkey, 2000, No. 1514 (inTurkish)
Holechek J. L., EstellR.E.,KuykendallC.B. et al. SeededwheatgrassyieldandnutritivequalityonNewMexicobigsagebrushrange//JournalofRangeManagement.–1989,vol.42,p.118–122
KacarB.,KatkatA.V.,ÖztürkŞ.Bitkifizyolojisi[Plantphy-siology].–Bursa,Turkey,2006,563p.(inTurkish)
KamalakA.Determinationofnutritivevalueofleavesofana-tivegrownshrub,Glycyrrhiza glabraL.usingin vitroandin situmeasurements//SmallRuminantResearch.–2006,vol.64,p.268–278
Meschy F. Recent progress in the assessment ofmineral re-quirements of goats // Livestock Production Science. –2000,vol.64,p.9–14
MountousisJ.,PapanikolaouK.,StanogiasG.etal.Seasonalvariationof chemical composition anddrymatterdiges-tibilityofrangelandsinNWGreece//JournalofCentralEuropeanAgriculture.–2008,vol.9,p.547–556
NationalResearchCouncil.Nutrientrequirementsofsmallru-minants:sheep,goats,cervids,andnewworldcamelids//NationalResearchCouncilof theNationalAcademies.–WashingtonD.C.,USA,2007,362p.
Papachristou T. G., NastisA. S. Diets of goats grazing oakshrublandsofvaryingcoverinnorthernGreece//JournalofRangeManagement.–1993,vol.46,p.220–226
PapachristouT.G.,NastisA.S.,MathurR.,HutchingsM.R.Effectofphysicalandchemicalplantdefensesonherbivo-ry:implicationsforMediterraneanshrublandmanagement//BasicandAppliedEcology.–2003,vol. 4,p.395–403
PapachristouT.G.,PlatisP.D.,NastisA.S.Foragingbehaviourofcattleandgoatsinoakforeststandsofvaryingcoppic-ingageinNorthernGreece//SmallRuminantResearch.–2005,vol.59,p.181–189
PapachristouT.G.,PlastisP.D.,PapanastasisV.P.,TsiouvarasC.N.Useofdeciduouswoody speciesas adiet supple-ment for goats grazingMediterranean shrublands duringthedryseason//AnimalFeedScienceandTechnology.–1999,vol.80,p.267–279
PerevolotskyA.,LandauS.,KababyaD.,UngarE.D.Dietse-lectionindairygoatsgrazingwoodyMediterraneanrange-land //AppliedAnimalBehaviour Science. – 1998, vol.57,p.117–131
PfefferE.Phosphorusrequirementsingoats:proceedingsoftheInternationalmeetingonmineral nutrition andmineral re-quirementsinruminants.–Kyoto,Japan,1989,p.153–183
Ramirez-OrdunaR.,RamirezR.G.,Gonzalez-RodriquezH.,HaenleinG.F.W.MineralcontentofbrowsespeciesfromBajaCaliforniaSur,Mexico//SmallRuminantResearch.–2005,vol.57,p.1–10
RamirezR.G.,HaenleinG.F.W.,Nunez-GonzalezM.A.Sea-sonalvariationofmacroandtracemineralcontentsin14browsespeciesthatgrowinnortheasternMexico//SmallRuminantResearch.–2001,vol.39,p.153–159
RogosicJ.AnecologicalapproachtomanagementoftheMedi-terraneannatural resources.SessionA.–Mostar,Bosni-Herzegovina,2000,p.121–130
SpearsJ.W.Mineralsinforages//ForageQuality,Evaluation,andUtilization / FaheyG. C. (ed.). –Wisconsin, USA,1994,p.281–317
VenturaM.R.,CastanonJ.I.R.,PieltainM.C.,FloresM.P.Nutritivevalueofforageshrubs:Bituminaria bituminosa,Rumex lunaria, Acacia salicina, Cassia sturtii and Ad-enocorpus foliosus //SmallRuminantResearch.–2004,vol. 52,p.13–18
Whitehead D. C. Nutrient elements in grassland: soil-plant-animalrelations.–Cambridge,UK,2000,p.70–94
WinerB.J.,BrownD.R.,MichelsK.M.Statisticalprinciplesinexperimentaldesign(3rded.).–California,USA,1991,928p.
ISSN 1392-3196 Žemdirbystė=Agriculture,vol.98,No.4(2011),p.357‒366UDK631.81.095.337:636.39.086.782
Mineralinių elementų kiekio pokyčiai Viduržemio jūros zonoje paplitusiuose krūmuose. I. Makroelementai
A.Gökkuş1,A.ÖzaslanParlak1,M.Parlak2
1ÇanakkaleOnsekizMartuniversitetas,Turkija2ÇanakkaleOnsekizMartuniversitetoLapsekiprofesinėmokykla,Turkija
Santrauka Krūmai yra būdingiViduržemio jūros zonos augalai ir svarbus ožkųmaisto šaltinis.Tačiaumitybos elementųkiekis juosesmarkiai įvairuoja,priklausomainuoklimato,dirvožemioiraugalųaugimosąlygų.AtliktakeletastyrimųapiemetinįmineraliniųmedžiagųįvairavimąkrūmuoseMarmarioregione.Šiotyrimometu14mėnesių(nuo2006m.spalio iki2007m. lapkričio) tirtassezoninismakroelementų (N,P,K,Ca,Mg irS)varijavimasQuercus coccifera,Phillyrea latifolia, Juniperus oxycedrus,Quercus infectoria,Paliurus spina-christi,Cistus creticus,Thymus longicaulisirSarcopoterium spinosumaugaluose.Makroelementųįvairavimaspermetusbuvodidelisvisuosekrūmuose.KrūmuosedidžiausiaN,P,K,irSkoncentracijabuvobalandžio–gegužėsmėnesiais,oCasmarkiaisumažėjobalandžiomėnesį.Mgvarijavopriklausomainuoaugalųrūšies.Nkiekisvisuosekrūmuose,išskyrusPaliurus spina-christiirQuercus infectoria,ožkųmitybosporeikiusgalėjopatenkintitikpavasarį.Paliurus spina-christipakankamąkiekįNturėjovisaismetųlaikais,taippatirQuercus infectoria,išskyrusžiemą.P,K,irCakiekisdaugeliuatvejųtenkinoožkųmitybosporeikius.MgJuniperus oxycedrusturėjopakankamaivisaismetųlaikais,oPhillyrea latifoliaL.–vasarąirrudenį.Mgtrūkumokituosekrūmuosenebuvonustatyta.S kiekisbuvonepakankamaspatenkintiožkųmitybosporeikius.
Reikšminiaižodžiai:makroelementai,krūmaisapaugusivietovė.
Change of mineral element content in the common shrubs of Mediterranean zone. I. Macronutrients