


Bahasa
Halaman
Hukum

ISSN 1392-3196 ŽEMDIRBYSTĖ=AGRICULTURE Vol.98,No.4(2011) 357
ISSN 1392-3196 Žemdirbystė=Agriculture,vol.98,No.4(2011),p.357‒366UDK631.81.095.337:636.39.086.782
Change of mineral element content in the common shrubs of Mediterranean zone. I. Macronutrients
AhmetGÖKKUŞ1,AltingülÖZASLANPARLAK1,MehmetPARLAK2
1ÇanakkaleOnsekizMartUniversityÇanakkale,Turkey2ÇanakkaleOnsekizMartUniversity,LapsekiVocationalSchoolÇanakkale,TurkeyE-mail: [email protected]
Abstract ShrubsarecharacteristicofMediterraneanzoneandarea significant feed source forgoats.However,nutrientcontentsofshrubsvarysignificantlywithclimate,soilandespeciallywithplantgrowth.ThereareafewstudiesonannualvariationsinmineralcontentsofshrubsinMarmaraRegion.Therefore,inthisstudy,seasonalvariationofmacronutrients(N,P,K,Ca,Mg,S)ofkermesoak(Quercus cocciferaL.),mockprivet(Phillyrea latifoliaL.),pricklyjuniper(Juniperus oxycedrusL.),galloak(Quercus infectoriaOliv.),Christ’s-thorn(Paliurus spina-christi Miller),pinkrockrose(Cistus creticusL.),thyme(Thymus longicaulisC.Presl.)andpricklyburnet(Sarcopoterium spinosum(L.)Spach)wereinvestigatedfor14months(October2006–November2007).Variationofmacronutrientsthroughouttheyearwasfoundtobesignificantforallshrubs.TheconcentrationsofN,P,K,andSintheshrubsreachedthehighestlevelsduringtheApril–Maymonths.However,CasignificantlydecreasedinApril.VariationinMgvariedwithshrubspecies.WhiletheamountofNwasabletomeetthedemandsofgoatsduringspringforallshrubsexceptforPaliurus spina-christiandQuercus infectoria, theywerenotabletomeetthedemandsinotherseasons.WhilePaliurus spina-christihadsufficientNeveryseason,Quercus infectoriahadalsosufficientNduringeachseasonexceptforwinter.P,K,andCaweremostlyobservedatsufficientamountsforgoats.WhileJuniperus oxycedrushadinsufficientMgineveryseasonandmockprivetinsummerandautumn,Mgdeficiencywasnotobservedinothershrubs.AmountsofSweregenerallyinsufficientfortheneedsofgoats.
Keywords:macronutrients,shrubbyrangeland.
IntroductionShrubsareresistanttodroughtandsalinityand
play an important role in Mediterranean ecosystems.Maquis landsareconsideredasnatural feed source forgoatsduringtheentireyear.Therefore,goatproductionactivitiesarewidespreadovertheselands(Papachristouet al.,1999;2003;Rogosic,2000).Grazingstudiescarriedout overMediterranean shrublands revealed that morethan60%ofgoatfeedcomesfromshrubs(Perevolotskyet al., 1998; Papachristou et al., 2005). The ration ofshrubsingoatfeedreachesupto80%inDecemberandJanuarymonths(Papachristou,Nastis,1993).
Nutrients generally form the constituents ofimportantcompoundsinplantsandplayaroleinenzymeactivity(Kacaretal.,2006).Theyarebasicconstituentsof body tissues in animals, provide the regulation ofosmotic pressure and pH and take part in structure ofenzymes(Whitehead,2000).ConcentrationsofN,P,K,Ca,MgandSinplantstructurevarywithplantgrowth,soil and climate conditions and several other factors.Young tissues have higher nutrient concentrations thanolder ones. For instance, N, P, S present distinctive
decreasewithmaturation.Asleavessenesce,somelossesare observed in nutrients through remobilization andleachingwithprecipitation(Whitehead,2000).Nutrientdeficiencies can be seen in animals due to changes innutrient contents of plants.Making this situation clearwillpreventthenutritionaldisordersinanimals.
Basedontheyear2009statistics,goatsconstitute13.4% (5.1million) of 38.1million livestock assets ofTurkey(Cropproductionstatistics,2010).Mediterraneanmaquis are indispensible part of goat production inTurkey. However, sufficient researches were not ableto be performed over these maquis lands since theselandswereinvolvedinforestlinesandwereprohibitedfrom grazing. Therefore, to investigate macronutrient(N,P,K,Ca,Mg,S) concentrationsof eight shrubsofkermes oak, mock privet, prickly juniper, gall oak,Christ’s-thorn,pinkrockrose,thymeandpricklyburnet,commoninMediterraneanzone,andtoemphasizeboththesignificanceof theseshrubs foranimal feedingandtoevaluatepossiblenutrientdeficienciesthroughouttheyearwerepurposedinthisstudy.
358 Change of mineral element content in the common shrubs of Mediterranean zone. I. Macronutrients
Materials and methodsThe researchwas carried out in two different
sites(AğaköyandÇiplak)ofÇanakkale,innorth-west-ernAnatolia,Turkey,betweenOctober2006–November
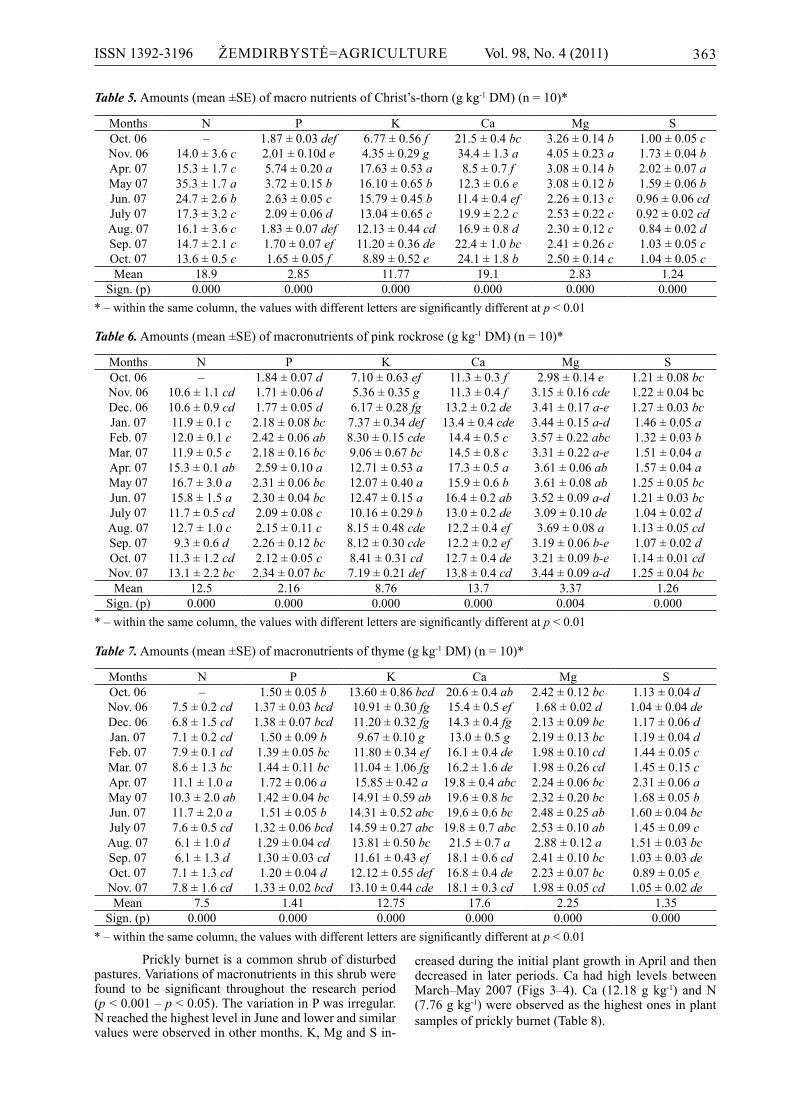
2007.AğaköyisintheCampusofBigaFacultyofEco-nomicsandAdministrativeScienceswhichis located85kmawayfromthecentreofÇanakkale,whileÇiplakislo-cated30kmawayfromthecentreofÇanakkale(Fig.1).
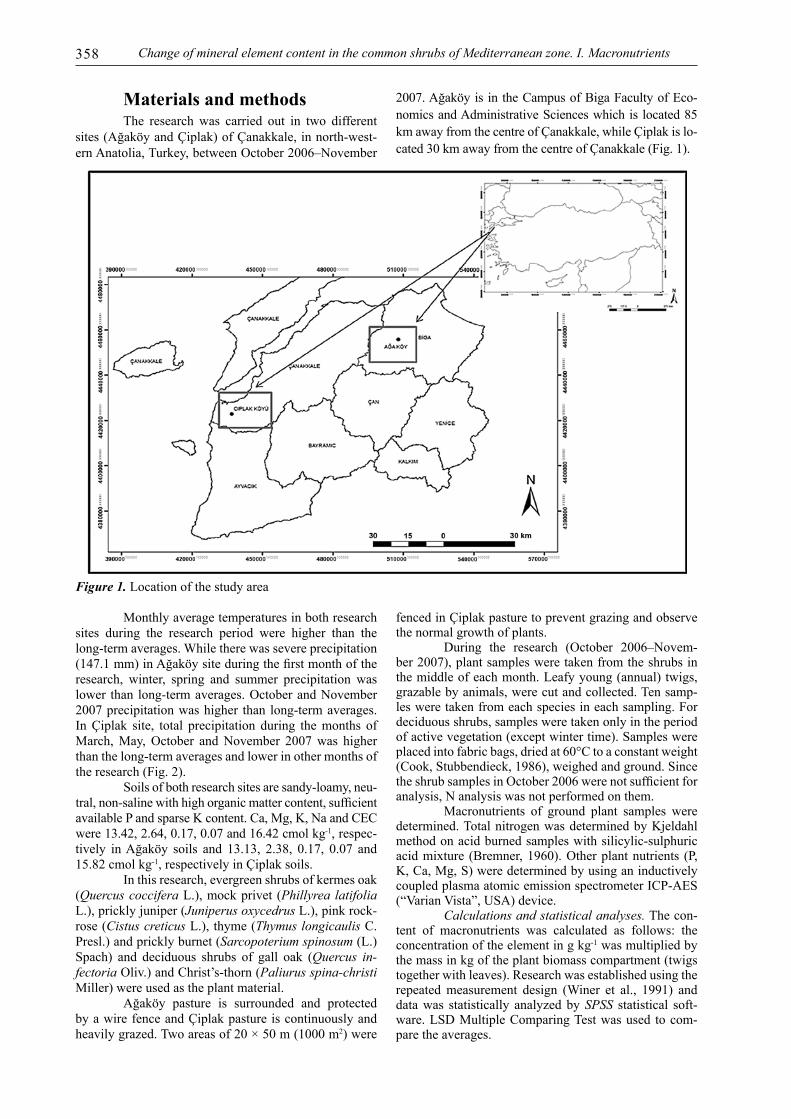
Figure 1.Locationofthestudyarea
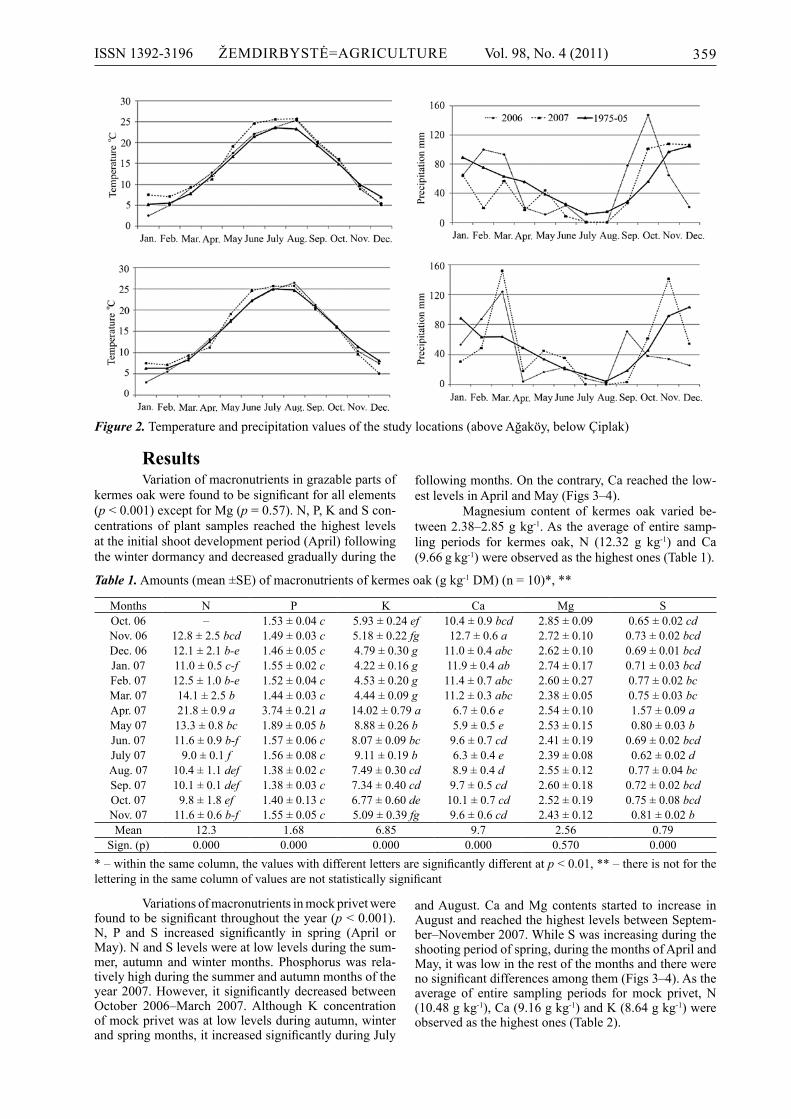
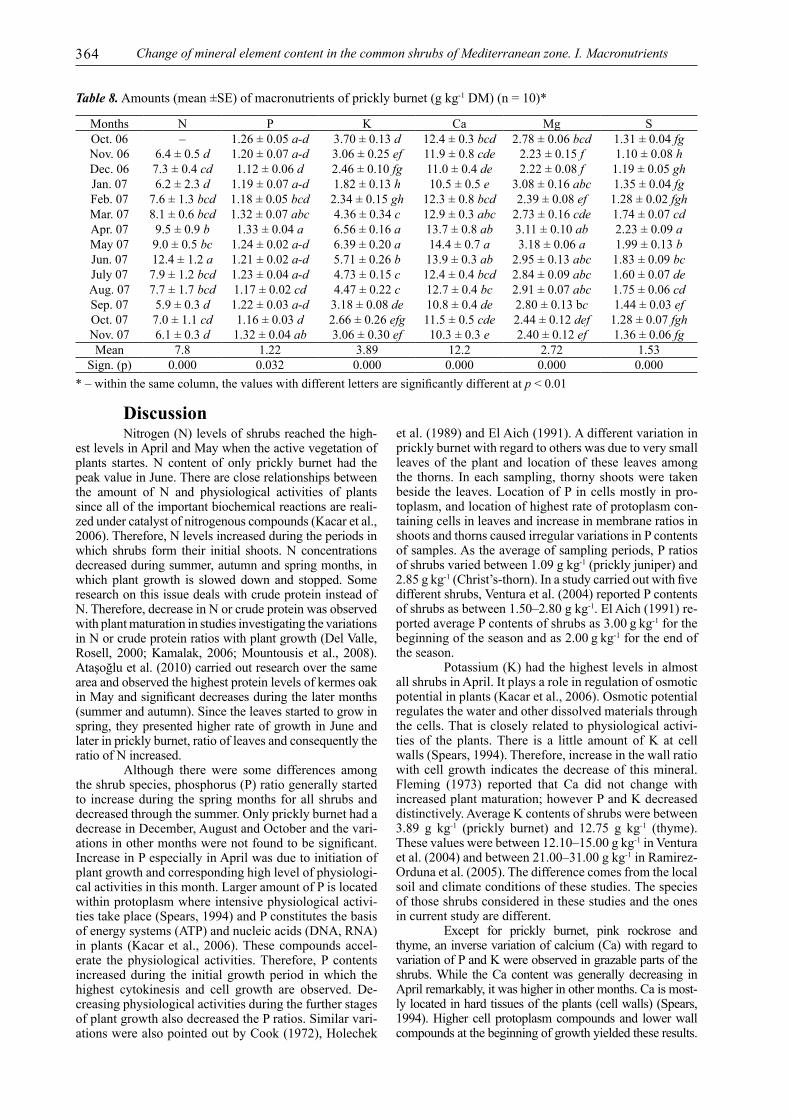
Monthlyaveragetemperaturesinbothresearchsites during the research period were higher than thelong-termaverages.Whiletherewassevereprecipitation(147.1mm)inAğaköysiteduringthefirstmonthoftheresearch, winter, spring and summer precipitation waslower than long-termaverages.OctoberandNovember2007precipitationwashigher than long-termaverages.InÇiplak site, total precipitation during themonths ofMarch,May,October andNovember 2007was higherthanthelong-termaveragesandlowerinothermonthsoftheresearch(Fig.2).
Soilsofbothresearchsitesaresandy-loamy,neu-tral,non-salinewithhighorganicmattercontent,sufficientavailablePandsparseKcontent.Ca,Mg,K,NaandCECwere13.42,2.64,0.17,0.07and16.42cmolkg-1,respec-tively inAğaköy soils and 13.13, 2.38, 0.17, 0.07 and15.82cmolkg-1,respectivelyinÇiplaksoils.
Inthisresearch,evergreenshrubsofkermesoak(Quercus cocciferaL.),mockprivet (Phillyrea latifolia L.),pricklyjuniper(Juniperus oxycedrusL.),pinkrock-rose(Cistus creticusL.),thyme(Thymus longicaulisC.Presl.)andpricklyburnet(Sarcopoterium spinosum(L.)Spach) and deciduous shrubs of gall oak (Quercus in-fectoriaOliv.)andChrist’s-thorn(Paliurus spina-christi Miller)wereusedastheplantmaterial.
Ağaköy pasture is surrounded and protectedbyawirefenceandÇiplakpastureiscontinuouslyandheavilygrazed.Twoareasof20×50m(1000m2)were
fencedinÇiplakpasturetopreventgrazingandobservethenormalgrowthofplants.
During the research (October 2006–Novem-ber2007),plantsamplesweretakenfromtheshrubsinthemiddleofeachmonth.Leafyyoung(annual)twigs,grazablebyanimals,werecutandcollected.Tensamp-lesweretakenfromeachspeciesineachsampling.Fordeciduousshrubs,samplesweretakenonlyintheperiodofactivevegetation(exceptwintertime).Sampleswereplacedintofabricbags,driedat60°Ctoaconstantweight(Cook,Stubbendieck,1986),weighedandground.SincetheshrubsamplesinOctober2006werenotsufficientforanalysis,Nanalysiswasnotperformedonthem.
Macronutrients of ground plant samples weredetermined.TotalnitrogenwasdeterminedbyKjeldahlmethodonacidburnedsampleswithsilicylic-sulphuricacidmixture (Bremner,1960).Otherplantnutrients (P,K,Ca,Mg,S)weredeterminedbyusinganinductivelycoupledplasmaatomicemissionspectrometerICP-AES(“VarianVista”,USA)device.
Calculations and statistical analyses.Thecon-tent of macronutrients was calculated as follows: theconcentrationoftheelementingkg-1wasmultipliedbythemassinkgoftheplantbiomasscompartment(twigstogetherwithleaves).Researchwasestablishedusingtherepeatedmeasurement design (Winer et al., 1991) anddatawas statistically analyzedbySPSS statistical soft-ware.LSDMultipleComparingTestwasused tocom-paretheaverages.
ISSN 1392-3196 ŽEMDIRBYSTĖ=AGRICULTURE Vol.98,No.4(2011) 359
ResultsVariationofmacronutrientsingrazablepartsof
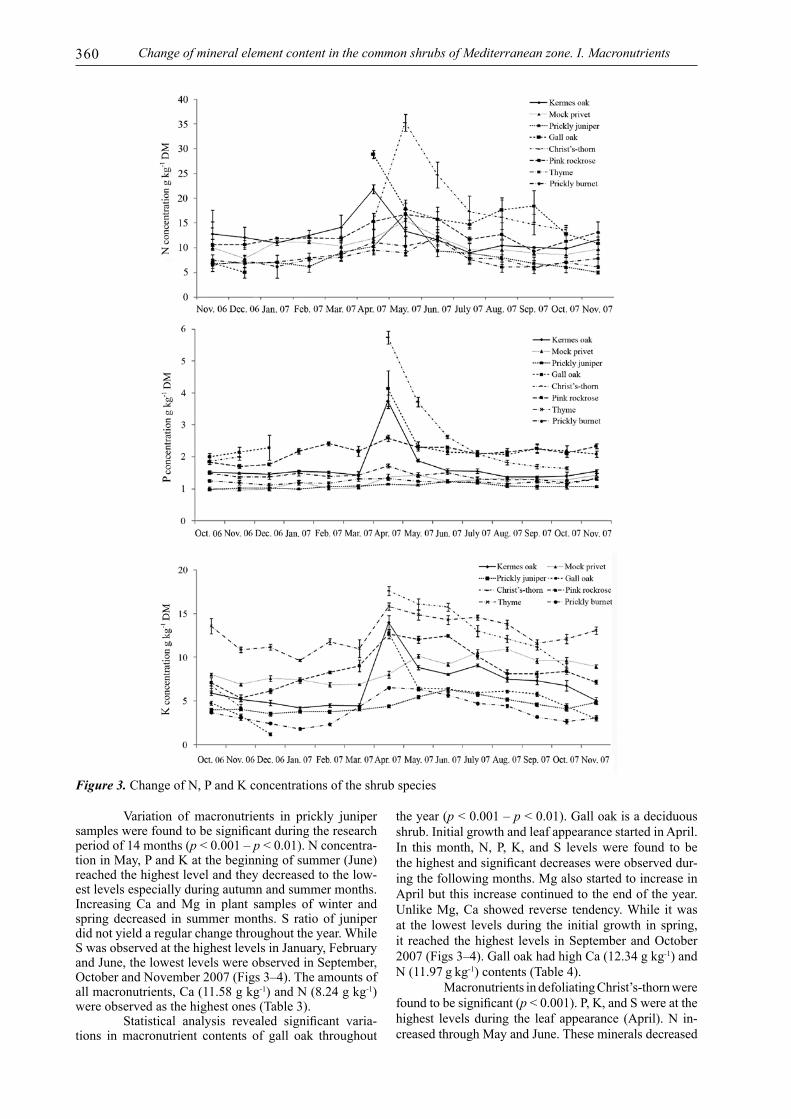
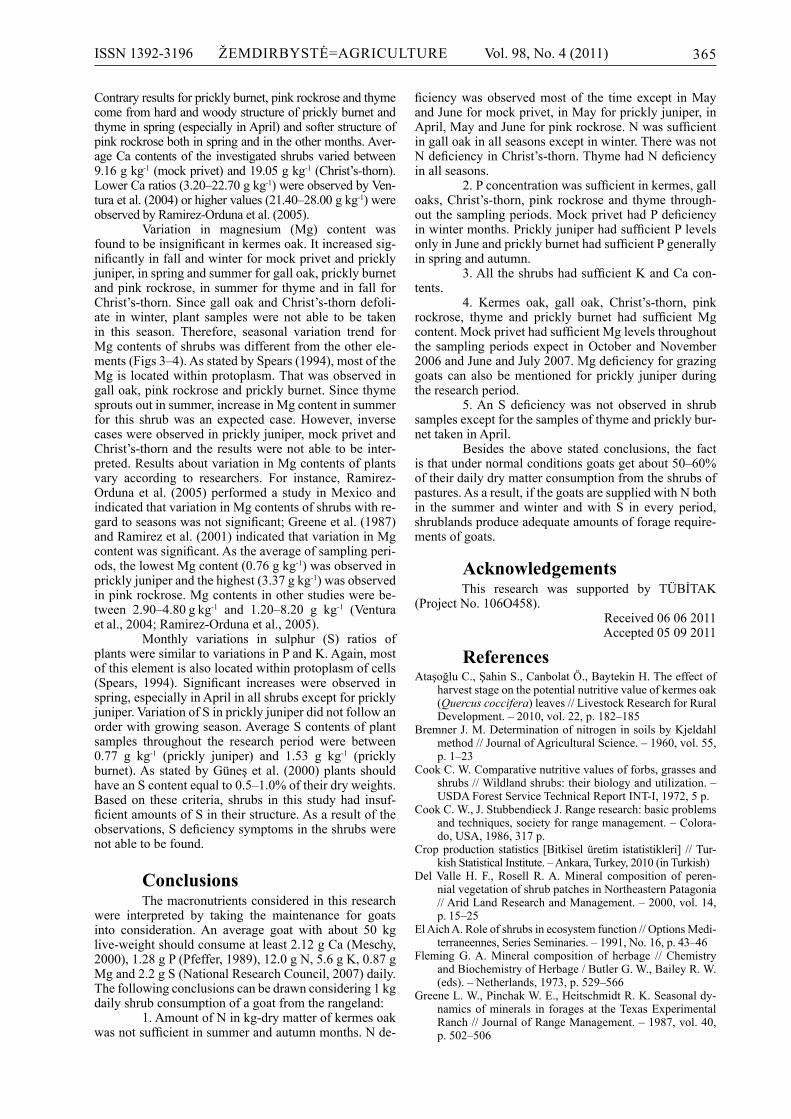
kermesoakwerefoundtobesignificantforallelements(p<0.001)exceptforMg(p=0.57).N,P,KandScon-centrations of plant samples reached the highest levelsattheinitialshootdevelopmentperiod(April)followingthewinterdormancyanddecreasedgraduallyduringthe
Figure 2.Temperatureandprecipitationvaluesofthestudylocations(aboveAğaköy,belowÇiplak)
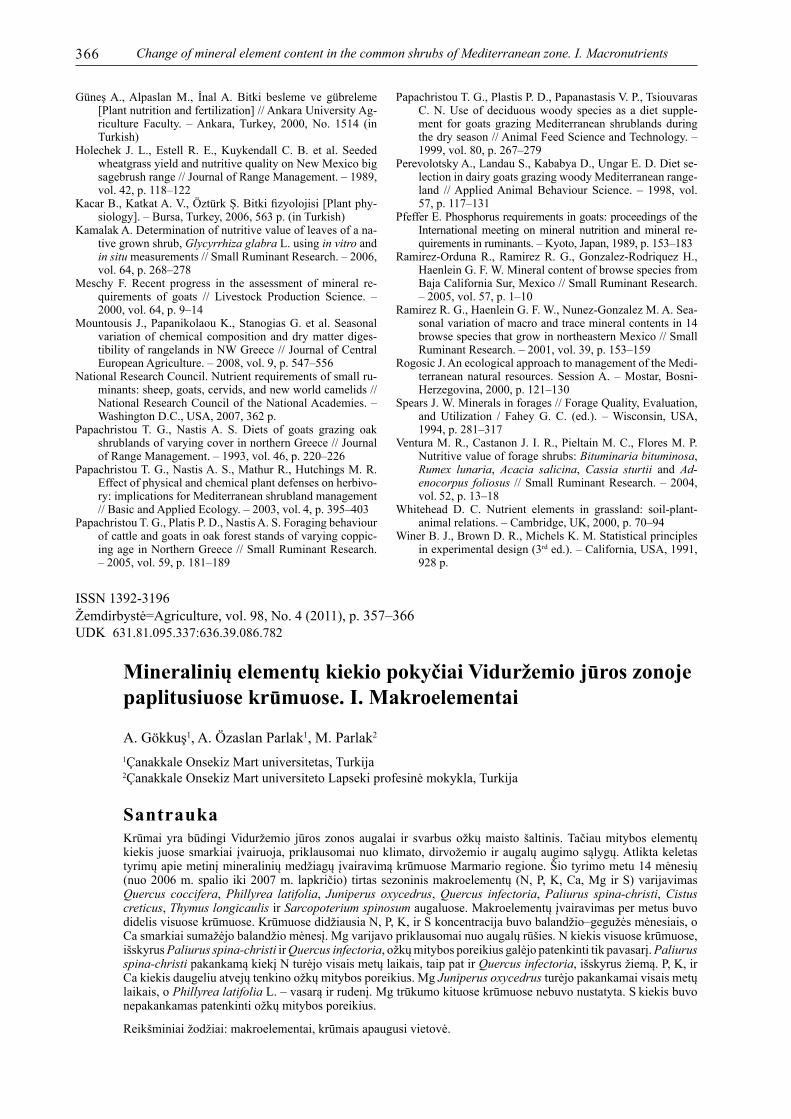
followingmonths.Onthecontrary,Careachedthelow-estlevelsinAprilandMay(Figs3–4).
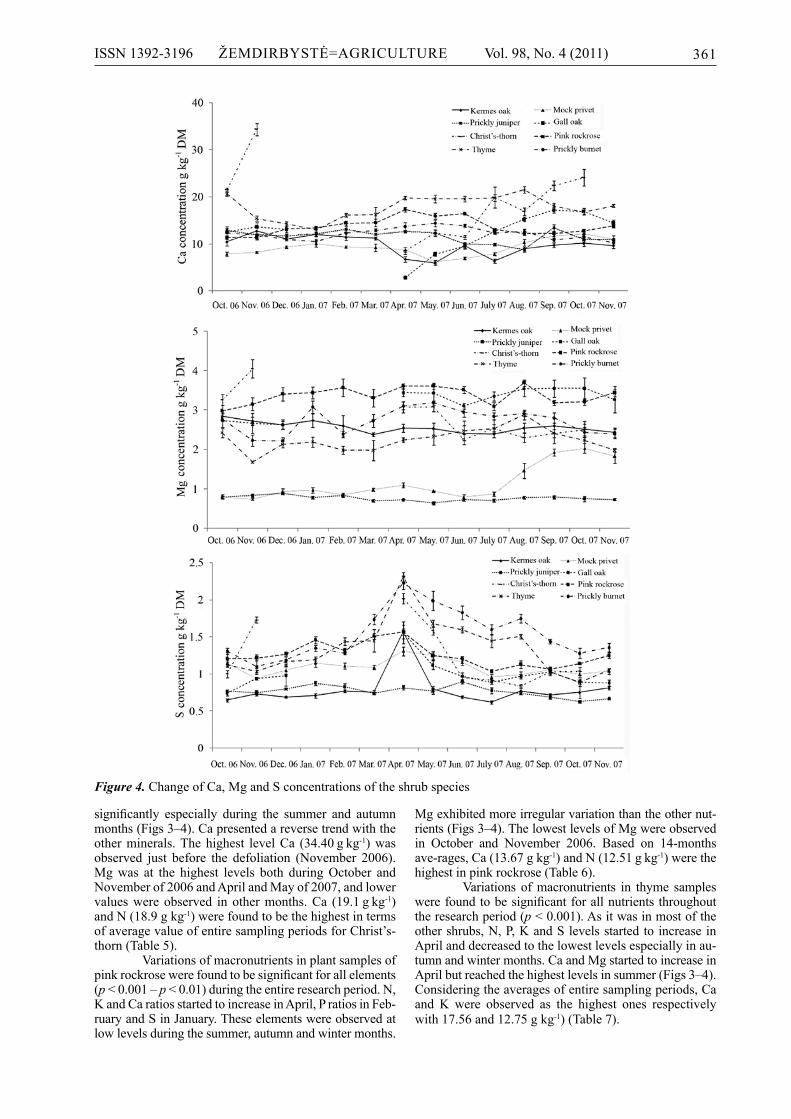
Magnesium content of kermes oak varied be-tween2.38–2.85gkg-1.As theaverageofentiresamp-ling periods for kermes oak, N (12.32 g kg-1) and Ca(9.66 g kg-1)wereobservedasthehighestones(Table1).
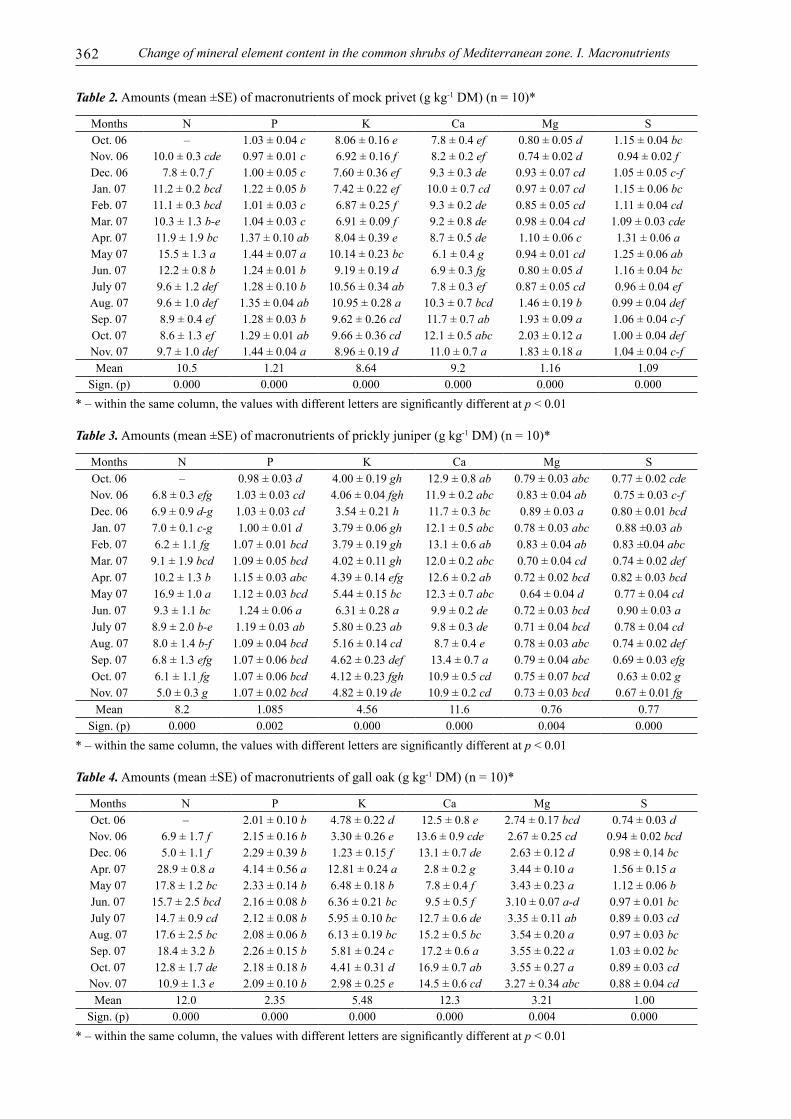
Table 1.Amounts(mean±SE)ofmacronutrientsofkermesoak(gkg-1DM)(n=10)*,**
Months N P K Ca Mg SOct.06 – 1.53±0.04c 5.93±0.24ef 10.4±0.9bcd 2.85±0.09 0.65±0.02cdNov.06 12.8±2.5bcd 1.49±0.03c 5.18±0.22fg 12.7±0.6a 2.72±0.10 0.73±0.02bcdDec.06 12.1±2.1b-e 1.46±0.05c 4.79±0.30g 11.0±0.4abc 2.62±0.10 0.69±0.01bcdJan.07 11.0±0.5c-f 1.55±0.02c 4.22±0.16g 11.9±0.4ab 2.74±0.17 0.71±0.03bcdFeb.07 12.5±1.0b-e 1.52±0.04c 4.53±0.20g 11.4±0.7abc 2.60±0.27 0.77±0.02bcMar.07 14.1±2.5b 1.44±0.03c 4.44±0.09g 11.2±0.3abc 2.38±0.05 0.75±0.03bcApr.07 21.8±0.9a 3.74±0.21a 14.02±0.79a 6.7±0.6e 2.54±0.10 1.57±0.09aMay07 13.3±0.8bc 1.89±0.05b 8.88±0.26b 5.9±0.5e 2.53±0.15 0.80±0.03bJun.07 11.6±0.9b-f 1.57±0.06c 8.07±0.09bc 9.6±0.7cd 2.41±0.19 0.69±0.02bcdJuly07 9.0±0.1f 1.56±0.08c 9.11±0.19b 6.3±0.4e 2.39±0.08 0.62±0.02dAug.07 10.4±1.1def 1.38±0.02c 7.49±0.30cd 8.9±0.4d 2.55±0.12 0.77±0.04bcSep.07 10.1±0.1def 1.38±0.03c 7.34±0.40cd 9.7±0.5cd 2.60±0.18 0.72±0.02bcdOct.07 9.8±1.8ef 1.40±0.13c 6.77±0.60de 10.1±0.7cd 2.52±0.19 0.75±0.08bcdNov.07 11.6±0.6b-f 1.55±0.05c 5.09±0.39fg 9.6±0.6cd 2.43±0.12 0.81±0.02bMean 12.3 1.68 6.85 9.7 2.56 0.79
Sign.(p) 0.000 0.000 0.000 0.000 0.570 0.000*–withinthesamecolumn,thevalueswithdifferentlettersaresignificantlydifferentatp<0.01,**–thereisnotfortheletteringinthesamecolumnofvaluesarenotstatisticallysignificant
Variationsofmacronutrientsinmockprivetwerefoundtobesignificantthroughouttheyear(p<0.001).N, P and S increased significantly in spring (April orMay).NandSlevelswereatlowlevelsduringthesum-mer, autumn andwintermonths. Phosphoruswas rela-tivelyhighduringthesummerandautumnmonthsoftheyear2007.However, itsignificantlydecreasedbetweenOctober 2006–March 2007.Although K concentrationofmockprivetwasatlowlevelsduringautumn,winterandspringmonths,itincreasedsignificantlyduringJuly
andAugust.Ca andMgcontents started to increase inAugustandreachedthehighestlevelsbetweenSeptem-ber–November2007.WhileSwasincreasingduringtheshootingperiodofspring,duringthemonthsofAprilandMay,itwaslowintherestofthemonthsandtherewerenosignificantdifferencesamongthem(Figs3–4).Astheaverage of entire sampling periods formock privet,N(10.48gkg-1),Ca(9.16gkg-1)andK(8.64gkg-1)wereobservedasthehighestones(Table2).
360
Figure 3.ChangeofN,PandKconcentrationsoftheshrubspecies
Variation of macronutrients in prickly junipersampleswerefoundtobesignificantduringtheresearchperiodof14months(p<0.001–p<0.01).Nconcentra-tioninMay,PandKatthebeginningofsummer(June)reachedthehighestlevelandtheydecreasedtothelow-estlevelsespeciallyduringautumnandsummermonths.Increasing Ca andMg in plant samples of winter andspringdecreased in summermonths.S ratioof juniperdidnotyieldaregularchangethroughouttheyear.WhileSwasobservedatthehighestlevelsinJanuary,FebruaryandJune,thelowestlevelswereobservedinSeptember,OctoberandNovember2007(Figs3–4).Theamountsofallmacronutrients,Ca(11.58gkg-1)andN(8.24gkg-1)wereobservedasthehighestones(Table3).
Statistical analysis revealed significant varia-tions inmacronutrient contents of gall oak throughout
theyear(p<0.001–p<0.01).Galloakisadeciduousshrub.InitialgrowthandleafappearancestartedinApril.In thismonth,N, P,K, andS levelswere found to bethehighestandsignificantdecreaseswereobserveddur-ingthefollowingmonths.MgalsostartedtoincreaseinAprilbutthisincreasecontinuedtotheendoftheyear.UnlikeMg,Ca showed reverse tendency.While itwasat the lowest levelsduring the initialgrowth in spring,it reached thehighest levels inSeptemberandOctober2007(Figs3–4).GalloakhadhighCa(12.34gkg-1)andN(11.97 g kg-1)contents(Table4).
MacronutrientsindefoliatingChrist’s-thornwerefoundtobesignificant(p<0.001).P,K,andSwereatthehighest levels during the leaf appearance (April).N in-creasedthroughMayandJune.Thesemineralsdecreased
Change of mineral element content in the common shrubs of Mediterranean zone. I. Macronutrients
ISSN 1392-3196 ŽEMDIRBYSTĖ=AGRICULTURE Vol.98,No.4(2011) 361
Figure 4.ChangeofCa,MgandSconcentrationsoftheshrubspecies
significantly especially during the summer and autumnmonths(Figs3–4).Capresentedareversetrendwiththeotherminerals.Thehighest levelCa (34.40 g kg-1)wasobserved just before the defoliation (November 2006).Mgwas at the highest levels both duringOctober andNovemberof2006andAprilandMayof2007,andlowervalueswere observed in othermonths.Ca (19.1 g kg-1)andN(18.9gkg-1)werefoundtobethehighestintermsofaveragevalueofentiresamplingperiodsforChrist’s-thorn(Table5).
Variationsofmacronutrientsinplantsamplesofpinkrockrosewerefoundtobesignificantforallelements(p<0.001–p<0.01)duringtheentireresearchperiod.N,KandCaratiosstartedtoincreaseinApril,PratiosinFeb-ruaryandSinJanuary.Theseelementswereobservedatlowlevelsduringthesummer,autumnandwintermonths.
Mgexhibitedmoreirregularvariationthantheothernut-rients(Figs3–4).ThelowestlevelsofMgwereobservedin October and November 2006. Based on 14-monthsave-rages,Ca(13.67gkg-1)andN(12.51 g kg-1)werethehighestinpinkrockrose(Table6).
Variations ofmacronutrients in thyme sampleswerefoundtobesignificantforallnutrientsthroughouttheresearchperiod(p<0.001).Asitwasinmostoftheothershrubs,N,P,KandSlevelsstartedto increaseinAprilanddecreasedtothelowestlevelsespeciallyinau-tumnandwintermonths.CaandMgstartedtoincreaseinAprilbutreachedthehighestlevelsinsummer(Figs 3–4).Consideringtheaveragesofentiresamplingperiods,Caand K were observed as the highest ones respectivelywith17.56and12.75gkg-1)(Table7).
362 Change of mineral element content in the common shrubs of Mediterranean zone. I. Macronutrients
Table 2.Amounts(mean±SE)ofmacronutrientsofmockprivet(gkg-1DM)(n=10)*
Months N P K Ca Mg SOct.06 – 1.03±0.04c 8.06±0.16e 7.8±0.4ef 0.80±0.05d 1.15±0.04bcNov.06 10.0±0.3cde 0.97±0.01c 6.92±0.16f 8.2±0.2ef 0.74±0.02d 0.94±0.02fDec.06 7.8±0.7f 1.00±0.05c 7.60±0.36ef 9.3±0.3de 0.93±0.07cd 1.05±0.05c-fJan.07 11.2±0.2bcd 1.22±0.05b 7.42±0.22ef 10.0±0.7cd 0.97±0.07cd 1.15±0.06bcFeb.07 11.1±0.3bcd 1.01±0.03c 6.87±0.25f 9.3±0.2de 0.85±0.05cd 1.11±0.04cdMar.07 10.3±1.3b-e 1.04±0.03c 6.91±0.09f 9.2±0.8de 0.98±0.04cd 1.09±0.03cdeApr.07 11.9±1.9bc 1.37±0.10ab 8.04±0.39e 8.7±0.5de 1.10±0.06c 1.31±0.06aMay07 15.5±1.3a 1.44±0.07a 10.14±0.23bc 6.1±0.4g 0.94±0.01cd 1.25±0.06abJun.07 12.2±0.8b 1.24±0.01b 9.19±0.19d 6.9±0.3fg 0.80±0.05d 1.16±0.04bcJuly07 9.6±1.2def 1.28±0.10b 10.56±0.34ab 7.8±0.3ef 0.87±0.05cd 0.96±0.04efAug.07 9.6±1.0def 1.35±0.04ab 10.95±0.28a 10.3±0.7bcd 1.46±0.19b 0.99±0.04defSep.07 8.9±0.4ef 1.28±0.03b 9.62±0.26cd 11.7±0.7ab 1.93±0.09a 1.06±0.04c-fOct.07 8.6±1.3ef 1.29±0.01ab 9.66±0.36cd 12.1±0.5abc 2.03±0.12a 1.00±0.04defNov.07 9.7±1.0def 1.44±0.04a 8.96±0.19d 11.0±0.7a 1.83±0.18a 1.04±0.04c-fMean 10.5 1.21 8.64 9.2 1.16 1.09
Sign.(p) 0.000 0.000 0.000 0.000 0.000 0.000*–withinthesamecolumn,thevalueswithdifferentlettersaresignificantlydifferentatp<0.01
Table 3.Amounts(mean±SE)ofmacronutrientsofpricklyjuniper(gkg-1DM)(n=10)*
Months N P K Ca Mg SOct.06 – 0.98±0.03d 4.00±0.19gh 12.9±0.8ab 0.79±0.03abc 0.77±0.02cdeNov.06 6.8±0.3efg 1.03±0.03cd 4.06±0.04fgh 11.9±0.2abc 0.83±0.04ab 0.75±0.03c-fDec.06 6.9±0.9d-g 1.03±0.03cd 3.54±0.21h 11.7±0.3bc 0.89±0.03a 0.80±0.01bcdJan.07 7.0±0.1c-g 1.00±0.01d 3.79±0.06gh 12.1±0.5abc 0.78±0.03abc 0.88±0.03abFeb.07 6.2±1.1fg 1.07±0.01bcd 3.79±0.19gh 13.1±0.6ab 0.83±0.04ab 0.83±0.04abcMar.07 9.1±1.9bcd 1.09±0.05bcd 4.02±0.11gh 12.0±0.2abc 0.70±0.04cd 0.74±0.02defApr.07 10.2±1.3b 1.15±0.03abc 4.39±0.14efg 12.6±0.2ab 0.72±0.02bcd 0.82±0.03bcdMay07 16.9±1.0a 1.12±0.03bcd 5.44±0.15bc 12.3±0.7abc 0.64±0.04d 0.77±0.04cdJun.07 9.3±1.1bc 1.24±0.06a 6.31±0.28a 9.9±0.2de 0.72±0.03bcd 0.90±0.03aJuly07 8.9±2.0b-e 1.19±0.03ab 5.80±0.23ab 9.8±0.3de 0.71±0.04bcd 0.78±0.04cdAug.07 8.0±1.4b-f 1.09±0.04bcd 5.16±0.14cd 8.7±0.4e 0.78±0.03abc 0.74±0.02defSep.07 6.8±1.3efg 1.07±0.06bcd 4.62±0.23def 13.4±0.7a 0.79±0.04abc 0.69±0.03efgOct.07 6.1±1.1fg 1.07±0.06bcd 4.12±0.23fgh 10.9±0.5cd 0.75±0.07bcd 0.63±0.02gNov.07 5.0±0.3g 1.07±0.02bcd 4.82±0.19de 10.9±0.2cd 0.73±0.03bcd 0.67±0.01fgMean 8.2 1.085 4.56 11.6 0.76 0.77
Sign.(p) 0.000 0.002 0.000 0.000 0.004 0.000
*–withinthesamecolumn,thevalueswithdifferentlettersaresignificantlydifferentatp<0.01
Table 4.Amounts(mean±SE)ofmacronutrientsofgalloak(gkg-1DM)(n=10)*
Months N P K Ca Mg SOct.06 – 2.01±0.10b 4.78±0.22d 12.5±0.8e 2.74±0.17bcd 0.74±0.03dNov.06 6.9±1.7f 2.15±0.16b 3.30±0.26e 13.6±0.9cde 2.67±0.25cd 0.94±0.02bcdDec.06 5.0±1.1f 2.29±0.39b 1.23±0.15f 13.1±0.7de 2.63±0.12d 0.98±0.14bcApr.07 28.9±0.8a 4.14±0.56a 12.81±0.24a 2.8±0.2g 3.44±0.10a 1.56±0.15aMay07 17.8±1.2bc 2.33±0.14b 6.48±0.18b 7.8±0.4f 3.43±0.23a 1.12±0.06bJun.07 15.7±2.5bcd 2.16±0.08b 6.36±0.21bc 9.5±0.5f 3.10±0.07a-d 0.97±0.01bcJuly07 14.7±0.9cd 2.12±0.08b 5.95±0.10bc 12.7±0.6de 3.35±0.11ab 0.89±0.03cdAug.07 17.6±2.5bc 2.08±0.06b 6.13±0.19bc 15.2±0.5bc 3.54±0.20a 0.97±0.03bcSep.07 18.4±3.2b 2.26±0.15b 5.81±0.24c 17.2±0.6a 3.55±0.22a 1.03±0.02bcOct.07 12.8±1.7de 2.18±0.18b 4.41±0.31d 16.9±0.7ab 3.55±0.27a 0.89±0.03cdNov.07 10.9±1.3e 2.09±0.10b 2.98±0.25e 14.5±0.6cd 3.27±0.34abc 0.88±0.04cdMean 12.0 2.35 5.48 12.3 3.21 1.00
Sign.(p) 0.000 0.000 0.000 0.000 0.004 0.000*–withinthesamecolumn,thevalueswithdifferentlettersaresignificantlydifferentatp<0.01
ISSN 1392-3196 ŽEMDIRBYSTĖ=AGRICULTURE Vol.98,No.4(2011) 363
Table 5.Amounts(mean±SE)ofmacronutrientsofChrist’s-thorn(gkg-1DM)(n=10)*
Months N P K Ca Mg SOct.06 – 1.87±0.03def 6.77±0.56f 21.5±0.4bc 3.26±0.14b 1.00±0.05cNov.06 14.0±3.6c 2.01±0.10de 4.35±0.29g 34.4±1.3a 4.05±0.23a 1.73±0.04bApr.07 15.3±1.7c 5.74±0.20a 17.63±0.53a 8.5±0.7f 3.08±0.14b 2.02±0.07aMay07 35.3±1.7a 3.72±0.15b 16.10±0.65b 12.3±0.6e 3.08±0.12b 1.59±0.06bJun.07 24.7±2.6b 2.63±0.05c 15.79±0.45b 11.4±0.4ef 2.26±0.13c 0.96±0.06cdJuly07 17.3±3.2c 2.09±0.06d 13.04±0.65c 19.9±2.2c 2.53±0.22c 0.92±0.02cdAug.07 16.1±3.6c 1.83±0.07def 12.13±0.44cd 16.9±0.8d 2.30±0.12c 0.84±0.02dSep.07 14.7±2.1c 1.70±0.07ef 11.20±0.36de 22.4±1.0bc 2.41±0.26c 1.03±0.05cOct.07 13.6±0.5c 1.65±0.05f 8.89±0.52e 24.1±1.8b 2.50±0.14c 1.04±0.05cMean 18.9 2.85 11.77 19.1 2.83 1.24
Sign.(p) 0.000 0.000 0.000 0.000 0.000 0.000*–withinthesamecolumn,thevalueswithdifferentlettersaresignificantlydifferentatp<0.01
Table 6.Amounts(mean±SE)ofmacronutrientsofpinkrockrose(gkg-1DM)(n=10)*
Months N P K Ca Mg SOct.06 – 1.84±0.07d 7.10±0.63ef 11.3±0.3f 2.98±0.14e 1.21±0.08bcNov.06 10.6±1.1cd 1.71±0.06d 5.36±0.35g 11.3±0.4f 3.15±0.16cde 1.22±0.04bcDec.06 10.6±0.9cd 1.77±0.05d 6.17±0.28fg 13.2±0.2de 3.41±0.17a-e 1.27±0.03bcJan.07 11.9±0.1c 2.18±0.08bc 7.37±0.34def 13.4±0.4cde 3.44±0.15a-d 1.46±0.05aFeb.07 12.0±0.1c 2.42±0.06ab 8.30±0.15cde 14.4±0.5c 3.57±0.22abc 1.32±0.03bMar.07 11.9±0.5c 2.18±0.16bc 9.06±0.67bc 14.5±0.8c 3.31±0.22a-e 1.51±0.04aApr.07 15.3±0.1ab 2.59±0.10a 12.71±0.53a 17.3±0.5a 3.61±0.06ab 1.57±0.04aMay07 16.7±3.0a 2.31±0.06bc 12.07±0.40a 15.9±0.6b 3.61±0.08ab 1.25±0.05bcJun.07 15.8±1.5a 2.30±0.04bc 12.47±0.15a 16.4±0.2ab 3.52±0.09a-d 1.21±0.03bcJuly07 11.7±0.5cd 2.09±0.08c 10.16±0.29b 13.0±0.2de 3.09±0.10de 1.04±0.02dAug.07 12.7±1.0c 2.15±0.11c 8.15±0.48cde 12.2±0.4ef 3.69±0.08a 1.13±0.05cdSep.07 9.3±0.6d 2.26±0.12bc 8.12±0.30cde 12.2±0.2ef 3.19±0.06b-e 1.07±0.02dOct.07 11.3±1.2cd 2.12±0.05c 8.41±0.31cd 12.7±0.4de 3.21±0.09b-e 1.14±0.01cdNov.07 13.1±2.2bc 2.34±0.07bc 7.19±0.21def 13.8±0.4cd 3.44±0.09a-d 1.25±0.04bcMean 12.5 2.16 8.76 13.7 3.37 1.26
Sign.(p) 0.000 0.000 0.000 0.000 0.004 0.000*–withinthesamecolumn,thevalueswithdifferentlettersaresignificantlydifferentatp<0.01
Table 7.Amounts(mean±SE)ofmacronutrientsofthyme(gkg-1DM)(n=10)*
Months N P K Ca Mg SOct.06 – 1.50±0.05b 13.60±0.86bcd 20.6±0.4ab 2.42±0.12bc 1.13±0.04dNov.06 7.5±0.2cd 1.37±0.03bcd 10.91±0.30fg 15.4±0.5ef 1.68±0.02d 1.04±0.04deDec.06 6.8±1.5cd 1.38±0.07bcd 11.20±0.32fg 14.3±0.4fg 2.13±0.09bc 1.17±0.06dJan.07 7.1±0.2cd 1.50±0.09b 9.67±0.10g 13.0±0.5g 2.19±0.13bc 1.19±0.04dFeb.07 7.9±0.1cd 1.39±0.05bc 11.80±0.34ef 16.1±0.4de 1.98±0.10cd 1.44±0.05cMar.07 8.6±1.3bc 1.44±0.11bc 11.04±1.06fg 16.2±1.6de 1.98±0.26cd 1.45±0.15cApr.07 11.1±1.0a 1.72±0.06a 15.85±0.42a 19.8±0.4abc 2.24±0.06bc 2.31±0.06aMay07 10.3±2.0ab 1.42±0.04bc 14.91±0.59ab 19.6±0.8bc 2.32±0.20bc 1.68±0.05bJun.07 11.7±2.0a 1.51±0.05b 14.31±0.52abc 19.6±0.6bc 2.48±0.25ab 1.60±0.04bcJuly07 7.6±0.5cd 1.32±0.06bcd 14.59±0.27abc 19.8±0.7abc 2.53±0.10ab 1.45±0.09cAug.07 6.1±1.0d 1.29±0.04cd 13.81±0.50bc 21.5±0.7a 2.88±0.12a 1.51±0.03bcSep.07 6.1±1.3d 1.30±0.03cd 11.61±0.43ef 18.1±0.6cd 2.41±0.10bc 1.03±0.03deOct.07 7.1±1.3cd 1.20±0.04d 12.12±0.55def 16.8±0.4de 2.23±0.07bc 0.89±0.05eNov.07 7.8±1.6cd 1.33±0.02bcd 13.10±0.44cde 18.1±0.3cd 1.98±0.05cd 1.05±0.02deMean 7.5 1.41 12.75 17.6 2.25 1.35
Sign.(p) 0.000 0.000 0.000 0.000 0.000 0.000*–withinthesamecolumn,thevalueswithdifferentlettersaresignificantlydifferentatp<0.01
Pricklyburnetisacommonshrubofdisturbedpastures.Variationsofmacronutrientsinthisshrubwerefound to be significant throughout the research period(p<0.001–p<0.05).ThevariationinPwasirregular.NreachedthehighestlevelinJuneandlowerandsimilarvalueswereobservedinothermonths.K,MgandSin-
creasedduringtheinitialplantgrowthinAprilandthendecreased in later periods.Cahadhigh levels betweenMarch–May2007 (Figs 3–4).Ca (12.18 g kg-1) andN(7.76gkg-1)wereobservedasthehighestonesinplantsamplesofpricklyburnet(Table8).
364 Change of mineral element content in the common shrubs of Mediterranean zone. I. Macronutrients
Table 8.Amounts(mean±SE)ofmacronutrientsofpricklyburnet(gkg-1DM)(n=10)*
Months N P K Ca Mg SOct.06 – 1.26±0.05a-d 3.70±0.13d 12.4±0.3bcd 2.78±0.06bcd 1.31±0.04fgNov.06 6.4±0.5d 1.20±0.07a-d 3.06±0.25ef 11.9±0.8cde 2.23±0.15f 1.10±0.08hDec.06 7.3±0.4cd 1.12±0.06d 2.46±0.10fg 11.0±0.4de 2.22±0.08f 1.19±0.05ghJan.07 6.2±2.3d 1.19±0.07a-d 1.82±0.13h 10.5±0.5e 3.08±0.16abc 1.35±0.04fgFeb.07 7.6±1.3bcd 1.18±0.05bcd 2.34±0.15gh 12.3±0.8bcd 2.39±0.08ef 1.28±0.02fghMar.07 8.1±0.6bcd 1.32±0.07abc 4.36±0.34c 12.9±0.3abc 2.73±0.16cde 1.74±0.07cdApr.07 9.5±0.9b 1.33±0.04a 6.56±0.16a 13.7±0.8ab 3.11±0.10ab 2.23±0.09aMay07 9.0±0.5bc 1.24±0.02a-d 6.39±0.20a 14.4±0.7a 3.18±0.06a 1.99±0.13bJun.07 12.4±1.2a 1.21±0.02a-d 5.71±0.26b 13.9±0.3ab 2.95±0.13abc 1.83±0.09bcJuly07 7.9±1.2bcd 1.23±0.04a-d 4.73±0.15c 12.4±0.4bcd 2.84±0.09abc 1.60±0.07deAug.07 7.7±1.7bcd 1.17±0.02cd 4.47±0.22c 12.7±0.4bc 2.91±0.07abc 1.75±0.06cdSep.07 5.9±0.3d 1.22±0.03a-d 3.18±0.08de 10.8±0.4de 2.80±0.13bc 1.44±0.03efOct.07 7.0±1.1cd 1.16±0.03d 2.66±0.26efg 11.5±0.5cde 2.44±0.12def 1.28±0.07fghNov.07 6.1±0.3d 1.32±0.04ab 3.06±0.30ef 10.3±0.3e 2.40±0.12ef 1.36±0.06fgMean 7.8 1.22 3.89 12.2 2.72 1.53
Sign.(p) 0.000 0.032 0.000 0.000 0.000 0.000*–withinthesamecolumn,thevalueswithdifferentlettersaresignificantlydifferentatp<0.01
DiscussionNitrogen(N)levelsofshrubsreachedthehigh-
estlevelsinAprilandMaywhentheactivevegetationofplants startes. N content of only prickly burnet had thepeakvalueinJune.Therearecloserelationshipsbetweenthe amount of N and physiological activities of plantssincealloftheimportantbiochemicalreactionsarereali-zedundercatalystofnitrogenouscompounds(Kacaretal.,2006).Therefore,Nlevelsincreasedduringtheperiodsinwhich shrubs form their initial shoots.N concentrationsdecreasedduringsummer,autumnandspringmonths,inwhichplant growth is sloweddown and stopped.SomeresearchonthisissuedealswithcrudeproteininsteadofN.Therefore,decreaseinNorcrudeproteinwasobservedwithplantmaturationinstudiesinvestigatingthevariationsinNorcrudeproteinratioswithplantgrowth(DelValle,Rosell, 2000;Kamalak, 2006;Mountousis et al., 2008).Ataşoğluetal.(2010)carriedoutresearchoverthesameareaandobservedthehighestproteinlevelsofkermesoakinMayandsignificantdecreasesduringthelatermonths(summerandautumn).Sincetheleavesstartedtogrowinspring, theypresentedhigherrateofgrowthinJuneandlaterinpricklyburnet,ratioofleavesandconsequentlytheratioofNincreased.
Although there were some differences amongtheshrubspecies,phosphorus(P)ratiogenerallystartedto increaseduring thespringmonthsforallshrubsanddecreasedthroughthesummer.OnlypricklyburnethadadecreaseinDecember,AugustandOctoberandthevari-ationsinothermonthswerenotfoundtobesignificant.IncreaseinPespeciallyinAprilwasduetoinitiationofplantgrowthandcorrespondinghighlevelofphysiologi-calactivitiesinthismonth.LargeramountofPislocatedwithinprotoplasmwhereintensivephysiologicalactivi-tiestakeplace(Spears,1994)andPconstitutesthebasisofenergysystems(ATP)andnucleicacids(DNA,RNA)inplants (Kacaret al.,2006).Thesecompoundsaccel-erate thephysiological activities.Therefore,P contentsincreasedduring the initialgrowthperiod inwhich thehighest cytokinesis and cell growth are observed. De-creasingphysiologicalactivitiesduringthefurtherstagesofplantgrowthalsodecreasedthePratios.Similarvari-ationswerealsopointedoutbyCook(1972),Holechek
etal.(1989)andElAich(1991).Adifferentvariationinpricklyburnetwithregardtootherswasduetoverysmallleavesof theplant and locationof these leaves amongthe thorns. Ineachsampling, thornyshootswere takenbeside the leaves.LocationofP incellsmostly inpro-toplasm,andlocationofhighestrateofprotoplasmcon-tainingcellsinleavesandincreaseinmembraneratiosinshootsandthornscausedirregularvariationsinPcontentsofsamples.Astheaverageofsamplingperiods,Pratiosofshrubsvariedbetween1.09gkg-1(pricklyjuniper)and2.85gkg-1(Christ’s-thorn).Inastudycarriedoutwithfivedifferentshrubs,Venturaetal.(2004)reportedPcontentsofshrubsasbetween1.50–2.80gkg-1.ElAich(1991)re-portedaveragePcontentsofshrubsas3.00 g kg-1forthebeginningoftheseasonandas2.00 g kg-1fortheendoftheseason.
Potassium(K)hadthehighestlevelsinalmostallshrubsinApril.Itplaysaroleinregulationofosmoticpotentialinplants(Kacaretal.,2006).Osmoticpotentialregulatesthewaterandotherdissolvedmaterialsthroughthecells.Thatiscloselyrelatedtophysiologicalactivi-ties of the plants.There is a little amount ofK at cellwalls(Spears,1994).Therefore,increaseinthewallratiowithcellgrowth indicates thedecreaseof thismineral.Fleming (1973) reported that Ca did not change withincreasedplantmaturation;howeverPandKdecreaseddistinctively.AverageKcontentsofshrubswerebetween3.89 g kg-1 (prickly burnet) and 12.75 g kg-1 (thyme).Thesevalueswerebetween12.10–15.00gkg-1inVenturaetal.(2004)andbetween21.00–31.00gkg-1inRamirez-Ordunaetal.(2005).Thedifferencecomesfromthelocalsoilandclimateconditionsofthesestudies.Thespeciesofthoseshrubsconsideredinthesestudiesandtheonesincurrentstudyaredifferent.
Except for prickly burnet, pink rockrose andthyme,aninversevariationofcalcium(Ca)withregardtovariationofPandKwereobservedingrazablepartsoftheshrubs.While theCacontentwasgenerallydecreasing inAprilremarkably,itwashigherinothermonths.Caismost-lylocatedinhardtissuesoftheplants(cellwalls)(Spears,1994).Highercellprotoplasmcompoundsand lowerwallcompoundsatthebeginningofgrowthyieldedtheseresults.
ISSN 1392-3196 ŽEMDIRBYSTĖ=AGRICULTURE Vol.98,No.4(2011) 365
Contraryresultsforpricklyburnet,pinkrockroseandthymecomefromhardandwoodystructureofpricklyburnetandthymeinspring(especiallyinApril)andsofterstructureofpinkrockrosebothinspringandintheothermonths.Aver-ageCacontentsof theinvestigatedshrubsvariedbetween9.16gkg-1(mockprivet)and19.05gkg-1(Christ’s-thorn).LowerCaratios(3.20–22.70gkg-1)wereobservedbyVen-turaetal.(2004)orhighervalues(21.40–28.00gkg-1)wereobservedbyRamirez-Ordunaetal.(2005).
Variation in magnesium (Mg) content wasfoundtobeinsignificantinkermesoak.Itincreasedsig-nificantlyinfallandwinterformockprivetandpricklyjuniper,inspringandsummerforgalloak,pricklyburnetandpinkrockrose, insummerforthymeandinfallforChrist’s-thorn.SincegalloakandChrist’s-thorndefoli-ate inwinter, plant sampleswere not able to be takenin this season. Therefore, seasonal variation trend forMgcontentsofshrubswasdifferentfromtheotherele-ments(Figs3–4).AsstatedbySpears(1994),mostoftheMgislocatedwithinprotoplasm.Thatwasobservedingalloak,pinkrockroseandpricklyburnet.Sincethymesproutsoutinsummer,increaseinMgcontentinsummerfor this shrubwas an expected case.However, inversecaseswereobservedinpricklyjuniper,mockprivetandChrist’s-thornandtheresultswerenotable tobe inter-preted.ResultsaboutvariationinMgcontentsofplantsvary according to researchers. For instance, Ramirez-Ordunaet al. (2005)performeda study inMexicoandindicatedthatvariationinMgcontentsofshrubswithre-gardtoseasonswasnotsignificant;Greeneetal.(1987)andRamirezetal.(2001)indicatedthatvariationinMgcontentwassignificant.Astheaverageofsamplingperi-ods,thelowestMgcontent(0.76gkg-1)wasobservedinpricklyjuniperandthehighest(3.37gkg-1)wasobservedinpinkrockrose.Mgcontentsinotherstudieswerebe-tween 2.90–4.80 g kg-1 and 1.20–8.20 g kg-1 (Venturaet al.,2004;Ramirez-Ordunaetal.,2005).
Monthly variations in sulphur (S) ratios ofplantsweresimilartovariationsinPandK.Again,mostofthiselementisalsolocatedwithinprotoplasmofcells(Spears, 1994). Significant increases were observed inspring,especiallyinAprilinallshrubsexceptforpricklyjuniper.VariationofSinpricklyjuniperdidnotfollowanorderwithgrowingseason.AverageScontentsofplantsamples throughout the research period were between0.77 g kg-1 (prickly juniper) and 1.53 g kg-1 (pricklyburnet).AsstatedbyGüneşetal. (2000)plantsshouldhaveanScontentequalto0.5–1.0%oftheirdryweights.Basedon these criteria, shrubs in this studyhad insuf-ficientamountsofSintheirstructure.Asaresultoftheobservations,Sdeficiencysymptomsintheshrubswerenotabletobefound.
ConclusionsThemacronutrientsconsideredinthisresearch
were interpreted by taking the maintenance for goatsinto consideration.An average goat with about 50 kglive-weightshouldconsumeatleast2.12gCa(Meschy,2000),1.28gP(Pfeffer,1989),12.0gN,5.6gK,0.87gMgand2.2gS(NationalResearchCouncil,2007)daily.Thefollowingconclusionscanbedrawnconsidering1kgdailyshrubconsumptionofagoatfromtherangeland:
1.AmountofNinkg-drymatterofkermesoakwasnotsufficientinsummerandautumnmonths.Nde-
ficiencywasobservedmost of the timeexcept inMayandJuneformockprivet,inMayforpricklyjuniper,inApril,MayandJuneforpinkrockrose.Nwassufficientingalloakinallseasonsexceptinwinter.TherewasnotNdeficiencyinChrist’s-thorn.ThymehadNdeficiencyinallseasons.
2.Pconcentrationwassufficientinkermes,galloaks,Christ’s-thorn,pink rockroseand thyme through-outthesamplingperiods.MockprivethadPdeficiencyinwintermonths.PricklyjuniperhadsufficientPlevelsonlyinJuneandpricklyburnethadsufficientPgenerallyinspringandautumn.
3.AlltheshrubshadsufficientKandCacon-tents.
4. Kermes oak, gall oak, Christ’s-thorn, pinkrockrose, thyme and prickly burnet had sufficient Mgcontent.MockprivethadsufficientMglevelsthroughoutthe samplingperiodsexpect inOctober andNovember2006andJuneandJuly2007.Mgdeficiencyforgrazinggoats can alsobementioned forprickly juniperduringtheresearchperiod.
5.AnS deficiencywas not observed in shrubsamplesexceptforthesamplesofthymeandpricklybur-nettakeninApril.
Besides the above stated conclusions, the factisthatundernormalconditionsgoatsgetabout50–60%oftheirdailydrymatterconsumptionfromtheshrubsofpastures.Asaresult,ifthegoatsaresuppliedwithNbothin the summer andwinter andwith S in every period,shrublandsproduceadequateamountsofforagerequire-mentsofgoats.
AcknowledgementsThis research was supported by TÜBİTAK
(ProjectNo.106O458).Received06062011Accepted05092011
ReferencesAtaşoğluC.,ŞahinS.,CanbolatÖ.,BaytekinH.Theeffectof
harveststageonthepotentialnutritivevalueofkermesoak(Quercus coccifera)leaves//LivestockResearchforRuralDevelopment.–2010,vol.22,p.182–185
BremnerJ.M.DeterminationofnitrogeninsoilsbyKjeldahlmethod//JournalofAgriculturalScience.–1960,vol.55,p.1–23
CookC.W.Comparativenutritivevaluesofforbs,grassesandshrubs//Wildlandshrubs:theirbiologyandutilization.–USDAForestServiceTechnicalReportINT-I,1972,5p.
CookC.W.,J.StubbendieckJ.Rangeresearch:basicproblemsandtechniques,societyforrangemanagement.–Colora-do,USA,1986,317p.
Cropproduction statistics [Bitkiselüretim istatistikleri] //Tur-kishStatisticalInstitute.–Ankara,Turkey,2010(inTurkish)
DelValleH. F.,RosellR.A.Mineral composition of peren-nialvegetationofshrubpatchesinNortheasternPatagonia//AridLandResearchandManagement.–2000,vol.14,p. 15–25
ElAichA.Roleofshrubsinecosystemfunction//OptionsMedi-terraneennes,SeriesSeminaries.–1991,No.16,p. 43–46
FlemingG.A.Mineral composition of herbage // ChemistryandBiochemistryofHerbage/ButlerG.W.,BaileyR.W.(eds).–Netherlands,1973,p.529–566
GreeneL.W.,PinchakW.E.,HeitschmidtR.K.Seasonaldy-namicsofminerals in foragesat theTexasExperimentalRanch//JournalofRangeManagement.–1987,vol.40,p.502–506
366
GüneşA.,AlpaslanM., İnalA. Bitki besleme ve gübreleme[Plantnutritionandfertilization]//AnkaraUniversityAg-riculture Faculty. –Ankara, Turkey, 2000, No. 1514 (inTurkish)
Holechek J. L., EstellR.E.,KuykendallC.B. et al. SeededwheatgrassyieldandnutritivequalityonNewMexicobigsagebrushrange//JournalofRangeManagement.–1989,vol.42,p.118–122
KacarB.,KatkatA.V.,ÖztürkŞ.Bitkifizyolojisi[Plantphy-siology].–Bursa,Turkey,2006,563p.(inTurkish)
KamalakA.Determinationofnutritivevalueofleavesofana-tivegrownshrub,Glycyrrhiza glabraL.usingin vitroandin situmeasurements//SmallRuminantResearch.–2006,vol.64,p.268–278
Meschy F. Recent progress in the assessment ofmineral re-quirements of goats // Livestock Production Science. –2000,vol.64,p.9–14
MountousisJ.,PapanikolaouK.,StanogiasG.etal.Seasonalvariationof chemical composition anddrymatterdiges-tibilityofrangelandsinNWGreece//JournalofCentralEuropeanAgriculture.–2008,vol.9,p.547–556
NationalResearchCouncil.Nutrientrequirementsofsmallru-minants:sheep,goats,cervids,andnewworldcamelids//NationalResearchCouncilof theNationalAcademies.–WashingtonD.C.,USA,2007,362p.
Papachristou T. G., NastisA. S. Diets of goats grazing oakshrublandsofvaryingcoverinnorthernGreece//JournalofRangeManagement.–1993,vol.46,p.220–226
PapachristouT.G.,NastisA.S.,MathurR.,HutchingsM.R.Effectofphysicalandchemicalplantdefensesonherbivo-ry:implicationsforMediterraneanshrublandmanagement//BasicandAppliedEcology.–2003,vol. 4,p.395–403
PapachristouT.G.,PlatisP.D.,NastisA.S.Foragingbehaviourofcattleandgoatsinoakforeststandsofvaryingcoppic-ingageinNorthernGreece//SmallRuminantResearch.–2005,vol.59,p.181–189
PapachristouT.G.,PlastisP.D.,PapanastasisV.P.,TsiouvarasC.N.Useofdeciduouswoody speciesas adiet supple-ment for goats grazingMediterranean shrublands duringthedryseason//AnimalFeedScienceandTechnology.–1999,vol.80,p.267–279
PerevolotskyA.,LandauS.,KababyaD.,UngarE.D.Dietse-lectionindairygoatsgrazingwoodyMediterraneanrange-land //AppliedAnimalBehaviour Science. – 1998, vol.57,p.117–131
PfefferE.Phosphorusrequirementsingoats:proceedingsoftheInternationalmeetingonmineral nutrition andmineral re-quirementsinruminants.–Kyoto,Japan,1989,p.153–183
Ramirez-OrdunaR.,RamirezR.G.,Gonzalez-RodriquezH.,HaenleinG.F.W.MineralcontentofbrowsespeciesfromBajaCaliforniaSur,Mexico//SmallRuminantResearch.–2005,vol.57,p.1–10
RamirezR.G.,HaenleinG.F.W.,Nunez-GonzalezM.A.Sea-sonalvariationofmacroandtracemineralcontentsin14browsespeciesthatgrowinnortheasternMexico//SmallRuminantResearch.–2001,vol.39,p.153–159
RogosicJ.AnecologicalapproachtomanagementoftheMedi-terraneannatural resources.SessionA.–Mostar,Bosni-Herzegovina,2000,p.121–130
SpearsJ.W.Mineralsinforages//ForageQuality,Evaluation,andUtilization / FaheyG. C. (ed.). –Wisconsin, USA,1994,p.281–317
VenturaM.R.,CastanonJ.I.R.,PieltainM.C.,FloresM.P.Nutritivevalueofforageshrubs:Bituminaria bituminosa,Rumex lunaria, Acacia salicina, Cassia sturtii and Ad-enocorpus foliosus //SmallRuminantResearch.–2004,vol. 52,p.13–18
Whitehead D. C. Nutrient elements in grassland: soil-plant-animalrelations.–Cambridge,UK,2000,p.70–94
WinerB.J.,BrownD.R.,MichelsK.M.Statisticalprinciplesinexperimentaldesign(3rded.).–California,USA,1991,928p.
ISSN 1392-3196 Žemdirbystė=Agriculture,vol.98,No.4(2011),p.357‒366UDK631.81.095.337:636.39.086.782
Mineralinių elementų kiekio pokyčiai Viduržemio jūros zonoje paplitusiuose krūmuose. I. Makroelementai
A.Gökkuş1,A.ÖzaslanParlak1,M.Parlak2
1ÇanakkaleOnsekizMartuniversitetas,Turkija2ÇanakkaleOnsekizMartuniversitetoLapsekiprofesinėmokykla,Turkija
Santrauka Krūmai yra būdingiViduržemio jūros zonos augalai ir svarbus ožkųmaisto šaltinis.Tačiaumitybos elementųkiekis juosesmarkiai įvairuoja,priklausomainuoklimato,dirvožemioiraugalųaugimosąlygų.AtliktakeletastyrimųapiemetinįmineraliniųmedžiagųįvairavimąkrūmuoseMarmarioregione.Šiotyrimometu14mėnesių(nuo2006m.spalio iki2007m. lapkričio) tirtassezoninismakroelementų (N,P,K,Ca,Mg irS)varijavimasQuercus coccifera,Phillyrea latifolia, Juniperus oxycedrus,Quercus infectoria,Paliurus spina-christi,Cistus creticus,Thymus longicaulisirSarcopoterium spinosumaugaluose.Makroelementųįvairavimaspermetusbuvodidelisvisuosekrūmuose.KrūmuosedidžiausiaN,P,K,irSkoncentracijabuvobalandžio–gegužėsmėnesiais,oCasmarkiaisumažėjobalandžiomėnesį.Mgvarijavopriklausomainuoaugalųrūšies.Nkiekisvisuosekrūmuose,išskyrusPaliurus spina-christiirQuercus infectoria,ožkųmitybosporeikiusgalėjopatenkintitikpavasarį.Paliurus spina-christipakankamąkiekįNturėjovisaismetųlaikais,taippatirQuercus infectoria,išskyrusžiemą.P,K,irCakiekisdaugeliuatvejųtenkinoožkųmitybosporeikius.MgJuniperus oxycedrusturėjopakankamaivisaismetųlaikais,oPhillyrea latifoliaL.–vasarąirrudenį.Mgtrūkumokituosekrūmuosenebuvonustatyta.S kiekisbuvonepakankamaspatenkintiožkųmitybosporeikius.
Reikšminiaižodžiai:makroelementai,krūmaisapaugusivietovė.
Change of mineral element content in the common shrubs of Mediterranean zone. I. Macronutrients
Top Related
Copyright © 2022 FDOKUMEN

