challenges - MDPI
21
Challenges 2014, 5, 409-429; doi:10.3390/challe5020409 challenges ISSN 2078-1547 www.mdpi.com/journal/challenges Article To Which Degree Does Sector Specific Standardization Make Life Cycle Assessments Comparable?—The Case of Global Warming Potential of Smartphones Anders S. G. Andrae 1, * and Mikko Samuli Vaija 2 1 Huawei Technologies Sweden AB, Skalholtsgatan 9, 16494 Kista, Sweden 2 Orange Labs Products & Services, 28 chemin du Vieux Chêne, 38240 Meylan, France; E-Mail: [email protected] * Author to whom correspondence should be addressed; E-Mail: [email protected]; Tel.: +46-739-200-533; Fax: +46-812-060-800. External Editor: Andreas Manz Received: 3 August 2014; in revised form: 28 September 2014 / Accepted: 28 September 2014 / Published: 7 November 2014 Abstract: Here attributional life cycle assessments (LCAs) for the same smartphone model are presented by two different organizations (Orange, OGE and Huawei, HuW) and the effect of different modeling approach is analyzed. A difference of around 32% (29.6 kg and 39.2 kg) for CO2e baseline scores is found using same study object and sector specific LCA standard, however, different metrics, emission intensities, and LCA software programs. The CO2e difference is reduced to 12% (29.9 kg and 33.5 kg) when OGE use HuW metrics for use phase power consumption and total mass, and when HuW use OGE metrics for gold mass and silicon die area. Further, a probability test confirms that present baseline climate change results, for one specific study object modeled with two largely different and independent LCA modeling approaches, are comparable if both use the European Telecommunications Standard Institute (ETSI) LCA standard. The general conclusion is that the ETSI LCA standard strongly facilitates comparable CC results for technically comparable smartphone models. Moreover, thanks to the reporting requirements of ETSI LCA standard, a clear understanding of the differences between LCA modeling approaches is obtained. The research also discusses the magnitude of the CO2e reduction potential in the life cycle of smartphones. OPEN ACCESS
-
Upload
khangminh22 -
Category
Documents
-
view
1 -
download
0
Transcript of challenges - MDPI

Challenges 2014, 5, 409-429; doi:10.3390/challe5020409
challenges ISSN 2078-1547
www.mdpi.com/journal/challenges
Article
To Which Degree Does Sector Specific Standardization Make
Life Cycle Assessments Comparable?—The Case of Global
Warming Potential of Smartphones
Anders S. G. Andrae 1,* and Mikko Samuli Vaija 2
1 Huawei Technologies Sweden AB, Skalholtsgatan 9, 16494 Kista, Sweden 2 Orange Labs Products & Services, 28 chemin du Vieux Chêne, 38240 Meylan, France;
E-Mail: [email protected]
* Author to whom correspondence should be addressed; E-Mail: [email protected];
Tel.: +46-739-200-533; Fax: +46-812-060-800.
External Editor: Andreas Manz
Received: 3 August 2014; in revised form: 28 September 2014 / Accepted: 28 September 2014 /
Published: 7 November 2014
Abstract: Here attributional life cycle assessments (LCAs) for the same smartphone model
are presented by two different organizations (Orange, OGE and Huawei, HuW) and the
effect of different modeling approach is analyzed. A difference of around 32% (29.6 kg and
39.2 kg) for CO2e baseline scores is found using same study object and sector specific LCA
standard, however, different metrics, emission intensities, and LCA software programs. The
CO2e difference is reduced to 12% (29.9 kg and 33.5 kg) when OGE use HuW metrics for
use phase power consumption and total mass, and when HuW use OGE metrics for gold
mass and silicon die area. Further, a probability test confirms that present baseline climate
change results, for one specific study object modeled with two largely different and
independent LCA modeling approaches, are comparable if both use the European
Telecommunications Standard Institute (ETSI) LCA standard. The general conclusion is that
the ETSI LCA standard strongly facilitates comparable CC results for technically comparable
smartphone models. Moreover, thanks to the reporting requirements of ETSI LCA standard,
a clear understanding of the differences between LCA modeling approaches is obtained. The
research also discusses the magnitude of the CO2e reduction potential in the life cycle of
smartphones.
OPEN ACCESS

Challenges 2014, 5 410
Keywords: climate change; life cycle assessment; modeling; smartphone; standardization
1. Introduction
Information and Communication Technology (ICT) and Entertainment and Media (E&M) are two of
the fastest growing industries and a future is foreseen where almost all electronic devices are connected.
The annual shipped number of mobile devices can be counted in billions. As such, smartphone sales are
currently around one billion units. However, the share of the production of ICT and E&M Equipment,
its use and end-of-life treatment of the global annual electricity usage and CO2e emissions are currently
relatively low at around 8% and 4%, respectively [1–4]. Moreover, certain ICT Services (such as, virtual
meetings in enterprise offices) could help reduce the global CO2 emissions and environmental impacts
[5,6]. Still, the amount of ICT and E&M Equipment in use is increasing, especially end-user equipment
such as mobile phones and tablets driven by a surge in cloud computing applications [7]. Mobile phones
usually have a relatively short operating lifetime of one to three years, which negatively influences eco-
environmental impacts beyond climate change (CC). Anyway, at least until 2020, the improving energy
efficiencies within the ICT networks seem to counterbalance the mass production of consumer ICT
devices [3]. Life Cycle Assessment (LCA) is a systematic analytical method and model by which eco-
environmental effects for product systems can be estimated with a precision of around an order of
magnitude. The impact assessment step in LCA makes use of mid-point categories and mid-point
category indicators. Climate Change (CC) is a mid-point category and infrared forcing, e.g., expressed
as Global Warming Potential during 100 years (GWP100), is a mid-point category indicator of CC.
GWP100 is typically expressed as mass CO2 equivalents (CO2e). Examples of other mid-point categories
are ozone depletion, acidification and land use [8]. CC is commonly reported, as the results can be
obtained with relatively high convenience and confidence compared to other mid-point categories. A
full LCA should nevertheless cover several mid-point categories beyond CC to arrive at a “complete”
estimation of eco-environmental impacts. As shown in Figure 1, three previous non-comparable
smartphone (LCAs) suggested that the total CO2e per lifetime is around 16–70 kg CO2e with the Raw
Material Acquisition (RMA) + Part Production (PP) + Assembly + Distribution dominating the score
[9–11]. The End-of-Life Treatment (EoLT) stage was of smaller importance in these studies.
Several CC and broader eco-environmental impact studies of mobile phones show similar relative
ranking in between life cycle stages, however, still these and other electronics LCA studies often raise
questions due to lack of transparency [12–14]. Recently three different mobile phone LCA studies came
to these surprising conclusions for CC, challenging the common understanding of LCAs of smartphones; the
charger was the main driver of the CC score [15], the use stage was the dominating life-cycle stage [16], and
the smartphone had a better absolute eco-environmental performance than simpler entry phones with
less functionality than smartphones [17]. These mobile phone LCAs are, unfortunately, not isolated
occurrences as far as electronics LCAs studies are concerned. Hischier et al. identified, for LCA
comparisons of media consumption via tablet or printed versions, that differences can be explained by
different methodological approaches used for LCI modeling [18].

Challenges 2014, 5 411
Figure 1. Results of three previous LCAs (CC) of different smartphones with a lifetime of three years.
Hence, without proper sector standardization, beyond the LCA standards of ISO, the robustness of
LCA results in general, and ICT Equipment LCA results and ICT Sector footprint in particular, will be
in doubt.
In 2009 and 2010 the European Commission (EC) addressed this problem [19,20] and as a result
several standards/guides have emerged. The most detailed requirement specification for LCA of ICT
Equipment was developed by European Telecommunications Standards Institute (ETSI) [8]. In 2012
Orange (OGE) and Huawei (HuW) were among the organizations that volunteered to participate in an
EC pilot project, testing ICT LCA methodologies. A report about the outcome of the pilot test concluded
that the tested LCA methodologies were in principle compatible and workable however, allowed
considerable freedom regarding LCA modeling decisions that influenced the calculation outcomes for
CC and primary energy usage [21].
This research will for the first time shed light on these conclusions by presenting two LCAs of one
smartphone, one by HuW and the other by OGE. The additional goals are to understand the effect on CC
impact category results in LCA of using different LCA tools, databases and methodological choices. We want
to understand if the difference and uncertainty of electronics LCA scores are bearable for policy makers
if the LCA studies are based on ETSI TS 103 199 (ETSI LCA) [8].
2. Materials and Methods—LCA Methodologies Used
Below is described how OGE and HuW, starting from the same goal and scope for the same studied
product system, use different modeling approaches to perform the LCA. The baseline scenario is
identical for OGE and HuW and two LCA calculations are done for one product.
Reference 1, Apple iPhone 4S Reference 2, Nokia Lumia 920 Reference 3, Huawei U8652
Raw Material Recycling
End-of-Life Treatment 1.4 0.2 0.1
Use 16.1 2.7 5.9
Distribution 4.2 2.4 6.9
RMA+PP+Assembly 48.3 10.7 30.0
70
16
43
0.0
10.0
20.0
30.0
40.0
50.0
60.0
70.0
80.0kg
CO
2e
/lif
eti
me
Previous LCAs of smartphones

Challenges 2014, 5 412
2.1. Goal and Scope
The goal of the study is to estimate the CC mid-point impact category result of a Smartphone (U8350)
during its lifetime, using attributional process-sum LCA. Process-sum LCA uses a bottom-up approach
in which material contents and component inventories are used as the starting point for the analysis [22].
The study object (product system) is the U8350 (ICT Equipment) smartphone assembled in China
and shipped to France for use on wireless networks, and then sent for end-of-life treatment in France.
HuW and OGE both strive for full compliance with ETSI LCA, i.e., fulfilling all of its 83 mandatory
requirements [23].
U8350 physically consists of these building blocks: smartphone, Li-ion battery, complete packaging
(cardboard, plastic bags, manual, USB/µUSB cable, headset, charger).
These building blocks can be categorized according to parts defined in Table B.1 in ETSI LCA [8]. In
this LCA the impact of eventual spare parts production is not included. Moreover, the CO2e emissions
associated with the operating system software program of U8350 are excluded from the studied product
system.
Functional Unit
The mandatory basic functional unit (f.u) as required by ETSI LCA is total lifetime use. More
specifically, the f.u. is defined as two years of U8350 usage charging the battery from 0% to 100% once
every 24 h. The reference flow is one U8350 smartphone with its packaging and accessories.
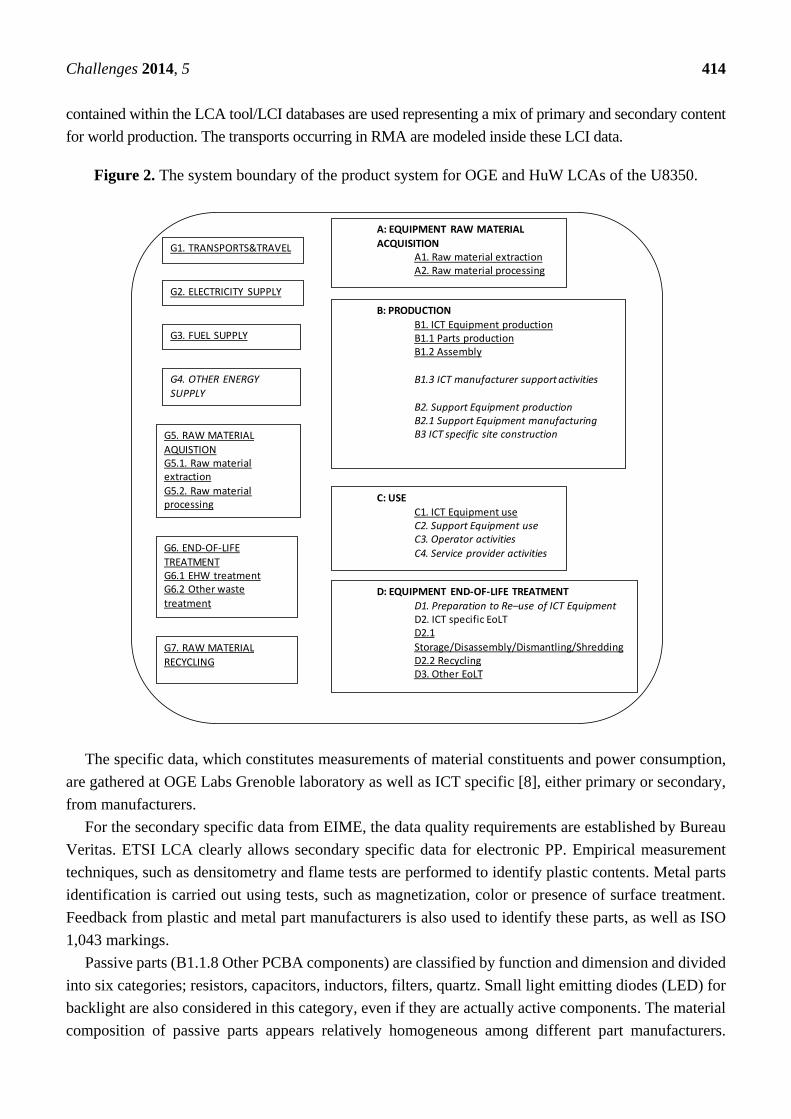
2.2. System Boundaries
Table 1 of ETSI LCA (ETSI, 2011) specifies the mandatory, recommended, and optional life cycle
stages/unit processes for ICT Equipment. A1, A2, B1.1, B1.2, C1, D2.1, D2.2, D3 (Figure 2) life cycle
stages are included in this LCA.
Certain activities, B1.3, B2, B.3, C2-C4 and D1, are not part of the studied product system.
Furthermore support activities, such as marketing, development and sales, are not considered for unit
processes because of lack of data and models.
OGE advocate a cradle-to-grave approach using the EIME 5.0 LCA tool database version 11.4. [24].
EIME 5.0 uses a database specifically designed for electrical and electronic products based on data compiled
from the Federation of Electric and Electronic Industries and Communication (FIEEC). The current software
database represents some 160 parts, 470 raw materials and 190 processes called “modules”.
HuW on the other hand use the SimaPro 7.3.2 LCA tool and an approach separating all life cycle
stages such as RMA and PP.
In Figure 2 below the underlined processes are included in the studied product system whereas, the
italic marked are excluded. G1, G2, G3, etc. denote reoccurring generic unit processes and A-D main
life cycle stages for the Equipment for which the LCA is made.

Challenges 2014, 5 413
Table 1. Summary of HuW CO2e scores for raw materials used by U8350.
Raw Material Amount per
Piece U8350 Unit
Mean g CO2e per Unit and
Uncertainty ± 2σ
Mean g CO2e per
Piece U8350
Iron/Steel alloys (primary) 13 × 1.25 = 16.3 g 6.13, 10% 100
Aluminum alloys (primary) 7.9 × 1.10 = 8.69 g 12.2, 15% 106
Copper alloys (primary) 28.8 × 1.25 = 36 g 3.34, 15% 120
Gold (primary) 0.123 × 1.01 = 0.124 g 18,800, 32% 2,336
Silver (primary) 0.179 × 1.01 = 0.181 g 145, 24% 26
Nickel 1.2 × 1.25 = 1.5 g 7.18, 25% 11
Tin 1.56 × 1.25 = 1.95 g 17.1, 46% 33
Palladium 0.0336 × 1.01 =
0.034 g 10,500, 22% 356
Zinc 0.972 × 1.25 = 1.215 g 4.29, 31% 5
Acrylonitrile butadiene styrene (ABS) 18.4 × 1.25 = 23 g 4.39, 7% 101
Polyester (e.g., PET) 2.29 × 1.25 = 2.86 g 2.7, 13% 8
PMMA 1.53 × 1.25 = 1.91 g 8.38, 6% 16
PA (Nylone) 1.3 × 1.25 = 1.62 g 8.5, 5% 14
PVC 14.5 × 1.25 = 18.1 g 2.01, 11% 36
Polyethylene (PE)—HD 6.9 × 1.25 = 8.62 g 2.02, 7% 17
Polycarbonate (PC) 2.15 × 1.25 = 2.69 g 7.78, 7% 21
Polypropylene 1.05 × 1.25 = 1.31 g 1.97, 10% 3
Polyurethane (PUR) 1.26 × 1.25 = 1.58 g 4.83, 22% 8
Epoxy 16 × 1.25 = 20 g 1.1, 11% 22
Glassfibre 34.6 × 1.25 = 43.3 g 2.79, 18% 121
SiO2 5.7 × 1.25 = 7.13 g 0.021, 10% 0.15
Glass 26.7 × 1.25 = 33.4 g 1.09, 32% 36
SUM of B1.1 and B1.2 including
Ancillary Raw Material Acquisition 3,496, 2σ = 782
The geographical and temporal coordinates vary dynamically for the RMA and Production of the ICT
Equipment. The presented results for RMA and Production will therefore represent a global average for
the U8350.
OGE use a laboratory weighing machine (Milligram scale) to establish the mass of each part. HuW
mass numbers for parts are originally provided by as material content declarations by part producers.
U8350 is assembled in China and sent to France by plane.
2.3. Inventory
2.3.1. Data Collection
Raw Material Acquisition, Part Production, Assembly
OGE
Regarding data collection in the EIME 5.0 software RMA and PP are linked, i.e., it is not possible to show
separate results for RMA (A). For raw material extraction (A1) and raw material processing (A2) databases
Challenges 2014, 5 414
contained within the LCA tool/LCI databases are used representing a mix of primary and secondary content
for world production. The transports occurring in RMA are modeled inside these LCI data.
Figure 2. The system boundary of the product system for OGE and HuW LCAs of the U8350.
The specific data, which constitutes measurements of material constituents and power consumption,
are gathered at OGE Labs Grenoble laboratory as well as ICT specific [8], either primary or secondary,
from manufacturers.
For the secondary specific data from EIME, the data quality requirements are established by Bureau
Veritas. ETSI LCA clearly allows secondary specific data for electronic PP. Empirical measurement
techniques, such as densitometry and flame tests are performed to identify plastic contents. Metal parts
identification is carried out using tests, such as magnetization, color or presence of surface treatment.
Feedback from plastic and metal part manufacturers is also used to identify these parts, as well as ISO
1,043 markings.
Passive parts (B1.1.8 Other PCBA components) are classified by function and dimension and divided
into six categories; resistors, capacitors, inductors, filters, quartz. Small light emitting diodes (LED) for
backlight are also considered in this category, even if they are actually active components. The material
composition of passive parts appears relatively homogeneous among different part manufacturers.
G1. TRANSPORTS&TRAVEL
G2. ELECTRICITY SUPPLY
G3. FUEL SUPPLY
G4. OTHER ENERGY
SUPPLY
G5. RAW MATERIAL
AQUISTIONG5.1. Raw material extraction
G5.2. Raw material processing
G6. END-OF-LIFE
TREATMENTG6.1 EHW treatmentG6.2 Other waste
treatment
G7. RAW MATERIAL
RECYCLING
A: EQUIPMENT RAW MATERIAL
ACQUISITIONA1. Raw material extractionA2. Raw material processing
B: PRODUCTION
B1. ICT Equipment productionB1.1 Parts productionB1.2 Assembly
B1.3 ICT manufacturer support activities
B2. Support Equipment productionB2.1 Support Equipment manufacturingB3 ICT specific site construction
C: USE
C1. ICT Equipment useC2. Support Equipment useC3. Operator activities
C4. Service provider activities
D: EQUIPMENT END-OF-LIFE TREATMENT
D1. Preparation to Re–use of ICT EquipmentD2. ICT specific EoLTD2.1
Storage/Disassembly/Dismantling/ShreddingD2.2 RecyclingD3. Other EoLT

Challenges 2014, 5 415
Therefore, there is no motivation to request material composition and LCI data for the manufacturing of
each part.
Active parts (B1.1.4 Integrated Circuits, IC) mainly include ICs, transistors and diodes. Previous
LCAs of mobile phones tend to show that these parts have a relatively high eco-environmental impact.
Therefore it is decided to analyze IC in greater detail than other parts. Importantly, there are many
different types of IC package types whose architecture directly influences the eco-environmental impact
of the IC parts [25]. For each IC with more than 12 connections the good silicon (Si) die area inside the
IC chip is identified. Good Si area is the area of the bare die inside unpackaged ICs. Corcoran et al. [23]
described further the OGE data collection for parts.
OGE measure values for parts and important examples of respective EIME models used for each part.
Moreover OGE’s approach with EIME makes use of other metrics than mass, for e.g., printed circuit
boards and Displays, explaining why the total mass is not 326 g as given below in Table 2.
HuW
HuW’s approach is based on supplier data from product data management (PDM) systems and the
RMA and PP are modeled separately in SimaPro LCA tool and associated LCI databases (See Section
2.3.2). RMA includes the total use of Raw Materials, losses and connection to EoLT metal recycling.
HuW estimates the Si die area according to Equation (1):
𝑆𝑖𝑎𝑟𝑒𝑎 = 𝐶ℎ𝑂 ×𝐶𝑑𝑊
𝑊𝑂+ 𝐶ℎ𝑆 ×
𝐶𝑑𝑊
𝑊𝑆+ 𝑃𝑂 ×
𝑃𝑑𝑊
𝑊𝑂+ 𝑃𝑆 ×
𝑃𝑑𝑊
𝑊𝑆 = 7.26 𝑐𝑚2 (1)
where
ChO = share ordinary dies in Charger, 100%
ChS = share stacked dies in Charger, 0%
PO = share ordinary dies in Phone, 53.5%
PS = share stacked dies in Phone, 46.5%
CdW = mg Si dies in Charger, 47.25 mg
PdW = mg Si dies in Phone, 85.7 mg
WO = mg/cm2 for ordinary Si dies, 150
WS = mg/cm2 for stacked Si dies, 6
The measured value from OGE is 4.85 cm2.
Transports
Transport of U8350 to use stage, TrpU8350, is modeled by both companies on assumptions of share of
air, truck and van transports (See Equation (2)).
HuW LCA used the following values
A = % of transports from B1.2 to France by Air. 1 (100% Air transport)
B = Average air distance from near B1.2 Airport to near France Airport (km). 9,600 km
C = Average emission factor for air-freight (kg CO2e/tonkm, 1.07)
D = Average Distance B1.2 to near B1.2 Airport (km). 100 km
E = Average emission factor for lorry in B1.2 (kg CO2e/tonkm, 0.279).
F = Average Distance France Airport to France warehouse (km). 230 km

Challenges 2014, 5 416
G = Average emission factor for lorry in France (kg CO2e/tonkm, 0.279).
H = Average Distance France warehouse (shop) to C1 use location site (km). 150 km
I = Average emission factor for van (kg CO2e/tonkm, 1.51).
W= weight of U8350, 357 g
𝑇𝑟𝑝𝑈8350 = 𝐴 × 𝑊(𝐵 × 𝐶 + 𝐷 × 𝐸 + 𝐹 × 𝐺 + 𝐻 × 𝐼) = 3.78 𝑘𝑔𝐶𝑂2𝑒 (2)
OGE do not consider the H transport due to high variability (mean of transport, distance…).
Use Stage Power
OGE
Use phase electricity energy usage is measured by OGE in its laboratory (uncertainty 2.6σ, 99%
confidence interval around the mean value) using Software Labview and National Instruments for the
capture card. A complete charge of the battery 0 to 100% is measured at the mains.
HuW
HuW use measurements of charger efficiency and battery capacity and assume one charge of the
battery, 0 to 100%, per day.
Huawei estimate the electricity usage for the studied U8350, UseU8350, according to Equation (3).
𝑈𝑠𝑒𝑈8350 =𝐵𝐶
1000× 𝑉 × 𝑌 ×
𝐷𝑌
𝐶𝐸= 4 754 𝑊ℎ (3)
where
BC = (mAh) Battery capacity = 1,200
V = (Voltage, V) = 3.7
Y = (years) lifetime = 2
DY = (days per year), charging = 365
CE = (%), charger efficiency = 0.6817
A French average electricity mix for low voltage is applied (“Electricity, low voltage, at grid/FR U”
from ecoinvent db, 0.108 kg CO2e/kWh) as the U8350 is operating in France market and the purpose of
the study is to estimate CC impact of the smartphone in French Networks.
End-of-Life
For end-of-life management, the U8350 follows the European WEEE directive requiring more than
85wt% recyclability [26].
OGE
For end-of-life, OGE use EIME database for specific EoLT for storage, disassembly, dismantling,
shredding and recycling. The EoLT is assumed to be done in France and EoL transport distances are set
accordingly [23].

Challenges 2014, 5 417
HuW
HuW focuses the EoLT modeling on the metal recycling and use the 50/50 allocation method,
however, no primary data are collected as EoLT for CC has shown to be of low importance in previous
LCAs of mobile phones.
2.3.2. Data Calculation
OGE
As far as data calculation, OGE LCA value for CC is expressed as the total of A (all raw materials)
+ B (production) for all part types. For Assembly OGE use pre-made LCA modules. Further details of
OGE modeling are reported in a separate report [23].
HuW
HuW on the other hand, separates these life cycle stages for all parts as shown in Tables 1 and 2.
Assembly electricity is measured in the assembly factory.
Table 2. Summary of HuW CO2e scores for part production including auxiliary raw materials.
Part Category Amount per Piece U8350 Unit Mean g CO2e per
Unit and ± 2σ
Mean g CO2e per
Piece U8350
B1.1 Batteries, Lithium 24.06 g 5.62, 18% 135
B1.1.2 Cables μUSB-cable included in B1.1.3
B1.1.3 Electro-Mechanics 42 g 5.64, 56% 237
B1.1.3 Chargers 56.3 g 35.6, 28% 2,004
B1.1.4 ICs, Si die area (front-end) 7.26 cm2 2,170, 56% 15,754
B1.1.4 ICs, all types (back-end) 0.984 g 182, 14% 179
B1.1.4 Transistors 0.0737 g 141, 24% 10
B1.1.4 Diodes (Light Emitting, Transient
Voltage Suppression, Metal-oxide-
semiconductor field-effect transistor)
0.886 g 250, 20% 221
B1.1.5 Mechanics/Materials, Aluminum alloys 7.9 g 4.6, 14% 36
B1.1.5 Mechanics/Materials, Iron/Steel alloys 13 g 1.16, 11% 15
B1.1.5 Mechanics/Materials, Copper alloys 28.8 g 1.23, 15% 35
B1.1.5 Mechanics/Materials, Polymers 72.4 g 1.85, 16% 134
B1.1.6 Touch Screen+LCD module 20.16 cm2 487, 68% 9,818
B1.1.7 Printed Circuit Board, Plastic
multilayer boards (FR4) 35.6 (6 layers, 49 cm2) g 33.8, 12% 1,203
B1.1.8 Filters 0.057 g 537, 11% 31
B1.1.8 Inductors (chip type) 0.169 g 38.4, 30% 6
B1.1.8 Resistors (Thick film chip) 2.04 g 30.6, 35% 62
B1.1.8 Capacitors (Surface Mounted Device)
ceramic) 0.675 g 40.7, 33% 27
B1.1.8 Quartz crystal oscillators (Crystal
resonator, Temperature Compensated) 0.054 g 56.7, 11% 3

Challenges 2014, 5 418
Table 2. Cont.
Part Category Amount per Piece U8350 Unit Mean g CO2e per
Unit and ± 2σ
Mean g CO2e per
Piece U8350
B1.1.9 Packaging materials, Cardboard box 132 g 0.445, 9% 59
B1.1.10 Electronic components, unspecified
(Fuses, Speaker, Microphone) 1.34 g 282, 105% 378
B1.2 Assembly, PCBAs 1 p 680, 21% 680
G1. Transport, air scenario for Distribution 357 g 10.5, 11% 3,770
-Air 357 g 10.2, 8% 3,641
-Lorry 357 g 0.092, 60% 32
-Van 357 g 0.23, 56% 81
SUM of B1.1 and B1.2 including Ancillary
Raw Material Acquisition 34,779, 2σ = 14,600
2.3.3. Allocation
OGE
Regarding allocation of data, due to limitations of the EIME 5.0 LCA tool, OGE is bound to use the
100/0 allocation method for Raw Material Acquisition with recycled content ratios for each Raw
Material fixed by the EIME tool. No Raw Material Recycling discount is therefore included in the
calculation model.
Moreover the EIME LCA tool is not able to handle metal, paper, cardboard or plastic recycling.
HuW
HuW’s modeling approach within SimaPro is flexible regarding allocation and recycled content.
ETSI LCA prescribes cartian principles allocation rules for recycling (8, Section 6.3.3). 100/0 allocation
and no recycled content is used for RMA and 50/50 allocation and 50wt% material recovery for steel,
aluminum, copper, gold, silver, and palladium for RM recycling of the metals within the Phone Device.
All raw materials used are assumed to be 100% primary, i.e., no recycled content (Equation (4)). At G7
(raw material recycling), according to the 50/50 allocation method, 50% of the secondary raw material
acquisition is allocated to the present life cycle. Moreover, 50% metal recovery efficiency is assumed
not to overestimate the recycling benefit.
As a result, the impact of metal production, Imetals, per mass according to 100/0 + 50/50 and 50/50
allocation methods, is given by Equations (4) and (5), respectively.
𝐼𝑚𝑒𝑡𝑎𝑙𝑠 = 1.0 × 𝑃 × 𝐼𝑃 + 0.0 × 𝑆 × 𝐼𝑆 + 0.5 × (𝑆 + 𝑅𝑃) × 𝐼𝑆 − 0.5 × (𝑆 + 𝑅𝑃) × 𝐼𝑃 (4)
𝐼𝑚𝑒𝑡𝑎𝑙𝑠 = 0.5 × 𝑃 × 𝐼𝑃 + 0.5 × 𝑆 × 𝐼𝑆 + 0.5 × 𝑅𝑃 × 𝑆 + 0.5 × 𝐿𝑃 × 𝑃 (5)
P = share primary, %, 100
S = share secondary, %, 0
IP = Impact primary production
IS = Impact secondary production
RP = Recovered material, %, 50
LP = Lost material, %, 50

Challenges 2014, 5 419
The share of the U8350 (smartphone + charger + Li-ion battery + packaging materials) that goes to
metal recycling is 33.3 g of 357 g, i.e., 9.3%. The remaining 324.7 g is cardboard box (smartphone
packaging materials), charger packaging materials, Li-ion battery, charger, mechanical polymers in
smartphone, and residuals.
Example of 100/0 + 50/50 Allocation Method for Gold
For gold the 100/0+50/50 allocation method according to Equation (4) results in 14,311 g CO2e/g
gold (1.0 × 1.0 × 18,800 (burden upstream) + 0.0 × 0.0 × 846 (burden upstream) + 0.5 × (0 + 0.5) (burden
downstream) × 846 − 0.5 × (0 + 0.5) (credit downstream) × 18,800).
The 50/50 allocation method according to Equation (5) gives the same result as 100/0 + 50/50 method,
(0.5 × 1.0 × 18,800 + 0.5 × 0.0 × 846 + 0.5 × 0.5 × 846 + 0.5 × 0.5 × 18,800).
For Gold per piece U8350, (−)556 g CO2e (0.5 × 0.5 × 0.124 g × 846 g/g − 0.124 g × 0.5 (allocation)
× 0.5 (recovery efficiency) × 18,800 g/g) is avoided.
Hence, the CC impact for Gold per U8350 life cycle is 1,774 g CO2e (0.124 × 14,311), where 2,331
(0.124 × 18,800) is from Raw Material Acquisition, and (−)556 from metal recycling.
These effects are shown below in Figures 3 and 4 and more details in Corcoran et al. [23].
2.4. Data Quality
2.4.1. OGE
OGE seek high quality of LCI data for the most impacting flows (e.g., area of good Si dies, area of
Display LCD screen, and the CO2e intensities for these parts).
Both companies do a qualitative evaluation of the data quality based on criteria listed in ETSI LCA
Section 5.2.4 and find the quality “good” according to the Product Environmental Footprint guide [27].
OGE make a data quality rating (DQR) according to Equation (6).
𝐷𝑄𝑅 = (𝐶𝑜𝑚𝑝𝑙𝑒𝑡𝑒𝑛𝑒𝑠𝑠 𝑠𝑐𝑜𝑟𝑒, 𝐶 + 𝐴𝑐𝑞𝑢𝑖𝑠𝑖𝑡𝑖𝑜𝑛 𝑚𝑒𝑡ℎ𝑜𝑑 𝑠𝑐𝑜𝑟𝑒, 𝐴𝑀
+ 𝐷𝑎𝑡𝑎 𝑅𝑒𝑝𝑟𝑒𝑠𝑒𝑛𝑡𝑎𝑡𝑖𝑣𝑒𝑛𝑒𝑠𝑠 𝑠𝑐𝑜𝑟𝑒, 𝐷𝑅 + 𝐷𝑎𝑡𝑎 𝐴𝑔𝑒 𝑠𝑐𝑜𝑟𝑒, 𝑇
+ 𝐺𝑒𝑜𝑔𝑟𝑎𝑝ℎ𝑖𝑐𝑎𝑙 𝑐𝑜𝑟𝑟𝑒𝑙𝑎𝑡𝑖𝑜𝑛 𝑠𝑐𝑜𝑟𝑒, 𝐺𝐶
+ 𝑇𝑒𝑐ℎ𝑛𝑜𝑙𝑜𝑔𝑖𝑐𝑎𝑙 𝑐𝑜𝑟𝑟𝑒𝑙𝑎𝑡𝑖𝑜𝑛 𝑠𝑐𝑜𝑟𝑒, 𝑇𝐶
+ (𝑤𝑒𝑎𝑘𝑒𝑠𝑡 𝑞𝑢𝑎𝑙𝑖𝑡𝑦 𝑜𝑏𝑡𝑎𝑖𝑛𝑒𝑑) × 4/(6 + 4)
(6)
Due to lack of time only IC data quality is estimated as (1.4 + 1 + 1 + 2 + 3 + 2 + 4×3)/(10) = 2.24.
2.4.2. HuW
HuW estimate the overall data quality by Equation (7).
𝐷𝑄𝑅 = (𝑀𝑒𝑡ℎ𝑜𝑑𝑜𝑙𝑜𝑔𝑖𝑐𝑎𝑙 𝑐𝑜𝑛𝑠𝑖𝑠𝑡𝑒𝑛𝑐𝑦, 𝑀𝐶 + 𝐶 + 𝑈𝑛𝑐𝑒𝑟𝑡𝑎𝑖𝑛𝑡𝑦, 𝑈 + 𝐴𝑀
+ 𝑆𝑢𝑝𝑝𝑙𝑖𝑒𝑟 𝐼𝑛𝑑𝑒𝑝𝑒𝑛𝑑𝑒𝑐𝑒, 𝑆𝐼 + 𝐷𝑅 + 𝑇 + 𝐺𝐶 + 𝑇𝐶 + 𝐶𝑢𝑡
− 𝑜𝑓𝑓 𝑟𝑢𝑙𝑒𝑠, 𝑅𝐼𝐸 + (𝑤𝑒𝑎𝑘𝑒𝑠𝑡 𝑞𝑢𝑎𝑙𝑖𝑡𝑦 𝑜𝑏𝑡𝑎𝑖𝑛𝑒𝑑) × 4/(10 + 4)
(7)

Challenges 2014, 5 420
= 1.75 + 1.5 + 2.75 + 2.25 + 2.25 + 2 + 2 + 2 + 2.25 + 1.25 + 2.75 (weakest quality
obtained) × 4)/(10 + 4) = 2.21.
Further details can be found in Corcoran et al. [23].
3. Results
Below in Figures 3 and 4 are shown the key results of the present paper.
Figure 3. The effect of different LCA modeling approach and metrics choice on CC impact category.
Figure 4. Partition of HuW and OGE baseline scenario CC scores for U8350.
EIME SW/OGE method&metrics,
baseline
EIME SW/OGE method/OGE+Hu
W metrics
SimaPro SW/HuW method/OGE+Hu
W metrics
SimaPro SW/HuW method&metrics,
baseline
Raw Material Recycling 0.0 0.0 -0.5 -0.6
End-of-life treatment 0.4 0.4 1.0 1.0
Use 1.0 0.7 0.5 0.5
Distribution 6.5 7.1 3.8 3.8
RMA+PP+Assembly 21.7 21.7 28.7 34.6
29.6 29.9
33.5
39.2
-5.0
0.0
5.0
10.0
15.0
20.0
25.0
30.0
35.0
40.0
45.0kg CO2 equivalents/lifetime
GWP100 comparison of different LCA modelling
3.3
0.450.4
35
28.2
0.5 1.0
-5
0
5
10
15
20
25
30
35
40
Raw
Material
Acquisition
(A) HuW
Raw
Material
Acquisition
(A) OGE
Production
(B) HuW
Production
(B) OGE
Use (C)
HuW
Use (C)
OGE
EoLT (D)
HuW
EoLT (D)
OGE
kgCO2e/lifetime
Metal recycling
Transports
Other EoLT
ICT specific EoLT
Preparation for Reuse of ICT Equipment
ICT equipment use
Transports
ICT manufacturer support activities
Assembly
Parts production
Transports
Raw material processing
Raw material extraction

Challenges 2014, 5 421
OGE’s LCA method has a higher precision (mainly due to measurement of part masses) than HuW’s,
however, both lead to the same conclusions for CC impact category. Different inventory databases could
lead to diverse results because of vague system boundary definitions and incomplete data quality [12].
However, as shown in Figure 4, thanks to the reporting requirements of the ETSI LCA [8], a clear
understanding of the differences between LCA modeling approaches is obtained. For smartphone LCAs,
the differences between two different practitioners modeling choice are apparently not crucial for
understanding the main drivers of CC. The ETSI LCA [8] allows the LCA practitioner to rather freely
choose a methodological approach. However, the large number of requirements of ETSI LCA [8]
suggests that methodological choices concerning allocation, cut-off, and system boundary setting are in
reality somewhat limited.
4. Discussion
Different LCA approaches are allowed by the current LCA ICT standards, which will lead to different
absolute scores but hopefully not different conclusions for eco-design. In Table 3 are shown the most
important metrics used by OGE and HuW, which partly explain the CC score differences. The two
middle columns shall be interpreted as follows: “EIME SW/OGE method/OGE&HuW metrics” means
that OGE use EIME LCA tool and OGE modeling approach, however, used HuW metrics for use stage
electricity and total mass. “SimaPro SW/HuW method/OGE & HuW metrics” means that HuW use
SimaPro LCA tool and HuW modeling approach, however, use OGE metrics for gold mass and Si die
area.
Table 3. Effect of the four most important metrics used by OGE and HuW for LCA of U8350.
Metric
EIME SW/OGE
Method & Metrics,
OGE Baseline
EIME SW/OGE
Method/OGE &
HuW Metrics
SimaPro SW/HuW
Method/OGE &
HuW Metrics
SimaPro SW/HuW
Method & Metrics,
HuW Baseline
Si die area (cm2) 4.85 4.85 4.85 7.26
Au mass (mg) 119 119 119 123
Use electricity (kWh) 6.57 4.75 4.75 4.75
Total mass (g) 326 357 357 357
kg CO2e 29.6 29.9 33.5 39.2
Table 3 shows that if OGE and HuW would have been able to obtain the same metrics values the
differences induced by the LCA tools (allocation, databases, algorithms) would be significantly reduced.
Rules for measurement and calculation defined in product category rules (PCR) can solve this problem.
Then two different smartphone models from different companies could then theoretically be compared,
should they be technically comparable. Anyway, a clearly achievable improvement compared to the
present situation is that the relative change within product groups such as smartphones can be measured
more consistently and credibly. With a high likelihood the strictness of ETSI LCA [8] indicates that PCR
might be unnecessary for comparing smartphone LCAs.

Challenges 2014, 5 422
4.1. Uncertainty Analyses
The uncertainly analysis by OGE is made by an estimation as the EIME LCA tool is incapable of
uncertainty analysis. However, EIME claim that their modules have less than 20% uncertainty range.
Moreover, as OGE make numerous measurements for masses and areas of Si die and screens, the
largest uncertainty is found in the intensity measures from the EIME LCI database, e.g., kg CO2e/cm2
Si die area. Furthermore, EIME’s LCI database is updated systematically and on this basis OGE
estimates, with a 95% confidence interval, 23.7–35.5 kg CO2e.
HuW use SimaPro’s uncertainty calculation, which is based on Monte Carlo simulation resulting in
a 95% confidence interval of 24.5–53.9 kg CO2e.
Based on the above data HuW make a t-test [28] in which here a high probability, of mistakenly
favoring one score before other, is desired.
The t-test shows (Table 4) that it is a 49% probability that OGE baseline score 29.6 kg could be higher
than HuW baseline score 39.2 kg and vice versa.
Table 4. HuW t-test of baseline scenario LCA scores.
Various Inputs and
Outputs for t-Test Value
Coeffcient of
Variation% Details
OGE U8350 basic CO2e (kg) 29.6 0.1 20% 2σ
HuW U8350 basic CO2e (kg) 39.2 0.178 35.6% 2σ
σ 0.0997 0.177 SQRT(LN(0.12 + 1)) = 0.0997, SQRT(LN(0.1782 + 1)) = 0.177
e(σ) 1.105 1.193 e0.099751 = 1.105, e0.177 = 1.193
(e(σ))2 1.220 1.423 1.1052 = 1.2208, 1.1932 = 1.423
log10 0.086 0.153 log10 (1.2208) = 0.0866, log10 (1.423) = 0.153
LOG(29.6/39.2)/(SQRT(0.08662 + 0.1532)) = −0.69243
t-test 0.49 0.692011 = TINV(0.49, 150)
This means that the CC results for one study object, at least smartphones, modeled with two largely
different and independent LCA modeling approaches, are likely robust if both use ETSI LCA.
Nevertheless, comparisons between ICT LCAs performed by different organizations were agreed to be
beyond the scope of ETSI LCA [8], as such comparisons would require that the assumptions and context
of each study are exactly equivalent. Here the context is exactly equivalent, whereas several assumptions
are different.
4.2. The Effect of Skills and Competence of LCA Practitioners on the Outcome
Less skilled LCA practitioners might not be able to choose intensity data carefully enough, which
will lead to unnecessary uncertainty of the end result.
For example, consider the need to use an LCI data model for production of 1 m² of Si die. In EIME
one LCA practitioner could choose “Wafer, from silicon; before dies slicing; France, FR” or “Wafer,
from silicon; before dies slicing; China, CN”. In Simapro another could pick ecoinvent’s “Wafer,
fabricated, for integrated circuit, at plant/GLO”. The ratio between these EIME and SimaPro LCI data
is 1:2.4 and 1:5, respectively, and could therefore be significant for the whole smartphone LCA or other

Challenges 2014, 5 423
electronics LCAs. It is evident that the LCA practitioner needs to possess the necessary skills to assess
the data quality and representativeness and test it carefully against the requirements of ETSI LCA.
4.3. Sensitivity Analyses
OGE evaluate the robustness of the results based on sensitivity analysis including four parameters
(electricity consumption in the use stage, area of display LCD touch screen, distance of Air
transportation and area of good Si dies).
A change of ±1% in the input values for these four drivers gives a change of ±0.84 % for the outcomes.
HuW sensitivity analysis is founded in cut-off analyses and changing of flows for lifetime, electricity
mix and metal recovery (Figure 5).
Figure 5. Results of HuW sensitivity analyses.
4.4. Relation to Eco-Rating of Mobile Phones
Moreover, this research is associated with the Eco-Rating (ER) schemes proposed by telecom
operators for mobile phones [29]. The reason is that these schemes include a section for simplified LCA
in which several metrics based criteria are defined. Here two sensitivity checks are also made with OGE
ER Basic LCA [30], and a linear model for RMA+PP+Assembly+Distribution using display screen
mass, battery mass, and printed circuit board assembly (PCBA) mass as inputs [31].
For OGE ER 27.44 kg CO2e is obtained using 7.26 cm2 as Si die area [23], and with Teehan/Kandlikar
linear model 0.18 × 100 g (mass PCBA) + 0.3 × 24 g (mass battery) + 0.065 × 28.3 g (mass display screen)
= 27.0 kg. The result for OGE ER is not surprising as the carbon footprint indicator algorithms are based
on the information of hundreds of mobile phone models. Teehan and Kandlikar simplified method for
RMA + PP + Assembly + Distribution with 27.0 kg shows a good precision compared to OGE full LCA
value for RMA + PP + Assembly + Distribution, 28.2 kg.
42.4
41.1
40.9
38.7
77.6
26.6
22.0
39.3
0 10 20 30 40 50 60 70 80 90
C-O3. Software + C-O1 + C-O2
C-O2. Road transports from A to B
+ C-O1
C-O1. Some air transports within
B1.1 included
90% Recycling of total input (metal
recovery efficiency) instead of 50%
Operating lifetime 1 years instead
of 2 years
Operating lifetime 3 years instead
of 2 years
Photovoltaic electricity for Screen
and IC, front-end production
Basic scenario
Sensitivity analyses: Total score [kg CO2e] per U8350 functional unit, accumulation

Challenges 2014, 5 424
4.5. Marginal Electricity
Partly smartphones are charged at night and partly at daytime. Marginal electricity mixes can be used
instead of average ones to reflect the difference in time and season when the present smartphone is
charged. As shown in Tables 5 and 6, the marginal electricity in France is a mix of thermal power (≈56%)
and renewable (≈44%) calculated on the basis of electricity statistics [32], in this case between 2008 and
2009. Due to data unavailability we cannot confirm further the hour-by-hour French marginal mixes.
Table 5. Sources of French electricity production (TWh) 2008–2010 and 2020.
Source of Electricity Gross Generation (g.g.)
in 2008 [33] G.g. in 2009 [34] G.g. in 2010 [35] Expected in 2020 [35]
Thermal, all 59.4 90
Thermal, Coal 27 28.7
Thermal, Oil 6 6.17
Thermal, Gas 22 21.0
Nuclear 439 409.7 407.9 385
Hydro 68 61.9 68 79
Other renewables 12.9 14.5 15 96
TOTAL 575 542 550 650
Table 6. HuW estimation of French marginal electricity mixes 2009 and 2020.
Source of Electricity Change 2008-2009 (TWh) Applied Mix, 2009 Expected Change
2010-2020 (TWh) Applied Mix, 2020
Thermal, all - 30.6 25%
Thermal, Coal 1.7 46.3% - -
Thermal, Oil 0.2 10.1% - -
Thermal, Gas 0 0% - -
Nuclear 0 0% 0% 0%
Hydro 0 0% 11 9%
Other renewables 1.6 43.6% 81 66%
TOTAL 3.7 100% 122.6 100%
The 2008–2009 French marginal mix, being some 0.6 kg CO2e/kWh, is assumed to be used at night
when demand is lower than at day.
The 2010–2020 French marginal mix is expected to be thermal (≈25%), hydro (≈9%), and other
renewables (≈66%), which would render around 0.3 kg CO2e/kWh.
Therefore nighttime charging of smartphones, with French marginal mix, suggests higher use stage
emissions than the average French electricity mix around 0.1 kg CO2e/kWh dominated by nuclear. The
marginal mix at day is assumed to be close to the average French mix.
All in all however, also in France, the use stage electricity usage for smartphones will still be
relatively small.

Challenges 2014, 5 425
The Big Picture
Moreover, the smart mobile devices are used in a larger context of wireless networks which in 2012
used around 10% of the annual ICT Sector electricity globally (appr. 1100 TWh) whereas the smartphone
RMA + PP + Assembly + Distribution (appr. 23 TWh) and charging (appr. 5 TWh) only used 2.5% [23].
In this context the relation between the receiver sensitivity of the mobile phones and the radio base
station power usage has been highlighted [36]. Possibly this relation could be an extension of the mobile
phone LCA or ER schemes.
4.6. Potential for Reduction of CO2e Emissions
The following reduction potentials generally do not include any system expansion and we are aware
of the limitations of the attributional LCA model for analyzing the net consequences of decisions [37].
Nevertheless, the upstream and the display LCD screen is the most important part and it has to be
determined if it is the direct CO2e emissions, or indirectly the grid electric power mixes, which is the
main source of the problem. In 2012 research showed that NF3 is a marginal contributor in LCD flat-
screen manufacturing [38]. This suggests that gases contributing to global warming, released from the
production upstream, are not the main issue for screen production.
Then, if the main reason for CO2e emissions in Display LCD screen production is instead average grid
electric power production mixes [23], and if it could somehow be replaced by renewable electricity, the
reduction potential for U8350 life cycle is 22%. As shown in Figure 5, another 21% is possible if also the
average grid electric power production mixes used in IC wafer fabs could also be replaced.
Valkering compared five different OLED lighting technologies to LED and fluorescent lighting and
showed that at the moment, OLED lighting has higher environmental impacts than the other technologies
[39]. This was explained by the dominance of the use phase in the life cycle impacts of all lighting
technologies. In order to compete with current LED and fluorescent lighting, the luminous efficacy of
the OLEDs should be comparable to those of the other lighting technologies. However, it is not straight-
forward to translate Valkering’s results to smartphone application. Anyway, the CO2e emissions for the
manufacturing and end-of-life of OLED foils were estimated to 0.6–1.2 g CO2e/cm2 (0.099–0.2 kg/Mega
Lumen-hour) [39]. However, Valkering’s scope was basically only the light emitting foil itself without
electronics such as ICs with gallium arsenide/Si dies inside. According to OGE ER, mobile phone LCD
manufacturing cradle-to-gate, including these dies, emits around 480 g CO2e/cm2. Seen from a CC
manufacturing point of view, OLED screen technologies will likely be preferable to LCD, should the
OLED screen design require fewer semiconductors than LCD or LED. OGE is currently investigating
the issue of next screen technology eco-environmental impacts.
Distribution of U8350 by ship ought to be more CO2e efficient than air transport. OGE estimate from
EIME that ship transports emit around 100 times less CO2e per kg × km than air transports, opening an
opportunity to reduce the total CC score by 22% (HuW 9%). The difference between OGE and HuW is
due to LCI data used, generating different CO2e for air transports.

Challenges 2014, 5 426
5. Conclusions
In conclusion the LCAs show that the most significant activity for the CC category is the production stage
driven by the area of screen and the amount of Si die area (good Si die area) used by the U8350. As far as
transports are concerned, the CO2e emissions are also significant from a life cycle perspective.
Differences in smartphone LCA results arise mostly due to modeling choices and less to secondary
emission intensity data from upstream processes and LCA tools.
This research shows that the results of two different LCAs of smartphones are comparable if both
LCAs use ETSI LCA and the study objects have comparable technical function and physical
characteristics, such as battery capacity, display screen size and type, memory capacity, and chipset.
6. Looking Ahead
By this research the basic CC footprint of smartphones is meticulously confirmed by two
organizations. HuW fulfill all requirements of ETSI LCA [8] except two, whereas OGE cannot fulfill
the requirements to this degree depending on LCA tool limitations [23].
The subjective choices made by an individual LCA analyst are likely unavoidable, however it will be
challenging to establish calculation rules for all situations.
Nevertheless, this underlines the need for more public data sets for upstream processes such as those
listed in Annex B of ETSI LCA [8].
Acknowledgements
Helpful personnel of Orange, especially Elisabeth Dechenaux and Catherine Garcia, Huawei
Technologies CO., Ltd., and Huawei Device CO., Ltd are acknowledged. Three anonymous peer
reviewers are greatly appraised for their comments, which improved this paper.
Author Contributions
Anders S. G. Andrae wrote the paper and Mikko Samuli Vaija contributed with Orange input data
and wrote Clause 4.2.
Conflicts of Interest
The authors declare no conflict of interest.
References
1. Tucker, R.S.; Hinton, K.; Ayre, R. Energy efficiency in cloud computing and optical networking.
In Proceedings of European Conference and Exhibition on Optical Communication, Amsterdam,
The Netherlands, 16–20 September 2012.
2. Sloma, M. Carbon footprint of electronic devices. In Proc. SPIE 8902. Available online:
http://dx.doi.org/10.1117/12.2030271 (accessed on 29 September 2014).

Challenges 2014, 5 427
3. Corcoran, P.M.; Andrae, A.S.G. Emerging Trends in Electricity Consumption for Consumer ICT.
Available online: http://aran.library.nuigalway.ie/xmlui/handle/10379/3563 (accessed on 29
September 2014).
4. Mills, M.P. The Cloud Begins With Coal. Available online: http://www.tech-pundit.com/wp-content/
uploads/2013/07/Cloud_Begins_With_Coal.pdf (accessed on 29 September 2014).
5. Global Sustainability Initiative. SMARTer 2020 Report: The Role of ICT in Driving a Sustainable Future.
Available online: http://gesi.org/assets/js/lib/tinymce/jscripts/tiny_mce/plugins/ajaxfilemanager/
uploaded/SMARTer%202020%20-%20The%20Role%20of%20ICT%20in%20Driving%20a%20Sust
ainable%20Future%20-%20December%202012._2.pdf (accessed on 29 September 2014).
6. Coroama, V.C.; Hilty, L.M.; Birtel, M. Effects of Internet-based multiple-site conferences on
greenhouse gas emissions. Telemat. Inform. 2012, 29, 362–374.
7. Cisco. Cisco Global Cloud Index: Forecast and Methodology, 2011–2017. Available online:
www.cisco.com/en/US/solutions/collateral/ns341/ns525/ns537/ns705/ns1175/Cloud_Index_White
_Paper.html (accessed on 29 September 2014).
8. European Telecommunications Standards Institute. ETSI TS 103 199 V1.1.1?: Environmental
Engineering (EE); Life Cycle Assessment (LCA) of ICT Equipment, Networks and Services;
General Methodology and Common Requirements. Available online: http://www.etsi.org/deliver/etsi_
ts/103100_103199/103199/01.01.01_60/ts_103199v010101p.pdf (accessed on 29 September 2014).
9. Apple. iPhone 4S Environmental Report. Available online: http://images.apple.com/br/environment/
reports/docs/iPhone4S_Product_Environmental_Report_2011.pdf (accessed on 29 September 2014).
10. Nokia. Nokia Lumia 920 Eco Profile. Available online: http://nds1.nokia.com/eco_declaration/files/
eco_declaration_phones/Lumia_920_Eco_profile.pdf (accessed on 29 September 2014).
11. Huawei. Sustainability Report. Carbon Footprint Analysis of Mobile Phone U8652. Available
online: www.huawei.com/ilink/en/download/HW_263589 (accessed on 29 September 2014).
12. Andrae, A.S.G.; Andersen, O. Life cycle assessments of consumer electronics—Are they consistent?
Int. J. Life Cycle Assess. 2010, 15, 827–836.
13. Hertwich, E.G.; Roux, C. Greenhouse gas emissions from the consumption of electric and electronic
equipment by Norwegian households. Environ. Sci. Technol. 2011, 45, 8190–8196.
14. Teehan, P.; Kandlikar, M. Sources of variation in life cycle assessments of desktop computers. J. Ind.
Ecol.2012, 16, S182–S194.
15. Sangprasert, W.; Pharino, C. Environmental Impact Evaluation of Mobile Phone via Life Cycle
Assessment. Available online: http://psrcentre.org/images/extraimages/113611.pdf (accessed on 29
September 2014).
16. Hoffmann, W. UL 110—Standard for the Sustainability of Mobile Phones. Presented at ITU 3rd
Green Standards Week, Madrid, Spain. Available online: http://www.itu.int/en/ITU-T/Workshops-
and-Seminars/gsw/201309/Documents/Documents-Greening%20Mobile%20Devices-
17%20Sept/S1P3_William_%20Hoffman_New.pptx (accessed on 29 September 2014).
17. Siu, L.S. Life Cycle Assessment of Smart Phones and Cell Phones of Last Generation. Master’s Thesis,
City University of Hong Kong. Available online: http://dspace.cityu.edu.hk/handle/2031/7022
(accessed on 29 September 2014).

Challenges 2014, 5 428
18. Hischier, R.; Achachlouei, M.A.; Hilty, L.M. Evaluating the sustainability of electronic media:
Strategies for life cycle inventory data collection and their implications for LCA results. Environ.
Model. Softw. 2014, 56, 27–36.
19. European Commission. C(2009) 7604 Final. Available online: http://ec.europa.eu/information_society/
activities/sustainable_growth/docs/recommendation_d_vista.pdf (accessed on 29 September 2014).
20. European Commission. A Digital Agenda for Europe /* COM/2010/0245 Final */. Available online:
http://eur-lex.europa.eu/legal-content/EN/ALL/?uri=CELEX:52010DC0245 (accessed on 29
September 2014).
21. European Commission. ICT Footprint—Pilot Testing on Methodologies for Energy Consumption
and Carbon Footprint of the ICT-Sector. FINAL REPORT. A Study Prepared for the European
Commission DG Communications Networks, Content & Technology; European Commission:
Brussels, Belgium, 2012
22. Zhu, Y.; Andrae, A.S.G. System and Method of Life-Cycle Assessment for Equipment of
Information and Communication Technology. WO2014012590 A1, 23 January 2014.
23. Corcoran, P.M.; Andrae, A.S.G.; Vaija, S.M.; Garcia, C.; Elisabeth Dechenaux, E. Effect of
Modeling Approach on climate change focused life cycle assessments for a Contemporary
Smartphone Device. Available online: http://aran.library.nuigalway.ie/xmlui/handle/10379/4522
(accessed on 29 September 2014).
24. Bureau Veritas EIME 5.0. Available online: www.bureauveritas.co.uk/wps/wcm/connect/0f1f588
04bcacbde914a911293bf3cd1/SERVICE+SHEET_EIME_Lifecycle+assessment+software.pdf?M
OD=AJPERES&CACHEID=0f1f58804bcacbde914a911293bf3cd1 (accessed on 29 September 2014).
25. Andrae, A.S.G.; Andersen, O. Life cycle assessment of integrated circuit packaging technologies.
Int. J. Life Cycle Assess. 2011, 16, 258–267.
26. European Parliament. Directive 2012/19/EU of the European Parliament and of the Council of 4
July 2012 on Waste Electrical and Electronic Equipment (WEEE). Off. J. Eur. Union 2012. Available
online: www.ewrn.org/fileadmin/ewrn/content/documents/WEEE-Directive__recast_.pdf (accessed
on 29 September 2014).
27. European Commission. Product Environmental Footprint (PEF) Guide. Deliverable 2 and 4A of
the Administrative Arrangement between DG Environment and the Joint Research Centre No. N
070307/2009/552517, Including Amendment No. 1 from December 2010; European Commission
Joint Research Centre: Ispra, Italy, 2012; p. 43.
28. Andrae, A.S.G.; Itsubo, N.; Yamaguchi, H.; Inaba, A. Life cycle assessment of Japanese high-
temperature conductive adhesives. Environ. Sci. Technol. 2008, 42, 3084–3089.
29. Rice, G.; Taplin, J.; Jamieson, S.; Weissbrod, M.I.; McKerrow, M.H.; Vounaki, M.T. Eco-Rating;
Communicating Sustainability to ICT consumers, and rewarding supplier product-design leadership.
In Design for Innovative Value towards a Sustainable Society; Springer: Dordrecht, The
Netherlands, 2012; pp. 483–488.
30. Orange. Device Life Cycle Environmental Impact Assessment. Available online: www.orange-
ecorating.com/methodology/REF (accessed on 29 September 2014).
31. Teehan, P.; Kandlikar, M. Comparing embodied greenhouse gas emissions of modern computing
and electronics products. Environ. Sci. Technol. 2013, 47, 3997–4003.

Challenges 2014, 5 429
32. Andrae, A.S.G. Comparative micro life cycle assessment of physical and virtual desktops in a cloud
computing network with consequential, efficiency, and rebound considerations. J. Green Eng. 2013,
3, 193–218.
33. Wikipedia. Electricity Generation—List of Countries with Source of Electricity 2008. Available
online: http://en.wikipedia.org/wiki/Electricity_generation#List_of_countries_with_source_of_
electricity_2008 (accessed on 29 September 2014).
34. International Energy Agency. Electricity/Heat in France in 2009. Available online: www.iea.org/
stats/electricitydata.asp?COUNTRY_CODE=FR (accessed on 29 September 2014).
35. Global Energy Network Institute. Is 100% Renewable Energy Possible in France by 2020? Available
online: www.geni.org/globalenergy/research/renewable-energy-potential-of-france/Renewable%20
Energy%20in%20France.%20PBM%20final.pdf (accessed on 29 September 2014).
36. Pedersen, G.F. Mobile Phone Antenna Performance 2013. Available online:
http://erhvervsstyrelsen.dk/file/435579/Mobile_Phone_Antenna_Performance_2013.pdf (accessed
on 29 September 2014).
37. Plevin, R.J.; Delucchi, M.A.; Creutzig, F. Using attributional life cycle assessment to estimate
climate-change mitigation benefits misleads policy makers. J. Ind. Ecol. 2014, 18, 73–83.
38. Thomas, N.J.; Chang, N.B.; Qi, C. Preliminary assessment for global warming potential of leading
contributory gases from a 40-in. LCD flat-screen television. Int. J. Life Cycle Assess. 2012, 17, 96–
104.
39. Valkering, M.S. Environmental Assessment of OLED Lighting Foils. Master’s Thesis, Universiteit
Utrecht, Utrecht, Netherlands, 2012.
© 2014 by the authors; licensee MDPI, Basel, Switzerland. This article is an open access article
distributed under the terms and conditions of the Creative Commons Attribution license
(http://creativecommons.org/licenses/by/4.0/).