Minority Rights, Culture, and Ethiopia's "Third Way" to Governance
Upload
addisababaCategory
view
1download
0
CHALLENGES AND PROSPECTS OF ETHIOPIA'S CEMENT INDUSTRY : CHALLENGES AND PROSPECTS OF ETHIOPIA'S CEMENT INDUSTRY :
STRATEGIC PERSPECTIVE (2015STRATEGIC PERSPECTIVE (2015--2025)2025)
By
Gemechu Waktola, Ph.D.
Assistant Professor, Adama Science & Technology University
Team Leader, Ethiopia’s Cement Industry Development Strategy
(2015-2025)
[email protected] or [email protected] +251911629011
In this presentation …In this presentation …
1.1. Brief Background & Current StatusBrief Background & Current Status
2.2. Critical Challenges & LimitationsCritical Challenges & Limitations
3.3. Opportunities & ProspectsOpportunities & Prospects
4.4. Strategic RecommendationsStrategic Recommendations4.4. Strategic RecommendationsStrategic Recommendations

11
Brief Background Brief Background
& Current Status & Current Status & Current Status & Current Status of Ethiopia’s Cement Industry
Development
4/20/2015 3
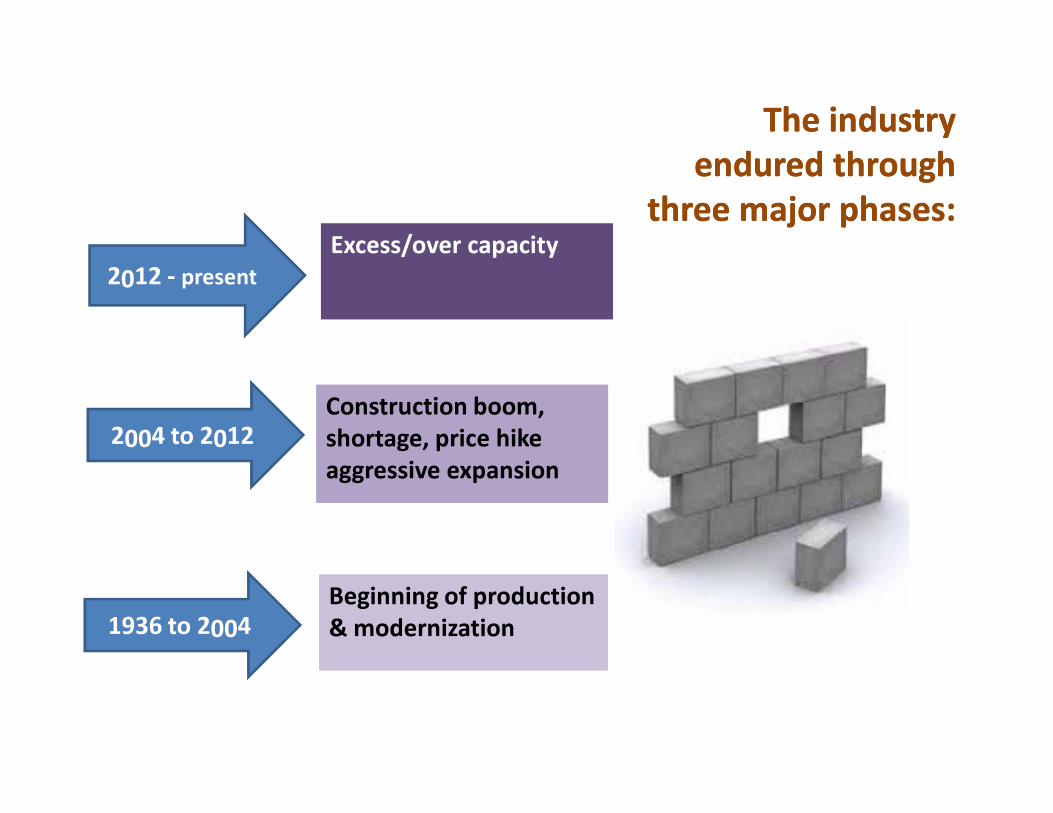
The industry The industry
endured through endured through
three major phases: three major phases:
Construction boom, Construction boom,
Excess/over capacityExcess/over capacity
2012 - present
Beginning of production
& modernization
Beginning of production
& modernization1936 to 2004
Construction boom,
shortage, price hike
aggressive expansion
Construction boom,
shortage, price hike
aggressive expansion
2004 to 2012

GT
P I
, P
roje
cte
d c
ap
aci
ty 2
7M
T, P
er
cap
ita
, 3
00
kg
GT
P I
, P
roje
cte
d c
ap
aci
ty 2
7M
T, P
er
cap
ita
, 3
00
kg
March 2012
Import ban

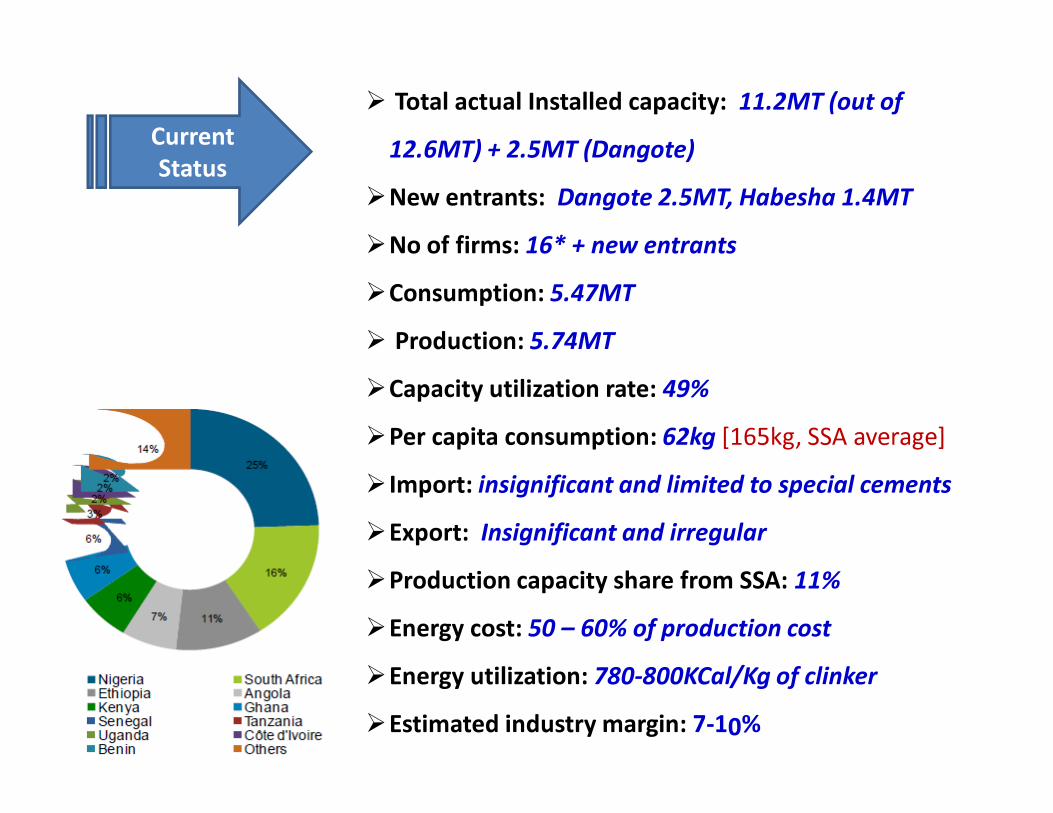
Current
Status
� Total actual Installed capacity: 11.2MT (out of
12.6MT) + 2.5MT (Dangote)
�New entrants: Dangote 2.5MT, Habesha 1.4MT
�No of firms: 16* + new entrants
�Consumption: 5.47MT
� Production: 5.74MT
�Capacity utilization rate: 49%
�Per capita consumption: 62kg [165kg, SSA average]
� Import: insignificant and limited to special cements
�Export: Insignificant and irregular
�Production capacity share from SSA: 11%
�Energy cost: 50 – 60% of production cost
�Energy utilization: 780-800KCal/Kg of clinker
�Estimated industry margin: 7-10%

22
Critical Challenges & Critical Challenges &
LimitationsLimitationsof Ethiopia’s Cement Industry of Ethiopia’s Cement Industry

Critical Challenges & Limitations of the Industry’s Value ChainCritical Challenges & Limitations of the Industry’s Value Chain
Su
pp
ort
Act
ivit
ies
Industry Infrastructure Limited access to finance;
Inadequate product, environment and energy standards and regulatory enforcement capacity;
Insufficient support institutions; existing ones are weak having limited capacity;
Industry Infrastructure Limited access to finance;
Inadequate product, environment and energy standards and regulatory enforcement capacity;
Insufficient support institutions; existing ones are weak having limited capacity;
Limited flexibility to respond to global and regional product, energy, and environmental trends;
Development of Industry Human Resource Shortage of trained HR in cement technology and management
Development of Industry Human Resource Shortage of trained HR in cement technology and management
Lack of strategic HRD
Limited knowledge and technology transfer capacity and system;
Cement Technology Development Limited knowledge and technology transfer capacity and system;
Weak strategic R&D plans; lim
ite
d g
row
th,
sust
ain
ab
ilit
y, a
nd
co
mp
eti
tive
ne
ss o
f
ce
me
nt
Ind
ust
ry
Weak strategic R&D plans;
Supply of Cement Inputs HFO and coal;
Absence or limited use of alternative energy;
Supply of Cement Inputs Heavy dependence on expensive imported energy – HFO and coal;
Absence or limited use of alternative energy;
Frequent electricity interruption;
Inbound
Logistics
• Inefficient,
insufficient and
expensive logistics
and customs
procedures
Cement
Production
• Inefficient
production and
energy
utilization,
mainly by mini-
plants
Outbound Logistics
• Inefficient, insufficient
and expensive logistics
• Lack of strategic focus
on core business
Demand & Marketing
• Inadequate current demand; higher
cement price
• High market concentration at center
• Inadequate product diversification and
value addition; weak Remicon, Remitar,
& other support industries
Sm
all
pro
fit
ma
rgin
s;li
mit
ed
gro
wth
,
sust
ain
ab
ilit
y, a
nd
co
mp
eti
tive
ne
ss o
f
the
ce
me
nt
Ind
ust
ry
Primary Activities

33
Opportunities Opportunities Opportunities Opportunities
& Prospects& Prospects
of Ethiopia’s Cement Industry

Strong Strong
demand demand
drivers drivers
Middle Income Vision
(2025)
Lower Cement Per Capita
(62kg)
Mega projects
Infrastructure
etc
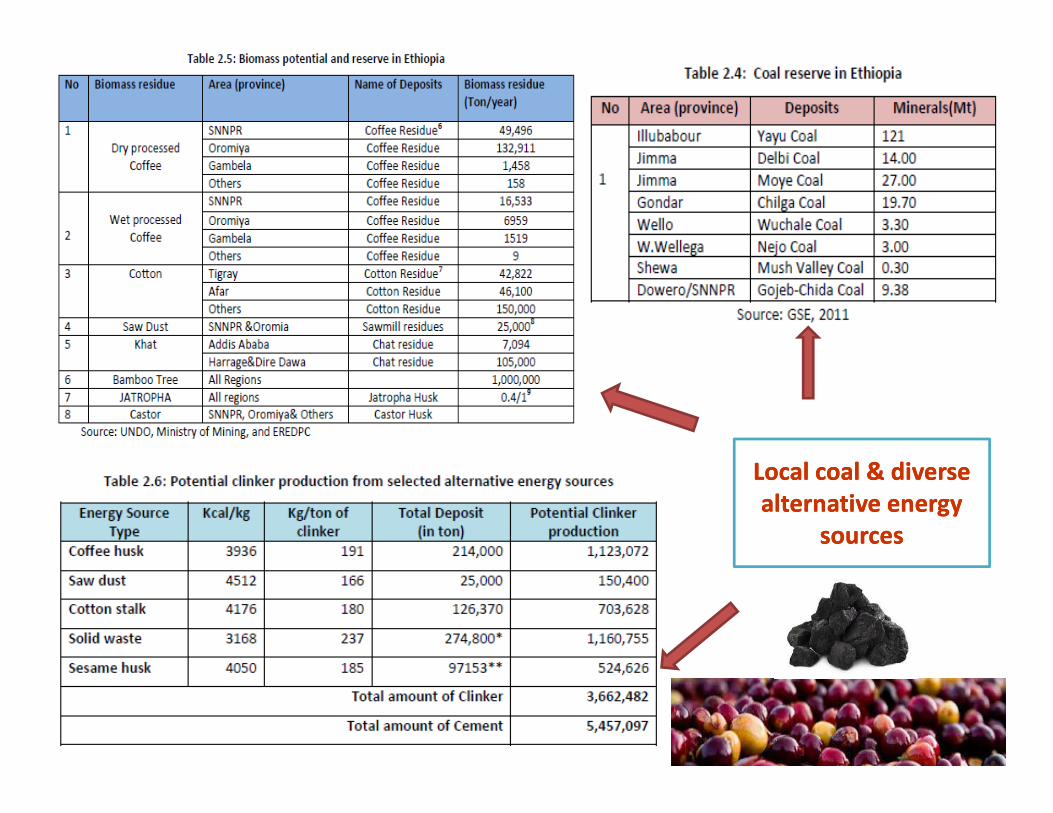
Local coal & diverse Local coal & diverse
alternative energy alternative energy
sources sources

… other critical opportunities… other critical opportunities
• Upcoming railway network
• Potential to diversify cement uses
• Young and trainable labor
• Widespread, accessible raw materials reserve
• Potential for localizing• Potential for localizingsignificant parts of selected cement technologies
• emerging professional associations and universities
• Strategic industry with government will to support
• Availability of environmentally friendly technologies `and carbon trading schemes

44
Strategic Strategic
RecommendationsRecommendationsRecommendationsRecommendations
for development of Ethiopia’s
Cement Industry (2015-2025)

1. Short1. Short--term term
demand demand
stimulation stimulation
measures measures
• Induce demand for additional consumption of 12.22 MT until
2020 mainly from replacing asphalt roads with cement concrete
• Increase capacity utilization rate to 75% during the first three
years of the strategy period [2015-17] and sustainably maintain
the rate at 80% for the rest of the strategy period.
Ke
y T
arg
ets

• By end of 2015 with fully defined structure, roles,
responsibilities, and accountabilities to members
and the government
• At least ten joint projects annually on HRD, R&D
and K&T transfer, energy improvement, and
environmental protection.
2. Strong cement 2. Strong cement
associationassociation
Ke
y T
arg
ets
• Meet over all energy [local coal, biomass,
33. Replacement of . Replacement of
Imported Energy Imported Energy
• Meet over all energy [local coal, biomass,
municipal waste] replacement of at least 60% for
the industry by 2025.
• Fulfill 10% thermal energy requirement from
locally developed coal supply by 2020 and reach
30% by 2025.
• Reach share of energy substituted to at least 20%
of thermal energy requirement with alternative
energy by 2020 and at least 30% at the end of
2025.
Ke
y T
arg
ets
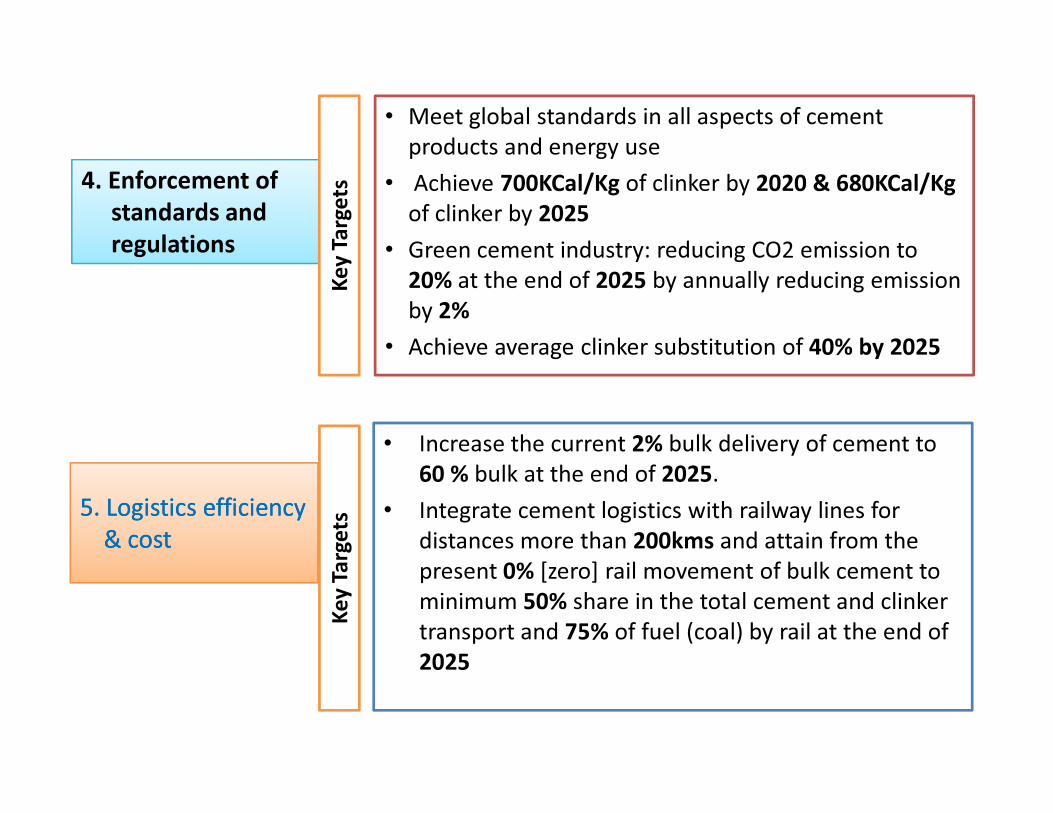
• Meet global standards in all aspects of cement
products and energy use
• Achieve 700KCal/Kg of clinker by 2020 & 680KCal/Kg
of clinker by 2025
• Green cement industry: reducing CO2 emission to
20% at the end of 2025 by annually reducing emission
by 2%
• Achieve average clinker substitution of 40% by 2025
4. Enforcement of
standards and
regulations
Ke
y T
arg
ets
55. Logistics efficiency . Logistics efficiency
& cost& cost
• Increase the current 2% bulk delivery of cement to
60 % bulk at the end of 2025.
• Integrate cement logistics with railway lines for
distances more than 200kms and attain from the
present 0% [zero] rail movement of bulk cement to
minimum 50% share in the total cement and clinker
transport and 75% of fuel (coal) by rail at the end of
2025
Ke
y T
arg
ets

77. . R&D, knowledge and technology transfer• 100 R&D and 50 K&T projects
• Localize 60% of cement technologies by 2025
Other
Strategic
Issues
66. . HRD system and programs• Produce operators; cement engineers &
technology managers
• 95% of OJT using S-OJT
• Operate and manage the cement industry with
98% local experts at the end of the strategy period.
• Localize 60% of cement technologies by 2025
8. Product diversification and value addition• Promote industries such as Remicon and prefabs as
major consumers for at least 50% of cement supply
by 2020
99. . Access to finance for cement and support
industries • financial access and loan guarantees for investments on
strategic priority areas
Issues

Projections
Projection
Components
In million tons/%/Kg
2014 2015 2016 2017 2018 2019 2020 2021 2022 2023 2024 2025
A Baseline Installed
Capacity11.2 15.6 17.15 17.15 17.15 17.15 17.15 17.15 17.15 17.15 17.15 17.15
BProjected Consumption 5.47 6.34 7.25 8.30 9.47 10.82 12.02 13.35 14.80 16.40 18.11 19.97
C Stimulation Adjusted
Consumption
Projection*
5.47 8.11 10.29 11.15 11.83 12.18 12.86 13.72 14.80 16.40 18.11 19.97
D Production Projection 5.74 8.52 10.80 11.70 12.43 12.79 13.51 14.41 15.54 17.22 19.01 20.97
D Production Projection
[=C*1.05]5.74 8.52 10.80 11.70 12.43 12.79 13.51 14.41 15.54 17.22 19.01 20.97
E Required Installed
Capacity [=D*1.20]6.89 10.22 12.97 14.05 14.91 15.35 16.21 17.29 18.65 20.66 22.82 25.16
F Required Additional
Capacity [=E-A]0.00 0.00 0.00 0.00 0.00 0.00 0.00 0.14 1.50 3.51 5.67 8.01
G Forecasted Capacity
Utilization (%)[=D/A]49 55 63 68 72 75 79 84 91 100 111 122
H Required Stimulation
[=C-B]1.77 3.04 2.85 2.36 1.36 0.84 0.37 0.00 0.00 0.00 0.00
I Projected Population
(Mil.)87.90 90.10 92.20 94.30 96.50 98.70 100.80 102.90 105.20 107.30 109.50 111.6
J Per capita consumption
(in kg) [=C/I]62 90 112 118 123 123 128 133 141 153 165 179

� Policies, Regulations and Directives
� Strategic Projects
� Organizational Setups
Recommendations Recommendations
For For
Implementation Implementation
4/20/2015 20
� Organizational Setups
� Support Institutions
� Support Industries
� Key partners

Credits: Credits:
Strategy Team membersStrategy Team members
MoIMoI, ASTU, , ASTU,
Steering committee Steering committee
EKI, Korea EKI, Korea
Thank you for your attention! Thank you for your attention!
4/20/2015 21
Copyright © 2022 FDOKUMEN