Cervical cord area measurement using volumetric brain magnetic resonance imaging in multiple...
6
journal homepage: www.elsevier.com/locate/msard Available online at www.sciencedirect.com Cervical cord area measurement using volumetric brain magnetic resonance imaging in multiple sclerosis Zheng Liu a,c , Özgür Yaldizli a , Matteo Pardini a,d , Varun Sethi a , Hugh Kearney a , Nils Muhlert a , Claudia Wheeler-Kingshott a , David H. Miller a , Declan T. Chard a,b,n a Queen Square Multiple Sclerosis Centre, Department of Neuroinflammation, UCL Institute of Neurology, UK b National Institute for Health Research (NIHR), University College London Hospitals (UCLH), Biomedical Research Centre, UK c Department of Neurology, Xuanwu Hospital of Capital Medical University, Beijing 100053, China d Department of Neuroscience, Rehabilitation, Ophthalmology, Genetics, Maternal and Child Health, University of Genoa, Genoa, Italy Received 25 July 2014; received in revised form 5 November 2014; accepted 10 November 2014 KEYWORDS Multiple sclerosis; MRI; Spinal cord; Atrophy Abstract Background: In multiple sclerosis (MS), recent work suggests that cervical cord atrophy is more consistently correlated with physical disability than brain white matter lesion load and atrophy. Although spinal cord imaging has not been routinely obtained in many clinical trial and research studies, brain volumetric imaging usually has and includes the upper cervical cord. Objectives: Using volumetric T1-weighted brain images, we investigated cross-sectional area measures in the uppermost cervical cord and compared them with areas at the standard C2/ 3 level. Methods: Using T1-weighted brain scans from 13 controls and 37 people with MS, and an active surface technique, cross-sectional area was measured over 5 mm and 1 mm cord segments at C2/3, below the level of odontoid peg, and 2 cm and 2.5 cm below the pons. Brain volume was also measured. Results: Cord area measurements were most reliable in a 5 mm segment 2.5 cm below the pons (inter-rater coefficient of variation 1.5%, intraclass correlation coefficient 0.99). Cord area at this level correlated more with that at C2/3 area than with brain volume (r = 0.811 with C2/3, r = 0.502 with brain volume). http://dx.doi.org/10.1016/j.msard.2014.11.004 2211-0348/& 2014 Elsevier B.V. All rights reserved. n Corresponding author at: Queen Square Multiple Sclerosis Centre, Department of Neuroinflammation, UCL Institute of Neurology, University College London, Queen Square, London WC1N 3BG, UK. Tel.: + 44 20 7829 8771; fax: + 44 20 7278 5616. E-mail address: [email protected] (D.T. Chard). Multiple Sclerosis and Related Disorders (2015) 4, 52–57
Transcript of Cervical cord area measurement using volumetric brain magnetic resonance imaging in multiple...

Multiple Sclerosis and Related Disorders (2015) 4, 52–57
Available online at www.sciencedirect.com
http://dx.doi.org/12211-0348/& 2014 E
nCorresponding aUniversity College L
E-mail address: d
journal homepage: www.elsevier.com/locate/msard
Cervical cord area measurement usingvolumetric brain magnetic resonanceimaging in multiple sclerosis
Zheng Liua,c, Özgür Yaldizlia, Matteo Pardinia,d, Varun Sethia,Hugh Kearneya, Nils Muhlerta, Claudia Wheeler-Kingshotta,David H. Millera, Declan T. Charda,b,n
aQueen Square Multiple Sclerosis Centre, Department of Neuroinflammation, UCL Institute of Neurology,UKbNational Institute for Health Research (NIHR), University College London Hospitals (UCLH), BiomedicalResearch Centre, UKcDepartment of Neurology, Xuanwu Hospital of Capital Medical University, Beijing 100053, ChinadDepartment of Neuroscience, Rehabilitation, Ophthalmology, Genetics, Maternal and Child Health,University of Genoa, Genoa, Italy
Received 25 July 2014; received in revised form 5 November 2014; accepted 10 November 2014
KEYWORDSMultiple sclerosis;MRI;Spinal cord;Atrophy
0.1016/j.msard.20lsevier B.V. All rig
uthor at: Queenondon, Queen [email protected]
AbstractBackground: In multiple sclerosis (MS), recent work suggests that cervical cord atrophy ismore consistently correlated with physical disability than brain white matter lesion load andatrophy. Although spinal cord imaging has not been routinely obtained in many clinical trial andresearch studies, brain volumetric imaging usually has and includes the upper cervical cord.Objectives: Using volumetric T1-weighted brain images, we investigated cross-sectional areameasures in the uppermost cervical cord and compared them with areas at the standard C2/3 level.Methods: Using T1-weighted brain scans from 13 controls and 37 people with MS, and anactive surface technique, cross-sectional area was measured over 5 mm and 1 mm cordsegments at C2/3, below the level of odontoid peg, and 2 cm and 2.5 cm below the pons.Brain volume was also measured.Results: Cord area measurements were most reliable in a 5 mm segment 2.5 cm below thepons (inter-rater coefficient of variation 1.5%, intraclass correlation coefficient 0.99). Cordarea at this level correlated more with that at C2/3 area than with brain volume (r=0.811 withC2/3, r=0.502 with brain volume).
14.11.004hts reserved.
Square Multiple Sclerosis Centre, Department of Neuroinflammation, UCL Institute of Neurology,are, London WC1N 3BG, UK. Tel.: +44 20 7829 8771; fax: +44 20 7278 5616.(D.T. Chard).
53Cervical cord area measurement using volumetric brain magnetic resonance imaging in multiple sclerosis
Conclusion: Whereas the standard C2/3 level is often not within the field of view on brainimages, the level 2.5 cm below the pons usually is, and measurement at this level may be agood way to investigate upper cervical cord atrophy when only brain images are available.& 2014 Elsevier B.V. All rights reserved.
1. Introduction
In people with multiple sclerosis (MS), combined clinical andMRI studies have shown that neurological disability cannot beexplained by brain white matter (WM) lesions alone, and thatbrain and cervical cord atrophy both independently correlatewith clinical impairments (Bonati et al., 2011; Cohen et al.,2012; Kearney et al., 2014a; Lukas et al., 2013). Further,throughout the clinical course of relapsing remitting (RR) andsecondary progressive (SP) MS, cervical cord cross-sectionalarea at the C2/3 level appears to be more consistently andstrongly associated with disability than either brain WM lesionload or brain atrophy (Bonati et al., 2011; Cohen et al., 2012;Kearney et al., 2014a; Lukas et al., 2013). Measurement ofspinal cord cross-sectional area has developed using dedicatedvolumetric spinal cord MRI. Due to time and cost constraints,and in the absence of a compelling reason to measure cervicalcord area, such scans have not been routinely collected inmany research studies or therapeutic trials. However, cordatrophy remains an outcome measure of interest if monitoringpathological changes that contribute to irreversible motordisability or testing treatments that aim to prevent this.
Volumetric brain MRI scans are often obtained as part ofresearch studies in MS, and these scans usually include thebrainstem and the upper cervical cord. Recent work in peoplewith traumatic cord injuries has shown that it is possible, usingthe method developed by Losseff et al. (1996), to obtaincomparable C2/3 cord cross-sectional area measures fromvolumetric cord and brain imaging (Freund et al., 2010).However, while C2/3 is the usual landmark for cord areameasures, less than half of routinely acquired brain images, inour experience, will include this level in the field of view. Ifmeasures representative of the cord could be robustlyobtained at higher (rostral) levels, then this would increasethe chances that brain volumetric imaging could be used forthis purpose. Previous work employing a manual segmentationmethod has found that medulla oblongata volume is correlatedwith upper cervical cord volume (Pearson r=0.67) and brainparenchymal fractional volume (r=0.45); however thesecorrelations did not significantly differ i.e. medulla oblongatavolume was not significantly more representative of thecervical cord than the brain (Liptak et al., 2008). Cord areameasures are also usually assessed over a 1.5 cm segment(Losseff et al., 1996; Kearney et al., 2014b), but the longerthe segment used the smaller the chance it will have beenincluded in brain imaging. Therefore, it would be of interest toknow if shorter segments could be used.
The aims of this study were (1) to determine if a recentlyimplemented active surface model (Horsfield et al., 2010) usedto measure cord cross-sectional area at C2/3 could be reliablyused at higher levels in short (0.5 cm and 0.1 cm) segments;and (2), if these measures were more representative of the
spinal cord area obtained at the standard C2/3 level ratherthan the brain volume.
2. Materials and methods
2.1. Subjects
From a previously recruited cohort of 32 healthy controls and89 people with MS (RRMS 45, SPMS 29, PPMS 15), 50 volumetricbrain scans included the C2/3 level. These data, from 13healthy controls (mean age 40.5 (standard deviation (SD) 14.1)years, and 9 females) and 37 people with MS (mean age 48.8(10.1) years, 26 females, 17 RRMS, 15 SPMS and 5 PPMS), wereused in this study. In the MS cohort the median expandeddisability status scale (EDSS (Kurtzke, 1983)) was 6.0, range1.0–8.5. As part of MS functional composite score assessments(Cutter et al., 1999), Timed Walk Test (TWT) and 9 Hole PegTest (HPT) scores were obtained, and z-scores calculated asper Fischer et al. (2001). This study was approved by our localethics committee. Written informed consent was obtainedfrom participants.
2.2. MRI protocol
A T1-weighted (T1w) brain volume scan was acquired with a3 T Philips Achieva system (Philips Healthcare, Best, TheNetherlands) using a 32-channel head coil and multi-transmit technology. The sequence used was a 3Dinversion-prepared (TI=824 ms) fast field echo (FFE)sequence (TR/TE=6.9/3.1 ms), flip angle (α)=81, 1� 1� 1mm3. This was acquired per our routine for brain imaging,and not specifically modified to include the spinal cord.
2.3. Selection of cord levels for areameasurement
We measured cord area at four levels. Landmarks wereidentified on sagittal reconstructions of the T1w brain scan.The first was centred on the conventional C2/3 disc landmark,the middle of the anterior border of the disc. The secondstarted at the top of odontoid peg (OP), the highest cervicalbony landmark that we could identify, and extended caudally.As the spinal cord can move significantly relative to surround-ing bony structures with head flexion or extension (Reid,1996), we also used the inferior margin of pons as a rostralmarker. The average length of medulla oblongata is about2.5 cm (Gilman and Newman, 1996), but the boundarybetween it and the spinal cord is indistinct, so we measuredcord cross sectional area caudally from 2 cm to 2.5 cm belowthe inferior margin of pons (labeled P2 and P2.5).

Z. Liu et al.54
2.4. Image analysis
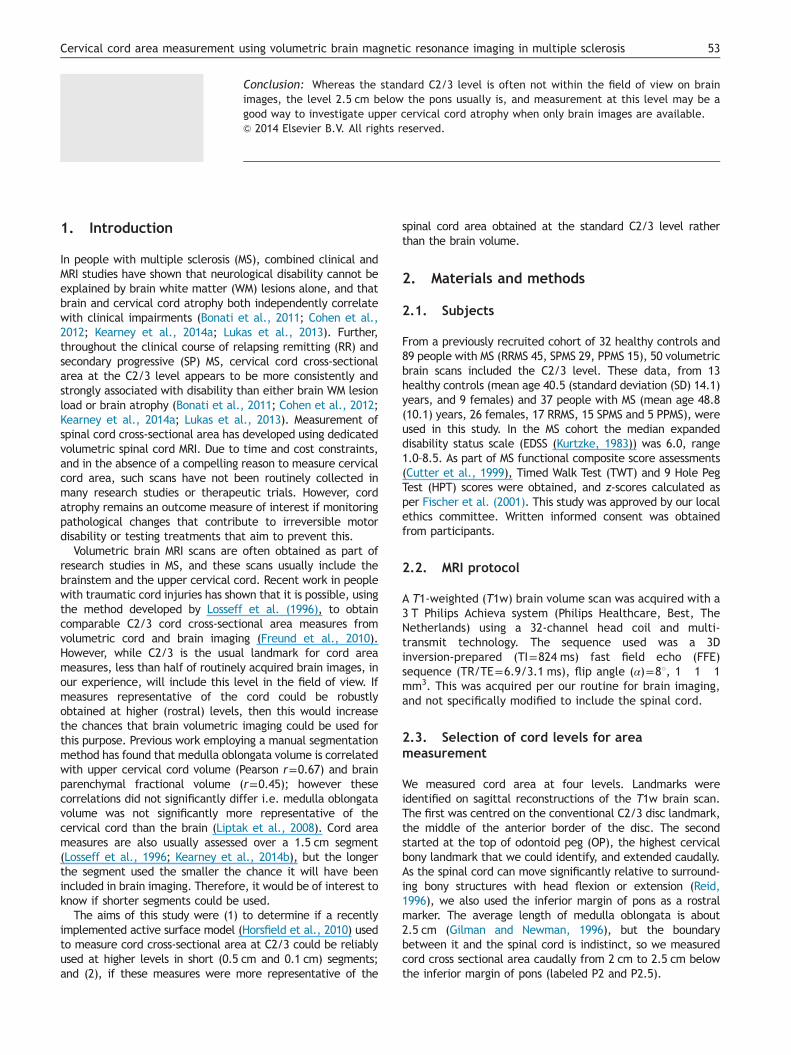
Mean cervical cord cross-sectional area was measured on5 contiguous 1 mm thick slices and in the single slice nearestto the reference landmark (for C2/3 it was the middle slice,and for all other measures, the most rostral one). Thevolumetric T1w brain images were reorientated so that axialslices orthogonal to the cord could be extracted. For theC2/3 cord area measures, the T1w brain images werereoriented at the middle level of C2/3 intervertebral disc.For the cord area measures of the OP, P2 and P2.5 levels,the T1w brain images were reoriented at the level of theinferior margin of pons. Five 1� 1� 1 mm3 axial slicesperpendicular to the long axis of the cord were extractedusing the multi-planar reconstruction tool in JIM (version 6,Xinapse Systems) at the OP, P2 and P2.5 levels separately.Using the cord finder tool in JIM, which implements anactive surface model (Horsfield et al., 2010), seed pointswere manually placed in the centre of the cord, and thecord was then automatically contoured. These contourswere reviewed for accuracy, and when necessary manuallyedited. Fig. 1 shows examples of P2.5 and C2/3 sagittal andcoronal cord images after reorientation, and the first axialcord section.
2.5. Reproducibility
Intra- and inter-rater reproducibilities were assessed using MRIdata from 5 healthy controls and 5 MS patients who wereselected randomly from the study population. To evaluate the
Fig. 1 Example of reconstructed cord images in a person with MS.landmarks, with the cord outlined. B and C show reconstructed sagifor the C2/3 landmark in a same person.
intra-rater reproducibility, one investigator (ZL) performedthe measurement three times in each subject. Inter-raterreproducibility was assessed between three investigators (ZL,OY and MP), who independently measured cord area once ateach level in each of the 10 subjects.
2.6. Associations between cord area measures atdifferent levels and brain volumes
To determine if OP, P2, P2.5 cord area measures were moreclosely linked with cord area measure at the conventionalC2/3 level than brain tissue volumes, brain tissue volumeswere obtained using the new segment tool in SPM8 afterwhite matter lesion filling (Chard et al., 2010). Brainparenchymal (the sum of white and grey matter; BPV) andintracranial (the sum of white matter, grey matter andcerebrospinal fluid; ICV) volumes were estimated.
2.7. Statistics
Statistics were undertaken using SPSS (version 21, IBM).With the reliability data, coefficients of variation (CV;calculated as the square root of the mean intra-subjectmeasurement variation divided by the mean cross-sectionalarea in all subjects) and intraclass correlation coefficients(ICC; calculated using restricted estimate of maximumlikelihood variance components) were computed. To deter-mine if the area measurements at the level of the OP, P2and P2.5 were more closely related to those at C2/3 or
A and D show an axial slice extracted using the P2.5 and C2/3ttal and coronal views using P2.5 landmark; E and F show these

Table 1 Reproducibility figures for each of the 4 cord levels measured in five slices (1a) and one slice (1b) by oneinvestigator on three occasions (intra-rater reproducibility), and in five slices by three investigators (inter-raterreproducibility).
1a
Cord level Coefficient of variation Intraclass correlation coefficient
5 slices, 1 rater 5 slices, 3 raters 5 slices, 1 rater 5 slices, 3 raters
C2/3 1.3% 2.3% 0.99 0.97OP 8.8% 14.6% 0.65 0.24P2 4.2% 3.7% 0.93 0.95P2.5 2.3% 1.5% 0.95 0.99
1b
Cord level Coefficient of variation Intraclass correlation coefficient
1 slice, 1 rater 1 slice, 3 raters 1 slice, 1 rater 1 slice, 3 rater
C2/3 3.2% 4.0% 0.94 0.89OP 8.1% 19.7% 0.59 0.07P2 3.9% 11.4% 0.94 0.64P2.5 1.9% 6.0% 0.97 0.79
OP=odontoid peg; P2 and P2.5=caudally 2 cm and 2.5 cm below the inferior margin of pons.
Table 2 Brain and spinal cord MRI measures (mean7standard deviation).
Group Cord cross sectional area (mm2) Tissue volume (ml)
C2/3 OP P2 P2.5 ICV BPV
Control 74.878.9 96.6712.3 95.6715.8 83.7710.9 14307139 11887101RRMS 67.1710.8 83.2723.1 90.3715.2 79.3713.1 13997137 11447117SPMS 59.5713.3 76.2714.0 74.2718.9 70.4710.4 13867136 10747104PPMS 63.775.9 79.2712.1 90.2719.4 76.3712.1 14117139 11417111
OP=odontoid peg; P2 and P2.5=caudally 2 cm and 2.5 cm below the inferior margin of pons; BPV=brain parenchymal volume;ICV= intracranial volume; RRMS=relapsing remitting multiple sclerosis; SPMS=secondary progressive MS; PPMS=primaryprogressive MS.
Table 3 Pearson correlations and associated P-values between cord area (based on five slices in 3a and one slice in 3b) andcranial volume measures in 37 people with multiple sclerosis and 13 healthy controls.
Measure C2/3 OP P2 P2.5 BPV
3aOP 0.741, o0.001P2 0.731, o0.001 0.737, o0.001P2.5 0.811, o0.001 0.801, o0.001 0.939, o0.001BPV 0.408, 0.003 0.427, 0.002 0.431, 0.002 0.502, o0.001ICV 0.318, 0.024 0.286, 0.044 0.366, 0.009 0.408, 0.003 0.951, o0.001
3bOP 0.775, o0.001P2 0.741, o0.001 0.793, o0.001P2.5 0.840, o0.001 0.846, o0.001 0.921, o0.001BPV 0.415, 0.003 0.457, 0.002 0.434, 0.002 0.474, o0.001ICV 0.326, 0.024 0.321, 0.044 0.362, 0.009 0.378, 0.003 0.951, o0.001
Note: OP=odontoid peg; P2 and P2.5=cross-sectional cord area caudally from 2 cm and 2.5 cm below the inferior margin of pons;BPV=Brain parenchymal volume; ICV= Intracranial volume.
55Cervical cord area measurement using volumetric brain magnetic resonance imaging in multiple sclerosis

Z. Liu et al.56
brain tissue volumes, Pearson correlations were calculated,and linear regression modeling with the area measure ofinterest as the dependent variable, and BPV and C2/3 meanarea as predictor variables. Associations between EDSS,TWT and HPT z-scores, and spinal cord areas were assessedusing Spearman correlations.
3. Results
Of the 10 subjects included in the reliability study, at C2/3 20of the 150 cord contours were manually edited (14 of these ina single subject with marked kyphosis), for OP, P2 and P2.5none required editing. The measure at P2.5 and C2/3 wasmore reproducible than that at other levels, in terms of higherICC and lower CV (Table 1). Table 2 shows the measurementresults of the interest levels of spinal cord and brain of allsubjects. Table 3 shows the Pearson correlations between thecord area and brain volume measures.
In the regression models using the five slice cord areadata, only C2/3 reached significance predicting OP area(partial Eta=0.47, Po0.001, model R2=0.57) and P2 area(partial Eta=0.45, Po0.001, R2=0.56). For P2.5 area bothC2/3 (partial Eta=0.59, Po0.001) and BPV (partialEta=0.10, P=0.024)) were significant (total modelR2=0.69). Repeating these analyses using cord area deter-mined with a single slice did not materially differ, exceptfor P2.5 where BPV was no longer a significant factor.
Table 4 shows the Spearman correlations between cordarea measures, HPT and TWT z-scores. In the combinedcontrol and MS groups, and MS group alone, significantcorrelations of spinal cord measures with 9HPT and TWT z-scores were observed, except for 9HPT z-scores with cordarea at P2 in the MS group, where it was of borderlinesignificance. Correlations with EDSS were only significant inthe combined control and MS group (C2/3 rs=�0.30,P=0.032; OP rs=�0.40, P=0.004; P2 rs=�0.29,P=0.043, and P2.5 rs=�0.34, P=0.015).
Table 4 Correlation between MSFC and MRI parametersfrom five cord slices (4a) and one cord slice (4b).
MS and control group MS group
TWT 9HPT TWT 9HPT
r p r p r p r p
4aP2 0.46 0.001 0.31 0.029 0.46 0.004 0.34 0.041P2.5 0.44 0.002 0.30 0.037 0.47 0.004 0.33 0.049OP 0.51 o0.001 0.41 0.003 0.51 0.001 0.38 0.020C2/3 0.46 0.001 0.40 0.004 0.44 0.006 0.38 0.021
4bP2 0.44 0.001 0.28 0.045 0.46 0.004 0.32 0.053P2.5 0.44 0.001 0.33 0.018 0.48 0.003 0.39 0.018OP 0.50 o0.001 0.38 0.006 0.52 0.001 0.39 0.018C2/3 0.44 0.001 0.38 0.006 0.42 0.010 0.36 0.029
4. Discussion
In people with MS, cervical cord area is usually measured usingdedicated spinal cord volumetric imaging at the C2/3 level. Inthis study we investigated the possibility of using volumetricbrain MRI scans for cervical cord area measurements, andwhether or not measures from short segments at levels higherthan C2/3 were reliable and still representative of cord area atC2/3. We found that reliability measures at P2.5 and C2/3 werecomparable with a previous study using volumetric brain imagesto measure cord area over a 1.5 cm cord segment (Freundet al., 2010) (in which CVs of 1.6–1.7% were found, comparedwith 1.5–2.3% for P2.5 over a 0.5 cm segment and 1.9–5.2% or asingle 1 mm slice, and 1.3–3.2% and 3.2–6.0% respectively forC2/3 in the present work). ICC at these levels were also high,ranging between 0.94 and 0.99), indicating that nearly allmeasurement variabilities were due to inter-subject differencesrather than measurement errors. These figures are similar tothose previously obtained in the medulla oblongata by Liptaket al. (intra-rater ICC 0.97) (Liptak et al., 2008). Compared withcord area measures over 0.5 cm segments, measurementreproducibility in 1 mm segments was similar when a singlerater undertook the analysis, but noticeably lowers when threeraters analyzed the MRI data.
Comparing the average cord area measure at C2/3 obtainedwith the method used in this study with the literature values,they were similar (for example, 68.6712.3 mm2 for RRMSpatients in a study by Kearney et al. and 67.1710.8 in thepresent work) (Kearney et al., 2014a). Also consistent with theprevious literature, cord area measures at C2/3 correlated withmeasures of limb function impairment (TWT, HPT and, to alesser degree, EDSS) (for example Horsfield et al. 2010), andsimilar correlation were seen at all the cord levels assessed andwith area measures over 5 mm or 1 mm of the cord.
For cord areas measures using the OP landmark, both inter-rater and intra-rater reproducibilities were substantially worsethan those at other levels. There are two likely explanations forthis. First, it is difficult to precisely locate the top of the OP onT1-weighted volumetric scans, and this will limit reliability.Second, the cord can move substantially relative to this bonylandmark, with head flexion or extension (Reid 1996), and wefound that OP level could be higher than P2 or lower than P2.5,or somewhere between them.
Correlation analyses showed that for all the area measuresabove C2/3 there was a strong association with cord area at C2/3 and a much more modest one with brain parenchymal volume.Regression analyses confirmed this, demonstrating that for P2and OP measures, only C2/3 area was a significant predictor,and for P2.5 C2/3 predicted much more variation than BPV(partial Eta for C2/3 0.59 and BPV 0.10). Together this suggeststhat short-segment high cervical cord measures are much morerepresentative of cord area at C2/3 than brain volume.
The method proposed in this work was not designed as areplacement for volumetric analysis of dedicated cord imaging,with measures based on high-resolution cervical images achiev-ing intra-rater CVs of 0.002% over a 1.5 cm cord sample(Kearney et al., 2014b). Instead, it was developed with theapplication to previously collected MRI data in mind, or incircumstance where it may not be possible to obtain separatecervical cord scans due to time and cost constraints. Futurework could look at optimising brain imaging to improve cervicalcord coverage without compromising brain atrophy measures.

57Cervical cord area measurement using volumetric brain magnetic resonance imaging in multiple sclerosis
For example, while we did not see reduced cord signal intensitytowards the edge of the imaging field of view on the scans usedin this study, this may be more noticeable on brain scansacquired using different machines or with different techniques.Similarly, in this study subject positioning did not take accountof the cord, and we found that we had to edit cord contoursmost in a person with a marked kyphosis. As such, whenacquiring brain scans with the possibility of undertaking cordarea measures in mind, it may be worthwhile trying to ensurethat neck flexion is minimised as far as possible, and the neckimmobilised (Kearney et al., 2013). There may also be furtherscope to improve the cord area measurement technique for usein high cervical spine and medulla oblongata.
In conclusion, we have shown that it is possible to extractfrom brain images short segment (5 mm or 1 mm) cross-sectional cord area measurements above the conventionalC2/3 level that are comparable, in terms of both reprodu-cibility and correlations with disability, with establishedtechniques for measuring cord cross-sectional area in clin-ical studies. This may be of particular interest in long-itudinal studies or treatment trials where cord area may nothave been included as an original outcome measure butwould be of interest now.
Conflicts of interest
Professor Miller has received honoraria through payments to hisemployer, UCL Institute of Neurology, for Advisory Committeeand/or Consultancy advice in multiple sclerosis studies fromBiogen Idec, GlaxoSmithKline, Novartis, Merck, Chugai, Mitsu-bishi Pharma Europe and Bayer Schering Pharma. He alsoreceived compensation through payments to his employer forperforming central MRI analysis of multiple sclerosis trials fromGlaxoSmithKline, Biogen Idec, Novartis and Merck. The NMRResearch Unit at UCL Institute of Neurology is supported by theUK MS Society and UCL-UCLH Biomedical Research Centre. DrChard has received honoraria through his employer from Bayer,Teva and the Serono Symposia International Foundation forfaculty-led education work, Teva for advisory board work, andholds stock in GlaxoSmithKline. Dr Yaldizli received honorariafor lectures from Teva and Bayer Schering exclusively used forfunding of research or educational courses at UniversityHospital Basel. The other authors report no conflicts of interest.
Acknowledgements
Dr. Chard has received research support from the MultipleSclerosis Society of Great Britain and Northern Ireland, andthe UCLH/UCL NIHR Biomedical Research Center. Zheng Liu isan ECTRIMS (European Committee for Treatment and Researchin Multiple Sclerosis) clinical training fellow sponsored byECTRIMS. Dr. Pardini is supported by the Non-profit KarolWojtila Association (Lavagna, Italy).
References
Bonati U, Fisniku LK, Altmann DR, Yiannakas MC, Furby J, ThompsonAJ, et al. Cervical cord and brain grey matter atrophy indepen-dently associate with long-term MS disability. J Neurol Neuro-surg Psychiatry 2011;82:471–2.
Chard DT, Jackson JS, Miller DH, Wheeler-Kingshott CAM. Reducingthe impact of white matter lesions on automated measures ofbrain gray and white matter volumes. J Magn Reson Imaging2010;32:223–8.
Cohen AB, Neema M, Arora A, Dell’Oglio E, Benedict RHB, Tauhid S,et al. The relationships among MRI-defined spinal cord involve-ment, brain involvement, and disability in multiple sclerosis. JNeuroimaging 2012;22:122–8.
Cutter GR, Baier ML, Rudick RA, Cookfair DL, Fischer JS, Petkau J,et al. Development of a multiple sclerosis functional compositeas a clinical trial outcome measure. Brain 1999;122(5):871–82.
Fischer JS, Jak A, Knicker J, Rudick RA. MSFC Manual and Forms:Guidebook.National Multiple Sclerosis Society; 1–44. (pdf).
Freund PA, Dalton C, Wheeler-Kingshott CA, Glensman J, BradburyD, Thompson AJ, et al. Method for simultaneous voxel-basedmorphometry of the brain and cervical spinal cord area mea-surements using 3D-MDEFT. J Magn Reson Imaging 2010;32:1242–7.
Gilman S, Newman SW. Anatomy of the brain stem: medulla, pons,and midbrain. In: Manter and Gatz's Essentials of ClinicalNeuroanatomy and Neurophysiology, 9th edition. Philadelphia,Davis, 1996, p. 91.
Horsfield MA, Sala S, Neema M, Absinta M, Bakshi A, Sormani MP,et al. Rapid semi-automatic segmentation of the spinal cordfrom magnetic resonance images: application in multiple sclero-sis. NeuroImage 2010;50:446–55.
Kearney H, Miszkiel KA, Yiannakas MC, Ciccarelli O, Miller DH. Apilot MRI study of white and grey matter involvement bymultiple sclerosis spinal cord lesions. Mult Scler Relat Disord2013;2:103–8.
Kearney H, Rocca M, Valsasina P, Balk L, Sastre-Garriga J, ReinhardtJ, et al. Magnetic resonance imaging correlates of physicaldisability in relapse onset multiple sclerosis of long diseaseduration. Mult Scler 2014a;20:72–80.
Kearney H, Yiannakas MC, Abdel-Aziz K, Wheeler-Kingshott CAM,Altmann DR, Ciccarelli O, et al. Improved MRI quantification ofspinal cord atrophy in multiple sclerosis. J Magn Reson Imaging2014;39:617–23.
Kurtzke JF. Rating neurologic impairment in multiple sclerosis: anexpanded disability status scale (EDSS). Neurology 1983;33:1444–52.
Liptak Z, Berger AM, Sampat MP, Charil A, Felsovalyi O, Healy BC,et al. Medulla oblongata volume: a biomarker of spinal corddamage and disability in multiple sclerosis. AJNR Am J Neuror-adiol 2008;29:1465–70.
Losseff NA, Webb SL, O’Riordan JI, Page R, Wang L, Barker GJ, et al.Spinal cord atrophy and disability in multiple sclerosis. A newreproducible and sensitive MRI method with potential to monitordisease progression. Brain 1996;119:701–8.
Lukas C, Sombekke MH, Bellenberg B, Hahn HK, Popescu V,Bendfeldt K, et al. Relevance of spinal cord abnormalities toclinical disability in multiple sclerosis: MR imaging findings in alarge cohort of patients. Radiology 2013;269:542–52.
Reid JD. Effects of flexion–extension movements of the head andspine upon the spinal cord and nerve roots. J Neurol NeurosurgPsychiatry 1996;23:214–21.